Lakeland, NY Map & Demographics
Lakeland Map
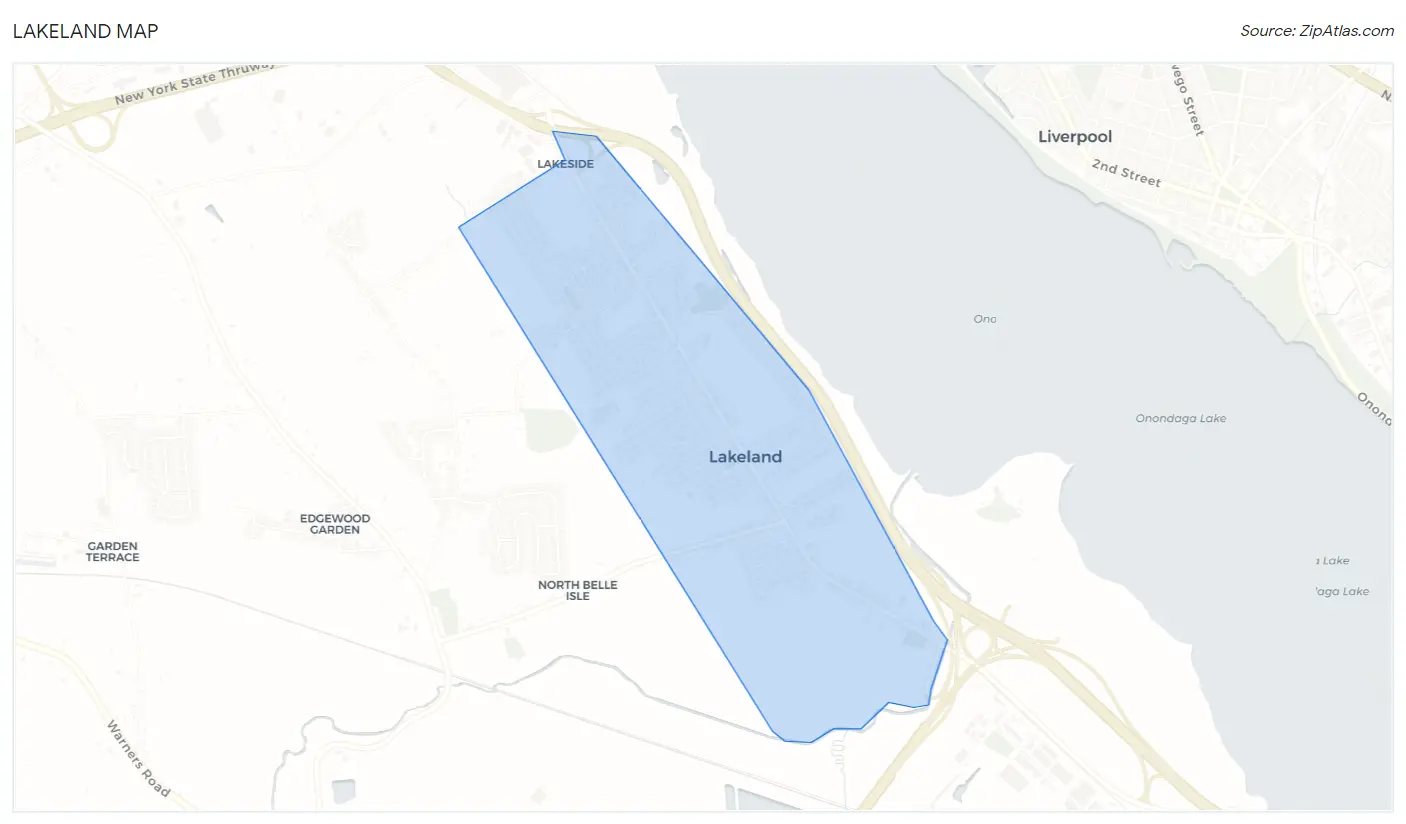
Lakeland Overview
$38,945
PER CAPITA INCOME
$92,976
AVG FAMILY INCOME
$76,250
AVG HOUSEHOLD INCOME
9.6%
WAGE / INCOME GAP [ % ]
90.4¢/ $1
WAGE / INCOME GAP [ $ ]
0.38
INEQUALITY / GINI INDEX
2,513
TOTAL POPULATION
1,153
MALE POPULATION
1,360
FEMALE POPULATION
84.78
MALES / 100 FEMALES
117.95
FEMALES / 100 MALES
50.4
MEDIAN AGE
2.9
AVG FAMILY SIZE
2.1
AVG HOUSEHOLD SIZE
1,428
LABOR FORCE [ PEOPLE ]
64.8%
PERCENT IN LABOR FORCE
2.5%
UNEMPLOYMENT RATE
Income in Lakeland
Income Overview in Lakeland
Per Capita Income in Lakeland is $38,945, while median incomes of families and households are $92,976 and $76,250 respectively.
| Characteristic | Number | Measure |
| Per Capita Income | 2,513 | $38,945 |
| Median Family Income | 636 | $92,976 |
| Mean Family Income | 636 | $106,360 |
| Median Household Income | 1,168 | $76,250 |
| Mean Household Income | 1,168 | $84,164 |
| Income Deficit | 636 | $0 |
| Wage / Income Gap (%) | 2,513 | 9.60% |
| Wage / Income Gap ($) | 2,513 | 90.40¢ per $1 |
| Gini / Inequality Index | 2,513 | 0.38 |
Earnings by Sex in Lakeland
Average Earnings in Lakeland are $44,245, $45,195 for men and $40,855 for women, a difference of 9.6%.
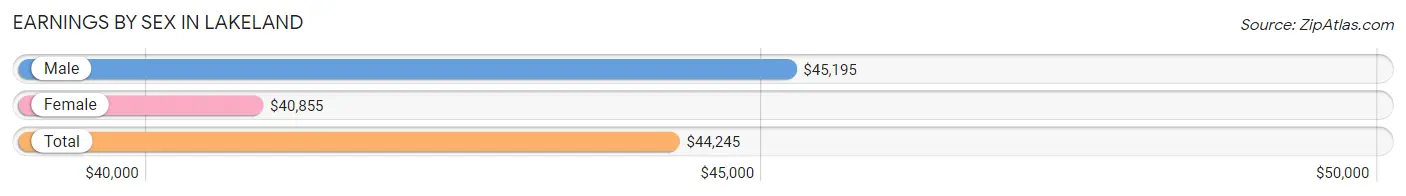
| Sex | Number | Average Earnings |
| Male | 715 (49.4%) | $45,195 |
| Female | 731 (50.5%) | $40,855 |
| Total | 1,446 (100.0%) | $44,245 |
Earnings by Sex by Income Bracket in Lakeland
The most common earnings brackets in Lakeland are $75,000 to $99,999 for men (142 | 19.9%) and $65,000 to $74,999 for women (97 | 13.3%).
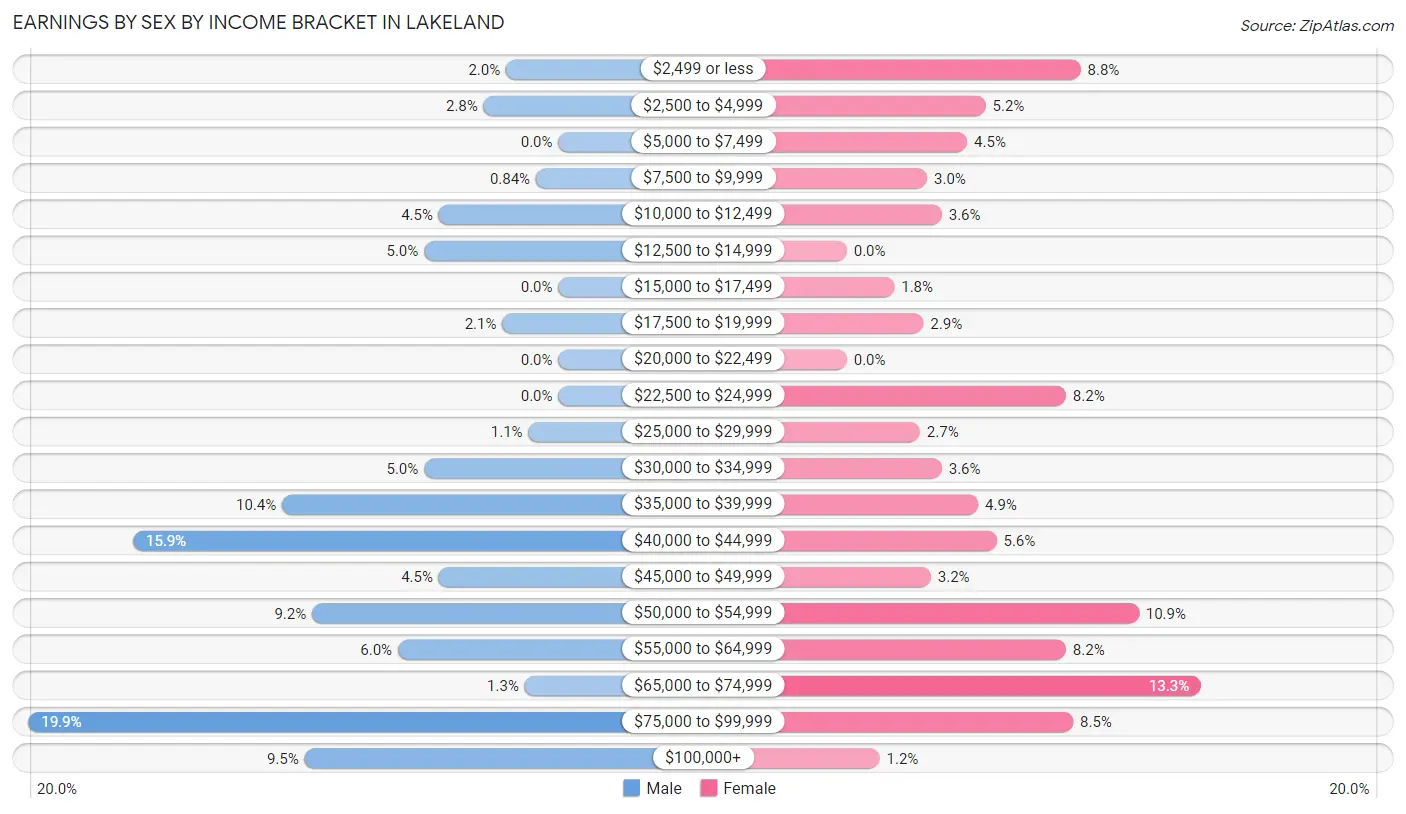
| Income | Male | Female |
| $2,499 or less | 14 (2.0%) | 64 (8.8%) |
| $2,500 to $4,999 | 20 (2.8%) | 38 (5.2%) |
| $5,000 to $7,499 | 0 (0.0%) | 33 (4.5%) |
| $7,500 to $9,999 | 6 (0.8%) | 22 (3.0%) |
| $10,000 to $12,499 | 32 (4.5%) | 26 (3.6%) |
| $12,500 to $14,999 | 36 (5.0%) | 0 (0.0%) |
| $15,000 to $17,499 | 0 (0.0%) | 13 (1.8%) |
| $17,500 to $19,999 | 15 (2.1%) | 21 (2.9%) |
| $20,000 to $22,499 | 0 (0.0%) | 0 (0.0%) |
| $22,500 to $24,999 | 0 (0.0%) | 60 (8.2%) |
| $25,000 to $29,999 | 8 (1.1%) | 20 (2.7%) |
| $30,000 to $34,999 | 36 (5.0%) | 26 (3.6%) |
| $35,000 to $39,999 | 74 (10.3%) | 36 (4.9%) |
| $40,000 to $44,999 | 114 (15.9%) | 41 (5.6%) |
| $45,000 to $49,999 | 32 (4.5%) | 23 (3.2%) |
| $50,000 to $54,999 | 66 (9.2%) | 80 (10.9%) |
| $55,000 to $64,999 | 43 (6.0%) | 60 (8.2%) |
| $65,000 to $74,999 | 9 (1.3%) | 97 (13.3%) |
| $75,000 to $99,999 | 142 (19.9%) | 62 (8.5%) |
| $100,000+ | 68 (9.5%) | 9 (1.2%) |
| Total | 715 (100.0%) | 731 (100.0%) |
Earnings by Sex by Educational Attainment in Lakeland
Average earnings in Lakeland are $50,045 for men and $44,261 for women, a difference of 11.6%. Men with an educational attainment of college or associate's degree enjoy the highest average annual earnings of $87,538, while those with less than high school education earn the least with $39,900. Women with an educational attainment of graduate degree earn the most with the average annual earnings of $73,781, while those with high school diploma education have the smallest earnings of $30,694.
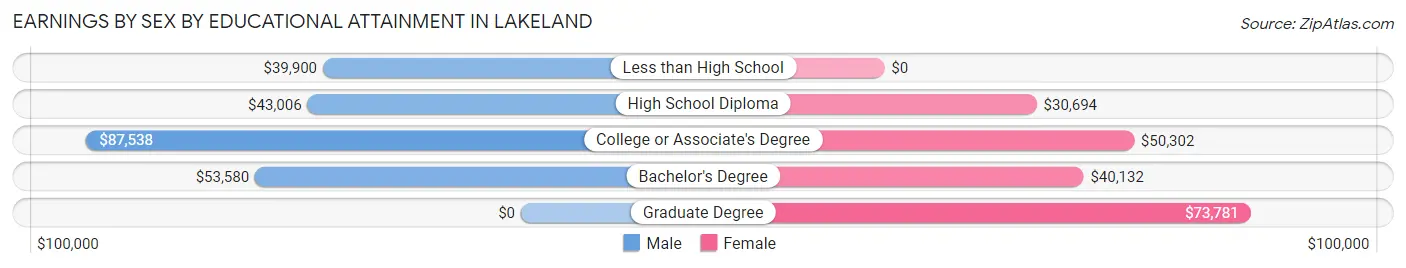
| Educational Attainment | Male Income | Female Income |
| Less than High School | $39,900 | $0 |
| High School Diploma | $43,006 | $30,694 |
| College or Associate's Degree | $87,538 | $50,302 |
| Bachelor's Degree | $53,580 | $40,132 |
| Graduate Degree | - | - |
| Total | $50,045 | $44,261 |
Family Income in Lakeland
Family Income Brackets in Lakeland
According to the Lakeland family income data, there are 147 families falling into the $100,000 to $149,999 income range, which is the most common income bracket and makes up 23.1% of all families.
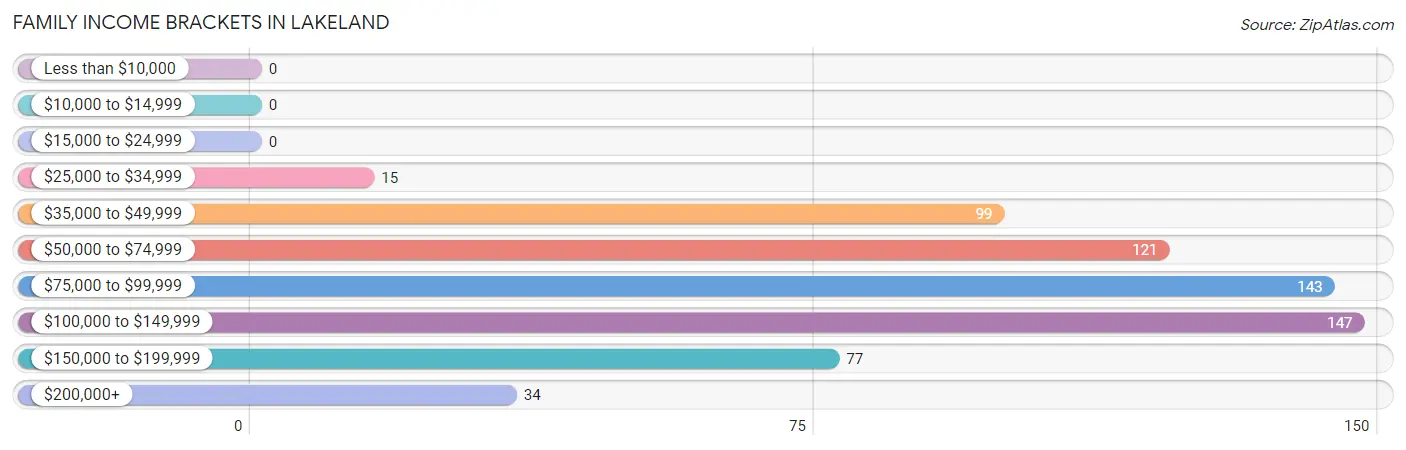
| Income Bracket | # Families | % Families |
| Less than $10,000 | 0 | 0.0% |
| $10,000 to $14,999 | 0 | 0.0% |
| $15,000 to $24,999 | 0 | 0.0% |
| $25,000 to $34,999 | 15 | 2.4% |
| $35,000 to $49,999 | 99 | 15.6% |
| $50,000 to $74,999 | 121 | 19.0% |
| $75,000 to $99,999 | 143 | 22.5% |
| $100,000 to $149,999 | 147 | 23.1% |
| $150,000 to $199,999 | 77 | 12.1% |
| $200,000+ | 34 | 5.3% |
Family Income by Famaliy Size in Lakeland
4-person families (107 | 16.8%) account for the highest median family income in Lakeland with $98,958 per family, while 2-person families (263 | 41.3%) have the highest median income of $46,434 per family member.
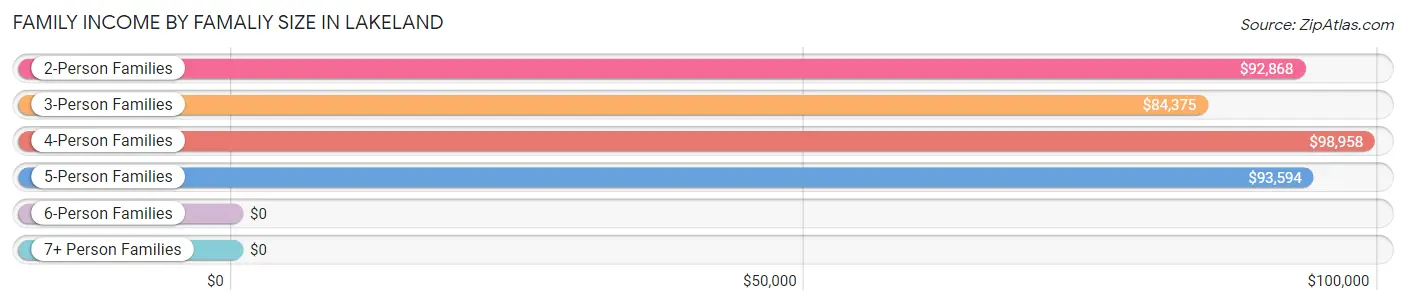
| Income Bracket | # Families | Median Income |
| 2-Person Families | 263 (41.3%) | $92,868 |
| 3-Person Families | 219 (34.4%) | $84,375 |
| 4-Person Families | 107 (16.8%) | $98,958 |
| 5-Person Families | 36 (5.7%) | $93,594 |
| 6-Person Families | 11 (1.7%) | $0 |
| 7+ Person Families | 0 (0.0%) | $0 |
| Total | 636 (100.0%) | $92,976 |
Family Income by Number of Earners in Lakeland
The median family income in Lakeland is $92,976, with families comprising 3+ earners (66) having the highest median family income of $146,364, while families with 1 earner (185) have the lowest median family income of $71,813, accounting for 10.4% and 29.1% of families, respectively.
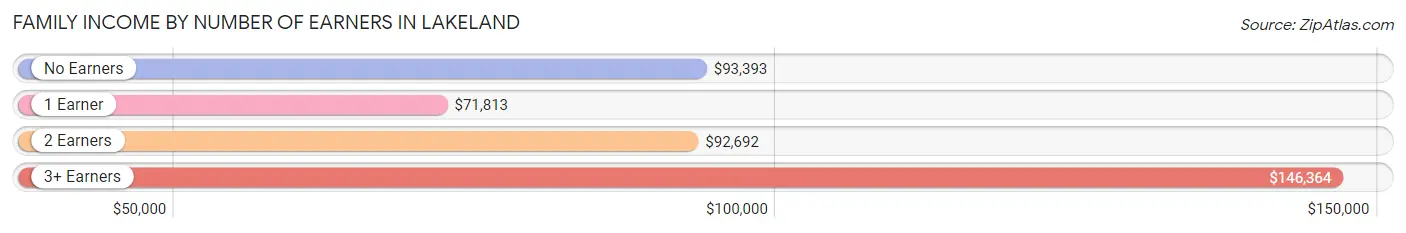
| Number of Earners | # Families | Median Income |
| No Earners | 77 (12.1%) | $93,393 |
| 1 Earner | 185 (29.1%) | $71,813 |
| 2 Earners | 308 (48.4%) | $92,692 |
| 3+ Earners | 66 (10.4%) | $146,364 |
| Total | 636 (100.0%) | $92,976 |
Household Income in Lakeland
Household Income Brackets in Lakeland
With 314 households falling in the category, the $75,000 to $99,999 income range is the most frequent in Lakeland, accounting for 26.9% of all households. In contrast, only 34 households (2.9%) fall into the less than $10,000 income bracket, making it the least populous group.
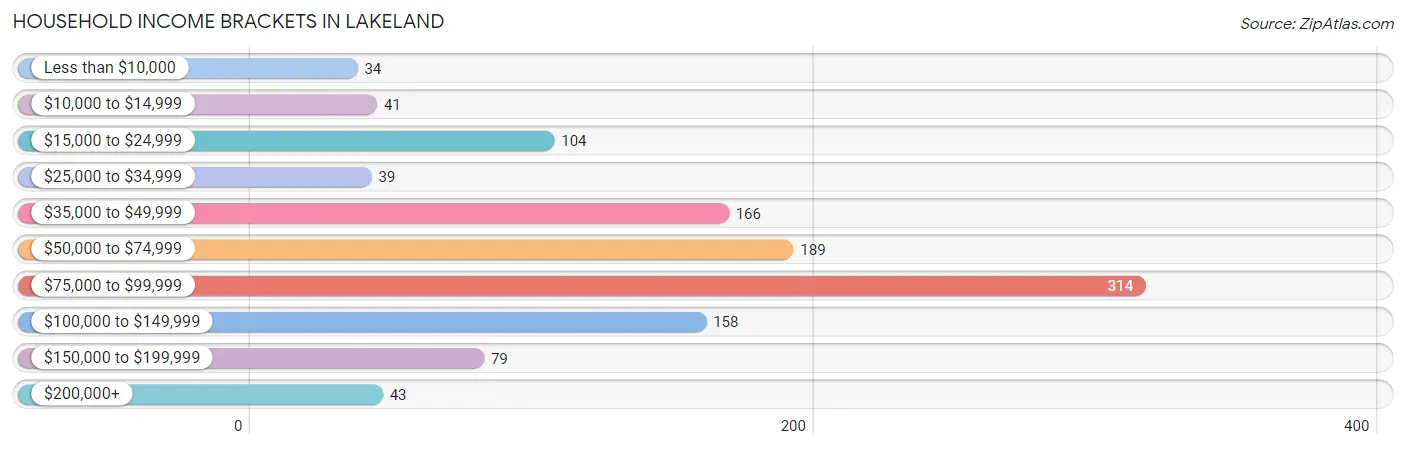
| Income Bracket | # Households | % Households |
| Less than $10,000 | 34 | 2.9% |
| $10,000 to $14,999 | 41 | 3.5% |
| $15,000 to $24,999 | 104 | 8.9% |
| $25,000 to $34,999 | 39 | 3.3% |
| $35,000 to $49,999 | 166 | 14.2% |
| $50,000 to $74,999 | 189 | 16.2% |
| $75,000 to $99,999 | 314 | 26.9% |
| $100,000 to $149,999 | 158 | 13.5% |
| $150,000 to $199,999 | 79 | 6.8% |
| $200,000+ | 43 | 3.7% |
Household Income by Householder Age in Lakeland
The median household income in Lakeland is $76,250, with the highest median household income of $88,977 found in the 45 to 64 years age bracket for the primary householder. A total of 517 households (44.3%) fall into this category. Meanwhile, the 15 to 24 years age bracket for the primary householder has the lowest median household income of $0, with 22 households (1.9%) in this group.
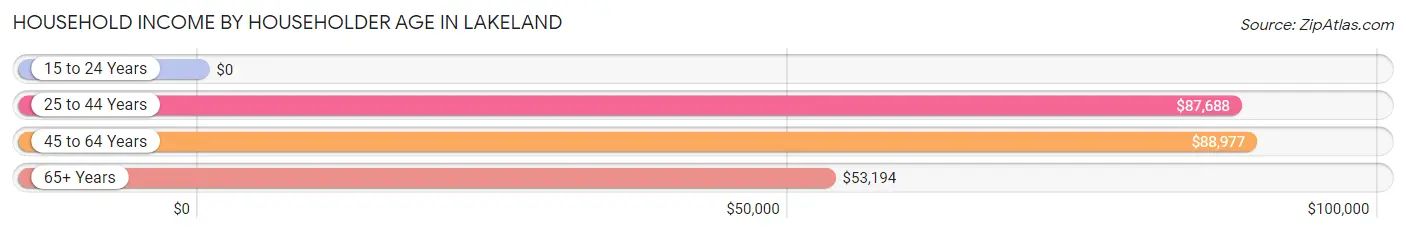
| Income Bracket | # Households | Median Income |
| 15 to 24 Years | 22 (1.9%) | $0 |
| 25 to 44 Years | 240 (20.5%) | $87,688 |
| 45 to 64 Years | 517 (44.3%) | $88,977 |
| 65+ Years | 389 (33.3%) | $53,194 |
| Total | 1,168 (100.0%) | $76,250 |
Poverty in Lakeland
Income Below Poverty by Sex and Age in Lakeland
With 4.3% poverty level for males and 2.7% for females among the residents of Lakeland, 35 to 44 year old males and 55 to 64 year old females are the most vulnerable to poverty, with 32 males (16.8%) and 27 females (11.1%) in their respective age groups living below the poverty level.
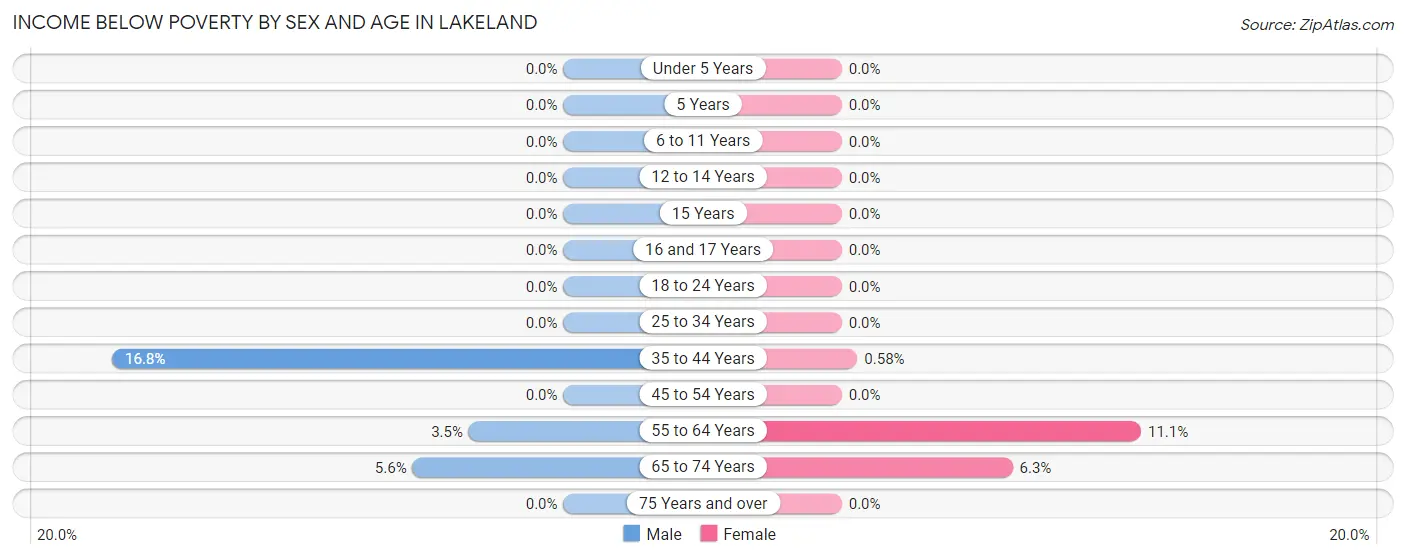
| Age Bracket | Male | Female |
| Under 5 Years | 0 (0.0%) | 0 (0.0%) |
| 5 Years | 0 (0.0%) | 0 (0.0%) |
| 6 to 11 Years | 0 (0.0%) | 0 (0.0%) |
| 12 to 14 Years | 0 (0.0%) | 0 (0.0%) |
| 15 Years | 0 (0.0%) | 0 (0.0%) |
| 16 and 17 Years | 0 (0.0%) | 0 (0.0%) |
| 18 to 24 Years | 0 (0.0%) | 0 (0.0%) |
| 25 to 34 Years | 0 (0.0%) | 0 (0.0%) |
| 35 to 44 Years | 32 (16.8%) | 1 (0.6%) |
| 45 to 54 Years | 0 (0.0%) | 0 (0.0%) |
| 55 to 64 Years | 10 (3.5%) | 27 (11.1%) |
| 65 to 74 Years | 7 (5.6%) | 9 (6.3%) |
| 75 Years and over | 0 (0.0%) | 0 (0.0%) |
| Total | 49 (4.3%) | 37 (2.7%) |
Income Above Poverty by Sex and Age in Lakeland
According to the poverty statistics in Lakeland, males aged under 5 years and females aged under 5 years are the age groups that are most secure financially, with 100.0% of males and 100.0% of females in these age groups living above the poverty line.
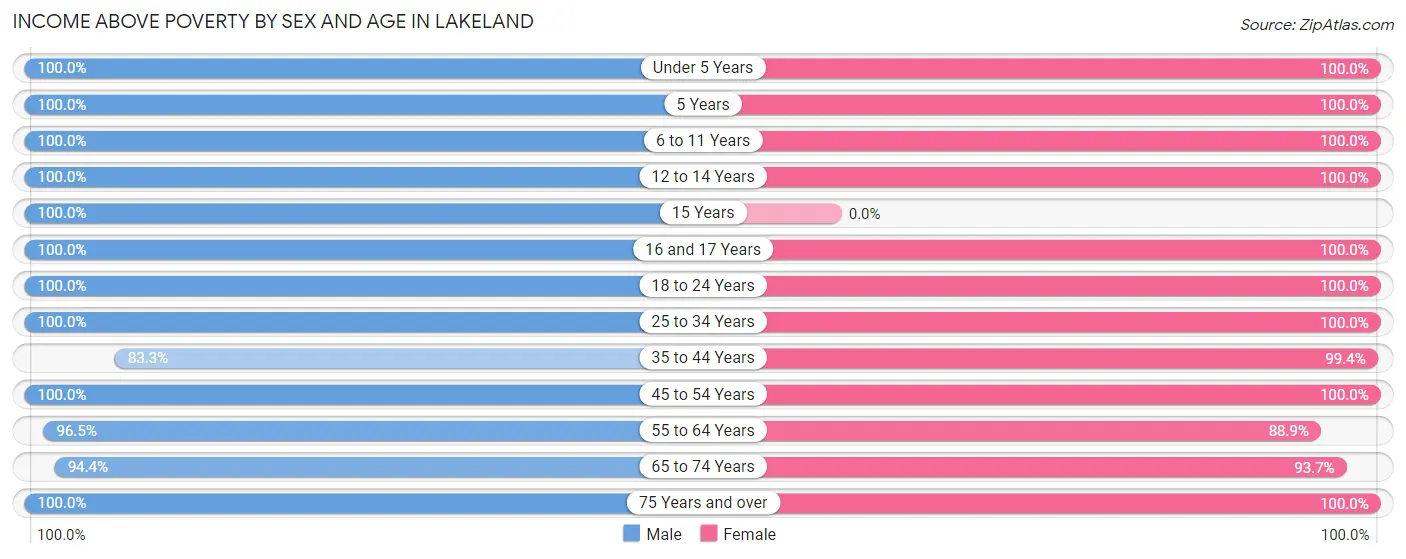
| Age Bracket | Male | Female |
| Under 5 Years | 42 (100.0%) | 6 (100.0%) |
| 5 Years | 21 (100.0%) | 60 (100.0%) |
| 6 to 11 Years | 12 (100.0%) | 89 (100.0%) |
| 12 to 14 Years | 51 (100.0%) | 20 (100.0%) |
| 15 Years | 7 (100.0%) | 0 (0.0%) |
| 16 and 17 Years | 36 (100.0%) | 47 (100.0%) |
| 18 to 24 Years | 87 (100.0%) | 67 (100.0%) |
| 25 to 34 Years | 47 (100.0%) | 126 (100.0%) |
| 35 to 44 Years | 159 (83.3%) | 171 (99.4%) |
| 45 to 54 Years | 173 (100.0%) | 206 (100.0%) |
| 55 to 64 Years | 275 (96.5%) | 216 (88.9%) |
| 65 to 74 Years | 118 (94.4%) | 133 (93.7%) |
| 75 Years and over | 76 (100.0%) | 181 (100.0%) |
| Total | 1,104 (95.8%) | 1,322 (97.3%) |
Income Below Poverty Among Married-Couple Families in Lakeland
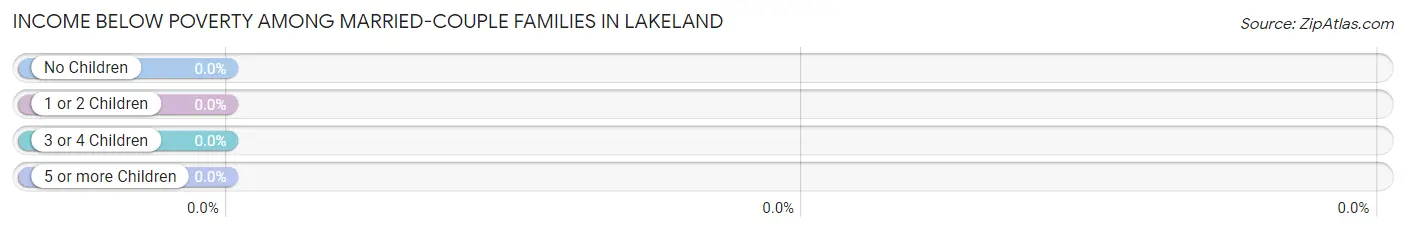
| Children | Above Poverty | Below Poverty |
| No Children | 339 (100.0%) | 0 (0.0%) |
| 1 or 2 Children | 220 (100.0%) | 0 (0.0%) |
| 3 or 4 Children | 11 (100.0%) | 0 (0.0%) |
| 5 or more Children | 0 (0.0%) | 0 (0.0%) |
| Total | 570 (100.0%) | 0 (0.0%) |
Income Below Poverty Among Single-Parent Households in Lakeland
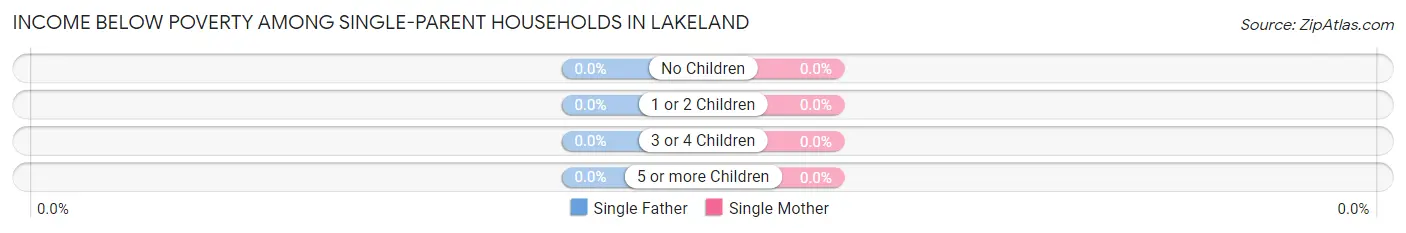
| Children | Single Father | Single Mother |
| No Children | 0 (0.0%) | 0 (0.0%) |
| 1 or 2 Children | 0 (0.0%) | 0 (0.0%) |
| 3 or 4 Children | 0 (0.0%) | 0 (0.0%) |
| 5 or more Children | 0 (0.0%) | 0 (0.0%) |
| Total | 0 (0.0%) | 0 (0.0%) |
Income Below Poverty Among Married-Couple vs Single-Parent Households in Lakeland
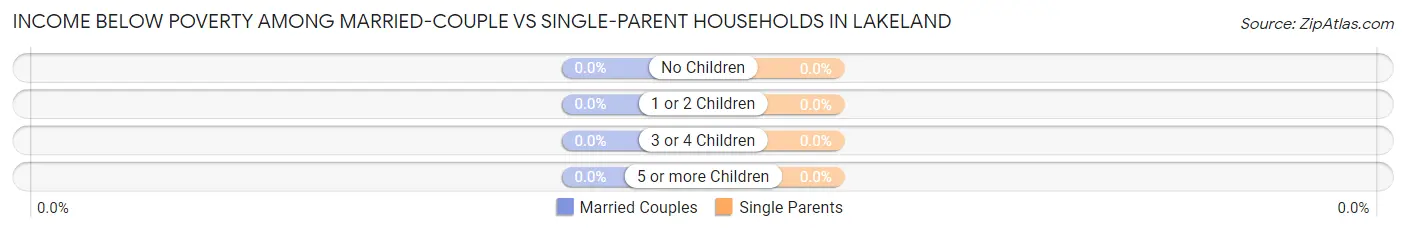
| Children | Married-Couple Families | Single-Parent Households |
| No Children | 0 (0.0%) | 0 (0.0%) |
| 1 or 2 Children | 0 (0.0%) | 0 (0.0%) |
| 3 or 4 Children | 0 (0.0%) | 0 (0.0%) |
| 5 or more Children | 0 (0.0%) | 0 (0.0%) |
| Total | 0 (0.0%) | 0 (0.0%) |
Race in Lakeland
The most populous races in Lakeland are White / Caucasian (2,337 | 93.0%), Hispanic or Latino (94 | 3.7%), and Asian (72 | 2.9%).
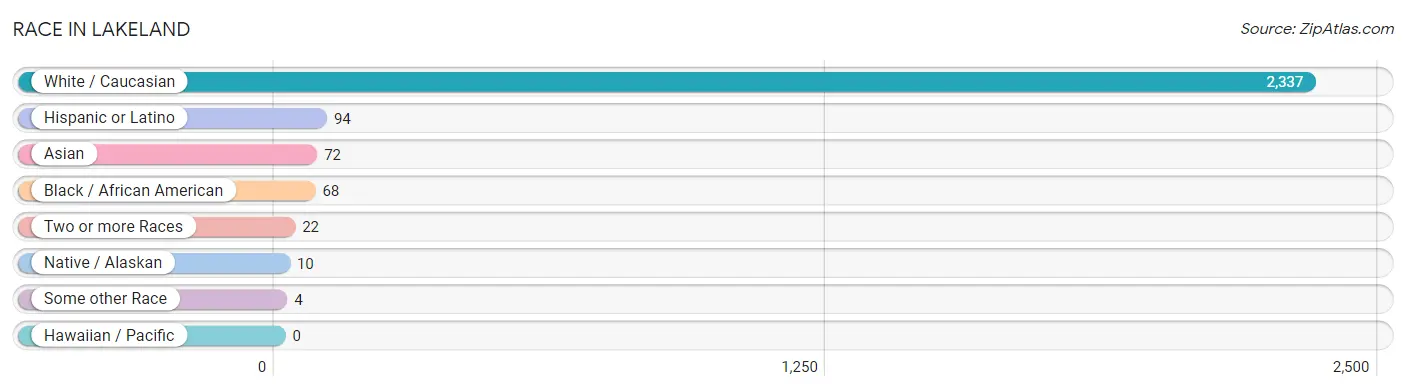
| Race | # Population | % Population |
| Asian | 72 | 2.9% |
| Black / African American | 68 | 2.7% |
| Hawaiian / Pacific | 0 | 0.0% |
| Hispanic or Latino | 94 | 3.7% |
| Native / Alaskan | 10 | 0.4% |
| White / Caucasian | 2,337 | 93.0% |
| Two or more Races | 22 | 0.9% |
| Some other Race | 4 | 0.2% |
| Total | 2,513 | 100.0% |
Ancestry in Lakeland
The most populous ancestries reported in Lakeland are Irish (529 | 21.0%), Italian (509 | 20.3%), Polish (355 | 14.1%), English (347 | 13.8%), and German (330 | 13.1%), together accounting for 82.4% of all Lakeland residents.
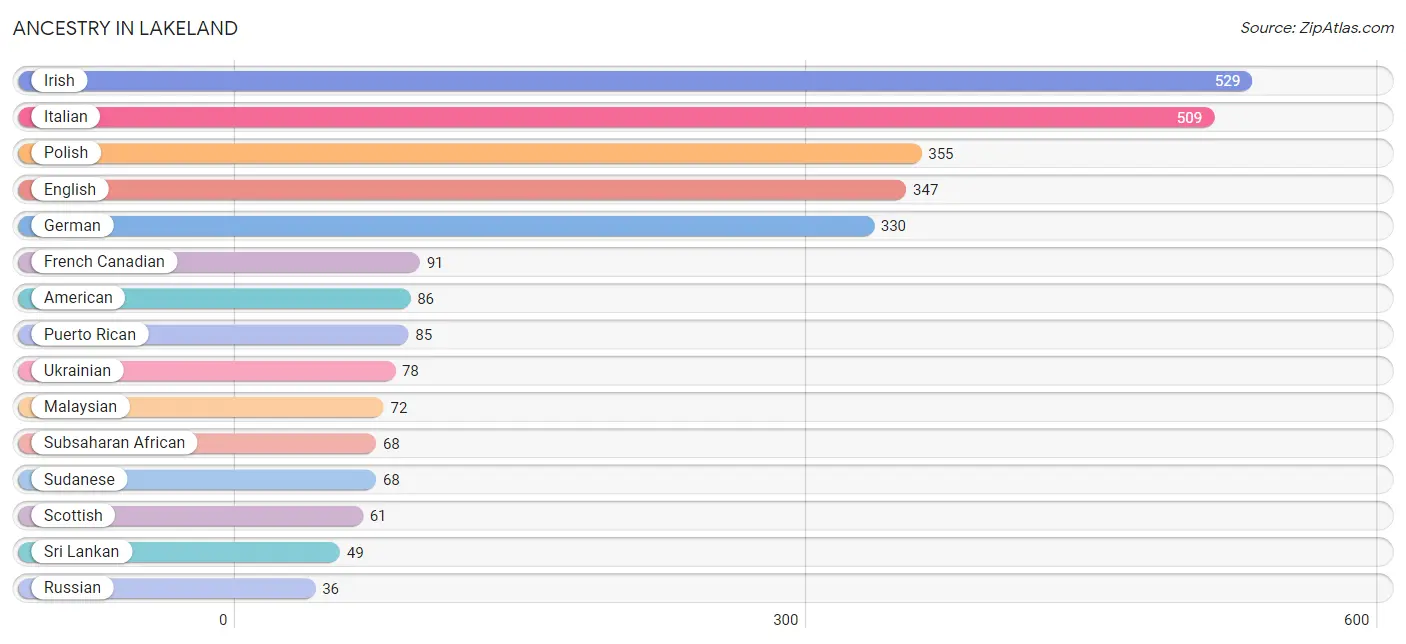
| Ancestry | # Population | % Population |
| American | 86 | 3.4% |
| Arab | 5 | 0.2% |
| Austrian | 25 | 1.0% |
| British | 14 | 0.6% |
| Bulgarian | 22 | 0.9% |
| Canadian | 23 | 0.9% |
| Czech | 10 | 0.4% |
| Dutch | 23 | 0.9% |
| Eastern European | 10 | 0.4% |
| English | 347 | 13.8% |
| Estonian | 7 | 0.3% |
| European | 16 | 0.6% |
| French | 32 | 1.3% |
| French Canadian | 91 | 3.6% |
| German | 330 | 13.1% |
| Greek | 13 | 0.5% |
| Hungarian | 10 | 0.4% |
| Irish | 529 | 21.0% |
| Iroquois | 10 | 0.4% |
| Italian | 509 | 20.3% |
| Malaysian | 72 | 2.9% |
| Mexican | 9 | 0.4% |
| Norwegian | 10 | 0.4% |
| Polish | 355 | 14.1% |
| Puerto Rican | 85 | 3.4% |
| Russian | 36 | 1.4% |
| Scandinavian | 6 | 0.2% |
| Scotch-Irish | 7 | 0.3% |
| Scottish | 61 | 2.4% |
| Sri Lankan | 49 | 1.9% |
| Subsaharan African | 68 | 2.7% |
| Sudanese | 68 | 2.7% |
| Swedish | 18 | 0.7% |
| Swiss | 7 | 0.3% |
| Ukrainian | 78 | 3.1% | View All 35 Rows |
Immigrants in Lakeland
The most numerous immigrant groups reported in Lakeland came from Europe (95 | 3.8%), Eastern Europe (80 | 3.2%), Ukraine (73 | 2.9%), Asia (72 | 2.9%), and South Eastern Asia (72 | 2.9%), together accounting for 15.6% of all Lakeland residents.
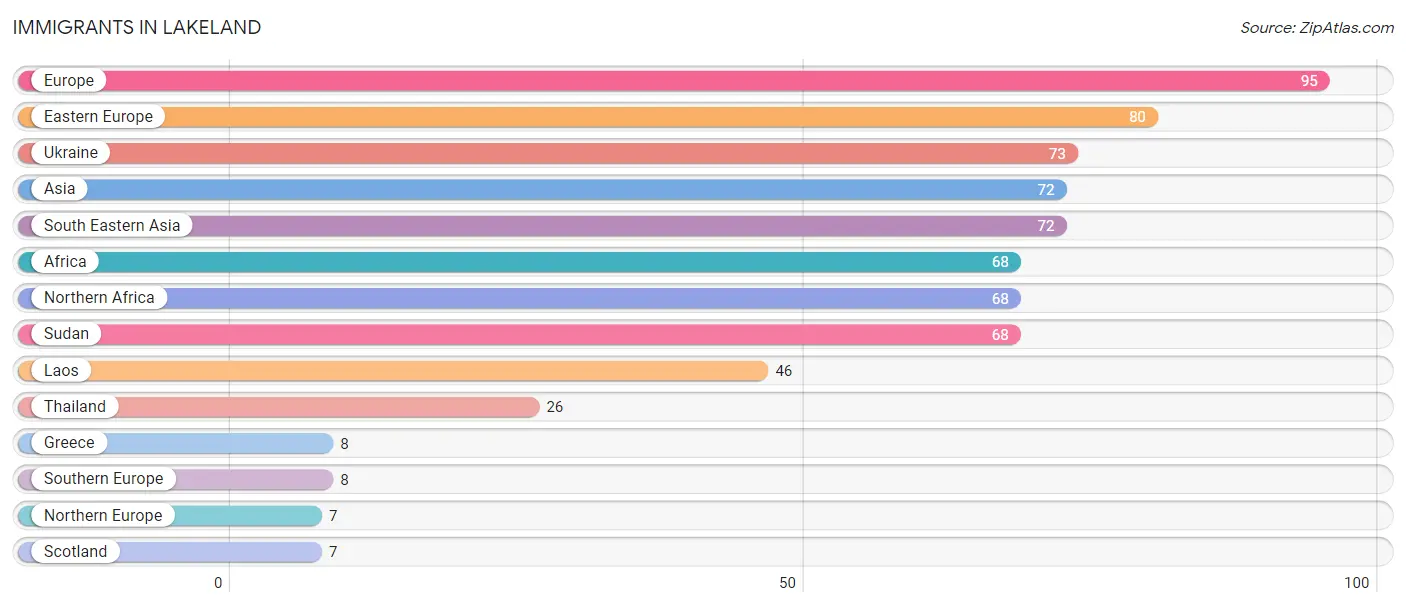
| Immigration Origin | # Population | % Population |
| Africa | 68 | 2.7% |
| Asia | 72 | 2.9% |
| Eastern Europe | 80 | 3.2% |
| Europe | 95 | 3.8% |
| Greece | 8 | 0.3% |
| Laos | 46 | 1.8% |
| Northern Africa | 68 | 2.7% |
| Northern Europe | 7 | 0.3% |
| Scotland | 7 | 0.3% |
| South Eastern Asia | 72 | 2.9% |
| Southern Europe | 8 | 0.3% |
| Sudan | 68 | 2.7% |
| Thailand | 26 | 1.0% |
| Ukraine | 73 | 2.9% | View All 14 Rows |
Sex and Age in Lakeland
Sex and Age in Lakeland
The most populous age groups in Lakeland are 55 to 59 Years (195 | 16.9%) for men and 60 to 64 Years (164 | 12.1%) for women.
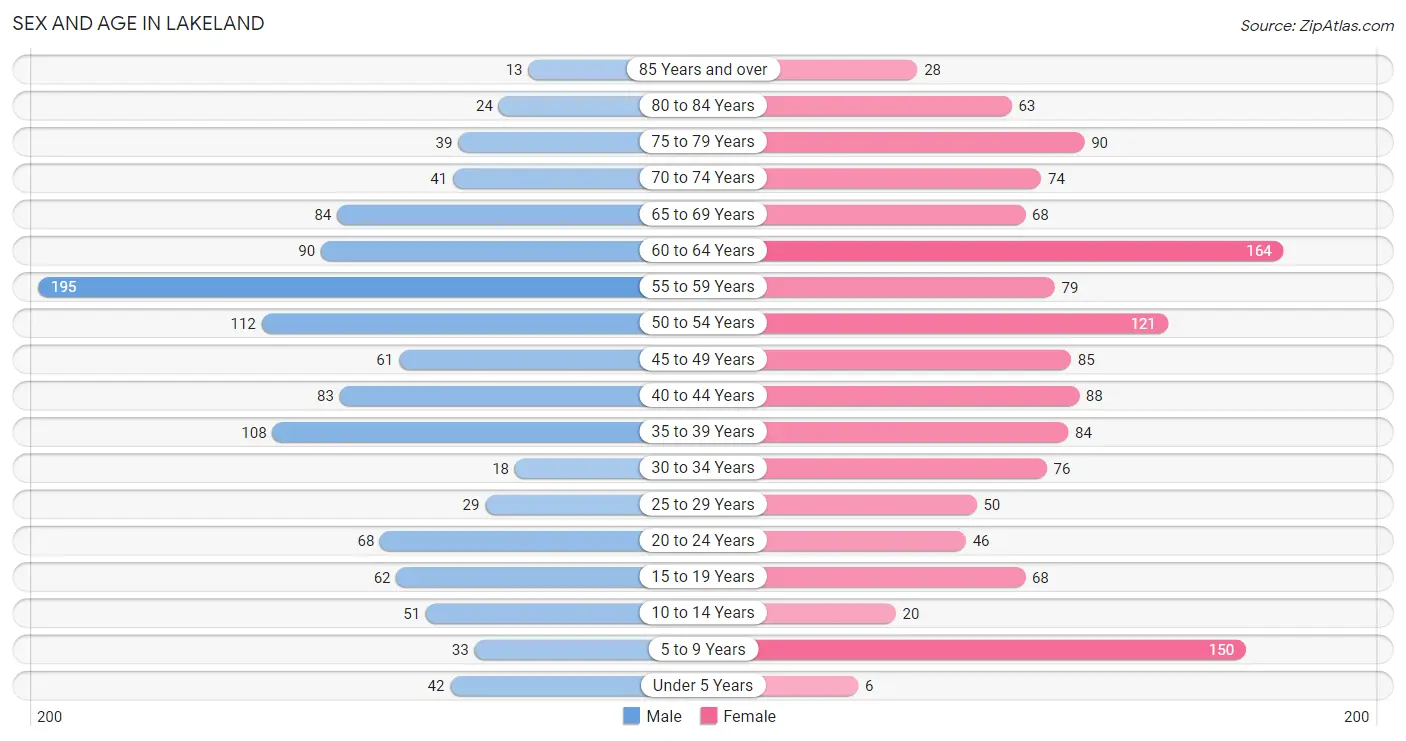
| Age Bracket | Male | Female |
| Under 5 Years | 42 (3.6%) | 6 (0.4%) |
| 5 to 9 Years | 33 (2.9%) | 150 (11.0%) |
| 10 to 14 Years | 51 (4.4%) | 20 (1.5%) |
| 15 to 19 Years | 62 (5.4%) | 68 (5.0%) |
| 20 to 24 Years | 68 (5.9%) | 46 (3.4%) |
| 25 to 29 Years | 29 (2.5%) | 50 (3.7%) |
| 30 to 34 Years | 18 (1.6%) | 76 (5.6%) |
| 35 to 39 Years | 108 (9.4%) | 84 (6.2%) |
| 40 to 44 Years | 83 (7.2%) | 88 (6.5%) |
| 45 to 49 Years | 61 (5.3%) | 85 (6.2%) |
| 50 to 54 Years | 112 (9.7%) | 121 (8.9%) |
| 55 to 59 Years | 195 (16.9%) | 79 (5.8%) |
| 60 to 64 Years | 90 (7.8%) | 164 (12.1%) |
| 65 to 69 Years | 84 (7.3%) | 68 (5.0%) |
| 70 to 74 Years | 41 (3.6%) | 74 (5.4%) |
| 75 to 79 Years | 39 (3.4%) | 90 (6.6%) |
| 80 to 84 Years | 24 (2.1%) | 63 (4.6%) |
| 85 Years and over | 13 (1.1%) | 28 (2.1%) |
| Total | 1,153 (100.0%) | 1,360 (100.0%) |
Families and Households in Lakeland
Median Family Size in Lakeland
The median family size in Lakeland is 2.92 persons per family, with married-couple families (570 | 89.6%) accounting for the largest median family size of 2.99 persons per family. On the other hand, single female/mother families (30 | 4.7%) represent the smallest median family size with 2.30 persons per family.
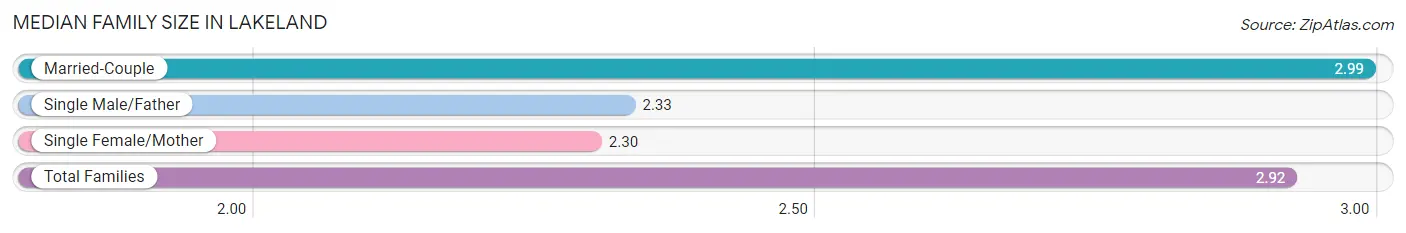
| Family Type | # Families | Family Size |
| Married-Couple | 570 (89.6%) | 2.99 |
| Single Male/Father | 36 (5.7%) | 2.33 |
| Single Female/Mother | 30 (4.7%) | 2.30 |
| Total Families | 636 (100.0%) | 2.92 |
Median Household Size in Lakeland
The median household size in Lakeland is 2.15 persons per household, with married-couple households (570 | 48.8%) accounting for the largest median household size of 3.01 persons per household. non-family households (532 | 45.6%) represent the smallest median household size with 1.17 persons per household.
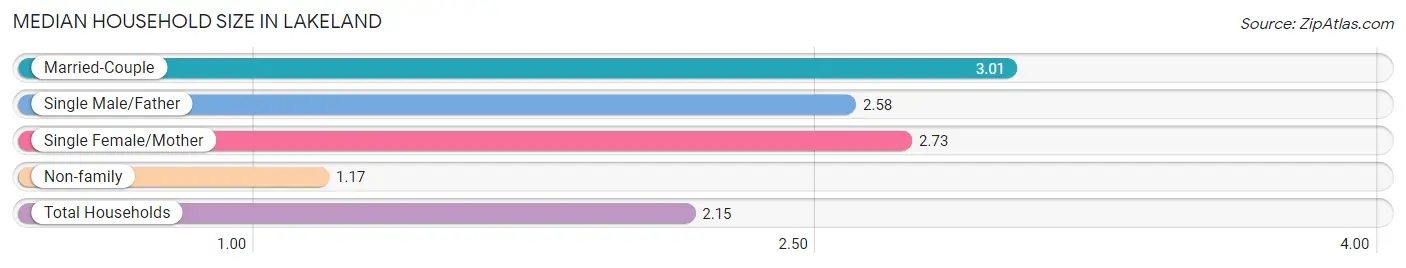
| Household Type | # Households | Household Size |
| Married-Couple | 570 (48.8%) | 3.01 |
| Single Male/Father | 36 (3.1%) | 2.58 |
| Single Female/Mother | 30 (2.6%) | 2.73 |
| Non-family | 532 (45.6%) | 1.17 |
| Total Households | 1,168 (100.0%) | 2.15 |
Household Size by Marriage Status in Lakeland
Out of a total of 1,168 households in Lakeland, 636 (54.4%) are family households, while 532 (45.6%) are nonfamily households. The most numerous type of family households are 2-person households, comprising 263, and the most common type of nonfamily households are 1-person households, comprising 432.
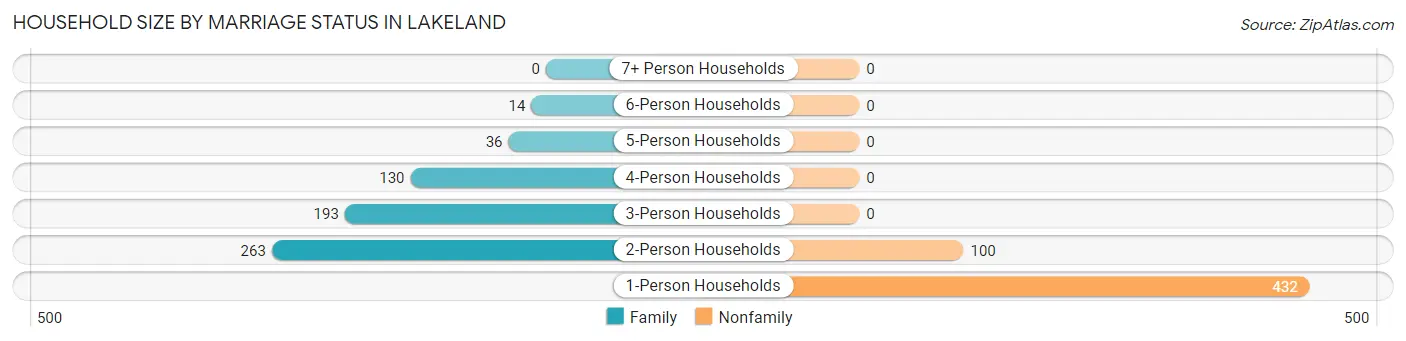
| Household Size | Family Households | Nonfamily Households |
| 1-Person Households | - | 432 (37.0%) |
| 2-Person Households | 263 (22.5%) | 100 (8.6%) |
| 3-Person Households | 193 (16.5%) | 0 (0.0%) |
| 4-Person Households | 130 (11.1%) | 0 (0.0%) |
| 5-Person Households | 36 (3.1%) | 0 (0.0%) |
| 6-Person Households | 14 (1.2%) | 0 (0.0%) |
| 7+ Person Households | 0 (0.0%) | 0 (0.0%) |
| Total | 636 (54.4%) | 532 (45.6%) |
Female Fertility in Lakeland
Fertility by Age in Lakeland
Average fertility rate in Lakeland is 62.0 births per 1,000 women. Women in the age bracket of 20 to 34 years have the highest fertility rate with 128.0 births per 1,000 women. Women in the age bracket of 20 to 34 years acount for 64.7% of all women with births.
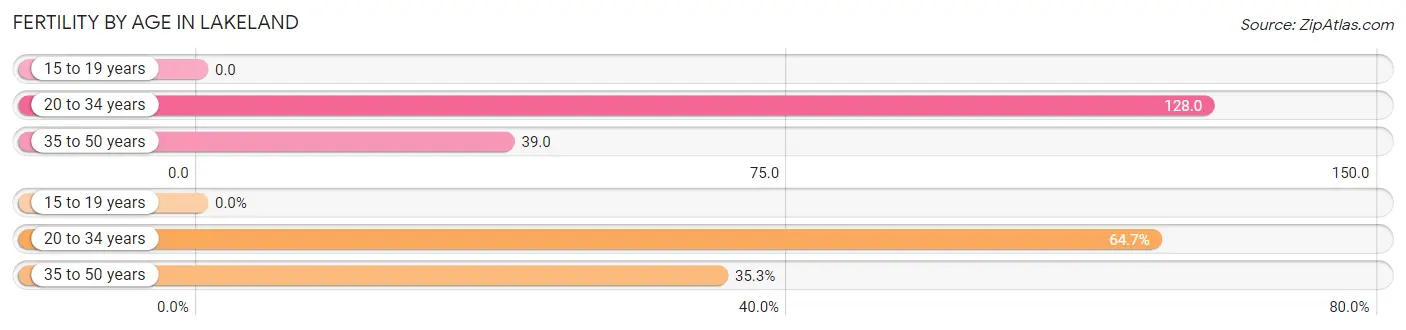
| Age Bracket | Women with Births | Births / 1,000 Women |
| 15 to 19 years | 0 (0.0%) | 0.0 |
| 20 to 34 years | 22 (64.7%) | 128.0 |
| 35 to 50 years | 12 (35.3%) | 39.0 |
| Total | 34 (100.0%) | 62.0 |
Fertility by Age by Marriage Status in Lakeland
64.7% of women with births (34) in Lakeland are married. The highest percentage of unmarried women with births falls into 35 to 50 years age bracket with 100.0% of them unmarried at the time of birth, while the lowest percentage of unmarried women with births belong to 20 to 34 years age bracket with 0.0% of them unmarried.
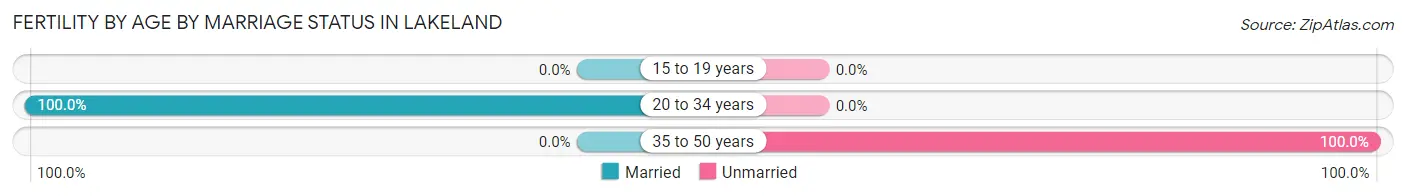
| Age Bracket | Married | Unmarried |
| 15 to 19 years | 0 (0.0%) | 0 (0.0%) |
| 20 to 34 years | 22 (100.0%) | 0 (0.0%) |
| 35 to 50 years | 0 (0.0%) | 12 (100.0%) |
| Total | 22 (64.7%) | 12 (35.3%) |
Fertility by Education in Lakeland
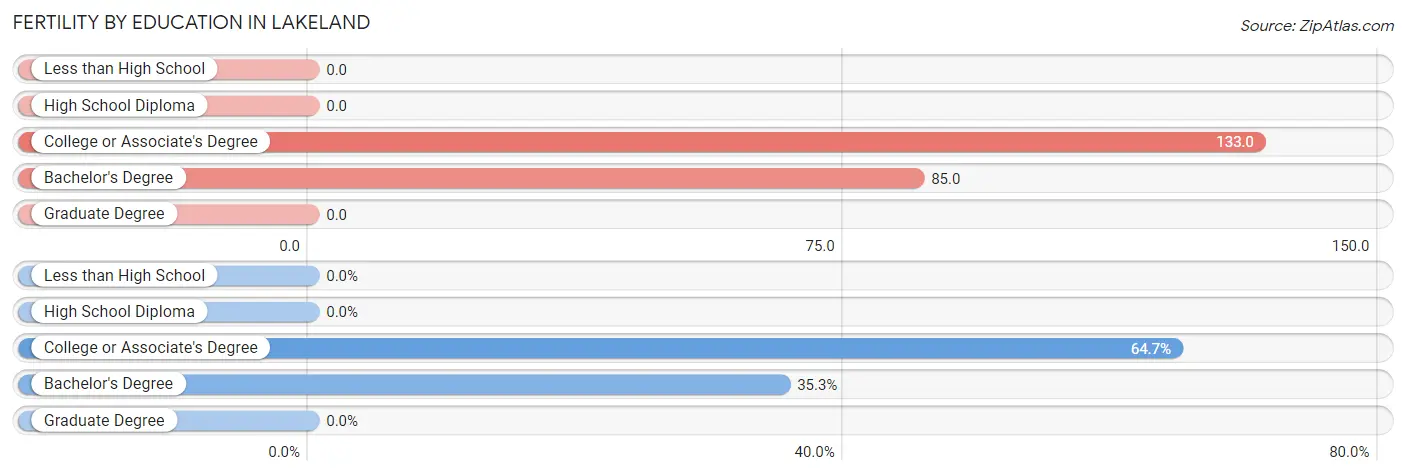
| Educational Attainment | Women with Births | Births / 1,000 Women |
| Less than High School | 0 (0.0%) | 0.0 |
| High School Diploma | 0 (0.0%) | 0.0 |
| College or Associate's Degree | 22 (64.7%) | 133.0 |
| Bachelor's Degree | 12 (35.3%) | 85.0 |
| Graduate Degree | 0 (0.0%) | 0.0 |
| Total | 34 (100.0%) | 62.0 |
Fertility by Education by Marriage Status in Lakeland
35.3% of women with births in Lakeland are unmarried. Women with the educational attainment of college or associate's degree are most likely to be married with 100.0% of them married at childbirth, while women with the educational attainment of bachelor's degree are least likely to be married with 100.0% of them unmarried at childbirth.
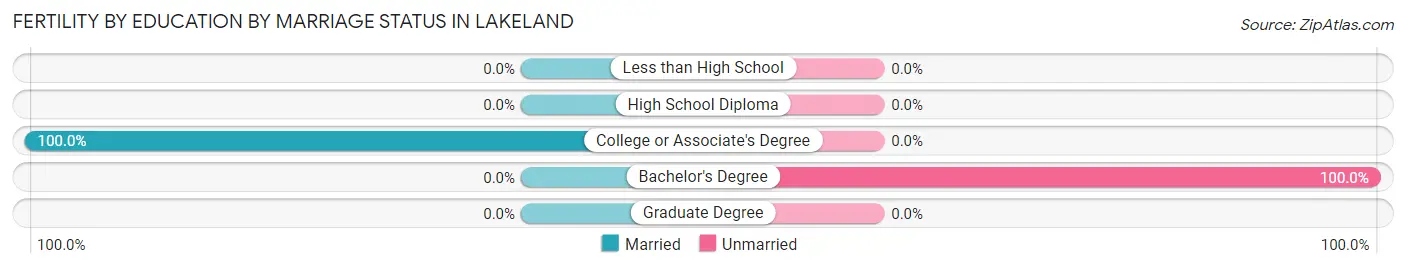
| Educational Attainment | Married | Unmarried |
| Less than High School | 0 (0.0%) | 0 (0.0%) |
| High School Diploma | 0 (0.0%) | 0 (0.0%) |
| College or Associate's Degree | 22 (100.0%) | 0 (0.0%) |
| Bachelor's Degree | 0 (0.0%) | 12 (100.0%) |
| Graduate Degree | 0 (0.0%) | 0 (0.0%) |
| Total | 22 (64.7%) | 12 (35.3%) |
Employment Characteristics in Lakeland
Employment by Class of Employer in Lakeland
Among the 1,359 employed individuals in Lakeland, private company employees (872 | 64.2%), local government employees (196 | 14.4%), and not-for-profit organizations (99 | 7.3%) make up the most common classes of employment.
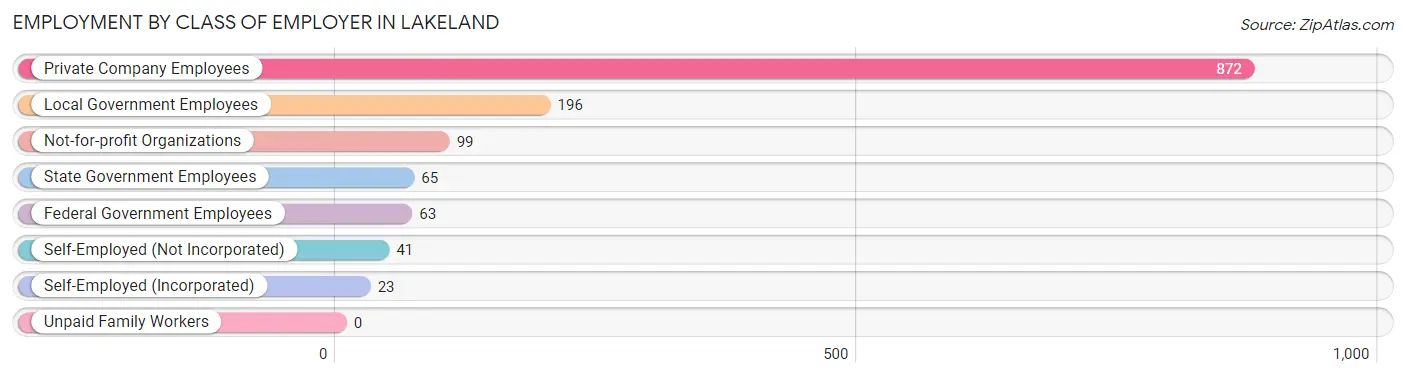
| Employer Class | # Employees | % Employees |
| Private Company Employees | 872 | 64.2% |
| Self-Employed (Incorporated) | 23 | 1.7% |
| Self-Employed (Not Incorporated) | 41 | 3.0% |
| Not-for-profit Organizations | 99 | 7.3% |
| Local Government Employees | 196 | 14.4% |
| State Government Employees | 65 | 4.8% |
| Federal Government Employees | 63 | 4.6% |
| Unpaid Family Workers | 0 | 0.0% |
| Total | 1,359 | 100.0% |
Employment Status by Age in Lakeland
According to the labor force statistics for Lakeland, out of the total population over 16 years of age (2,204), 64.8% or 1,428 individuals are in the labor force, with 2.5% or 36 of them unemployed. The age group with the highest labor force participation rate is 30 to 34 years, with 100.0% or 94 individuals in the labor force. Within the labor force, the 20 to 24 years age range has the highest percentage of unemployed individuals, with 21.4% or 15 of them being unemployed.
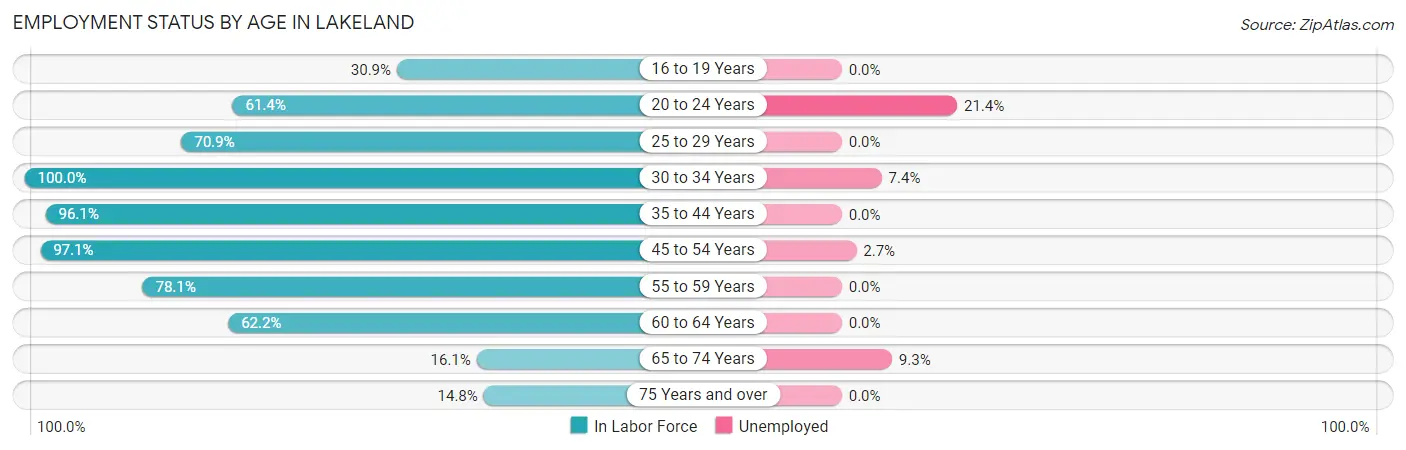
| Age Bracket | In Labor Force | Unemployed |
| 16 to 19 Years | 38 (30.9%) | 0 (0.0%) |
| 20 to 24 Years | 70 (61.4%) | 15 (21.4%) |
| 25 to 29 Years | 56 (70.9%) | 0 (0.0%) |
| 30 to 34 Years | 94 (100.0%) | 7 (7.4%) |
| 35 to 44 Years | 349 (96.1%) | 0 (0.0%) |
| 45 to 54 Years | 368 (97.1%) | 10 (2.7%) |
| 55 to 59 Years | 214 (78.1%) | 0 (0.0%) |
| 60 to 64 Years | 158 (62.2%) | 0 (0.0%) |
| 65 to 74 Years | 43 (16.1%) | 4 (9.3%) |
| 75 Years and over | 38 (14.8%) | 0 (0.0%) |
| Total | 1,428 (64.8%) | 36 (2.5%) |
Employment Status by Educational Attainment in Lakeland
According to labor force statistics for Lakeland, 85.9% of individuals (1,240) out of the total population between 25 and 64 years of age (1,443) are in the labor force, with 1.4% or 17 of them being unemployed. The group with the highest labor force participation rate are those with the educational attainment of bachelor's degree or higher, with 94.9% or 337 individuals in the labor force. Within the labor force, individuals with high school diploma education have the highest percentage of unemployment, with 2.1% or 10 of them being unemployed.
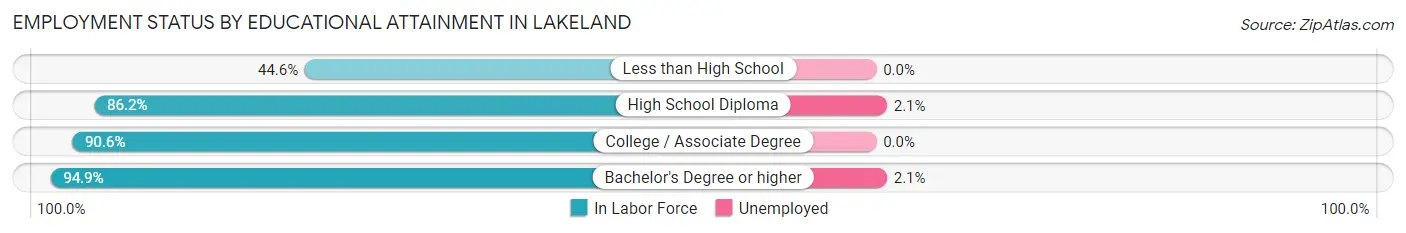
| Educational Attainment | In Labor Force | Unemployed |
| Less than High School | 58 (44.6%) | 0 (0.0%) |
| High School Diploma | 468 (86.2%) | 11 (2.1%) |
| College / Associate Degree | 376 (90.6%) | 0 (0.0%) |
| Bachelor's Degree or higher | 337 (94.9%) | 7 (2.1%) |
| Total | 1,240 (85.9%) | 20 (1.4%) |
Employment Occupations by Sex in Lakeland
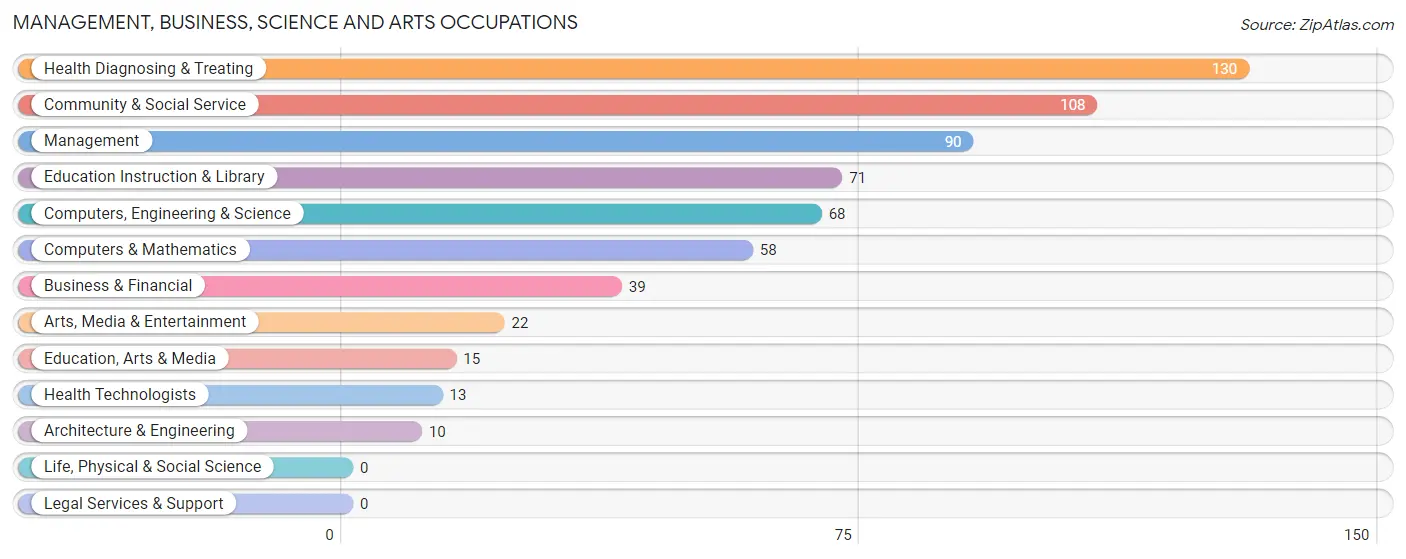
Management, Business, Science and Arts Occupations
The most common Management, Business, Science and Arts occupations in Lakeland are Health Diagnosing & Treating (130 | 9.3%), Community & Social Service (108 | 7.8%), Management (90 | 6.5%), Education Instruction & Library (71 | 5.1%), and Computers, Engineering & Science (68 | 4.9%).
Management, Business, Science and Arts Occupations by Sex
Within the Management, Business, Science and Arts occupations in Lakeland, the most male-oriented occupations are Architecture & Engineering (100.0%), Management (64.4%), and Business & Financial (61.5%), while the most female-oriented occupations are Education, Arts & Media (100.0%), Education Instruction & Library (100.0%), and Health Diagnosing & Treating (94.6%).
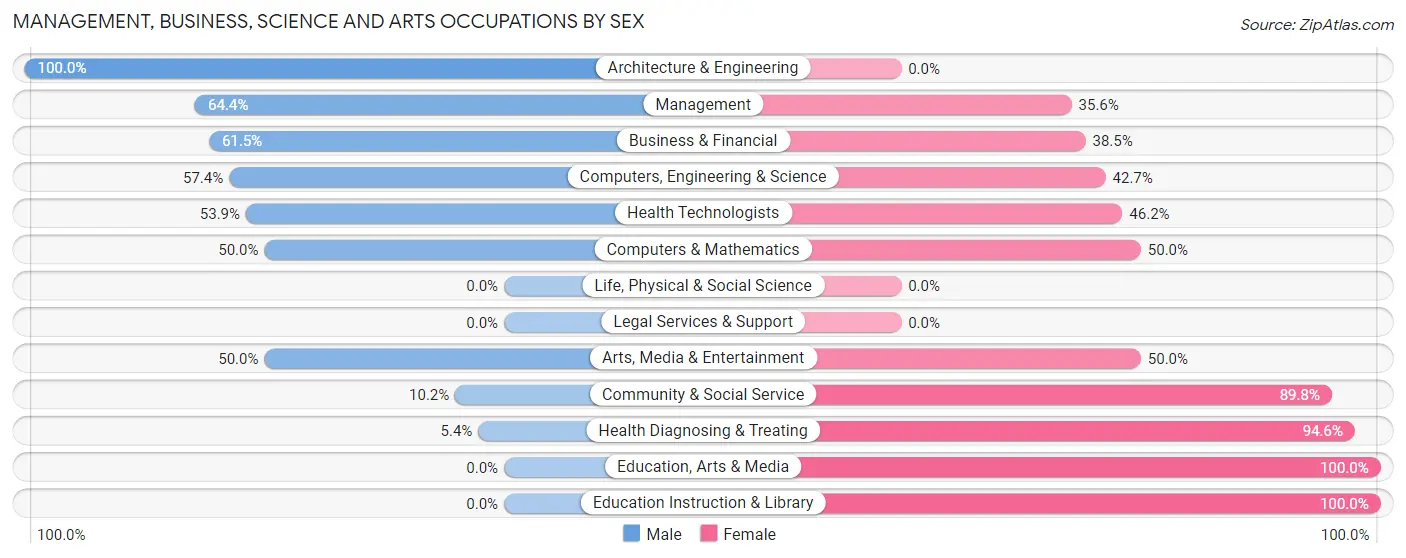
| Occupation | Male | Female |
| Management | 58 (64.4%) | 32 (35.6%) |
| Business & Financial | 24 (61.5%) | 15 (38.5%) |
| Computers, Engineering & Science | 39 (57.4%) | 29 (42.6%) |
| Computers & Mathematics | 29 (50.0%) | 29 (50.0%) |
| Architecture & Engineering | 10 (100.0%) | 0 (0.0%) |
| Life, Physical & Social Science | 0 (0.0%) | 0 (0.0%) |
| Community & Social Service | 11 (10.2%) | 97 (89.8%) |
| Education, Arts & Media | 0 (0.0%) | 15 (100.0%) |
| Legal Services & Support | 0 (0.0%) | 0 (0.0%) |
| Education Instruction & Library | 0 (0.0%) | 71 (100.0%) |
| Arts, Media & Entertainment | 11 (50.0%) | 11 (50.0%) |
| Health Diagnosing & Treating | 7 (5.4%) | 123 (94.6%) |
| Health Technologists | 7 (53.8%) | 6 (46.2%) |
| Total (Category) | 139 (32.0%) | 296 (68.0%) |
| Total (Overall) | 686 (49.3%) | 706 (50.7%) |
Services Occupations
The most common Services occupations in Lakeland are Food Preparation & Serving (87 | 6.2%), Security & Protection (70 | 5.0%), Firefighting & Prevention (57 | 4.1%), Personal Care & Service (37 | 2.7%), and Cleaning & Maintenance (35 | 2.5%).
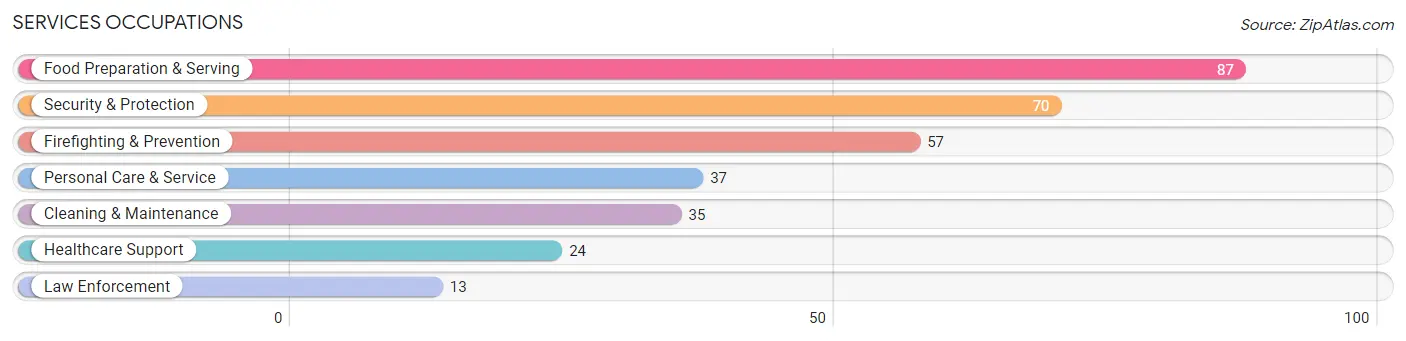
Services Occupations by Sex
Within the Services occupations in Lakeland, the most male-oriented occupations are Law Enforcement (100.0%), Security & Protection (67.1%), and Cleaning & Maintenance (62.9%), while the most female-oriented occupations are Healthcare Support (100.0%), Personal Care & Service (100.0%), and Food Preparation & Serving (70.1%).
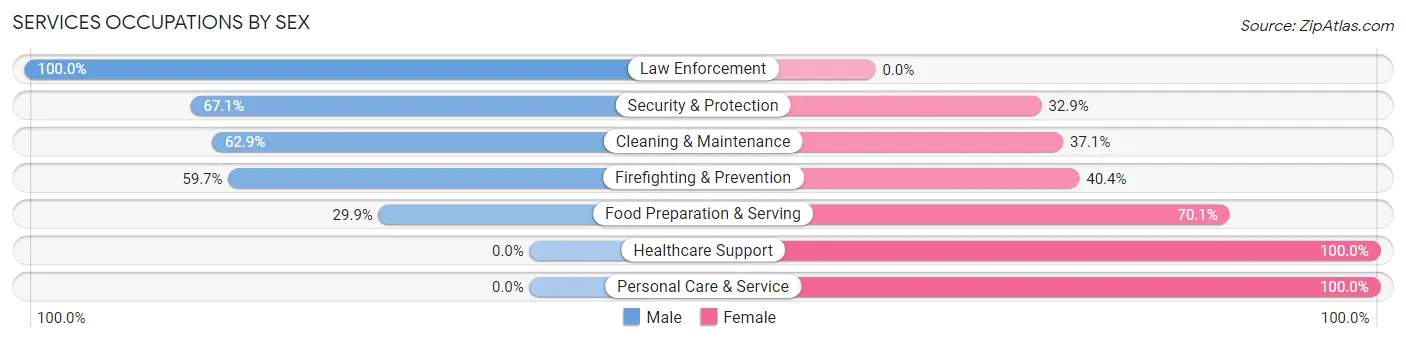
| Occupation | Male | Female |
| Healthcare Support | 0 (0.0%) | 24 (100.0%) |
| Security & Protection | 47 (67.1%) | 23 (32.9%) |
| Firefighting & Prevention | 34 (59.7%) | 23 (40.4%) |
| Law Enforcement | 13 (100.0%) | 0 (0.0%) |
| Food Preparation & Serving | 26 (29.9%) | 61 (70.1%) |
| Cleaning & Maintenance | 22 (62.9%) | 13 (37.1%) |
| Personal Care & Service | 0 (0.0%) | 37 (100.0%) |
| Total (Category) | 95 (37.6%) | 158 (62.5%) |
| Total (Overall) | 686 (49.3%) | 706 (50.7%) |
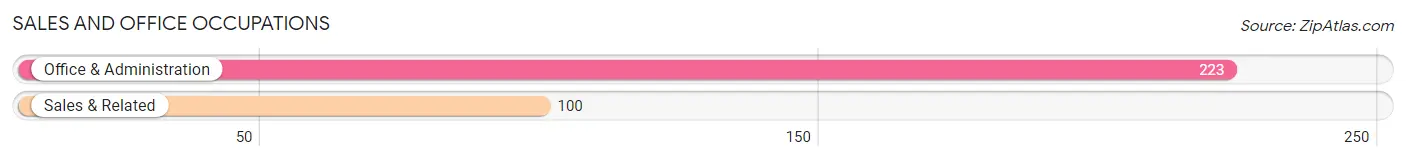
Sales and Office Occupations
The most common Sales and Office occupations in Lakeland are Office & Administration (223 | 16.0%), and Sales & Related (100 | 7.2%).
Sales and Office Occupations by Sex
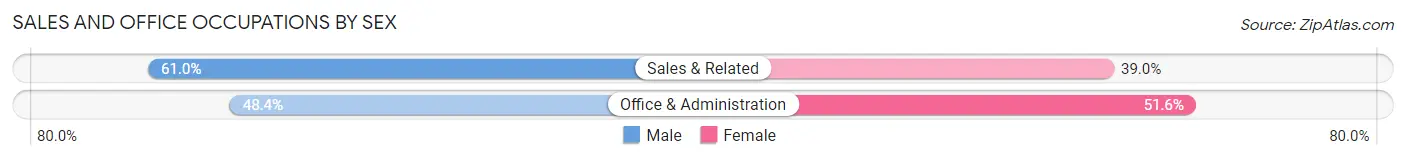
| Occupation | Male | Female |
| Sales & Related | 61 (61.0%) | 39 (39.0%) |
| Office & Administration | 108 (48.4%) | 115 (51.6%) |
| Total (Category) | 169 (52.3%) | 154 (47.7%) |
| Total (Overall) | 686 (49.3%) | 706 (50.7%) |
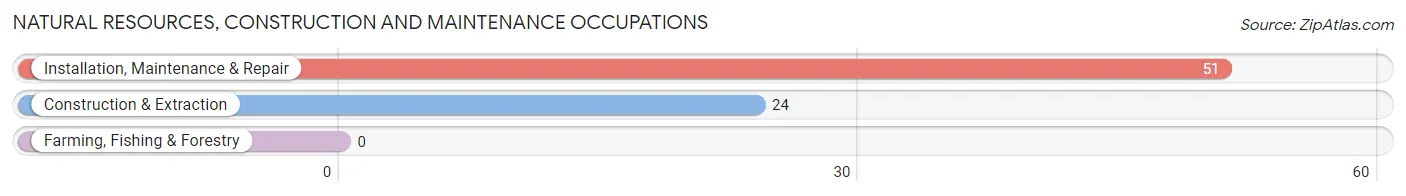
Natural Resources, Construction and Maintenance Occupations
The most common Natural Resources, Construction and Maintenance occupations in Lakeland are Installation, Maintenance & Repair (51 | 3.7%), and Construction & Extraction (24 | 1.7%).
Natural Resources, Construction and Maintenance Occupations by Sex
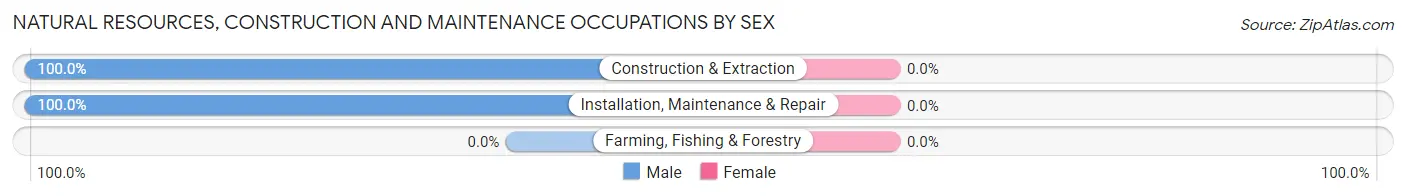
| Occupation | Male | Female |
| Farming, Fishing & Forestry | 0 (0.0%) | 0 (0.0%) |
| Construction & Extraction | 24 (100.0%) | 0 (0.0%) |
| Installation, Maintenance & Repair | 51 (100.0%) | 0 (0.0%) |
| Total (Category) | 75 (100.0%) | 0 (0.0%) |
| Total (Overall) | 686 (49.3%) | 706 (50.7%) |
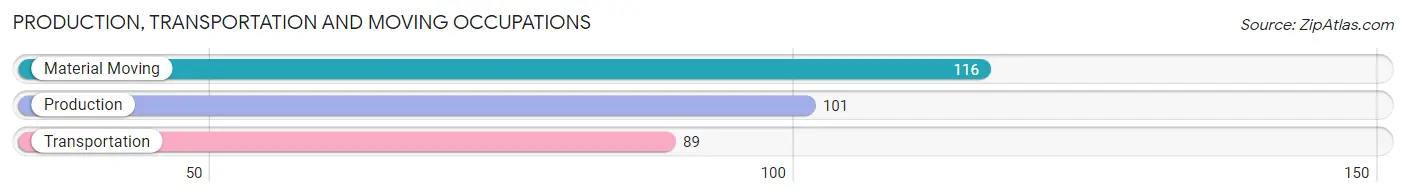
Production, Transportation and Moving Occupations
The most common Production, Transportation and Moving occupations in Lakeland are Material Moving (116 | 8.3%), Production (101 | 7.3%), and Transportation (89 | 6.4%).
Production, Transportation and Moving Occupations by Sex
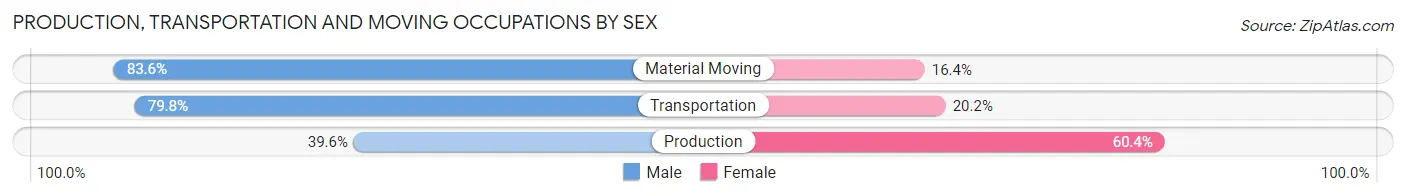
| Occupation | Male | Female |
| Production | 40 (39.6%) | 61 (60.4%) |
| Transportation | 71 (79.8%) | 18 (20.2%) |
| Material Moving | 97 (83.6%) | 19 (16.4%) |
| Total (Category) | 208 (68.0%) | 98 (32.0%) |
| Total (Overall) | 686 (49.3%) | 706 (50.7%) |
Employment Industries by Sex in Lakeland
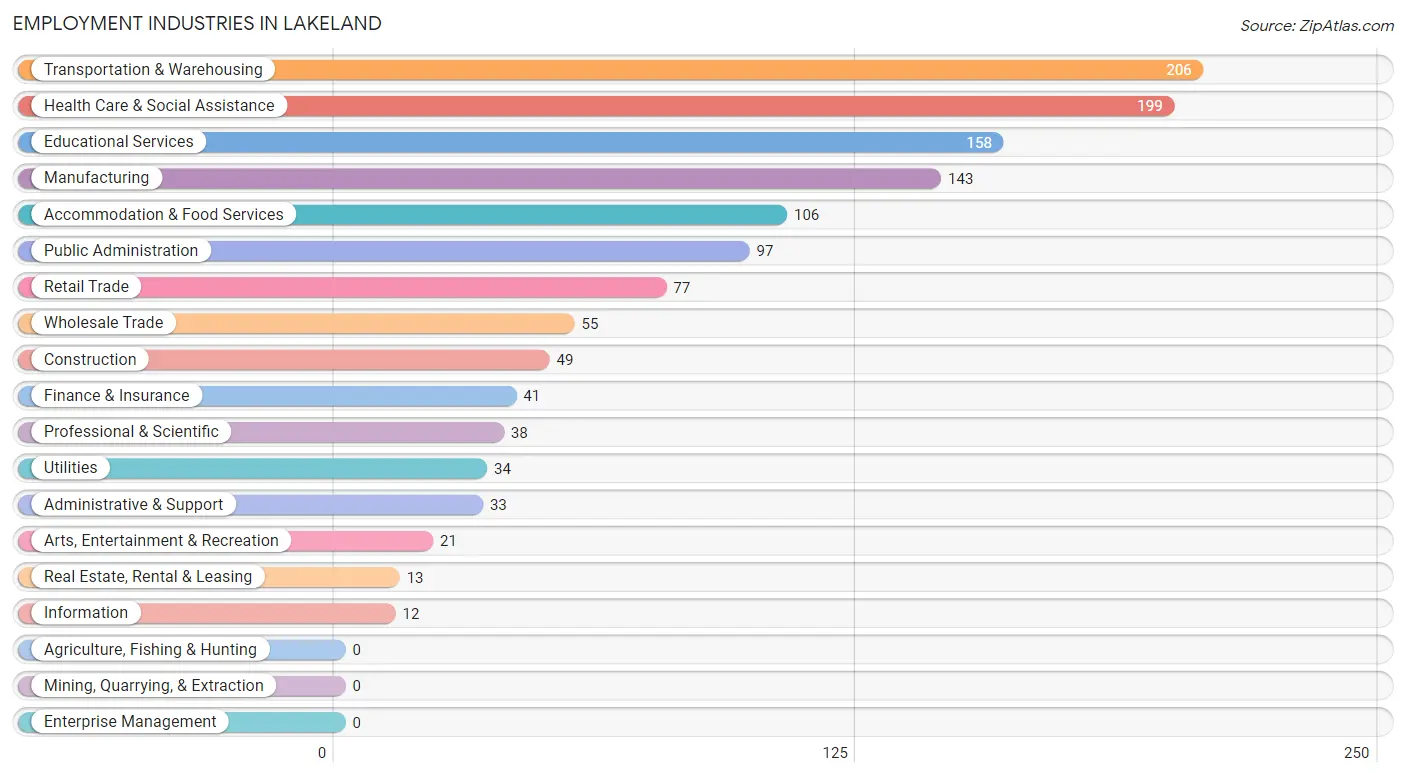
Employment Industries in Lakeland
The major employment industries in Lakeland include Transportation & Warehousing (206 | 14.8%), Health Care & Social Assistance (199 | 14.3%), Educational Services (158 | 11.4%), Manufacturing (143 | 10.3%), and Accommodation & Food Services (106 | 7.6%).
Employment Industries by Sex in Lakeland
The Lakeland industries that see more men than women are Construction (100.0%), Information (100.0%), and Real Estate, Rental & Leasing (100.0%), whereas the industries that tend to have a higher number of women are Administrative & Support (100.0%), Arts, Entertainment & Recreation (90.5%), and Health Care & Social Assistance (89.9%).
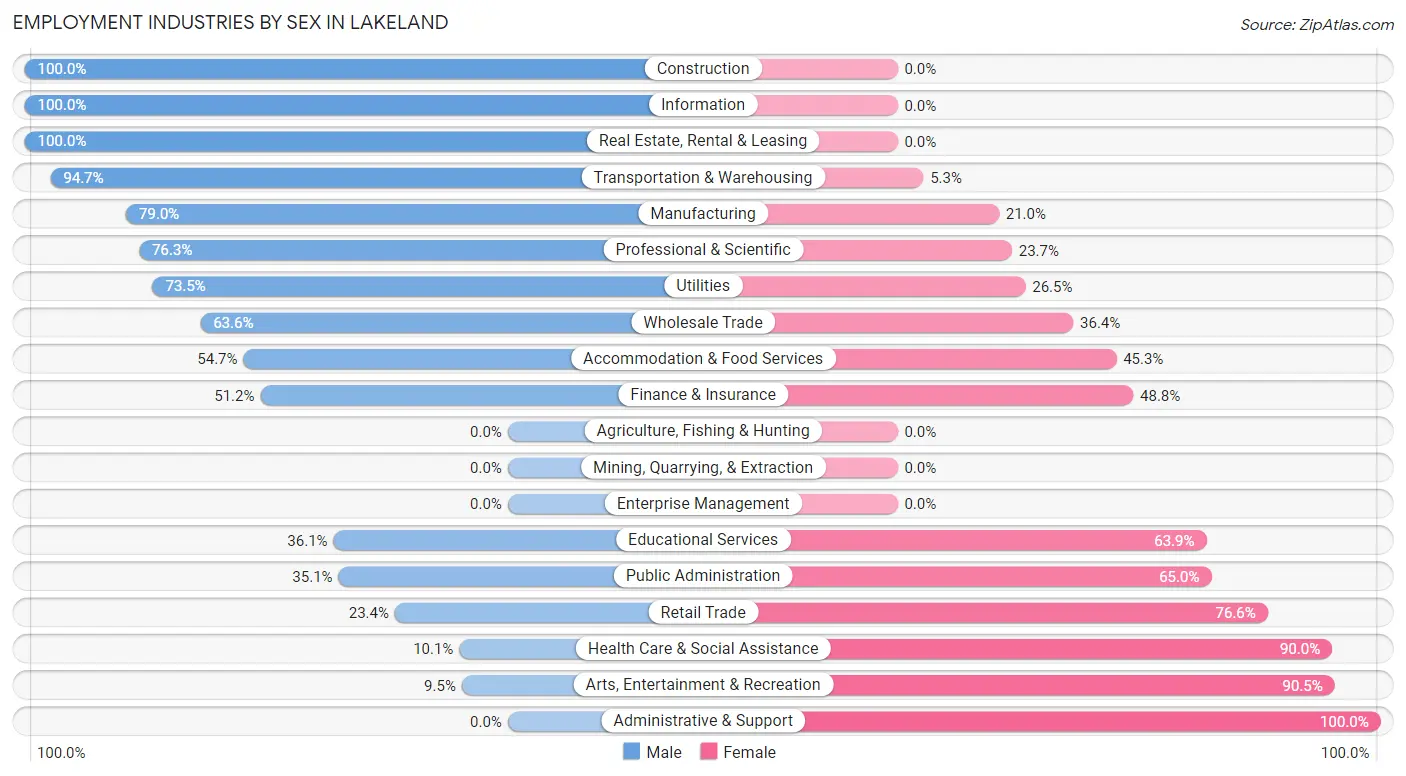
| Industry | Male | Female |
| Agriculture, Fishing & Hunting | 0 (0.0%) | 0 (0.0%) |
| Mining, Quarrying, & Extraction | 0 (0.0%) | 0 (0.0%) |
| Construction | 49 (100.0%) | 0 (0.0%) |
| Manufacturing | 113 (79.0%) | 30 (21.0%) |
| Wholesale Trade | 35 (63.6%) | 20 (36.4%) |
| Retail Trade | 18 (23.4%) | 59 (76.6%) |
| Transportation & Warehousing | 195 (94.7%) | 11 (5.3%) |
| Utilities | 25 (73.5%) | 9 (26.5%) |
| Information | 12 (100.0%) | 0 (0.0%) |
| Finance & Insurance | 21 (51.2%) | 20 (48.8%) |
| Real Estate, Rental & Leasing | 13 (100.0%) | 0 (0.0%) |
| Professional & Scientific | 29 (76.3%) | 9 (23.7%) |
| Enterprise Management | 0 (0.0%) | 0 (0.0%) |
| Administrative & Support | 0 (0.0%) | 33 (100.0%) |
| Educational Services | 57 (36.1%) | 101 (63.9%) |
| Health Care & Social Assistance | 20 (10.1%) | 179 (89.9%) |
| Arts, Entertainment & Recreation | 2 (9.5%) | 19 (90.5%) |
| Accommodation & Food Services | 58 (54.7%) | 48 (45.3%) |
| Public Administration | 34 (35.0%) | 63 (64.9%) |
| Total | 686 (49.3%) | 706 (50.7%) |
Education in Lakeland
School Enrollment in Lakeland
The most common levels of schooling among the 440 students in Lakeland are high school (126 | 28.6%), college / undergraduate (90 | 20.4%), and elementary school (89 | 20.2%).
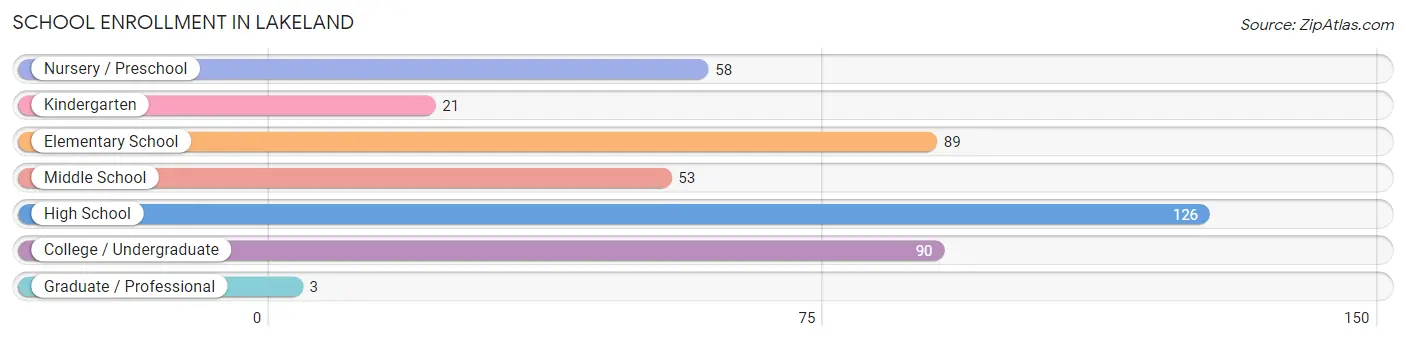
| School Level | # Students | % Students |
| Nursery / Preschool | 58 | 13.2% |
| Kindergarten | 21 | 4.8% |
| Elementary School | 89 | 20.2% |
| Middle School | 53 | 12.0% |
| High School | 126 | 28.6% |
| College / Undergraduate | 90 | 20.4% |
| Graduate / Professional | 3 | 0.7% |
| Total | 440 | 100.0% |
School Enrollment by Age by Funding Source in Lakeland
Out of a total of 440 students who are enrolled in schools in Lakeland, 26 (5.9%) attend a private institution, while the remaining 414 (94.1%) are enrolled in public schools. The age group of 3 to 4 year olds has the highest likelihood of being enrolled in private schools, with 10 (100.0% in the age bracket) enrolled. Conversely, the age group of 5 to 9 year old has the lowest likelihood of being enrolled in a private school, with 158 (100.0% in the age bracket) attending a public institution.
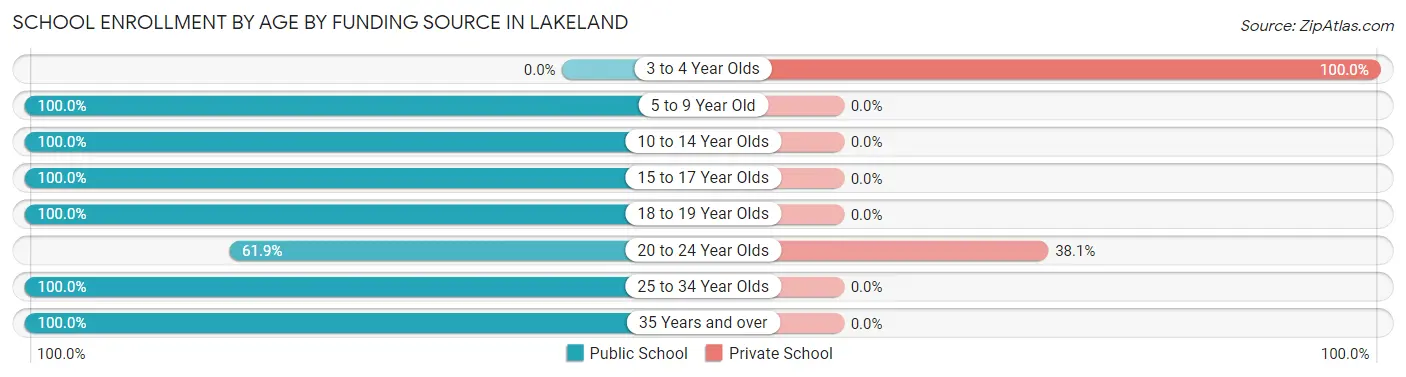
| Age Bracket | Public School | Private School |
| 3 to 4 Year Olds | 0 (0.0%) | 10 (100.0%) |
| 5 to 9 Year Old | 158 (100.0%) | 0 (0.0%) |
| 10 to 14 Year Olds | 71 (100.0%) | 0 (0.0%) |
| 15 to 17 Year Olds | 90 (100.0%) | 0 (0.0%) |
| 18 to 19 Year Olds | 26 (100.0%) | 0 (0.0%) |
| 20 to 24 Year Olds | 26 (61.9%) | 16 (38.1%) |
| 25 to 34 Year Olds | 24 (100.0%) | 0 (0.0%) |
| 35 Years and over | 19 (100.0%) | 0 (0.0%) |
| Total | 414 (94.1%) | 26 (5.9%) |
Educational Attainment by Field of Study in Lakeland
Business (107 | 19.9%), education (89 | 16.5%), arts & humanities (70 | 13.0%), bio, nature & agricultural (67 | 12.4%), and engineering (50 | 9.3%) are the most common fields of study among 539 individuals in Lakeland who have obtained a bachelor's degree or higher.
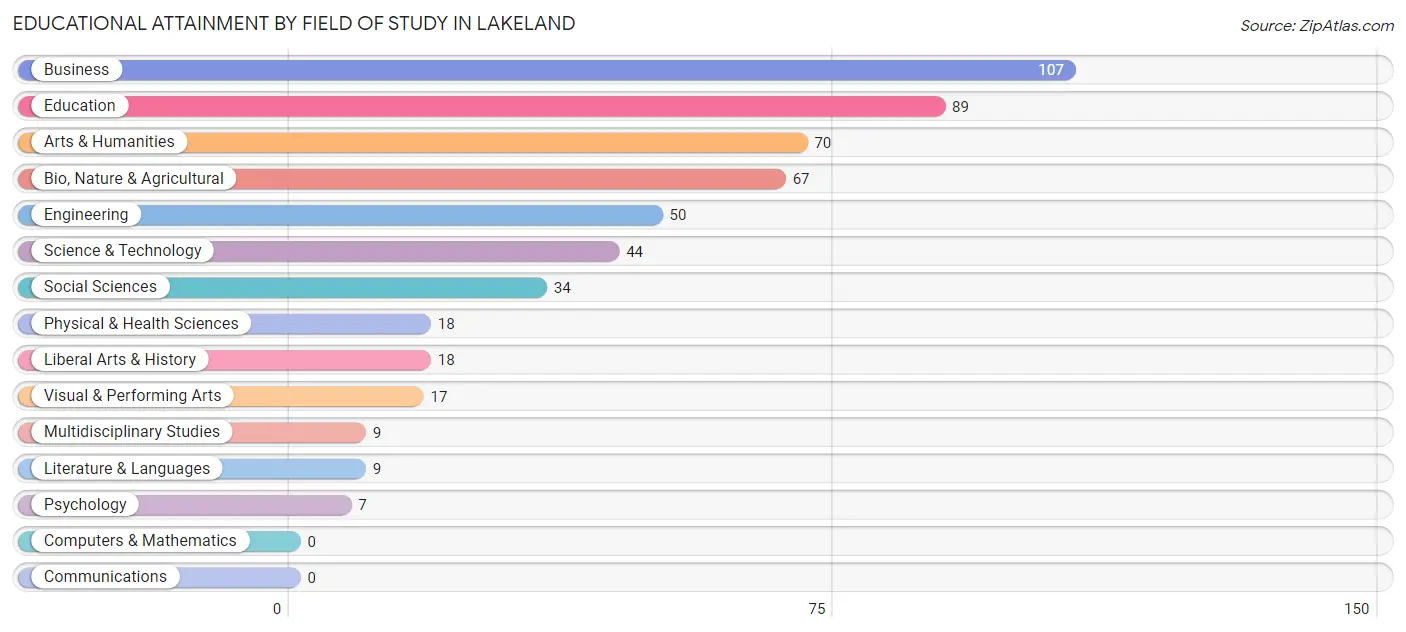
| Field of Study | # Graduates | % Graduates |
| Computers & Mathematics | 0 | 0.0% |
| Bio, Nature & Agricultural | 67 | 12.4% |
| Physical & Health Sciences | 18 | 3.3% |
| Psychology | 7 | 1.3% |
| Social Sciences | 34 | 6.3% |
| Engineering | 50 | 9.3% |
| Multidisciplinary Studies | 9 | 1.7% |
| Science & Technology | 44 | 8.2% |
| Business | 107 | 19.9% |
| Education | 89 | 16.5% |
| Literature & Languages | 9 | 1.7% |
| Liberal Arts & History | 18 | 3.3% |
| Visual & Performing Arts | 17 | 3.2% |
| Communications | 0 | 0.0% |
| Arts & Humanities | 70 | 13.0% |
| Total | 539 | 100.0% |
Transportation & Commute in Lakeland
Vehicle Availability by Sex in Lakeland
The most prevalent vehicle ownership categories in Lakeland are males with 2 vehicles (301, accounting for 43.9%) and females with 2 vehicles (321, making up 44.7%).
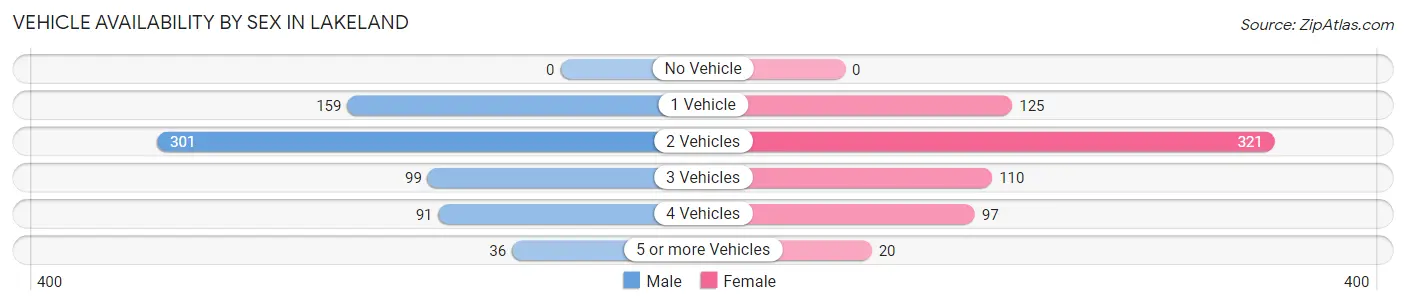
| Vehicles Available | Male | Female |
| No Vehicle | 0 (0.0%) | 0 (0.0%) |
| 1 Vehicle | 159 (23.2%) | 125 (18.6%) |
| 2 Vehicles | 301 (43.9%) | 321 (47.7%) |
| 3 Vehicles | 99 (14.4%) | 110 (16.3%) |
| 4 Vehicles | 91 (13.3%) | 97 (14.4%) |
| 5 or more Vehicles | 36 (5.2%) | 20 (3.0%) |
| Total | 686 (100.0%) | 673 (100.0%) |
Commute Time in Lakeland
The most frequently occuring commute durations in Lakeland are 20 to 24 minutes (332 commuters, 25.5%), 15 to 19 minutes (280 commuters, 21.5%), and 10 to 14 minutes (238 commuters, 18.3%).
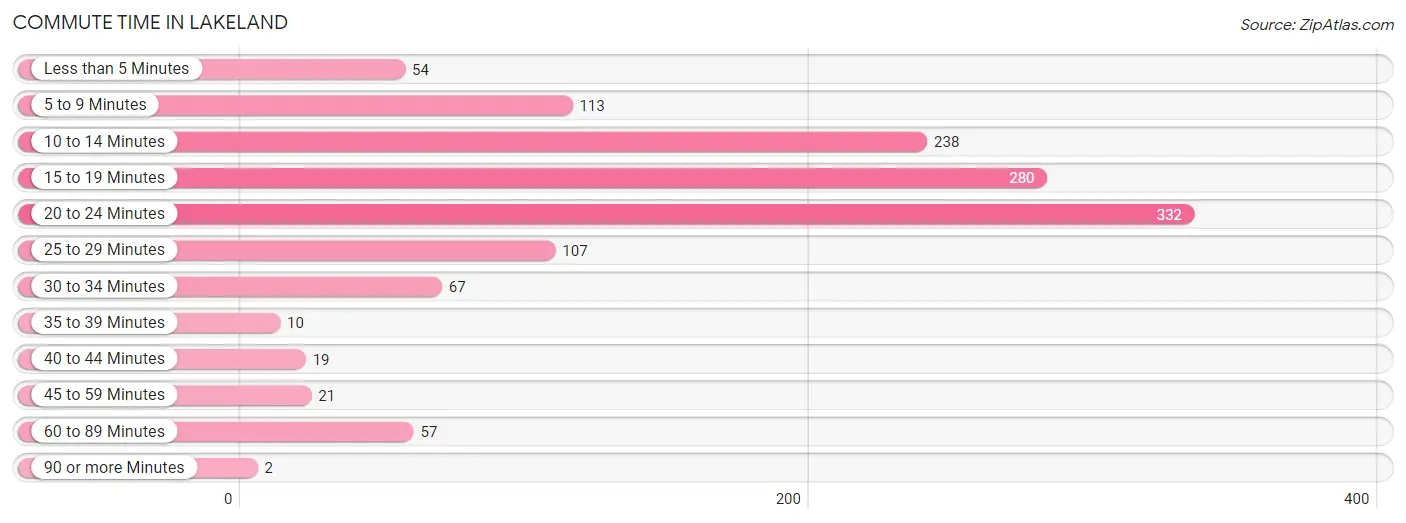
| Commute Time | # Commuters | % Commuters |
| Less than 5 Minutes | 54 | 4.2% |
| 5 to 9 Minutes | 113 | 8.7% |
| 10 to 14 Minutes | 238 | 18.3% |
| 15 to 19 Minutes | 280 | 21.5% |
| 20 to 24 Minutes | 332 | 25.5% |
| 25 to 29 Minutes | 107 | 8.2% |
| 30 to 34 Minutes | 67 | 5.1% |
| 35 to 39 Minutes | 10 | 0.8% |
| 40 to 44 Minutes | 19 | 1.5% |
| 45 to 59 Minutes | 21 | 1.6% |
| 60 to 89 Minutes | 57 | 4.4% |
| 90 or more Minutes | 2 | 0.2% |
Commute Time by Sex in Lakeland
The most common commute times in Lakeland are 10 to 14 minutes (186 commuters, 27.8%) for males and 20 to 24 minutes (241 commuters, 38.1%) for females.
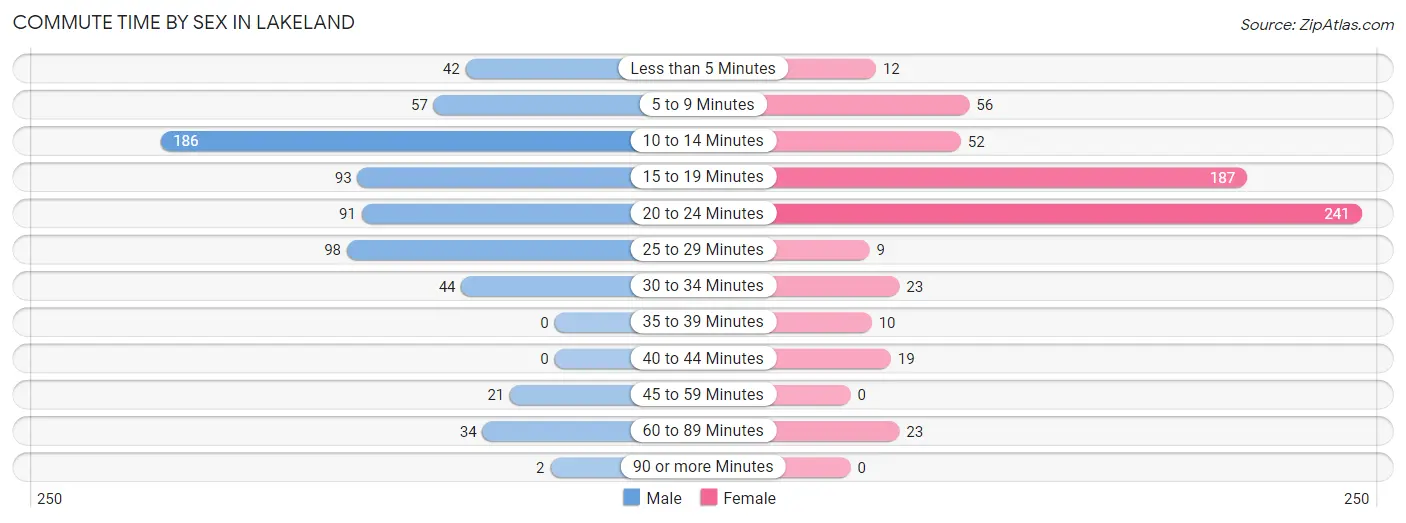
| Commute Time | Male | Female |
| Less than 5 Minutes | 42 (6.3%) | 12 (1.9%) |
| 5 to 9 Minutes | 57 (8.5%) | 56 (8.9%) |
| 10 to 14 Minutes | 186 (27.8%) | 52 (8.2%) |
| 15 to 19 Minutes | 93 (13.9%) | 187 (29.6%) |
| 20 to 24 Minutes | 91 (13.6%) | 241 (38.1%) |
| 25 to 29 Minutes | 98 (14.7%) | 9 (1.4%) |
| 30 to 34 Minutes | 44 (6.6%) | 23 (3.6%) |
| 35 to 39 Minutes | 0 (0.0%) | 10 (1.6%) |
| 40 to 44 Minutes | 0 (0.0%) | 19 (3.0%) |
| 45 to 59 Minutes | 21 (3.1%) | 0 (0.0%) |
| 60 to 89 Minutes | 34 (5.1%) | 23 (3.6%) |
| 90 or more Minutes | 2 (0.3%) | 0 (0.0%) |
Time of Departure to Work by Sex in Lakeland
The most frequent times of departure to work in Lakeland are 7:00 AM to 7:29 AM (133, 19.9%) for males and 7:00 AM to 7:29 AM (128, 20.3%) for females.
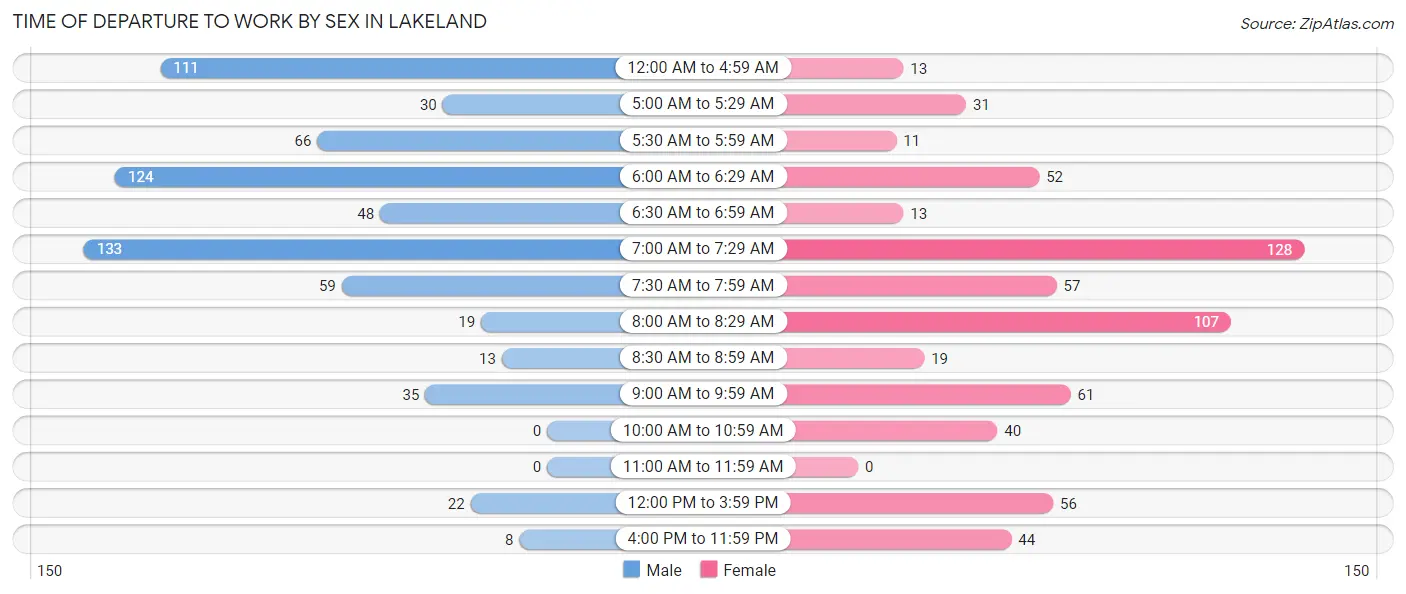
| Time of Departure | Male | Female |
| 12:00 AM to 4:59 AM | 111 (16.6%) | 13 (2.1%) |
| 5:00 AM to 5:29 AM | 30 (4.5%) | 31 (4.9%) |
| 5:30 AM to 5:59 AM | 66 (9.9%) | 11 (1.7%) |
| 6:00 AM to 6:29 AM | 124 (18.6%) | 52 (8.2%) |
| 6:30 AM to 6:59 AM | 48 (7.2%) | 13 (2.1%) |
| 7:00 AM to 7:29 AM | 133 (19.9%) | 128 (20.3%) |
| 7:30 AM to 7:59 AM | 59 (8.8%) | 57 (9.0%) |
| 8:00 AM to 8:29 AM | 19 (2.8%) | 107 (16.9%) |
| 8:30 AM to 8:59 AM | 13 (1.9%) | 19 (3.0%) |
| 9:00 AM to 9:59 AM | 35 (5.2%) | 61 (9.7%) |
| 10:00 AM to 10:59 AM | 0 (0.0%) | 40 (6.3%) |
| 11:00 AM to 11:59 AM | 0 (0.0%) | 0 (0.0%) |
| 12:00 PM to 3:59 PM | 22 (3.3%) | 56 (8.9%) |
| 4:00 PM to 11:59 PM | 8 (1.2%) | 44 (7.0%) |
| Total | 668 (100.0%) | 632 (100.0%) |
Housing Occupancy in Lakeland
Occupancy by Ownership in Lakeland
Of the total 1,168 dwellings in Lakeland, owner-occupied units account for 942 (80.6%), while renter-occupied units make up 226 (19.4%).
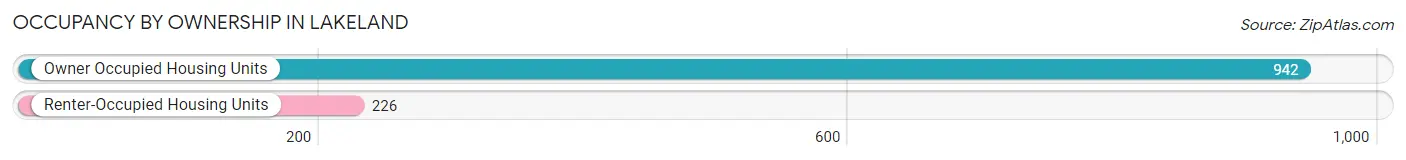
| Occupancy | # Housing Units | % Housing Units |
| Owner Occupied Housing Units | 942 | 80.6% |
| Renter-Occupied Housing Units | 226 | 19.4% |
| Total Occupied Housing Units | 1,168 | 100.0% |
Occupancy by Household Size in Lakeland
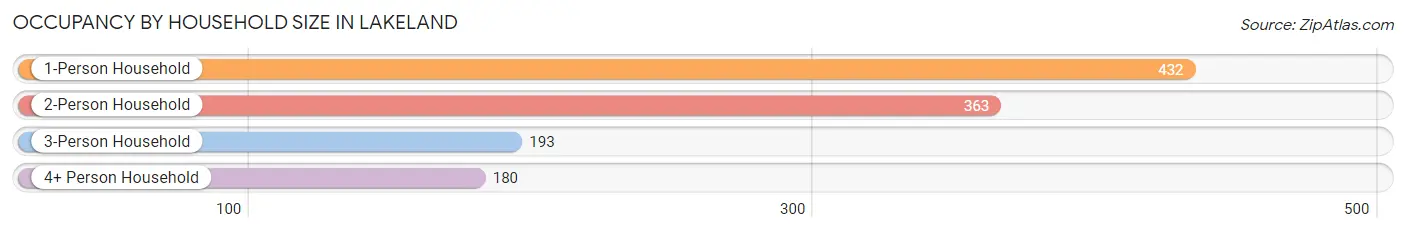
| Household Size | # Housing Units | % Housing Units |
| 1-Person Household | 432 | 37.0% |
| 2-Person Household | 363 | 31.1% |
| 3-Person Household | 193 | 16.5% |
| 4+ Person Household | 180 | 15.4% |
| Total Housing Units | 1,168 | 100.0% |
Occupancy by Ownership by Household Size in Lakeland
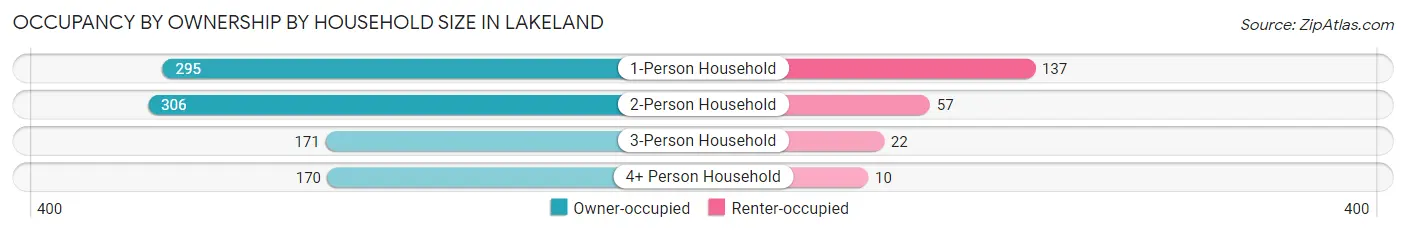
| Household Size | Owner-occupied | Renter-occupied |
| 1-Person Household | 295 (68.3%) | 137 (31.7%) |
| 2-Person Household | 306 (84.3%) | 57 (15.7%) |
| 3-Person Household | 171 (88.6%) | 22 (11.4%) |
| 4+ Person Household | 170 (94.4%) | 10 (5.6%) |
| Total Housing Units | 942 (80.6%) | 226 (19.4%) |
Occupancy by Educational Attainment in Lakeland
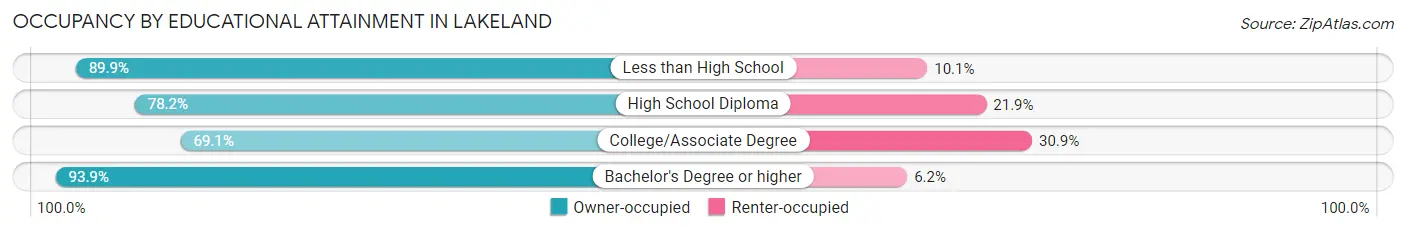
| Household Size | Owner-occupied | Renter-occupied |
| Less than High School | 62 (89.9%) | 7 (10.1%) |
| High School Diploma | 347 (78.1%) | 97 (21.8%) |
| College/Associate Degree | 228 (69.1%) | 102 (30.9%) |
| Bachelor's Degree or higher | 305 (93.9%) | 20 (6.1%) |
Occupancy by Age of Householder in Lakeland
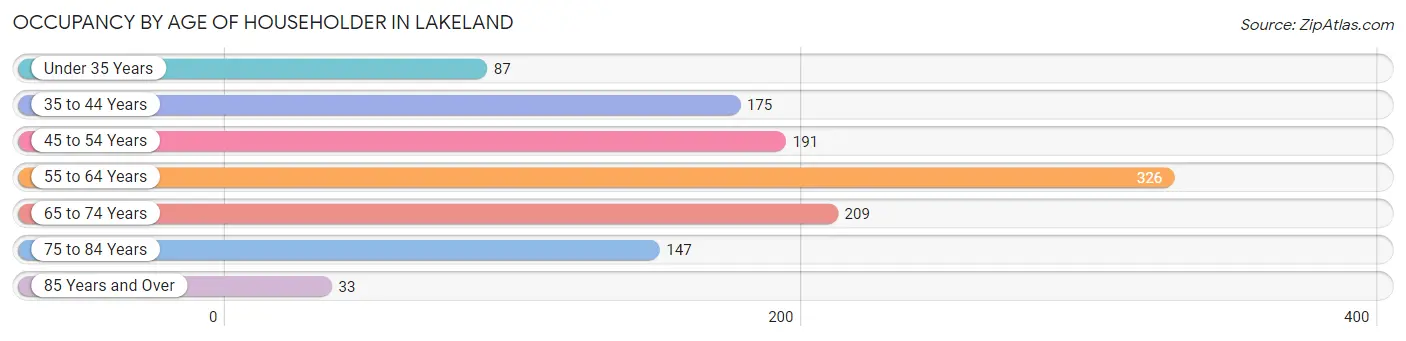
| Age Bracket | # Households | % Households |
| Under 35 Years | 87 | 7.4% |
| 35 to 44 Years | 175 | 15.0% |
| 45 to 54 Years | 191 | 16.4% |
| 55 to 64 Years | 326 | 27.9% |
| 65 to 74 Years | 209 | 17.9% |
| 75 to 84 Years | 147 | 12.6% |
| 85 Years and Over | 33 | 2.8% |
| Total | 1,168 | 100.0% |
Housing Finances in Lakeland
Median Income by Occupancy in Lakeland
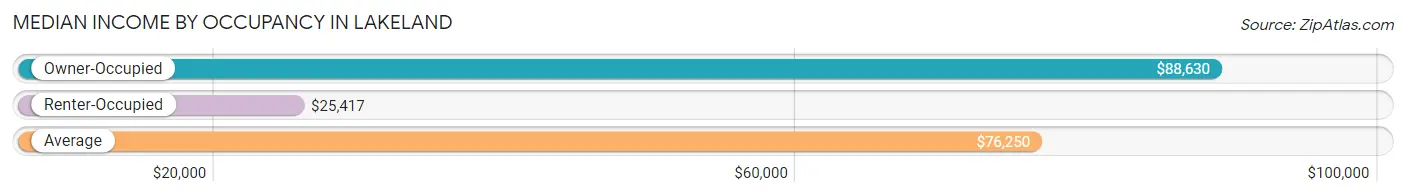
| Occupancy Type | # Households | Median Income |
| Owner-Occupied | 942 (80.6%) | $88,630 |
| Renter-Occupied | 226 (19.4%) | $25,417 |
| Average | 1,168 (100.0%) | $76,250 |
Occupancy by Householder Income Bracket in Lakeland
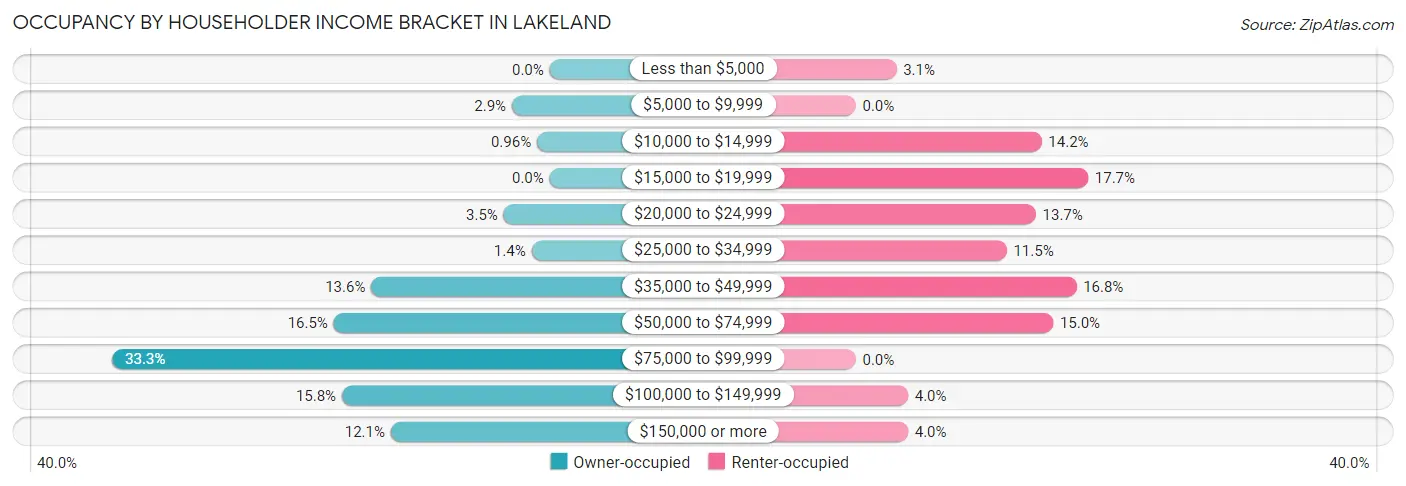
| Income Bracket | Owner-occupied | Renter-occupied |
| Less than $5,000 | 0 (0.0%) | 7 (3.1%) |
| $5,000 to $9,999 | 27 (2.9%) | 0 (0.0%) |
| $10,000 to $14,999 | 9 (1.0%) | 32 (14.2%) |
| $15,000 to $19,999 | 0 (0.0%) | 40 (17.7%) |
| $20,000 to $24,999 | 33 (3.5%) | 31 (13.7%) |
| $25,000 to $34,999 | 13 (1.4%) | 26 (11.5%) |
| $35,000 to $49,999 | 128 (13.6%) | 38 (16.8%) |
| $50,000 to $74,999 | 155 (16.5%) | 34 (15.0%) |
| $75,000 to $99,999 | 314 (33.3%) | 0 (0.0%) |
| $100,000 to $149,999 | 149 (15.8%) | 9 (4.0%) |
| $150,000 or more | 114 (12.1%) | 9 (4.0%) |
| Total | 942 (100.0%) | 226 (100.0%) |
Monthly Housing Cost Tiers in Lakeland
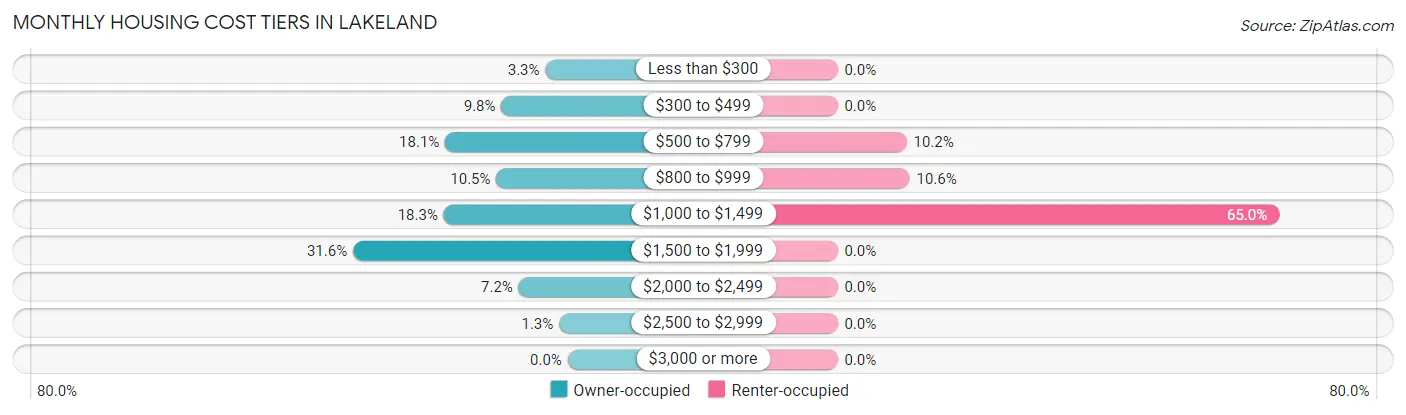
| Monthly Cost | Owner-occupied | Renter-occupied |
| Less than $300 | 31 (3.3%) | 0 (0.0%) |
| $300 to $499 | 92 (9.8%) | 0 (0.0%) |
| $500 to $799 | 170 (18.0%) | 23 (10.2%) |
| $800 to $999 | 99 (10.5%) | 24 (10.6%) |
| $1,000 to $1,499 | 172 (18.3%) | 147 (65.0%) |
| $1,500 to $1,999 | 298 (31.6%) | 0 (0.0%) |
| $2,000 to $2,499 | 68 (7.2%) | 0 (0.0%) |
| $2,500 to $2,999 | 12 (1.3%) | 0 (0.0%) |
| $3,000 or more | 0 (0.0%) | 0 (0.0%) |
| Total | 942 (100.0%) | 226 (100.0%) |
Physical Housing Characteristics in Lakeland
Housing Structures in Lakeland
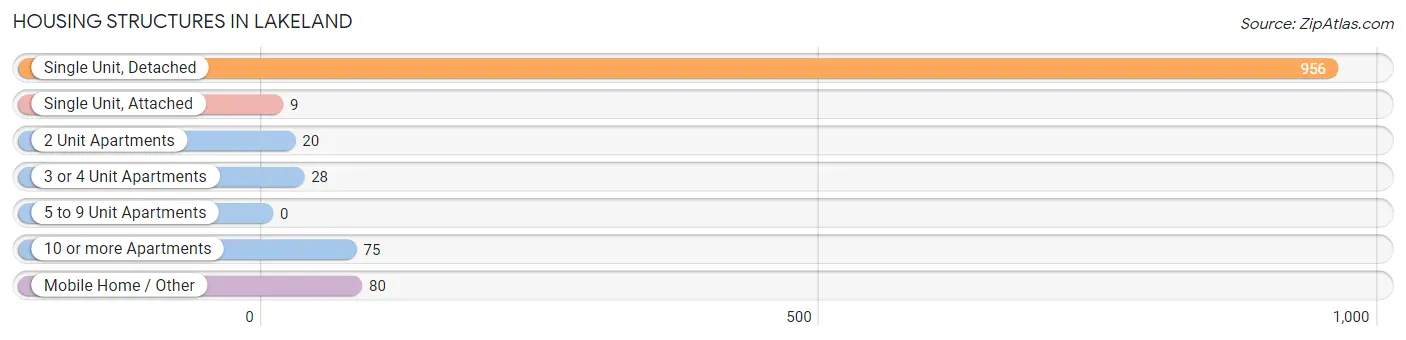
| Structure Type | # Housing Units | % Housing Units |
| Single Unit, Detached | 956 | 81.9% |
| Single Unit, Attached | 9 | 0.8% |
| 2 Unit Apartments | 20 | 1.7% |
| 3 or 4 Unit Apartments | 28 | 2.4% |
| 5 to 9 Unit Apartments | 0 | 0.0% |
| 10 or more Apartments | 75 | 6.4% |
| Mobile Home / Other | 80 | 6.9% |
| Total | 1,168 | 100.0% |
Housing Structures by Occupancy in Lakeland
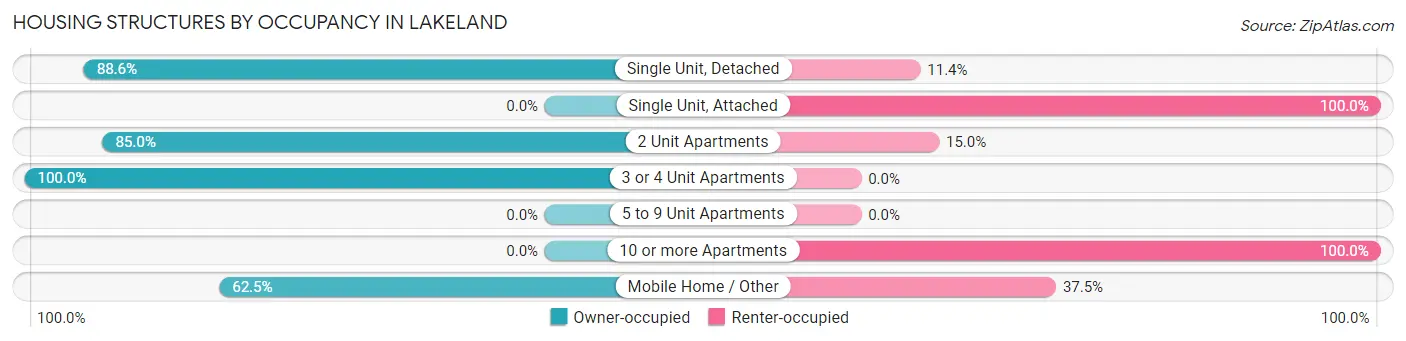
| Structure Type | Owner-occupied | Renter-occupied |
| Single Unit, Detached | 847 (88.6%) | 109 (11.4%) |
| Single Unit, Attached | 0 (0.0%) | 9 (100.0%) |
| 2 Unit Apartments | 17 (85.0%) | 3 (15.0%) |
| 3 or 4 Unit Apartments | 28 (100.0%) | 0 (0.0%) |
| 5 to 9 Unit Apartments | 0 (0.0%) | 0 (0.0%) |
| 10 or more Apartments | 0 (0.0%) | 75 (100.0%) |
| Mobile Home / Other | 50 (62.5%) | 30 (37.5%) |
| Total | 942 (80.6%) | 226 (19.4%) |
Housing Structures by Number of Rooms in Lakeland
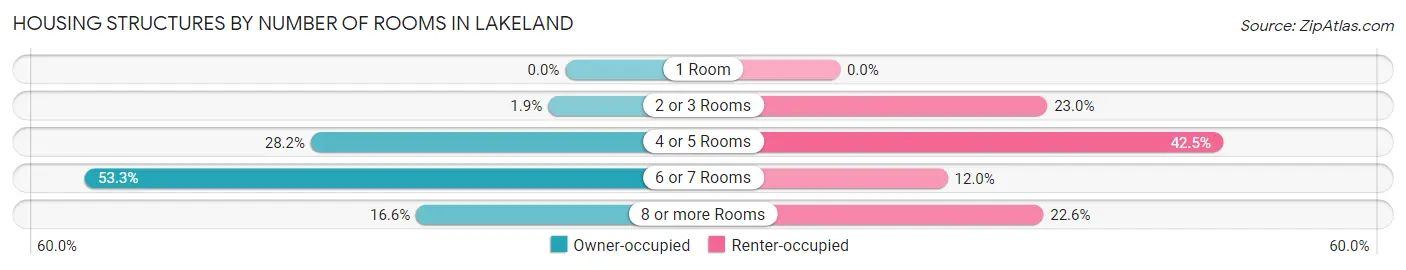
| Number of Rooms | Owner-occupied | Renter-occupied |
| 1 Room | 0 (0.0%) | 0 (0.0%) |
| 2 or 3 Rooms | 18 (1.9%) | 52 (23.0%) |
| 4 or 5 Rooms | 266 (28.2%) | 96 (42.5%) |
| 6 or 7 Rooms | 502 (53.3%) | 27 (11.9%) |
| 8 or more Rooms | 156 (16.6%) | 51 (22.6%) |
| Total | 942 (100.0%) | 226 (100.0%) |
Housing Structure by Heating Type in Lakeland
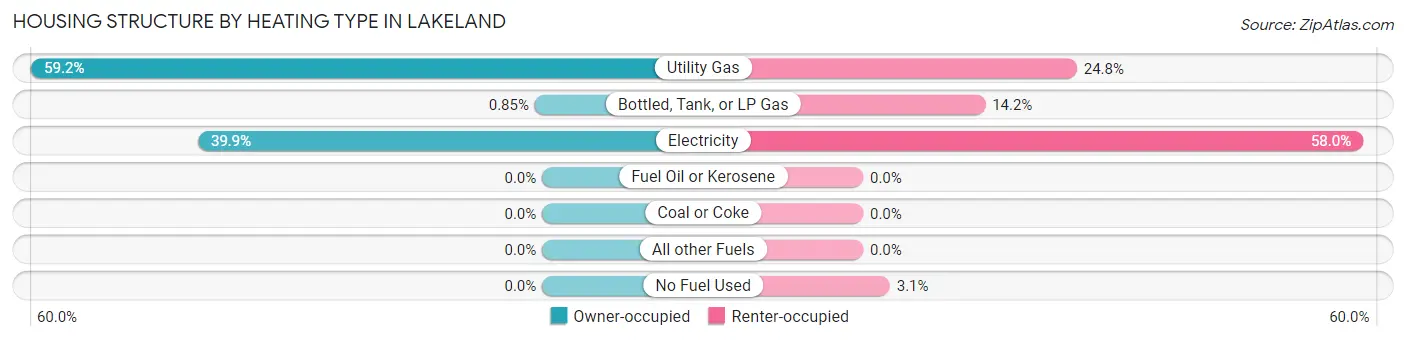
| Heating Type | Owner-occupied | Renter-occupied |
| Utility Gas | 558 (59.2%) | 56 (24.8%) |
| Bottled, Tank, or LP Gas | 8 (0.9%) | 32 (14.2%) |
| Electricity | 376 (39.9%) | 131 (58.0%) |
| Fuel Oil or Kerosene | 0 (0.0%) | 0 (0.0%) |
| Coal or Coke | 0 (0.0%) | 0 (0.0%) |
| All other Fuels | 0 (0.0%) | 0 (0.0%) |
| No Fuel Used | 0 (0.0%) | 7 (3.1%) |
| Total | 942 (100.0%) | 226 (100.0%) |
Household Vehicle Usage in Lakeland
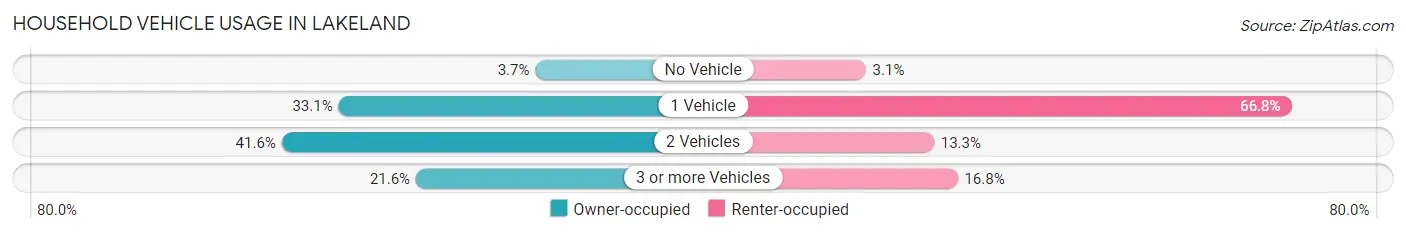
| Vehicles per Household | Owner-occupied | Renter-occupied |
| No Vehicle | 35 (3.7%) | 7 (3.1%) |
| 1 Vehicle | 312 (33.1%) | 151 (66.8%) |
| 2 Vehicles | 392 (41.6%) | 30 (13.3%) |
| 3 or more Vehicles | 203 (21.5%) | 38 (16.8%) |
| Total | 942 (100.0%) | 226 (100.0%) |
Real Estate & Mortgages in Lakeland
Real Estate and Mortgage Overview in Lakeland
| Characteristic | Without Mortgage | With Mortgage |
| Housing Units | 323 | 619 |
| Median Property Value | $138,100 | $162,000 |
| Median Household Income | $71,406 | $82 |
| Monthly Housing Costs | $564 | $0 |
| Real Estate Taxes | $3,929 | $0 |
Property Value by Mortgage Status in Lakeland
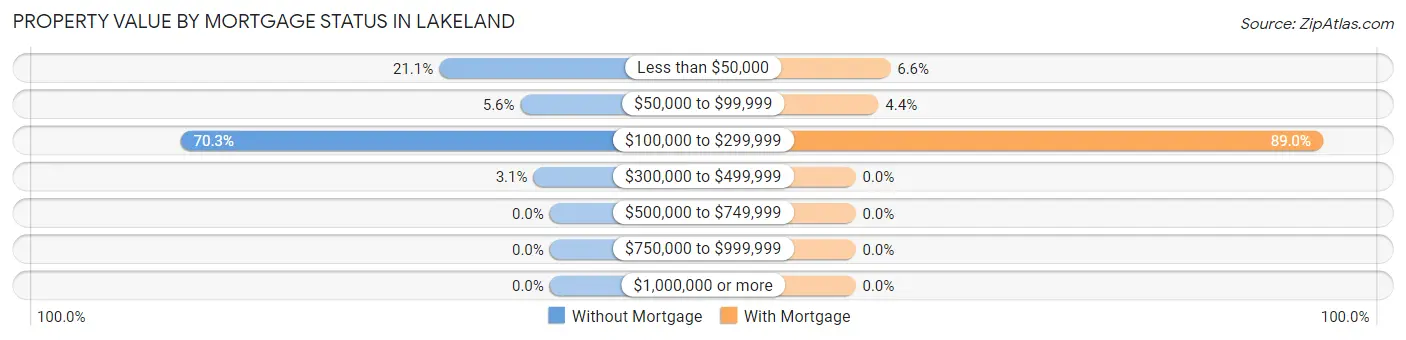
| Property Value | Without Mortgage | With Mortgage |
| Less than $50,000 | 68 (21.0%) | 41 (6.6%) |
| $50,000 to $99,999 | 18 (5.6%) | 27 (4.4%) |
| $100,000 to $299,999 | 227 (70.3%) | 551 (89.0%) |
| $300,000 to $499,999 | 10 (3.1%) | 0 (0.0%) |
| $500,000 to $749,999 | 0 (0.0%) | 0 (0.0%) |
| $750,000 to $999,999 | 0 (0.0%) | 0 (0.0%) |
| $1,000,000 or more | 0 (0.0%) | 0 (0.0%) |
| Total | 323 (100.0%) | 619 (100.0%) |
Household Income by Mortgage Status in Lakeland
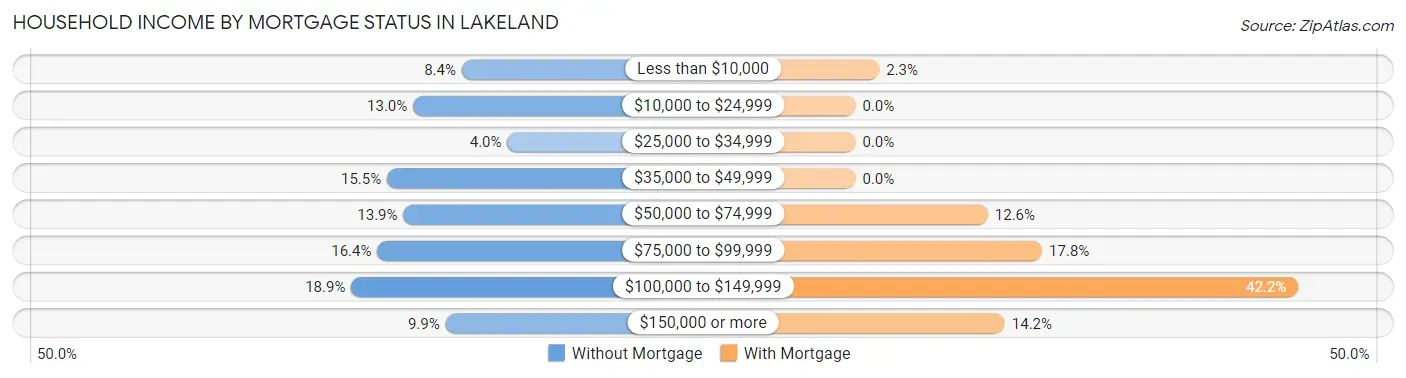
| Household Income | Without Mortgage | With Mortgage |
| Less than $10,000 | 27 (8.4%) | 14 (2.3%) |
| $10,000 to $24,999 | 42 (13.0%) | 0 (0.0%) |
| $25,000 to $34,999 | 13 (4.0%) | 0 (0.0%) |
| $35,000 to $49,999 | 50 (15.5%) | 0 (0.0%) |
| $50,000 to $74,999 | 45 (13.9%) | 78 (12.6%) |
| $75,000 to $99,999 | 53 (16.4%) | 110 (17.8%) |
| $100,000 to $149,999 | 61 (18.9%) | 261 (42.2%) |
| $150,000 or more | 32 (9.9%) | 88 (14.2%) |
| Total | 323 (100.0%) | 619 (100.0%) |
Property Value to Household Income Ratio in Lakeland
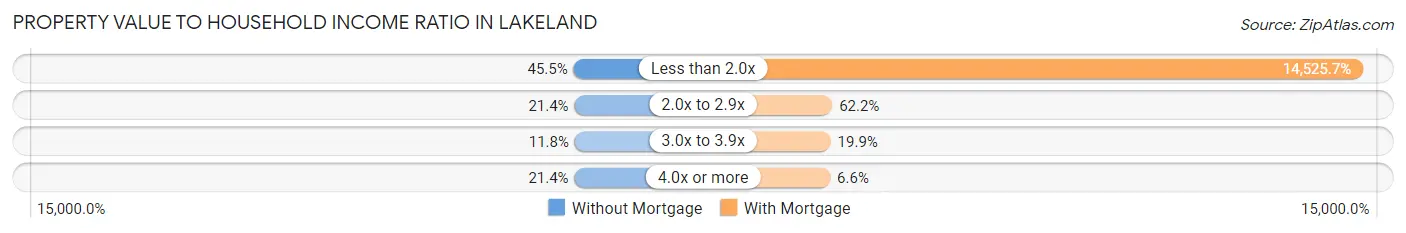
| Value-to-Income Ratio | Without Mortgage | With Mortgage |
| Less than 2.0x | 147 (45.5%) | 89,914 (14,525.7%) |
| 2.0x to 2.9x | 69 (21.4%) | 385 (62.2%) |
| 3.0x to 3.9x | 38 (11.8%) | 123 (19.9%) |
| 4.0x or more | 69 (21.4%) | 41 (6.6%) |
| Total | 323 (100.0%) | 619 (100.0%) |
Real Estate Taxes by Mortgage Status in Lakeland
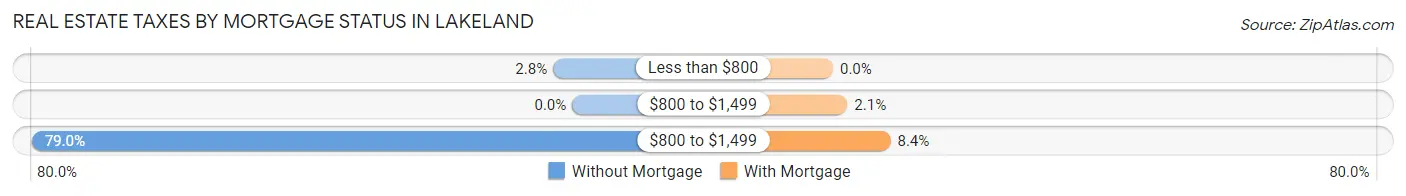
| Property Taxes | Without Mortgage | With Mortgage |
| Less than $800 | 9 (2.8%) | 0 (0.0%) |
| $800 to $1,499 | 0 (0.0%) | 13 (2.1%) |
| $800 to $1,499 | 255 (78.9%) | 52 (8.4%) |
| Total | 323 (100.0%) | 619 (100.0%) |
Health & Disability in Lakeland
Health Insurance Coverage by Age in Lakeland
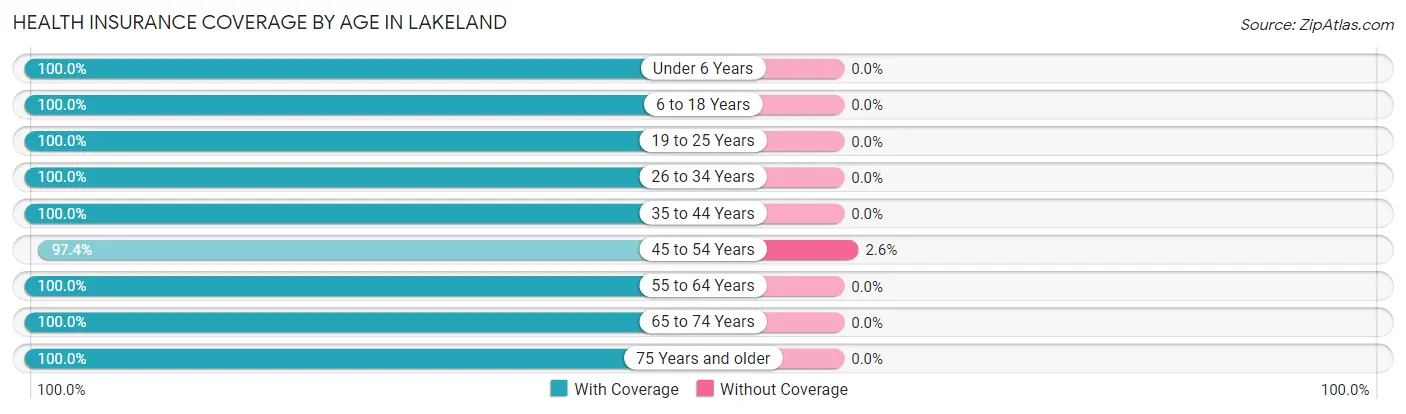
| Age Bracket | With Coverage | Without Coverage |
| Under 6 Years | 130 (100.0%) | 0 (0.0%) |
| 6 to 18 Years | 287 (100.0%) | 0 (0.0%) |
| 19 to 25 Years | 135 (100.0%) | 0 (0.0%) |
| 26 to 34 Years | 167 (100.0%) | 0 (0.0%) |
| 35 to 44 Years | 363 (100.0%) | 0 (0.0%) |
| 45 to 54 Years | 369 (97.4%) | 10 (2.6%) |
| 55 to 64 Years | 528 (100.0%) | 0 (0.0%) |
| 65 to 74 Years | 267 (100.0%) | 0 (0.0%) |
| 75 Years and older | 257 (100.0%) | 0 (0.0%) |
| Total | 2,503 (99.6%) | 10 (0.4%) |
Health Insurance Coverage by Citizenship Status in Lakeland
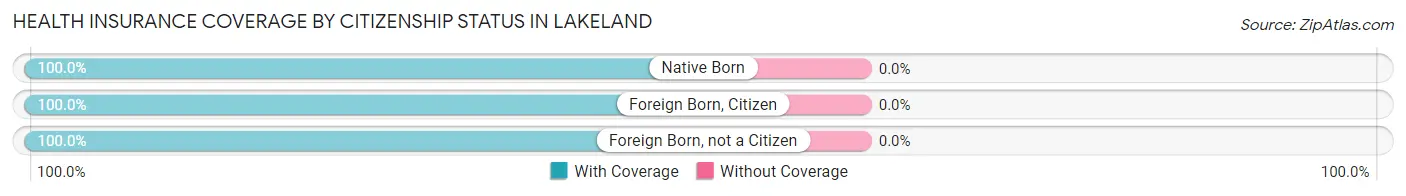
| Citizenship Status | With Coverage | Without Coverage |
| Native Born | 130 (100.0%) | 0 (0.0%) |
| Foreign Born, Citizen | 287 (100.0%) | 0 (0.0%) |
| Foreign Born, not a Citizen | 135 (100.0%) | 0 (0.0%) |
Health Insurance Coverage by Household Income in Lakeland
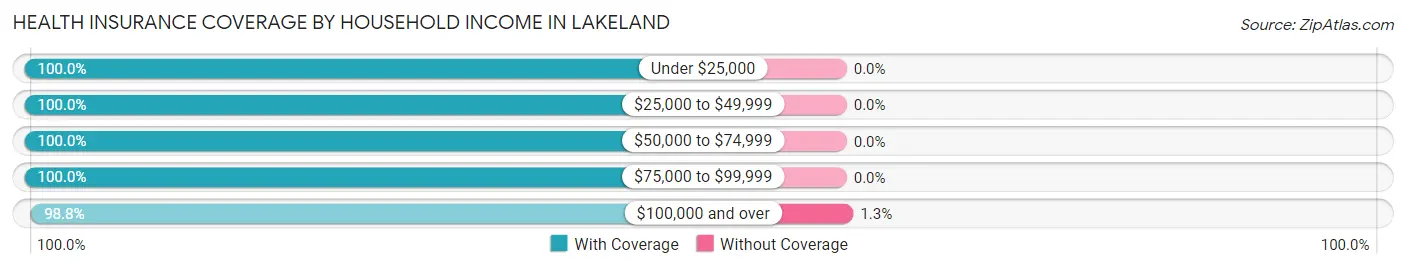
| Household Income | With Coverage | Without Coverage |
| Under $25,000 | 179 (100.0%) | 0 (0.0%) |
| $25,000 to $49,999 | 378 (100.0%) | 0 (0.0%) |
| $50,000 to $74,999 | 409 (100.0%) | 0 (0.0%) |
| $75,000 to $99,999 | 742 (100.0%) | 0 (0.0%) |
| $100,000 and over | 793 (98.8%) | 10 (1.3%) |
Public vs Private Health Insurance Coverage by Age in Lakeland
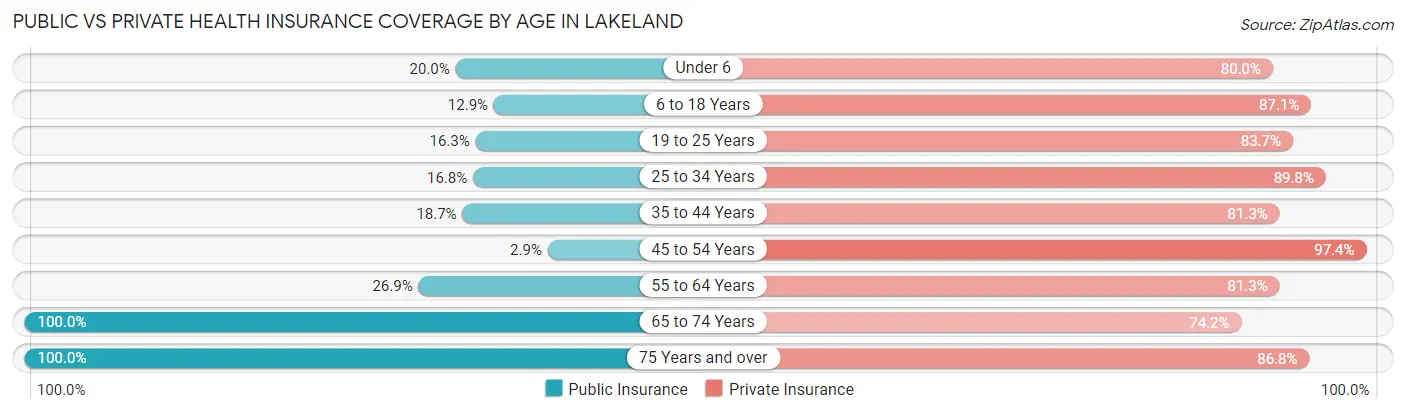
| Age Bracket | Public Insurance | Private Insurance |
| Under 6 | 26 (20.0%) | 104 (80.0%) |
| 6 to 18 Years | 37 (12.9%) | 250 (87.1%) |
| 19 to 25 Years | 22 (16.3%) | 113 (83.7%) |
| 25 to 34 Years | 28 (16.8%) | 150 (89.8%) |
| 35 to 44 Years | 68 (18.7%) | 295 (81.3%) |
| 45 to 54 Years | 11 (2.9%) | 369 (97.4%) |
| 55 to 64 Years | 142 (26.9%) | 429 (81.2%) |
| 65 to 74 Years | 267 (100.0%) | 198 (74.2%) |
| 75 Years and over | 257 (100.0%) | 223 (86.8%) |
| Total | 858 (34.1%) | 2,131 (84.8%) |
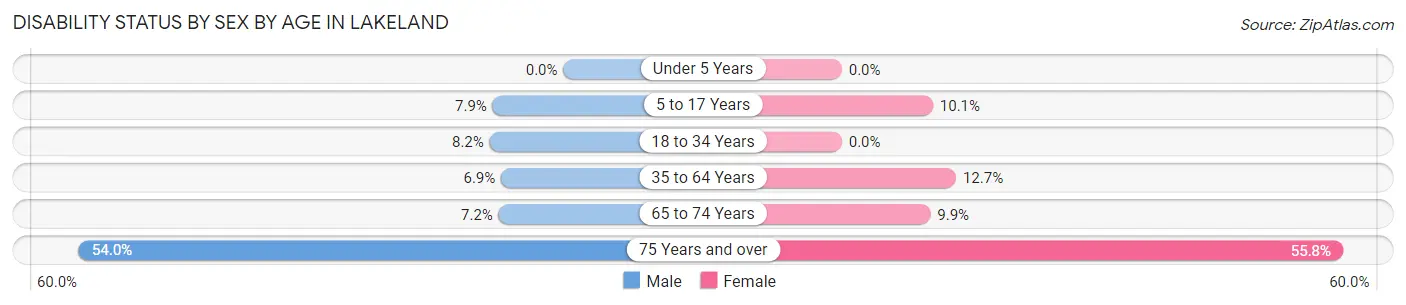
Disability Status by Sex by Age in Lakeland
| Age Bracket | Male | Female |
| Under 5 Years | 0 (0.0%) | 0 (0.0%) |
| 5 to 17 Years | 10 (7.9%) | 22 (10.1%) |
| 18 to 34 Years | 11 (8.2%) | 0 (0.0%) |
| 35 to 64 Years | 45 (6.9%) | 79 (12.7%) |
| 65 to 74 Years | 9 (7.2%) | 14 (9.9%) |
| 75 Years and over | 41 (53.9%) | 101 (55.8%) |
Disability Class by Sex by Age in Lakeland
Disability Class: Hearing Difficulty
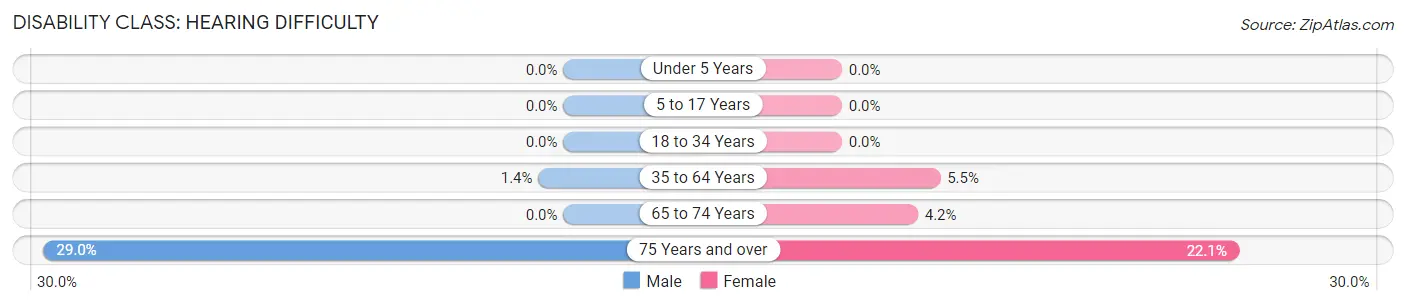
| Age Bracket | Male | Female |
| Under 5 Years | 0 (0.0%) | 0 (0.0%) |
| 5 to 17 Years | 0 (0.0%) | 0 (0.0%) |
| 18 to 34 Years | 0 (0.0%) | 0 (0.0%) |
| 35 to 64 Years | 9 (1.4%) | 34 (5.5%) |
| 65 to 74 Years | 0 (0.0%) | 6 (4.2%) |
| 75 Years and over | 22 (28.9%) | 40 (22.1%) |
Disability Class: Vision Difficulty
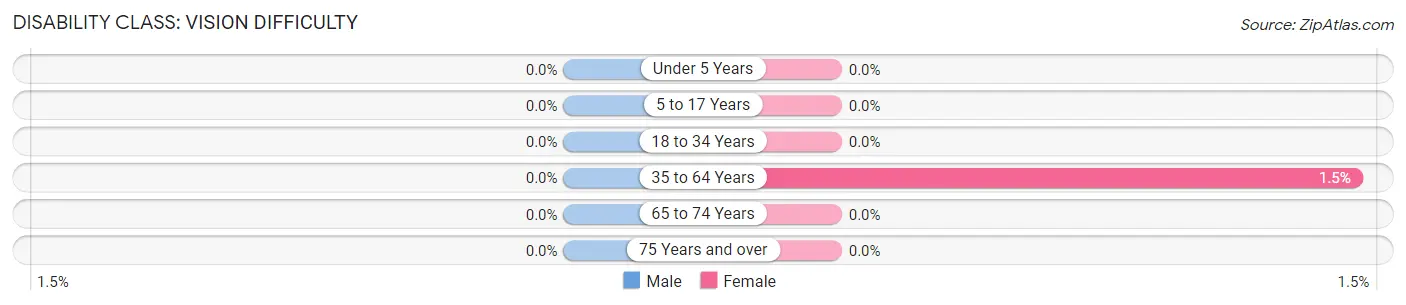
| Age Bracket | Male | Female |
| Under 5 Years | 0 (0.0%) | 0 (0.0%) |
| 5 to 17 Years | 0 (0.0%) | 0 (0.0%) |
| 18 to 34 Years | 0 (0.0%) | 0 (0.0%) |
| 35 to 64 Years | 0 (0.0%) | 9 (1.5%) |
| 65 to 74 Years | 0 (0.0%) | 0 (0.0%) |
| 75 Years and over | 0 (0.0%) | 0 (0.0%) |
Disability Class: Cognitive Difficulty
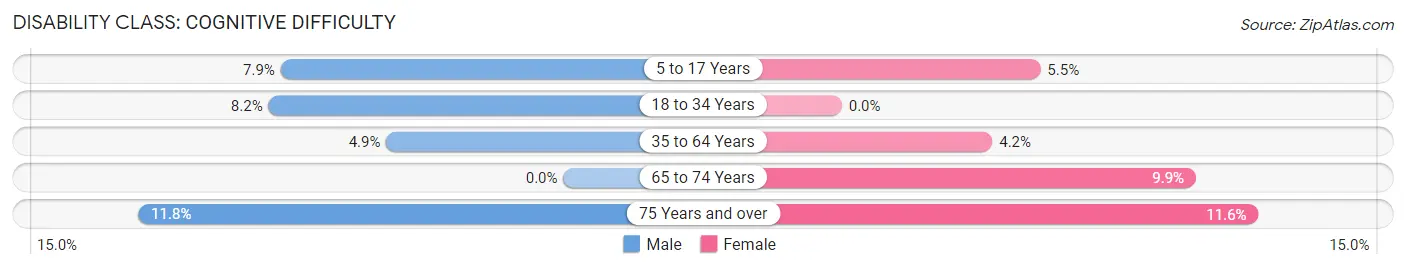
| Age Bracket | Male | Female |
| 5 to 17 Years | 10 (7.9%) | 12 (5.5%) |
| 18 to 34 Years | 11 (8.2%) | 0 (0.0%) |
| 35 to 64 Years | 32 (4.9%) | 26 (4.2%) |
| 65 to 74 Years | 0 (0.0%) | 14 (9.9%) |
| 75 Years and over | 9 (11.8%) | 21 (11.6%) |
Disability Class: Ambulatory Difficulty
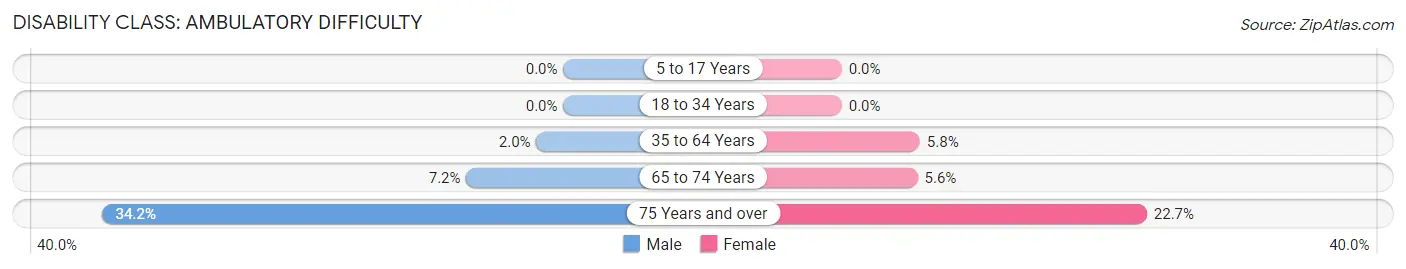
| Age Bracket | Male | Female |
| 5 to 17 Years | 0 (0.0%) | 0 (0.0%) |
| 18 to 34 Years | 0 (0.0%) | 0 (0.0%) |
| 35 to 64 Years | 13 (2.0%) | 36 (5.8%) |
| 65 to 74 Years | 9 (7.2%) | 8 (5.6%) |
| 75 Years and over | 26 (34.2%) | 41 (22.7%) |
Disability Class: Self-Care Difficulty
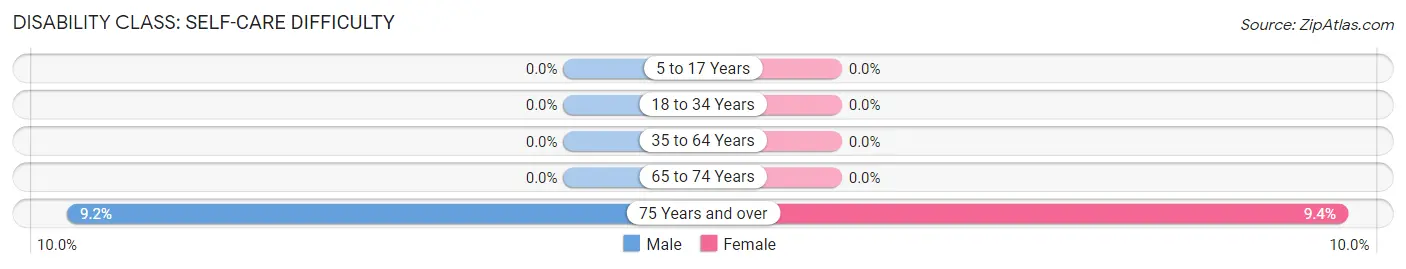
| Age Bracket | Male | Female |
| 5 to 17 Years | 0 (0.0%) | 0 (0.0%) |
| 18 to 34 Years | 0 (0.0%) | 0 (0.0%) |
| 35 to 64 Years | 0 (0.0%) | 0 (0.0%) |
| 65 to 74 Years | 0 (0.0%) | 0 (0.0%) |
| 75 Years and over | 7 (9.2%) | 17 (9.4%) |
Technology Access in Lakeland
Computing Device Access in Lakeland
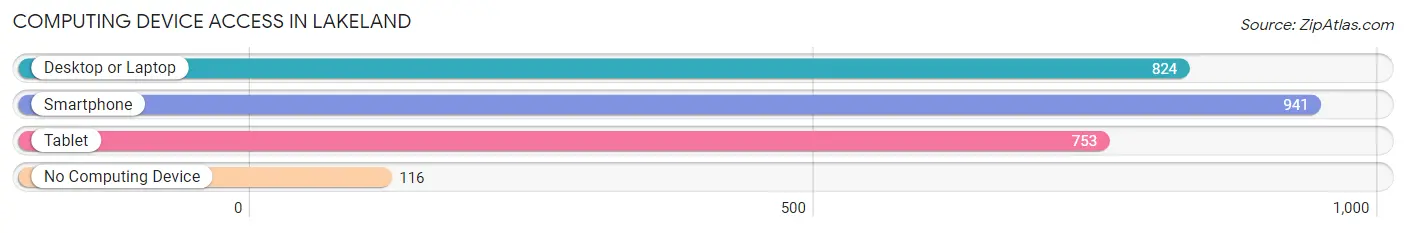
| Device Type | # Households | % Households |
| Desktop or Laptop | 824 | 70.6% |
| Smartphone | 941 | 80.6% |
| Tablet | 753 | 64.5% |
| No Computing Device | 116 | 9.9% |
| Total | 1,168 | 100.0% |
Internet Access in Lakeland
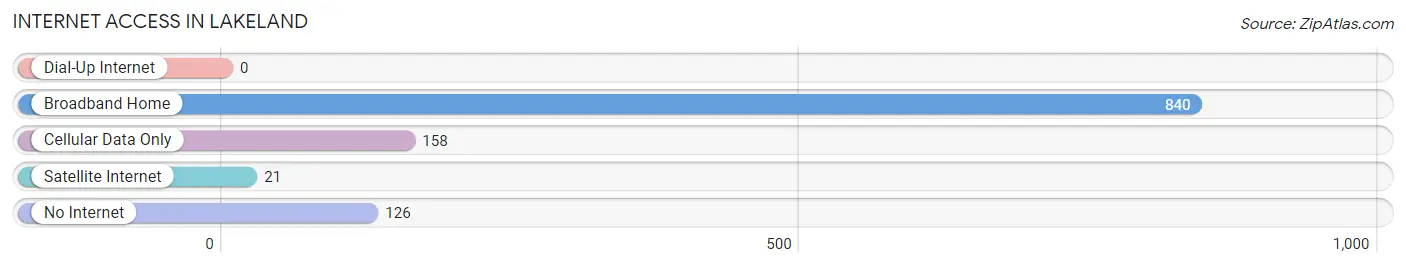
| Internet Type | # Households | % Households |
| Dial-Up Internet | 0 | 0.0% |
| Broadband Home | 840 | 71.9% |
| Cellular Data Only | 158 | 13.5% |
| Satellite Internet | 21 | 1.8% |
| No Internet | 126 | 10.8% |
| Total | 1,168 | 100.0% |
Lakeland Summary
Lakeland is a hamlet located in the town of Yorktown in Westchester County, New York. It is situated in the southeastern corner of the county, approximately 40 miles north of New York City. The hamlet is bordered by the towns of Somers and Cortlandt to the north, and the towns of Putnam Valley and Southeast to the east.
History
The area that is now Lakeland was originally inhabited by the Wappinger Indians. The first European settlers arrived in the area in the late 17th century. The hamlet was originally known as “Lakeland” due to its proximity to the Croton Reservoir, which was created in the early 19th century. The hamlet was officially incorporated in 1845.
Geography
Lakeland is located in the southeastern corner of Westchester County, approximately 40 miles north of New York City. The hamlet is bordered by the towns of Somers and Cortlandt to the north, and the towns of Putnam Valley and Southeast to the east. The hamlet is situated on the Croton Reservoir, which is the largest body of water in the county. The reservoir is fed by the Croton River, which flows through the hamlet.
Economy
The economy of Lakeland is largely based on tourism and recreation. The hamlet is home to several parks and recreational areas, including the Croton Reservoir, which is a popular destination for fishing, boating, and swimming. The hamlet is also home to several golf courses, including the Lakeland Country Club.
The hamlet is also home to several businesses, including restaurants, retail stores, and professional services. The hamlet is also home to several manufacturing companies, including the Lakeland Manufacturing Company, which produces industrial equipment.
Demographics
As of the 2010 census, the population of Lakeland was 8,845. The racial makeup of the hamlet was 87.3% White, 5.2% African American, 0.3% Native American, 2.2% Asian, and 4.0% from other races. The median household income was $90,945, and the median family income was $103,945.
Conclusion
Lakeland is a hamlet located in the town of Yorktown in Westchester County, New York. It is situated in the southeastern corner of the county, approximately 40 miles north of New York City. The hamlet is bordered by the towns of Somers and Cortlandt to the north, and the towns of Putnam Valley and Southeast to the east. The economy of Lakeland is largely based on tourism and recreation, and the hamlet is home to several businesses, including restaurants, retail stores, and professional services. As of the 2010 census, the population of Lakeland was 8,845. The racial makeup of the hamlet was 87.3% White, 5.2% African American, 0.3% Native American, 2.2% Asian, and 4.0% from other races. The median household income was $90,945, and the median family income was $103,945.
Common Questions
What is Per Capita Income in Lakeland?
Per Capita income in Lakeland is $38,945.
What is the Median Family Income in Lakeland?
Median Family Income in Lakeland is $92,976.
What is the Median Household income in Lakeland?
Median Household Income in Lakeland is $76,250.
What is Income or Wage Gap in Lakeland?
Income or Wage Gap in Lakeland is 9.6%.
Women in Lakeland earn 90.4 cents for every dollar earned by a man.
What is Inequality or Gini Index in Lakeland?
Inequality or Gini Index in Lakeland is 0.38.
What is the Total Population of Lakeland?
Total Population of Lakeland is 2,513.
What is the Total Male Population of Lakeland?
Total Male Population of Lakeland is 1,153.
What is the Total Female Population of Lakeland?
Total Female Population of Lakeland is 1,360.
What is the Ratio of Males per 100 Females in Lakeland?
There are 84.78 Males per 100 Females in Lakeland.
What is the Ratio of Females per 100 Males in Lakeland?
There are 117.95 Females per 100 Males in Lakeland.
What is the Median Population Age in Lakeland?
Median Population Age in Lakeland is 50.4 Years.
What is the Average Family Size in Lakeland
Average Family Size in Lakeland is 2.9 People.
What is the Average Household Size in Lakeland
Average Household Size in Lakeland is 2.1 People.
How Large is the Labor Force in Lakeland?
There are 1,428 People in the Labor Forcein in Lakeland.
What is the Percentage of People in the Labor Force in Lakeland?
64.8% of People are in the Labor Force in Lakeland.
What is the Unemployment Rate in Lakeland?
Unemployment Rate in Lakeland is 2.5%.