Lorenz Park, NY Map & Demographics
Lorenz Park Map
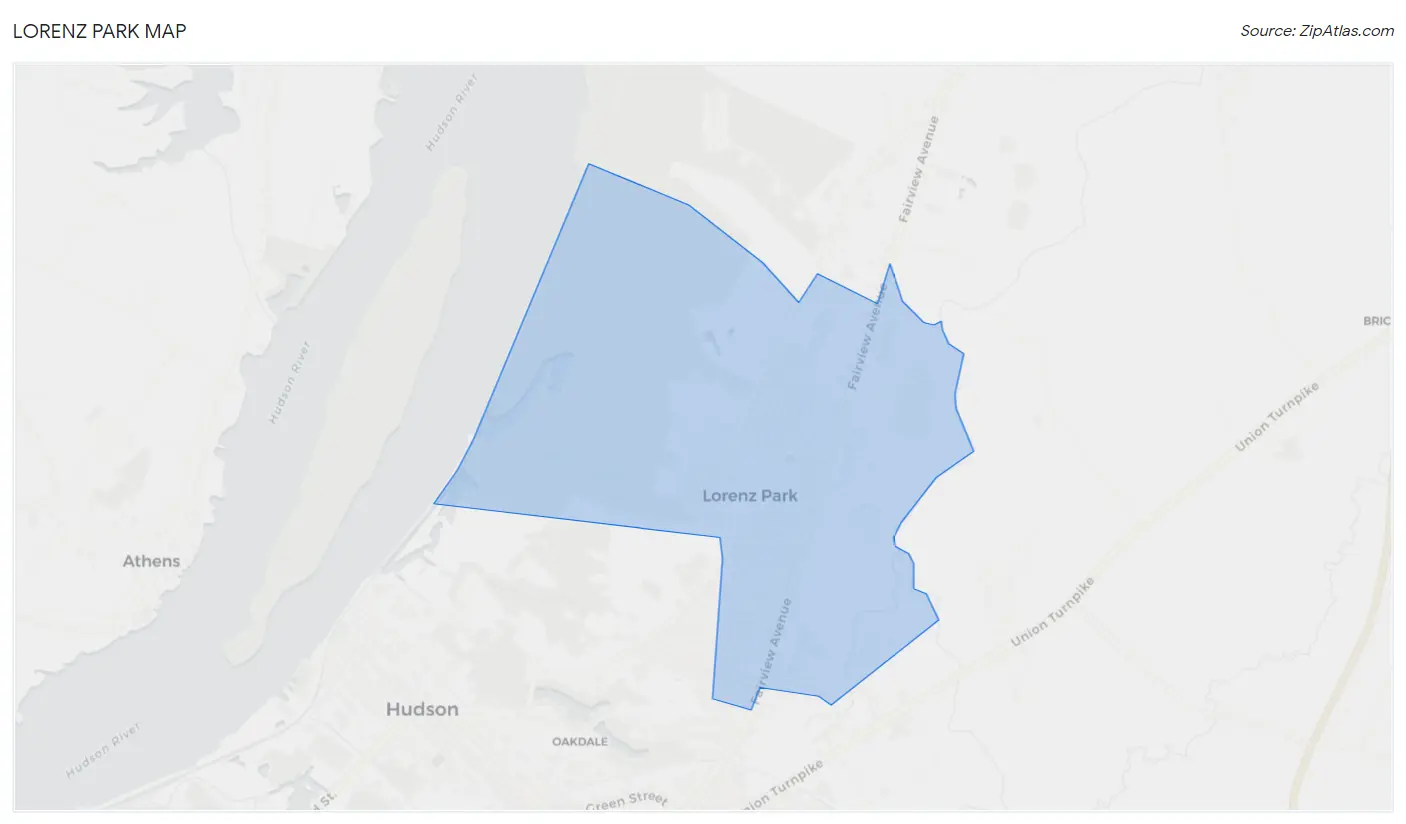
Lorenz Park Overview
$38,631
PER CAPITA INCOME
$81,290
AVG FAMILY INCOME
$67,200
AVG HOUSEHOLD INCOME
0.42
INEQUALITY / GINI INDEX
2,003
TOTAL POPULATION
912
MALE POPULATION
1,091
FEMALE POPULATION
83.59
MALES / 100 FEMALES
119.63
FEMALES / 100 MALES
53.4
MEDIAN AGE
2.6
AVG FAMILY SIZE
2.3
AVG HOUSEHOLD SIZE
1,035
LABOR FORCE [ PEOPLE ]
57.8%
PERCENT IN LABOR FORCE
4.5%
UNEMPLOYMENT RATE
Income in Lorenz Park
Income Overview in Lorenz Park
Per Capita Income in Lorenz Park is $38,631, while median incomes of families and households are $81,290 and $67,200 respectively.
| Characteristic | Number | Measure |
| Per Capita Income | 2,003 | $38,631 |
| Median Family Income | 646 | $81,290 |
| Mean Family Income | 646 | $99,238 |
| Median Household Income | 862 | $67,200 |
| Mean Household Income | 862 | $92,745 |
| Income Deficit | 646 | $0 |
| Wage / Income Gap (%) | 2,003 | 0.00% |
| Wage / Income Gap ($) | 2,003 | 100.00¢ per $1 |
| Gini / Inequality Index | 2,003 | 0.42 |
Earnings by Sex in Lorenz Park
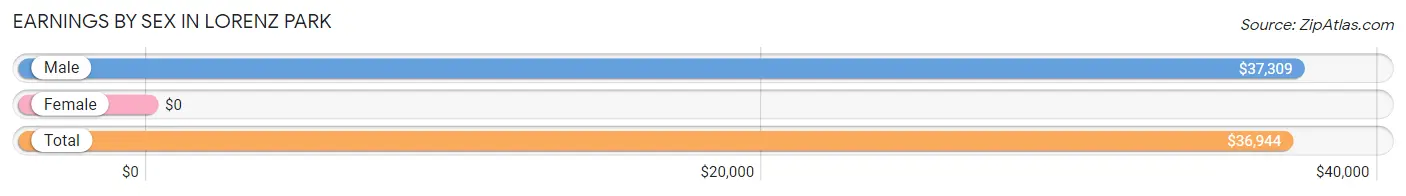
| Sex | Number | Average Earnings |
| Male | 455 (42.6%) | $37,309 |
| Female | 613 (57.4%) | $0 |
| Total | 1,068 (100.0%) | $36,944 |
Earnings by Sex by Income Bracket in Lorenz Park
The most common earnings brackets in Lorenz Park are $35,000 to $39,999 for men (84 | 18.5%) and $75,000 to $99,999 for women (118 | 19.3%).
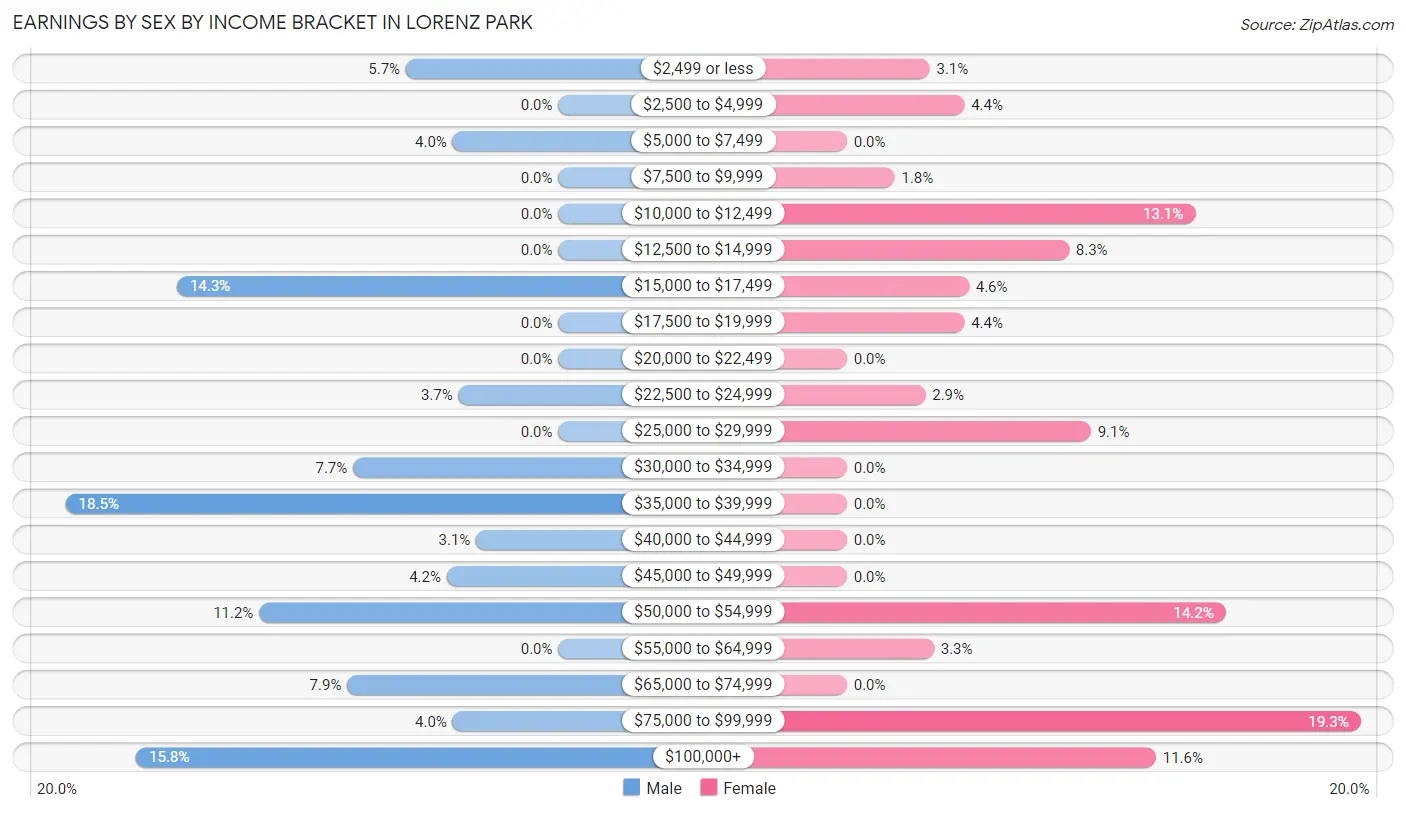
| Income | Male | Female |
| $2,499 or less | 26 (5.7%) | 19 (3.1%) |
| $2,500 to $4,999 | 0 (0.0%) | 27 (4.4%) |
| $5,000 to $7,499 | 18 (4.0%) | 0 (0.0%) |
| $7,500 to $9,999 | 0 (0.0%) | 11 (1.8%) |
| $10,000 to $12,499 | 0 (0.0%) | 80 (13.1%) |
| $12,500 to $14,999 | 0 (0.0%) | 51 (8.3%) |
| $15,000 to $17,499 | 65 (14.3%) | 28 (4.6%) |
| $17,500 to $19,999 | 0 (0.0%) | 27 (4.4%) |
| $20,000 to $22,499 | 0 (0.0%) | 0 (0.0%) |
| $22,500 to $24,999 | 17 (3.7%) | 18 (2.9%) |
| $25,000 to $29,999 | 0 (0.0%) | 56 (9.1%) |
| $30,000 to $34,999 | 35 (7.7%) | 0 (0.0%) |
| $35,000 to $39,999 | 84 (18.5%) | 0 (0.0%) |
| $40,000 to $44,999 | 14 (3.1%) | 0 (0.0%) |
| $45,000 to $49,999 | 19 (4.2%) | 0 (0.0%) |
| $50,000 to $54,999 | 51 (11.2%) | 87 (14.2%) |
| $55,000 to $64,999 | 0 (0.0%) | 20 (3.3%) |
| $65,000 to $74,999 | 36 (7.9%) | 0 (0.0%) |
| $75,000 to $99,999 | 18 (4.0%) | 118 (19.3%) |
| $100,000+ | 72 (15.8%) | 71 (11.6%) |
| Total | 455 (100.0%) | 613 (100.0%) |
Earnings by Sex by Educational Attainment in Lorenz Park
Average earnings in Lorenz Park are $37,309 for men and $53,469 for women, a difference of 30.2%. Men with an educational attainment of high school diploma enjoy the highest average annual earnings of $32,071, while those with high school diploma education earn the least with $32,071. Women with an educational attainment of graduate degree earn the most with the average annual earnings of $78,887, while those with graduate degree education have the smallest earnings of $78,887.
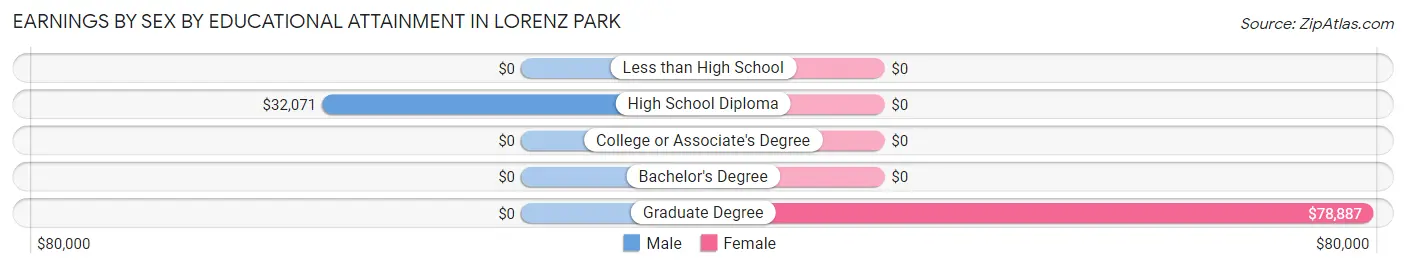
| Educational Attainment | Male Income | Female Income |
| Less than High School | - | - |
| High School Diploma | $32,071 | $0 |
| College or Associate's Degree | - | - |
| Bachelor's Degree | - | - |
| Graduate Degree | - | - |
| Total | $37,309 | $53,469 |
Family Income in Lorenz Park
Family Income Brackets in Lorenz Park
According to the Lorenz Park family income data, there are 146 families falling into the $150,000 to $199,999 income range, which is the most common income bracket and makes up 22.6% of all families. Conversely, the less than $10,000 income bracket is the least frequent group with only 15 families (2.3%) belonging to this category.
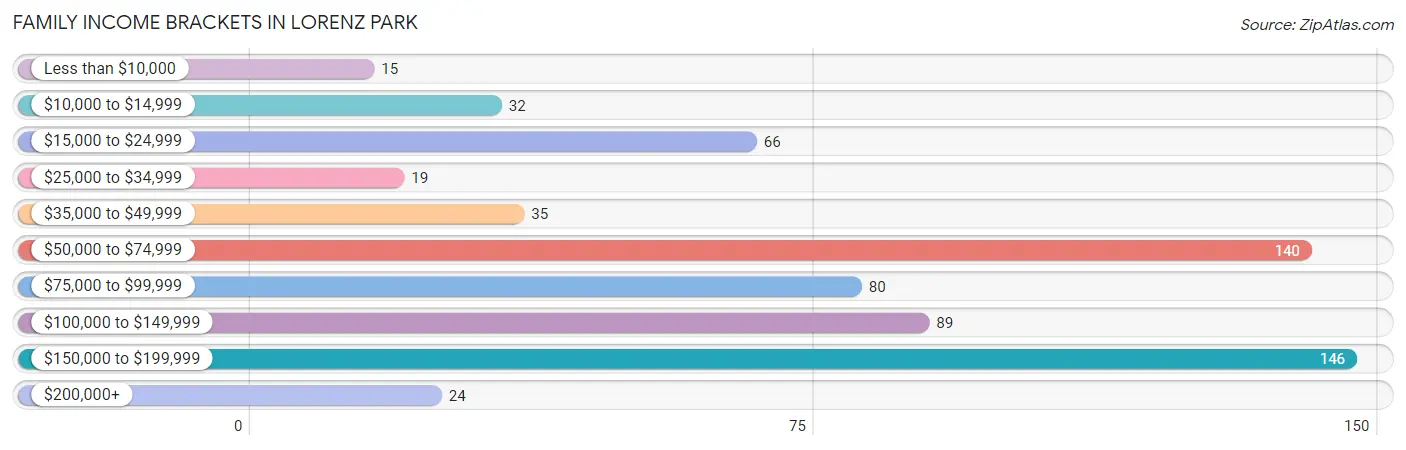
| Income Bracket | # Families | % Families |
| Less than $10,000 | 15 | 2.3% |
| $10,000 to $14,999 | 32 | 5.0% |
| $15,000 to $24,999 | 66 | 10.2% |
| $25,000 to $34,999 | 19 | 2.9% |
| $35,000 to $49,999 | 35 | 5.4% |
| $50,000 to $74,999 | 140 | 21.7% |
| $75,000 to $99,999 | 80 | 12.4% |
| $100,000 to $149,999 | 89 | 13.8% |
| $150,000 to $199,999 | 146 | 22.6% |
| $200,000+ | 24 | 3.7% |
Family Income by Famaliy Size in Lorenz Park
2-person families (369 | 57.1%) account for the highest median family income in Lorenz Park with $81,250 per family, while 2-person families (369 | 57.1%) have the highest median income of $40,625 per family member.
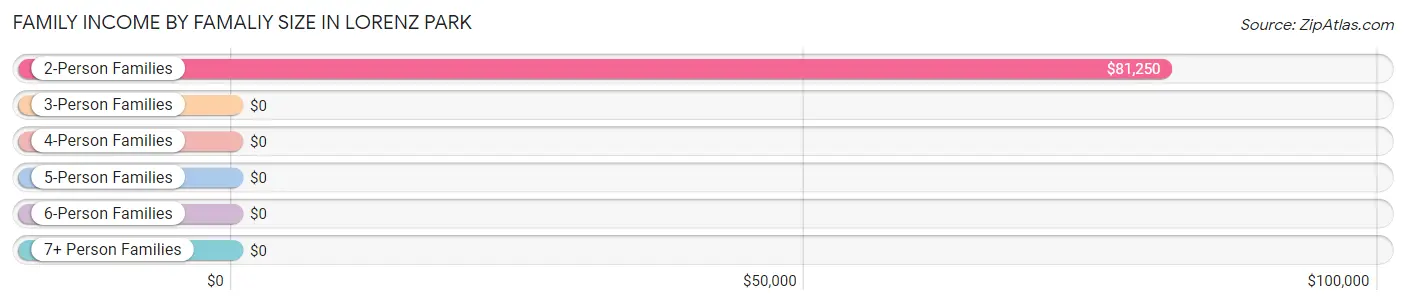
| Income Bracket | # Families | Median Income |
| 2-Person Families | 369 (57.1%) | $81,250 |
| 3-Person Families | 219 (33.9%) | $0 |
| 4-Person Families | 52 (8.1%) | $0 |
| 5-Person Families | 0 (0.0%) | $0 |
| 6-Person Families | 0 (0.0%) | $0 |
| 7+ Person Families | 6 (0.9%) | $0 |
| Total | 646 (100.0%) | $81,290 |
Family Income by Number of Earners in Lorenz Park
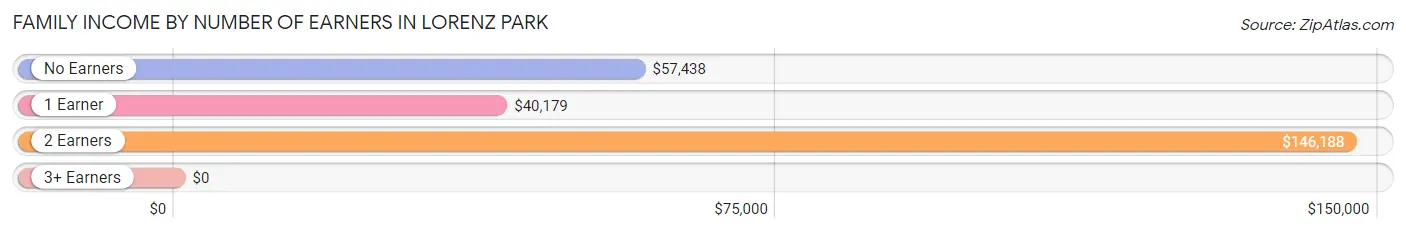
| Number of Earners | # Families | Median Income |
| No Earners | 137 (21.2%) | $57,438 |
| 1 Earner | 150 (23.2%) | $40,179 |
| 2 Earners | 321 (49.7%) | $146,188 |
| 3+ Earners | 38 (5.9%) | $0 |
| Total | 646 (100.0%) | $81,290 |
Household Income in Lorenz Park
Household Income Brackets in Lorenz Park
With 190 households falling in the category, the $100,000 to $149,999 income range is the most frequent in Lorenz Park, accounting for 22.0% of all households. In contrast, only 24 households (2.8%) fall into the $200,000+ income bracket, making it the least populous group.
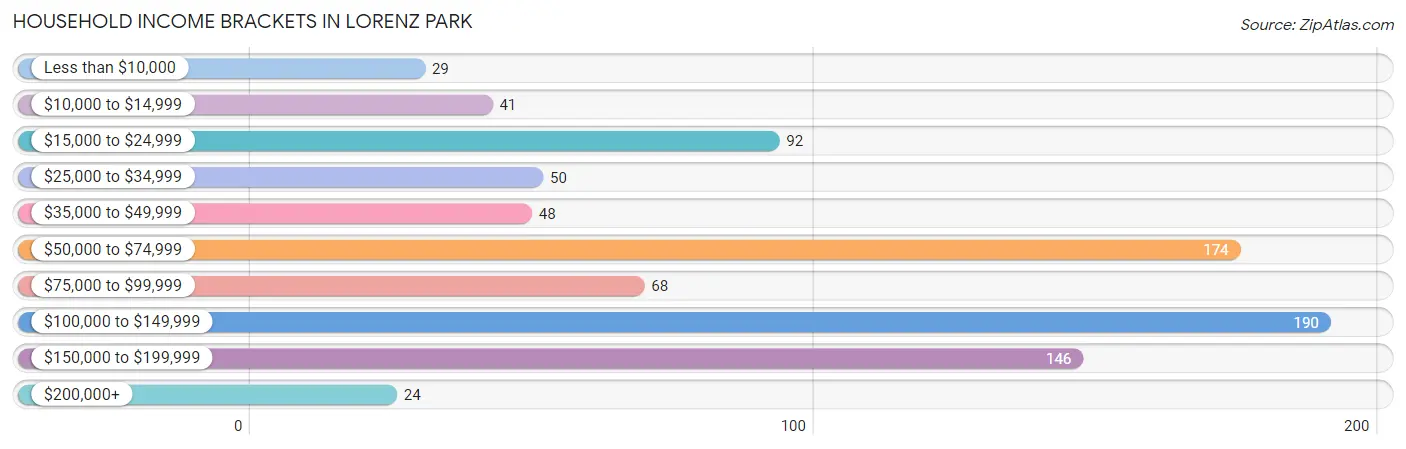
| Income Bracket | # Households | % Households |
| Less than $10,000 | 29 | 3.4% |
| $10,000 to $14,999 | 41 | 4.8% |
| $15,000 to $24,999 | 92 | 10.7% |
| $25,000 to $34,999 | 50 | 5.8% |
| $35,000 to $49,999 | 48 | 5.6% |
| $50,000 to $74,999 | 174 | 20.2% |
| $75,000 to $99,999 | 68 | 7.9% |
| $100,000 to $149,999 | 190 | 22.0% |
| $150,000 to $199,999 | 146 | 16.9% |
| $200,000+ | 24 | 2.8% |
Household Income by Householder Age in Lorenz Park
The median household income in Lorenz Park is $67,200, with the highest median household income of $134,792 found in the 25 to 44 years age bracket for the primary householder. A total of 143 households (16.6%) fall into this category. Meanwhile, the 15 to 24 years age bracket for the primary householder has the lowest median household income of $0, with 27 households (3.1%) in this group.
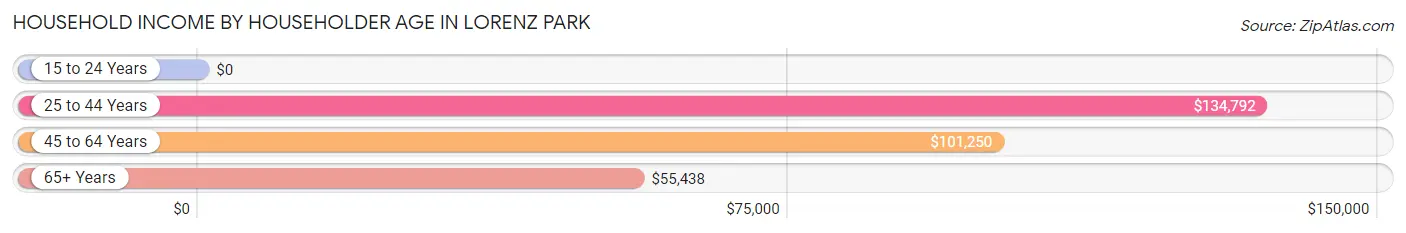
| Income Bracket | # Households | Median Income |
| 15 to 24 Years | 27 (3.1%) | $0 |
| 25 to 44 Years | 143 (16.6%) | $134,792 |
| 45 to 64 Years | 363 (42.1%) | $101,250 |
| 65+ Years | 329 (38.2%) | $55,438 |
| Total | 862 (100.0%) | $67,200 |
Poverty in Lorenz Park
Income Below Poverty by Sex and Age in Lorenz Park
With 16.0% poverty level for males and 19.1% for females among the residents of Lorenz Park, 15 year old males and 6 to 11 year old females are the most vulnerable to poverty, with 15 males (100.0%) and 13 females (100.0%) in their respective age groups living below the poverty level.
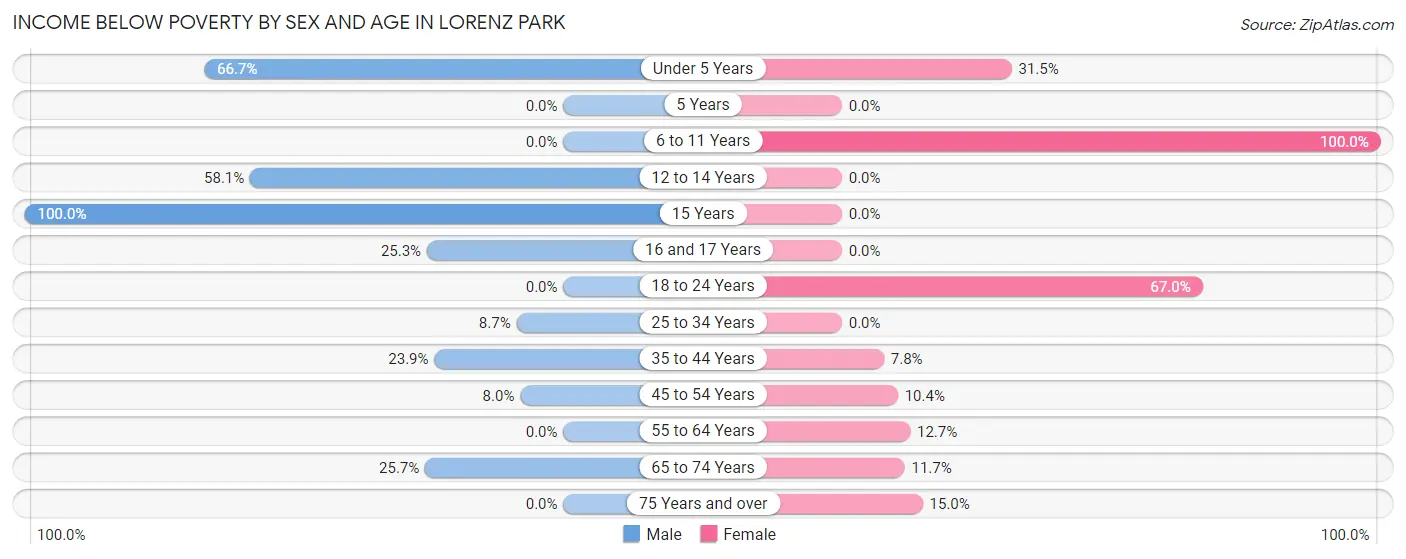
| Age Bracket | Male | Female |
| Under 5 Years | 20 (66.7%) | 23 (31.5%) |
| 5 Years | 0 (0.0%) | 0 (0.0%) |
| 6 to 11 Years | 0 (0.0%) | 13 (100.0%) |
| 12 to 14 Years | 25 (58.1%) | 0 (0.0%) |
| 15 Years | 15 (100.0%) | 0 (0.0%) |
| 16 and 17 Years | 20 (25.3%) | 0 (0.0%) |
| 18 to 24 Years | 0 (0.0%) | 75 (67.0%) |
| 25 to 34 Years | 4 (8.7%) | 0 (0.0%) |
| 35 to 44 Years | 17 (23.9%) | 15 (7.8%) |
| 45 to 54 Years | 16 (8.0%) | 11 (10.4%) |
| 55 to 64 Years | 0 (0.0%) | 28 (12.7%) |
| 65 to 74 Years | 29 (25.7%) | 31 (11.7%) |
| 75 Years and over | 0 (0.0%) | 12 (15.0%) |
| Total | 146 (16.0%) | 208 (19.1%) |
Income Above Poverty by Sex and Age in Lorenz Park
According to the poverty statistics in Lorenz Park, males aged 6 to 11 years and females aged 12 to 14 years are the age groups that are most secure financially, with 100.0% of males and 100.0% of females in these age groups living above the poverty line.
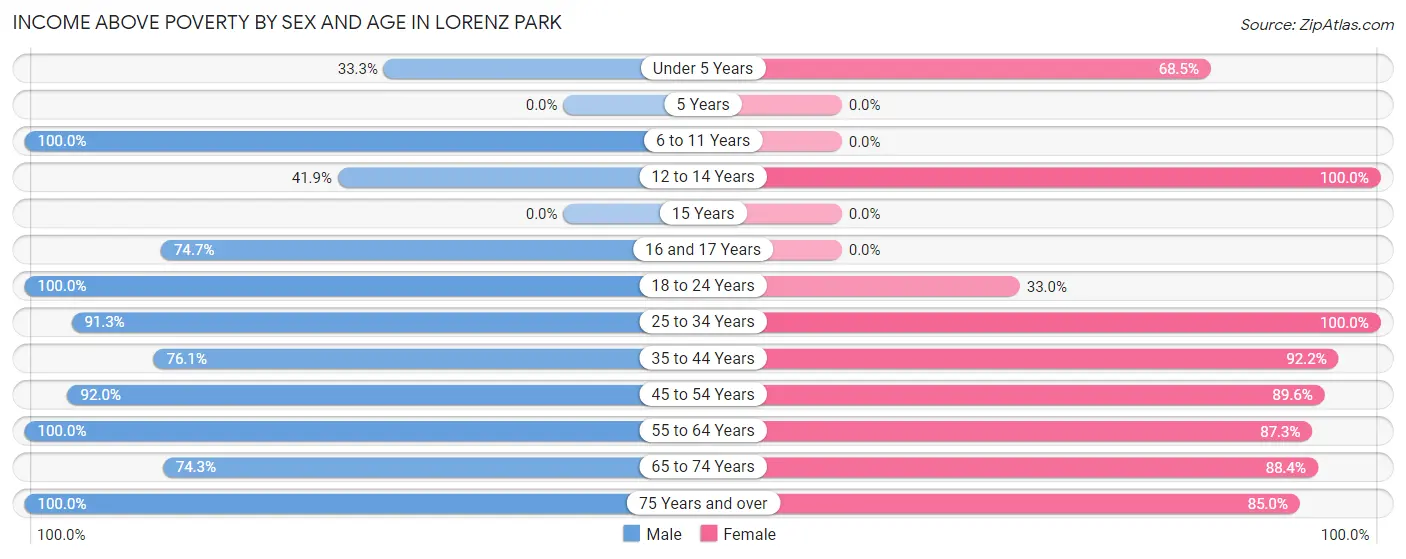
| Age Bracket | Male | Female |
| Under 5 Years | 10 (33.3%) | 50 (68.5%) |
| 5 Years | 0 (0.0%) | 0 (0.0%) |
| 6 to 11 Years | 17 (100.0%) | 0 (0.0%) |
| 12 to 14 Years | 18 (41.9%) | 21 (100.0%) |
| 15 Years | 0 (0.0%) | 0 (0.0%) |
| 16 and 17 Years | 59 (74.7%) | 0 (0.0%) |
| 18 to 24 Years | 57 (100.0%) | 37 (33.0%) |
| 25 to 34 Years | 42 (91.3%) | 7 (100.0%) |
| 35 to 44 Years | 54 (76.1%) | 177 (92.2%) |
| 45 to 54 Years | 184 (92.0%) | 95 (89.6%) |
| 55 to 64 Years | 181 (100.0%) | 193 (87.3%) |
| 65 to 74 Years | 84 (74.3%) | 235 (88.3%) |
| 75 Years and over | 60 (100.0%) | 68 (85.0%) |
| Total | 766 (84.0%) | 883 (80.9%) |
Income Below Poverty Among Married-Couple Families in Lorenz Park
The poverty statistics for married-couple families in Lorenz Park show that 2.0% or 9 of the total 449 families live below the poverty line. Families with no children have the highest poverty rate of 2.7%, comprising of 9 families. On the other hand, families with 1 or 2 children have the lowest poverty rate of 0.0%, which includes 0 families.
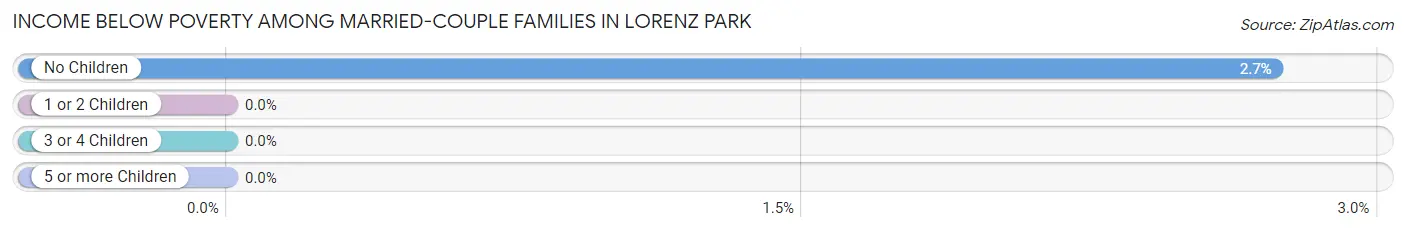
| Children | Above Poverty | Below Poverty |
| No Children | 321 (97.3%) | 9 (2.7%) |
| 1 or 2 Children | 119 (100.0%) | 0 (0.0%) |
| 3 or 4 Children | 0 (0.0%) | 0 (0.0%) |
| 5 or more Children | 0 (0.0%) | 0 (0.0%) |
| Total | 440 (98.0%) | 9 (2.0%) |
Income Below Poverty Among Single-Parent Households in Lorenz Park
According to the poverty data in Lorenz Park, 37.8% or 17 single-father households and 45.4% or 69 single-mother households are living below the poverty line. Among single-father households, those with 1 or 2 children have the highest poverty rate, with 17 households (100.0%) experiencing poverty. Likewise, among single-mother households, those with 1 or 2 children have the highest poverty rate, with 53 households (51.0%) falling below the poverty line.
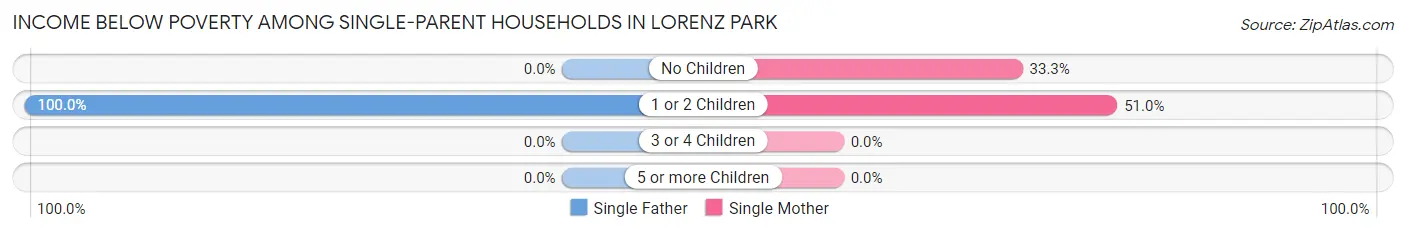
| Children | Single Father | Single Mother |
| No Children | 0 (0.0%) | 16 (33.3%) |
| 1 or 2 Children | 17 (100.0%) | 53 (51.0%) |
| 3 or 4 Children | 0 (0.0%) | 0 (0.0%) |
| 5 or more Children | 0 (0.0%) | 0 (0.0%) |
| Total | 17 (37.8%) | 69 (45.4%) |
Income Below Poverty Among Married-Couple vs Single-Parent Households in Lorenz Park
The poverty data for Lorenz Park shows that 9 of the married-couple family households (2.0%) and 86 of the single-parent households (43.6%) are living below the poverty level. Within the married-couple family households, those with no children have the highest poverty rate, with 9 households (2.7%) falling below the poverty line. Among the single-parent households, those with 1 or 2 children have the highest poverty rate, with 70 household (57.9%) living below poverty.
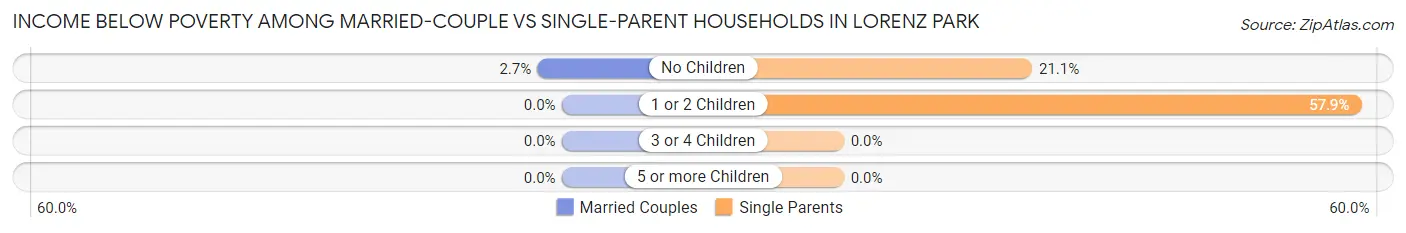
| Children | Married-Couple Families | Single-Parent Households |
| No Children | 9 (2.7%) | 16 (21.0%) |
| 1 or 2 Children | 0 (0.0%) | 70 (57.9%) |
| 3 or 4 Children | 0 (0.0%) | 0 (0.0%) |
| 5 or more Children | 0 (0.0%) | 0 (0.0%) |
| Total | 9 (2.0%) | 86 (43.6%) |
Race in Lorenz Park
The most populous races in Lorenz Park are White / Caucasian (1,467 | 73.2%), Asian (206 | 10.3%), and Black / African American (172 | 8.6%).
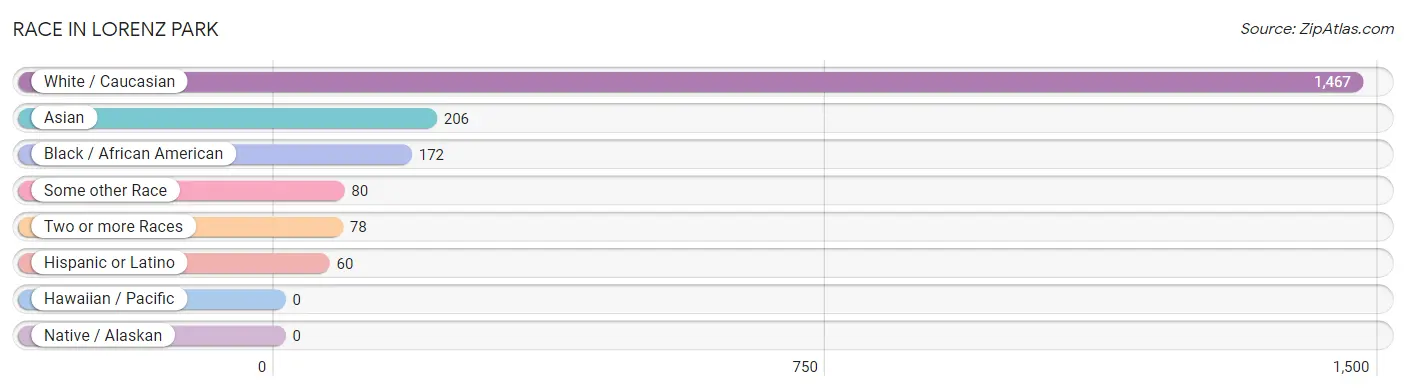
| Race | # Population | % Population |
| Asian | 206 | 10.3% |
| Black / African American | 172 | 8.6% |
| Hawaiian / Pacific | 0 | 0.0% |
| Hispanic or Latino | 60 | 3.0% |
| Native / Alaskan | 0 | 0.0% |
| White / Caucasian | 1,467 | 73.2% |
| Two or more Races | 78 | 3.9% |
| Some other Race | 80 | 4.0% |
| Total | 2,003 | 100.0% |
Ancestry in Lorenz Park
The most populous ancestries reported in Lorenz Park are Italian (405 | 20.2%), German (260 | 13.0%), Irish (255 | 12.7%), American (140 | 7.0%), and Polish (136 | 6.8%), together accounting for 59.7% of all Lorenz Park residents.
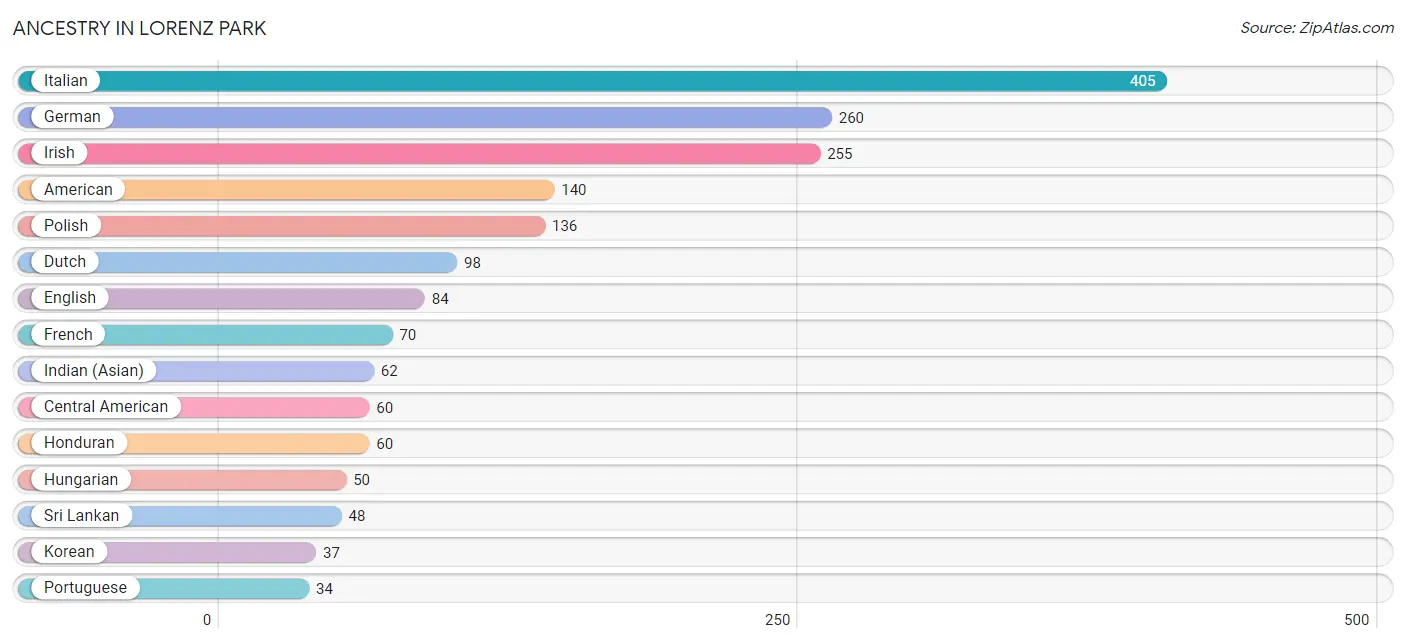
| Ancestry | # Population | % Population |
| American | 140 | 7.0% |
| Central American | 60 | 3.0% |
| Dutch | 98 | 4.9% |
| Eastern European | 17 | 0.9% |
| English | 84 | 4.2% |
| French | 70 | 3.5% |
| German | 260 | 13.0% |
| Honduran | 60 | 3.0% |
| Hungarian | 50 | 2.5% |
| Indian (Asian) | 62 | 3.1% |
| Irish | 255 | 12.7% |
| Italian | 405 | 20.2% |
| Jamaican | 18 | 0.9% |
| Korean | 37 | 1.8% |
| Polish | 136 | 6.8% |
| Portuguese | 34 | 1.7% |
| Scottish | 28 | 1.4% |
| Sri Lankan | 48 | 2.4% |
| Ukrainian | 19 | 0.9% |
| Welsh | 8 | 0.4% | View All 20 Rows |
Immigrants in Lorenz Park
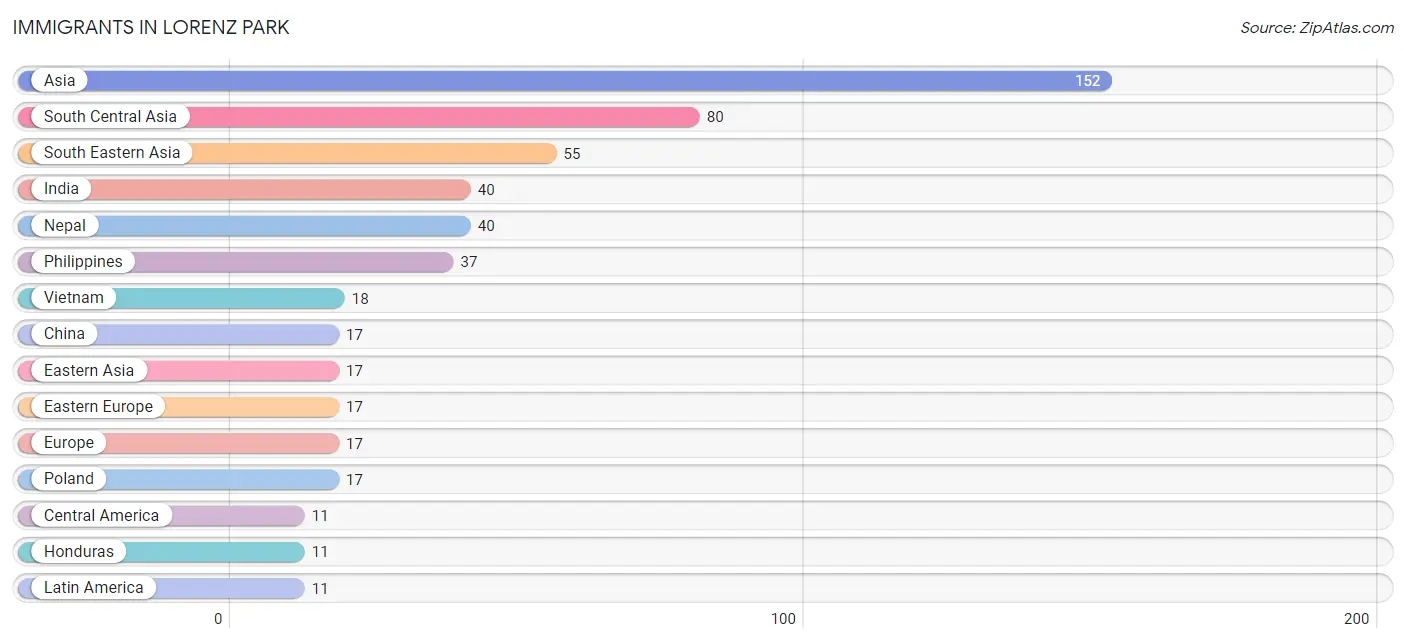
The most numerous immigrant groups reported in Lorenz Park came from Asia (152 | 7.6%), South Central Asia (80 | 4.0%), South Eastern Asia (55 | 2.8%), India (40 | 2.0%), and Nepal (40 | 2.0%), together accounting for 18.3% of all Lorenz Park residents.
| Immigration Origin | # Population | % Population |
| Asia | 152 | 7.6% |
| Canada | 4 | 0.2% |
| Central America | 11 | 0.5% |
| China | 17 | 0.9% |
| Eastern Asia | 17 | 0.9% |
| Eastern Europe | 17 | 0.9% |
| Europe | 17 | 0.9% |
| Honduras | 11 | 0.5% |
| India | 40 | 2.0% |
| Latin America | 11 | 0.5% |
| Nepal | 40 | 2.0% |
| Philippines | 37 | 1.8% |
| Poland | 17 | 0.9% |
| South Central Asia | 80 | 4.0% |
| South Eastern Asia | 55 | 2.8% |
| Vietnam | 18 | 0.9% | View All 16 Rows |
Sex and Age in Lorenz Park
Sex and Age in Lorenz Park
The most populous age groups in Lorenz Park are 60 to 64 Years (132 | 14.5%) for men and 70 to 74 Years (180 | 16.5%) for women.
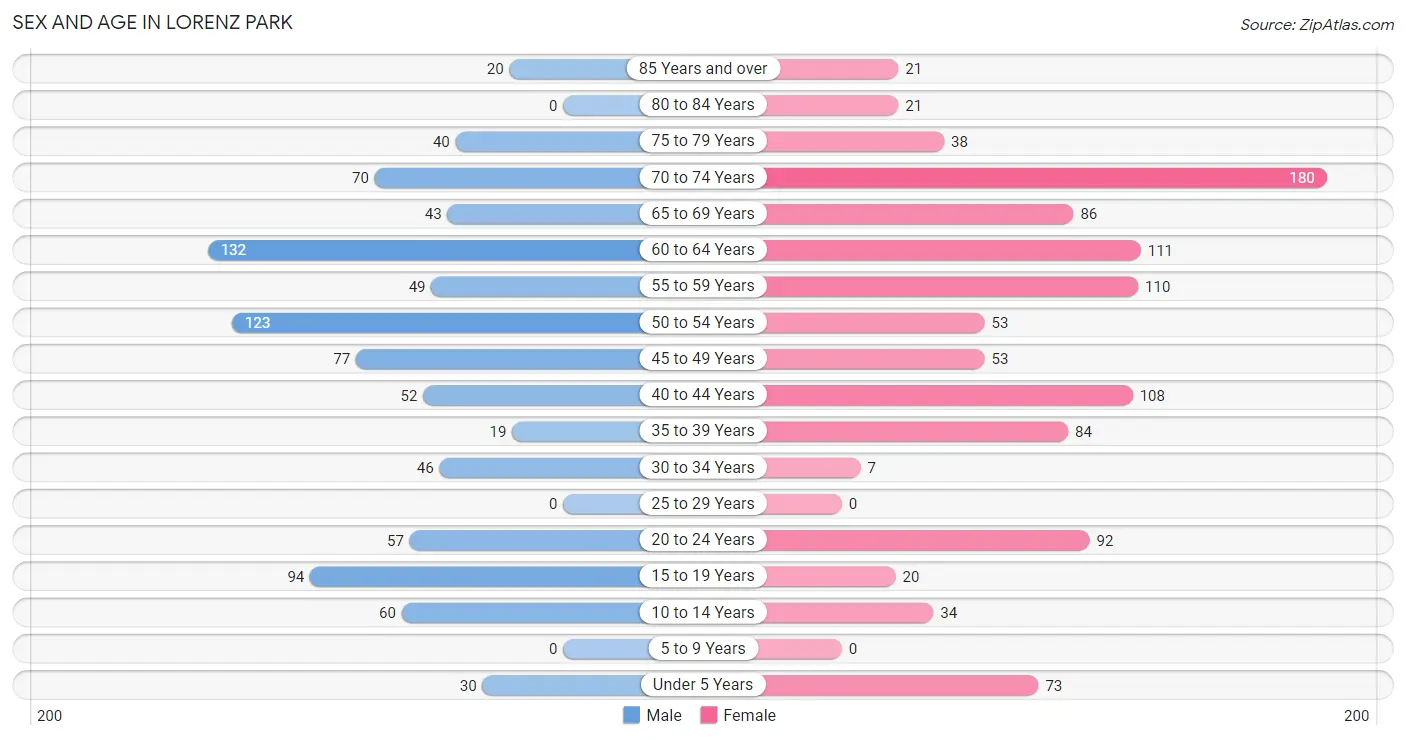
| Age Bracket | Male | Female |
| Under 5 Years | 30 (3.3%) | 73 (6.7%) |
| 5 to 9 Years | 0 (0.0%) | 0 (0.0%) |
| 10 to 14 Years | 60 (6.6%) | 34 (3.1%) |
| 15 to 19 Years | 94 (10.3%) | 20 (1.8%) |
| 20 to 24 Years | 57 (6.2%) | 92 (8.4%) |
| 25 to 29 Years | 0 (0.0%) | 0 (0.0%) |
| 30 to 34 Years | 46 (5.0%) | 7 (0.6%) |
| 35 to 39 Years | 19 (2.1%) | 84 (7.7%) |
| 40 to 44 Years | 52 (5.7%) | 108 (9.9%) |
| 45 to 49 Years | 77 (8.4%) | 53 (4.9%) |
| 50 to 54 Years | 123 (13.5%) | 53 (4.9%) |
| 55 to 59 Years | 49 (5.4%) | 110 (10.1%) |
| 60 to 64 Years | 132 (14.5%) | 111 (10.2%) |
| 65 to 69 Years | 43 (4.7%) | 86 (7.9%) |
| 70 to 74 Years | 70 (7.7%) | 180 (16.5%) |
| 75 to 79 Years | 40 (4.4%) | 38 (3.5%) |
| 80 to 84 Years | 0 (0.0%) | 21 (1.9%) |
| 85 Years and over | 20 (2.2%) | 21 (1.9%) |
| Total | 912 (100.0%) | 1,091 (100.0%) |
Families and Households in Lorenz Park
Median Family Size in Lorenz Park
The median family size in Lorenz Park is 2.56 persons per family, with single female/mother families (152 | 23.5%) accounting for the largest median family size of 3 persons per family. On the other hand, married-couple families (449 | 69.5%) represent the smallest median family size with 2.38 persons per family.
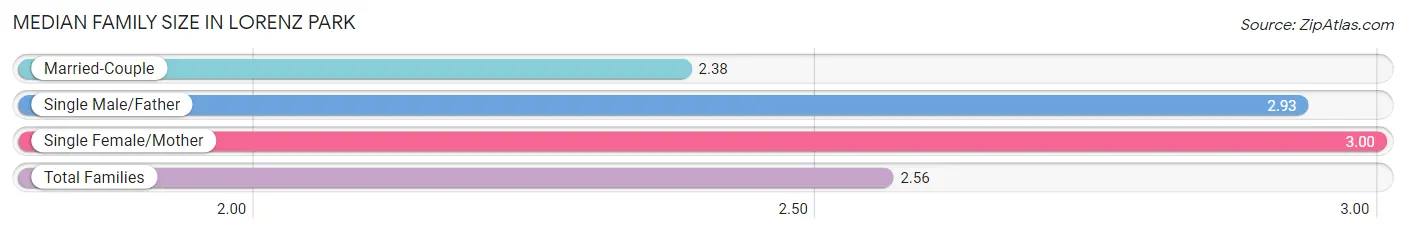
| Family Type | # Families | Family Size |
| Married-Couple | 449 (69.5%) | 2.38 |
| Single Male/Father | 45 (7.0%) | 2.93 |
| Single Female/Mother | 152 (23.5%) | 3.00 |
| Total Families | 646 (100.0%) | 2.56 |
Median Household Size in Lorenz Park
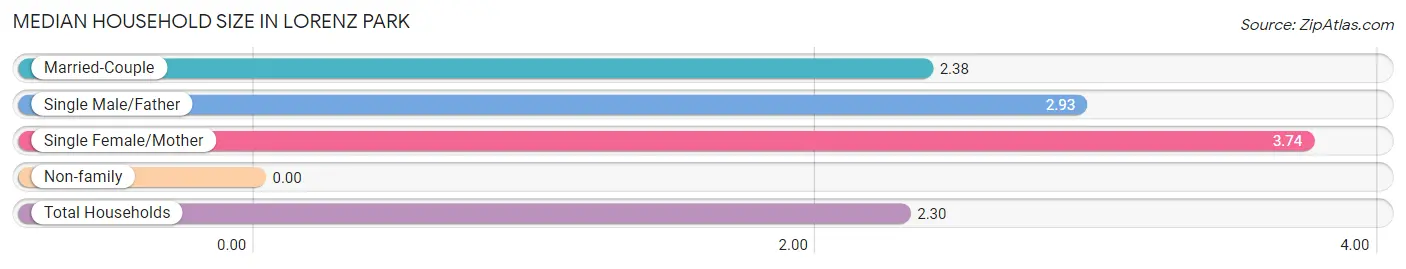
| Household Type | # Households | Household Size |
| Married-Couple | 449 (52.1%) | 2.38 |
| Single Male/Father | 45 (5.2%) | 2.93 |
| Single Female/Mother | 152 (17.6%) | 3.74 |
| Non-family | 216 (25.1%) | - |
| Total Households | 862 (100.0%) | 2.30 |
Household Size by Marriage Status in Lorenz Park
Out of a total of 862 households in Lorenz Park, 646 (74.9%) are family households, while 216 (25.1%) are nonfamily households. The most numerous type of family households are 2-person households, comprising 307, and the most common type of nonfamily households are 1-person households, comprising 216.
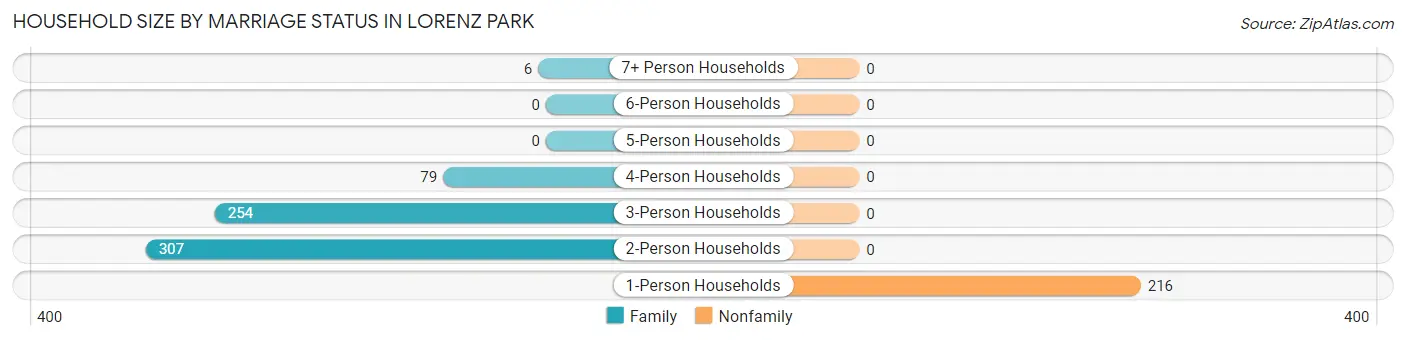
| Household Size | Family Households | Nonfamily Households |
| 1-Person Households | - | 216 (25.1%) |
| 2-Person Households | 307 (35.6%) | 0 (0.0%) |
| 3-Person Households | 254 (29.5%) | 0 (0.0%) |
| 4-Person Households | 79 (9.2%) | 0 (0.0%) |
| 5-Person Households | 0 (0.0%) | 0 (0.0%) |
| 6-Person Households | 0 (0.0%) | 0 (0.0%) |
| 7+ Person Households | 6 (0.7%) | 0 (0.0%) |
| Total | 646 (74.9%) | 216 (25.1%) |
Female Fertility in Lorenz Park
Fertility by Age in Lorenz Park
| Age Bracket | Women with Births | Births / 1,000 Women |
| 15 to 19 years | 0 (0.0%) | 0.0 |
| 20 to 34 years | 0 (0.0%) | 0.0 |
| 35 to 50 years | 0 (0.0%) | 0.0 |
| Total | 0 (0.0%) | 0.0 |
Fertility by Age by Marriage Status in Lorenz Park
| Age Bracket | Married | Unmarried |
| 15 to 19 years | 0 (0.0%) | 0 (0.0%) |
| 20 to 34 years | 0 (0.0%) | 0 (0.0%) |
| 35 to 50 years | 0 (0.0%) | 0 (0.0%) |
| Total | 0 (0.0%) | 0 (0.0%) |
Fertility by Education in Lorenz Park
| Educational Attainment | Women with Births | Births / 1,000 Women |
| Less than High School | 0 (0.0%) | 0.0 |
| High School Diploma | 0 (0.0%) | 0.0 |
| College or Associate's Degree | 0 (0.0%) | 0.0 |
| Bachelor's Degree | 0 (0.0%) | 0.0 |
| Graduate Degree | 0 (0.0%) | 0.0 |
| Total | 0 (0.0%) | 0.0 |
Fertility by Education by Marriage Status in Lorenz Park
| Educational Attainment | Married | Unmarried |
| Less than High School | 0 (0.0%) | 0 (0.0%) |
| High School Diploma | 0 (0.0%) | 0 (0.0%) |
| College or Associate's Degree | 0 (0.0%) | 0 (0.0%) |
| Bachelor's Degree | 0 (0.0%) | 0 (0.0%) |
| Graduate Degree | 0 (0.0%) | 0 (0.0%) |
| Total | 0 (0.0%) | 0 (0.0%) |
Employment Characteristics in Lorenz Park
Employment by Class of Employer in Lorenz Park
Among the 970 employed individuals in Lorenz Park, private company employees (468 | 48.2%), not-for-profit organizations (164 | 16.9%), and state government employees (113 | 11.7%) make up the most common classes of employment.
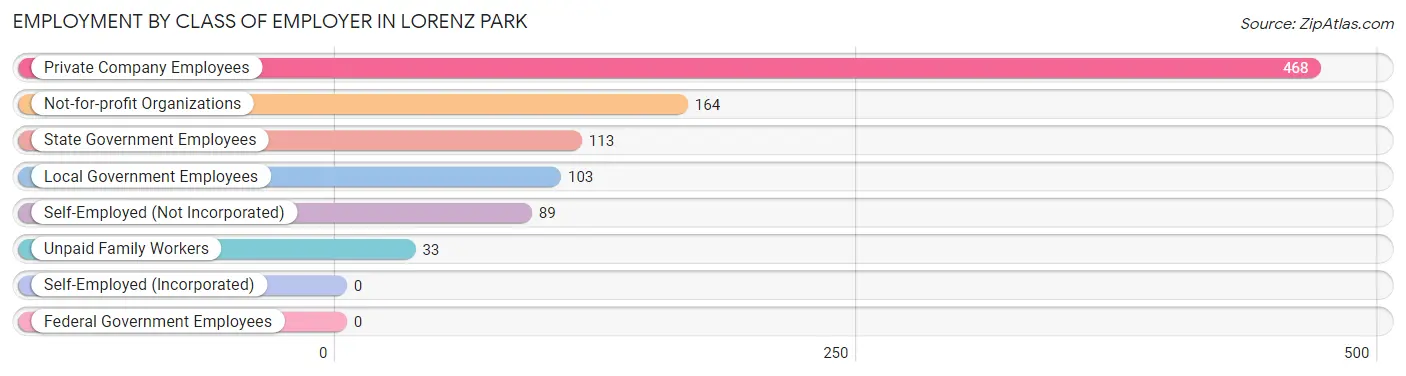
| Employer Class | # Employees | % Employees |
| Private Company Employees | 468 | 48.2% |
| Self-Employed (Incorporated) | 0 | 0.0% |
| Self-Employed (Not Incorporated) | 89 | 9.2% |
| Not-for-profit Organizations | 164 | 16.9% |
| Local Government Employees | 103 | 10.6% |
| State Government Employees | 113 | 11.7% |
| Federal Government Employees | 0 | 0.0% |
| Unpaid Family Workers | 33 | 3.4% |
| Total | 970 | 100.0% |
Employment Status by Age in Lorenz Park
According to the labor force statistics for Lorenz Park, out of the total population over 16 years of age (1,791), 57.8% or 1,035 individuals are in the labor force, with 4.5% or 47 of them unemployed. The age group with the highest labor force participation rate is 45 to 54 years, with 94.8% or 290 individuals in the labor force. Within the labor force, the 55 to 59 years age range has the highest percentage of unemployed individuals, with 18.2% or 22 of them being unemployed.
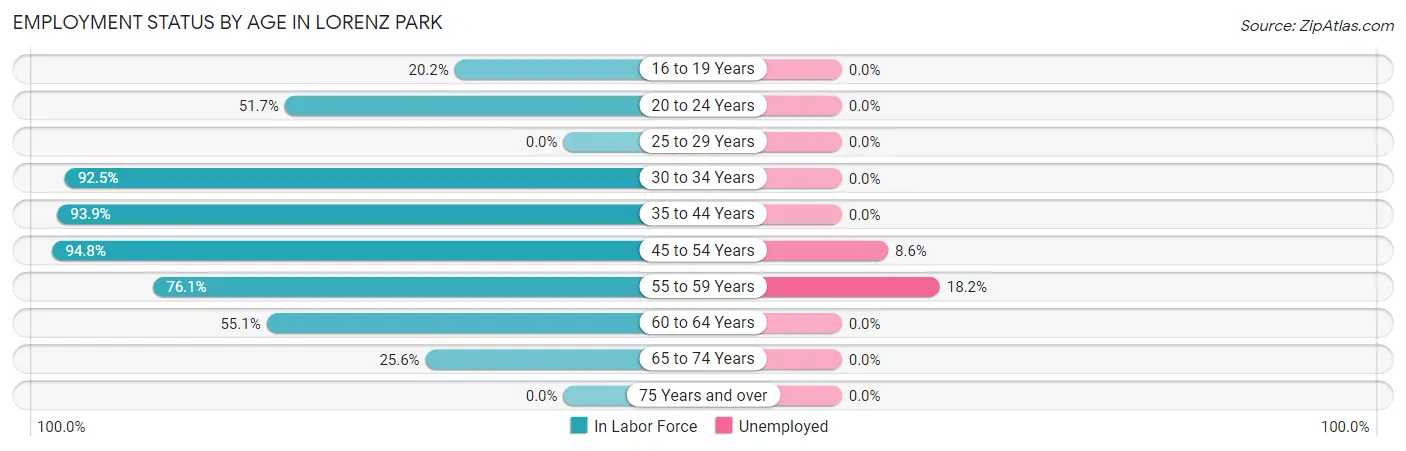
| Age Bracket | In Labor Force | Unemployed |
| 16 to 19 Years | 20 (20.2%) | 0 (0.0%) |
| 20 to 24 Years | 77 (51.7%) | 0 (0.0%) |
| 25 to 29 Years | 0 (0.0%) | 0 (0.0%) |
| 30 to 34 Years | 49 (92.5%) | 0 (0.0%) |
| 35 to 44 Years | 247 (93.9%) | 0 (0.0%) |
| 45 to 54 Years | 290 (94.8%) | 25 (8.6%) |
| 55 to 59 Years | 121 (76.1%) | 22 (18.2%) |
| 60 to 64 Years | 134 (55.1%) | 0 (0.0%) |
| 65 to 74 Years | 97 (25.6%) | 0 (0.0%) |
| 75 Years and over | 0 (0.0%) | 0 (0.0%) |
| Total | 1,035 (57.8%) | 47 (4.5%) |
Employment Status by Educational Attainment in Lorenz Park
According to labor force statistics for Lorenz Park, 82.1% of individuals (841) out of the total population between 25 and 64 years of age (1,024) are in the labor force, with 5.6% or 47 of them being unemployed. The group with the highest labor force participation rate are those with the educational attainment of college / associate degree, with 96.5% or 193 individuals in the labor force. Within the labor force, individuals with high school diploma education have the highest percentage of unemployment, with 14.8% or 42 of them being unemployed.
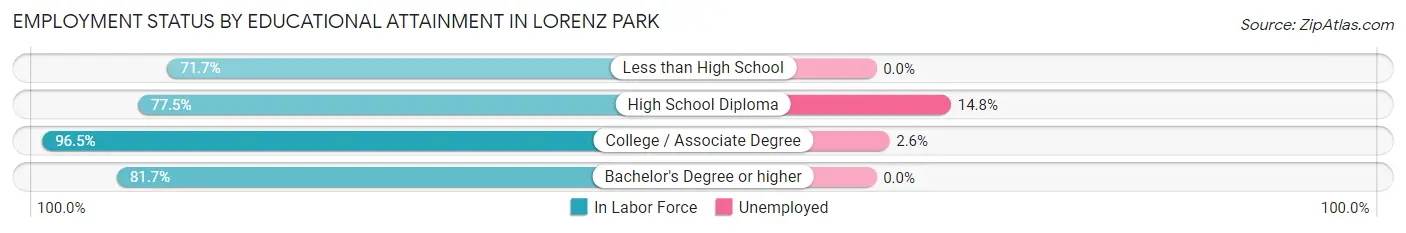
| Educational Attainment | In Labor Force | Unemployed |
| Less than High School | 71 (71.7%) | 0 (0.0%) |
| High School Diploma | 283 (77.5%) | 54 (14.8%) |
| College / Associate Degree | 193 (96.5%) | 5 (2.6%) |
| Bachelor's Degree or higher | 294 (81.7%) | 0 (0.0%) |
| Total | 841 (82.1%) | 57 (5.6%) |
Employment Occupations by Sex in Lorenz Park
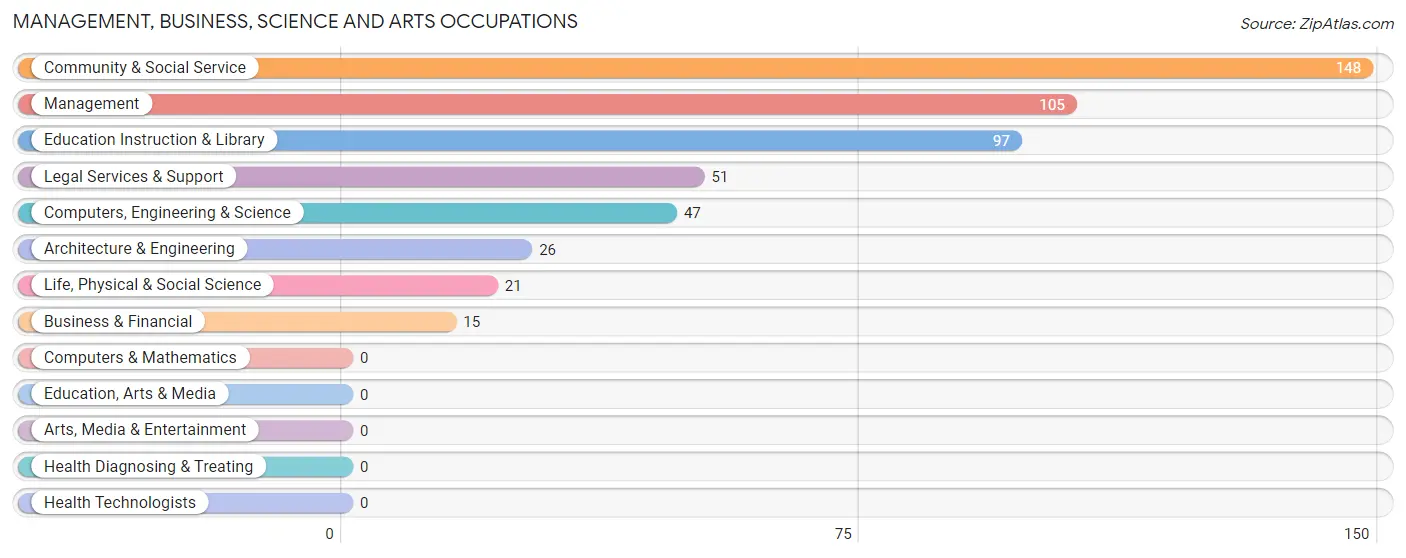
Management, Business, Science and Arts Occupations
The most common Management, Business, Science and Arts occupations in Lorenz Park are Community & Social Service (148 | 15.0%), Management (105 | 10.6%), Education Instruction & Library (97 | 9.8%), Legal Services & Support (51 | 5.2%), and Computers, Engineering & Science (47 | 4.8%).
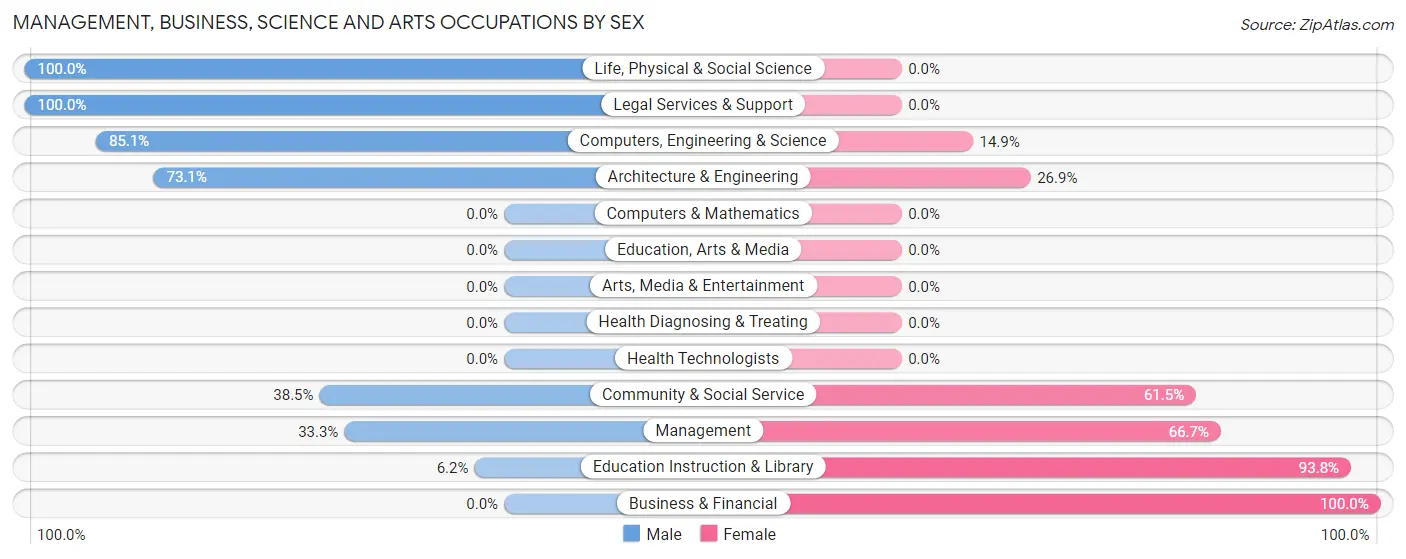
Management, Business, Science and Arts Occupations by Sex
Within the Management, Business, Science and Arts occupations in Lorenz Park, the most male-oriented occupations are Life, Physical & Social Science (100.0%), Legal Services & Support (100.0%), and Computers, Engineering & Science (85.1%), while the most female-oriented occupations are Business & Financial (100.0%), Education Instruction & Library (93.8%), and Management (66.7%).
| Occupation | Male | Female |
| Management | 35 (33.3%) | 70 (66.7%) |
| Business & Financial | 0 (0.0%) | 15 (100.0%) |
| Computers, Engineering & Science | 40 (85.1%) | 7 (14.9%) |
| Computers & Mathematics | 0 (0.0%) | 0 (0.0%) |
| Architecture & Engineering | 19 (73.1%) | 7 (26.9%) |
| Life, Physical & Social Science | 21 (100.0%) | 0 (0.0%) |
| Community & Social Service | 57 (38.5%) | 91 (61.5%) |
| Education, Arts & Media | 0 (0.0%) | 0 (0.0%) |
| Legal Services & Support | 51 (100.0%) | 0 (0.0%) |
| Education Instruction & Library | 6 (6.2%) | 91 (93.8%) |
| Arts, Media & Entertainment | 0 (0.0%) | 0 (0.0%) |
| Health Diagnosing & Treating | 0 (0.0%) | 0 (0.0%) |
| Health Technologists | 0 (0.0%) | 0 (0.0%) |
| Total (Category) | 132 (41.9%) | 183 (58.1%) |
| Total (Overall) | 392 (39.7%) | 596 (60.3%) |
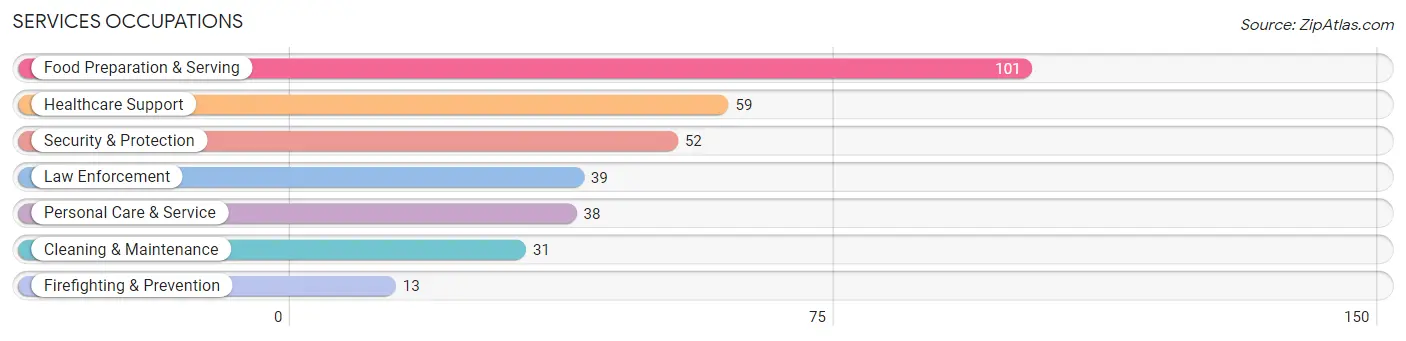
Services Occupations
The most common Services occupations in Lorenz Park are Food Preparation & Serving (101 | 10.2%), Healthcare Support (59 | 6.0%), Security & Protection (52 | 5.3%), Law Enforcement (39 | 4.0%), and Personal Care & Service (38 | 3.8%).
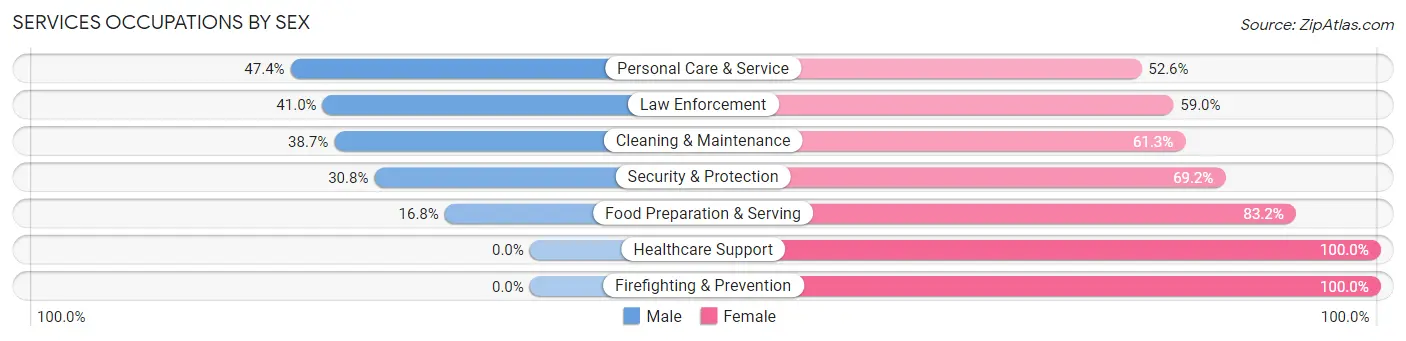
Services Occupations by Sex
Within the Services occupations in Lorenz Park, the most male-oriented occupations are Personal Care & Service (47.4%), Law Enforcement (41.0%), and Cleaning & Maintenance (38.7%), while the most female-oriented occupations are Healthcare Support (100.0%), Firefighting & Prevention (100.0%), and Food Preparation & Serving (83.2%).
| Occupation | Male | Female |
| Healthcare Support | 0 (0.0%) | 59 (100.0%) |
| Security & Protection | 16 (30.8%) | 36 (69.2%) |
| Firefighting & Prevention | 0 (0.0%) | 13 (100.0%) |
| Law Enforcement | 16 (41.0%) | 23 (59.0%) |
| Food Preparation & Serving | 17 (16.8%) | 84 (83.2%) |
| Cleaning & Maintenance | 12 (38.7%) | 19 (61.3%) |
| Personal Care & Service | 18 (47.4%) | 20 (52.6%) |
| Total (Category) | 63 (22.4%) | 218 (77.6%) |
| Total (Overall) | 392 (39.7%) | 596 (60.3%) |
Sales and Office Occupations
The most common Sales and Office occupations in Lorenz Park are Sales & Related (101 | 10.2%), and Office & Administration (79 | 8.0%).
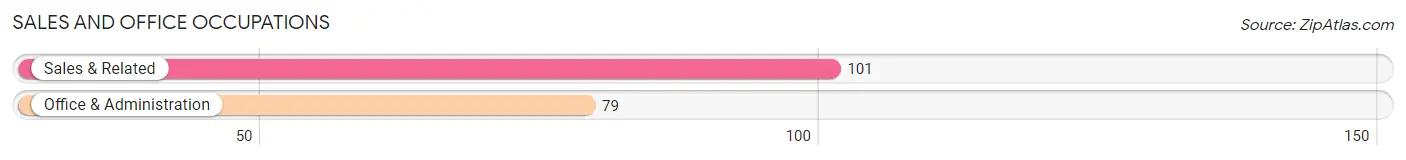
Sales and Office Occupations by Sex
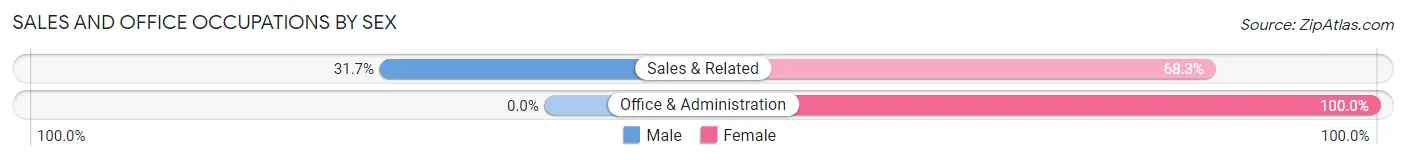
| Occupation | Male | Female |
| Sales & Related | 32 (31.7%) | 69 (68.3%) |
| Office & Administration | 0 (0.0%) | 79 (100.0%) |
| Total (Category) | 32 (17.8%) | 148 (82.2%) |
| Total (Overall) | 392 (39.7%) | 596 (60.3%) |
Natural Resources, Construction and Maintenance Occupations
The most common Natural Resources, Construction and Maintenance occupations in Lorenz Park are , and Installation, Maintenance & Repair (48 | 4.9%).
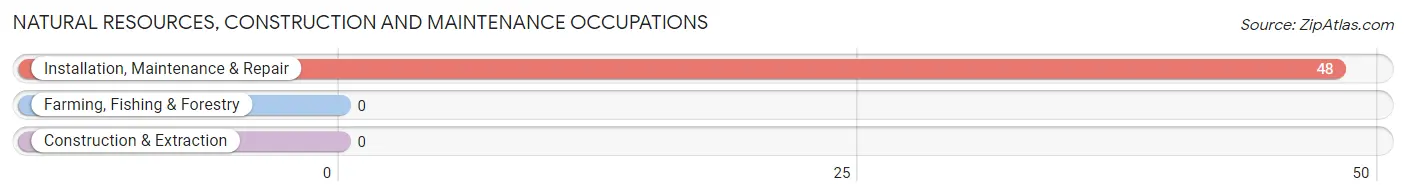
Natural Resources, Construction and Maintenance Occupations by Sex
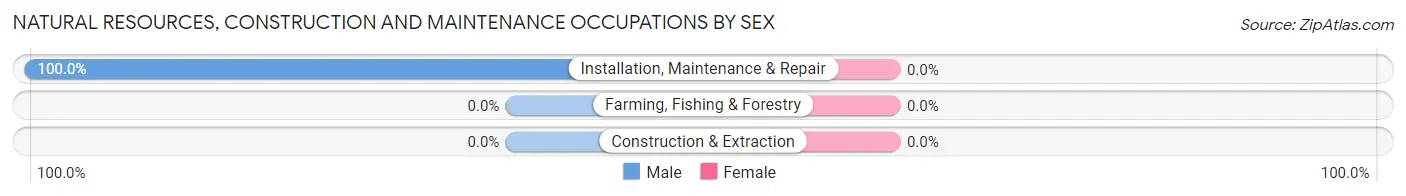
| Occupation | Male | Female |
| Farming, Fishing & Forestry | 0 (0.0%) | 0 (0.0%) |
| Construction & Extraction | 0 (0.0%) | 0 (0.0%) |
| Installation, Maintenance & Repair | 48 (100.0%) | 0 (0.0%) |
| Total (Category) | 48 (100.0%) | 0 (0.0%) |
| Total (Overall) | 392 (39.7%) | 596 (60.3%) |
Production, Transportation and Moving Occupations
The most common Production, Transportation and Moving occupations in Lorenz Park are Transportation (82 | 8.3%), and Material Moving (82 | 8.3%).
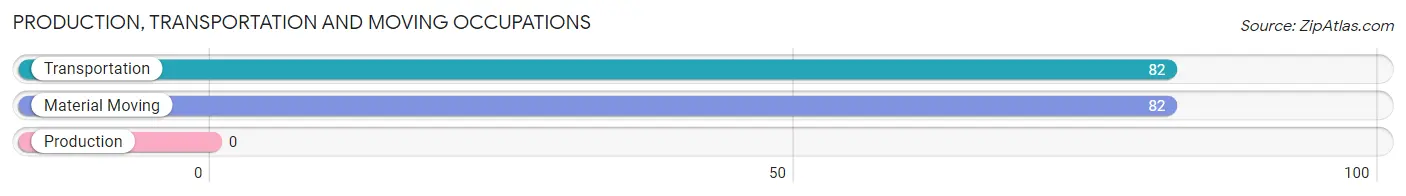
Production, Transportation and Moving Occupations by Sex
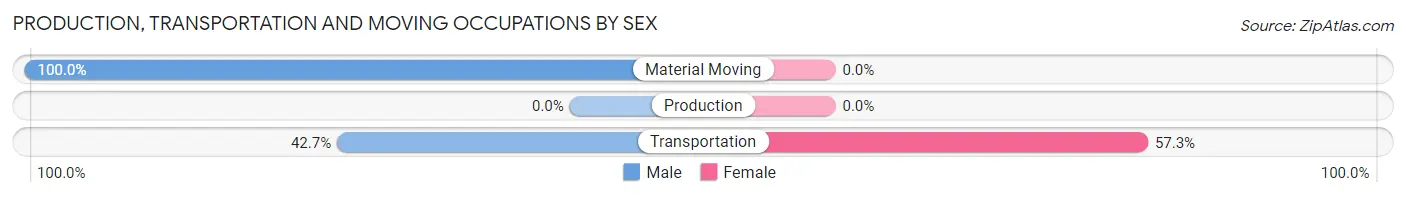
| Occupation | Male | Female |
| Production | 0 (0.0%) | 0 (0.0%) |
| Transportation | 35 (42.7%) | 47 (57.3%) |
| Material Moving | 82 (100.0%) | 0 (0.0%) |
| Total (Category) | 117 (71.3%) | 47 (28.7%) |
| Total (Overall) | 392 (39.7%) | 596 (60.3%) |
Employment Industries by Sex in Lorenz Park
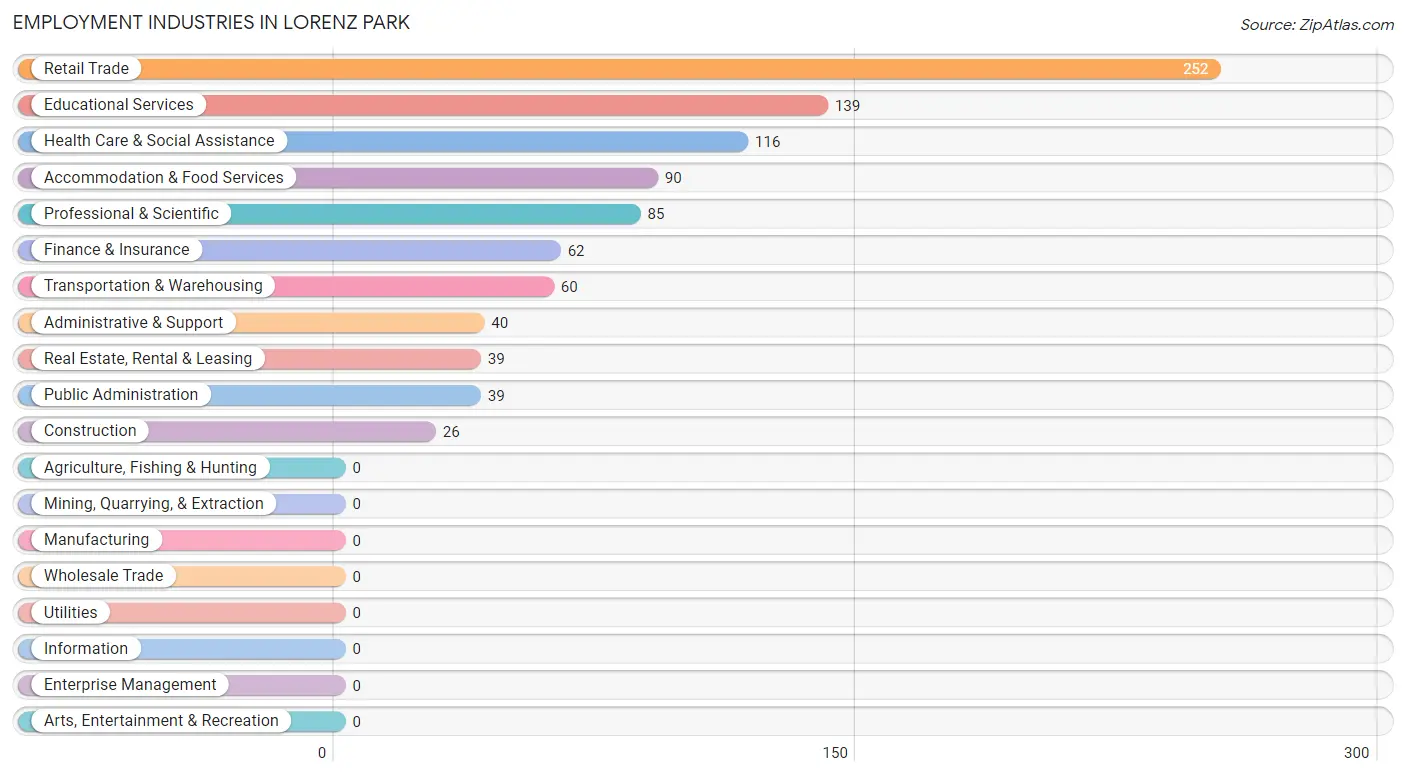
Employment Industries in Lorenz Park
The major employment industries in Lorenz Park include Retail Trade (252 | 25.5%), Educational Services (139 | 14.1%), Health Care & Social Assistance (116 | 11.7%), Accommodation & Food Services (90 | 9.1%), and Professional & Scientific (85 | 8.6%).
Employment Industries by Sex in Lorenz Park
The Lorenz Park industries that see more men than women are Professional & Scientific (82.4%), Real Estate, Rental & Leasing (76.9%), and Construction (73.1%), whereas the industries that tend to have a higher number of women are Transportation & Warehousing (100.0%), Finance & Insurance (100.0%), and Educational Services (87.1%).
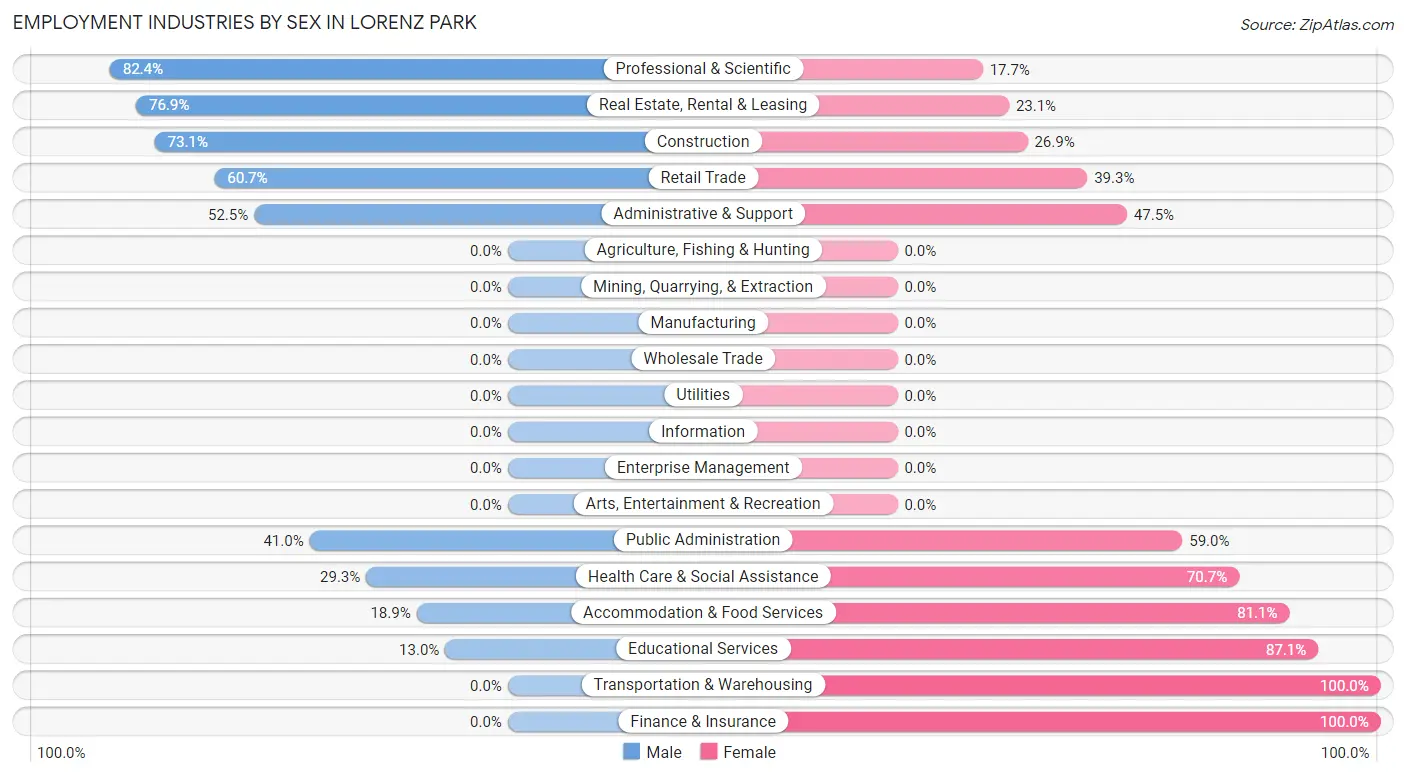
| Industry | Male | Female |
| Agriculture, Fishing & Hunting | 0 (0.0%) | 0 (0.0%) |
| Mining, Quarrying, & Extraction | 0 (0.0%) | 0 (0.0%) |
| Construction | 19 (73.1%) | 7 (26.9%) |
| Manufacturing | 0 (0.0%) | 0 (0.0%) |
| Wholesale Trade | 0 (0.0%) | 0 (0.0%) |
| Retail Trade | 153 (60.7%) | 99 (39.3%) |
| Transportation & Warehousing | 0 (0.0%) | 60 (100.0%) |
| Utilities | 0 (0.0%) | 0 (0.0%) |
| Information | 0 (0.0%) | 0 (0.0%) |
| Finance & Insurance | 0 (0.0%) | 62 (100.0%) |
| Real Estate, Rental & Leasing | 30 (76.9%) | 9 (23.1%) |
| Professional & Scientific | 70 (82.4%) | 15 (17.6%) |
| Enterprise Management | 0 (0.0%) | 0 (0.0%) |
| Administrative & Support | 21 (52.5%) | 19 (47.5%) |
| Educational Services | 18 (13.0%) | 121 (87.1%) |
| Health Care & Social Assistance | 34 (29.3%) | 82 (70.7%) |
| Arts, Entertainment & Recreation | 0 (0.0%) | 0 (0.0%) |
| Accommodation & Food Services | 17 (18.9%) | 73 (81.1%) |
| Public Administration | 16 (41.0%) | 23 (59.0%) |
| Total | 392 (39.7%) | 596 (60.3%) |
Education in Lorenz Park
School Enrollment in Lorenz Park
The most common levels of schooling among the 288 students in Lorenz Park are high school (112 | 38.9%), college / undergraduate (88 | 30.6%), and middle school (76 | 26.4%).
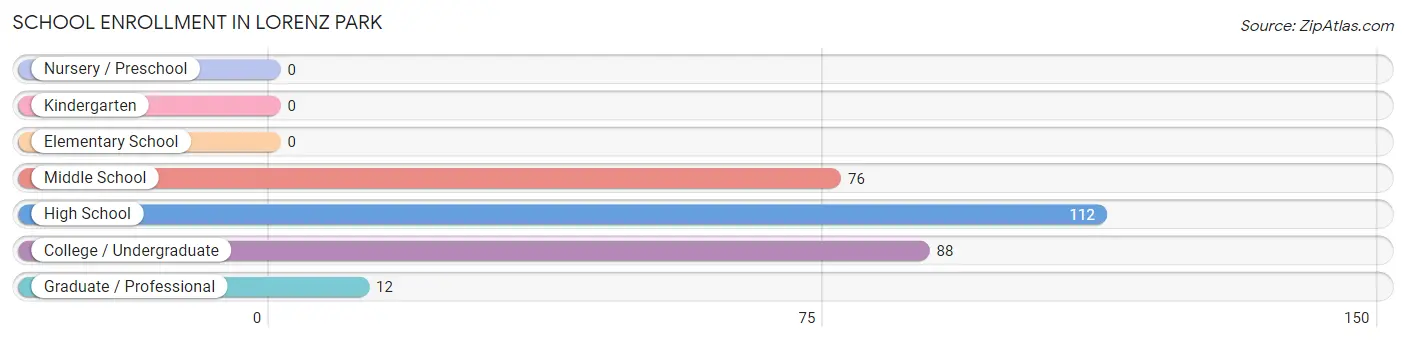
| School Level | # Students | % Students |
| Nursery / Preschool | 0 | 0.0% |
| Kindergarten | 0 | 0.0% |
| Elementary School | 0 | 0.0% |
| Middle School | 76 | 26.4% |
| High School | 112 | 38.9% |
| College / Undergraduate | 88 | 30.6% |
| Graduate / Professional | 12 | 4.2% |
| Total | 288 | 100.0% |
School Enrollment by Age by Funding Source in Lorenz Park
Out of a total of 288 students who are enrolled in schools in Lorenz Park, 114 (39.6%) attend a private institution, while the remaining 174 (60.4%) are enrolled in public schools. The age group of 20 to 24 year olds has the highest likelihood of being enrolled in private schools, with 57 (100.0% in the age bracket) enrolled. Conversely, the age group of 10 to 14 year olds has the lowest likelihood of being enrolled in a private school, with 94 (100.0% in the age bracket) attending a public institution.
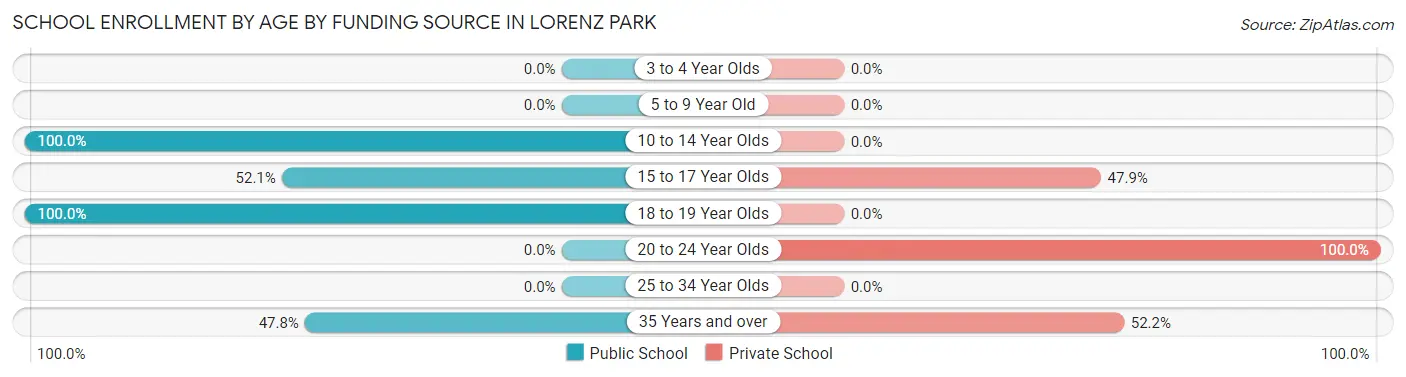
| Age Bracket | Public School | Private School |
| 3 to 4 Year Olds | 0 (0.0%) | 0 (0.0%) |
| 5 to 9 Year Old | 0 (0.0%) | 0 (0.0%) |
| 10 to 14 Year Olds | 94 (100.0%) | 0 (0.0%) |
| 15 to 17 Year Olds | 49 (52.1%) | 45 (47.9%) |
| 18 to 19 Year Olds | 20 (100.0%) | 0 (0.0%) |
| 20 to 24 Year Olds | 0 (0.0%) | 57 (100.0%) |
| 25 to 34 Year Olds | 0 (0.0%) | 0 (0.0%) |
| 35 Years and over | 11 (47.8%) | 12 (52.2%) |
| Total | 174 (60.4%) | 114 (39.6%) |
Educational Attainment by Field of Study in Lorenz Park
Psychology (71 | 17.2%), visual & performing arts (63 | 15.3%), liberal arts & history (51 | 12.4%), business (46 | 11.2%), and engineering (38 | 9.2%) are the most common fields of study among 412 individuals in Lorenz Park who have obtained a bachelor's degree or higher.
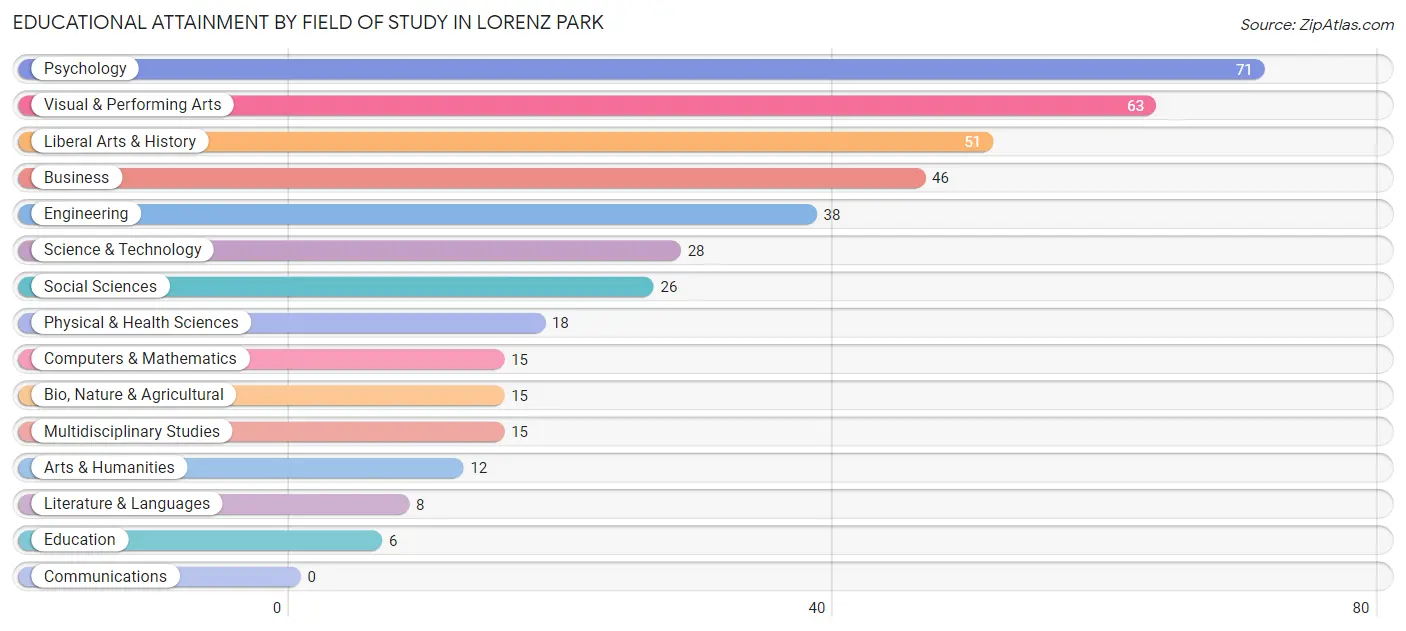
| Field of Study | # Graduates | % Graduates |
| Computers & Mathematics | 15 | 3.6% |
| Bio, Nature & Agricultural | 15 | 3.6% |
| Physical & Health Sciences | 18 | 4.4% |
| Psychology | 71 | 17.2% |
| Social Sciences | 26 | 6.3% |
| Engineering | 38 | 9.2% |
| Multidisciplinary Studies | 15 | 3.6% |
| Science & Technology | 28 | 6.8% |
| Business | 46 | 11.2% |
| Education | 6 | 1.5% |
| Literature & Languages | 8 | 1.9% |
| Liberal Arts & History | 51 | 12.4% |
| Visual & Performing Arts | 63 | 15.3% |
| Communications | 0 | 0.0% |
| Arts & Humanities | 12 | 2.9% |
| Total | 412 | 100.0% |
Transportation & Commute in Lorenz Park
Vehicle Availability by Sex in Lorenz Park
The most prevalent vehicle ownership categories in Lorenz Park are males with 2 vehicles (258, accounting for 65.8%) and females with 2 vehicles (273, making up 44.6%).
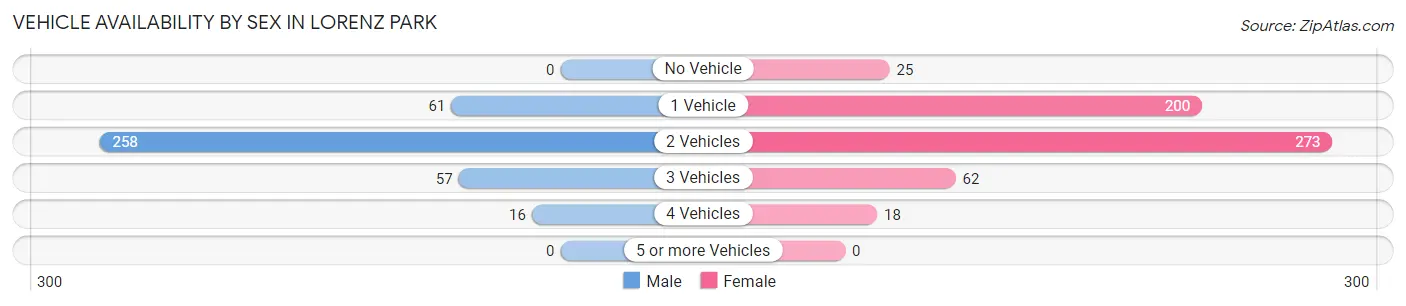
| Vehicles Available | Male | Female |
| No Vehicle | 0 (0.0%) | 25 (4.3%) |
| 1 Vehicle | 61 (15.6%) | 200 (34.6%) |
| 2 Vehicles | 258 (65.8%) | 273 (47.2%) |
| 3 Vehicles | 57 (14.5%) | 62 (10.7%) |
| 4 Vehicles | 16 (4.1%) | 18 (3.1%) |
| 5 or more Vehicles | 0 (0.0%) | 0 (0.0%) |
| Total | 392 (100.0%) | 578 (100.0%) |
Commute Time in Lorenz Park
The most frequently occuring commute durations in Lorenz Park are 5 to 9 minutes (346 commuters, 37.5%), 15 to 19 minutes (131 commuters, 14.2%), and 10 to 14 minutes (106 commuters, 11.5%).
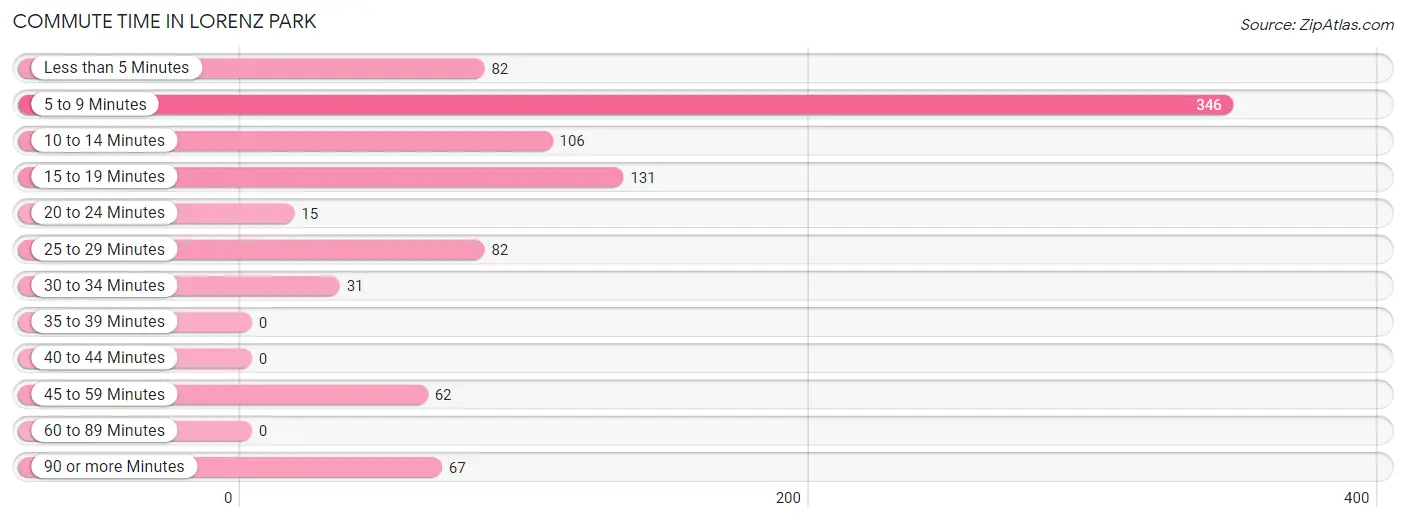
| Commute Time | # Commuters | % Commuters |
| Less than 5 Minutes | 82 | 8.9% |
| 5 to 9 Minutes | 346 | 37.5% |
| 10 to 14 Minutes | 106 | 11.5% |
| 15 to 19 Minutes | 131 | 14.2% |
| 20 to 24 Minutes | 15 | 1.6% |
| 25 to 29 Minutes | 82 | 8.9% |
| 30 to 34 Minutes | 31 | 3.4% |
| 35 to 39 Minutes | 0 | 0.0% |
| 40 to 44 Minutes | 0 | 0.0% |
| 45 to 59 Minutes | 62 | 6.7% |
| 60 to 89 Minutes | 0 | 0.0% |
| 90 or more Minutes | 67 | 7.3% |
Commute Time by Sex in Lorenz Park
The most common commute times in Lorenz Park are 5 to 9 minutes (147 commuters, 37.5%) for males and 5 to 9 minutes (199 commuters, 37.6%) for females.
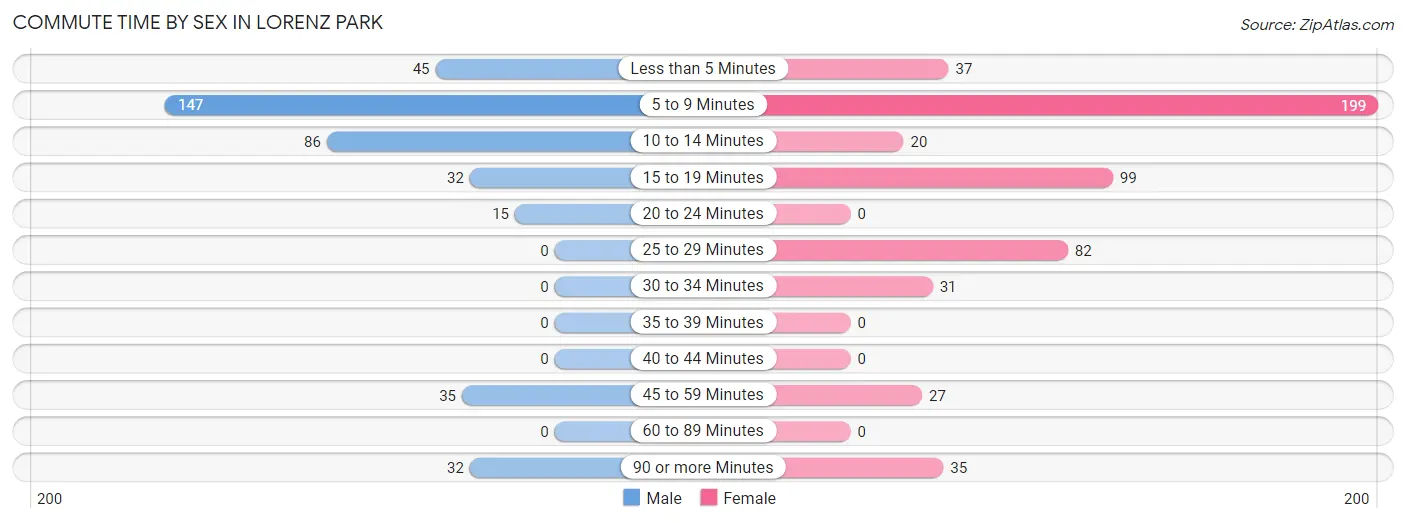
| Commute Time | Male | Female |
| Less than 5 Minutes | 45 (11.5%) | 37 (7.0%) |
| 5 to 9 Minutes | 147 (37.5%) | 199 (37.6%) |
| 10 to 14 Minutes | 86 (21.9%) | 20 (3.8%) |
| 15 to 19 Minutes | 32 (8.2%) | 99 (18.7%) |
| 20 to 24 Minutes | 15 (3.8%) | 0 (0.0%) |
| 25 to 29 Minutes | 0 (0.0%) | 82 (15.5%) |
| 30 to 34 Minutes | 0 (0.0%) | 31 (5.9%) |
| 35 to 39 Minutes | 0 (0.0%) | 0 (0.0%) |
| 40 to 44 Minutes | 0 (0.0%) | 0 (0.0%) |
| 45 to 59 Minutes | 35 (8.9%) | 27 (5.1%) |
| 60 to 89 Minutes | 0 (0.0%) | 0 (0.0%) |
| 90 or more Minutes | 32 (8.2%) | 35 (6.6%) |
Time of Departure to Work by Sex in Lorenz Park
The most frequent times of departure to work in Lorenz Park are 6:00 AM to 6:29 AM (108, 27.6%) for males and 6:30 AM to 6:59 AM (114, 21.5%) for females.
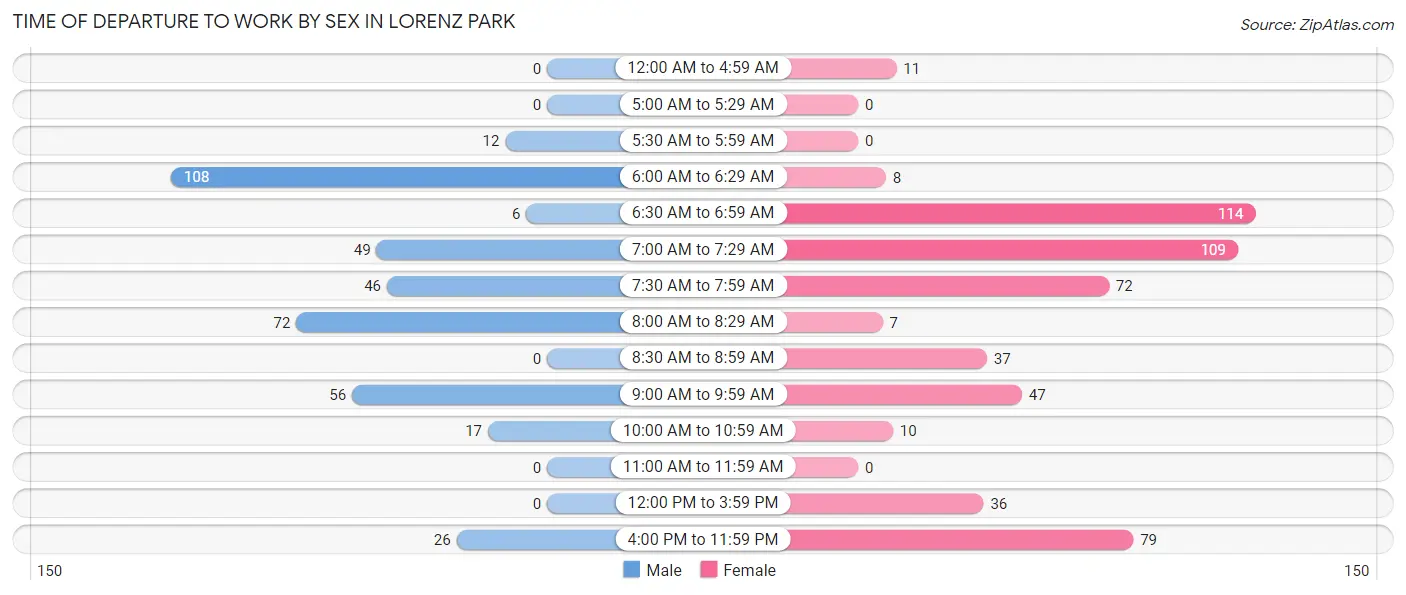
| Time of Departure | Male | Female |
| 12:00 AM to 4:59 AM | 0 (0.0%) | 11 (2.1%) |
| 5:00 AM to 5:29 AM | 0 (0.0%) | 0 (0.0%) |
| 5:30 AM to 5:59 AM | 12 (3.1%) | 0 (0.0%) |
| 6:00 AM to 6:29 AM | 108 (27.6%) | 8 (1.5%) |
| 6:30 AM to 6:59 AM | 6 (1.5%) | 114 (21.5%) |
| 7:00 AM to 7:29 AM | 49 (12.5%) | 109 (20.6%) |
| 7:30 AM to 7:59 AM | 46 (11.7%) | 72 (13.6%) |
| 8:00 AM to 8:29 AM | 72 (18.4%) | 7 (1.3%) |
| 8:30 AM to 8:59 AM | 0 (0.0%) | 37 (7.0%) |
| 9:00 AM to 9:59 AM | 56 (14.3%) | 47 (8.9%) |
| 10:00 AM to 10:59 AM | 17 (4.3%) | 10 (1.9%) |
| 11:00 AM to 11:59 AM | 0 (0.0%) | 0 (0.0%) |
| 12:00 PM to 3:59 PM | 0 (0.0%) | 36 (6.8%) |
| 4:00 PM to 11:59 PM | 26 (6.6%) | 79 (14.9%) |
| Total | 392 (100.0%) | 530 (100.0%) |
Housing Occupancy in Lorenz Park
Occupancy by Ownership in Lorenz Park
Of the total 862 dwellings in Lorenz Park, owner-occupied units account for 628 (72.9%), while renter-occupied units make up 234 (27.2%).
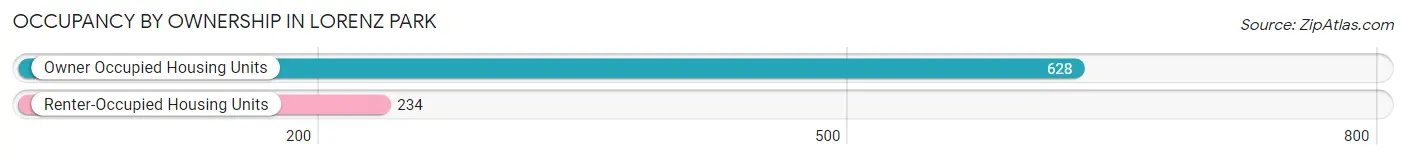
| Occupancy | # Housing Units | % Housing Units |
| Owner Occupied Housing Units | 628 | 72.9% |
| Renter-Occupied Housing Units | 234 | 27.2% |
| Total Occupied Housing Units | 862 | 100.0% |
Occupancy by Household Size in Lorenz Park
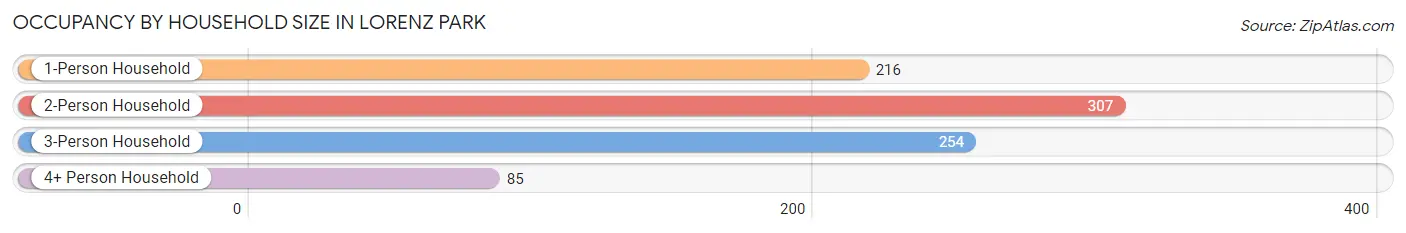
| Household Size | # Housing Units | % Housing Units |
| 1-Person Household | 216 | 25.1% |
| 2-Person Household | 307 | 35.6% |
| 3-Person Household | 254 | 29.5% |
| 4+ Person Household | 85 | 9.9% |
| Total Housing Units | 862 | 100.0% |
Occupancy by Ownership by Household Size in Lorenz Park
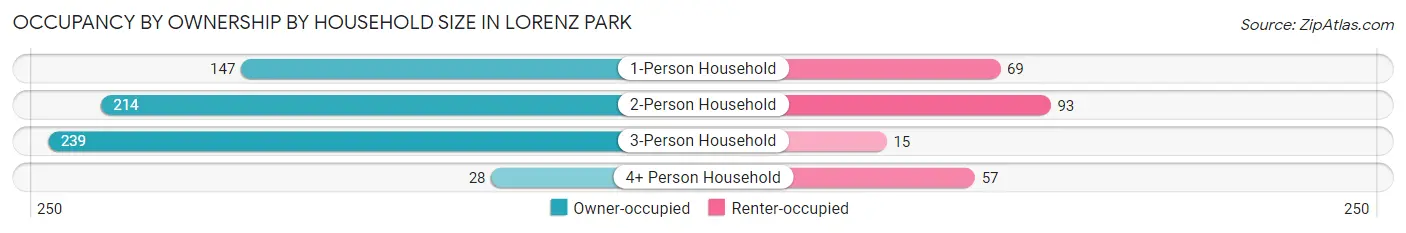
| Household Size | Owner-occupied | Renter-occupied |
| 1-Person Household | 147 (68.1%) | 69 (31.9%) |
| 2-Person Household | 214 (69.7%) | 93 (30.3%) |
| 3-Person Household | 239 (94.1%) | 15 (5.9%) |
| 4+ Person Household | 28 (32.9%) | 57 (67.1%) |
| Total Housing Units | 628 (72.9%) | 234 (27.2%) |
Occupancy by Educational Attainment in Lorenz Park
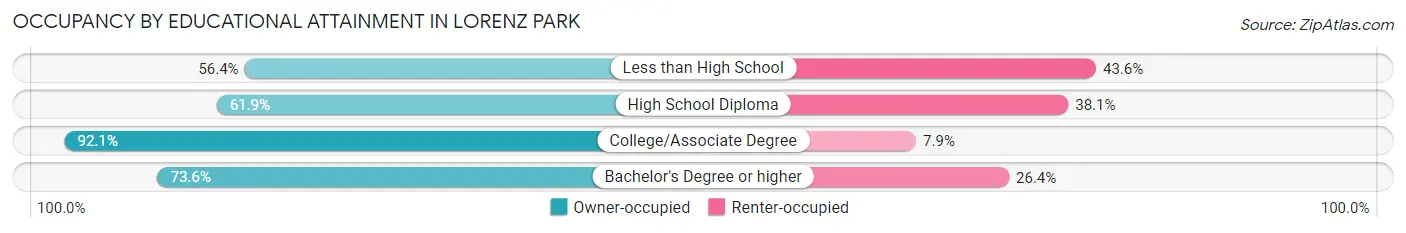
| Household Size | Owner-occupied | Renter-occupied |
| Less than High School | 22 (56.4%) | 17 (43.6%) |
| High School Diploma | 221 (61.9%) | 136 (38.1%) |
| College/Associate Degree | 209 (92.1%) | 18 (7.9%) |
| Bachelor's Degree or higher | 176 (73.6%) | 63 (26.4%) |
Occupancy by Age of Householder in Lorenz Park
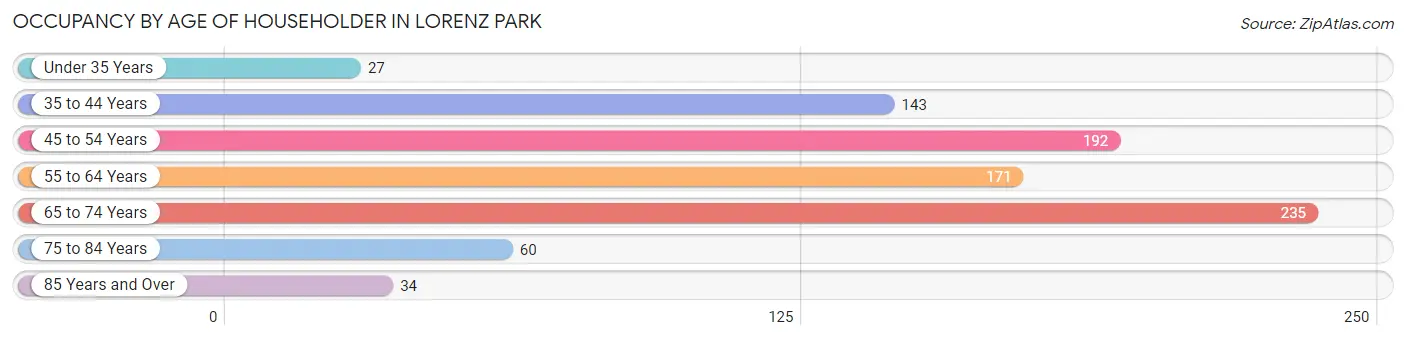
| Age Bracket | # Households | % Households |
| Under 35 Years | 27 | 3.1% |
| 35 to 44 Years | 143 | 16.6% |
| 45 to 54 Years | 192 | 22.3% |
| 55 to 64 Years | 171 | 19.8% |
| 65 to 74 Years | 235 | 27.3% |
| 75 to 84 Years | 60 | 7.0% |
| 85 Years and Over | 34 | 3.9% |
| Total | 862 | 100.0% |
Housing Finances in Lorenz Park
Median Income by Occupancy in Lorenz Park
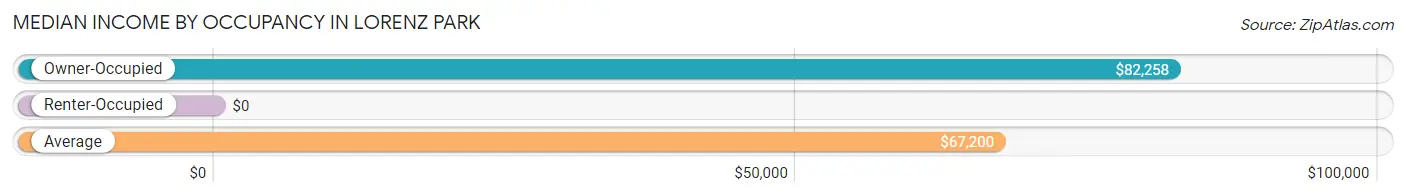
| Occupancy Type | # Households | Median Income |
| Owner-Occupied | 628 (72.9%) | $82,258 |
| Renter-Occupied | 234 (27.2%) | $0 |
| Average | 862 (100.0%) | $67,200 |
Occupancy by Householder Income Bracket in Lorenz Park
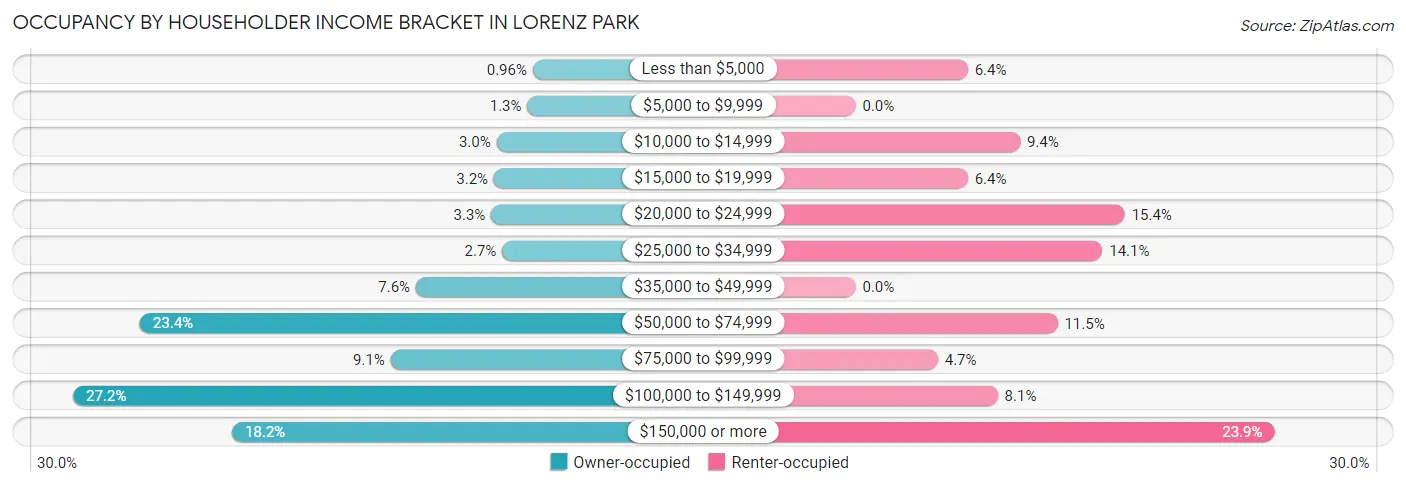
| Income Bracket | Owner-occupied | Renter-occupied |
| Less than $5,000 | 6 (1.0%) | 15 (6.4%) |
| $5,000 to $9,999 | 8 (1.3%) | 0 (0.0%) |
| $10,000 to $14,999 | 19 (3.0%) | 22 (9.4%) |
| $15,000 to $19,999 | 20 (3.2%) | 15 (6.4%) |
| $20,000 to $24,999 | 21 (3.3%) | 36 (15.4%) |
| $25,000 to $34,999 | 17 (2.7%) | 33 (14.1%) |
| $35,000 to $49,999 | 48 (7.6%) | 0 (0.0%) |
| $50,000 to $74,999 | 147 (23.4%) | 27 (11.5%) |
| $75,000 to $99,999 | 57 (9.1%) | 11 (4.7%) |
| $100,000 to $149,999 | 171 (27.2%) | 19 (8.1%) |
| $150,000 or more | 114 (18.1%) | 56 (23.9%) |
| Total | 628 (100.0%) | 234 (100.0%) |
Monthly Housing Cost Tiers in Lorenz Park
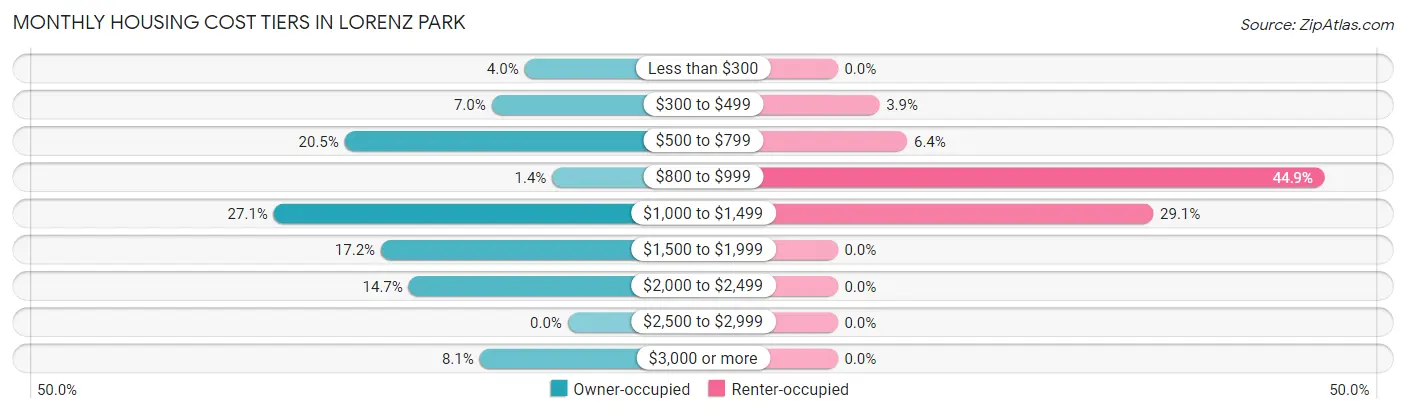
| Monthly Cost | Owner-occupied | Renter-occupied |
| Less than $300 | 25 (4.0%) | 0 (0.0%) |
| $300 to $499 | 44 (7.0%) | 9 (3.8%) |
| $500 to $799 | 129 (20.5%) | 15 (6.4%) |
| $800 to $999 | 9 (1.4%) | 105 (44.9%) |
| $1,000 to $1,499 | 170 (27.1%) | 68 (29.1%) |
| $1,500 to $1,999 | 108 (17.2%) | 0 (0.0%) |
| $2,000 to $2,499 | 92 (14.6%) | 0 (0.0%) |
| $2,500 to $2,999 | 0 (0.0%) | 0 (0.0%) |
| $3,000 or more | 51 (8.1%) | 0 (0.0%) |
| Total | 628 (100.0%) | 234 (100.0%) |
Physical Housing Characteristics in Lorenz Park
Housing Structures in Lorenz Park
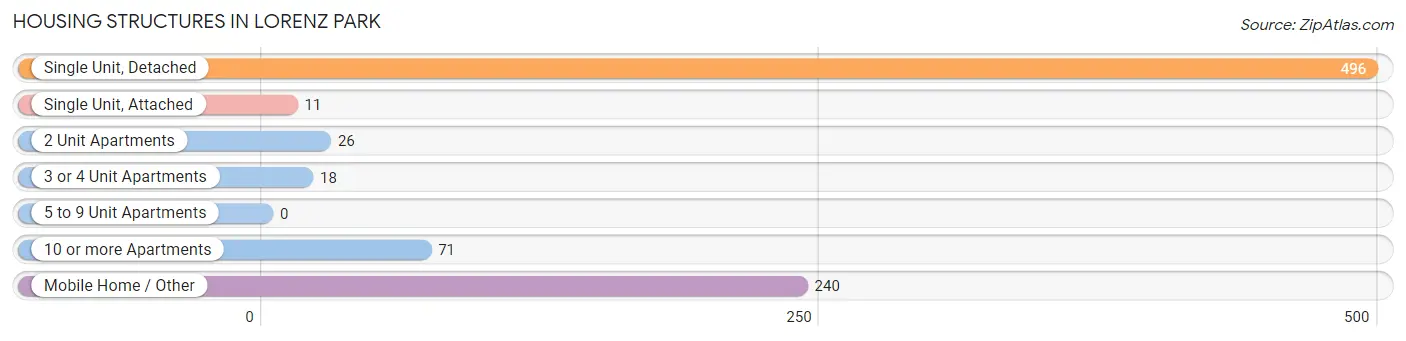
| Structure Type | # Housing Units | % Housing Units |
| Single Unit, Detached | 496 | 57.5% |
| Single Unit, Attached | 11 | 1.3% |
| 2 Unit Apartments | 26 | 3.0% |
| 3 or 4 Unit Apartments | 18 | 2.1% |
| 5 to 9 Unit Apartments | 0 | 0.0% |
| 10 or more Apartments | 71 | 8.2% |
| Mobile Home / Other | 240 | 27.8% |
| Total | 862 | 100.0% |
Housing Structures by Occupancy in Lorenz Park
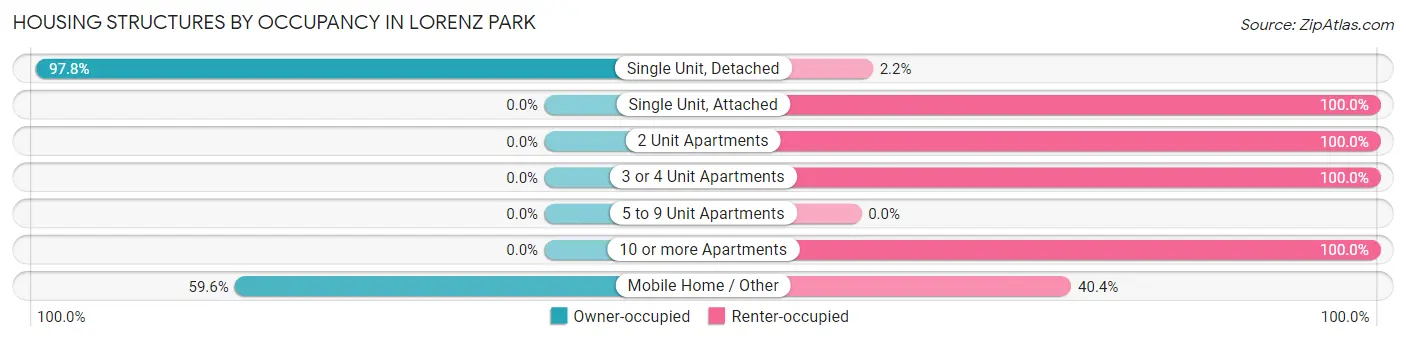
| Structure Type | Owner-occupied | Renter-occupied |
| Single Unit, Detached | 485 (97.8%) | 11 (2.2%) |
| Single Unit, Attached | 0 (0.0%) | 11 (100.0%) |
| 2 Unit Apartments | 0 (0.0%) | 26 (100.0%) |
| 3 or 4 Unit Apartments | 0 (0.0%) | 18 (100.0%) |
| 5 to 9 Unit Apartments | 0 (0.0%) | 0 (0.0%) |
| 10 or more Apartments | 0 (0.0%) | 71 (100.0%) |
| Mobile Home / Other | 143 (59.6%) | 97 (40.4%) |
| Total | 628 (72.9%) | 234 (27.2%) |
Housing Structures by Number of Rooms in Lorenz Park
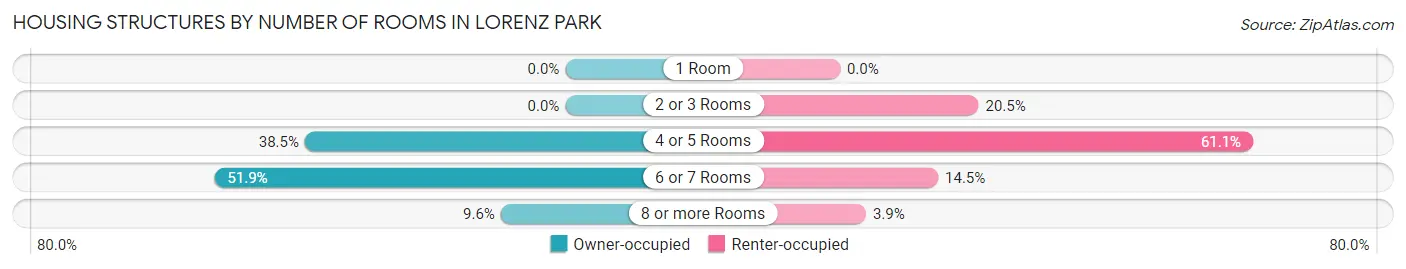
| Number of Rooms | Owner-occupied | Renter-occupied |
| 1 Room | 0 (0.0%) | 0 (0.0%) |
| 2 or 3 Rooms | 0 (0.0%) | 48 (20.5%) |
| 4 or 5 Rooms | 242 (38.5%) | 143 (61.1%) |
| 6 or 7 Rooms | 326 (51.9%) | 34 (14.5%) |
| 8 or more Rooms | 60 (9.6%) | 9 (3.8%) |
| Total | 628 (100.0%) | 234 (100.0%) |
Housing Structure by Heating Type in Lorenz Park
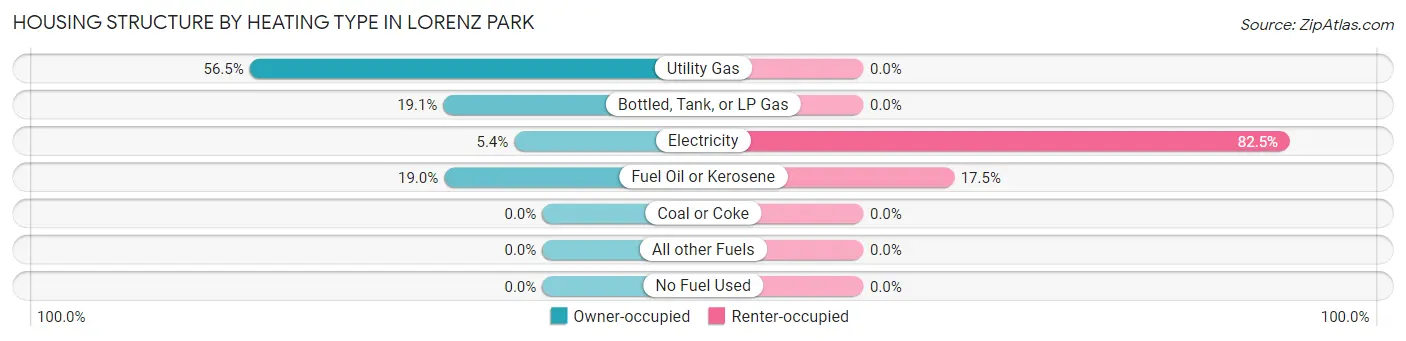
| Heating Type | Owner-occupied | Renter-occupied |
| Utility Gas | 355 (56.5%) | 0 (0.0%) |
| Bottled, Tank, or LP Gas | 120 (19.1%) | 0 (0.0%) |
| Electricity | 34 (5.4%) | 193 (82.5%) |
| Fuel Oil or Kerosene | 119 (19.0%) | 41 (17.5%) |
| Coal or Coke | 0 (0.0%) | 0 (0.0%) |
| All other Fuels | 0 (0.0%) | 0 (0.0%) |
| No Fuel Used | 0 (0.0%) | 0 (0.0%) |
| Total | 628 (100.0%) | 234 (100.0%) |
Household Vehicle Usage in Lorenz Park
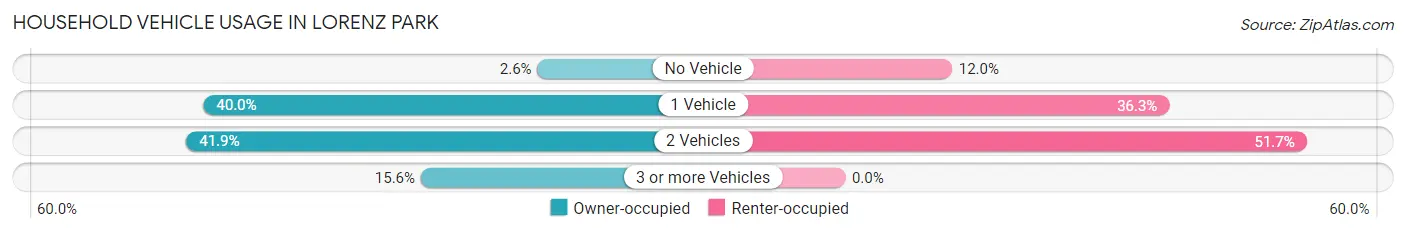
| Vehicles per Household | Owner-occupied | Renter-occupied |
| No Vehicle | 16 (2.5%) | 28 (12.0%) |
| 1 Vehicle | 251 (40.0%) | 85 (36.3%) |
| 2 Vehicles | 263 (41.9%) | 121 (51.7%) |
| 3 or more Vehicles | 98 (15.6%) | 0 (0.0%) |
| Total | 628 (100.0%) | 234 (100.0%) |
Real Estate & Mortgages in Lorenz Park
Real Estate and Mortgage Overview in Lorenz Park
| Characteristic | Without Mortgage | With Mortgage |
| Housing Units | 245 | 383 |
| Median Property Value | $162,000 | $197,600 |
| Median Household Income | $59,732 | $114 |
| Monthly Housing Costs | $626 | $51 |
| Real Estate Taxes | $2,481 | $46 |
Property Value by Mortgage Status in Lorenz Park
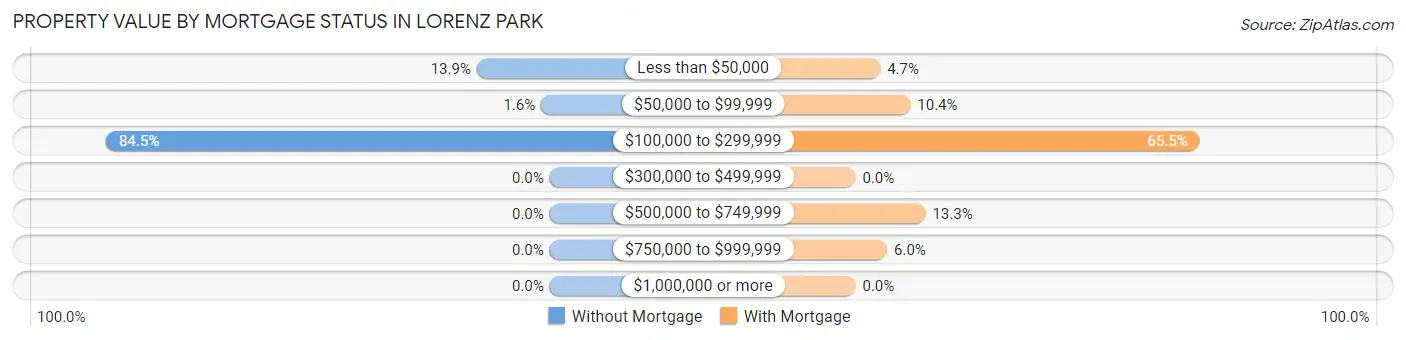
| Property Value | Without Mortgage | With Mortgage |
| Less than $50,000 | 34 (13.9%) | 18 (4.7%) |
| $50,000 to $99,999 | 4 (1.6%) | 40 (10.4%) |
| $100,000 to $299,999 | 207 (84.5%) | 251 (65.5%) |
| $300,000 to $499,999 | 0 (0.0%) | 0 (0.0%) |
| $500,000 to $749,999 | 0 (0.0%) | 51 (13.3%) |
| $750,000 to $999,999 | 0 (0.0%) | 23 (6.0%) |
| $1,000,000 or more | 0 (0.0%) | 0 (0.0%) |
| Total | 245 (100.0%) | 383 (100.0%) |
Household Income by Mortgage Status in Lorenz Park
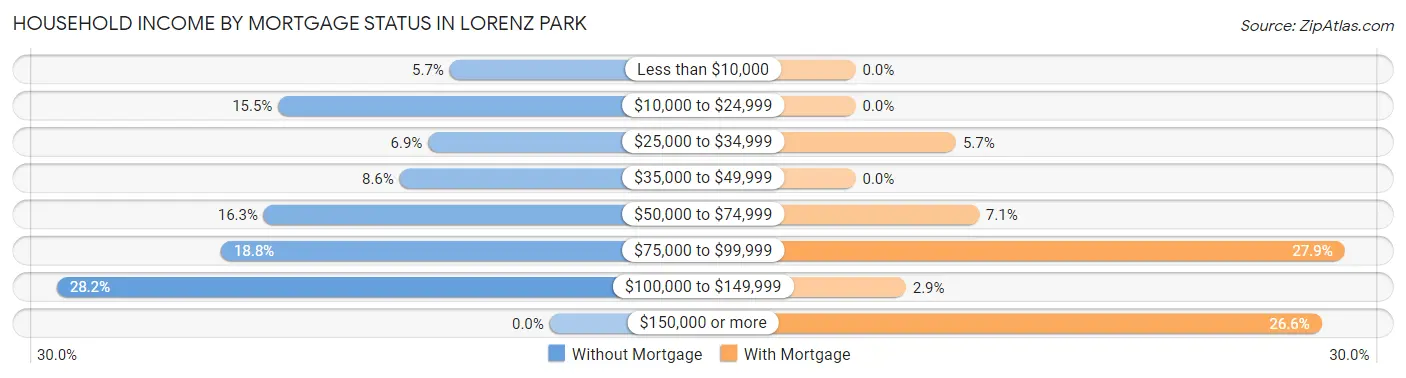
| Household Income | Without Mortgage | With Mortgage |
| Less than $10,000 | 14 (5.7%) | 0 (0.0%) |
| $10,000 to $24,999 | 38 (15.5%) | 0 (0.0%) |
| $25,000 to $34,999 | 17 (6.9%) | 22 (5.7%) |
| $35,000 to $49,999 | 21 (8.6%) | 0 (0.0%) |
| $50,000 to $74,999 | 40 (16.3%) | 27 (7.0%) |
| $75,000 to $99,999 | 46 (18.8%) | 107 (27.9%) |
| $100,000 to $149,999 | 69 (28.2%) | 11 (2.9%) |
| $150,000 or more | 0 (0.0%) | 102 (26.6%) |
| Total | 245 (100.0%) | 383 (100.0%) |
Property Value to Household Income Ratio in Lorenz Park
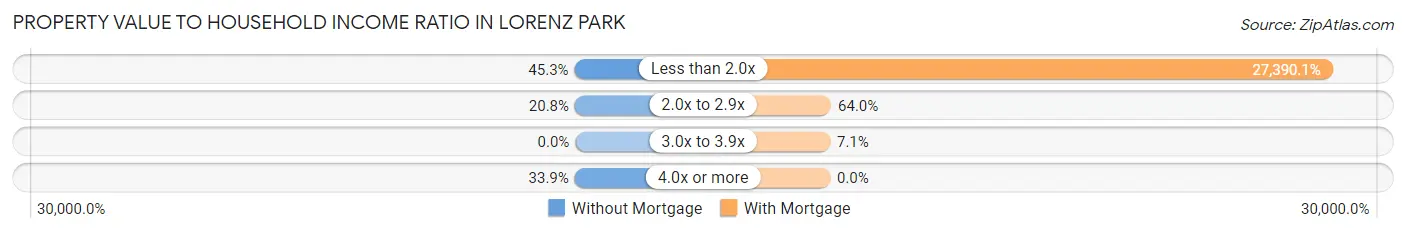
| Value-to-Income Ratio | Without Mortgage | With Mortgage |
| Less than 2.0x | 111 (45.3%) | 104,904 (27,390.1%) |
| 2.0x to 2.9x | 51 (20.8%) | 245 (64.0%) |
| 3.0x to 3.9x | 0 (0.0%) | 27 (7.0%) |
| 4.0x or more | 83 (33.9%) | 0 (0.0%) |
| Total | 245 (100.0%) | 383 (100.0%) |
Real Estate Taxes by Mortgage Status in Lorenz Park
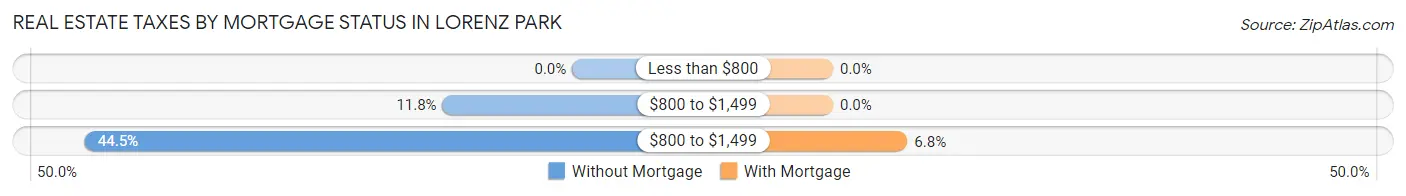
| Property Taxes | Without Mortgage | With Mortgage |
| Less than $800 | 0 (0.0%) | 0 (0.0%) |
| $800 to $1,499 | 29 (11.8%) | 0 (0.0%) |
| $800 to $1,499 | 109 (44.5%) | 26 (6.8%) |
| Total | 245 (100.0%) | 383 (100.0%) |
Health & Disability in Lorenz Park
Health Insurance Coverage by Age in Lorenz Park
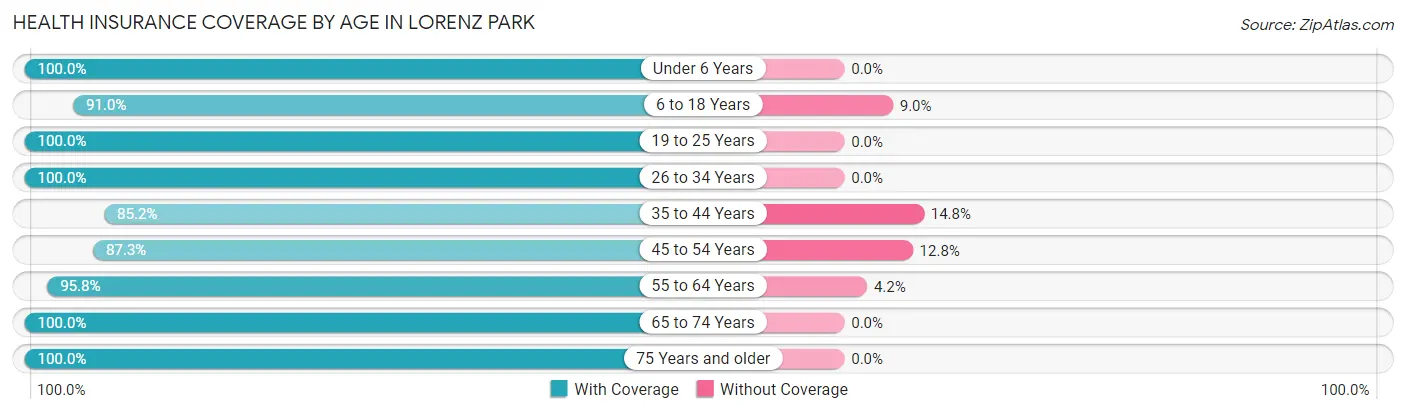
| Age Bracket | With Coverage | Without Coverage |
| Under 6 Years | 103 (100.0%) | 0 (0.0%) |
| 6 to 18 Years | 171 (91.0%) | 17 (9.0%) |
| 19 to 25 Years | 169 (100.0%) | 0 (0.0%) |
| 26 to 34 Years | 53 (100.0%) | 0 (0.0%) |
| 35 to 44 Years | 224 (85.2%) | 39 (14.8%) |
| 45 to 54 Years | 267 (87.3%) | 39 (12.8%) |
| 55 to 64 Years | 385 (95.8%) | 17 (4.2%) |
| 65 to 74 Years | 379 (100.0%) | 0 (0.0%) |
| 75 Years and older | 140 (100.0%) | 0 (0.0%) |
| Total | 1,891 (94.4%) | 112 (5.6%) |
Health Insurance Coverage by Citizenship Status in Lorenz Park
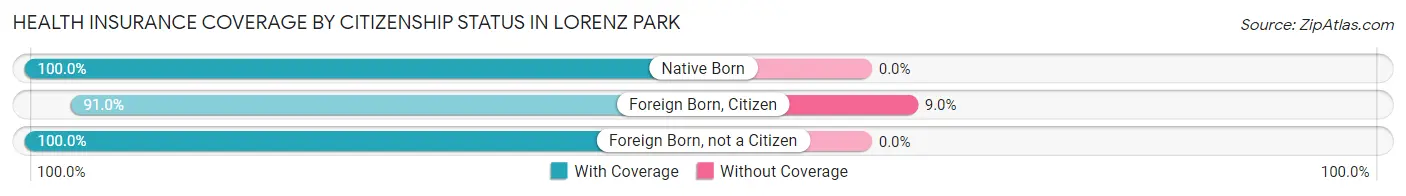
| Citizenship Status | With Coverage | Without Coverage |
| Native Born | 103 (100.0%) | 0 (0.0%) |
| Foreign Born, Citizen | 171 (91.0%) | 17 (9.0%) |
| Foreign Born, not a Citizen | 169 (100.0%) | 0 (0.0%) |
Health Insurance Coverage by Household Income in Lorenz Park
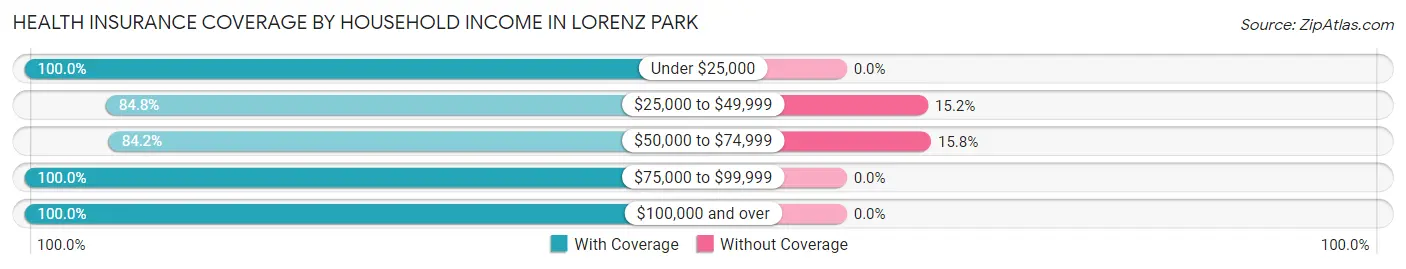
| Household Income | With Coverage | Without Coverage |
| Under $25,000 | 366 (100.0%) | 0 (0.0%) |
| $25,000 to $49,999 | 139 (84.8%) | 25 (15.2%) |
| $50,000 to $74,999 | 464 (84.2%) | 87 (15.8%) |
| $75,000 to $99,999 | 133 (100.0%) | 0 (0.0%) |
| $100,000 and over | 769 (100.0%) | 0 (0.0%) |
Public vs Private Health Insurance Coverage by Age in Lorenz Park
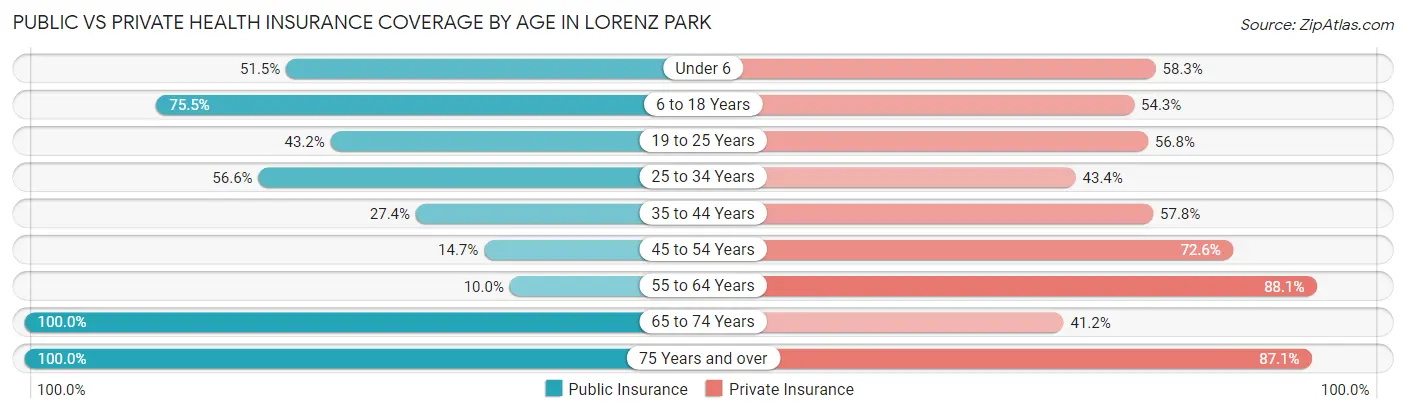
| Age Bracket | Public Insurance | Private Insurance |
| Under 6 | 53 (51.5%) | 60 (58.3%) |
| 6 to 18 Years | 142 (75.5%) | 102 (54.3%) |
| 19 to 25 Years | 73 (43.2%) | 96 (56.8%) |
| 25 to 34 Years | 30 (56.6%) | 23 (43.4%) |
| 35 to 44 Years | 72 (27.4%) | 152 (57.8%) |
| 45 to 54 Years | 45 (14.7%) | 222 (72.6%) |
| 55 to 64 Years | 40 (10.0%) | 354 (88.1%) |
| 65 to 74 Years | 379 (100.0%) | 156 (41.2%) |
| 75 Years and over | 140 (100.0%) | 122 (87.1%) |
| Total | 974 (48.6%) | 1,287 (64.2%) |
Disability Status by Sex by Age in Lorenz Park
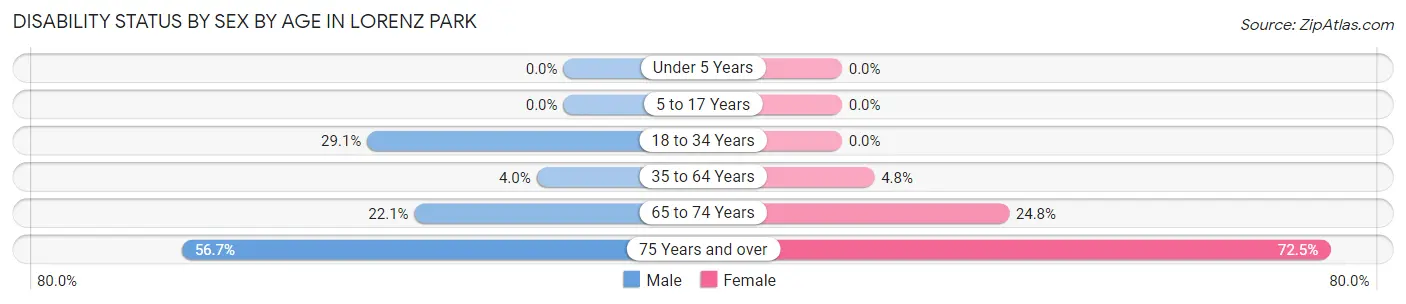
| Age Bracket | Male | Female |
| Under 5 Years | 0 (0.0%) | 0 (0.0%) |
| 5 to 17 Years | 0 (0.0%) | 0 (0.0%) |
| 18 to 34 Years | 30 (29.1%) | 0 (0.0%) |
| 35 to 64 Years | 18 (4.0%) | 25 (4.8%) |
| 65 to 74 Years | 25 (22.1%) | 66 (24.8%) |
| 75 Years and over | 34 (56.7%) | 58 (72.5%) |
Disability Class by Sex by Age in Lorenz Park
Disability Class: Hearing Difficulty
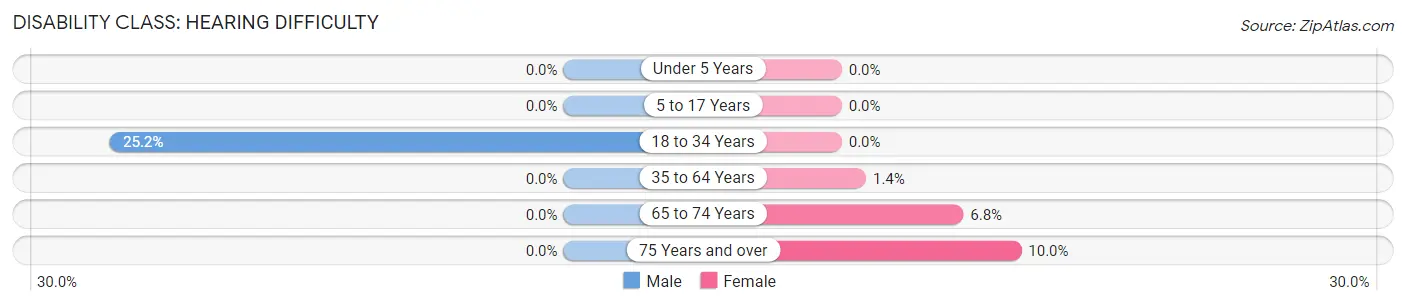
| Age Bracket | Male | Female |
| Under 5 Years | 0 (0.0%) | 0 (0.0%) |
| 5 to 17 Years | 0 (0.0%) | 0 (0.0%) |
| 18 to 34 Years | 26 (25.2%) | 0 (0.0%) |
| 35 to 64 Years | 0 (0.0%) | 7 (1.3%) |
| 65 to 74 Years | 0 (0.0%) | 18 (6.8%) |
| 75 Years and over | 0 (0.0%) | 8 (10.0%) |
Disability Class: Vision Difficulty
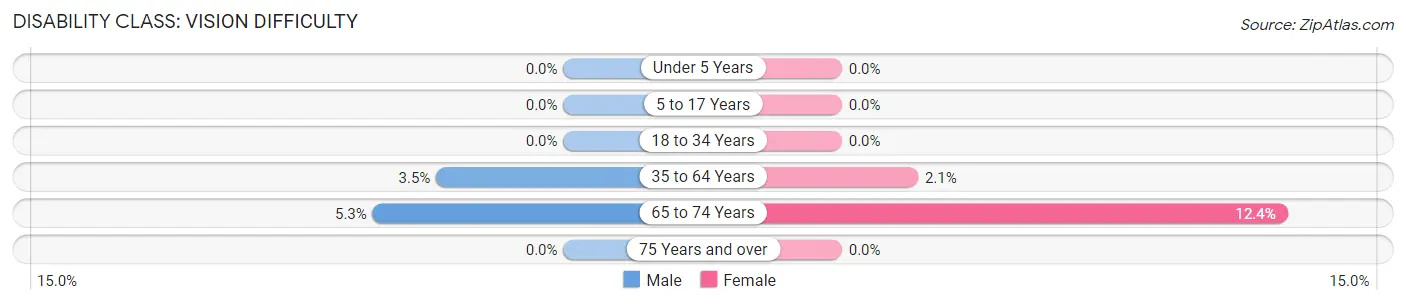
| Age Bracket | Male | Female |
| Under 5 Years | 0 (0.0%) | 0 (0.0%) |
| 5 to 17 Years | 0 (0.0%) | 0 (0.0%) |
| 18 to 34 Years | 0 (0.0%) | 0 (0.0%) |
| 35 to 64 Years | 16 (3.5%) | 11 (2.1%) |
| 65 to 74 Years | 6 (5.3%) | 33 (12.4%) |
| 75 Years and over | 0 (0.0%) | 0 (0.0%) |
Disability Class: Cognitive Difficulty
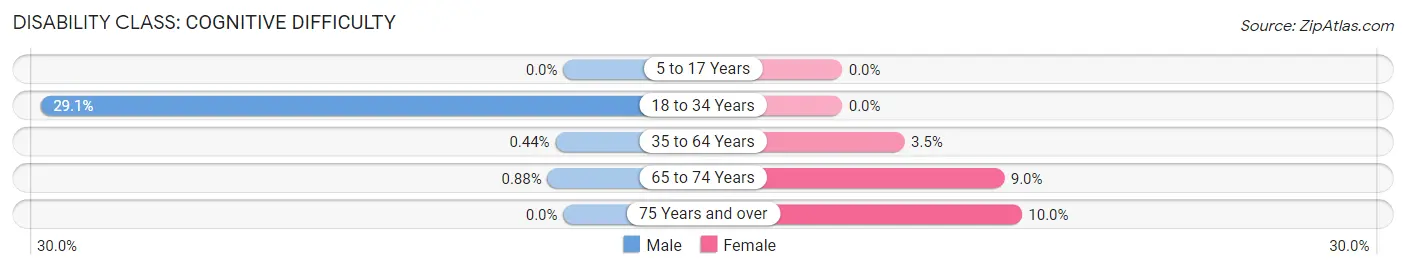
| Age Bracket | Male | Female |
| 5 to 17 Years | 0 (0.0%) | 0 (0.0%) |
| 18 to 34 Years | 30 (29.1%) | 0 (0.0%) |
| 35 to 64 Years | 2 (0.4%) | 18 (3.5%) |
| 65 to 74 Years | 1 (0.9%) | 24 (9.0%) |
| 75 Years and over | 0 (0.0%) | 8 (10.0%) |
Disability Class: Ambulatory Difficulty
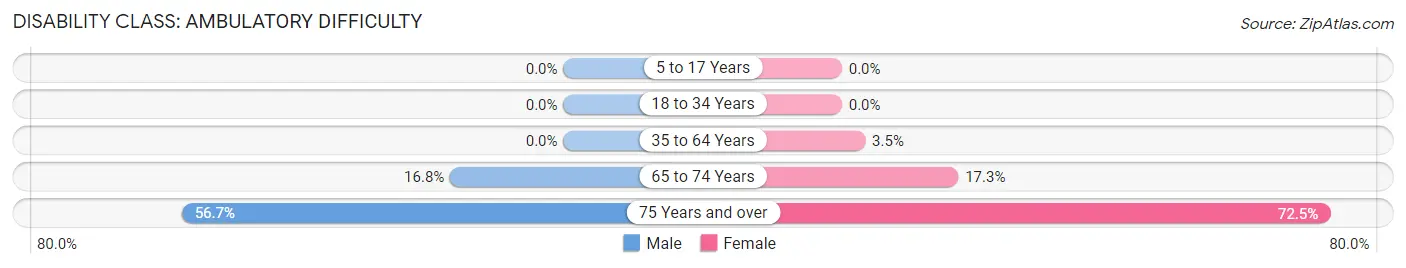
| Age Bracket | Male | Female |
| 5 to 17 Years | 0 (0.0%) | 0 (0.0%) |
| 18 to 34 Years | 0 (0.0%) | 0 (0.0%) |
| 35 to 64 Years | 0 (0.0%) | 18 (3.5%) |
| 65 to 74 Years | 19 (16.8%) | 46 (17.3%) |
| 75 Years and over | 34 (56.7%) | 58 (72.5%) |
Disability Class: Self-Care Difficulty
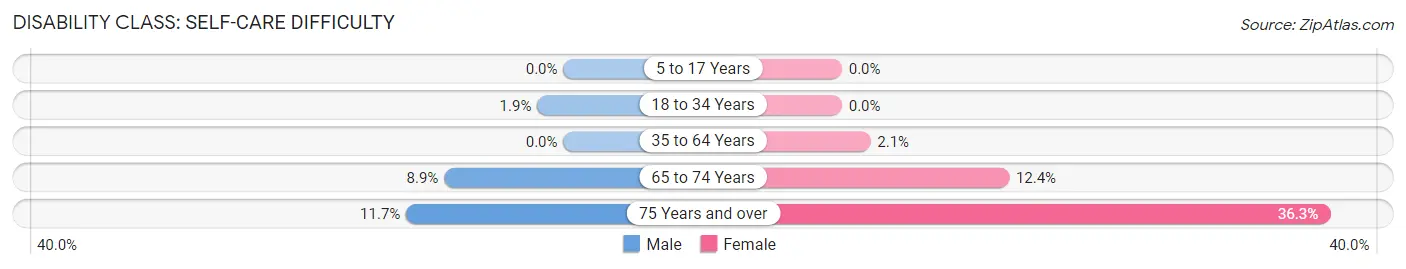
| Age Bracket | Male | Female |
| 5 to 17 Years | 0 (0.0%) | 0 (0.0%) |
| 18 to 34 Years | 2 (1.9%) | 0 (0.0%) |
| 35 to 64 Years | 0 (0.0%) | 11 (2.1%) |
| 65 to 74 Years | 10 (8.8%) | 33 (12.4%) |
| 75 Years and over | 7 (11.7%) | 29 (36.2%) |
Technology Access in Lorenz Park
Computing Device Access in Lorenz Park
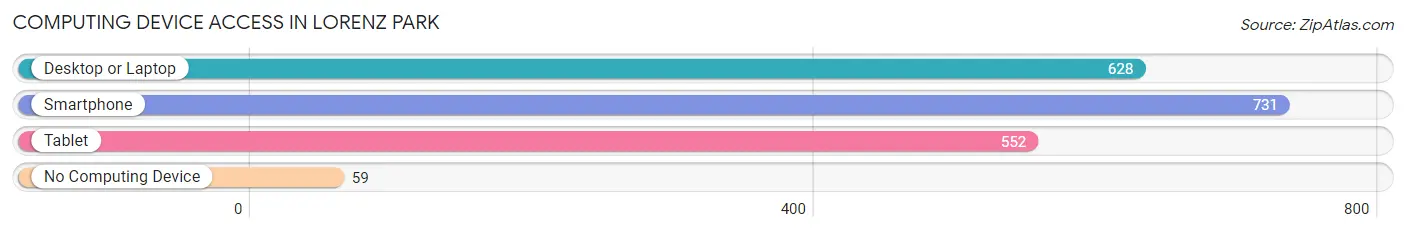
| Device Type | # Households | % Households |
| Desktop or Laptop | 628 | 72.9% |
| Smartphone | 731 | 84.8% |
| Tablet | 552 | 64.0% |
| No Computing Device | 59 | 6.8% |
| Total | 862 | 100.0% |
Internet Access in Lorenz Park
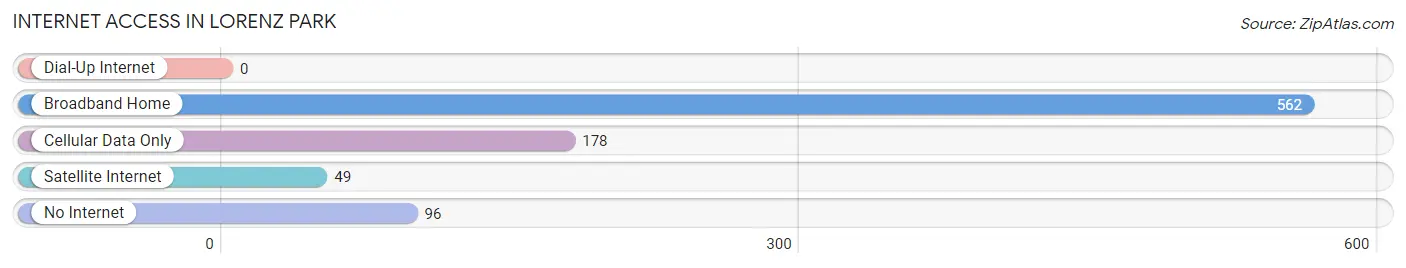
| Internet Type | # Households | % Households |
| Dial-Up Internet | 0 | 0.0% |
| Broadband Home | 562 | 65.2% |
| Cellular Data Only | 178 | 20.6% |
| Satellite Internet | 49 | 5.7% |
| No Internet | 96 | 11.1% |
| Total | 862 | 100.0% |
Lorenz Park Summary
Lorenz Park is a small hamlet located in the town of North Collins in Erie County, New York. It is situated in the southwestern corner of the county, near the border with Chautauqua County. The hamlet is located on the banks of Cattaraugus Creek, and is home to a population of approximately 500 people.
Geography
Lorenz Park is located in the southwestern corner of Erie County, near the border with Chautauqua County. It is situated on the banks of Cattaraugus Creek, which flows through the hamlet. The terrain is mostly flat, with some rolling hills in the area. The hamlet is located in the Great Lakes region of the United States, and is part of the Buffalo-Niagara Falls metropolitan area.
History
Lorenz Park was founded in 1845 by German immigrants, who named the hamlet after their leader, Lorenz Lorenz. The hamlet was originally a farming community, and the Lorenz family owned a large farm in the area. The hamlet grew slowly over the years, and by the early 20th century, it had become a small village.
In the 1950s, the hamlet began to experience a population decline, as many of its residents moved away in search of better economic opportunities. By the 1970s, the population had dropped to just over 500 people. In recent years, the population has stabilized, and the hamlet has seen some growth.
Economy
Lorenz Park is a primarily residential community, and the majority of its residents are employed in the nearby towns and cities. The hamlet does not have any major industries, but there are a few small businesses in the area, including a gas station, a convenience store, and a few restaurants.
Demographics
As of the 2010 census, the population of Lorenz Park was 514 people. The racial makeup of the hamlet was 97.3% White, 0.6% African American, 0.4% Native American, 0.2% Asian, and 1.5% from other races. The median household income was $45,000, and the median age was 43.
Conclusion
Lorenz Park is a small hamlet located in the southwestern corner of Erie County, New York. It is situated on the banks of Cattaraugus Creek, and is home to a population of approximately 500 people. The hamlet was founded in 1845 by German immigrants, and has since become a primarily residential community. The majority of its residents are employed in the nearby towns and cities, and there are a few small businesses in the area. The population of Lorenz Park is 97.3% White, 0.6% African American, 0.4% Native American, 0.2% Asian, and 1.5% from other races. The median household income is $45,000, and the median age is 43.
Common Questions
What is Per Capita Income in Lorenz Park?
Per Capita income in Lorenz Park is $38,631.
What is the Median Family Income in Lorenz Park?
Median Family Income in Lorenz Park is $81,290.
What is the Median Household income in Lorenz Park?
Median Household Income in Lorenz Park is $67,200.
What is Inequality or Gini Index in Lorenz Park?
Inequality or Gini Index in Lorenz Park is 0.42.
What is the Total Population of Lorenz Park?
Total Population of Lorenz Park is 2,003.
What is the Total Male Population of Lorenz Park?
Total Male Population of Lorenz Park is 912.
What is the Total Female Population of Lorenz Park?
Total Female Population of Lorenz Park is 1,091.
What is the Ratio of Males per 100 Females in Lorenz Park?
There are 83.59 Males per 100 Females in Lorenz Park.
What is the Ratio of Females per 100 Males in Lorenz Park?
There are 119.63 Females per 100 Males in Lorenz Park.
What is the Median Population Age in Lorenz Park?
Median Population Age in Lorenz Park is 53.4 Years.
What is the Average Family Size in Lorenz Park
Average Family Size in Lorenz Park is 2.6 People.
What is the Average Household Size in Lorenz Park
Average Household Size in Lorenz Park is 2.3 People.
How Large is the Labor Force in Lorenz Park?
There are 1,035 People in the Labor Forcein in Lorenz Park.
What is the Percentage of People in the Labor Force in Lorenz Park?
57.8% of People are in the Labor Force in Lorenz Park.
What is the Unemployment Rate in Lorenz Park?
Unemployment Rate in Lorenz Park is 4.5%.