Almond, NY Map & Demographics
Almond Map
Almond Overview
$28,364
PER CAPITA INCOME
$65,625
AVG FAMILY INCOME
$52,000
AVG HOUSEHOLD INCOME
20.7%
WAGE / INCOME GAP [ % ]
79.3¢/ $1
WAGE / INCOME GAP [ $ ]
0.42
INEQUALITY / GINI INDEX
418
TOTAL POPULATION
182
MALE POPULATION
236
FEMALE POPULATION
77.12
MALES / 100 FEMALES
129.67
FEMALES / 100 MALES
39.8
MEDIAN AGE
2.9
AVG FAMILY SIZE
2.5
AVG HOUSEHOLD SIZE
192
LABOR FORCE [ PEOPLE ]
58.5%
PERCENT IN LABOR FORCE
4.7%
UNEMPLOYMENT RATE
Almond Zip Codes
Almond Area Codes
Income in Almond
Income Overview in Almond
Per Capita Income in Almond is $28,364, while median incomes of families and households are $65,625 and $52,000 respectively.
| Characteristic | Number | Measure |
| Per Capita Income | 418 | $28,364 |
| Median Family Income | 115 | $65,625 |
| Mean Family Income | 115 | $79,781 |
| Median Household Income | 166 | $52,000 |
| Mean Household Income | 166 | $69,088 |
| Income Deficit | 115 | $0 |
| Wage / Income Gap (%) | 418 | 20.74% |
| Wage / Income Gap ($) | 418 | 79.26¢ per $1 |
| Gini / Inequality Index | 418 | 0.42 |
Earnings by Sex in Almond
Average Earnings in Almond are $35,556, $38,750 for men and $30,714 for women, a difference of 20.7%.
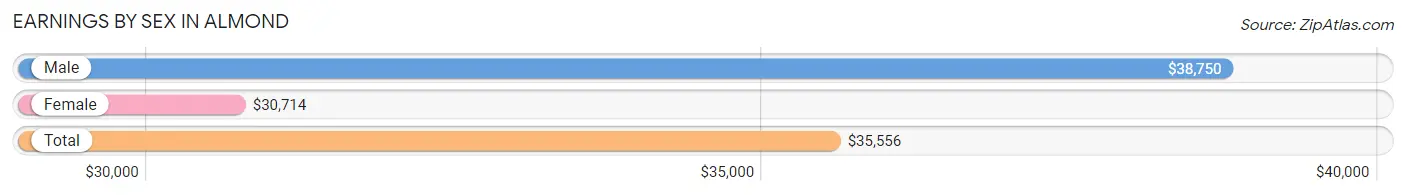
| Sex | Number | Average Earnings |
| Male | 102 (51.0%) | $38,750 |
| Female | 98 (49.0%) | $30,714 |
| Total | 200 (100.0%) | $35,556 |
Earnings by Sex by Income Bracket in Almond
The most common earnings brackets in Almond are $25,000 to $29,999 for men (15 | 14.7%) and $55,000 to $64,999 for women (10 | 10.2%).
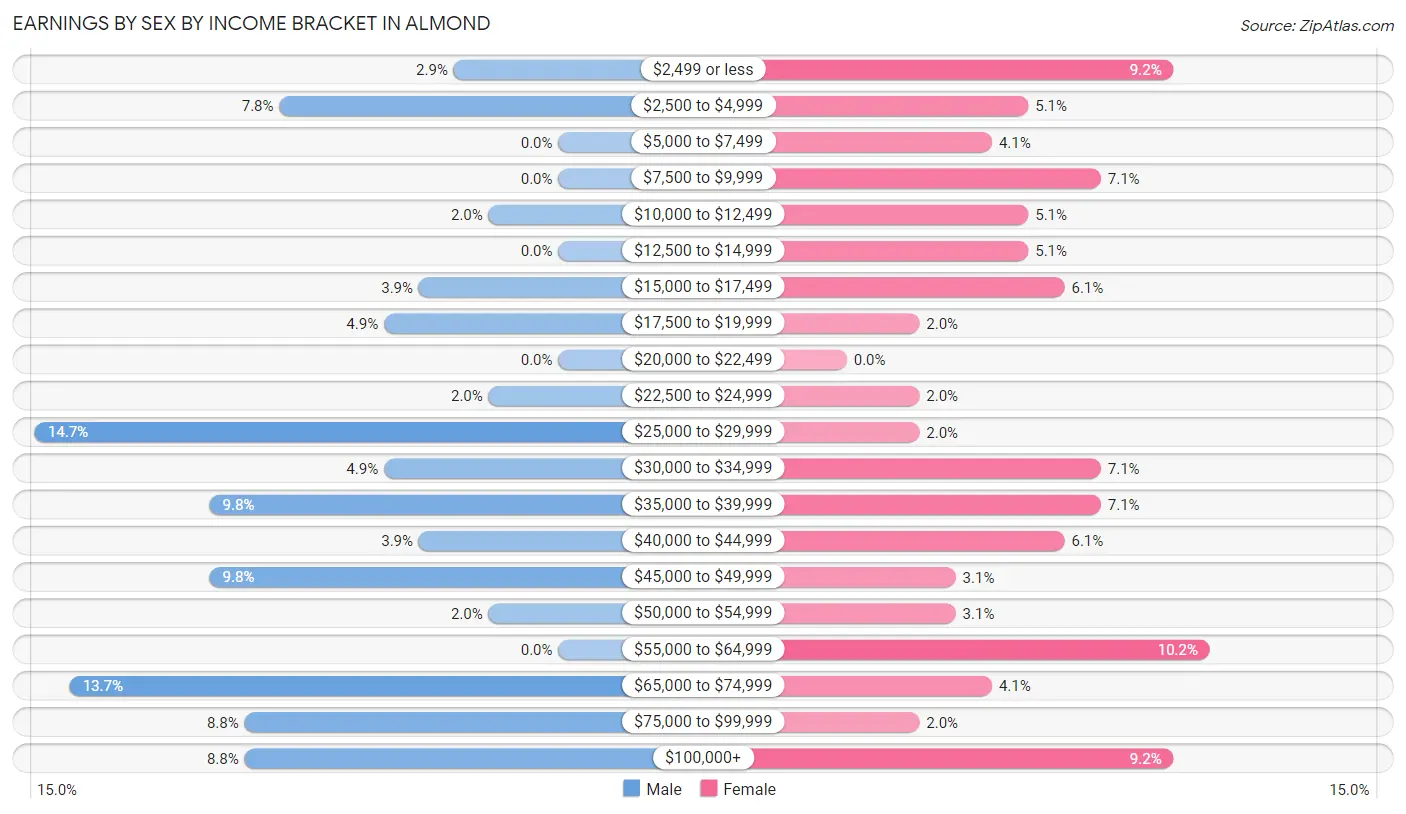
| Income | Male | Female |
| $2,499 or less | 3 (2.9%) | 9 (9.2%) |
| $2,500 to $4,999 | 8 (7.8%) | 5 (5.1%) |
| $5,000 to $7,499 | 0 (0.0%) | 4 (4.1%) |
| $7,500 to $9,999 | 0 (0.0%) | 7 (7.1%) |
| $10,000 to $12,499 | 2 (2.0%) | 5 (5.1%) |
| $12,500 to $14,999 | 0 (0.0%) | 5 (5.1%) |
| $15,000 to $17,499 | 4 (3.9%) | 6 (6.1%) |
| $17,500 to $19,999 | 5 (4.9%) | 2 (2.0%) |
| $20,000 to $22,499 | 0 (0.0%) | 0 (0.0%) |
| $22,500 to $24,999 | 2 (2.0%) | 2 (2.0%) |
| $25,000 to $29,999 | 15 (14.7%) | 2 (2.0%) |
| $30,000 to $34,999 | 5 (4.9%) | 7 (7.1%) |
| $35,000 to $39,999 | 10 (9.8%) | 7 (7.1%) |
| $40,000 to $44,999 | 4 (3.9%) | 6 (6.1%) |
| $45,000 to $49,999 | 10 (9.8%) | 3 (3.1%) |
| $50,000 to $54,999 | 2 (2.0%) | 3 (3.1%) |
| $55,000 to $64,999 | 0 (0.0%) | 10 (10.2%) |
| $65,000 to $74,999 | 14 (13.7%) | 4 (4.1%) |
| $75,000 to $99,999 | 9 (8.8%) | 2 (2.0%) |
| $100,000+ | 9 (8.8%) | 9 (9.2%) |
| Total | 102 (100.0%) | 98 (100.0%) |
Earnings by Sex by Educational Attainment in Almond
Average earnings in Almond are $47,083 for men and $40,313 for women, a difference of 14.4%. Men with an educational attainment of graduate degree enjoy the highest average annual earnings of $112,500, while those with high school diploma education earn the least with $29,688. Women with an educational attainment of college or associate's degree earn the most with the average annual earnings of $41,875, while those with graduate degree education have the smallest earnings of $39,375.
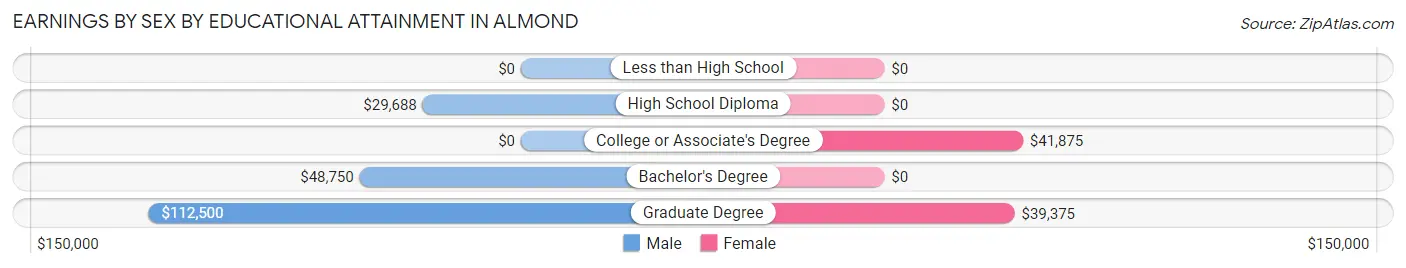
| Educational Attainment | Male Income | Female Income |
| Less than High School | - | - |
| High School Diploma | $29,688 | $0 |
| College or Associate's Degree | - | - |
| Bachelor's Degree | $48,750 | $0 |
| Graduate Degree | $112,500 | $39,375 |
| Total | $47,083 | $40,313 |
Family Income in Almond
Family Income Brackets in Almond
According to the Almond family income data, there are 25 families falling into the $25,000 to $34,999 income range, which is the most common income bracket and makes up 21.7% of all families.
| Income Bracket | # Families | % Families |
| Less than $10,000 | 6 | 5.2% |
| $10,000 to $14,999 | 0 | 0.0% |
| $15,000 to $24,999 | 6 | 5.2% |
| $25,000 to $34,999 | 25 | 21.7% |
| $35,000 to $49,999 | 8 | 7.0% |
| $50,000 to $74,999 | 24 | 20.9% |
| $75,000 to $99,999 | 9 | 7.8% |
| $100,000 to $149,999 | 22 | 19.1% |
| $150,000 to $199,999 | 13 | 11.3% |
| $200,000+ | 2 | 1.7% |
Family Income by Famaliy Size in Almond
4-person families (17 | 14.8%) account for the highest median family income in Almond with $107,188 per family, while 2-person families (72 | 62.6%) have the highest median income of $27,084 per family member.
| Income Bracket | # Families | Median Income |
| 2-Person Families | 72 (62.6%) | $54,167 |
| 3-Person Families | 17 (14.8%) | $69,219 |
| 4-Person Families | 17 (14.8%) | $107,188 |
| 5-Person Families | 9 (7.8%) | $0 |
| 6-Person Families | 0 (0.0%) | $0 |
| 7+ Person Families | 0 (0.0%) | $0 |
| Total | 115 (100.0%) | $65,625 |
Family Income by Number of Earners in Almond
The median family income in Almond is $65,625, with families comprising 3+ earners (6) having the highest median family income of $141,250, while families with no earners (31) have the lowest median family income of $31,979, accounting for 5.2% and 27.0% of families, respectively.
| Number of Earners | # Families | Median Income |
| No Earners | 31 (27.0%) | $31,979 |
| 1 Earner | 44 (38.3%) | $58,750 |
| 2 Earners | 34 (29.6%) | $101,250 |
| 3+ Earners | 6 (5.2%) | $141,250 |
| Total | 115 (100.0%) | $65,625 |
Household Income in Almond
Household Income Brackets in Almond
With 34 households falling in the category, the $50,000 to $74,999 income range is the most frequent in Almond, accounting for 20.5% of all households. In contrast, only 4 households (2.4%) fall into the $200,000+ income bracket, making it the least populous group.
| Income Bracket | # Households | % Households |
| Less than $10,000 | 6 | 3.6% |
| $10,000 to $14,999 | 7 | 4.2% |
| $15,000 to $24,999 | 19 | 11.4% |
| $25,000 to $34,999 | 31 | 18.7% |
| $35,000 to $49,999 | 16 | 9.6% |
| $50,000 to $74,999 | 34 | 20.5% |
| $75,000 to $99,999 | 14 | 8.4% |
| $100,000 to $149,999 | 22 | 13.3% |
| $150,000 to $199,999 | 13 | 7.8% |
| $200,000+ | 4 | 2.4% |
Household Income by Householder Age in Almond
The median household income in Almond is $52,000, with the highest median household income of $65,625 found in the 25 to 44 years age bracket for the primary householder. A total of 51 households (30.7%) fall into this category. Meanwhile, the 15 to 24 years age bracket for the primary householder has the lowest median household income of $35,500, with 12 households (7.2%) in this group.
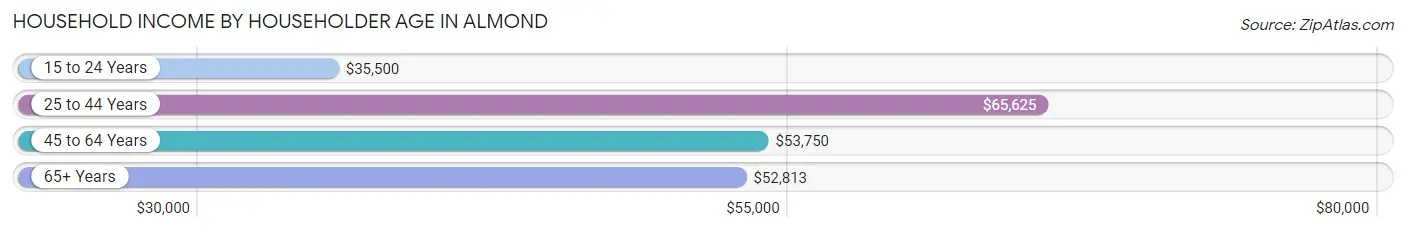
| Income Bracket | # Households | Median Income |
| 15 to 24 Years | 12 (7.2%) | $35,500 |
| 25 to 44 Years | 51 (30.7%) | $65,625 |
| 45 to 64 Years | 58 (34.9%) | $53,750 |
| 65+ Years | 45 (27.1%) | $52,813 |
| Total | 166 (100.0%) | $52,000 |
Poverty in Almond
Income Below Poverty by Sex and Age in Almond
With 18.1% poverty level for males and 22.8% for females among the residents of Almond, under 5 year old males and 12 to 14 year old females are the most vulnerable to poverty, with 4 males (66.7%) and 4 females (66.7%) in their respective age groups living below the poverty level.
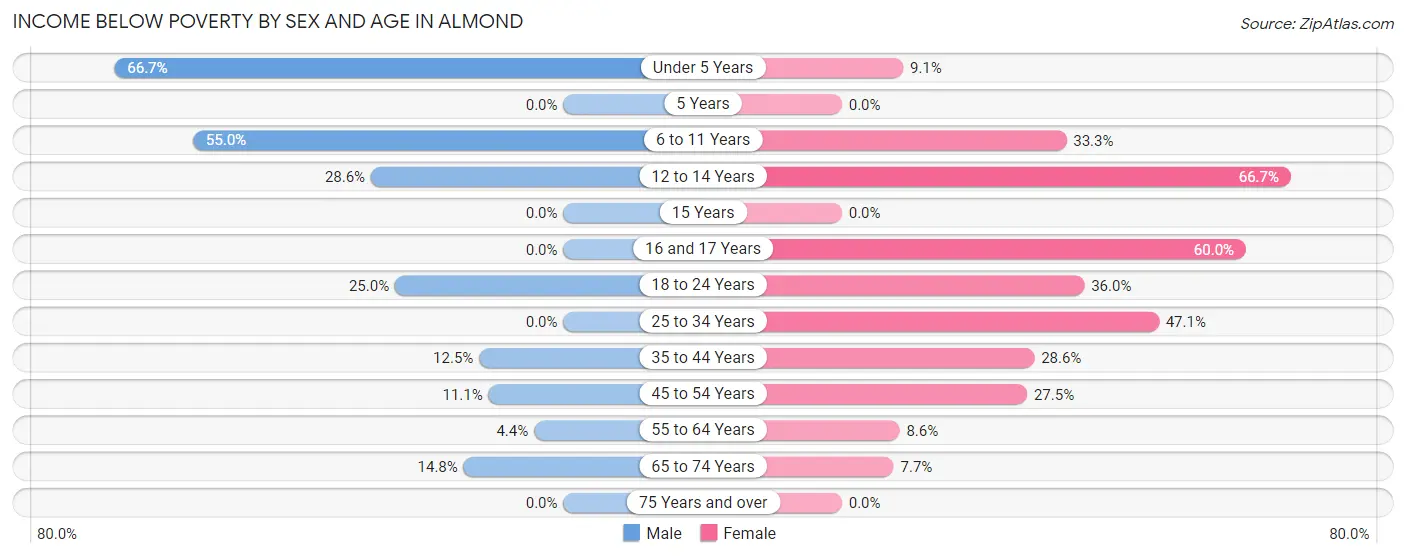
| Age Bracket | Male | Female |
| Under 5 Years | 4 (66.7%) | 2 (9.1%) |
| 5 Years | 0 (0.0%) | 0 (0.0%) |
| 6 to 11 Years | 11 (55.0%) | 5 (33.3%) |
| 12 to 14 Years | 2 (28.6%) | 4 (66.7%) |
| 15 Years | 0 (0.0%) | 0 (0.0%) |
| 16 and 17 Years | 0 (0.0%) | 3 (60.0%) |
| 18 to 24 Years | 6 (25.0%) | 9 (36.0%) |
| 25 to 34 Years | 0 (0.0%) | 8 (47.1%) |
| 35 to 44 Years | 3 (12.5%) | 6 (28.6%) |
| 45 to 54 Years | 2 (11.1%) | 11 (27.5%) |
| 55 to 64 Years | 1 (4.3%) | 3 (8.6%) |
| 65 to 74 Years | 4 (14.8%) | 2 (7.7%) |
| 75 Years and over | 0 (0.0%) | 0 (0.0%) |
| Total | 33 (18.1%) | 53 (22.8%) |
Income Above Poverty by Sex and Age in Almond
According to the poverty statistics in Almond, males aged 5 years and females aged 15 years are the age groups that are most secure financially, with 100.0% of males and 100.0% of females in these age groups living above the poverty line.
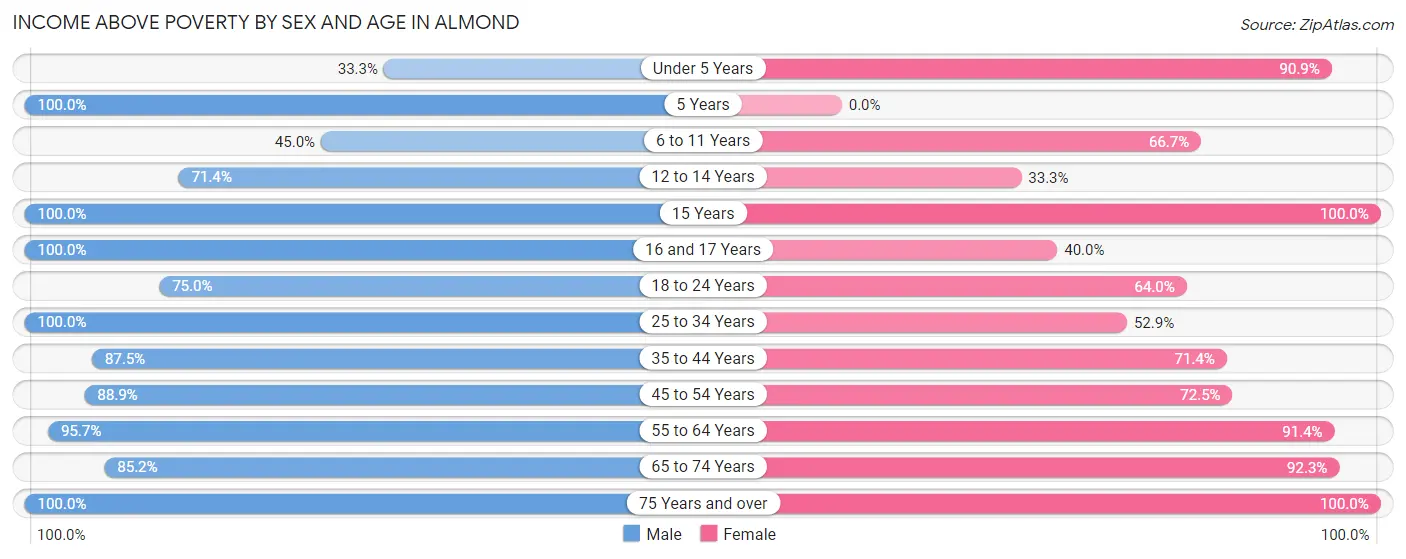
| Age Bracket | Male | Female |
| Under 5 Years | 2 (33.3%) | 20 (90.9%) |
| 5 Years | 2 (100.0%) | 0 (0.0%) |
| 6 to 11 Years | 9 (45.0%) | 10 (66.7%) |
| 12 to 14 Years | 5 (71.4%) | 2 (33.3%) |
| 15 Years | 1 (100.0%) | 8 (100.0%) |
| 16 and 17 Years | 3 (100.0%) | 2 (40.0%) |
| 18 to 24 Years | 18 (75.0%) | 16 (64.0%) |
| 25 to 34 Years | 20 (100.0%) | 9 (52.9%) |
| 35 to 44 Years | 21 (87.5%) | 15 (71.4%) |
| 45 to 54 Years | 16 (88.9%) | 29 (72.5%) |
| 55 to 64 Years | 22 (95.7%) | 32 (91.4%) |
| 65 to 74 Years | 23 (85.2%) | 24 (92.3%) |
| 75 Years and over | 7 (100.0%) | 13 (100.0%) |
| Total | 149 (81.9%) | 180 (77.2%) |
Income Below Poverty Among Married-Couple Families in Almond
The poverty statistics for married-couple families in Almond show that 2.5% or 2 of the total 81 families live below the poverty line. Families with 1 or 2 children have the highest poverty rate of 9.1%, comprising of 2 families. On the other hand, families with no children have the lowest poverty rate of 0.0%, which includes 0 families.
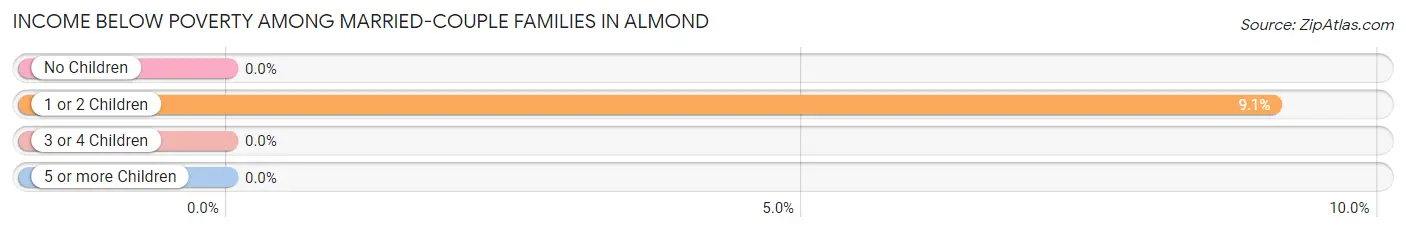
| Children | Above Poverty | Below Poverty |
| No Children | 58 (100.0%) | 0 (0.0%) |
| 1 or 2 Children | 20 (90.9%) | 2 (9.1%) |
| 3 or 4 Children | 1 (100.0%) | 0 (0.0%) |
| 5 or more Children | 0 (0.0%) | 0 (0.0%) |
| Total | 79 (97.5%) | 2 (2.5%) |
Income Below Poverty Among Single-Parent Households in Almond
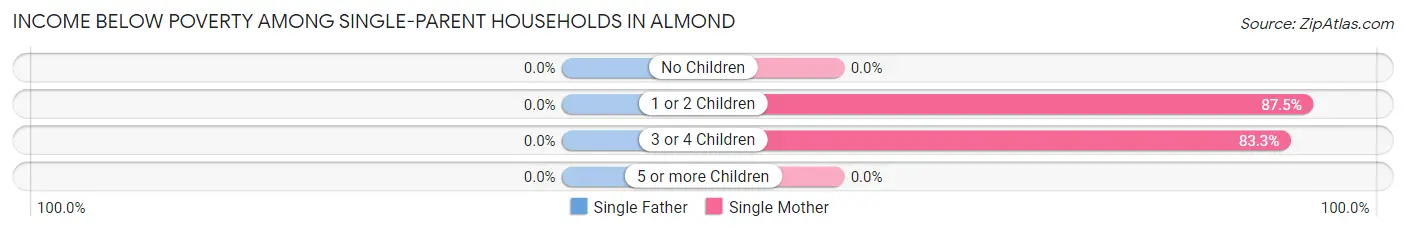
| Children | Single Father | Single Mother |
| No Children | 0 (0.0%) | 0 (0.0%) |
| 1 or 2 Children | 0 (0.0%) | 7 (87.5%) |
| 3 or 4 Children | 0 (0.0%) | 5 (83.3%) |
| 5 or more Children | 0 (0.0%) | 0 (0.0%) |
| Total | 0 (0.0%) | 12 (60.0%) |
Income Below Poverty Among Married-Couple vs Single-Parent Households in Almond
The poverty data for Almond shows that 2 of the married-couple family households (2.5%) and 12 of the single-parent households (35.3%) are living below the poverty level. Within the married-couple family households, those with 1 or 2 children have the highest poverty rate, with 2 households (9.1%) falling below the poverty line. Among the single-parent households, those with 3 or 4 children have the highest poverty rate, with 5 household (83.3%) living below poverty.
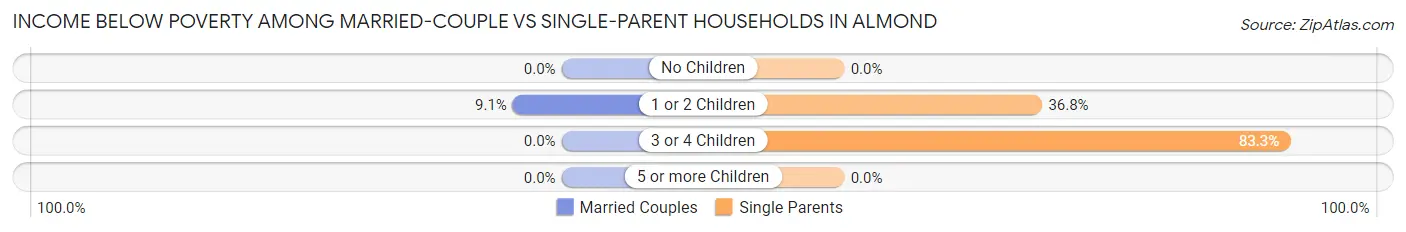
| Children | Married-Couple Families | Single-Parent Households |
| No Children | 0 (0.0%) | 0 (0.0%) |
| 1 or 2 Children | 2 (9.1%) | 7 (36.8%) |
| 3 or 4 Children | 0 (0.0%) | 5 (83.3%) |
| 5 or more Children | 0 (0.0%) | 0 (0.0%) |
| Total | 2 (2.5%) | 12 (35.3%) |
Race in Almond
The most populous races in Almond are White / Caucasian (402 | 96.2%), Asian (10 | 2.4%), and Two or more Races (6 | 1.4%).
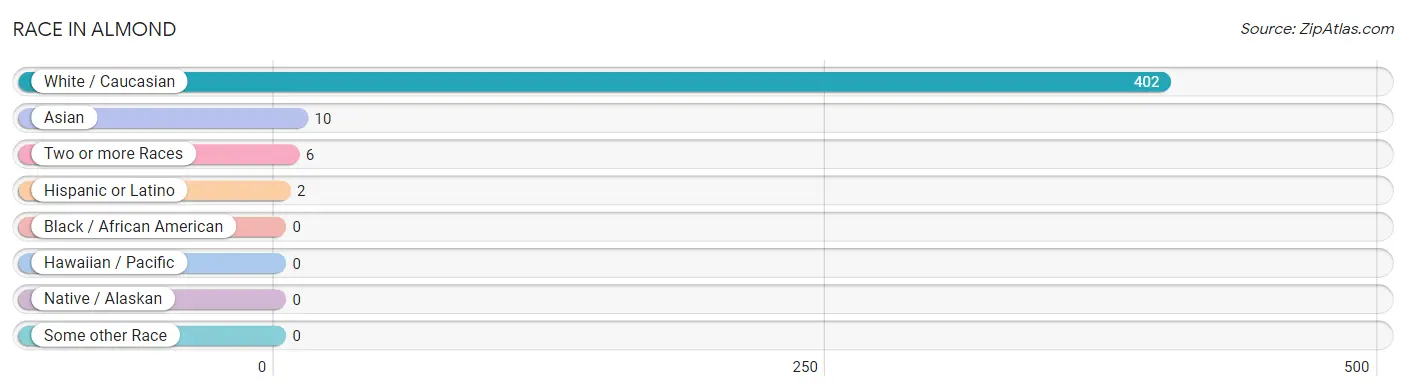
| Race | # Population | % Population |
| Asian | 10 | 2.4% |
| Black / African American | 0 | 0.0% |
| Hawaiian / Pacific | 0 | 0.0% |
| Hispanic or Latino | 2 | 0.5% |
| Native / Alaskan | 0 | 0.0% |
| White / Caucasian | 402 | 96.2% |
| Two or more Races | 6 | 1.4% |
| Some other Race | 0 | 0.0% |
| Total | 418 | 100.0% |
Ancestry in Almond
The most populous ancestries reported in Almond are German (103 | 24.6%), English (72 | 17.2%), Italian (55 | 13.2%), Irish (49 | 11.7%), and Polish (28 | 6.7%), together accounting for 73.4% of all Almond residents.
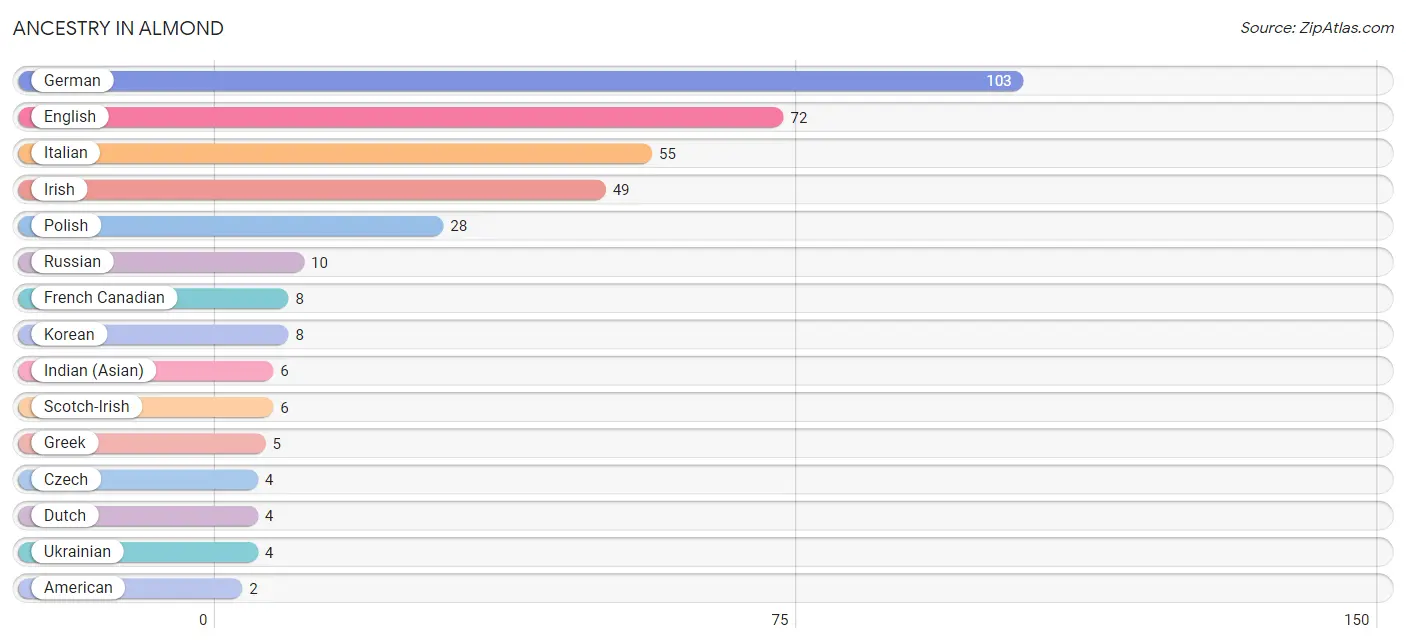
| Ancestry | # Population | % Population |
| American | 2 | 0.5% |
| Arab | 2 | 0.5% |
| British | 2 | 0.5% |
| Cherokee | 1 | 0.2% |
| Czech | 4 | 1.0% |
| Dutch | 4 | 1.0% |
| Eastern European | 1 | 0.2% |
| English | 72 | 17.2% |
| European | 1 | 0.2% |
| French Canadian | 8 | 1.9% |
| German | 103 | 24.6% |
| Greek | 5 | 1.2% |
| Indian (Asian) | 6 | 1.4% |
| Irish | 49 | 11.7% |
| Italian | 55 | 13.2% |
| Korean | 8 | 1.9% |
| Lebanese | 2 | 0.5% |
| Norwegian | 2 | 0.5% |
| Polish | 28 | 6.7% |
| Puerto Rican | 2 | 0.5% |
| Russian | 10 | 2.4% |
| Scotch-Irish | 6 | 1.4% |
| Scottish | 2 | 0.5% |
| Swiss | 2 | 0.5% |
| Ukrainian | 4 | 1.0% |
| Welsh | 2 | 0.5% |
| West Indian | 1 | 0.2% | View All 27 Rows |
Immigrants in Almond
The most numerous immigrant groups reported in Almond came from Asia (8 | 1.9%), China (6 | 1.4%), Eastern Asia (6 | 1.4%), Europe (2 | 0.5%), and France (2 | 0.5%), together accounting for 5.7% of all Almond residents.
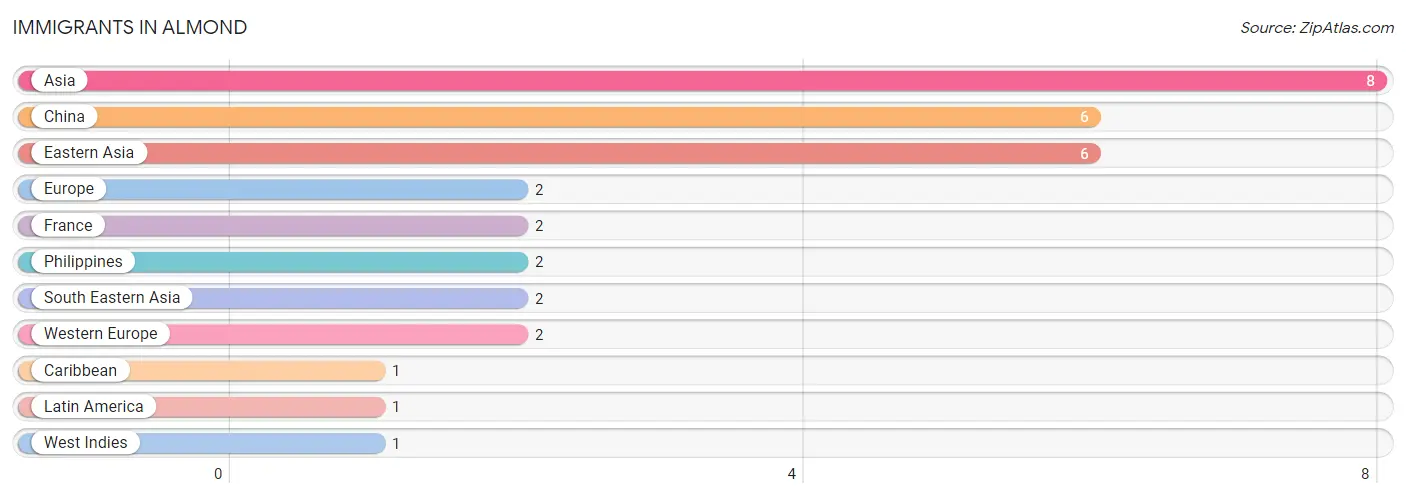
| Immigration Origin | # Population | % Population |
| Asia | 8 | 1.9% |
| Caribbean | 1 | 0.2% |
| China | 6 | 1.4% |
| Eastern Asia | 6 | 1.4% |
| Europe | 2 | 0.5% |
| France | 2 | 0.5% |
| Latin America | 1 | 0.2% |
| Philippines | 2 | 0.5% |
| South Eastern Asia | 2 | 0.5% |
| West Indies | 1 | 0.2% |
| Western Europe | 2 | 0.5% | View All 11 Rows |
Sex and Age in Almond
Sex and Age in Almond
The most populous age groups in Almond are 20 to 24 Years (24 | 13.2%) for men and 55 to 59 Years (30 | 12.7%) for women.
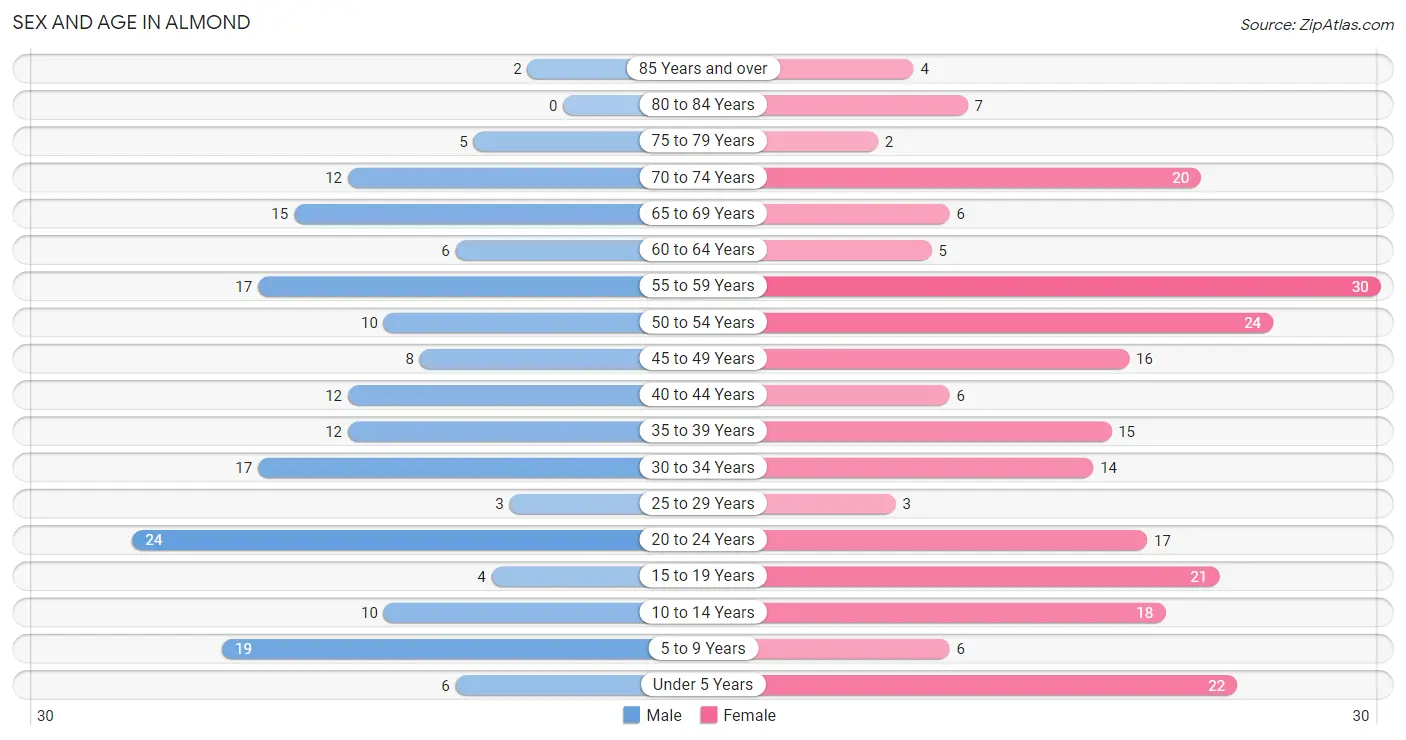
| Age Bracket | Male | Female |
| Under 5 Years | 6 (3.3%) | 22 (9.3%) |
| 5 to 9 Years | 19 (10.4%) | 6 (2.5%) |
| 10 to 14 Years | 10 (5.5%) | 18 (7.6%) |
| 15 to 19 Years | 4 (2.2%) | 21 (8.9%) |
| 20 to 24 Years | 24 (13.2%) | 17 (7.2%) |
| 25 to 29 Years | 3 (1.7%) | 3 (1.3%) |
| 30 to 34 Years | 17 (9.3%) | 14 (5.9%) |
| 35 to 39 Years | 12 (6.6%) | 15 (6.4%) |
| 40 to 44 Years | 12 (6.6%) | 6 (2.5%) |
| 45 to 49 Years | 8 (4.4%) | 16 (6.8%) |
| 50 to 54 Years | 10 (5.5%) | 24 (10.2%) |
| 55 to 59 Years | 17 (9.3%) | 30 (12.7%) |
| 60 to 64 Years | 6 (3.3%) | 5 (2.1%) |
| 65 to 69 Years | 15 (8.2%) | 6 (2.5%) |
| 70 to 74 Years | 12 (6.6%) | 20 (8.5%) |
| 75 to 79 Years | 5 (2.8%) | 2 (0.9%) |
| 80 to 84 Years | 0 (0.0%) | 7 (3.0%) |
| 85 Years and over | 2 (1.1%) | 4 (1.7%) |
| Total | 182 (100.0%) | 236 (100.0%) |
Families and Households in Almond
Median Family Size in Almond
The median family size in Almond is 2.88 persons per family, with single female/mother families (20 | 17.4%) accounting for the largest median family size of 3.2 persons per family. On the other hand, single male/father families (14 | 12.2%) represent the smallest median family size with 2.50 persons per family.
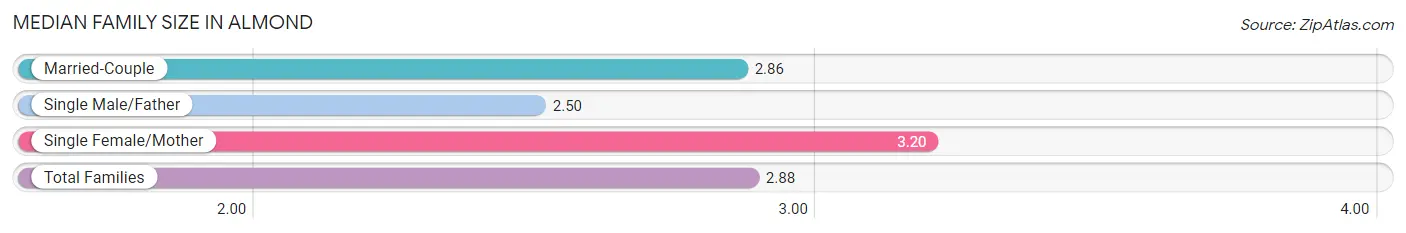
| Family Type | # Families | Family Size |
| Married-Couple | 81 (70.4%) | 2.86 |
| Single Male/Father | 14 (12.2%) | 2.50 |
| Single Female/Mother | 20 (17.4%) | 3.20 |
| Total Families | 115 (100.0%) | 2.88 |
Median Household Size in Almond
The median household size in Almond is 2.51 persons per household, with single male/father households (14 | 8.4%) accounting for the largest median household size of 3.57 persons per household. non-family households (51 | 30.7%) represent the smallest median household size with 1.12 persons per household.
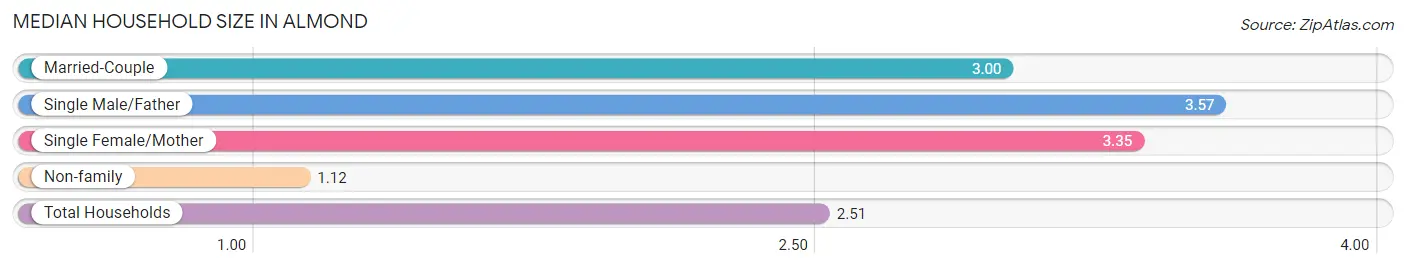
| Household Type | # Households | Household Size |
| Married-Couple | 81 (48.8%) | 3.00 |
| Single Male/Father | 14 (8.4%) | 3.57 |
| Single Female/Mother | 20 (12.0%) | 3.35 |
| Non-family | 51 (30.7%) | 1.12 |
| Total Households | 166 (100.0%) | 2.51 |
Household Size by Marriage Status in Almond
Out of a total of 166 households in Almond, 115 (69.3%) are family households, while 51 (30.7%) are nonfamily households. The most numerous type of family households are 2-person households, comprising 63, and the most common type of nonfamily households are 1-person households, comprising 47.
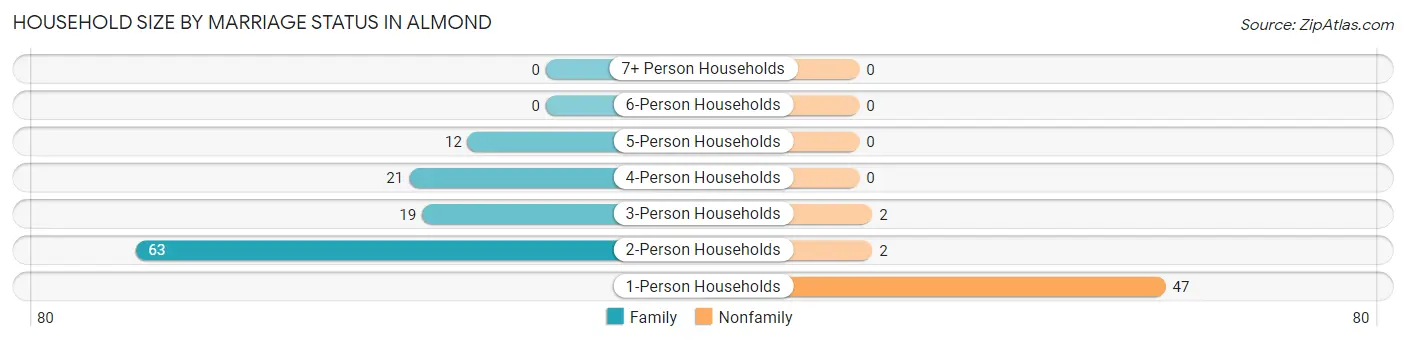
| Household Size | Family Households | Nonfamily Households |
| 1-Person Households | - | 47 (28.3%) |
| 2-Person Households | 63 (38.0%) | 2 (1.2%) |
| 3-Person Households | 19 (11.5%) | 2 (1.2%) |
| 4-Person Households | 21 (12.7%) | 0 (0.0%) |
| 5-Person Households | 12 (7.2%) | 0 (0.0%) |
| 6-Person Households | 0 (0.0%) | 0 (0.0%) |
| 7+ Person Households | 0 (0.0%) | 0 (0.0%) |
| Total | 115 (69.3%) | 51 (30.7%) |
Female Fertility in Almond
Fertility by Age in Almond
Average fertility rate in Almond is 43.0 births per 1,000 women. Women in the age bracket of 35 to 50 years have the highest fertility rate with 108.0 births per 1,000 women. Women in the age bracket of 35 to 50 years acount for 100.0% of all women with births.
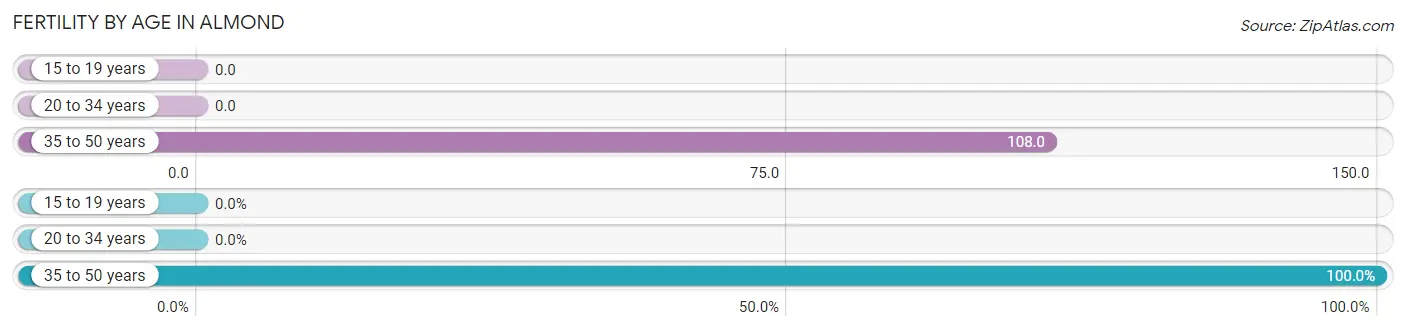
| Age Bracket | Women with Births | Births / 1,000 Women |
| 15 to 19 years | 0 (0.0%) | 0.0 |
| 20 to 34 years | 0 (0.0%) | 0.0 |
| 35 to 50 years | 4 (100.0%) | 108.0 |
| Total | 4 (100.0%) | 43.0 |
Fertility by Age by Marriage Status in Almond
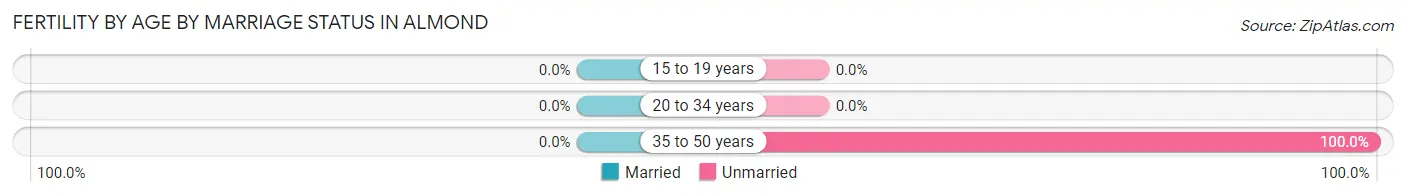
| Age Bracket | Married | Unmarried |
| 15 to 19 years | 0 (0.0%) | 0 (0.0%) |
| 20 to 34 years | 0 (0.0%) | 0 (0.0%) |
| 35 to 50 years | 0 (0.0%) | 4 (100.0%) |
| Total | 0 (0.0%) | 4 (100.0%) |
Fertility by Education in Almond
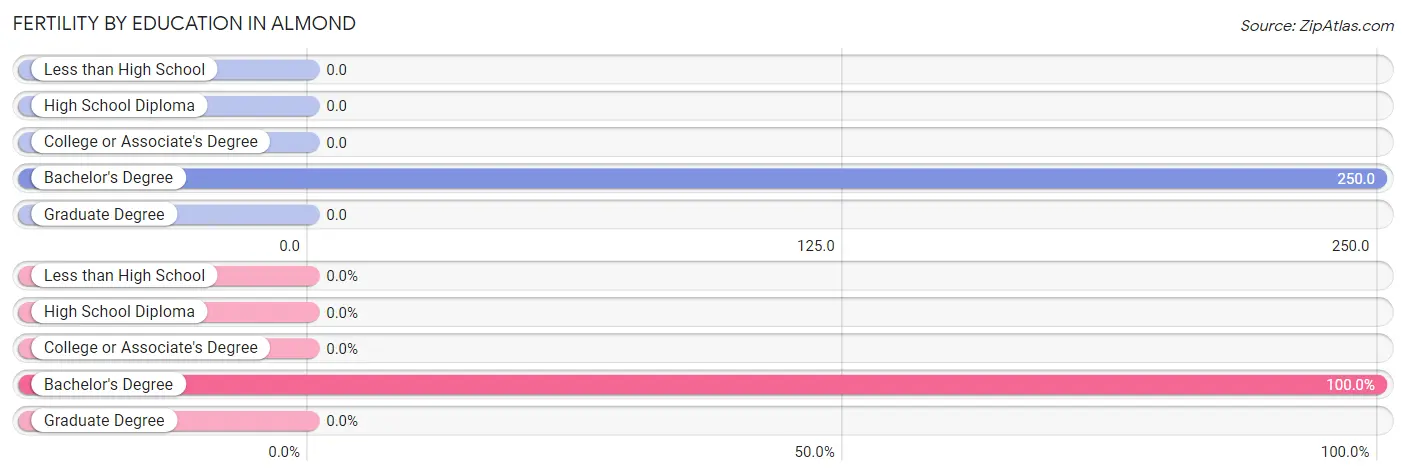
| Educational Attainment | Women with Births | Births / 1,000 Women |
| Less than High School | 0 (0.0%) | 0.0 |
| High School Diploma | 0 (0.0%) | 0.0 |
| College or Associate's Degree | 0 (0.0%) | 0.0 |
| Bachelor's Degree | 4 (100.0%) | 250.0 |
| Graduate Degree | 0 (0.0%) | 0.0 |
| Total | 4 (100.0%) | 43.0 |
Fertility by Education by Marriage Status in Almond
| Educational Attainment | Married | Unmarried |
| Less than High School | 0 (0.0%) | 0 (0.0%) |
| High School Diploma | 0 (0.0%) | 0 (0.0%) |
| College or Associate's Degree | 0 (0.0%) | 0 (0.0%) |
| Bachelor's Degree | 0 (0.0%) | 4 (100.0%) |
| Graduate Degree | 0 (0.0%) | 0 (0.0%) |
| Total | 0 (0.0%) | 4 (100.0%) |
Employment Characteristics in Almond
Employment by Class of Employer in Almond
Among the 180 employed individuals in Almond, private company employees (99 | 55.0%), not-for-profit organizations (32 | 17.8%), and local government employees (29 | 16.1%) make up the most common classes of employment.
| Employer Class | # Employees | % Employees |
| Private Company Employees | 99 | 55.0% |
| Self-Employed (Incorporated) | 0 | 0.0% |
| Self-Employed (Not Incorporated) | 2 | 1.1% |
| Not-for-profit Organizations | 32 | 17.8% |
| Local Government Employees | 29 | 16.1% |
| State Government Employees | 15 | 8.3% |
| Federal Government Employees | 0 | 0.0% |
| Unpaid Family Workers | 3 | 1.7% |
| Total | 180 | 100.0% |
Employment Status by Age in Almond
According to the labor force statistics for Almond, out of the total population over 16 years of age (328), 58.5% or 192 individuals are in the labor force, with 4.7% or 9 of them unemployed. The age group with the highest labor force participation rate is 20 to 24 years, with 100.0% or 41 individuals in the labor force. Within the labor force, the 45 to 54 years age range has the highest percentage of unemployed individuals, with 10.8% or 4 of them being unemployed.
| Age Bracket | In Labor Force | Unemployed |
| 16 to 19 Years | 6 (37.5%) | 0 (0.0%) |
| 20 to 24 Years | 41 (100.0%) | 4 (9.8%) |
| 25 to 29 Years | 3 (50.0%) | 0 (0.0%) |
| 30 to 34 Years | 28 (90.3%) | 0 (0.0%) |
| 35 to 44 Years | 32 (71.1%) | 1 (3.1%) |
| 45 to 54 Years | 37 (63.8%) | 4 (10.8%) |
| 55 to 59 Years | 27 (57.4%) | 0 (0.0%) |
| 60 to 64 Years | 9 (81.8%) | 0 (0.0%) |
| 65 to 74 Years | 8 (15.1%) | 0 (0.0%) |
| 75 Years and over | 1 (5.0%) | 0 (0.0%) |
| Total | 192 (58.5%) | 9 (4.7%) |
Employment Status by Educational Attainment in Almond
According to labor force statistics for Almond, 68.7% of individuals (136) out of the total population between 25 and 64 years of age (198) are in the labor force, with 3.7% or 5 of them being unemployed. The group with the highest labor force participation rate are those with the educational attainment of bachelor's degree or higher, with 87.1% or 54 individuals in the labor force. Within the labor force, individuals with bachelor's degree or higher education have the highest percentage of unemployment, with 7.4% or 4 of them being unemployed.
| Educational Attainment | In Labor Force | Unemployed |
| Less than High School | 0 (0.0%) | 0 (0.0%) |
| High School Diploma | 39 (66.1%) | 2 (2.6%) |
| College / Associate Degree | 43 (72.9%) | 0 (0.0%) |
| Bachelor's Degree or higher | 54 (87.1%) | 5 (7.4%) |
| Total | 136 (68.7%) | 7 (3.7%) |
Employment Occupations by Sex in Almond
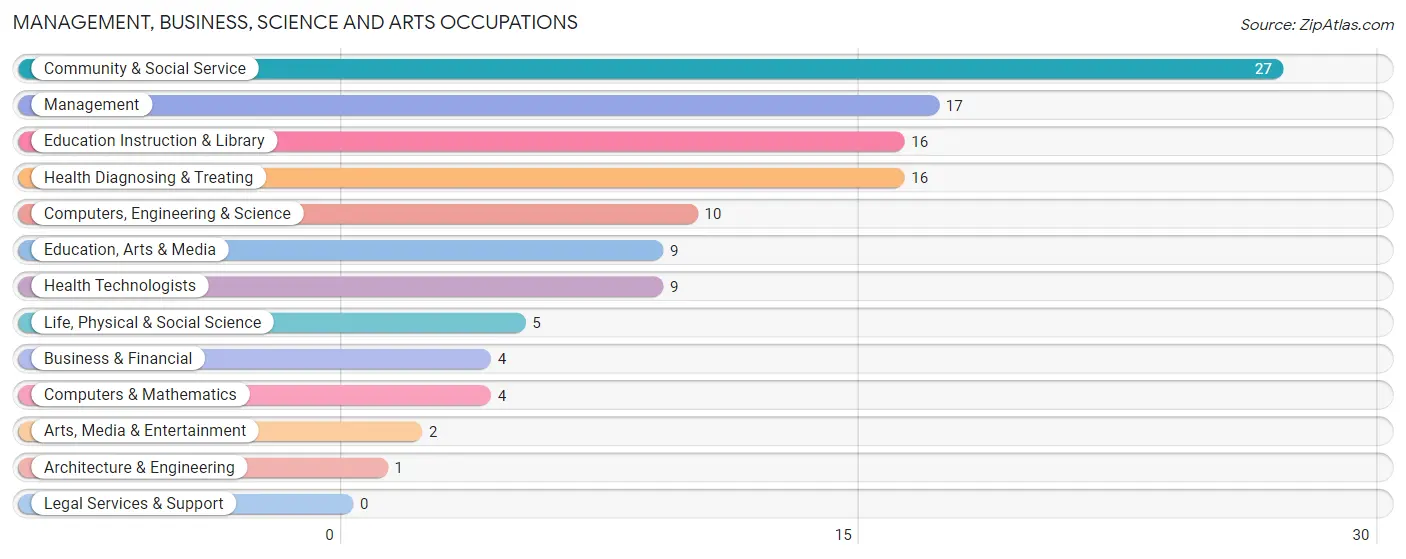
Management, Business, Science and Arts Occupations
The most common Management, Business, Science and Arts occupations in Almond are Community & Social Service (27 | 14.7%), Management (17 | 9.3%), Education Instruction & Library (16 | 8.7%), Health Diagnosing & Treating (16 | 8.7%), and Computers, Engineering & Science (10 | 5.5%).
Management, Business, Science and Arts Occupations by Sex
Within the Management, Business, Science and Arts occupations in Almond, the most male-oriented occupations are Computers & Mathematics (100.0%), Architecture & Engineering (100.0%), and Education, Arts & Media (100.0%), while the most female-oriented occupations are Life, Physical & Social Science (100.0%), Education Instruction & Library (81.2%), and Health Technologists (66.7%).
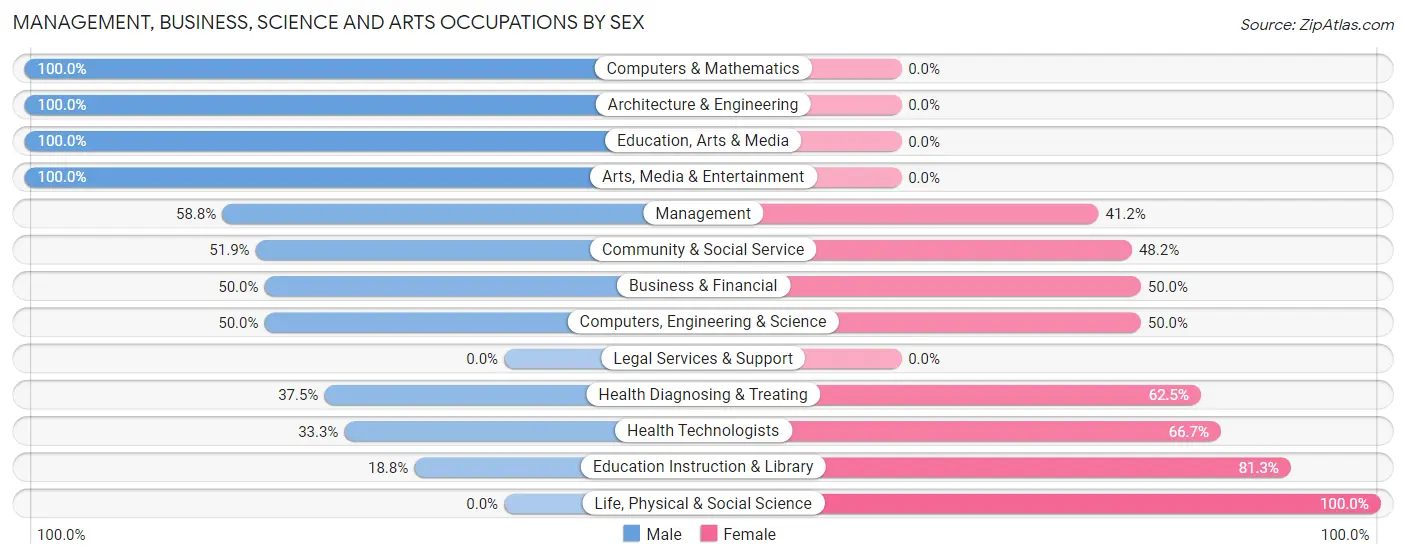
| Occupation | Male | Female |
| Management | 10 (58.8%) | 7 (41.2%) |
| Business & Financial | 2 (50.0%) | 2 (50.0%) |
| Computers, Engineering & Science | 5 (50.0%) | 5 (50.0%) |
| Computers & Mathematics | 4 (100.0%) | 0 (0.0%) |
| Architecture & Engineering | 1 (100.0%) | 0 (0.0%) |
| Life, Physical & Social Science | 0 (0.0%) | 5 (100.0%) |
| Community & Social Service | 14 (51.8%) | 13 (48.1%) |
| Education, Arts & Media | 9 (100.0%) | 0 (0.0%) |
| Legal Services & Support | 0 (0.0%) | 0 (0.0%) |
| Education Instruction & Library | 3 (18.8%) | 13 (81.2%) |
| Arts, Media & Entertainment | 2 (100.0%) | 0 (0.0%) |
| Health Diagnosing & Treating | 6 (37.5%) | 10 (62.5%) |
| Health Technologists | 3 (33.3%) | 6 (66.7%) |
| Total (Category) | 37 (50.0%) | 37 (50.0%) |
| Total (Overall) | 96 (52.5%) | 87 (47.5%) |
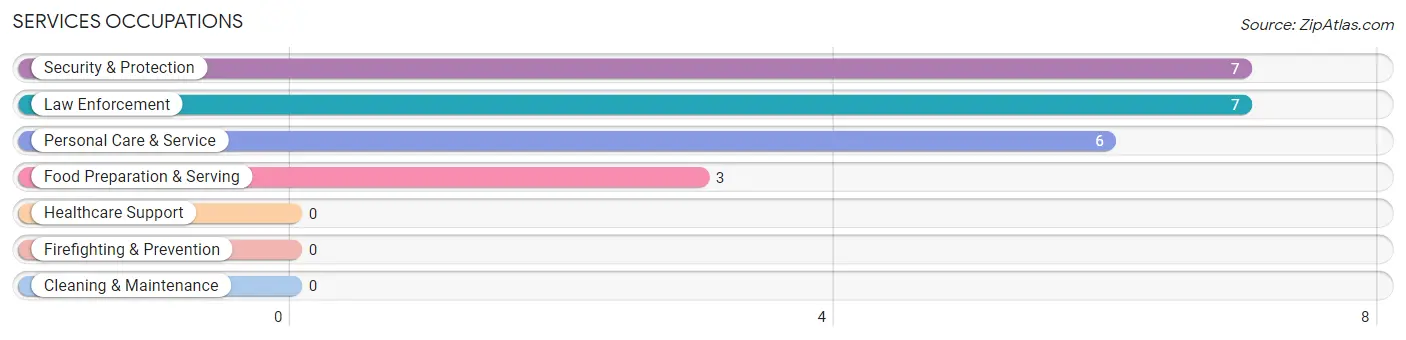
Services Occupations
The most common Services occupations in Almond are Security & Protection (7 | 3.8%), Law Enforcement (7 | 3.8%), Personal Care & Service (6 | 3.3%), and Food Preparation & Serving (3 | 1.6%).
Services Occupations by Sex
Within the Services occupations in Almond, the most male-oriented occupations are Security & Protection (100.0%), and Law Enforcement (100.0%), while the most female-oriented occupations are Food Preparation & Serving (100.0%), and Personal Care & Service (100.0%).
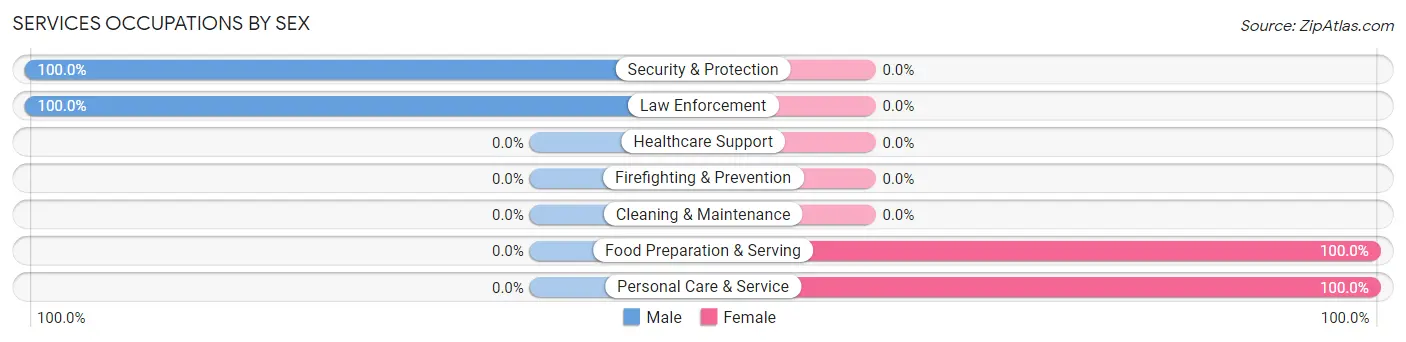
| Occupation | Male | Female |
| Healthcare Support | 0 (0.0%) | 0 (0.0%) |
| Security & Protection | 7 (100.0%) | 0 (0.0%) |
| Firefighting & Prevention | 0 (0.0%) | 0 (0.0%) |
| Law Enforcement | 7 (100.0%) | 0 (0.0%) |
| Food Preparation & Serving | 0 (0.0%) | 3 (100.0%) |
| Cleaning & Maintenance | 0 (0.0%) | 0 (0.0%) |
| Personal Care & Service | 0 (0.0%) | 6 (100.0%) |
| Total (Category) | 7 (43.8%) | 9 (56.2%) |
| Total (Overall) | 96 (52.5%) | 87 (47.5%) |
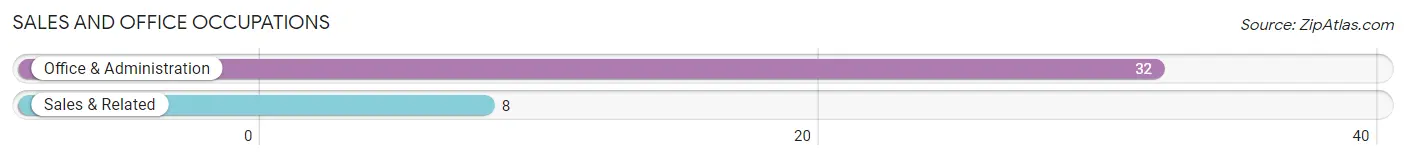
Sales and Office Occupations
The most common Sales and Office occupations in Almond are Office & Administration (32 | 17.5%), and Sales & Related (8 | 4.4%).
Sales and Office Occupations by Sex
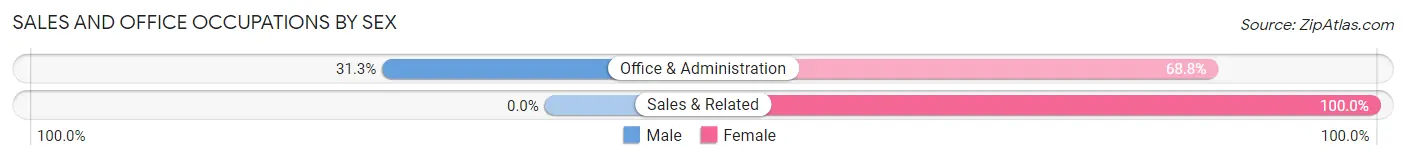
| Occupation | Male | Female |
| Sales & Related | 0 (0.0%) | 8 (100.0%) |
| Office & Administration | 10 (31.2%) | 22 (68.8%) |
| Total (Category) | 10 (25.0%) | 30 (75.0%) |
| Total (Overall) | 96 (52.5%) | 87 (47.5%) |
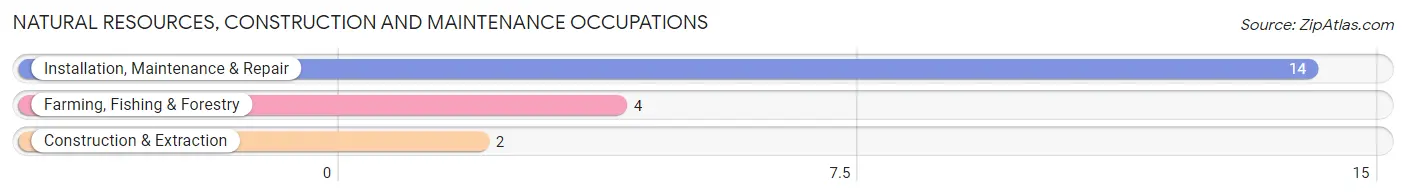
Natural Resources, Construction and Maintenance Occupations
The most common Natural Resources, Construction and Maintenance occupations in Almond are Installation, Maintenance & Repair (14 | 7.6%), Farming, Fishing & Forestry (4 | 2.2%), and Construction & Extraction (2 | 1.1%).
Natural Resources, Construction and Maintenance Occupations by Sex
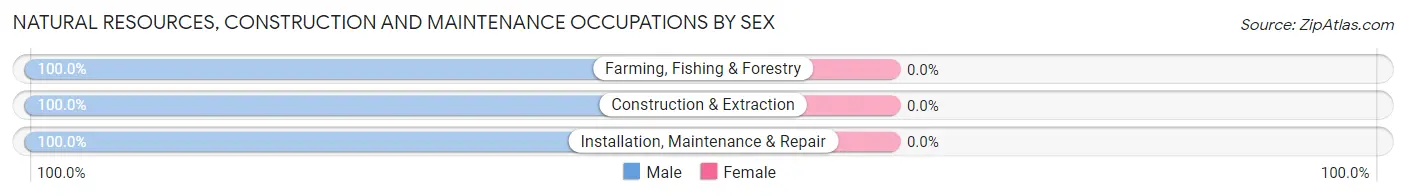
| Occupation | Male | Female |
| Farming, Fishing & Forestry | 4 (100.0%) | 0 (0.0%) |
| Construction & Extraction | 2 (100.0%) | 0 (0.0%) |
| Installation, Maintenance & Repair | 14 (100.0%) | 0 (0.0%) |
| Total (Category) | 20 (100.0%) | 0 (0.0%) |
| Total (Overall) | 96 (52.5%) | 87 (47.5%) |
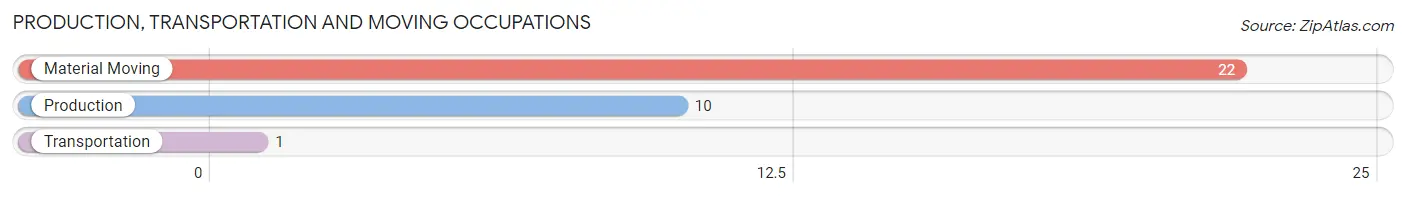
Production, Transportation and Moving Occupations
The most common Production, Transportation and Moving occupations in Almond are Material Moving (22 | 12.0%), Production (10 | 5.5%), and Transportation (1 | 0.5%).
Production, Transportation and Moving Occupations by Sex
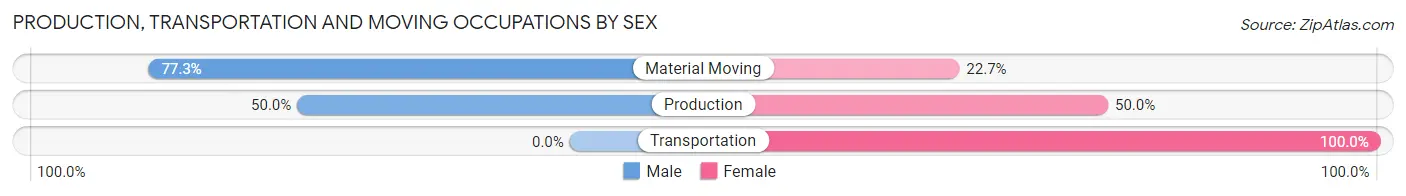
| Occupation | Male | Female |
| Production | 5 (50.0%) | 5 (50.0%) |
| Transportation | 0 (0.0%) | 1 (100.0%) |
| Material Moving | 17 (77.3%) | 5 (22.7%) |
| Total (Category) | 22 (66.7%) | 11 (33.3%) |
| Total (Overall) | 96 (52.5%) | 87 (47.5%) |
Employment Industries by Sex in Almond
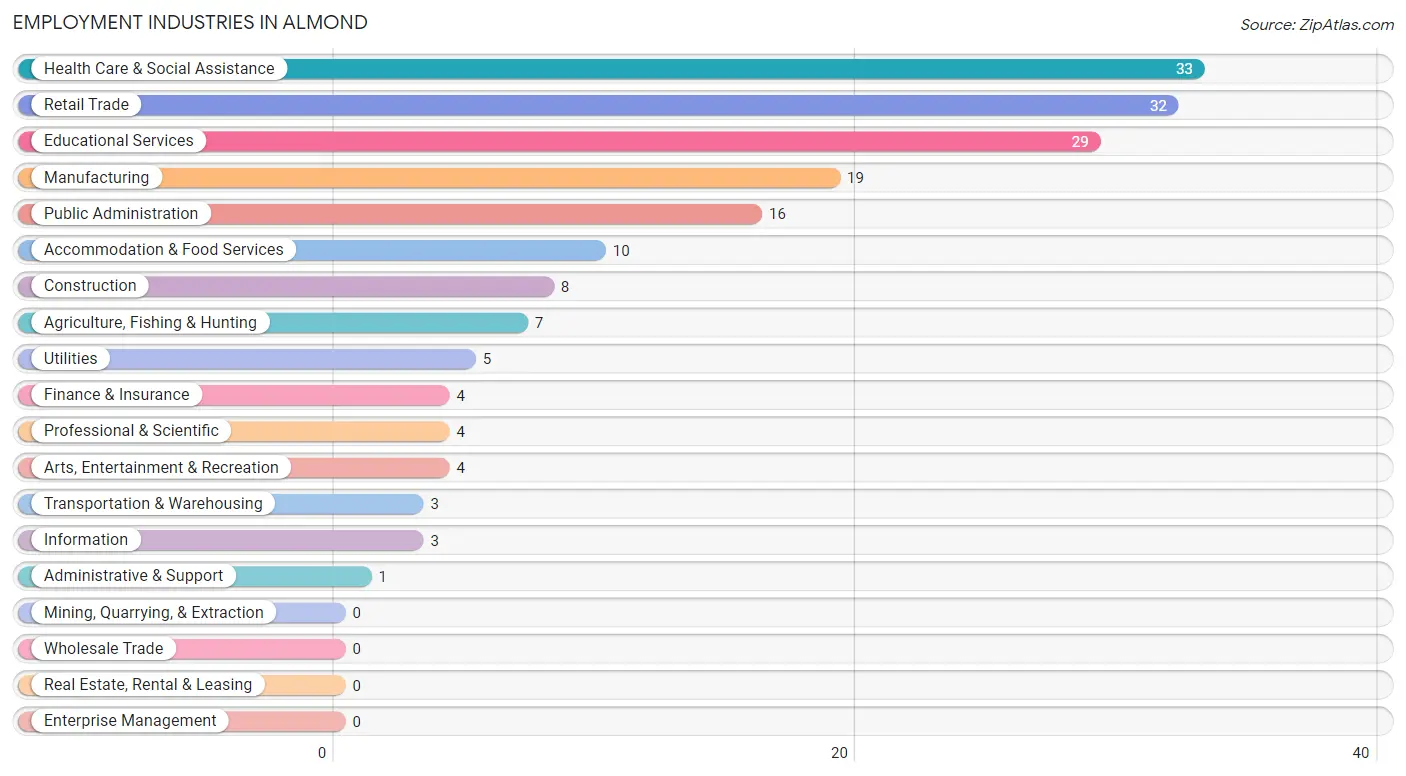
Employment Industries in Almond
The major employment industries in Almond include Health Care & Social Assistance (33 | 18.0%), Retail Trade (32 | 17.5%), Educational Services (29 | 15.9%), Manufacturing (19 | 10.4%), and Public Administration (16 | 8.7%).
Employment Industries by Sex in Almond
The Almond industries that see more men than women are Construction (100.0%), Utilities (100.0%), and Information (100.0%), whereas the industries that tend to have a higher number of women are Finance & Insurance (100.0%), Professional & Scientific (100.0%), and Administrative & Support (100.0%).
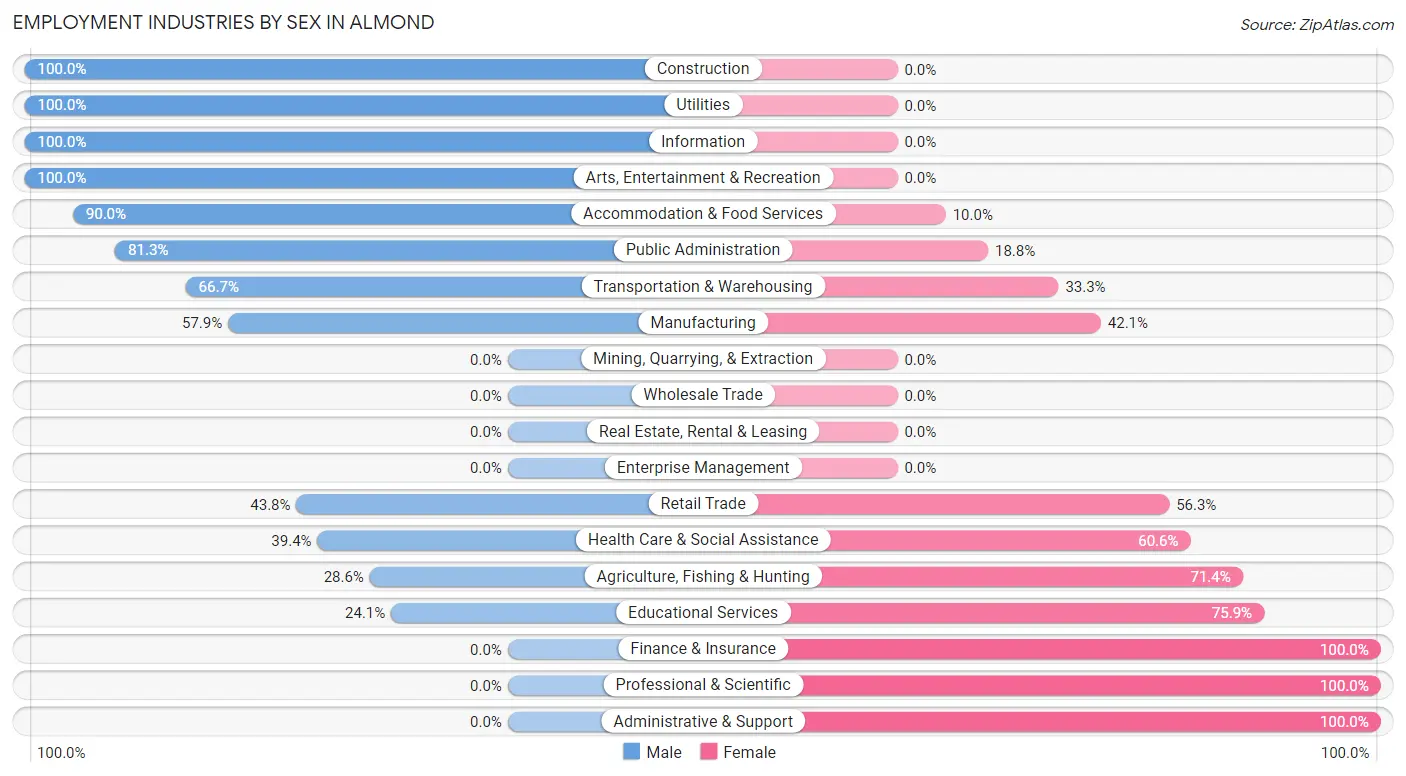
| Industry | Male | Female |
| Agriculture, Fishing & Hunting | 2 (28.6%) | 5 (71.4%) |
| Mining, Quarrying, & Extraction | 0 (0.0%) | 0 (0.0%) |
| Construction | 8 (100.0%) | 0 (0.0%) |
| Manufacturing | 11 (57.9%) | 8 (42.1%) |
| Wholesale Trade | 0 (0.0%) | 0 (0.0%) |
| Retail Trade | 14 (43.8%) | 18 (56.2%) |
| Transportation & Warehousing | 2 (66.7%) | 1 (33.3%) |
| Utilities | 5 (100.0%) | 0 (0.0%) |
| Information | 3 (100.0%) | 0 (0.0%) |
| Finance & Insurance | 0 (0.0%) | 4 (100.0%) |
| Real Estate, Rental & Leasing | 0 (0.0%) | 0 (0.0%) |
| Professional & Scientific | 0 (0.0%) | 4 (100.0%) |
| Enterprise Management | 0 (0.0%) | 0 (0.0%) |
| Administrative & Support | 0 (0.0%) | 1 (100.0%) |
| Educational Services | 7 (24.1%) | 22 (75.9%) |
| Health Care & Social Assistance | 13 (39.4%) | 20 (60.6%) |
| Arts, Entertainment & Recreation | 4 (100.0%) | 0 (0.0%) |
| Accommodation & Food Services | 9 (90.0%) | 1 (10.0%) |
| Public Administration | 13 (81.2%) | 3 (18.8%) |
| Total | 96 (52.5%) | 87 (47.5%) |
Education in Almond
School Enrollment in Almond
The most common levels of schooling among the 88 students in Almond are middle school (26 | 29.5%), elementary school (23 | 26.1%), and high school (22 | 25.0%).
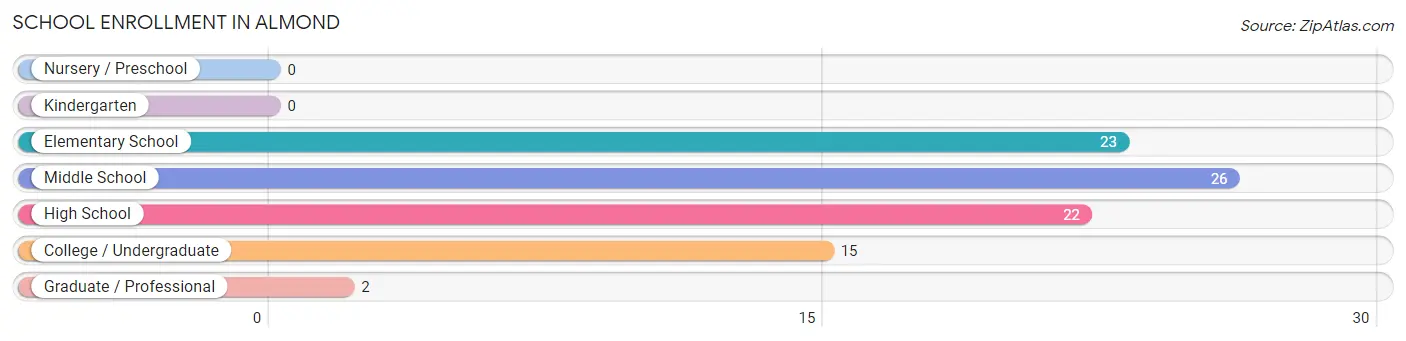
| School Level | # Students | % Students |
| Nursery / Preschool | 0 | 0.0% |
| Kindergarten | 0 | 0.0% |
| Elementary School | 23 | 26.1% |
| Middle School | 26 | 29.5% |
| High School | 22 | 25.0% |
| College / Undergraduate | 15 | 17.1% |
| Graduate / Professional | 2 | 2.3% |
| Total | 88 | 100.0% |
School Enrollment by Age by Funding Source in Almond
Out of a total of 88 students who are enrolled in schools in Almond, 10 (11.4%) attend a private institution, while the remaining 78 (88.6%) are enrolled in public schools. The age group of 35 years and over has the highest likelihood of being enrolled in private schools, with 6 (100.0% in the age bracket) enrolled. Conversely, the age group of 10 to 14 year olds has the lowest likelihood of being enrolled in a private school, with 28 (100.0% in the age bracket) attending a public institution.
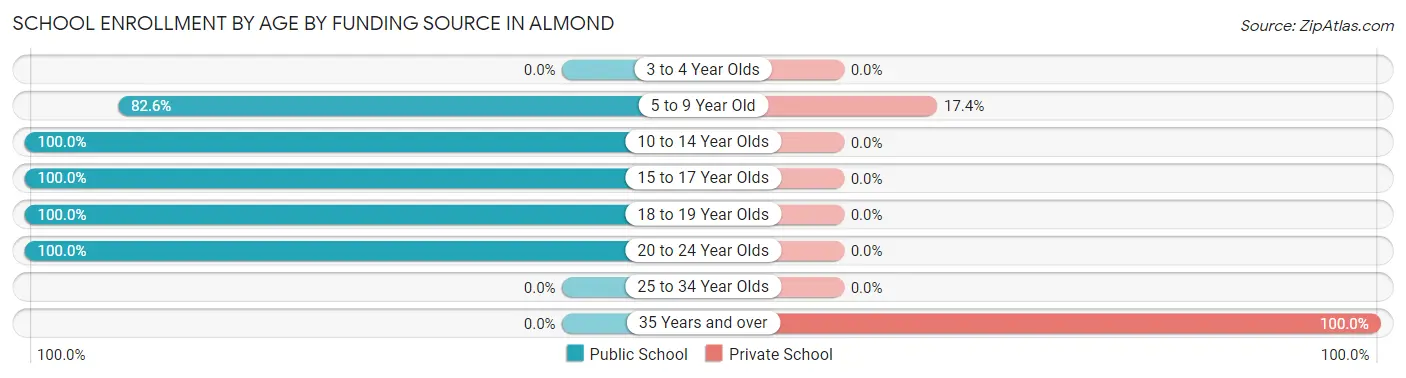
| Age Bracket | Public School | Private School |
| 3 to 4 Year Olds | 0 (0.0%) | 0 (0.0%) |
| 5 to 9 Year Old | 19 (82.6%) | 4 (17.4%) |
| 10 to 14 Year Olds | 28 (100.0%) | 0 (0.0%) |
| 15 to 17 Year Olds | 17 (100.0%) | 0 (0.0%) |
| 18 to 19 Year Olds | 4 (100.0%) | 0 (0.0%) |
| 20 to 24 Year Olds | 10 (100.0%) | 0 (0.0%) |
| 25 to 34 Year Olds | 0 (0.0%) | 0 (0.0%) |
| 35 Years and over | 0 (0.0%) | 6 (100.0%) |
| Total | 78 (88.6%) | 10 (11.4%) |
Educational Attainment by Field of Study in Almond
Education (21 | 30.4%), psychology (11 | 15.9%), physical & health sciences (10 | 14.5%), literature & languages (5 | 7.2%), and bio, nature & agricultural (3 | 4.3%) are the most common fields of study among 69 individuals in Almond who have obtained a bachelor's degree or higher.
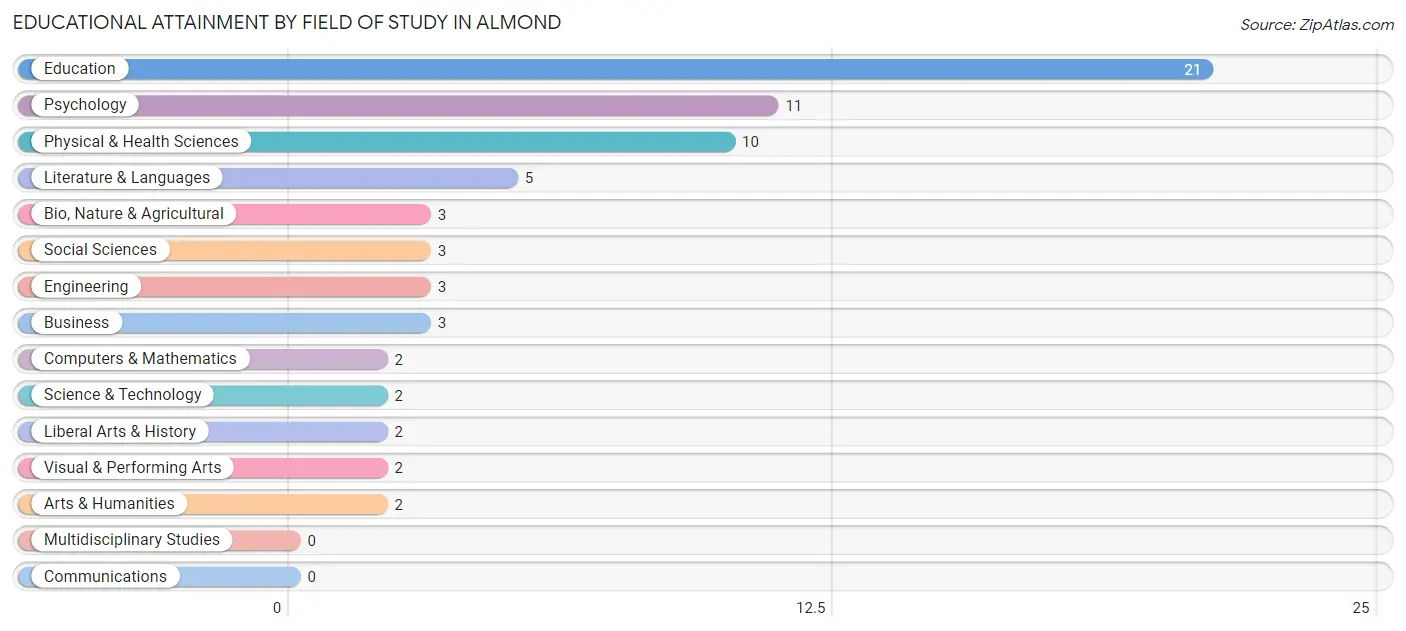
| Field of Study | # Graduates | % Graduates |
| Computers & Mathematics | 2 | 2.9% |
| Bio, Nature & Agricultural | 3 | 4.3% |
| Physical & Health Sciences | 10 | 14.5% |
| Psychology | 11 | 15.9% |
| Social Sciences | 3 | 4.3% |
| Engineering | 3 | 4.3% |
| Multidisciplinary Studies | 0 | 0.0% |
| Science & Technology | 2 | 2.9% |
| Business | 3 | 4.3% |
| Education | 21 | 30.4% |
| Literature & Languages | 5 | 7.2% |
| Liberal Arts & History | 2 | 2.9% |
| Visual & Performing Arts | 2 | 2.9% |
| Communications | 0 | 0.0% |
| Arts & Humanities | 2 | 2.9% |
| Total | 69 | 100.0% |
Transportation & Commute in Almond
Vehicle Availability by Sex in Almond
The most prevalent vehicle ownership categories in Almond are males with 2 vehicles (46, accounting for 48.4%) and females with 2 vehicles (37, making up 54.8%).
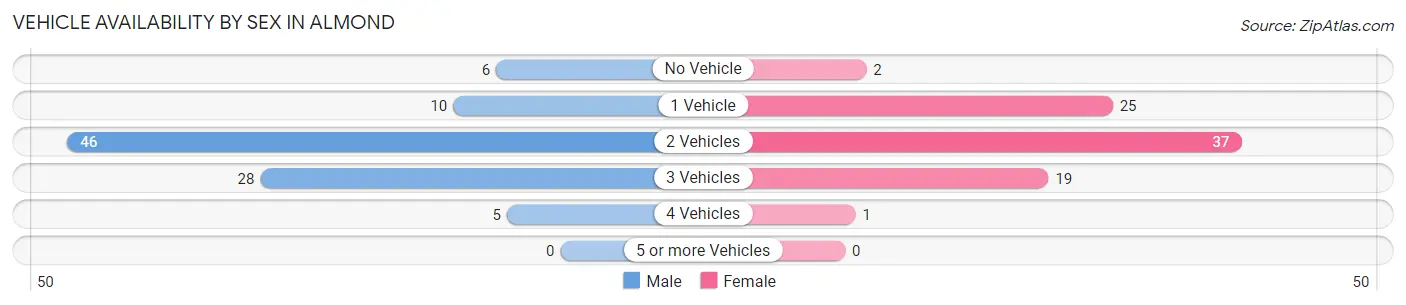
| Vehicles Available | Male | Female |
| No Vehicle | 6 (6.3%) | 2 (2.4%) |
| 1 Vehicle | 10 (10.5%) | 25 (29.8%) |
| 2 Vehicles | 46 (48.4%) | 37 (44.1%) |
| 3 Vehicles | 28 (29.5%) | 19 (22.6%) |
| 4 Vehicles | 5 (5.3%) | 1 (1.2%) |
| 5 or more Vehicles | 0 (0.0%) | 0 (0.0%) |
| Total | 95 (100.0%) | 84 (100.0%) |
Commute Time in Almond
The most frequently occuring commute durations in Almond are 10 to 14 minutes (62 commuters, 36.3%), 5 to 9 minutes (27 commuters, 15.8%), and 15 to 19 minutes (25 commuters, 14.6%).
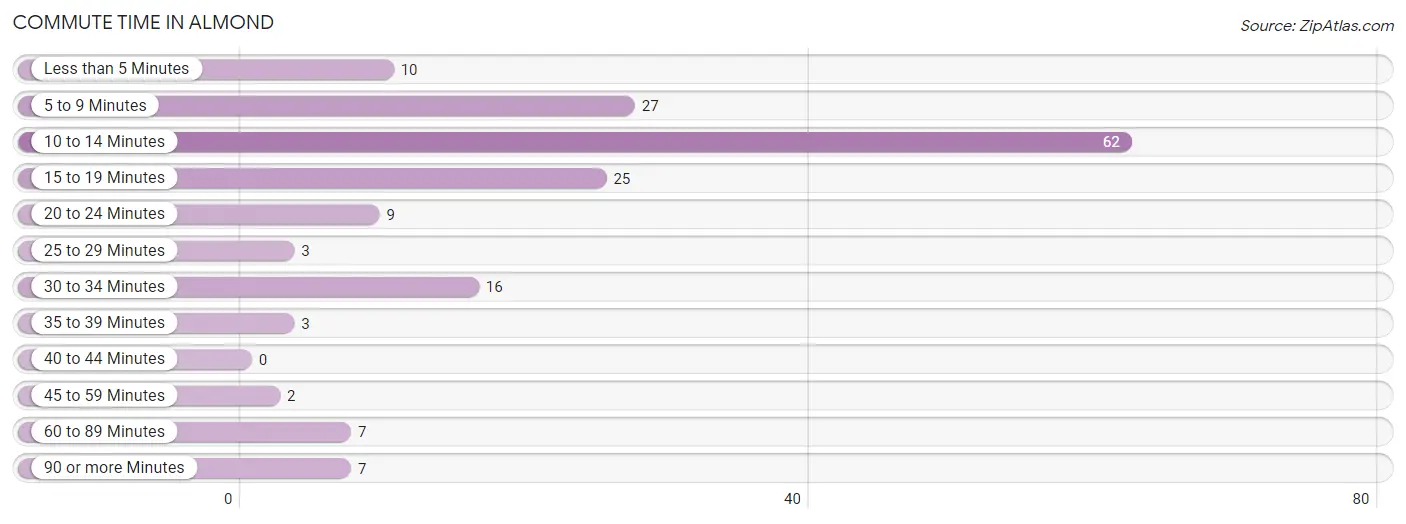
| Commute Time | # Commuters | % Commuters |
| Less than 5 Minutes | 10 | 5.9% |
| 5 to 9 Minutes | 27 | 15.8% |
| 10 to 14 Minutes | 62 | 36.3% |
| 15 to 19 Minutes | 25 | 14.6% |
| 20 to 24 Minutes | 9 | 5.3% |
| 25 to 29 Minutes | 3 | 1.8% |
| 30 to 34 Minutes | 16 | 9.4% |
| 35 to 39 Minutes | 3 | 1.8% |
| 40 to 44 Minutes | 0 | 0.0% |
| 45 to 59 Minutes | 2 | 1.2% |
| 60 to 89 Minutes | 7 | 4.1% |
| 90 or more Minutes | 7 | 4.1% |
Commute Time by Sex in Almond
The most common commute times in Almond are 10 to 14 minutes (27 commuters, 30.3%) for males and 10 to 14 minutes (35 commuters, 42.7%) for females.
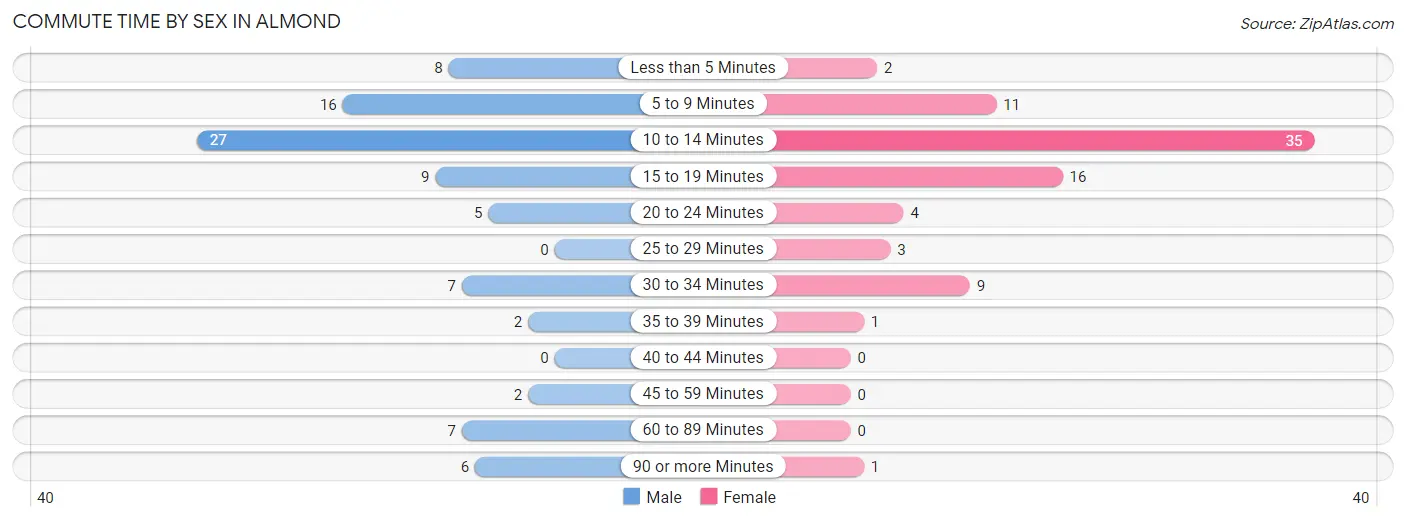
| Commute Time | Male | Female |
| Less than 5 Minutes | 8 (9.0%) | 2 (2.4%) |
| 5 to 9 Minutes | 16 (18.0%) | 11 (13.4%) |
| 10 to 14 Minutes | 27 (30.3%) | 35 (42.7%) |
| 15 to 19 Minutes | 9 (10.1%) | 16 (19.5%) |
| 20 to 24 Minutes | 5 (5.6%) | 4 (4.9%) |
| 25 to 29 Minutes | 0 (0.0%) | 3 (3.7%) |
| 30 to 34 Minutes | 7 (7.9%) | 9 (11.0%) |
| 35 to 39 Minutes | 2 (2.2%) | 1 (1.2%) |
| 40 to 44 Minutes | 0 (0.0%) | 0 (0.0%) |
| 45 to 59 Minutes | 2 (2.2%) | 0 (0.0%) |
| 60 to 89 Minutes | 7 (7.9%) | 0 (0.0%) |
| 90 or more Minutes | 6 (6.7%) | 1 (1.2%) |
Time of Departure to Work by Sex in Almond
The most frequent times of departure to work in Almond are 7:30 AM to 7:59 AM (25, 28.1%) for males and 7:00 AM to 7:29 AM (19, 23.2%) for females.
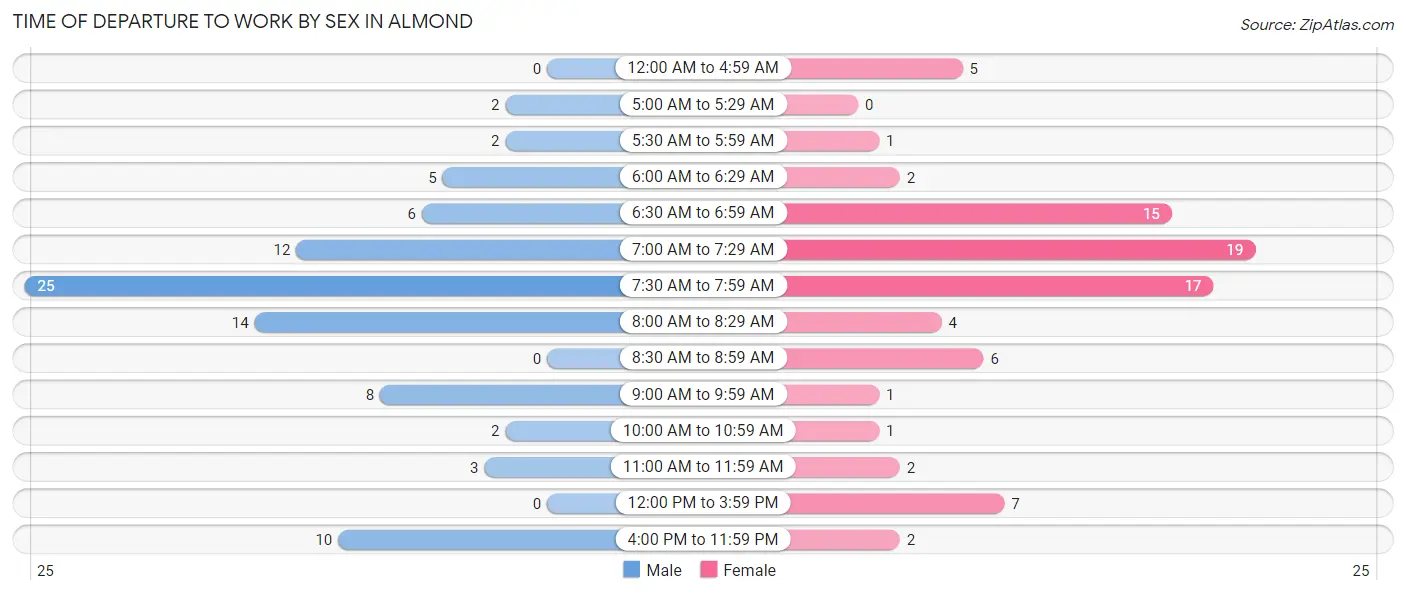
| Time of Departure | Male | Female |
| 12:00 AM to 4:59 AM | 0 (0.0%) | 5 (6.1%) |
| 5:00 AM to 5:29 AM | 2 (2.2%) | 0 (0.0%) |
| 5:30 AM to 5:59 AM | 2 (2.2%) | 1 (1.2%) |
| 6:00 AM to 6:29 AM | 5 (5.6%) | 2 (2.4%) |
| 6:30 AM to 6:59 AM | 6 (6.7%) | 15 (18.3%) |
| 7:00 AM to 7:29 AM | 12 (13.5%) | 19 (23.2%) |
| 7:30 AM to 7:59 AM | 25 (28.1%) | 17 (20.7%) |
| 8:00 AM to 8:29 AM | 14 (15.7%) | 4 (4.9%) |
| 8:30 AM to 8:59 AM | 0 (0.0%) | 6 (7.3%) |
| 9:00 AM to 9:59 AM | 8 (9.0%) | 1 (1.2%) |
| 10:00 AM to 10:59 AM | 2 (2.2%) | 1 (1.2%) |
| 11:00 AM to 11:59 AM | 3 (3.4%) | 2 (2.4%) |
| 12:00 PM to 3:59 PM | 0 (0.0%) | 7 (8.5%) |
| 4:00 PM to 11:59 PM | 10 (11.2%) | 2 (2.4%) |
| Total | 89 (100.0%) | 82 (100.0%) |
Housing Occupancy in Almond
Occupancy by Ownership in Almond
Of the total 166 dwellings in Almond, owner-occupied units account for 125 (75.3%), while renter-occupied units make up 41 (24.7%).
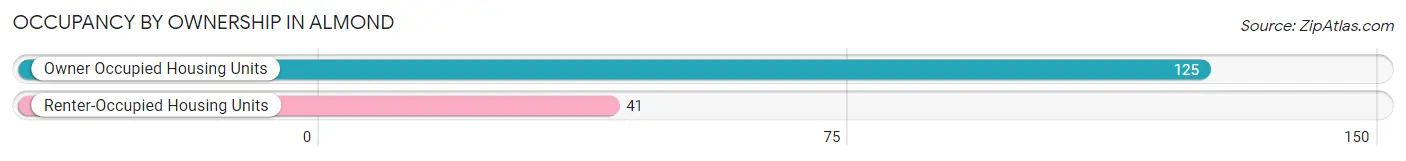
| Occupancy | # Housing Units | % Housing Units |
| Owner Occupied Housing Units | 125 | 75.3% |
| Renter-Occupied Housing Units | 41 | 24.7% |
| Total Occupied Housing Units | 166 | 100.0% |
Occupancy by Household Size in Almond
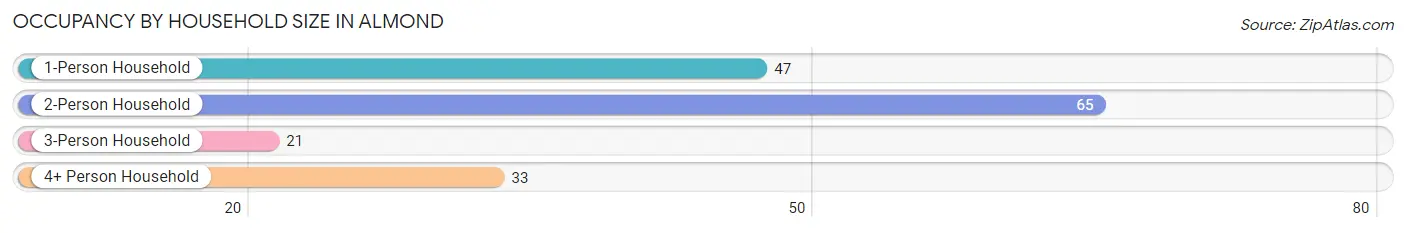
| Household Size | # Housing Units | % Housing Units |
| 1-Person Household | 47 | 28.3% |
| 2-Person Household | 65 | 39.2% |
| 3-Person Household | 21 | 12.7% |
| 4+ Person Household | 33 | 19.9% |
| Total Housing Units | 166 | 100.0% |
Occupancy by Ownership by Household Size in Almond
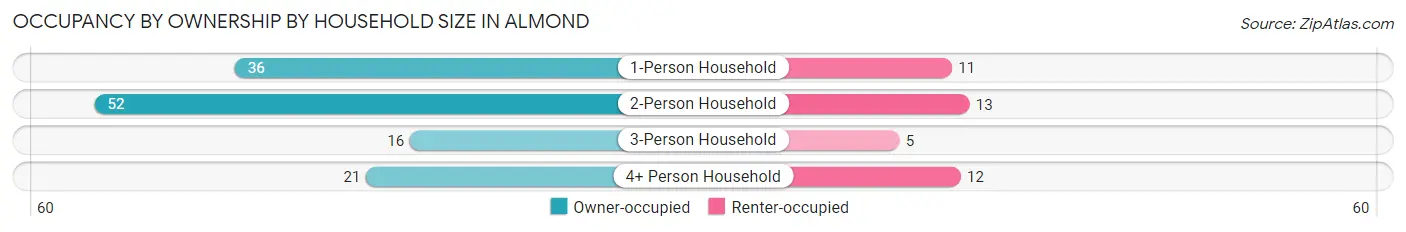
| Household Size | Owner-occupied | Renter-occupied |
| 1-Person Household | 36 (76.6%) | 11 (23.4%) |
| 2-Person Household | 52 (80.0%) | 13 (20.0%) |
| 3-Person Household | 16 (76.2%) | 5 (23.8%) |
| 4+ Person Household | 21 (63.6%) | 12 (36.4%) |
| Total Housing Units | 125 (75.3%) | 41 (24.7%) |
Occupancy by Educational Attainment in Almond
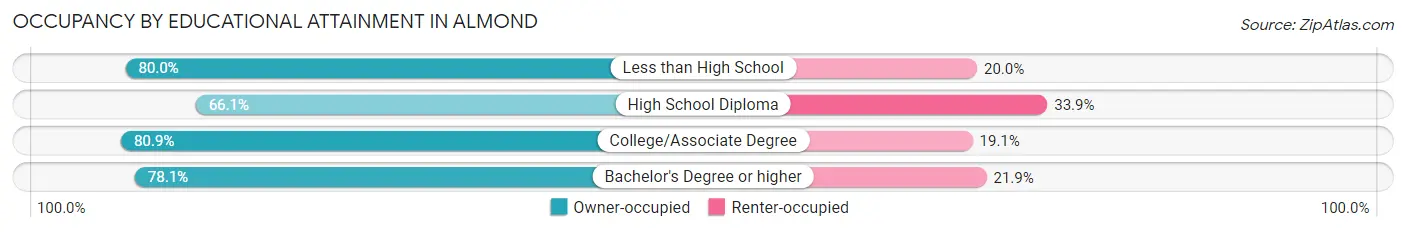
| Household Size | Owner-occupied | Renter-occupied |
| Less than High School | 8 (80.0%) | 2 (20.0%) |
| High School Diploma | 37 (66.1%) | 19 (33.9%) |
| College/Associate Degree | 55 (80.9%) | 13 (19.1%) |
| Bachelor's Degree or higher | 25 (78.1%) | 7 (21.9%) |
Occupancy by Age of Householder in Almond
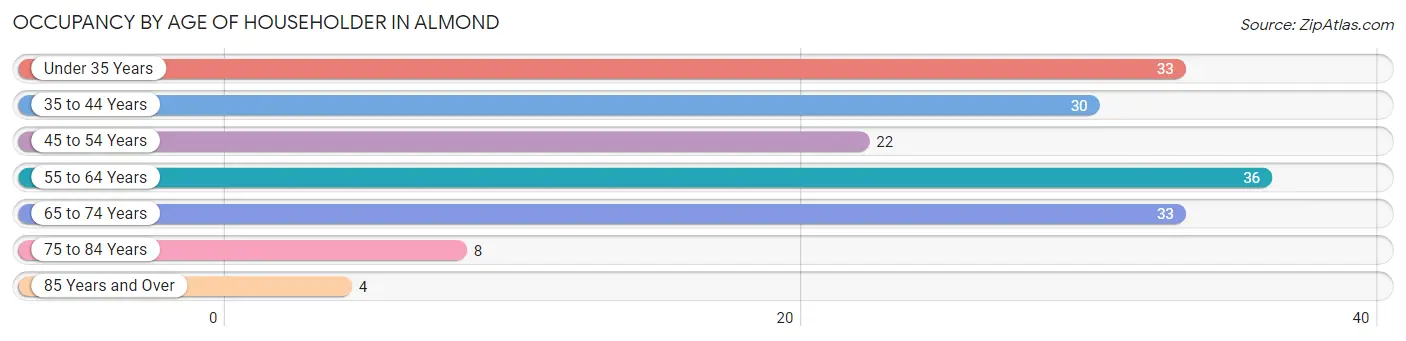
| Age Bracket | # Households | % Households |
| Under 35 Years | 33 | 19.9% |
| 35 to 44 Years | 30 | 18.1% |
| 45 to 54 Years | 22 | 13.3% |
| 55 to 64 Years | 36 | 21.7% |
| 65 to 74 Years | 33 | 19.9% |
| 75 to 84 Years | 8 | 4.8% |
| 85 Years and Over | 4 | 2.4% |
| Total | 166 | 100.0% |
Housing Finances in Almond
Median Income by Occupancy in Almond
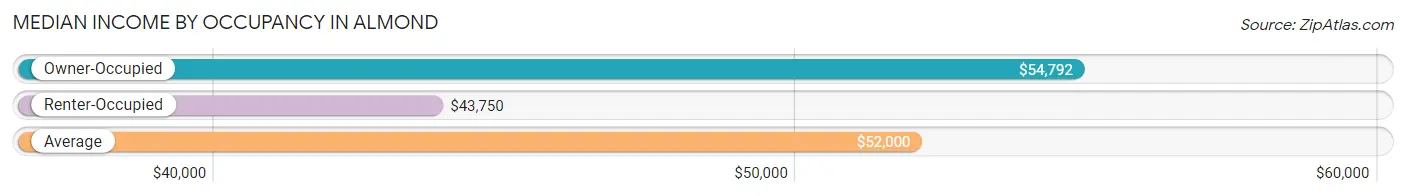
| Occupancy Type | # Households | Median Income |
| Owner-Occupied | 125 (75.3%) | $54,792 |
| Renter-Occupied | 41 (24.7%) | $43,750 |
| Average | 166 (100.0%) | $52,000 |
Occupancy by Householder Income Bracket in Almond
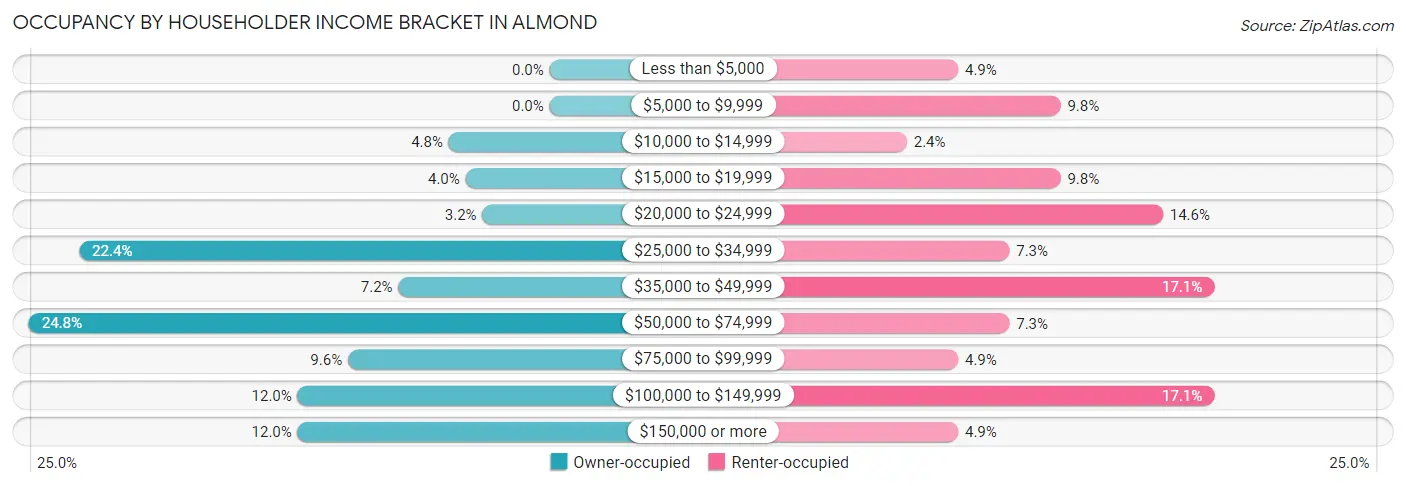
| Income Bracket | Owner-occupied | Renter-occupied |
| Less than $5,000 | 0 (0.0%) | 2 (4.9%) |
| $5,000 to $9,999 | 0 (0.0%) | 4 (9.8%) |
| $10,000 to $14,999 | 6 (4.8%) | 1 (2.4%) |
| $15,000 to $19,999 | 5 (4.0%) | 4 (9.8%) |
| $20,000 to $24,999 | 4 (3.2%) | 6 (14.6%) |
| $25,000 to $34,999 | 28 (22.4%) | 3 (7.3%) |
| $35,000 to $49,999 | 9 (7.2%) | 7 (17.1%) |
| $50,000 to $74,999 | 31 (24.8%) | 3 (7.3%) |
| $75,000 to $99,999 | 12 (9.6%) | 2 (4.9%) |
| $100,000 to $149,999 | 15 (12.0%) | 7 (17.1%) |
| $150,000 or more | 15 (12.0%) | 2 (4.9%) |
| Total | 125 (100.0%) | 41 (100.0%) |
Monthly Housing Cost Tiers in Almond
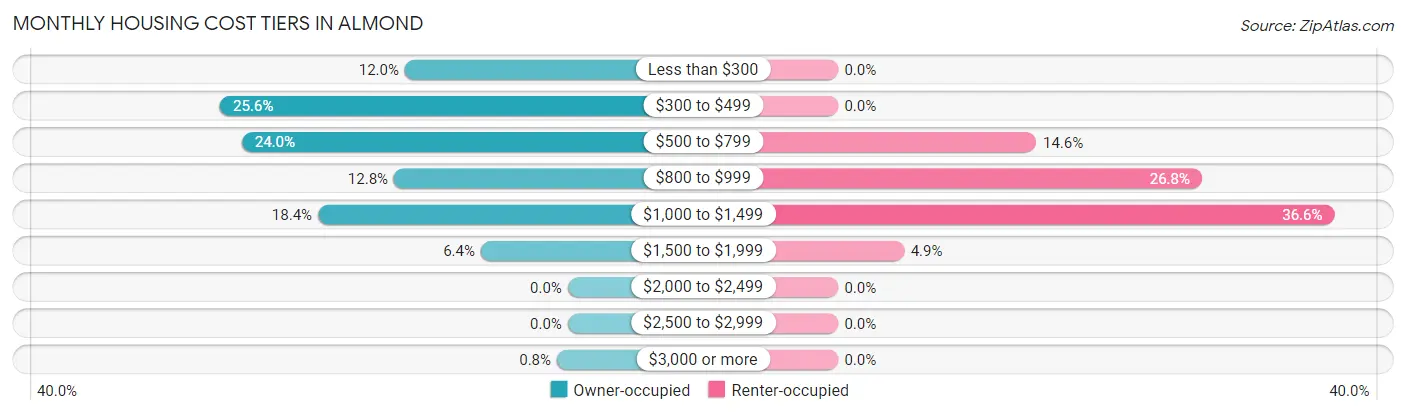
| Monthly Cost | Owner-occupied | Renter-occupied |
| Less than $300 | 15 (12.0%) | 0 (0.0%) |
| $300 to $499 | 32 (25.6%) | 0 (0.0%) |
| $500 to $799 | 30 (24.0%) | 6 (14.6%) |
| $800 to $999 | 16 (12.8%) | 11 (26.8%) |
| $1,000 to $1,499 | 23 (18.4%) | 15 (36.6%) |
| $1,500 to $1,999 | 8 (6.4%) | 2 (4.9%) |
| $2,000 to $2,499 | 0 (0.0%) | 0 (0.0%) |
| $2,500 to $2,999 | 0 (0.0%) | 0 (0.0%) |
| $3,000 or more | 1 (0.8%) | 0 (0.0%) |
| Total | 125 (100.0%) | 41 (100.0%) |
Physical Housing Characteristics in Almond
Housing Structures in Almond
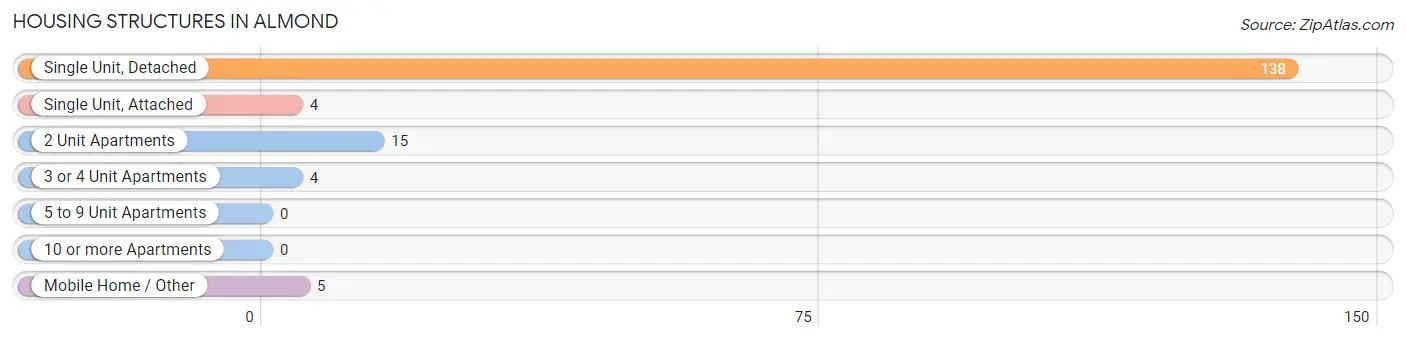
| Structure Type | # Housing Units | % Housing Units |
| Single Unit, Detached | 138 | 83.1% |
| Single Unit, Attached | 4 | 2.4% |
| 2 Unit Apartments | 15 | 9.0% |
| 3 or 4 Unit Apartments | 4 | 2.4% |
| 5 to 9 Unit Apartments | 0 | 0.0% |
| 10 or more Apartments | 0 | 0.0% |
| Mobile Home / Other | 5 | 3.0% |
| Total | 166 | 100.0% |
Housing Structures by Occupancy in Almond
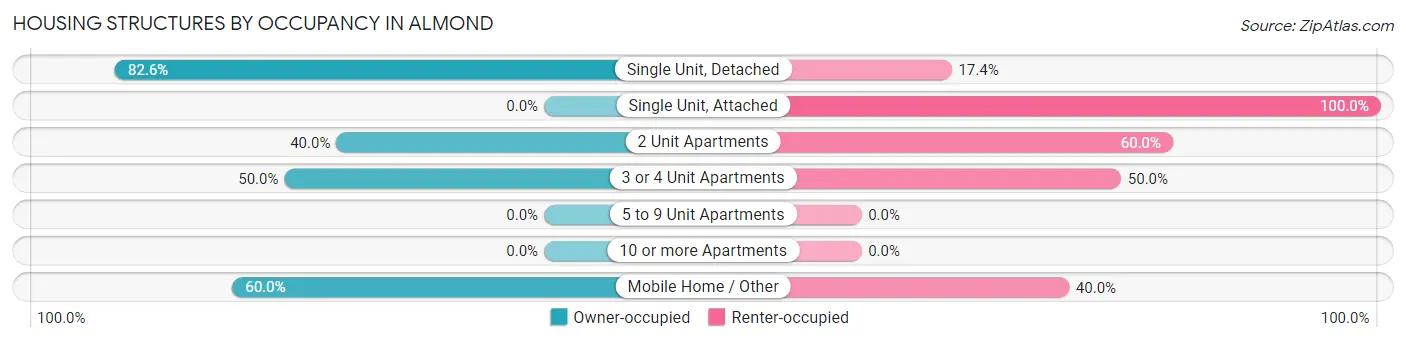
| Structure Type | Owner-occupied | Renter-occupied |
| Single Unit, Detached | 114 (82.6%) | 24 (17.4%) |
| Single Unit, Attached | 0 (0.0%) | 4 (100.0%) |
| 2 Unit Apartments | 6 (40.0%) | 9 (60.0%) |
| 3 or 4 Unit Apartments | 2 (50.0%) | 2 (50.0%) |
| 5 to 9 Unit Apartments | 0 (0.0%) | 0 (0.0%) |
| 10 or more Apartments | 0 (0.0%) | 0 (0.0%) |
| Mobile Home / Other | 3 (60.0%) | 2 (40.0%) |
| Total | 125 (75.3%) | 41 (24.7%) |
Housing Structures by Number of Rooms in Almond
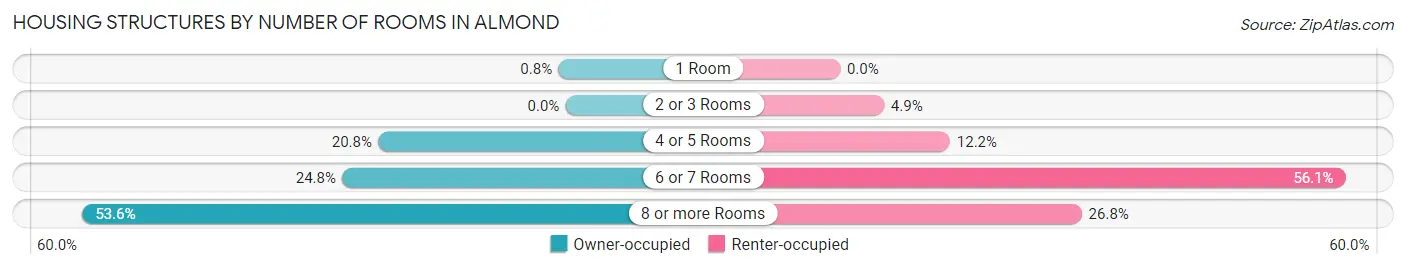
| Number of Rooms | Owner-occupied | Renter-occupied |
| 1 Room | 1 (0.8%) | 0 (0.0%) |
| 2 or 3 Rooms | 0 (0.0%) | 2 (4.9%) |
| 4 or 5 Rooms | 26 (20.8%) | 5 (12.2%) |
| 6 or 7 Rooms | 31 (24.8%) | 23 (56.1%) |
| 8 or more Rooms | 67 (53.6%) | 11 (26.8%) |
| Total | 125 (100.0%) | 41 (100.0%) |
Housing Structure by Heating Type in Almond
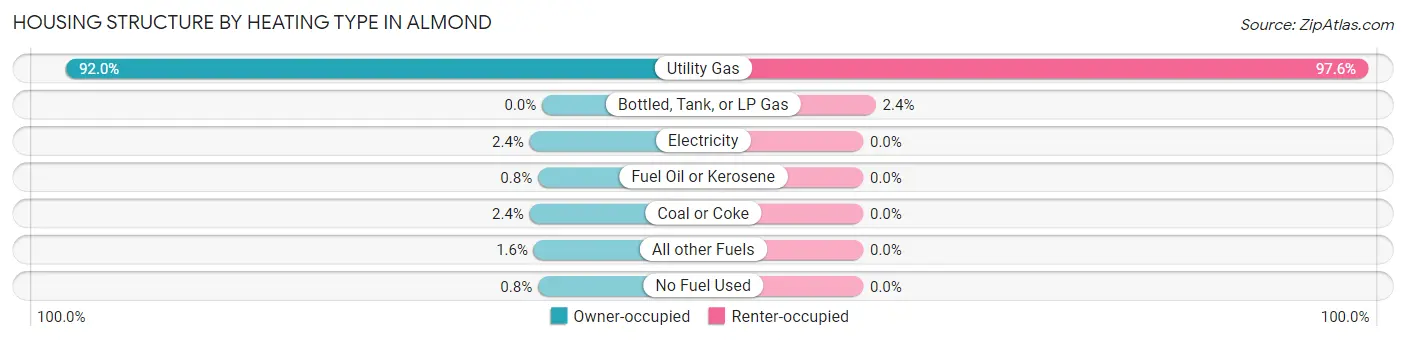
| Heating Type | Owner-occupied | Renter-occupied |
| Utility Gas | 115 (92.0%) | 40 (97.6%) |
| Bottled, Tank, or LP Gas | 0 (0.0%) | 1 (2.4%) |
| Electricity | 3 (2.4%) | 0 (0.0%) |
| Fuel Oil or Kerosene | 1 (0.8%) | 0 (0.0%) |
| Coal or Coke | 3 (2.4%) | 0 (0.0%) |
| All other Fuels | 2 (1.6%) | 0 (0.0%) |
| No Fuel Used | 1 (0.8%) | 0 (0.0%) |
| Total | 125 (100.0%) | 41 (100.0%) |
Household Vehicle Usage in Almond
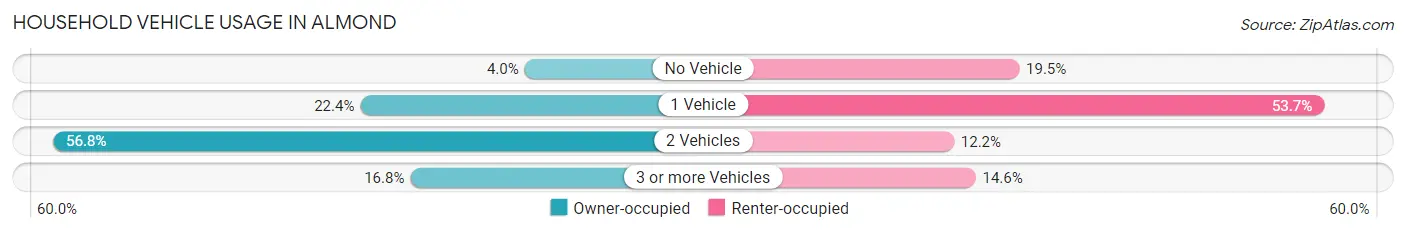
| Vehicles per Household | Owner-occupied | Renter-occupied |
| No Vehicle | 5 (4.0%) | 8 (19.5%) |
| 1 Vehicle | 28 (22.4%) | 22 (53.7%) |
| 2 Vehicles | 71 (56.8%) | 5 (12.2%) |
| 3 or more Vehicles | 21 (16.8%) | 6 (14.6%) |
| Total | 125 (100.0%) | 41 (100.0%) |
Real Estate & Mortgages in Almond
Real Estate and Mortgage Overview in Almond
| Characteristic | Without Mortgage | With Mortgage |
| Housing Units | 72 | 53 |
| Median Property Value | $60,000 | $97,700 |
| Median Household Income | - | - |
| Monthly Housing Costs | $450 | $1 |
| Real Estate Taxes | $1,725 | $2 |
Property Value by Mortgage Status in Almond
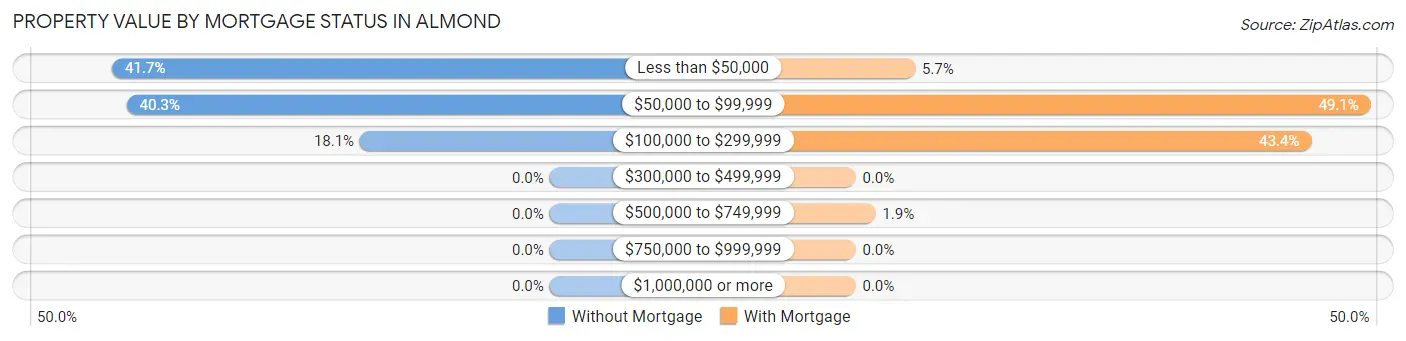
| Property Value | Without Mortgage | With Mortgage |
| Less than $50,000 | 30 (41.7%) | 3 (5.7%) |
| $50,000 to $99,999 | 29 (40.3%) | 26 (49.1%) |
| $100,000 to $299,999 | 13 (18.1%) | 23 (43.4%) |
| $300,000 to $499,999 | 0 (0.0%) | 0 (0.0%) |
| $500,000 to $749,999 | 0 (0.0%) | 1 (1.9%) |
| $750,000 to $999,999 | 0 (0.0%) | 0 (0.0%) |
| $1,000,000 or more | 0 (0.0%) | 0 (0.0%) |
| Total | 72 (100.0%) | 53 (100.0%) |
Household Income by Mortgage Status in Almond
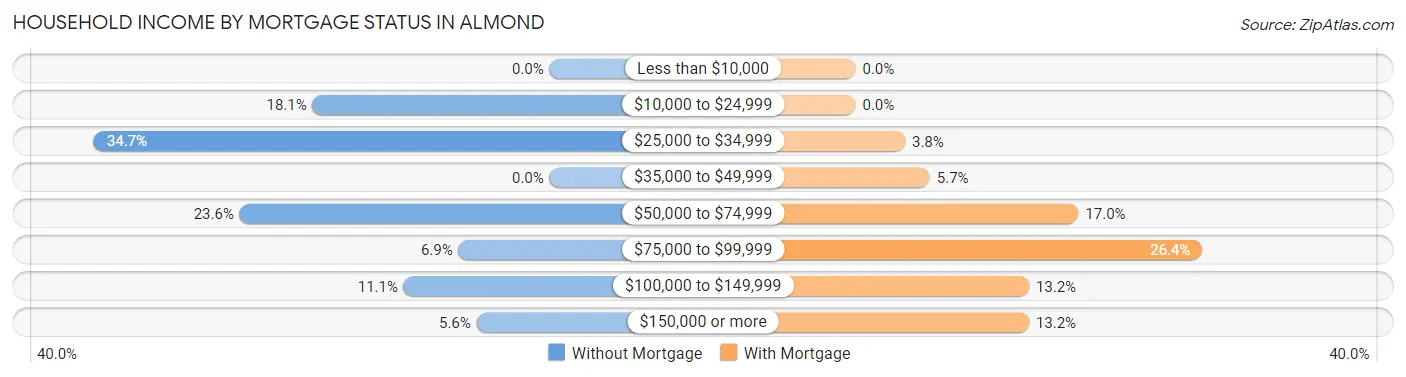
| Household Income | Without Mortgage | With Mortgage |
| Less than $10,000 | 0 (0.0%) | 0 (0.0%) |
| $10,000 to $24,999 | 13 (18.1%) | 0 (0.0%) |
| $25,000 to $34,999 | 25 (34.7%) | 2 (3.8%) |
| $35,000 to $49,999 | 0 (0.0%) | 3 (5.7%) |
| $50,000 to $74,999 | 17 (23.6%) | 9 (17.0%) |
| $75,000 to $99,999 | 5 (6.9%) | 14 (26.4%) |
| $100,000 to $149,999 | 8 (11.1%) | 7 (13.2%) |
| $150,000 or more | 4 (5.6%) | 7 (13.2%) |
| Total | 72 (100.0%) | 53 (100.0%) |
Property Value to Household Income Ratio in Almond
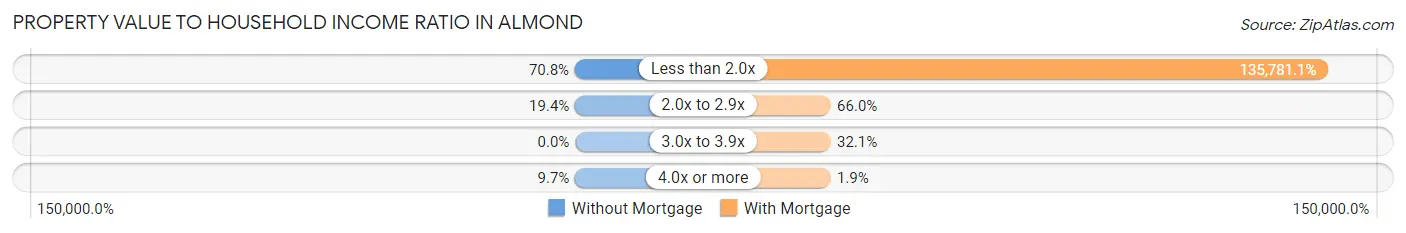
| Value-to-Income Ratio | Without Mortgage | With Mortgage |
| Less than 2.0x | 51 (70.8%) | 71,964 (135,781.1%) |
| 2.0x to 2.9x | 14 (19.4%) | 35 (66.0%) |
| 3.0x to 3.9x | 0 (0.0%) | 17 (32.1%) |
| 4.0x or more | 7 (9.7%) | 1 (1.9%) |
| Total | 72 (100.0%) | 53 (100.0%) |
Real Estate Taxes by Mortgage Status in Almond
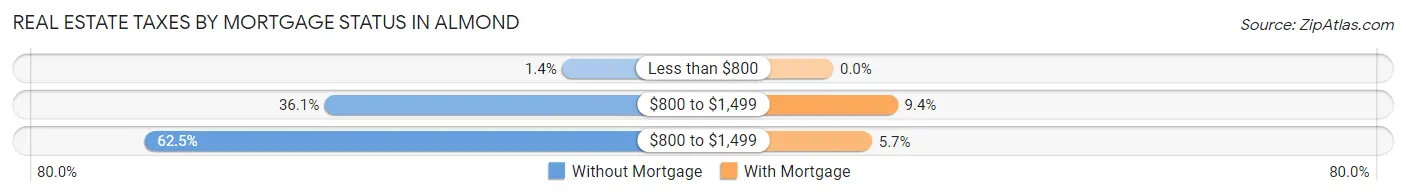
| Property Taxes | Without Mortgage | With Mortgage |
| Less than $800 | 1 (1.4%) | 0 (0.0%) |
| $800 to $1,499 | 26 (36.1%) | 5 (9.4%) |
| $800 to $1,499 | 45 (62.5%) | 3 (5.7%) |
| Total | 72 (100.0%) | 53 (100.0%) |
Health & Disability in Almond
Health Insurance Coverage by Age in Almond
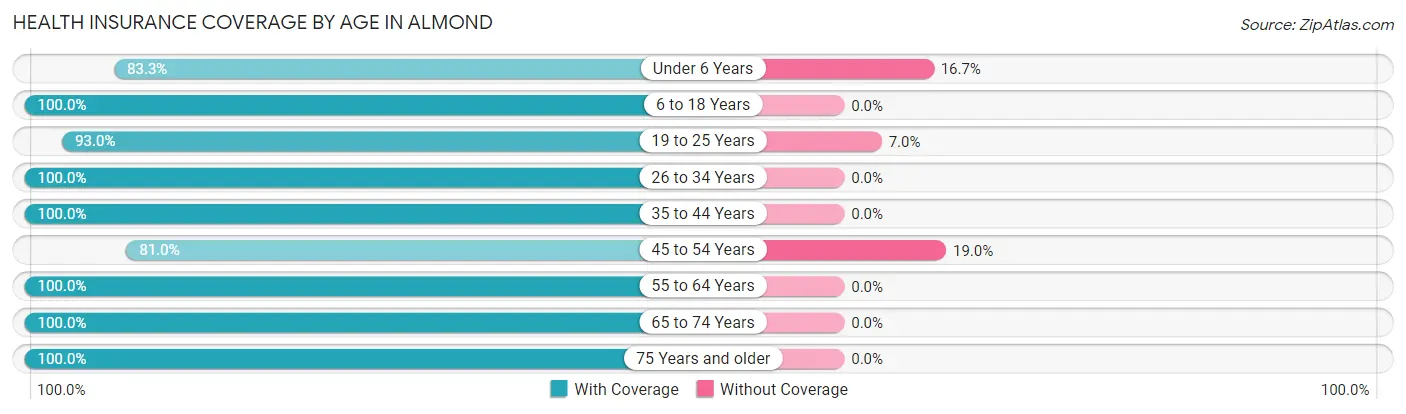
| Age Bracket | With Coverage | Without Coverage |
| Under 6 Years | 25 (83.3%) | 5 (16.7%) |
| 6 to 18 Years | 74 (100.0%) | 0 (0.0%) |
| 19 to 25 Years | 40 (93.0%) | 3 (7.0%) |
| 26 to 34 Years | 37 (100.0%) | 0 (0.0%) |
| 35 to 44 Years | 45 (100.0%) | 0 (0.0%) |
| 45 to 54 Years | 47 (81.0%) | 11 (19.0%) |
| 55 to 64 Years | 58 (100.0%) | 0 (0.0%) |
| 65 to 74 Years | 53 (100.0%) | 0 (0.0%) |
| 75 Years and older | 20 (100.0%) | 0 (0.0%) |
| Total | 399 (95.5%) | 19 (4.5%) |
Health Insurance Coverage by Citizenship Status in Almond
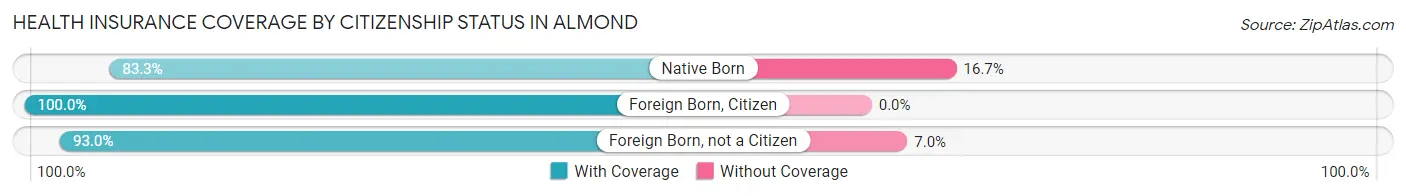
| Citizenship Status | With Coverage | Without Coverage |
| Native Born | 25 (83.3%) | 5 (16.7%) |
| Foreign Born, Citizen | 74 (100.0%) | 0 (0.0%) |
| Foreign Born, not a Citizen | 40 (93.0%) | 3 (7.0%) |
Health Insurance Coverage by Household Income in Almond
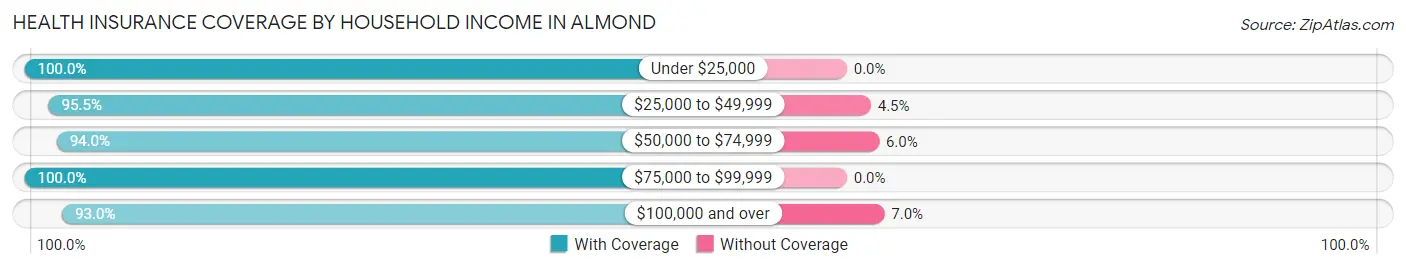
| Household Income | With Coverage | Without Coverage |
| Under $25,000 | 62 (100.0%) | 0 (0.0%) |
| $25,000 to $49,999 | 106 (95.5%) | 5 (4.5%) |
| $50,000 to $74,999 | 78 (94.0%) | 5 (6.0%) |
| $75,000 to $99,999 | 33 (100.0%) | 0 (0.0%) |
| $100,000 and over | 119 (93.0%) | 9 (7.0%) |
Public vs Private Health Insurance Coverage by Age in Almond
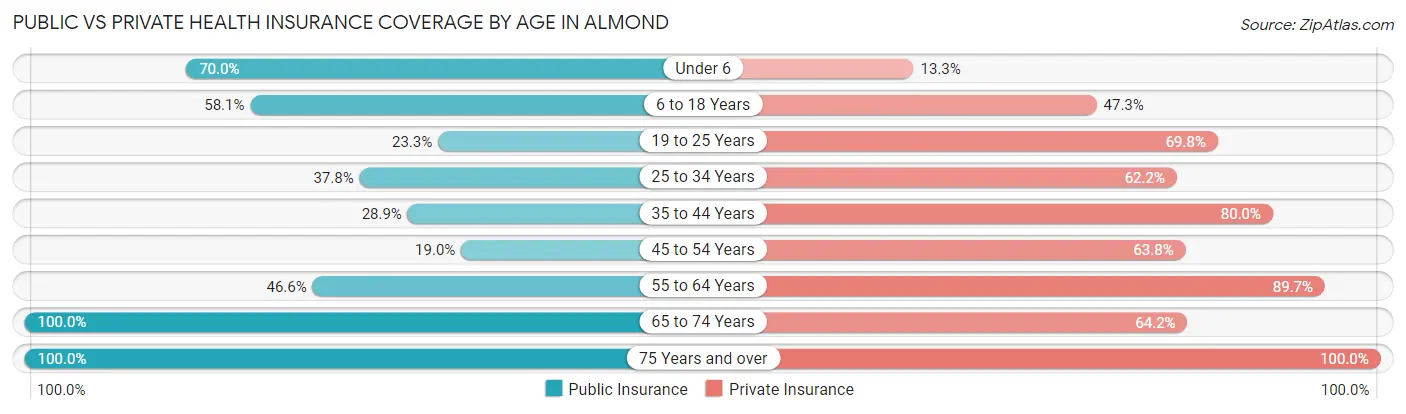
| Age Bracket | Public Insurance | Private Insurance |
| Under 6 | 21 (70.0%) | 4 (13.3%) |
| 6 to 18 Years | 43 (58.1%) | 35 (47.3%) |
| 19 to 25 Years | 10 (23.3%) | 30 (69.8%) |
| 25 to 34 Years | 14 (37.8%) | 23 (62.2%) |
| 35 to 44 Years | 13 (28.9%) | 36 (80.0%) |
| 45 to 54 Years | 11 (19.0%) | 37 (63.8%) |
| 55 to 64 Years | 27 (46.6%) | 52 (89.7%) |
| 65 to 74 Years | 53 (100.0%) | 34 (64.1%) |
| 75 Years and over | 20 (100.0%) | 20 (100.0%) |
| Total | 212 (50.7%) | 271 (64.8%) |
Disability Status by Sex by Age in Almond
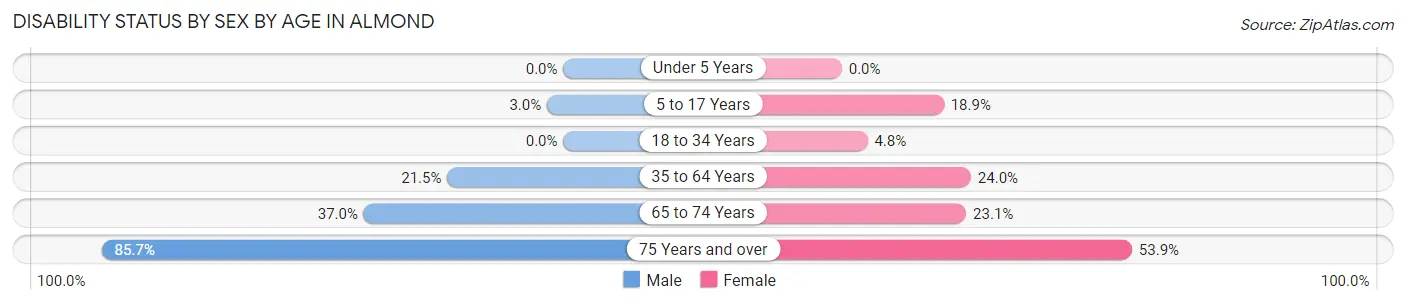
| Age Bracket | Male | Female |
| Under 5 Years | 0 (0.0%) | 0 (0.0%) |
| 5 to 17 Years | 1 (3.0%) | 7 (18.9%) |
| 18 to 34 Years | 0 (0.0%) | 2 (4.8%) |
| 35 to 64 Years | 14 (21.5%) | 23 (24.0%) |
| 65 to 74 Years | 10 (37.0%) | 6 (23.1%) |
| 75 Years and over | 6 (85.7%) | 7 (53.8%) |
Disability Class by Sex by Age in Almond
Disability Class: Hearing Difficulty
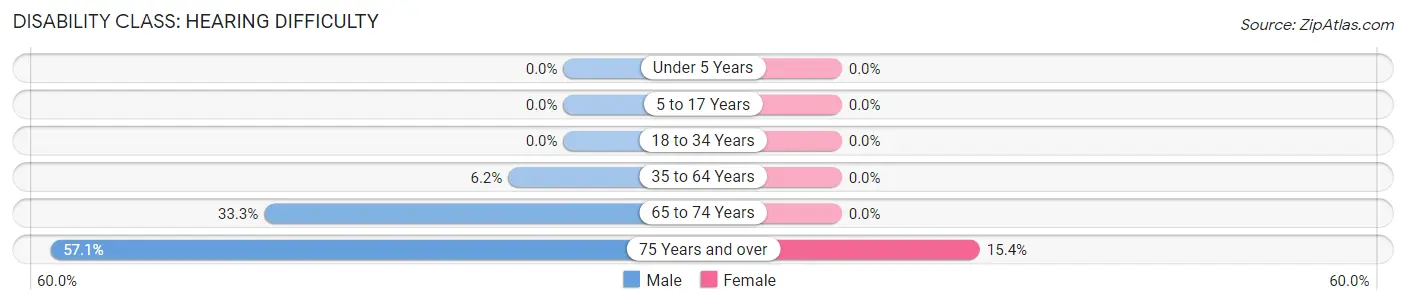
| Age Bracket | Male | Female |
| Under 5 Years | 0 (0.0%) | 0 (0.0%) |
| 5 to 17 Years | 0 (0.0%) | 0 (0.0%) |
| 18 to 34 Years | 0 (0.0%) | 0 (0.0%) |
| 35 to 64 Years | 4 (6.1%) | 0 (0.0%) |
| 65 to 74 Years | 9 (33.3%) | 0 (0.0%) |
| 75 Years and over | 4 (57.1%) | 2 (15.4%) |
Disability Class: Vision Difficulty
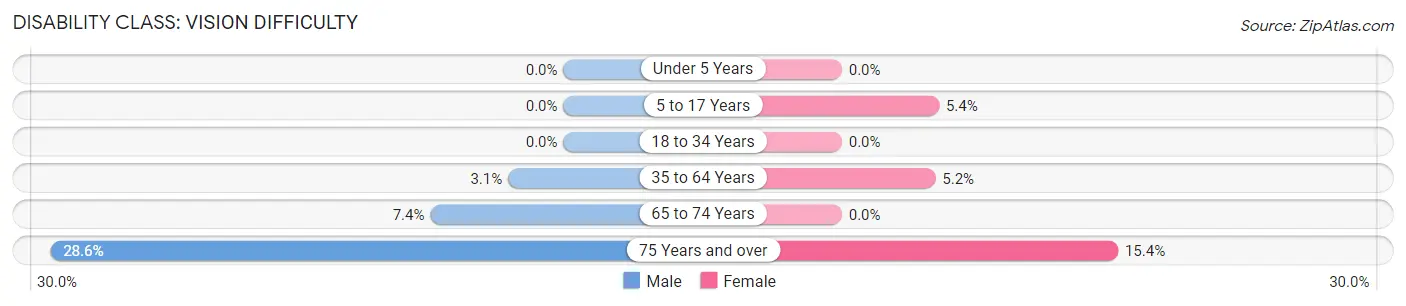
| Age Bracket | Male | Female |
| Under 5 Years | 0 (0.0%) | 0 (0.0%) |
| 5 to 17 Years | 0 (0.0%) | 2 (5.4%) |
| 18 to 34 Years | 0 (0.0%) | 0 (0.0%) |
| 35 to 64 Years | 2 (3.1%) | 5 (5.2%) |
| 65 to 74 Years | 2 (7.4%) | 0 (0.0%) |
| 75 Years and over | 2 (28.6%) | 2 (15.4%) |
Disability Class: Cognitive Difficulty
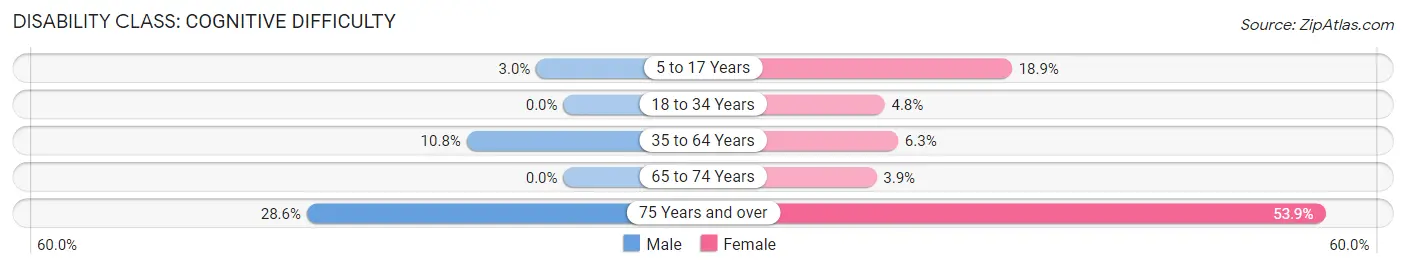
| Age Bracket | Male | Female |
| 5 to 17 Years | 1 (3.0%) | 7 (18.9%) |
| 18 to 34 Years | 0 (0.0%) | 2 (4.8%) |
| 35 to 64 Years | 7 (10.8%) | 6 (6.2%) |
| 65 to 74 Years | 0 (0.0%) | 1 (3.8%) |
| 75 Years and over | 2 (28.6%) | 7 (53.8%) |
Disability Class: Ambulatory Difficulty
| Age Bracket | Male | Female |
| 5 to 17 Years | 0 (0.0%) | 0 (0.0%) |
| 18 to 34 Years | 0 (0.0%) | 0 (0.0%) |
| 35 to 64 Years | 12 (18.5%) | 4 (4.2%) |
| 65 to 74 Years | 3 (11.1%) | 6 (23.1%) |
| 75 Years and over | 6 (85.7%) | 2 (15.4%) |
Disability Class: Self-Care Difficulty
| Age Bracket | Male | Female |
| 5 to 17 Years | 0 (0.0%) | 2 (5.4%) |
| 18 to 34 Years | 0 (0.0%) | 0 (0.0%) |
| 35 to 64 Years | 6 (9.2%) | 0 (0.0%) |
| 65 to 74 Years | 1 (3.7%) | 1 (3.8%) |
| 75 Years and over | 2 (28.6%) | 0 (0.0%) |
Technology Access in Almond
Computing Device Access in Almond
| Device Type | # Households | % Households |
| Desktop or Laptop | 134 | 80.7% |
| Smartphone | 142 | 85.5% |
| Tablet | 104 | 62.6% |
| No Computing Device | 5 | 3.0% |
| Total | 166 | 100.0% |
Internet Access in Almond
| Internet Type | # Households | % Households |
| Dial-Up Internet | 0 | 0.0% |
| Broadband Home | 133 | 80.1% |
| Cellular Data Only | 13 | 7.8% |
| Satellite Internet | 4 | 2.4% |
| No Internet | 17 | 10.2% |
| Total | 166 | 100.0% |
Almond Summary
Almond is a small town located in Allegany County, New York. It is situated in the foothills of the Allegheny Mountains, and is part of the Southern Tier region of the state. The town was first settled in 1808, and was incorporated in 1820. As of the 2010 census, the population of Almond was 1,072.
Geography
Almond is located in the western part of Allegany County, in the foothills of the Allegheny Mountains. It is bordered by the towns of Alfred to the north, Amity to the east, Andover to the south, and Wellsville to the west. The town is situated on the Genesee River, which flows through the center of the town. The terrain of Almond is mostly hilly, with some flat areas in the valleys. The highest point in the town is an unnamed hill, which has an elevation of 1,890 feet.
Climate
Almond has a humid continental climate, with cold, snowy winters and warm, humid summers. The average annual temperature is around 48°F, and the average annual precipitation is around 38 inches.
Demographics
As of the 2010 census, there were 1,072 people, 441 households, and 298 families residing in Almond. The population density was 33.2 people per square mile. The racial makeup of the town was 97.2% White, 0.7% African American, 0.3% Native American, 0.2% Asian, 0.1% from other races, and 1.5% from two or more races. Hispanic or Latino of any race were 0.7% of the population.
The median age in Almond was 43.2 years. About 24.2% of residents were under the age of 18, 6.2% were between the ages of 18 and 24, 24.2% were from 25 to 44, 28.2% were from 45 to 64, and 17.2% were 65 years of age or older. The gender makeup of the town was 48.7% male and 51.3% female.
Economy
The economy of Almond is largely based on agriculture and tourism. The town is home to several farms, which produce a variety of crops, including corn, soybeans, hay, and apples. The town is also home to several wineries, which produce a variety of wines. Tourism is also an important part of the local economy, with many visitors coming to the area to enjoy the scenic beauty of the Allegheny Mountains.
The town is also home to several small businesses, including restaurants, shops, and other services. The town is served by the Allegany County Airport, which provides air service to the surrounding area.
Conclusion
Almond is a small town located in Allegany County, New York. It is situated in the foothills of the Allegheny Mountains, and is part of the Southern Tier region of the state. The town was first settled in 1808, and was incorporated in 1820. As of the 2010 census, the population of Almond was 1,072. The town has a humid continental climate, with cold, snowy winters and warm, humid summers. The economy of Almond is largely based on agriculture and tourism. The town is home to several farms, wineries, and small businesses, and is served by the Allegany County Airport.
Common Questions
What is Per Capita Income in Almond?
Per Capita income in Almond is $28,364.
What is the Median Family Income in Almond?
Median Family Income in Almond is $65,625.
What is the Median Household income in Almond?
Median Household Income in Almond is $52,000.
What is Income or Wage Gap in Almond?
Income or Wage Gap in Almond is 20.7%.
Women in Almond earn 79.3 cents for every dollar earned by a man.
What is Inequality or Gini Index in Almond?
Inequality or Gini Index in Almond is 0.42.
What is the Total Population of Almond?
Total Population of Almond is 418.
What is the Total Male Population of Almond?
Total Male Population of Almond is 182.
What is the Total Female Population of Almond?
Total Female Population of Almond is 236.
What is the Ratio of Males per 100 Females in Almond?
There are 77.12 Males per 100 Females in Almond.
What is the Ratio of Females per 100 Males in Almond?
There are 129.67 Females per 100 Males in Almond.
What is the Median Population Age in Almond?
Median Population Age in Almond is 39.8 Years.
What is the Average Family Size in Almond
Average Family Size in Almond is 2.9 People.
What is the Average Household Size in Almond
Average Household Size in Almond is 2.5 People.
How Large is the Labor Force in Almond?
There are 192 People in the Labor Forcein in Almond.
What is the Percentage of People in the Labor Force in Almond?
58.5% of People are in the Labor Force in Almond.
What is the Unemployment Rate in Almond?
Unemployment Rate in Almond is 4.7%.