Pine Valley, NY Map & Demographics
Pine Valley Map
Pine Valley Overview
$24,358
PER CAPITA INCOME
$63,750
AVG FAMILY INCOME
$54,643
AVG HOUSEHOLD INCOME
55.7%
WAGE / INCOME GAP [ % ]
44.3¢/ $1
WAGE / INCOME GAP [ $ ]
0.34
INEQUALITY / GINI INDEX
609
TOTAL POPULATION
355
MALE POPULATION
254
FEMALE POPULATION
139.76
MALES / 100 FEMALES
71.55
FEMALES / 100 MALES
37.6
MEDIAN AGE
2.7
AVG FAMILY SIZE
2.3
AVG HOUSEHOLD SIZE
278
LABOR FORCE [ PEOPLE ]
58.9%
PERCENT IN LABOR FORCE
1.8%
UNEMPLOYMENT RATE
Pine Valley Zip Codes
Pine Valley Area Codes
Income in Pine Valley
Income Overview in Pine Valley
Per Capita Income in Pine Valley is $24,358, while median incomes of families and households are $63,750 and $54,643 respectively.
| Characteristic | Number | Measure |
| Per Capita Income | 609 | $24,358 |
| Median Family Income | 190 | $63,750 |
| Mean Family Income | 190 | $69,534 |
| Median Household Income | 266 | $54,643 |
| Mean Household Income | 266 | $56,907 |
| Income Deficit | 190 | $0 |
| Wage / Income Gap (%) | 609 | 55.70% |
| Wage / Income Gap ($) | 609 | 44.30¢ per $1 |
| Gini / Inequality Index | 609 | 0.34 |
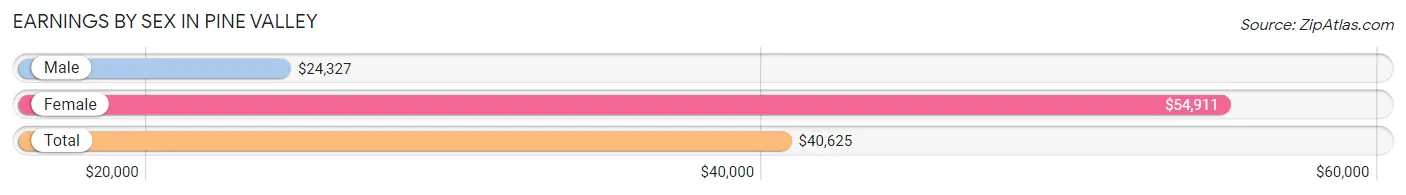
Earnings by Sex in Pine Valley
Average Earnings in Pine Valley are $40,625, $24,327 for men and $54,911 for women, a difference of 55.7%.
| Sex | Number | Average Earnings |
| Male | 172 (56.4%) | $24,327 |
| Female | 133 (43.6%) | $54,911 |
| Total | 305 (100.0%) | $40,625 |
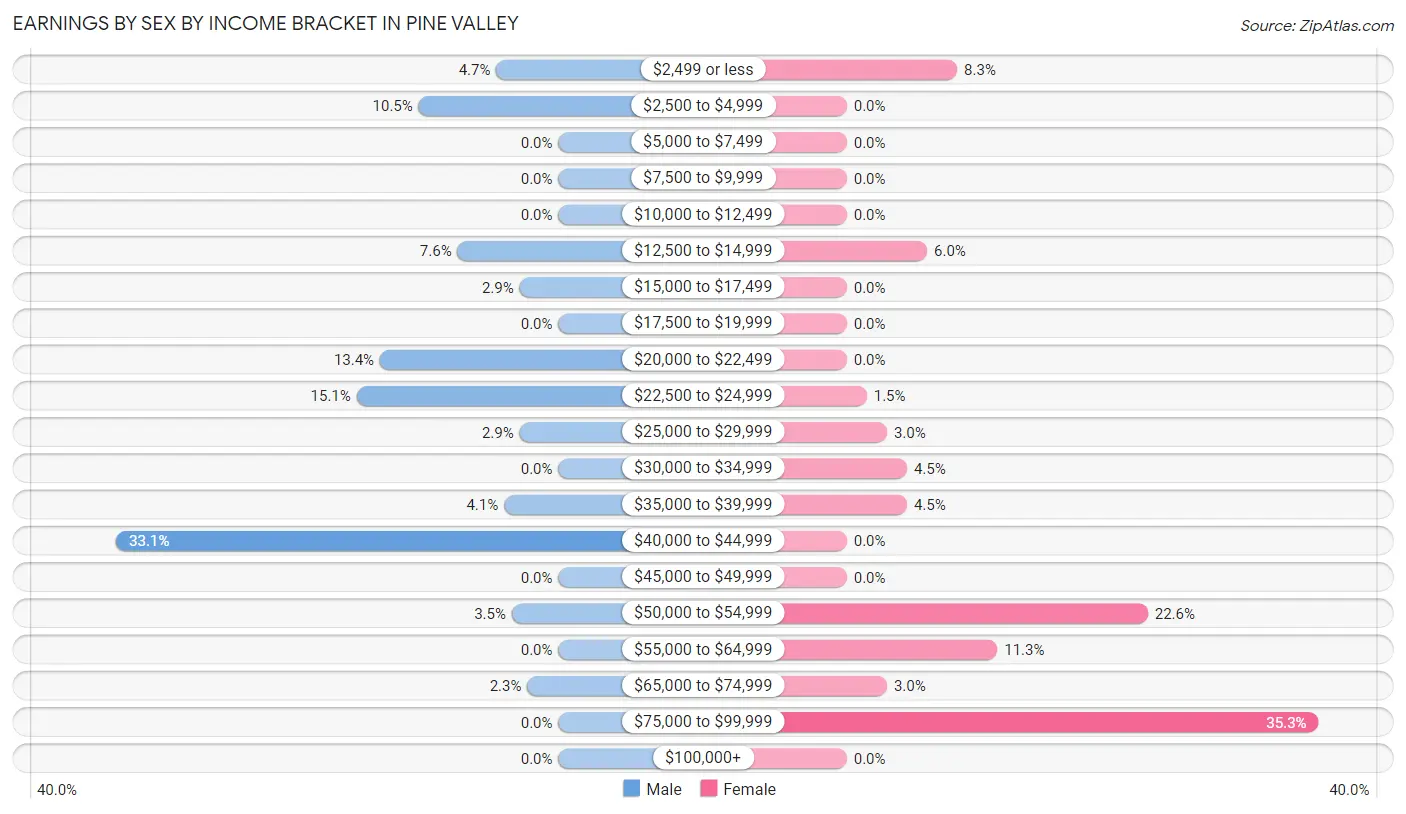
Earnings by Sex by Income Bracket in Pine Valley
The most common earnings brackets in Pine Valley are $40,000 to $44,999 for men (57 | 33.1%) and $75,000 to $99,999 for women (47 | 35.3%).
| Income | Male | Female |
| $2,499 or less | 8 (4.6%) | 11 (8.3%) |
| $2,500 to $4,999 | 18 (10.5%) | 0 (0.0%) |
| $5,000 to $7,499 | 0 (0.0%) | 0 (0.0%) |
| $7,500 to $9,999 | 0 (0.0%) | 0 (0.0%) |
| $10,000 to $12,499 | 0 (0.0%) | 0 (0.0%) |
| $12,500 to $14,999 | 13 (7.6%) | 8 (6.0%) |
| $15,000 to $17,499 | 5 (2.9%) | 0 (0.0%) |
| $17,500 to $19,999 | 0 (0.0%) | 0 (0.0%) |
| $20,000 to $22,499 | 23 (13.4%) | 0 (0.0%) |
| $22,500 to $24,999 | 26 (15.1%) | 2 (1.5%) |
| $25,000 to $29,999 | 5 (2.9%) | 4 (3.0%) |
| $30,000 to $34,999 | 0 (0.0%) | 6 (4.5%) |
| $35,000 to $39,999 | 7 (4.1%) | 6 (4.5%) |
| $40,000 to $44,999 | 57 (33.1%) | 0 (0.0%) |
| $45,000 to $49,999 | 0 (0.0%) | 0 (0.0%) |
| $50,000 to $54,999 | 6 (3.5%) | 30 (22.6%) |
| $55,000 to $64,999 | 0 (0.0%) | 15 (11.3%) |
| $65,000 to $74,999 | 4 (2.3%) | 4 (3.0%) |
| $75,000 to $99,999 | 0 (0.0%) | 47 (35.3%) |
| $100,000+ | 0 (0.0%) | 0 (0.0%) |
| Total | 172 (100.0%) | 133 (100.0%) |
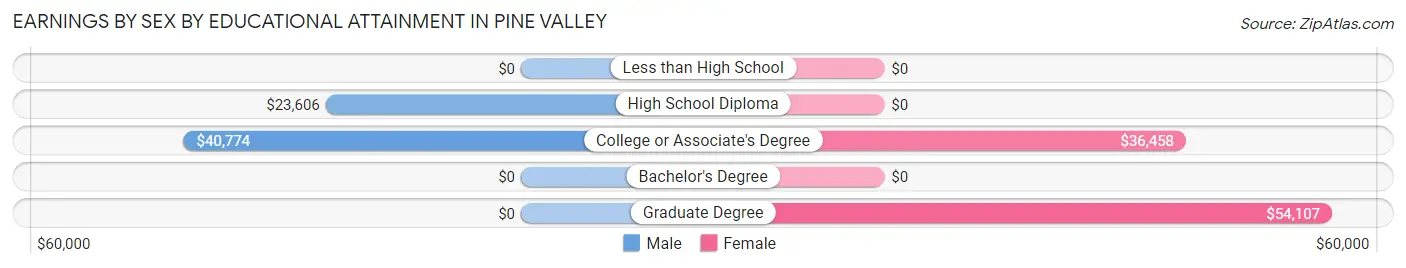
Earnings by Sex by Educational Attainment in Pine Valley
| Educational Attainment | Male Income | Female Income |
| Less than High School | - | - |
| High School Diploma | $23,606 | $0 |
| College or Associate's Degree | $40,774 | $36,458 |
| Bachelor's Degree | - | - |
| Graduate Degree | - | - |
| Total | - | - |
Family Income in Pine Valley
Family Income Brackets in Pine Valley
According to the Pine Valley family income data, there are 108 families falling into the $50,000 to $74,999 income range, which is the most common income bracket and makes up 56.8% of all families.
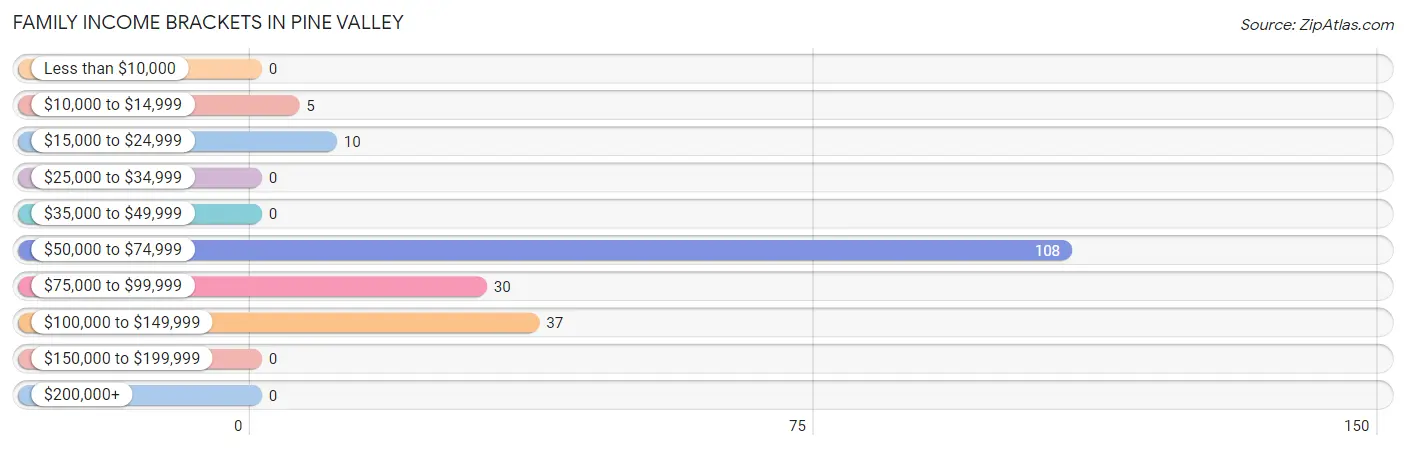
| Income Bracket | # Families | % Families |
| Less than $10,000 | 0 | 0.0% |
| $10,000 to $14,999 | 5 | 2.6% |
| $15,000 to $24,999 | 10 | 5.3% |
| $25,000 to $34,999 | 0 | 0.0% |
| $35,000 to $49,999 | 0 | 0.0% |
| $50,000 to $74,999 | 108 | 56.8% |
| $75,000 to $99,999 | 30 | 15.8% |
| $100,000 to $149,999 | 37 | 19.5% |
| $150,000 to $199,999 | 0 | 0.0% |
| $200,000+ | 0 | 0.0% |
Family Income by Famaliy Size in Pine Valley
2-person families (110 | 57.9%) account for the highest median family income in Pine Valley with $62,917 per family, while 2-person families (110 | 57.9%) have the highest median income of $31,458 per family member.
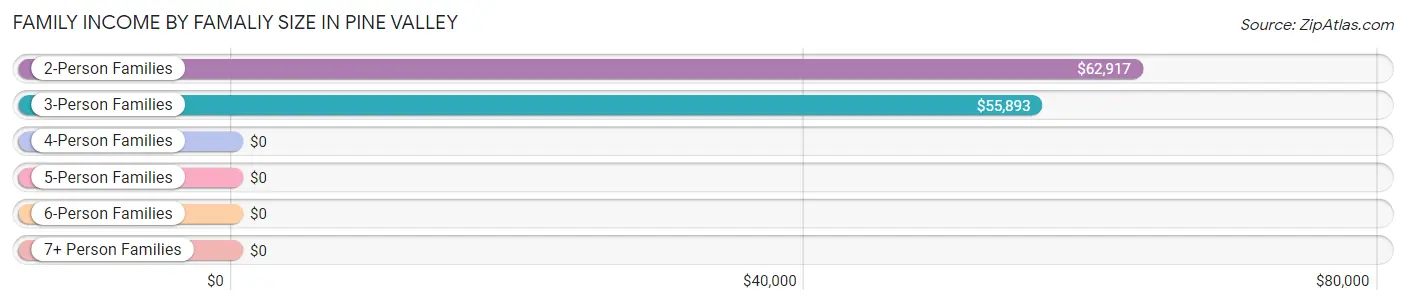
| Income Bracket | # Families | Median Income |
| 2-Person Families | 110 (57.9%) | $62,917 |
| 3-Person Families | 58 (30.5%) | $55,893 |
| 4-Person Families | 0 (0.0%) | $0 |
| 5-Person Families | 22 (11.6%) | $0 |
| 6-Person Families | 0 (0.0%) | $0 |
| 7+ Person Families | 0 (0.0%) | $0 |
| Total | 190 (100.0%) | $63,750 |
Family Income by Number of Earners in Pine Valley
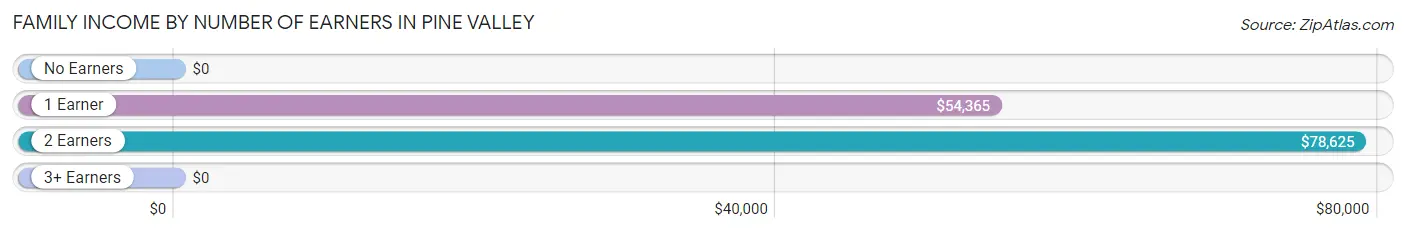
| Number of Earners | # Families | Median Income |
| No Earners | 16 (8.4%) | $0 |
| 1 Earner | 94 (49.5%) | $54,365 |
| 2 Earners | 76 (40.0%) | $78,625 |
| 3+ Earners | 4 (2.1%) | $0 |
| Total | 190 (100.0%) | $63,750 |
Household Income in Pine Valley
Household Income Brackets in Pine Valley
With 94 households falling in the category, the $50,000 to $74,999 income range is the most frequent in Pine Valley, accounting for 35.3% of all households.
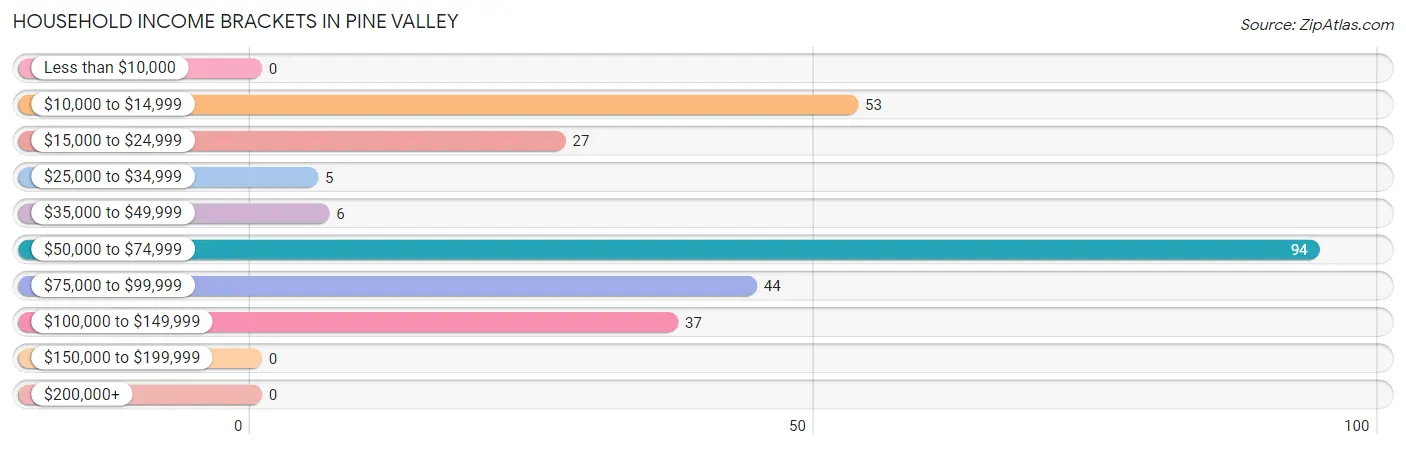
| Income Bracket | # Households | % Households |
| Less than $10,000 | 0 | 0.0% |
| $10,000 to $14,999 | 53 | 19.9% |
| $15,000 to $24,999 | 27 | 10.2% |
| $25,000 to $34,999 | 5 | 1.9% |
| $35,000 to $49,999 | 6 | 2.3% |
| $50,000 to $74,999 | 94 | 35.3% |
| $75,000 to $99,999 | 44 | 16.5% |
| $100,000 to $149,999 | 37 | 13.9% |
| $150,000 to $199,999 | 0 | 0.0% |
| $200,000+ | 0 | 0.0% |
Household Income by Householder Age in Pine Valley
The median household income in Pine Valley is $54,643, with the highest median household income of $71,667 found in the 25 to 44 years age bracket for the primary householder. A total of 96 households (36.1%) fall into this category.
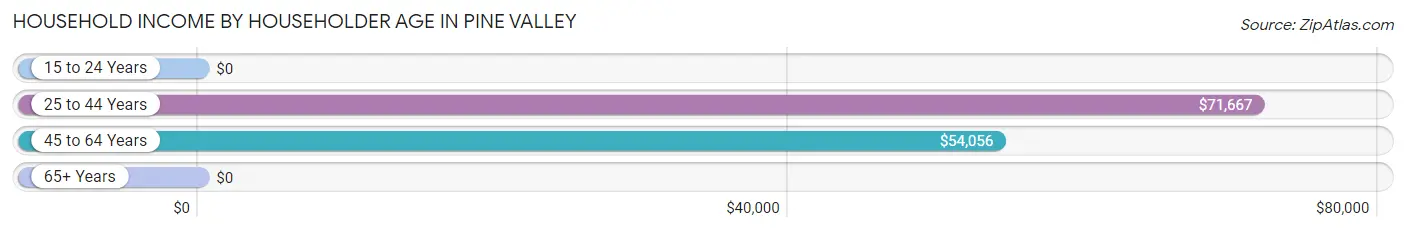
| Income Bracket | # Households | Median Income |
| 15 to 24 Years | 0 (0.0%) | $0 |
| 25 to 44 Years | 96 (36.1%) | $71,667 |
| 45 to 64 Years | 129 (48.5%) | $54,056 |
| 65+ Years | 41 (15.4%) | $0 |
| Total | 266 (100.0%) | $54,643 |
Poverty in Pine Valley
Income Below Poverty by Sex and Age in Pine Valley
With 10.7% poverty level for males and 18.9% for females among the residents of Pine Valley, 25 to 34 year old males and 15 year old females are the most vulnerable to poverty, with 5 males (100.0%) and 3 females (100.0%) in their respective age groups living below the poverty level.
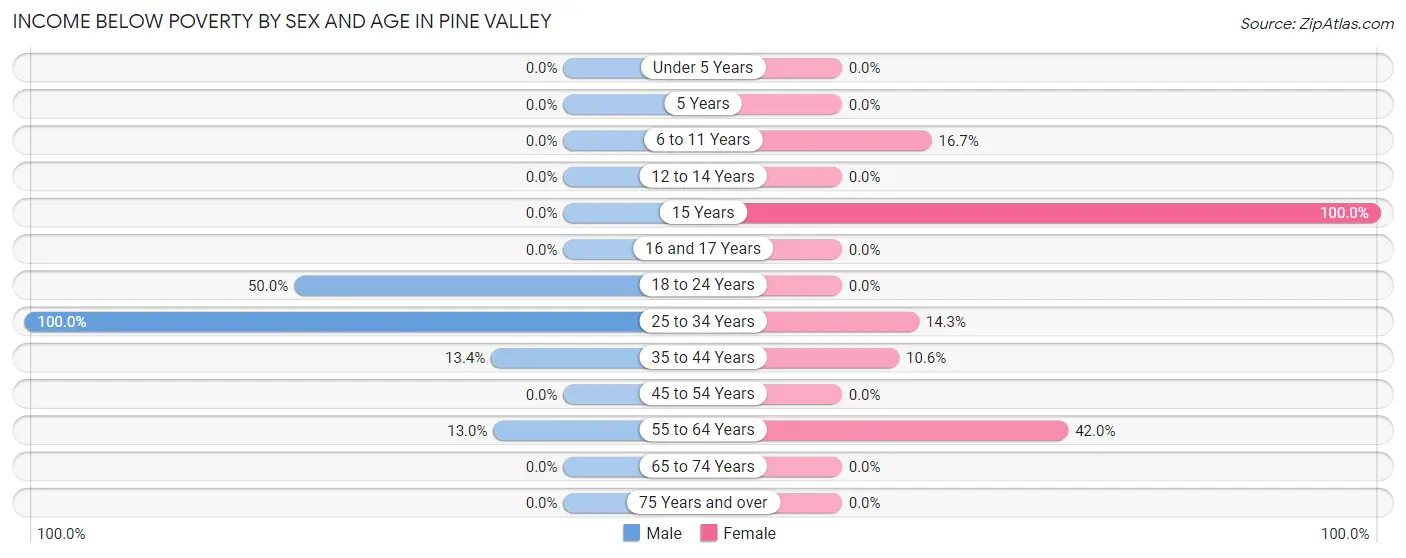
| Age Bracket | Male | Female |
| Under 5 Years | 0 (0.0%) | 0 (0.0%) |
| 5 Years | 0 (0.0%) | 0 (0.0%) |
| 6 to 11 Years | 0 (0.0%) | 6 (16.7%) |
| 12 to 14 Years | 0 (0.0%) | 0 (0.0%) |
| 15 Years | 0 (0.0%) | 3 (100.0%) |
| 16 and 17 Years | 0 (0.0%) | 0 (0.0%) |
| 18 to 24 Years | 7 (50.0%) | 0 (0.0%) |
| 25 to 34 Years | 5 (100.0%) | 5 (14.3%) |
| 35 to 44 Years | 13 (13.4%) | 5 (10.6%) |
| 45 to 54 Years | 0 (0.0%) | 0 (0.0%) |
| 55 to 64 Years | 13 (13.0%) | 29 (42.0%) |
| 65 to 74 Years | 0 (0.0%) | 0 (0.0%) |
| 75 Years and over | 0 (0.0%) | 0 (0.0%) |
| Total | 38 (10.7%) | 48 (18.9%) |
Income Above Poverty by Sex and Age in Pine Valley
According to the poverty statistics in Pine Valley, males aged under 5 years and females aged under 5 years are the age groups that are most secure financially, with 100.0% of males and 100.0% of females in these age groups living above the poverty line.
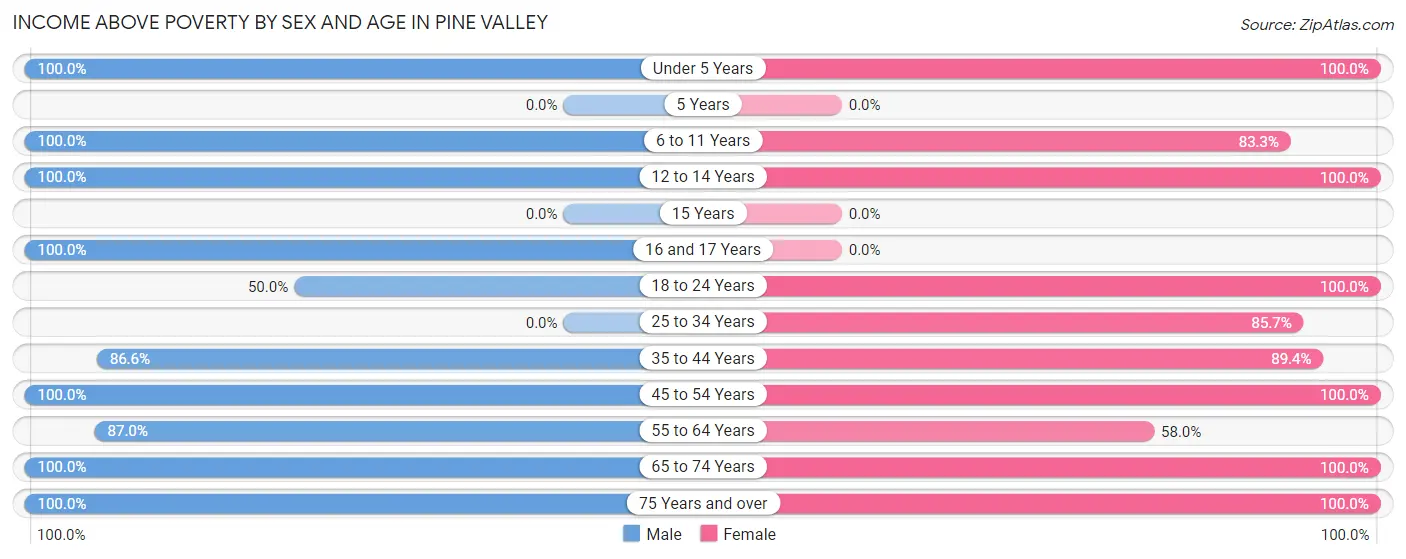
| Age Bracket | Male | Female |
| Under 5 Years | 16 (100.0%) | 16 (100.0%) |
| 5 Years | 0 (0.0%) | 0 (0.0%) |
| 6 to 11 Years | 17 (100.0%) | 30 (83.3%) |
| 12 to 14 Years | 38 (100.0%) | 11 (100.0%) |
| 15 Years | 0 (0.0%) | 0 (0.0%) |
| 16 and 17 Years | 31 (100.0%) | 0 (0.0%) |
| 18 to 24 Years | 7 (50.0%) | 8 (100.0%) |
| 25 to 34 Years | 0 (0.0%) | 30 (85.7%) |
| 35 to 44 Years | 84 (86.6%) | 42 (89.4%) |
| 45 to 54 Years | 6 (100.0%) | 7 (100.0%) |
| 55 to 64 Years | 87 (87.0%) | 40 (58.0%) |
| 65 to 74 Years | 19 (100.0%) | 9 (100.0%) |
| 75 Years and over | 12 (100.0%) | 13 (100.0%) |
| Total | 317 (89.3%) | 206 (81.1%) |
Income Below Poverty Among Married-Couple Families in Pine Valley
The poverty statistics for married-couple families in Pine Valley show that 5.9% or 5 of the total 84 families live below the poverty line. Families with 1 or 2 children have the highest poverty rate of 55.6%, comprising of 5 families. On the other hand, families with no children have the lowest poverty rate of 0.0%, which includes 0 families.
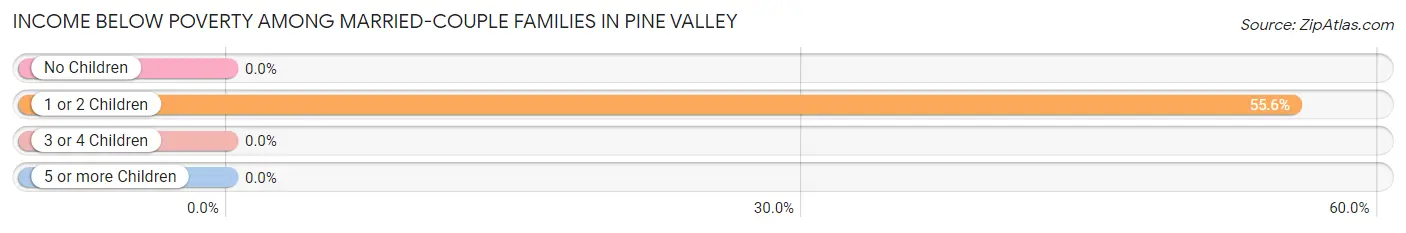
| Children | Above Poverty | Below Poverty |
| No Children | 57 (100.0%) | 0 (0.0%) |
| 1 or 2 Children | 4 (44.4%) | 5 (55.6%) |
| 3 or 4 Children | 18 (100.0%) | 0 (0.0%) |
| 5 or more Children | 0 (0.0%) | 0 (0.0%) |
| Total | 79 (94.1%) | 5 (5.9%) |
Income Below Poverty Among Single-Parent Households in Pine Valley
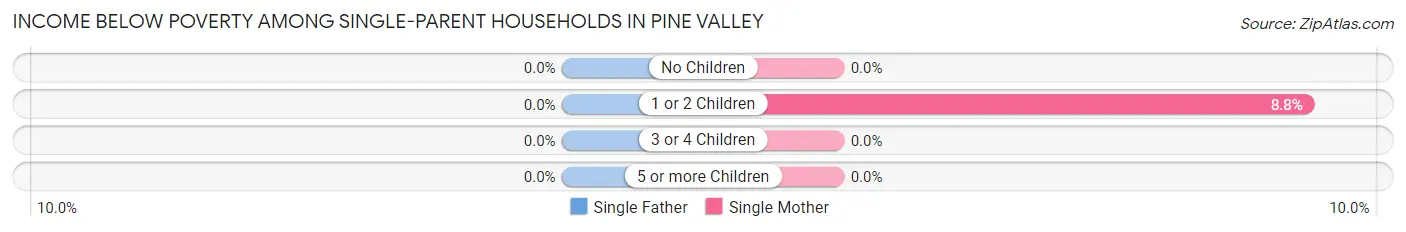
| Children | Single Father | Single Mother |
| No Children | 0 (0.0%) | 0 (0.0%) |
| 1 or 2 Children | 0 (0.0%) | 5 (8.8%) |
| 3 or 4 Children | 0 (0.0%) | 0 (0.0%) |
| 5 or more Children | 0 (0.0%) | 0 (0.0%) |
| Total | 0 (0.0%) | 5 (8.8%) |
Income Below Poverty Among Married-Couple vs Single-Parent Households in Pine Valley
The poverty data for Pine Valley shows that 5 of the married-couple family households (5.9%) and 5 of the single-parent households (4.7%) are living below the poverty level. Within the married-couple family households, those with 1 or 2 children have the highest poverty rate, with 5 households (55.6%) falling below the poverty line. Among the single-parent households, those with 1 or 2 children have the highest poverty rate, with 5 household (8.8%) living below poverty.
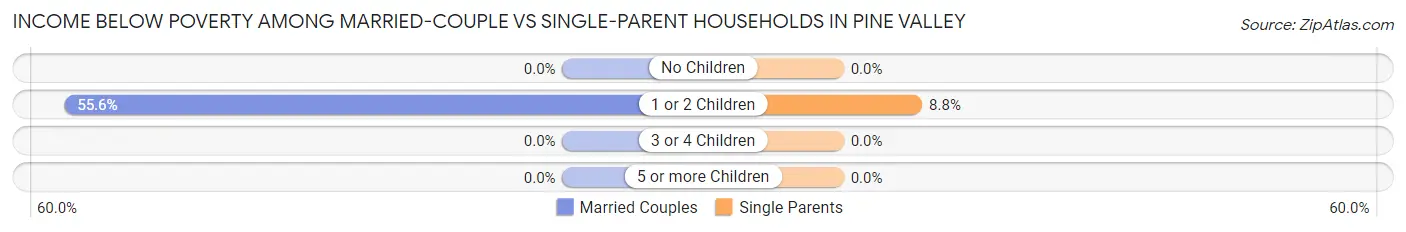
| Children | Married-Couple Families | Single-Parent Households |
| No Children | 0 (0.0%) | 0 (0.0%) |
| 1 or 2 Children | 5 (55.6%) | 5 (8.8%) |
| 3 or 4 Children | 0 (0.0%) | 0 (0.0%) |
| 5 or more Children | 0 (0.0%) | 0 (0.0%) |
| Total | 5 (5.9%) | 5 (4.7%) |
Race in Pine Valley
The most populous races in Pine Valley are White / Caucasian (607 | 99.7%), Hispanic or Latino (9 | 1.5%), and Two or more Races (2 | 0.3%).
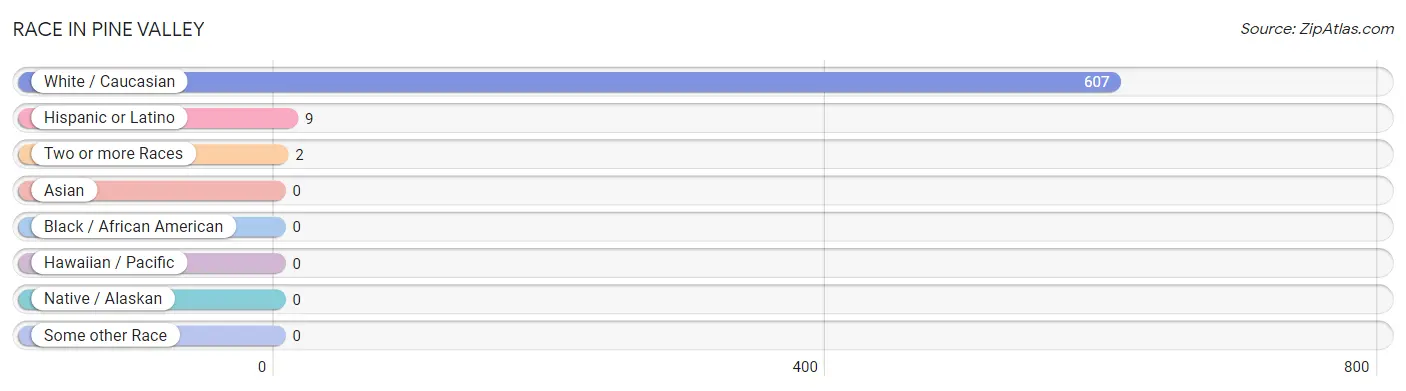
| Race | # Population | % Population |
| Asian | 0 | 0.0% |
| Black / African American | 0 | 0.0% |
| Hawaiian / Pacific | 0 | 0.0% |
| Hispanic or Latino | 9 | 1.5% |
| Native / Alaskan | 0 | 0.0% |
| White / Caucasian | 607 | 99.7% |
| Two or more Races | 2 | 0.3% |
| Some other Race | 0 | 0.0% |
| Total | 609 | 100.0% |
Ancestry in Pine Valley
The most populous ancestries reported in Pine Valley are Irish (130 | 21.3%), Polish (91 | 14.9%), Italian (68 | 11.2%), American (64 | 10.5%), and Czech (55 | 9.0%), together accounting for 67.0% of all Pine Valley residents.
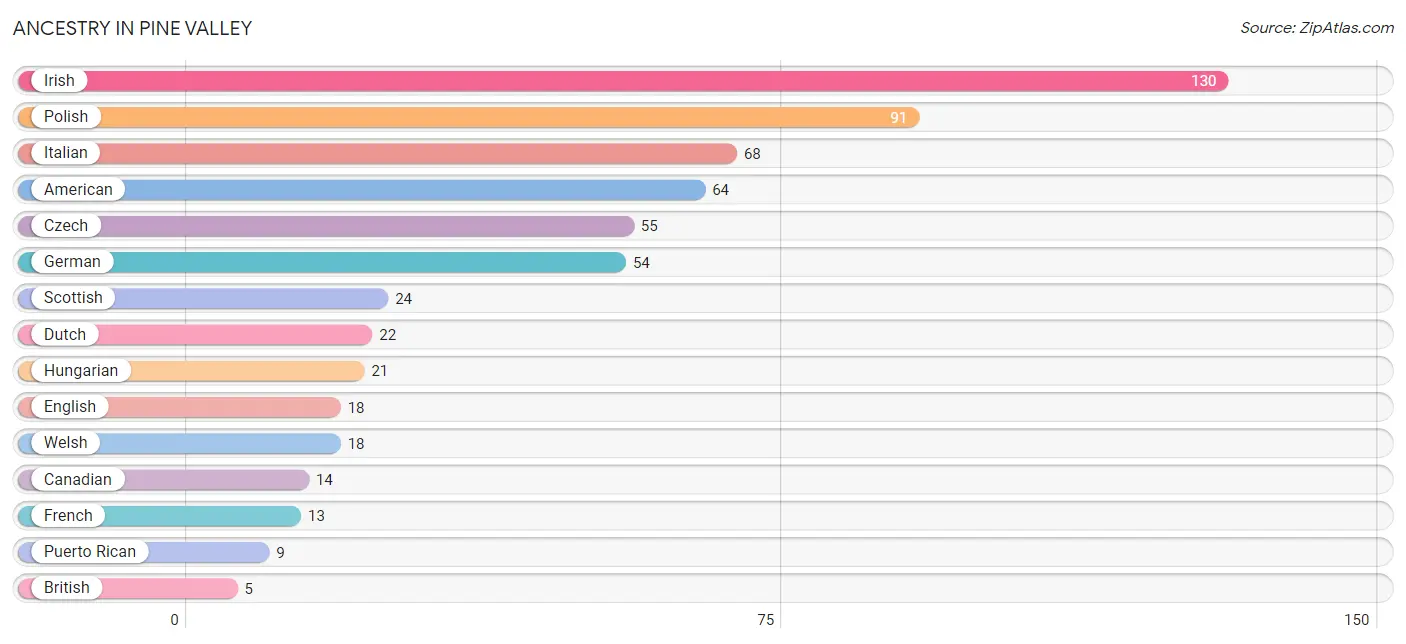
| Ancestry | # Population | % Population |
| American | 64 | 10.5% |
| British | 5 | 0.8% |
| Canadian | 14 | 2.3% |
| Czech | 55 | 9.0% |
| Dutch | 22 | 3.6% |
| English | 18 | 3.0% |
| French | 13 | 2.1% |
| German | 54 | 8.9% |
| Hungarian | 21 | 3.5% |
| Irish | 130 | 21.3% |
| Italian | 68 | 11.2% |
| Polish | 91 | 14.9% |
| Puerto Rican | 9 | 1.5% |
| Scottish | 24 | 3.9% |
| Slovak | 5 | 0.8% |
| Welsh | 18 | 3.0% | View All 16 Rows |
Immigrants in Pine Valley
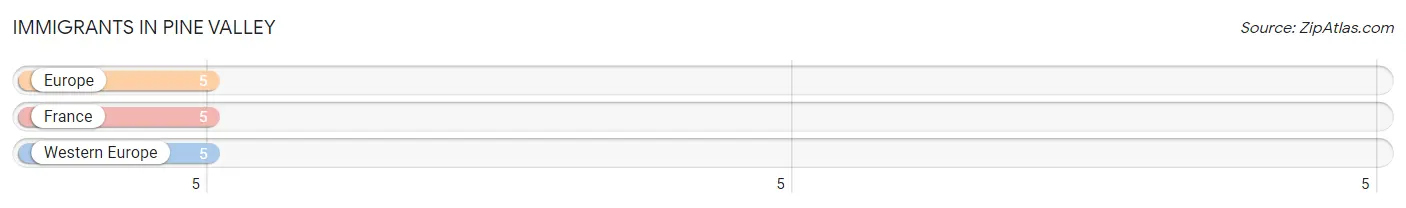
The most numerous immigrant groups reported in Pine Valley came from Europe (5 | 0.8%), France (5 | 0.8%), and Western Europe (5 | 0.8%), together accounting for 2.5% of all Pine Valley residents.
| Immigration Origin | # Population | % Population |
| Europe | 5 | 0.8% |
| France | 5 | 0.8% |
| Western Europe | 5 | 0.8% | View All 3 Rows |
Sex and Age in Pine Valley
Sex and Age in Pine Valley
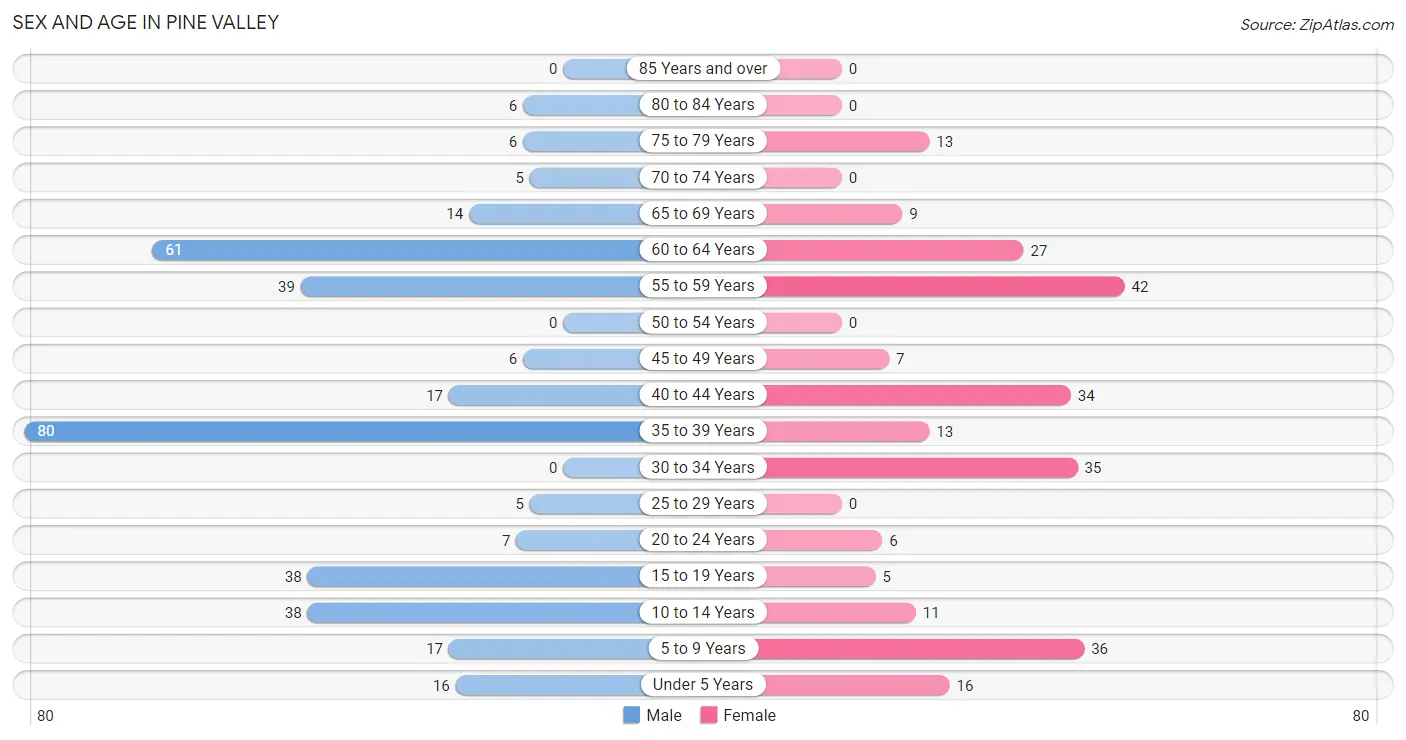
The most populous age groups in Pine Valley are 35 to 39 Years (80 | 22.5%) for men and 55 to 59 Years (42 | 16.5%) for women.
| Age Bracket | Male | Female |
| Under 5 Years | 16 (4.5%) | 16 (6.3%) |
| 5 to 9 Years | 17 (4.8%) | 36 (14.2%) |
| 10 to 14 Years | 38 (10.7%) | 11 (4.3%) |
| 15 to 19 Years | 38 (10.7%) | 5 (2.0%) |
| 20 to 24 Years | 7 (2.0%) | 6 (2.4%) |
| 25 to 29 Years | 5 (1.4%) | 0 (0.0%) |
| 30 to 34 Years | 0 (0.0%) | 35 (13.8%) |
| 35 to 39 Years | 80 (22.5%) | 13 (5.1%) |
| 40 to 44 Years | 17 (4.8%) | 34 (13.4%) |
| 45 to 49 Years | 6 (1.7%) | 7 (2.8%) |
| 50 to 54 Years | 0 (0.0%) | 0 (0.0%) |
| 55 to 59 Years | 39 (11.0%) | 42 (16.5%) |
| 60 to 64 Years | 61 (17.2%) | 27 (10.6%) |
| 65 to 69 Years | 14 (3.9%) | 9 (3.5%) |
| 70 to 74 Years | 5 (1.4%) | 0 (0.0%) |
| 75 to 79 Years | 6 (1.7%) | 13 (5.1%) |
| 80 to 84 Years | 6 (1.7%) | 0 (0.0%) |
| 85 Years and over | 0 (0.0%) | 0 (0.0%) |
| Total | 355 (100.0%) | 254 (100.0%) |
Families and Households in Pine Valley
Median Family Size in Pine Valley
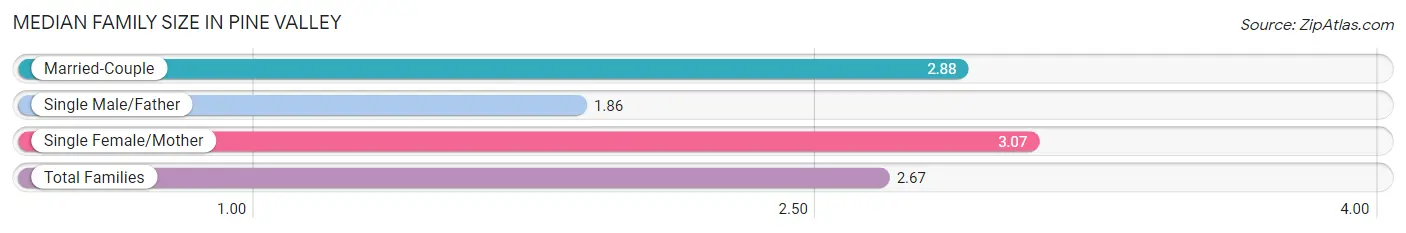
The median family size in Pine Valley is 2.67 persons per family, with single female/mother families (57 | 30.0%) accounting for the largest median family size of 3.07 persons per family. On the other hand, single male/father families (49 | 25.8%) represent the smallest median family size with 1.86 persons per family.
| Family Type | # Families | Family Size |
| Married-Couple | 84 (44.2%) | 2.88 |
| Single Male/Father | 49 (25.8%) | 1.86 |
| Single Female/Mother | 57 (30.0%) | 3.07 |
| Total Families | 190 (100.0%) | 2.67 |
Median Household Size in Pine Valley
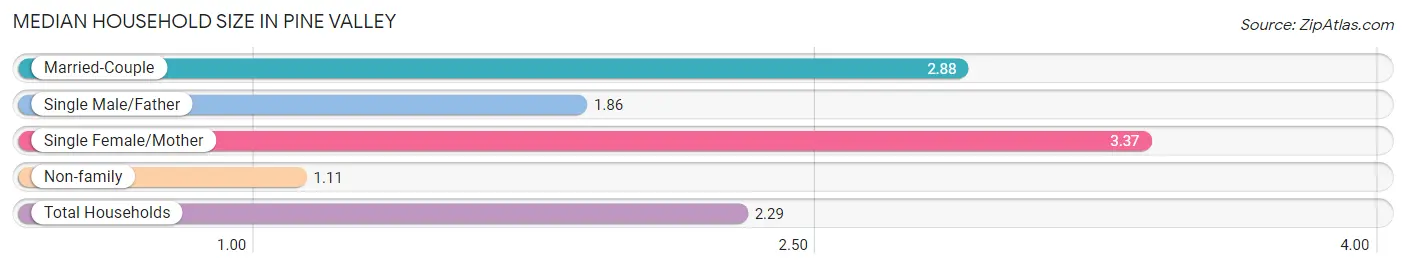
The median household size in Pine Valley is 2.29 persons per household, with single female/mother households (57 | 21.4%) accounting for the largest median household size of 3.37 persons per household. non-family households (76 | 28.6%) represent the smallest median household size with 1.11 persons per household.
| Household Type | # Households | Household Size |
| Married-Couple | 84 (31.6%) | 2.88 |
| Single Male/Father | 49 (18.4%) | 1.86 |
| Single Female/Mother | 57 (21.4%) | 3.37 |
| Non-family | 76 (28.6%) | 1.11 |
| Total Households | 266 (100.0%) | 2.29 |
Household Size by Marriage Status in Pine Valley
Out of a total of 266 households in Pine Valley, 190 (71.4%) are family households, while 76 (28.6%) are nonfamily households. The most numerous type of family households are 2-person households, comprising 110, and the most common type of nonfamily households are 1-person households, comprising 68.
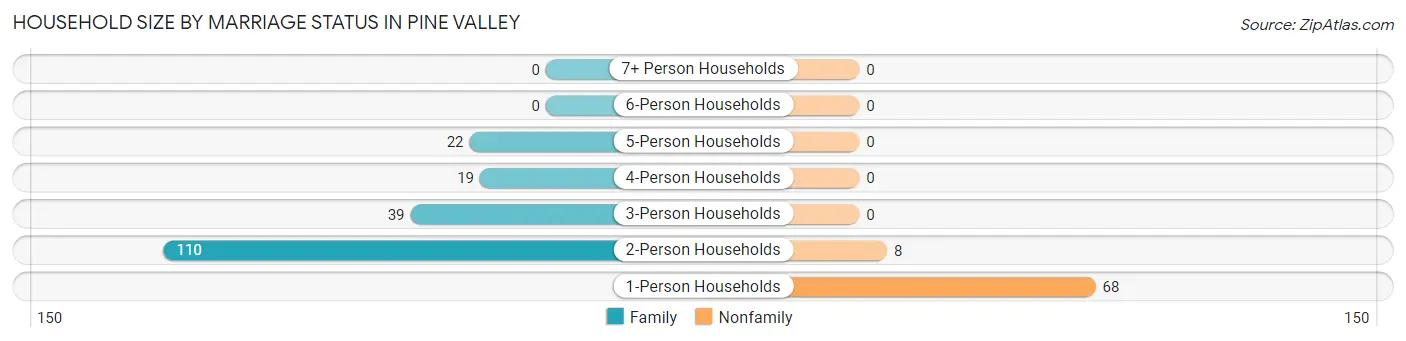
| Household Size | Family Households | Nonfamily Households |
| 1-Person Households | - | 68 (25.6%) |
| 2-Person Households | 110 (41.3%) | 8 (3.0%) |
| 3-Person Households | 39 (14.7%) | 0 (0.0%) |
| 4-Person Households | 19 (7.1%) | 0 (0.0%) |
| 5-Person Households | 22 (8.3%) | 0 (0.0%) |
| 6-Person Households | 0 (0.0%) | 0 (0.0%) |
| 7+ Person Households | 0 (0.0%) | 0 (0.0%) |
| Total | 190 (71.4%) | 76 (28.6%) |
Female Fertility in Pine Valley
Fertility by Age in Pine Valley
Average fertility rate in Pine Valley is 140.0 births per 1,000 women. Women in the age bracket of 20 to 34 years have the highest fertility rate with 341.0 births per 1,000 women. Women in the age bracket of 20 to 34 years acount for 100.0% of all women with births.
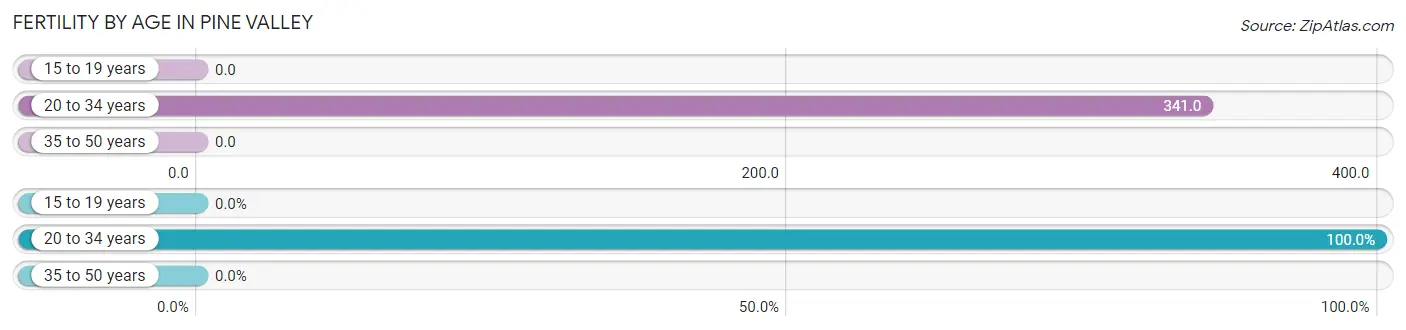
| Age Bracket | Women with Births | Births / 1,000 Women |
| 15 to 19 years | 0 (0.0%) | 0.0 |
| 20 to 34 years | 14 (100.0%) | 341.0 |
| 35 to 50 years | 0 (0.0%) | 0.0 |
| Total | 14 (100.0%) | 140.0 |
Fertility by Age by Marriage Status in Pine Valley
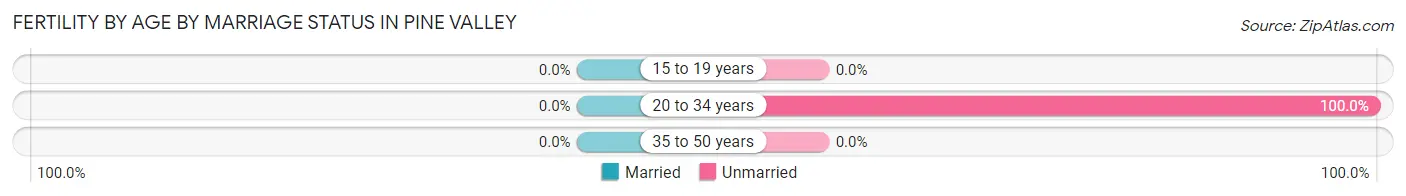
| Age Bracket | Married | Unmarried |
| 15 to 19 years | 0 (0.0%) | 0 (0.0%) |
| 20 to 34 years | 0 (0.0%) | 14 (100.0%) |
| 35 to 50 years | 0 (0.0%) | 0 (0.0%) |
| Total | 0 (0.0%) | 14 (100.0%) |
Fertility by Education in Pine Valley
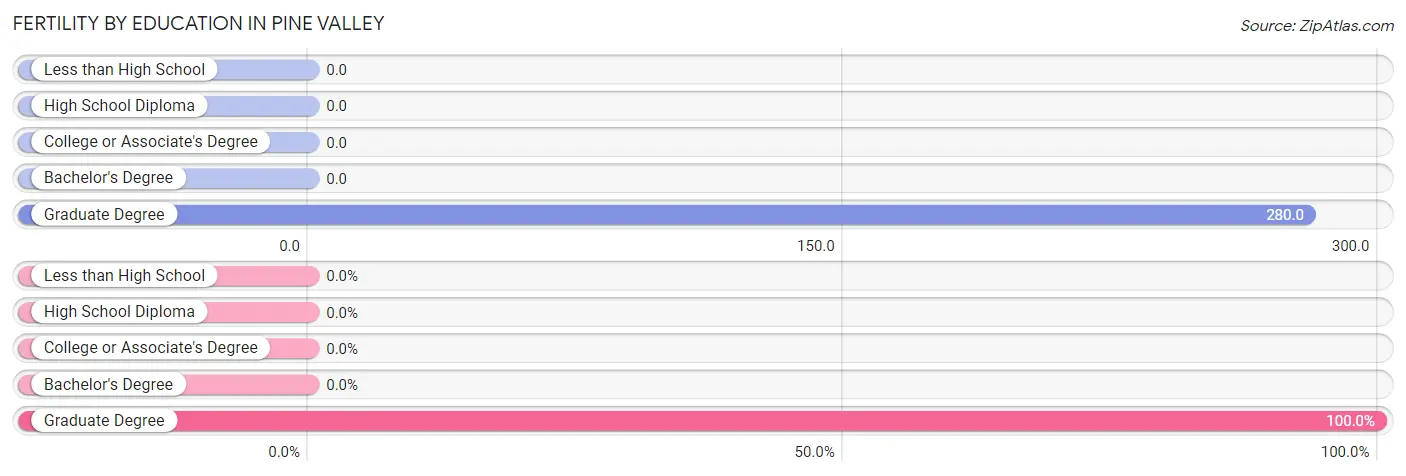
| Educational Attainment | Women with Births | Births / 1,000 Women |
| Less than High School | 0 (0.0%) | 0.0 |
| High School Diploma | 0 (0.0%) | 0.0 |
| College or Associate's Degree | 0 (0.0%) | 0.0 |
| Bachelor's Degree | 0 (0.0%) | 0.0 |
| Graduate Degree | 14 (100.0%) | 280.0 |
| Total | 14 (100.0%) | 140.0 |
Fertility by Education by Marriage Status in Pine Valley
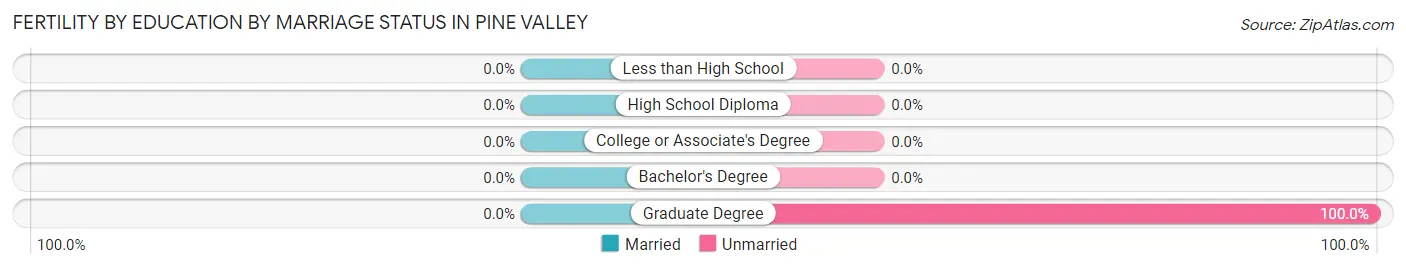
| Educational Attainment | Married | Unmarried |
| Less than High School | 0 (0.0%) | 0 (0.0%) |
| High School Diploma | 0 (0.0%) | 0 (0.0%) |
| College or Associate's Degree | 0 (0.0%) | 0 (0.0%) |
| Bachelor's Degree | 0 (0.0%) | 0 (0.0%) |
| Graduate Degree | 0 (0.0%) | 14 (100.0%) |
| Total | 0 (0.0%) | 14 (100.0%) |
Employment Characteristics in Pine Valley
Employment by Class of Employer in Pine Valley
Among the 273 employed individuals in Pine Valley, private company employees (135 | 49.4%), not-for-profit organizations (41 | 15.0%), and local government employees (35 | 12.8%) make up the most common classes of employment.
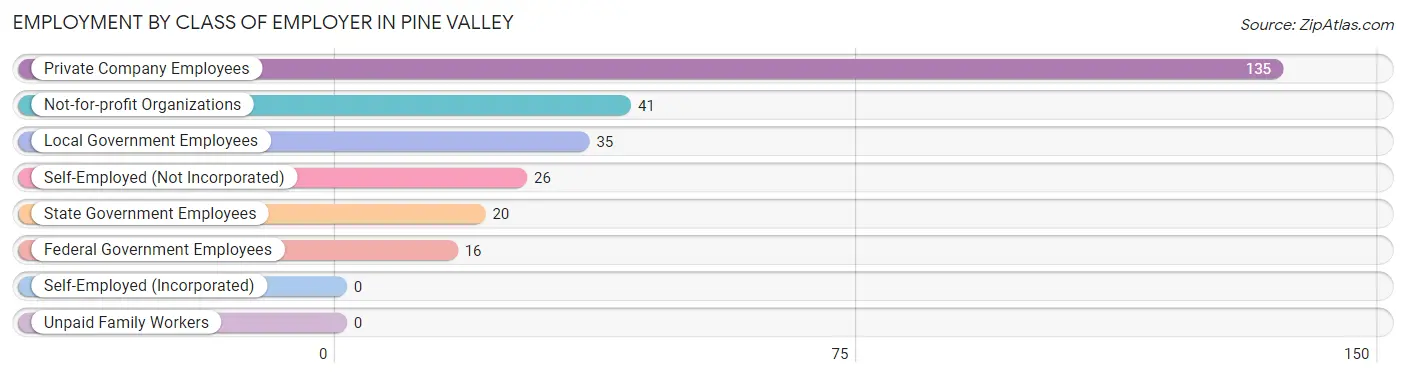
| Employer Class | # Employees | % Employees |
| Private Company Employees | 135 | 49.4% |
| Self-Employed (Incorporated) | 0 | 0.0% |
| Self-Employed (Not Incorporated) | 26 | 9.5% |
| Not-for-profit Organizations | 41 | 15.0% |
| Local Government Employees | 35 | 12.8% |
| State Government Employees | 20 | 7.3% |
| Federal Government Employees | 16 | 5.9% |
| Unpaid Family Workers | 0 | 0.0% |
| Total | 273 | 100.0% |
Employment Status by Age in Pine Valley
According to the labor force statistics for Pine Valley, out of the total population over 16 years of age (472), 58.9% or 278 individuals are in the labor force, with 1.8% or 5 of them unemployed. The age group with the highest labor force participation rate is 25 to 29 years, with 100.0% or 5 individuals in the labor force. Within the labor force, the 35 to 44 years age range has the highest percentage of unemployed individuals, with 4.0% or 5 of them being unemployed.
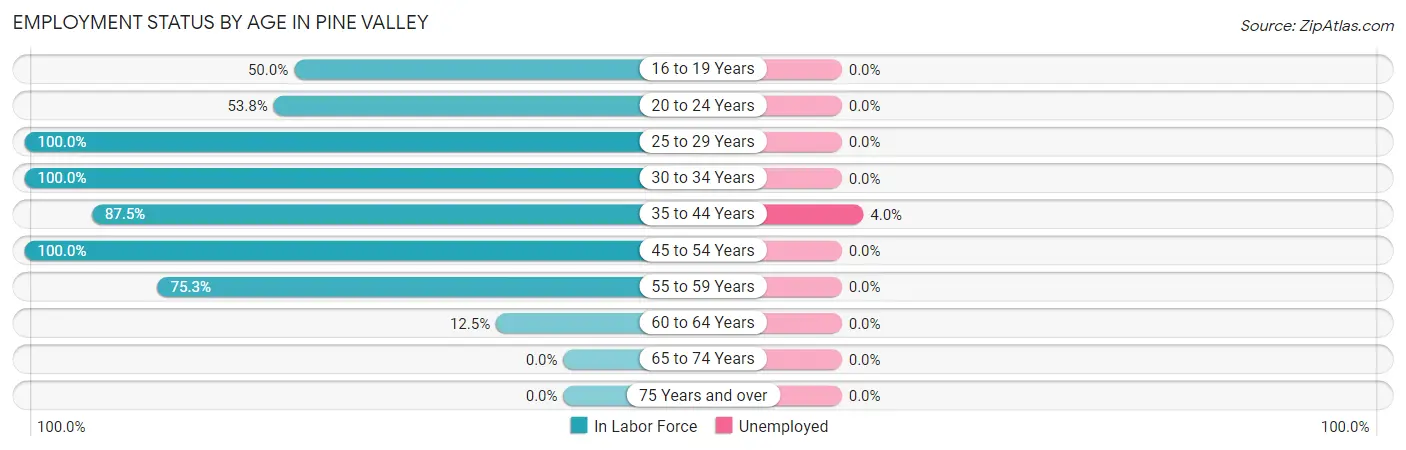
| Age Bracket | In Labor Force | Unemployed |
| 16 to 19 Years | 20 (50.0%) | 0 (0.0%) |
| 20 to 24 Years | 7 (53.8%) | 0 (0.0%) |
| 25 to 29 Years | 5 (100.0%) | 0 (0.0%) |
| 30 to 34 Years | 35 (100.0%) | 0 (0.0%) |
| 35 to 44 Years | 126 (87.5%) | 5 (4.0%) |
| 45 to 54 Years | 13 (100.0%) | 0 (0.0%) |
| 55 to 59 Years | 61 (75.3%) | 0 (0.0%) |
| 60 to 64 Years | 11 (12.5%) | 0 (0.0%) |
| 65 to 74 Years | 0 (0.0%) | 0 (0.0%) |
| 75 Years and over | 0 (0.0%) | 0 (0.0%) |
| Total | 278 (58.9%) | 5 (1.8%) |
Employment Status by Educational Attainment in Pine Valley
According to labor force statistics for Pine Valley, 68.6% of individuals (251) out of the total population between 25 and 64 years of age (366) are in the labor force, with 2.0% or 5 of them being unemployed. The group with the highest labor force participation rate are those with the educational attainment of bachelor's degree or higher, with 94.2% or 81 individuals in the labor force. Within the labor force, individuals with high school diploma education have the highest percentage of unemployment, with 9.4% or 5 of them being unemployed.
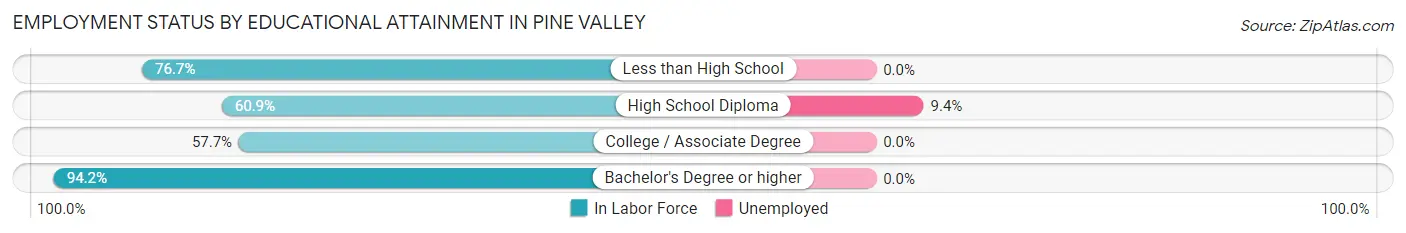
| Educational Attainment | In Labor Force | Unemployed |
| Less than High School | 23 (76.7%) | 0 (0.0%) |
| High School Diploma | 53 (60.9%) | 8 (9.4%) |
| College / Associate Degree | 94 (57.7%) | 0 (0.0%) |
| Bachelor's Degree or higher | 81 (94.2%) | 0 (0.0%) |
| Total | 251 (68.6%) | 7 (2.0%) |
Employment Occupations by Sex in Pine Valley
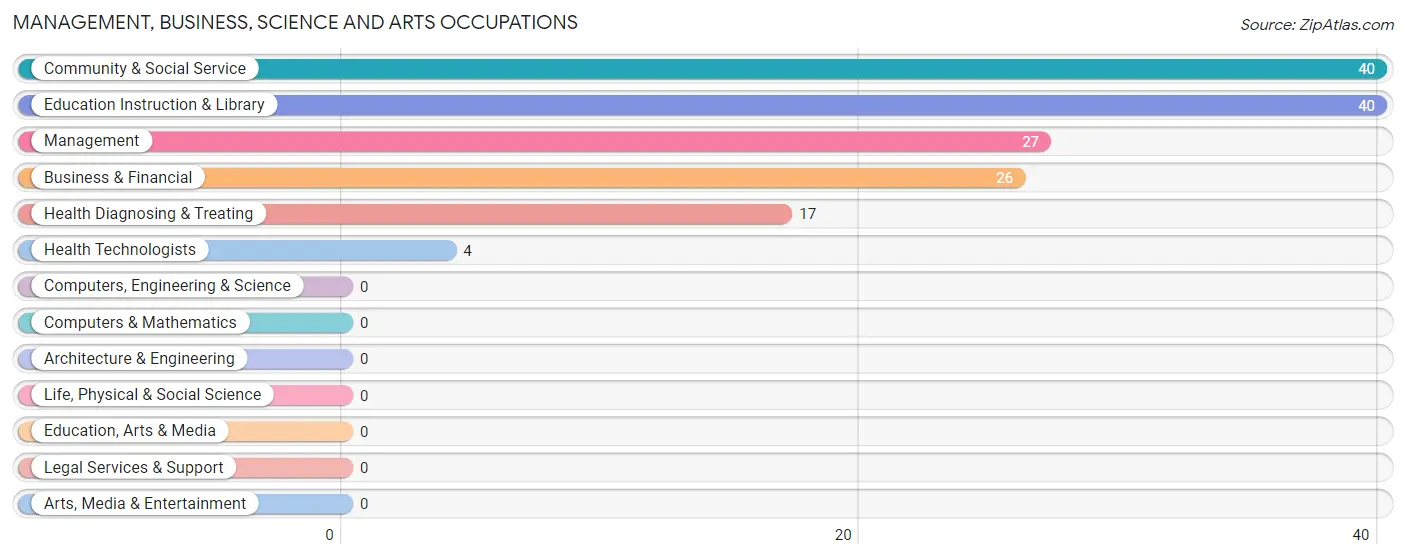
Management, Business, Science and Arts Occupations
The most common Management, Business, Science and Arts occupations in Pine Valley are Community & Social Service (40 | 14.6%), Education Instruction & Library (40 | 14.6%), Management (27 | 9.9%), Business & Financial (26 | 9.5%), and Health Diagnosing & Treating (17 | 6.2%).
Management, Business, Science and Arts Occupations by Sex
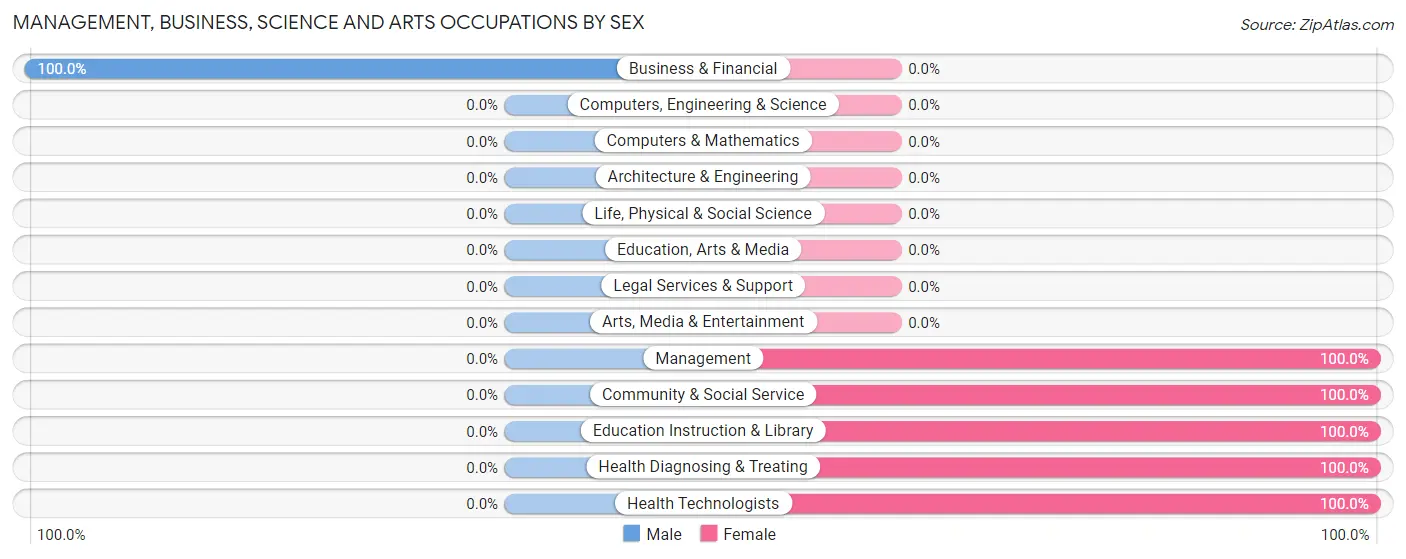
| Occupation | Male | Female |
| Management | 0 (0.0%) | 27 (100.0%) |
| Business & Financial | 26 (100.0%) | 0 (0.0%) |
| Computers, Engineering & Science | 0 (0.0%) | 0 (0.0%) |
| Computers & Mathematics | 0 (0.0%) | 0 (0.0%) |
| Architecture & Engineering | 0 (0.0%) | 0 (0.0%) |
| Life, Physical & Social Science | 0 (0.0%) | 0 (0.0%) |
| Community & Social Service | 0 (0.0%) | 40 (100.0%) |
| Education, Arts & Media | 0 (0.0%) | 0 (0.0%) |
| Legal Services & Support | 0 (0.0%) | 0 (0.0%) |
| Education Instruction & Library | 0 (0.0%) | 40 (100.0%) |
| Arts, Media & Entertainment | 0 (0.0%) | 0 (0.0%) |
| Health Diagnosing & Treating | 0 (0.0%) | 17 (100.0%) |
| Health Technologists | 0 (0.0%) | 4 (100.0%) |
| Total (Category) | 26 (23.6%) | 84 (76.4%) |
| Total (Overall) | 146 (53.5%) | 127 (46.5%) |
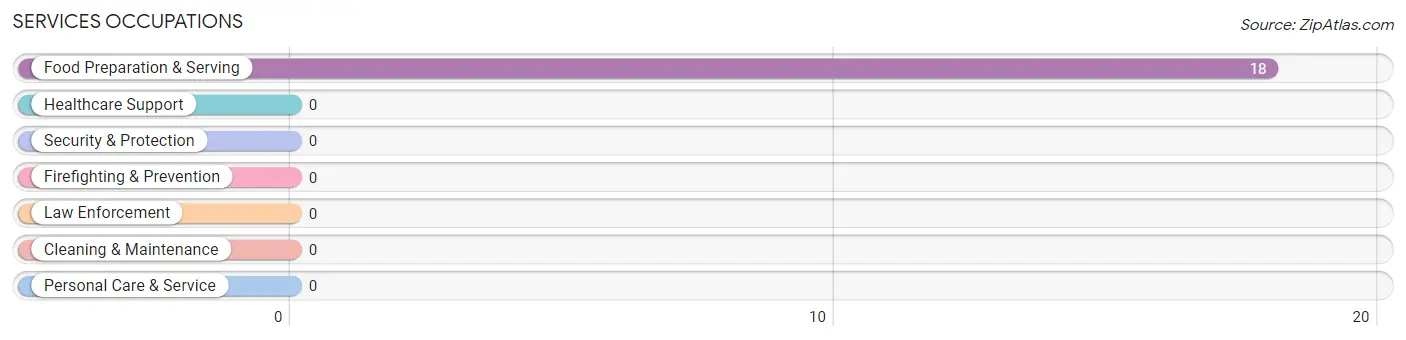
Services Occupations
The most common Services occupations in Pine Valley are , and Food Preparation & Serving (18 | 6.6%).
Services Occupations by Sex
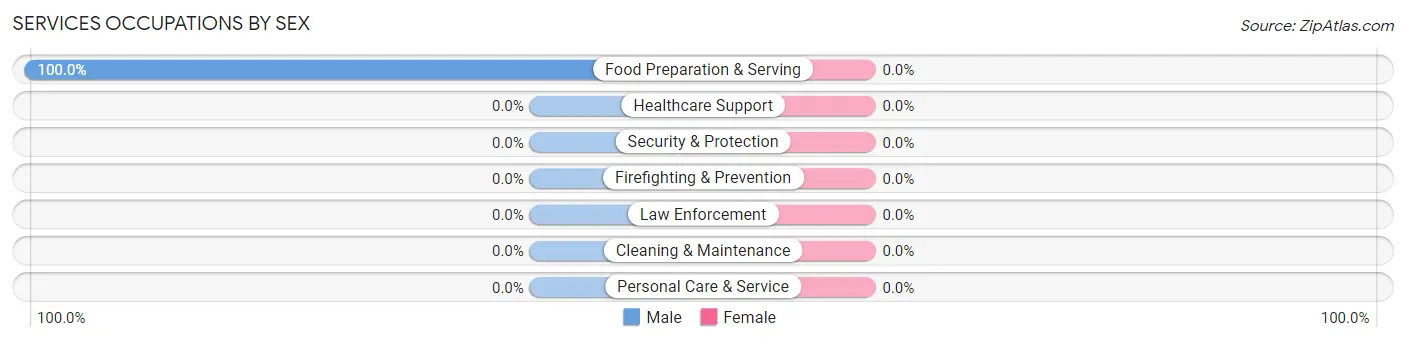
| Occupation | Male | Female |
| Healthcare Support | 0 (0.0%) | 0 (0.0%) |
| Security & Protection | 0 (0.0%) | 0 (0.0%) |
| Firefighting & Prevention | 0 (0.0%) | 0 (0.0%) |
| Law Enforcement | 0 (0.0%) | 0 (0.0%) |
| Food Preparation & Serving | 18 (100.0%) | 0 (0.0%) |
| Cleaning & Maintenance | 0 (0.0%) | 0 (0.0%) |
| Personal Care & Service | 0 (0.0%) | 0 (0.0%) |
| Total (Category) | 18 (100.0%) | 0 (0.0%) |
| Total (Overall) | 146 (53.5%) | 127 (46.5%) |
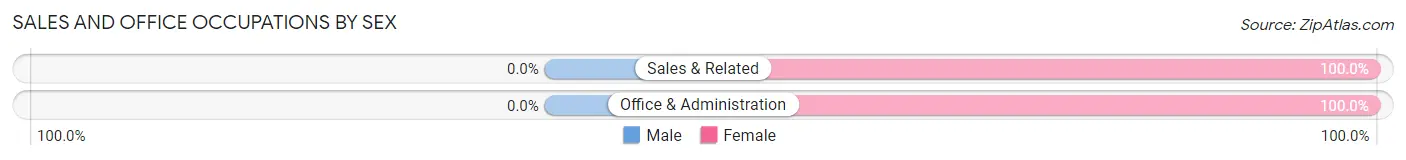
Sales and Office Occupations
The most common Sales and Office occupations in Pine Valley are Office & Administration (24 | 8.8%), and Sales & Related (15 | 5.5%).

Sales and Office Occupations by Sex
| Occupation | Male | Female |
| Sales & Related | 0 (0.0%) | 15 (100.0%) |
| Office & Administration | 0 (0.0%) | 24 (100.0%) |
| Total (Category) | 0 (0.0%) | 39 (100.0%) |
| Total (Overall) | 146 (53.5%) | 127 (46.5%) |
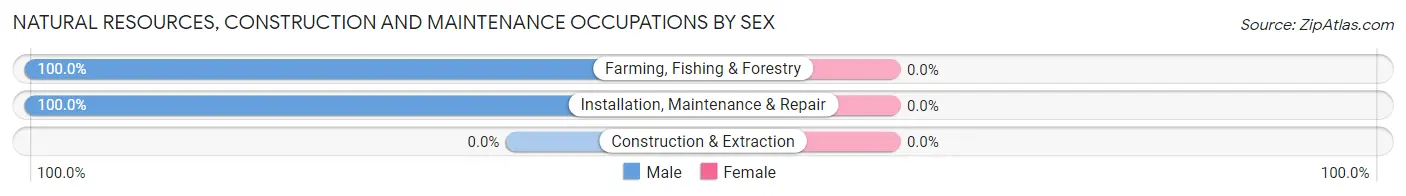
Natural Resources, Construction and Maintenance Occupations
The most common Natural Resources, Construction and Maintenance occupations in Pine Valley are Farming, Fishing & Forestry (42 | 15.4%), and Installation, Maintenance & Repair (15 | 5.5%).

Natural Resources, Construction and Maintenance Occupations by Sex
| Occupation | Male | Female |
| Farming, Fishing & Forestry | 42 (100.0%) | 0 (0.0%) |
| Construction & Extraction | 0 (0.0%) | 0 (0.0%) |
| Installation, Maintenance & Repair | 15 (100.0%) | 0 (0.0%) |
| Total (Category) | 57 (100.0%) | 0 (0.0%) |
| Total (Overall) | 146 (53.5%) | 127 (46.5%) |
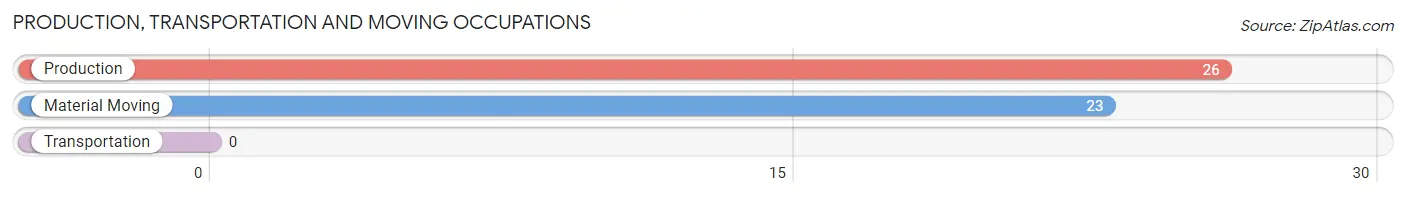
Production, Transportation and Moving Occupations
The most common Production, Transportation and Moving occupations in Pine Valley are Production (26 | 9.5%), and Material Moving (23 | 8.4%).
Production, Transportation and Moving Occupations by Sex
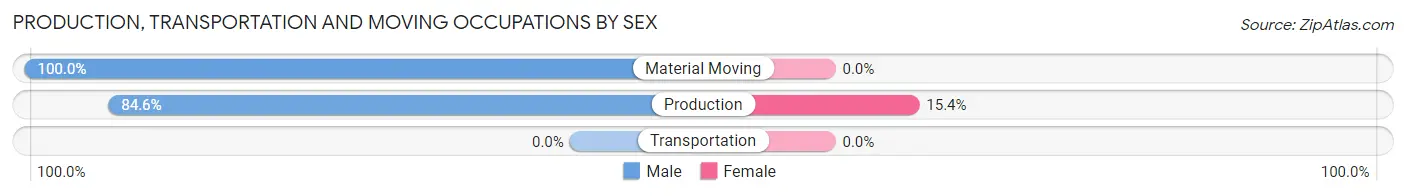
| Occupation | Male | Female |
| Production | 22 (84.6%) | 4 (15.4%) |
| Transportation | 0 (0.0%) | 0 (0.0%) |
| Material Moving | 23 (100.0%) | 0 (0.0%) |
| Total (Category) | 45 (91.8%) | 4 (8.2%) |
| Total (Overall) | 146 (53.5%) | 127 (46.5%) |
Employment Industries by Sex in Pine Valley
Employment Industries in Pine Valley
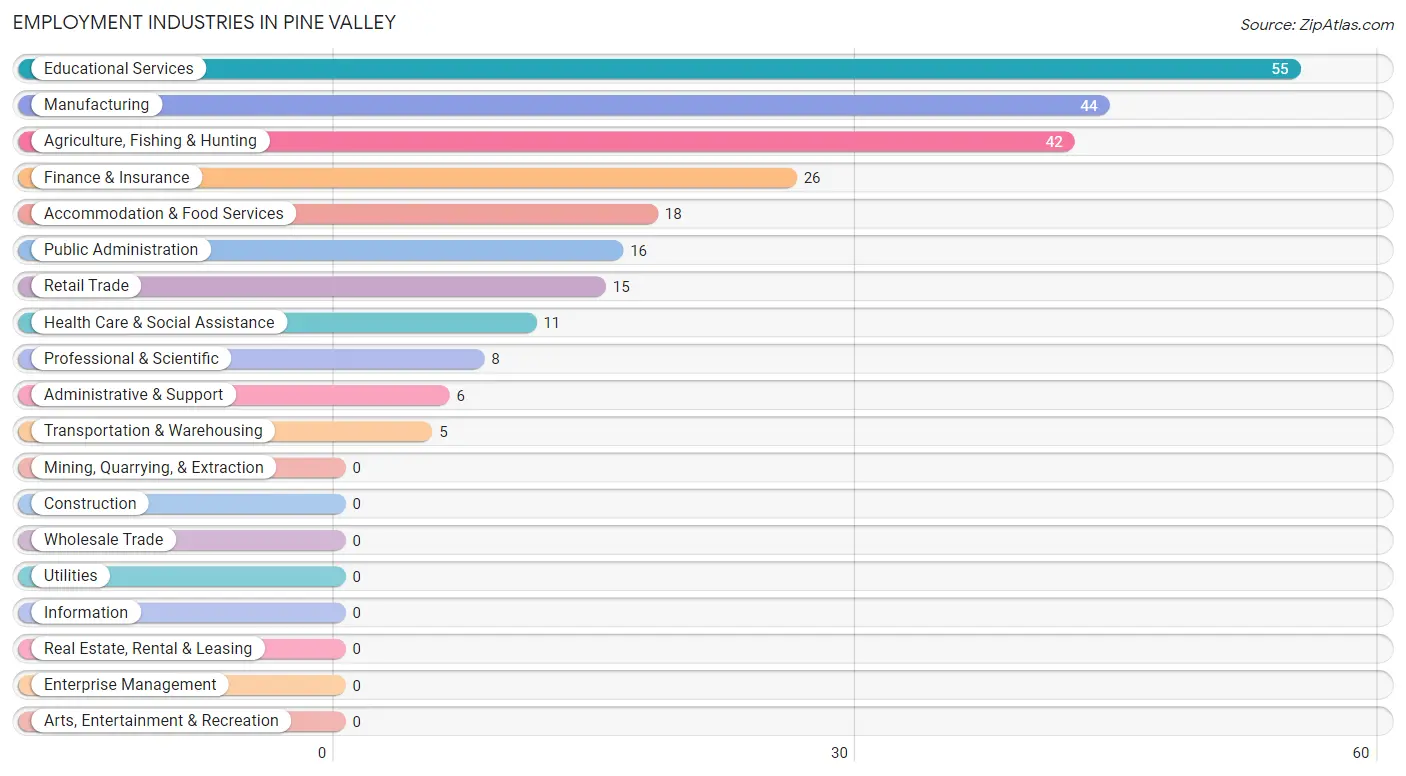
The major employment industries in Pine Valley include Educational Services (55 | 20.2%), Manufacturing (44 | 16.1%), Agriculture, Fishing & Hunting (42 | 15.4%), Finance & Insurance (26 | 9.5%), and Accommodation & Food Services (18 | 6.6%).
Employment Industries by Sex in Pine Valley
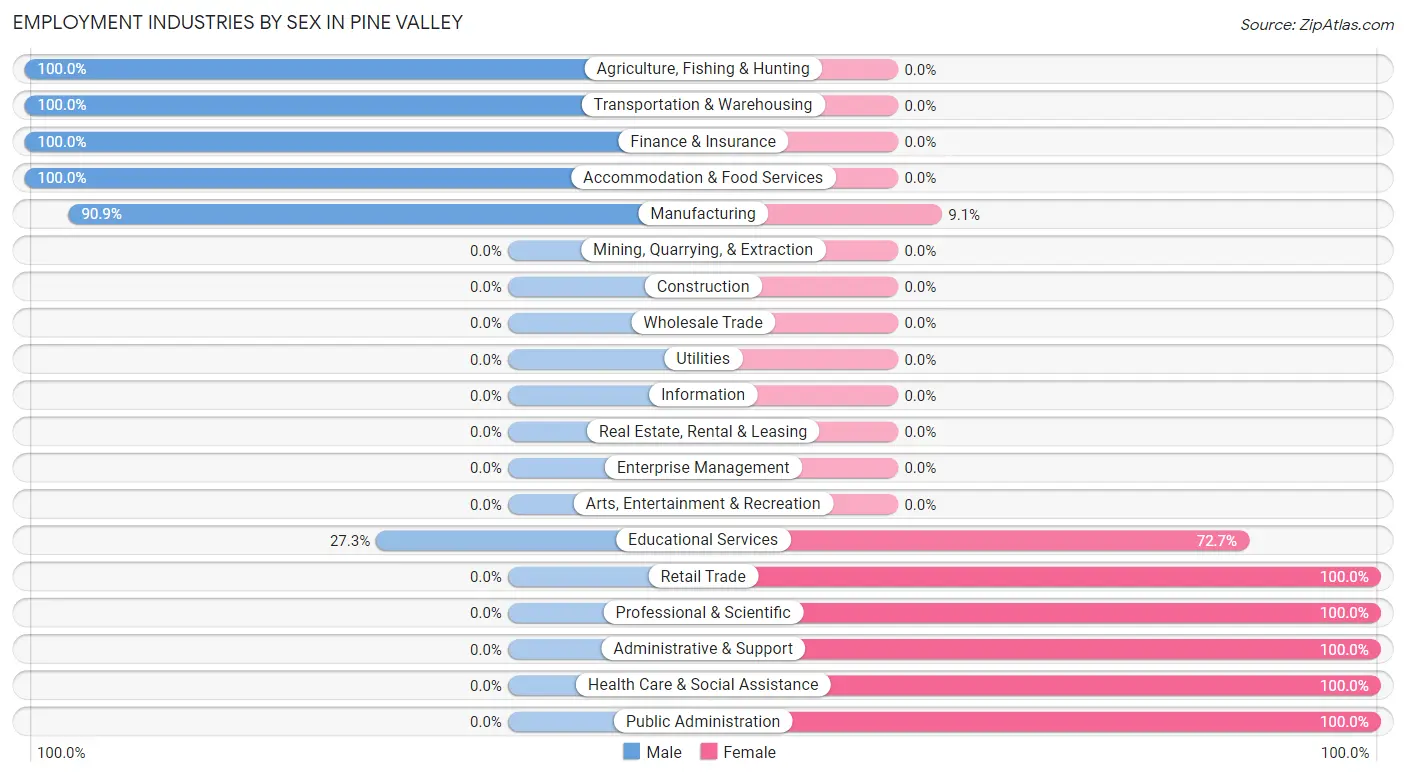
The Pine Valley industries that see more men than women are Agriculture, Fishing & Hunting (100.0%), Transportation & Warehousing (100.0%), and Finance & Insurance (100.0%), whereas the industries that tend to have a higher number of women are Retail Trade (100.0%), Professional & Scientific (100.0%), and Administrative & Support (100.0%).
| Industry | Male | Female |
| Agriculture, Fishing & Hunting | 42 (100.0%) | 0 (0.0%) |
| Mining, Quarrying, & Extraction | 0 (0.0%) | 0 (0.0%) |
| Construction | 0 (0.0%) | 0 (0.0%) |
| Manufacturing | 40 (90.9%) | 4 (9.1%) |
| Wholesale Trade | 0 (0.0%) | 0 (0.0%) |
| Retail Trade | 0 (0.0%) | 15 (100.0%) |
| Transportation & Warehousing | 5 (100.0%) | 0 (0.0%) |
| Utilities | 0 (0.0%) | 0 (0.0%) |
| Information | 0 (0.0%) | 0 (0.0%) |
| Finance & Insurance | 26 (100.0%) | 0 (0.0%) |
| Real Estate, Rental & Leasing | 0 (0.0%) | 0 (0.0%) |
| Professional & Scientific | 0 (0.0%) | 8 (100.0%) |
| Enterprise Management | 0 (0.0%) | 0 (0.0%) |
| Administrative & Support | 0 (0.0%) | 6 (100.0%) |
| Educational Services | 15 (27.3%) | 40 (72.7%) |
| Health Care & Social Assistance | 0 (0.0%) | 11 (100.0%) |
| Arts, Entertainment & Recreation | 0 (0.0%) | 0 (0.0%) |
| Accommodation & Food Services | 18 (100.0%) | 0 (0.0%) |
| Public Administration | 0 (0.0%) | 16 (100.0%) |
| Total | 146 (53.5%) | 127 (46.5%) |
Education in Pine Valley
School Enrollment in Pine Valley
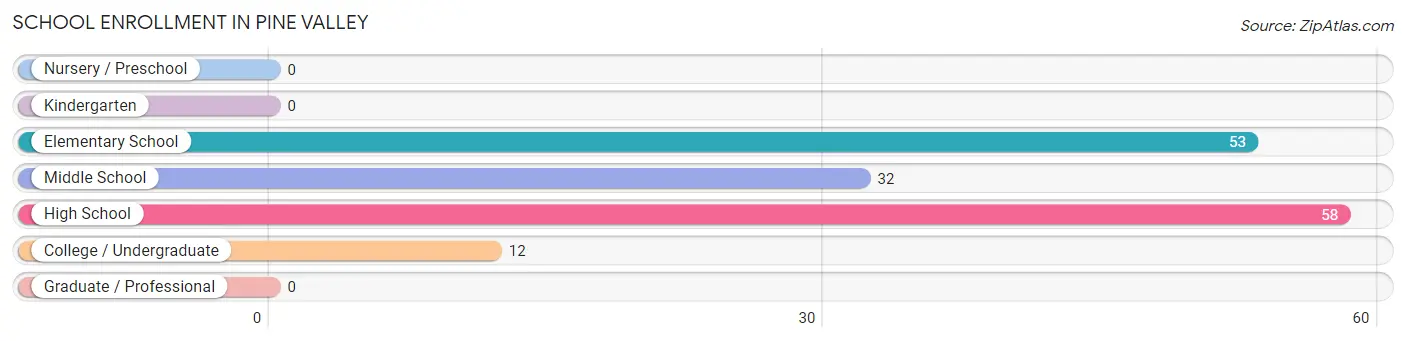
The most common levels of schooling among the 155 students in Pine Valley are high school (58 | 37.4%), elementary school (53 | 34.2%), and middle school (32 | 20.6%).
| School Level | # Students | % Students |
| Nursery / Preschool | 0 | 0.0% |
| Kindergarten | 0 | 0.0% |
| Elementary School | 53 | 34.2% |
| Middle School | 32 | 20.6% |
| High School | 58 | 37.4% |
| College / Undergraduate | 12 | 7.7% |
| Graduate / Professional | 0 | 0.0% |
| Total | 155 | 100.0% |
School Enrollment by Age by Funding Source in Pine Valley
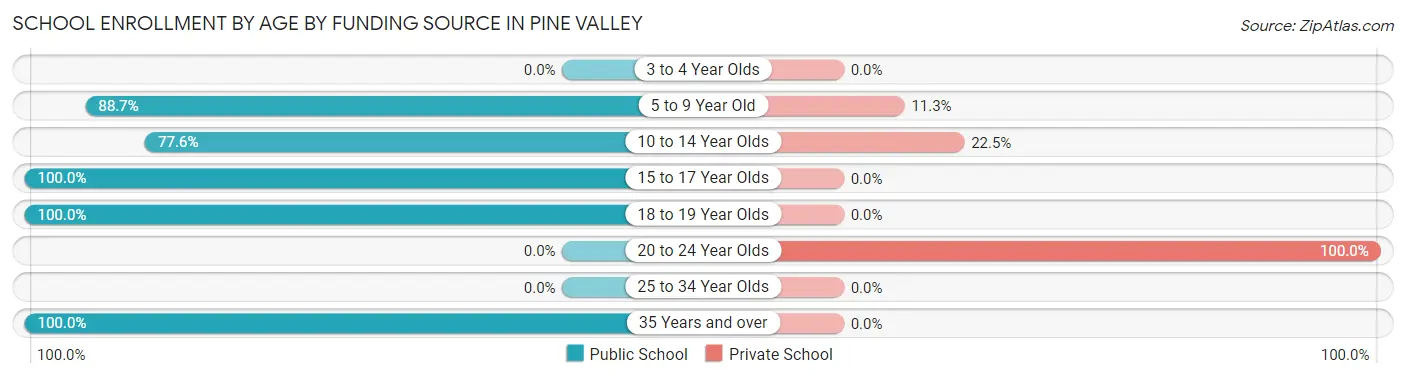
Out of a total of 155 students who are enrolled in schools in Pine Valley, 23 (14.8%) attend a private institution, while the remaining 132 (85.2%) are enrolled in public schools. The age group of 20 to 24 year olds has the highest likelihood of being enrolled in private schools, with 6 (100.0% in the age bracket) enrolled. Conversely, the age group of 15 to 17 year olds has the lowest likelihood of being enrolled in a private school, with 34 (100.0% in the age bracket) attending a public institution.
| Age Bracket | Public School | Private School |
| 3 to 4 Year Olds | 0 (0.0%) | 0 (0.0%) |
| 5 to 9 Year Old | 47 (88.7%) | 6 (11.3%) |
| 10 to 14 Year Olds | 38 (77.5%) | 11 (22.5%) |
| 15 to 17 Year Olds | 34 (100.0%) | 0 (0.0%) |
| 18 to 19 Year Olds | 7 (100.0%) | 0 (0.0%) |
| 20 to 24 Year Olds | 0 (0.0%) | 6 (100.0%) |
| 25 to 34 Year Olds | 0 (0.0%) | 0 (0.0%) |
| 35 Years and over | 6 (100.0%) | 0 (0.0%) |
| Total | 132 (85.2%) | 23 (14.8%) |
Educational Attainment by Field of Study in Pine Valley
Business (43 | 38.1%), education (34 | 30.1%), arts & humanities (27 | 23.9%), communications (5 | 4.4%), and science & technology (4 | 3.5%) are the most common fields of study among 113 individuals in Pine Valley who have obtained a bachelor's degree or higher.
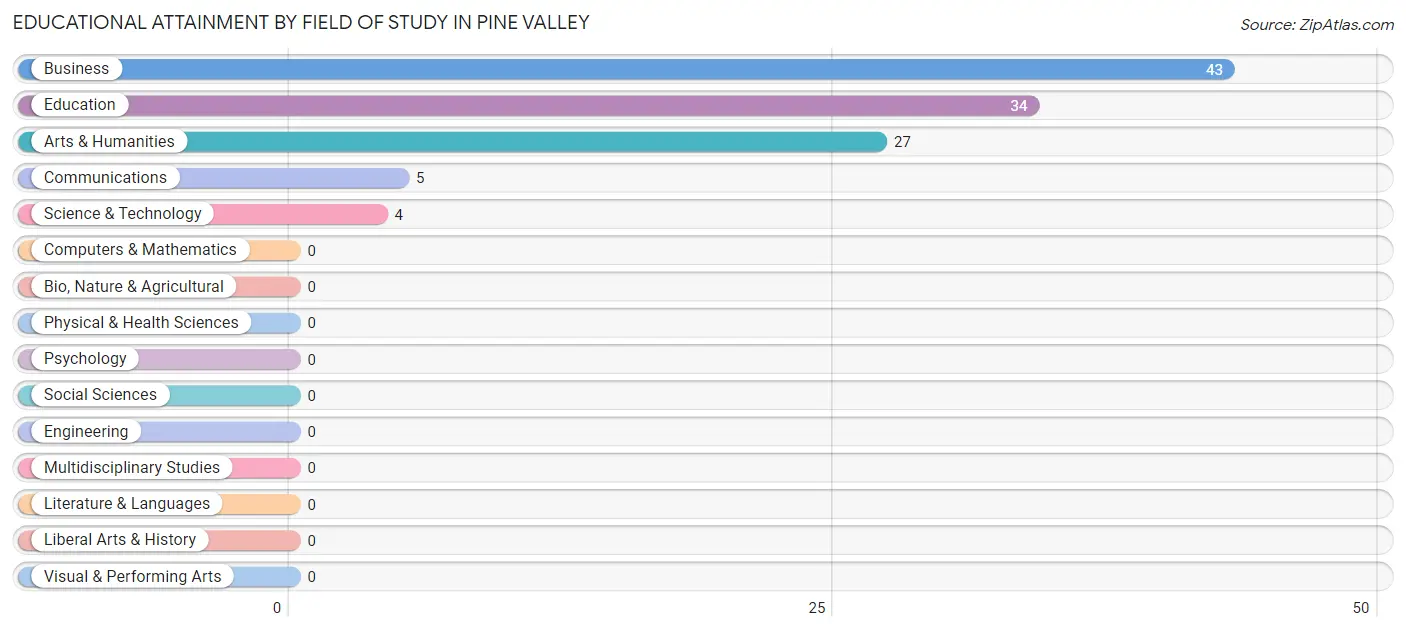
| Field of Study | # Graduates | % Graduates |
| Computers & Mathematics | 0 | 0.0% |
| Bio, Nature & Agricultural | 0 | 0.0% |
| Physical & Health Sciences | 0 | 0.0% |
| Psychology | 0 | 0.0% |
| Social Sciences | 0 | 0.0% |
| Engineering | 0 | 0.0% |
| Multidisciplinary Studies | 0 | 0.0% |
| Science & Technology | 4 | 3.5% |
| Business | 43 | 38.1% |
| Education | 34 | 30.1% |
| Literature & Languages | 0 | 0.0% |
| Liberal Arts & History | 0 | 0.0% |
| Visual & Performing Arts | 0 | 0.0% |
| Communications | 5 | 4.4% |
| Arts & Humanities | 27 | 23.9% |
| Total | 113 | 100.0% |
Transportation & Commute in Pine Valley
Vehicle Availability by Sex in Pine Valley
The most prevalent vehicle ownership categories in Pine Valley are males with 2 vehicles (75, accounting for 51.4%) and females with 2 vehicles (91, making up 59.1%).
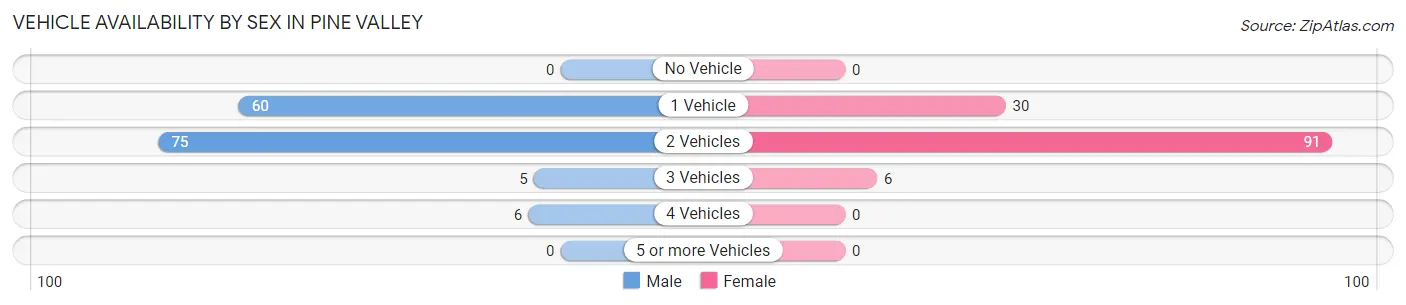
| Vehicles Available | Male | Female |
| No Vehicle | 0 (0.0%) | 0 (0.0%) |
| 1 Vehicle | 60 (41.1%) | 30 (23.6%) |
| 2 Vehicles | 75 (51.4%) | 91 (71.7%) |
| 3 Vehicles | 5 (3.4%) | 6 (4.7%) |
| 4 Vehicles | 6 (4.1%) | 0 (0.0%) |
| 5 or more Vehicles | 0 (0.0%) | 0 (0.0%) |
| Total | 146 (100.0%) | 127 (100.0%) |
Commute Time in Pine Valley
The most frequently occuring commute durations in Pine Valley are 15 to 19 minutes (91 commuters, 34.1%), 30 to 34 minutes (69 commuters, 25.8%), and 10 to 14 minutes (46 commuters, 17.2%).
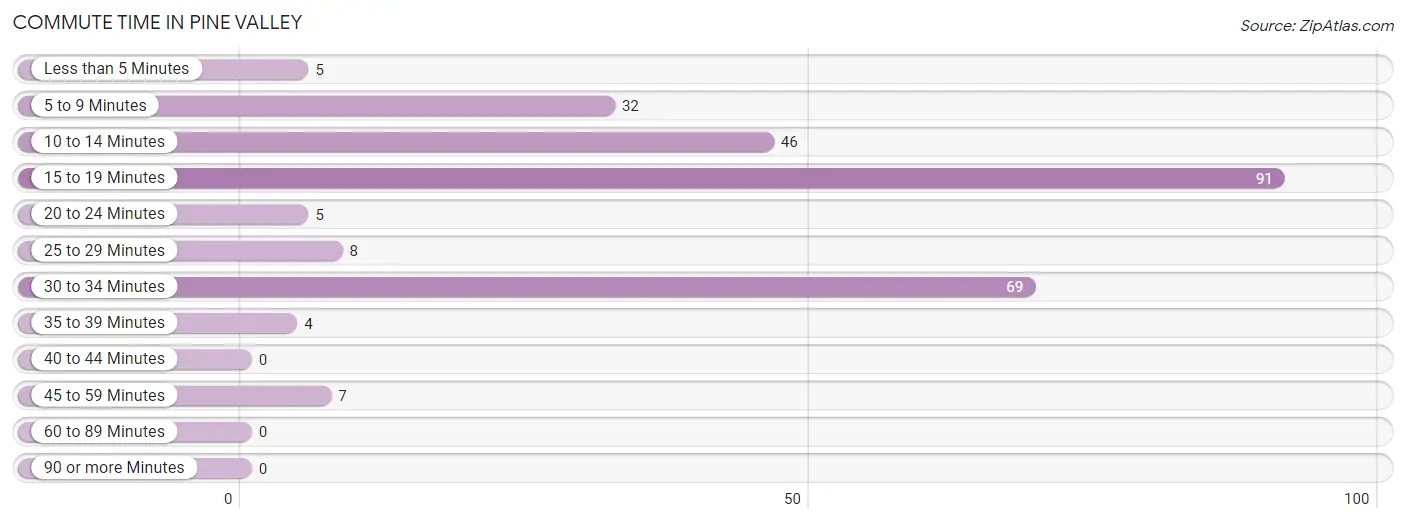
| Commute Time | # Commuters | % Commuters |
| Less than 5 Minutes | 5 | 1.9% |
| 5 to 9 Minutes | 32 | 12.0% |
| 10 to 14 Minutes | 46 | 17.2% |
| 15 to 19 Minutes | 91 | 34.1% |
| 20 to 24 Minutes | 5 | 1.9% |
| 25 to 29 Minutes | 8 | 3.0% |
| 30 to 34 Minutes | 69 | 25.8% |
| 35 to 39 Minutes | 4 | 1.5% |
| 40 to 44 Minutes | 0 | 0.0% |
| 45 to 59 Minutes | 7 | 2.6% |
| 60 to 89 Minutes | 0 | 0.0% |
| 90 or more Minutes | 0 | 0.0% |
Commute Time by Sex in Pine Valley
The most common commute times in Pine Valley are 15 to 19 minutes (49 commuters, 33.6%) for males and 15 to 19 minutes (42 commuters, 34.7%) for females.
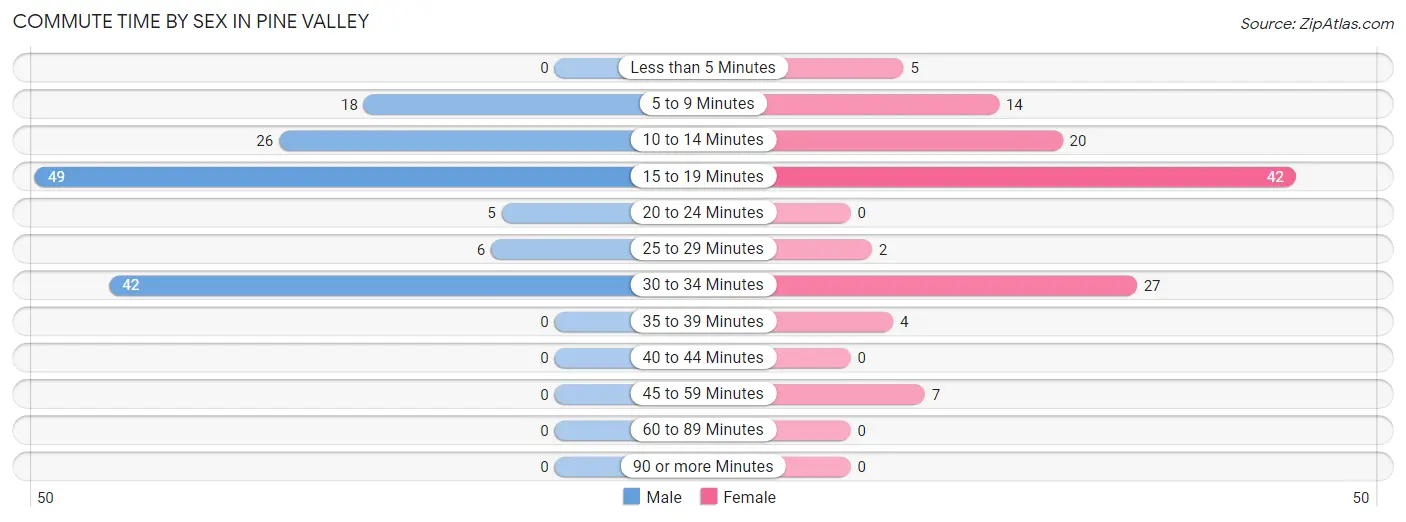
| Commute Time | Male | Female |
| Less than 5 Minutes | 0 (0.0%) | 5 (4.1%) |
| 5 to 9 Minutes | 18 (12.3%) | 14 (11.6%) |
| 10 to 14 Minutes | 26 (17.8%) | 20 (16.5%) |
| 15 to 19 Minutes | 49 (33.6%) | 42 (34.7%) |
| 20 to 24 Minutes | 5 (3.4%) | 0 (0.0%) |
| 25 to 29 Minutes | 6 (4.1%) | 2 (1.7%) |
| 30 to 34 Minutes | 42 (28.8%) | 27 (22.3%) |
| 35 to 39 Minutes | 0 (0.0%) | 4 (3.3%) |
| 40 to 44 Minutes | 0 (0.0%) | 0 (0.0%) |
| 45 to 59 Minutes | 0 (0.0%) | 7 (5.8%) |
| 60 to 89 Minutes | 0 (0.0%) | 0 (0.0%) |
| 90 or more Minutes | 0 (0.0%) | 0 (0.0%) |
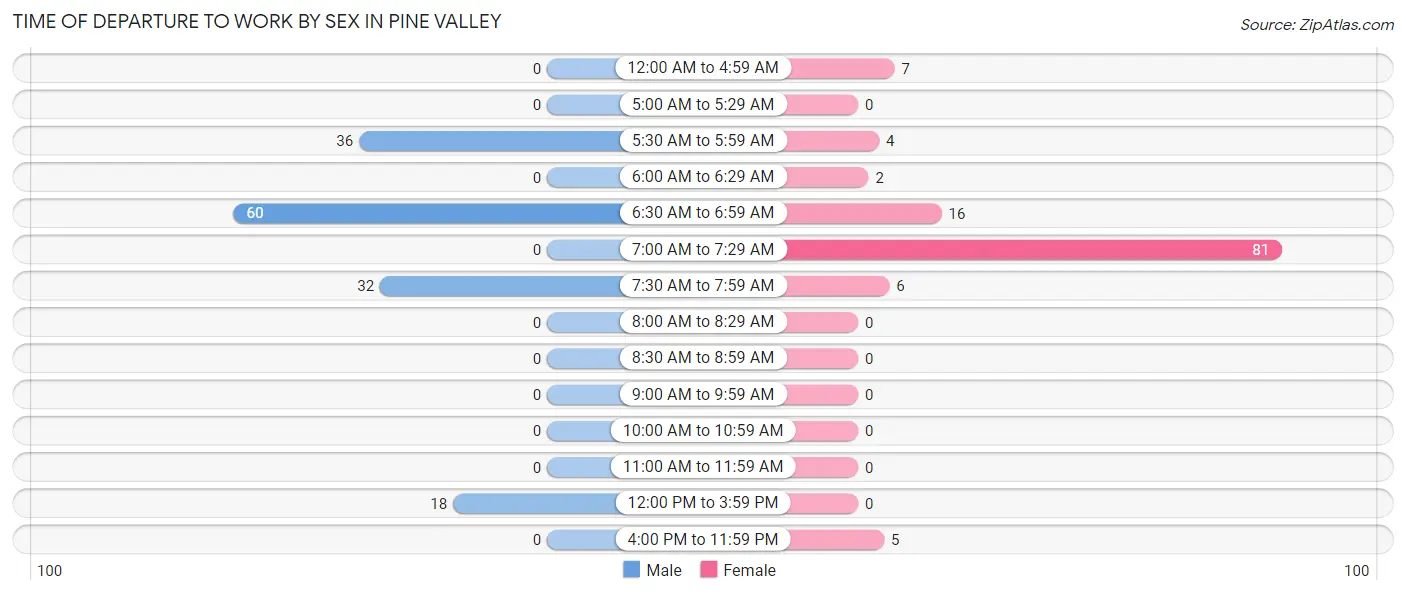
Time of Departure to Work by Sex in Pine Valley
The most frequent times of departure to work in Pine Valley are 6:30 AM to 6:59 AM (60, 41.1%) for males and 7:00 AM to 7:29 AM (81, 66.9%) for females.
| Time of Departure | Male | Female |
| 12:00 AM to 4:59 AM | 0 (0.0%) | 7 (5.8%) |
| 5:00 AM to 5:29 AM | 0 (0.0%) | 0 (0.0%) |
| 5:30 AM to 5:59 AM | 36 (24.7%) | 4 (3.3%) |
| 6:00 AM to 6:29 AM | 0 (0.0%) | 2 (1.7%) |
| 6:30 AM to 6:59 AM | 60 (41.1%) | 16 (13.2%) |
| 7:00 AM to 7:29 AM | 0 (0.0%) | 81 (66.9%) |
| 7:30 AM to 7:59 AM | 32 (21.9%) | 6 (5.0%) |
| 8:00 AM to 8:29 AM | 0 (0.0%) | 0 (0.0%) |
| 8:30 AM to 8:59 AM | 0 (0.0%) | 0 (0.0%) |
| 9:00 AM to 9:59 AM | 0 (0.0%) | 0 (0.0%) |
| 10:00 AM to 10:59 AM | 0 (0.0%) | 0 (0.0%) |
| 11:00 AM to 11:59 AM | 0 (0.0%) | 0 (0.0%) |
| 12:00 PM to 3:59 PM | 18 (12.3%) | 0 (0.0%) |
| 4:00 PM to 11:59 PM | 0 (0.0%) | 5 (4.1%) |
| Total | 146 (100.0%) | 121 (100.0%) |
Housing Occupancy in Pine Valley
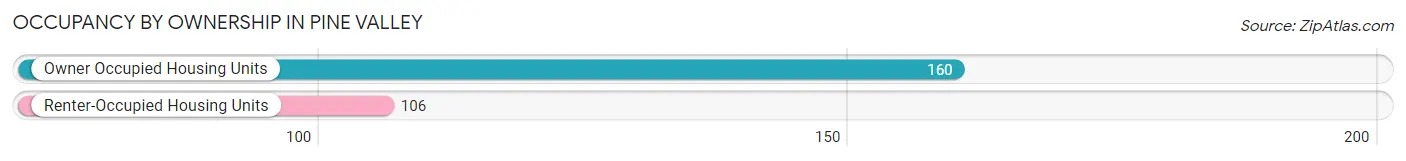
Occupancy by Ownership in Pine Valley
Of the total 266 dwellings in Pine Valley, owner-occupied units account for 160 (60.2%), while renter-occupied units make up 106 (39.9%).
| Occupancy | # Housing Units | % Housing Units |
| Owner Occupied Housing Units | 160 | 60.2% |
| Renter-Occupied Housing Units | 106 | 39.9% |
| Total Occupied Housing Units | 266 | 100.0% |
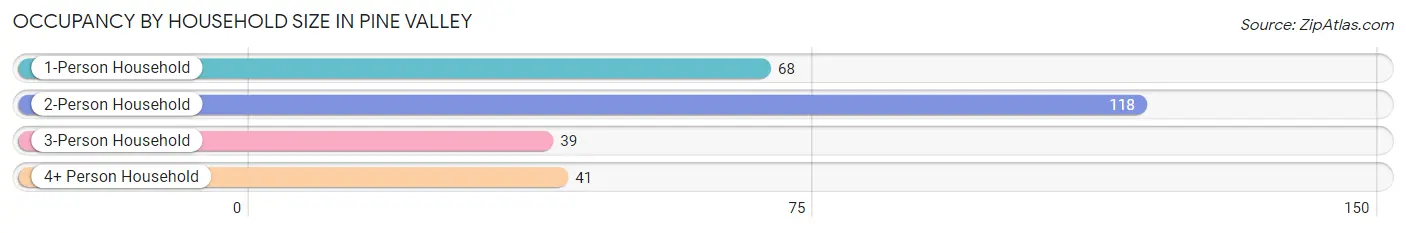
Occupancy by Household Size in Pine Valley
| Household Size | # Housing Units | % Housing Units |
| 1-Person Household | 68 | 25.6% |
| 2-Person Household | 118 | 44.4% |
| 3-Person Household | 39 | 14.7% |
| 4+ Person Household | 41 | 15.4% |
| Total Housing Units | 266 | 100.0% |
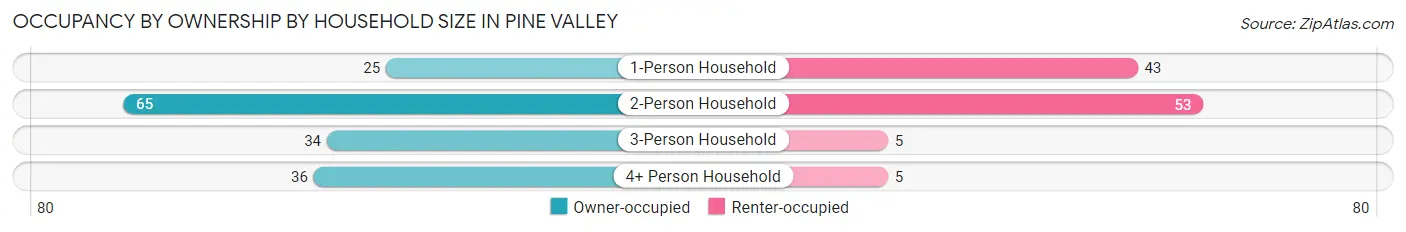
Occupancy by Ownership by Household Size in Pine Valley
| Household Size | Owner-occupied | Renter-occupied |
| 1-Person Household | 25 (36.8%) | 43 (63.2%) |
| 2-Person Household | 65 (55.1%) | 53 (44.9%) |
| 3-Person Household | 34 (87.2%) | 5 (12.8%) |
| 4+ Person Household | 36 (87.8%) | 5 (12.2%) |
| Total Housing Units | 160 (60.2%) | 106 (39.9%) |
Occupancy by Educational Attainment in Pine Valley
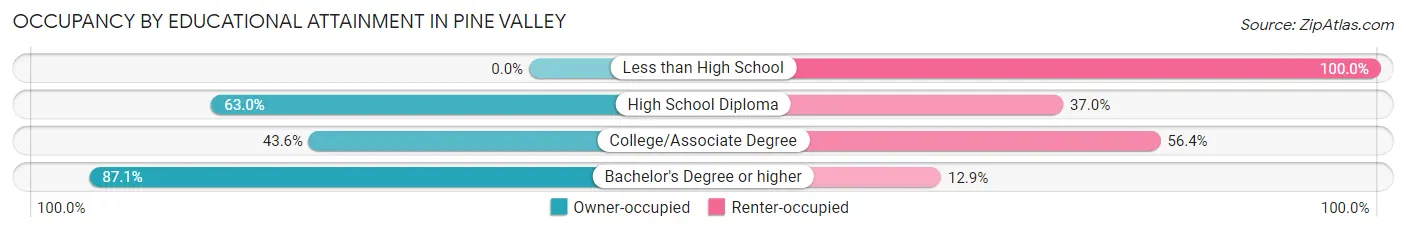
| Household Size | Owner-occupied | Renter-occupied |
| Less than High School | 0 (0.0%) | 5 (100.0%) |
| High School Diploma | 51 (63.0%) | 30 (37.0%) |
| College/Associate Degree | 48 (43.6%) | 62 (56.4%) |
| Bachelor's Degree or higher | 61 (87.1%) | 9 (12.9%) |
Occupancy by Age of Householder in Pine Valley
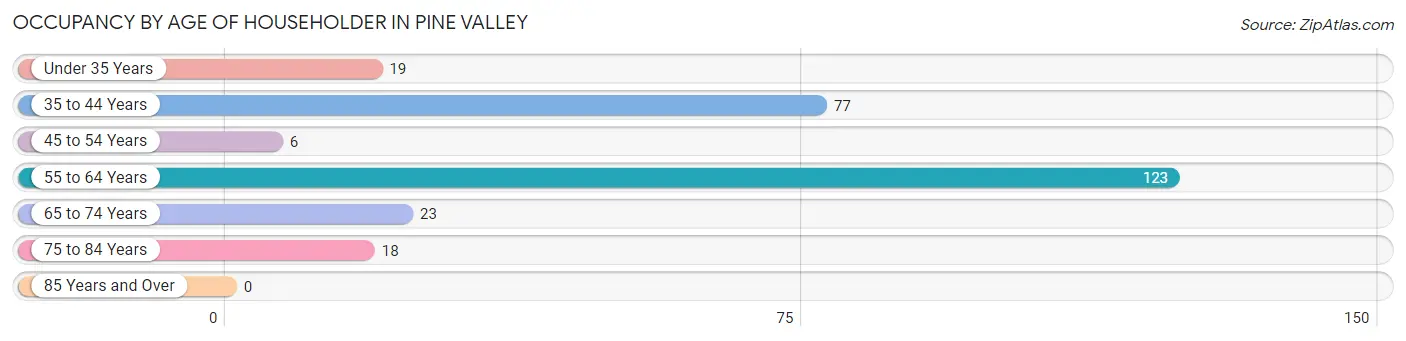
| Age Bracket | # Households | % Households |
| Under 35 Years | 19 | 7.1% |
| 35 to 44 Years | 77 | 28.9% |
| 45 to 54 Years | 6 | 2.3% |
| 55 to 64 Years | 123 | 46.2% |
| 65 to 74 Years | 23 | 8.6% |
| 75 to 84 Years | 18 | 6.8% |
| 85 Years and Over | 0 | 0.0% |
| Total | 266 | 100.0% |
Housing Finances in Pine Valley
Median Income by Occupancy in Pine Valley
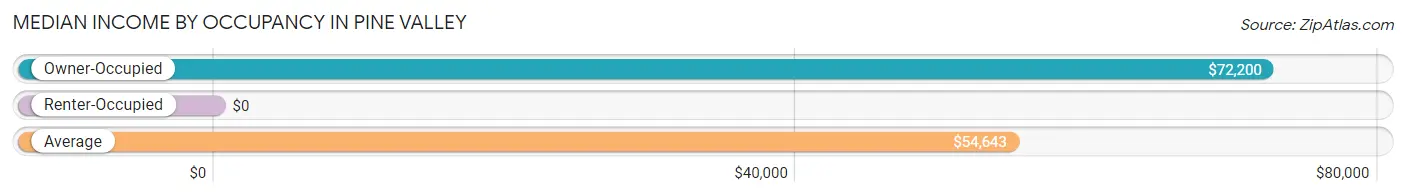
| Occupancy Type | # Households | Median Income |
| Owner-Occupied | 160 (60.2%) | $72,200 |
| Renter-Occupied | 106 (39.9%) | $0 |
| Average | 266 (100.0%) | $54,643 |
Occupancy by Householder Income Bracket in Pine Valley
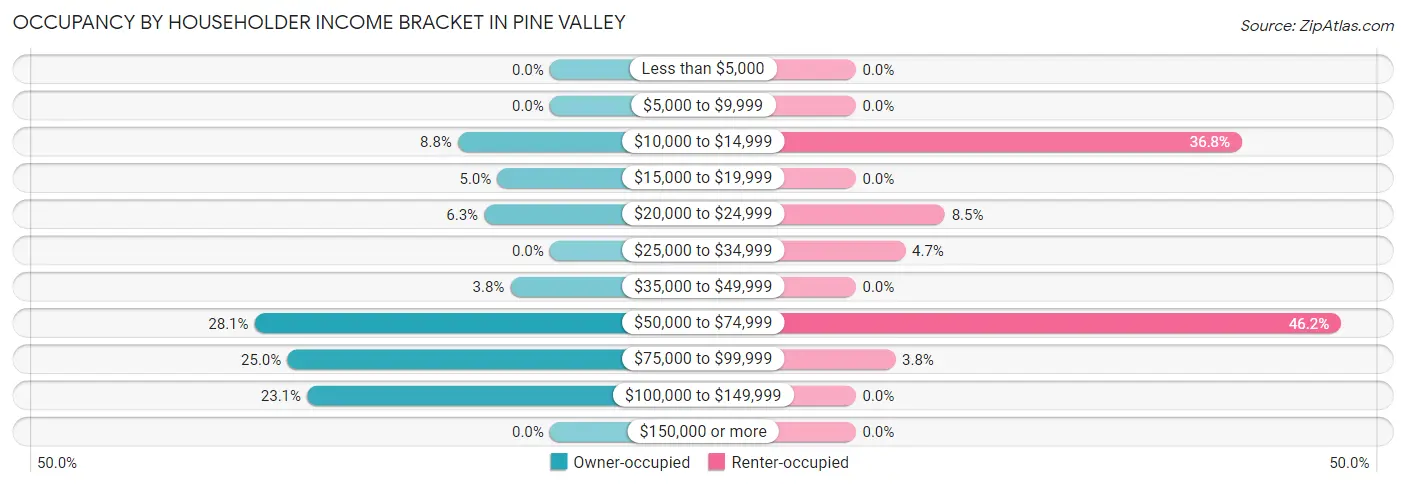
| Income Bracket | Owner-occupied | Renter-occupied |
| Less than $5,000 | 0 (0.0%) | 0 (0.0%) |
| $5,000 to $9,999 | 0 (0.0%) | 0 (0.0%) |
| $10,000 to $14,999 | 14 (8.7%) | 39 (36.8%) |
| $15,000 to $19,999 | 8 (5.0%) | 0 (0.0%) |
| $20,000 to $24,999 | 10 (6.2%) | 9 (8.5%) |
| $25,000 to $34,999 | 0 (0.0%) | 5 (4.7%) |
| $35,000 to $49,999 | 6 (3.7%) | 0 (0.0%) |
| $50,000 to $74,999 | 45 (28.1%) | 49 (46.2%) |
| $75,000 to $99,999 | 40 (25.0%) | 4 (3.8%) |
| $100,000 to $149,999 | 37 (23.1%) | 0 (0.0%) |
| $150,000 or more | 0 (0.0%) | 0 (0.0%) |
| Total | 160 (100.0%) | 106 (100.0%) |
Monthly Housing Cost Tiers in Pine Valley
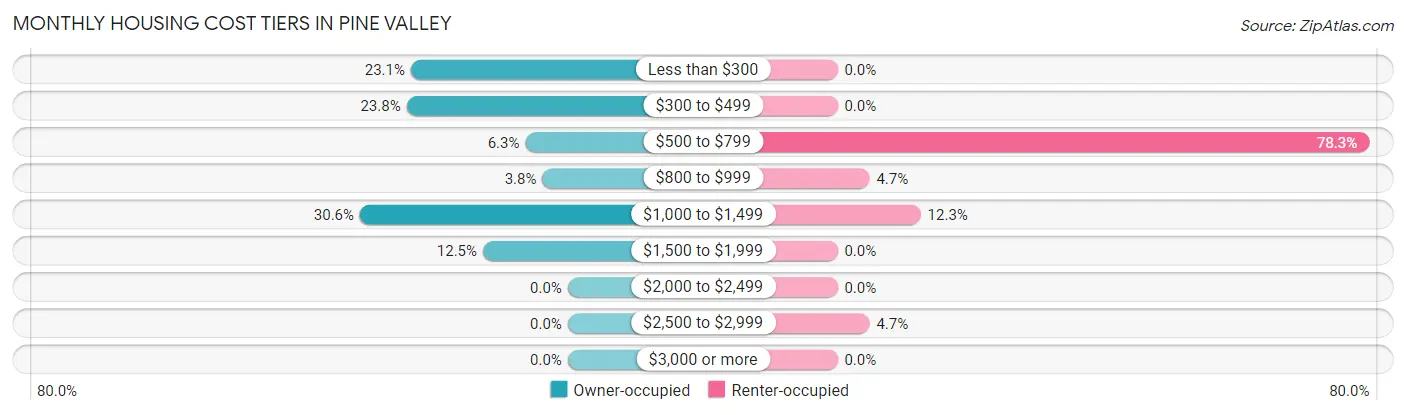
| Monthly Cost | Owner-occupied | Renter-occupied |
| Less than $300 | 37 (23.1%) | 0 (0.0%) |
| $300 to $499 | 38 (23.7%) | 0 (0.0%) |
| $500 to $799 | 10 (6.2%) | 83 (78.3%) |
| $800 to $999 | 6 (3.7%) | 5 (4.7%) |
| $1,000 to $1,499 | 49 (30.6%) | 13 (12.3%) |
| $1,500 to $1,999 | 20 (12.5%) | 0 (0.0%) |
| $2,000 to $2,499 | 0 (0.0%) | 0 (0.0%) |
| $2,500 to $2,999 | 0 (0.0%) | 5 (4.7%) |
| $3,000 or more | 0 (0.0%) | 0 (0.0%) |
| Total | 160 (100.0%) | 106 (100.0%) |
Physical Housing Characteristics in Pine Valley
Housing Structures in Pine Valley
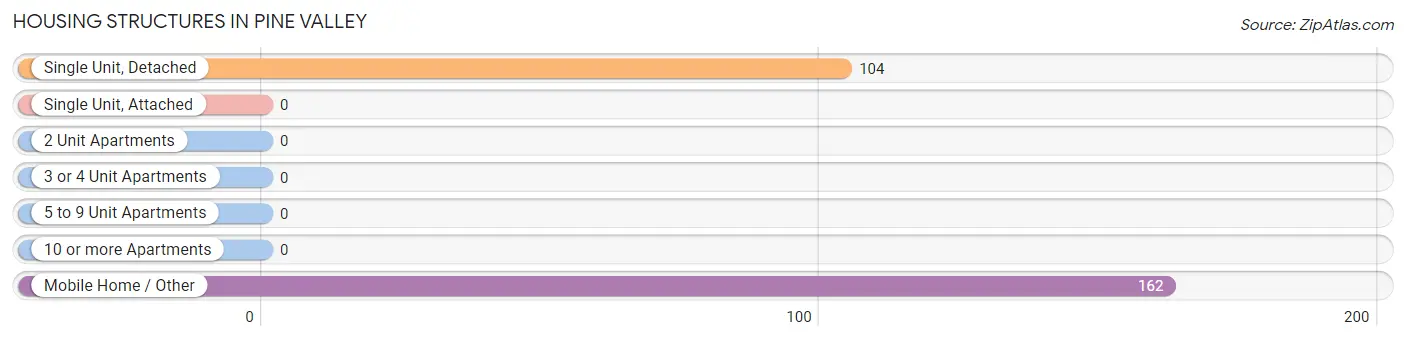
| Structure Type | # Housing Units | % Housing Units |
| Single Unit, Detached | 104 | 39.1% |
| Single Unit, Attached | 0 | 0.0% |
| 2 Unit Apartments | 0 | 0.0% |
| 3 or 4 Unit Apartments | 0 | 0.0% |
| 5 to 9 Unit Apartments | 0 | 0.0% |
| 10 or more Apartments | 0 | 0.0% |
| Mobile Home / Other | 162 | 60.9% |
| Total | 266 | 100.0% |
Housing Structures by Occupancy in Pine Valley
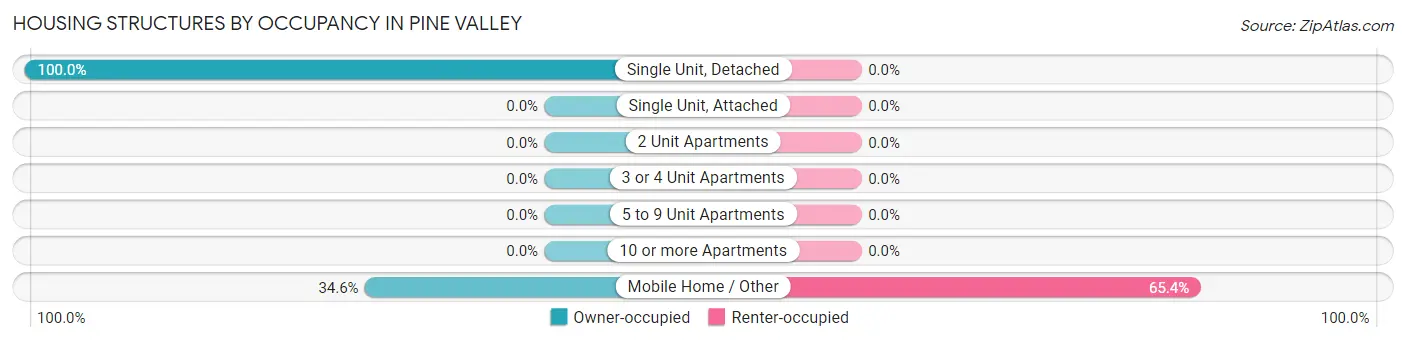
| Structure Type | Owner-occupied | Renter-occupied |
| Single Unit, Detached | 104 (100.0%) | 0 (0.0%) |
| Single Unit, Attached | 0 (0.0%) | 0 (0.0%) |
| 2 Unit Apartments | 0 (0.0%) | 0 (0.0%) |
| 3 or 4 Unit Apartments | 0 (0.0%) | 0 (0.0%) |
| 5 to 9 Unit Apartments | 0 (0.0%) | 0 (0.0%) |
| 10 or more Apartments | 0 (0.0%) | 0 (0.0%) |
| Mobile Home / Other | 56 (34.6%) | 106 (65.4%) |
| Total | 160 (60.2%) | 106 (39.9%) |
Housing Structures by Number of Rooms in Pine Valley
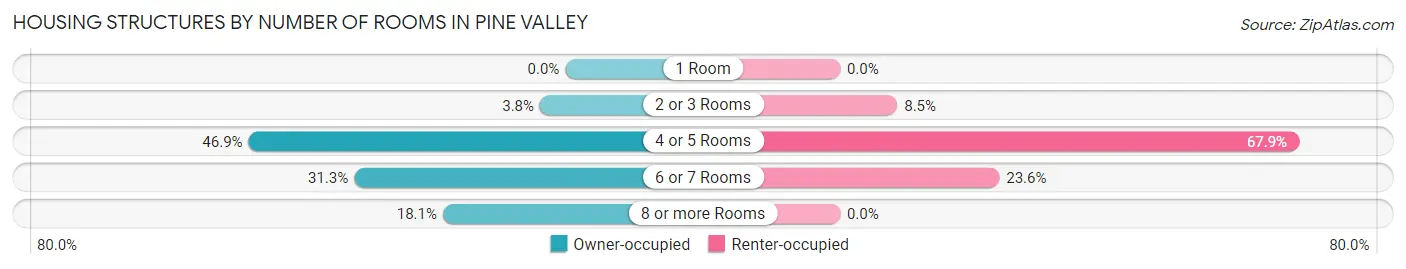
| Number of Rooms | Owner-occupied | Renter-occupied |
| 1 Room | 0 (0.0%) | 0 (0.0%) |
| 2 or 3 Rooms | 6 (3.7%) | 9 (8.5%) |
| 4 or 5 Rooms | 75 (46.9%) | 72 (67.9%) |
| 6 or 7 Rooms | 50 (31.2%) | 25 (23.6%) |
| 8 or more Rooms | 29 (18.1%) | 0 (0.0%) |
| Total | 160 (100.0%) | 106 (100.0%) |
Housing Structure by Heating Type in Pine Valley
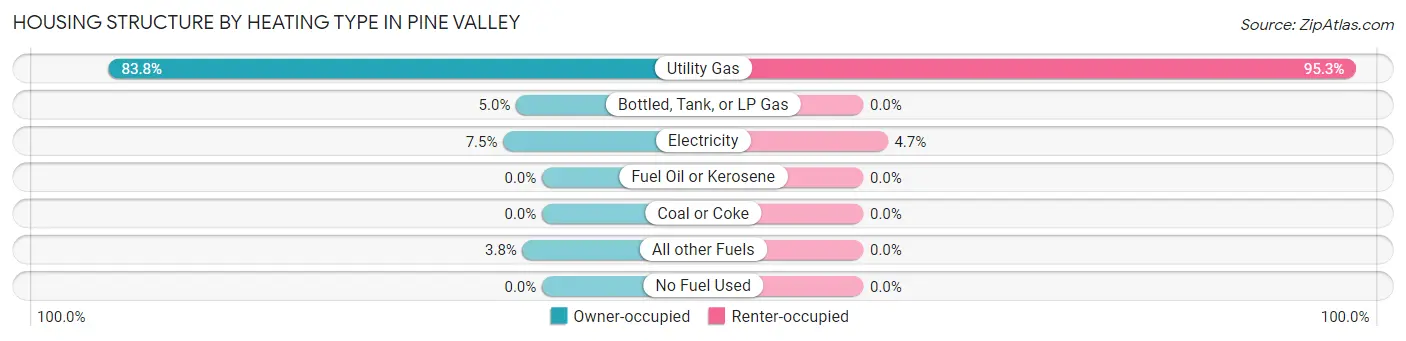
| Heating Type | Owner-occupied | Renter-occupied |
| Utility Gas | 134 (83.8%) | 101 (95.3%) |
| Bottled, Tank, or LP Gas | 8 (5.0%) | 0 (0.0%) |
| Electricity | 12 (7.5%) | 5 (4.7%) |
| Fuel Oil or Kerosene | 0 (0.0%) | 0 (0.0%) |
| Coal or Coke | 0 (0.0%) | 0 (0.0%) |
| All other Fuels | 6 (3.7%) | 0 (0.0%) |
| No Fuel Used | 0 (0.0%) | 0 (0.0%) |
| Total | 160 (100.0%) | 106 (100.0%) |
Household Vehicle Usage in Pine Valley
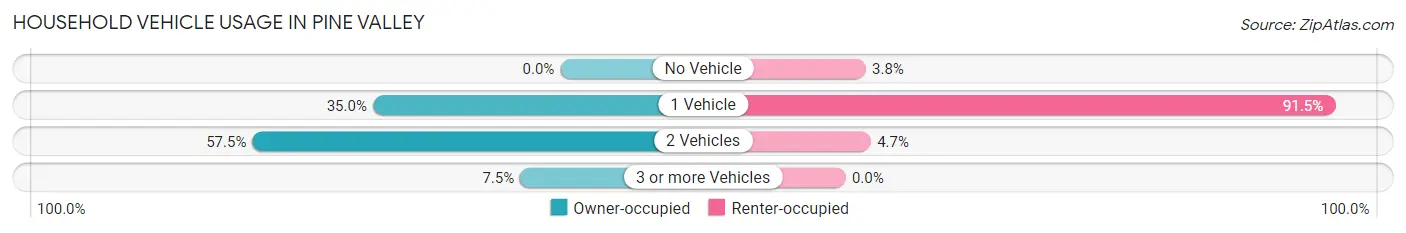
| Vehicles per Household | Owner-occupied | Renter-occupied |
| No Vehicle | 0 (0.0%) | 4 (3.8%) |
| 1 Vehicle | 56 (35.0%) | 97 (91.5%) |
| 2 Vehicles | 92 (57.5%) | 5 (4.7%) |
| 3 or more Vehicles | 12 (7.5%) | 0 (0.0%) |
| Total | 160 (100.0%) | 106 (100.0%) |
Real Estate & Mortgages in Pine Valley
Real Estate and Mortgage Overview in Pine Valley
| Characteristic | Without Mortgage | With Mortgage |
| Housing Units | 87 | 73 |
| Median Property Value | $31,500 | $164,900 |
| Median Household Income | $57,292 | $0 |
| Monthly Housing Costs | $352 | $0 |
| Real Estate Taxes | - | - |
Property Value by Mortgage Status in Pine Valley
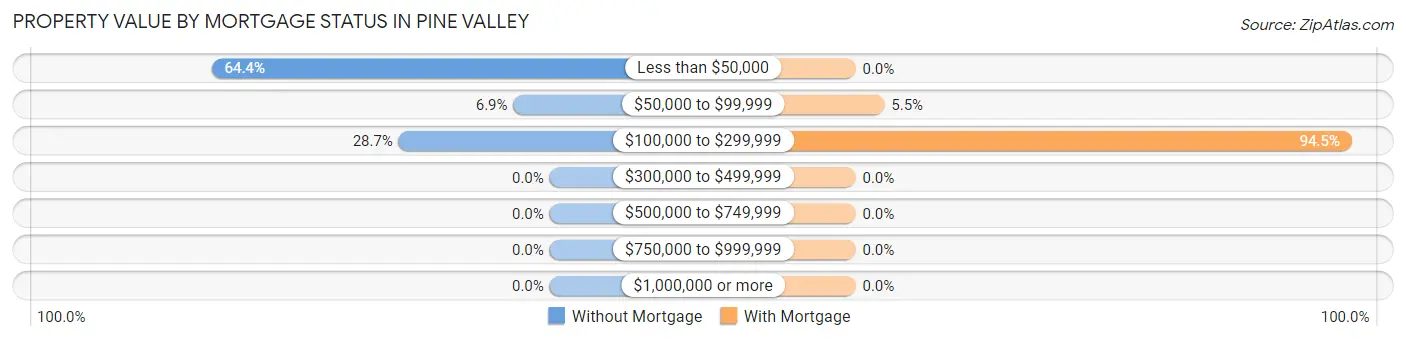
| Property Value | Without Mortgage | With Mortgage |
| Less than $50,000 | 56 (64.4%) | 0 (0.0%) |
| $50,000 to $99,999 | 6 (6.9%) | 4 (5.5%) |
| $100,000 to $299,999 | 25 (28.7%) | 69 (94.5%) |
| $300,000 to $499,999 | 0 (0.0%) | 0 (0.0%) |
| $500,000 to $749,999 | 0 (0.0%) | 0 (0.0%) |
| $750,000 to $999,999 | 0 (0.0%) | 0 (0.0%) |
| $1,000,000 or more | 0 (0.0%) | 0 (0.0%) |
| Total | 87 (100.0%) | 73 (100.0%) |
Household Income by Mortgage Status in Pine Valley
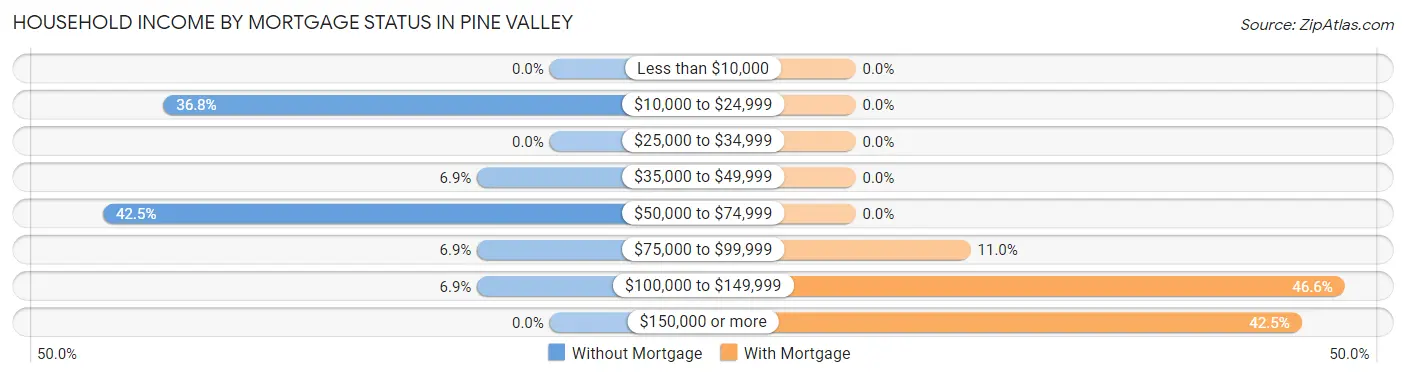
| Household Income | Without Mortgage | With Mortgage |
| Less than $10,000 | 0 (0.0%) | 0 (0.0%) |
| $10,000 to $24,999 | 32 (36.8%) | 0 (0.0%) |
| $25,000 to $34,999 | 0 (0.0%) | 0 (0.0%) |
| $35,000 to $49,999 | 6 (6.9%) | 0 (0.0%) |
| $50,000 to $74,999 | 37 (42.5%) | 0 (0.0%) |
| $75,000 to $99,999 | 6 (6.9%) | 8 (11.0%) |
| $100,000 to $149,999 | 6 (6.9%) | 34 (46.6%) |
| $150,000 or more | 0 (0.0%) | 31 (42.5%) |
| Total | 87 (100.0%) | 73 (100.0%) |
Property Value to Household Income Ratio in Pine Valley
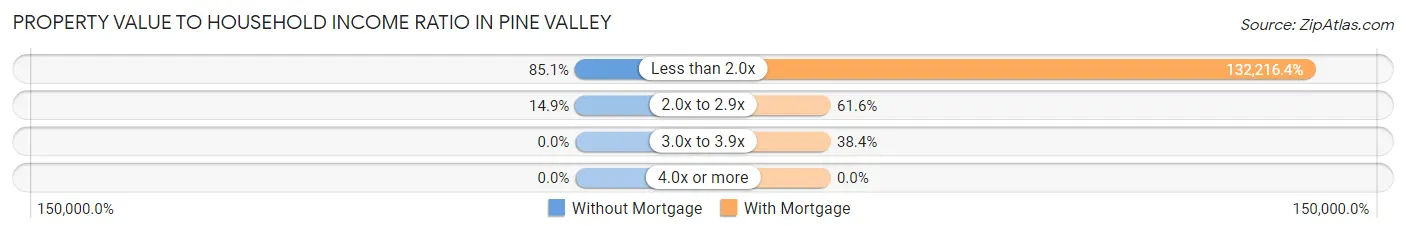
| Value-to-Income Ratio | Without Mortgage | With Mortgage |
| Less than 2.0x | 74 (85.1%) | 96,518 (132,216.4%) |
| 2.0x to 2.9x | 13 (14.9%) | 45 (61.6%) |
| 3.0x to 3.9x | 0 (0.0%) | 28 (38.4%) |
| 4.0x or more | 0 (0.0%) | 0 (0.0%) |
| Total | 87 (100.0%) | 73 (100.0%) |
Real Estate Taxes by Mortgage Status in Pine Valley
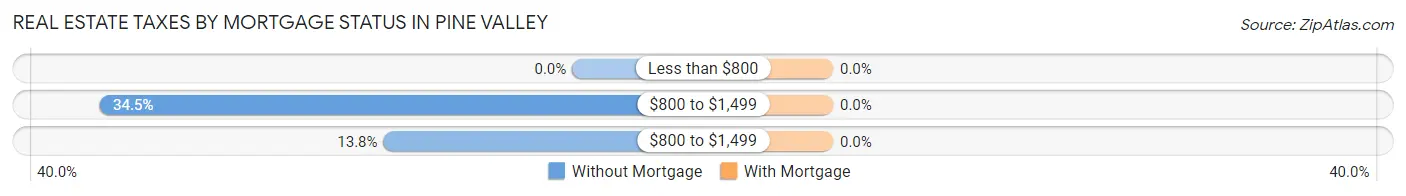
| Property Taxes | Without Mortgage | With Mortgage |
| Less than $800 | 0 (0.0%) | 0 (0.0%) |
| $800 to $1,499 | 30 (34.5%) | 0 (0.0%) |
| $800 to $1,499 | 12 (13.8%) | 0 (0.0%) |
| Total | 87 (100.0%) | 73 (100.0%) |
Health & Disability in Pine Valley
Health Insurance Coverage by Age in Pine Valley
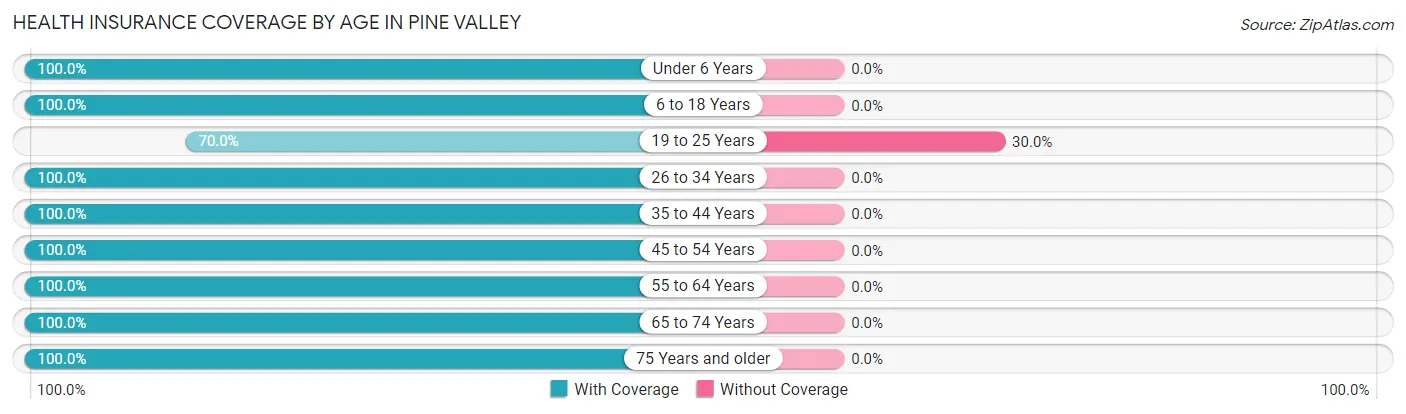
| Age Bracket | With Coverage | Without Coverage |
| Under 6 Years | 32 (100.0%) | 0 (0.0%) |
| 6 to 18 Years | 143 (100.0%) | 0 (0.0%) |
| 19 to 25 Years | 14 (70.0%) | 6 (30.0%) |
| 26 to 34 Years | 35 (100.0%) | 0 (0.0%) |
| 35 to 44 Years | 144 (100.0%) | 0 (0.0%) |
| 45 to 54 Years | 13 (100.0%) | 0 (0.0%) |
| 55 to 64 Years | 169 (100.0%) | 0 (0.0%) |
| 65 to 74 Years | 28 (100.0%) | 0 (0.0%) |
| 75 Years and older | 25 (100.0%) | 0 (0.0%) |
| Total | 603 (99.0%) | 6 (1.0%) |
Health Insurance Coverage by Citizenship Status in Pine Valley

| Citizenship Status | With Coverage | Without Coverage |
| Native Born | 32 (100.0%) | 0 (0.0%) |
| Foreign Born, Citizen | 143 (100.0%) | 0 (0.0%) |
| Foreign Born, not a Citizen | 14 (70.0%) | 6 (30.0%) |
Health Insurance Coverage by Household Income in Pine Valley
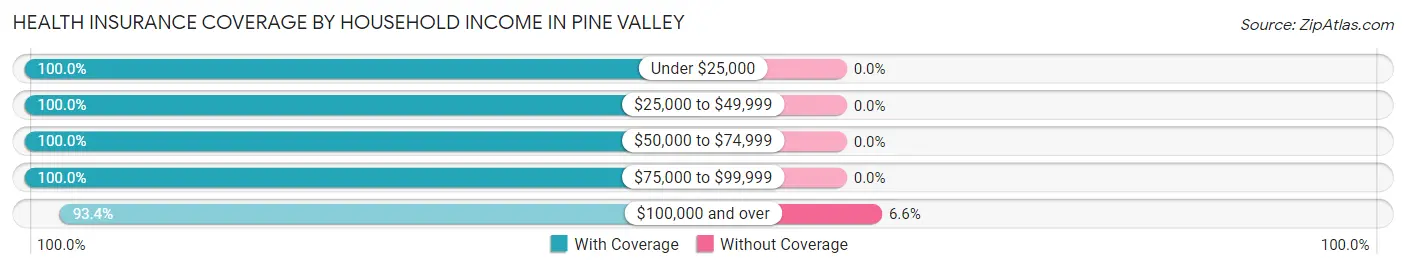
| Household Income | With Coverage | Without Coverage |
| Under $25,000 | 104 (100.0%) | 0 (0.0%) |
| $25,000 to $49,999 | 23 (100.0%) | 0 (0.0%) |
| $50,000 to $74,999 | 255 (100.0%) | 0 (0.0%) |
| $75,000 to $99,999 | 136 (100.0%) | 0 (0.0%) |
| $100,000 and over | 85 (93.4%) | 6 (6.6%) |
Public vs Private Health Insurance Coverage by Age in Pine Valley
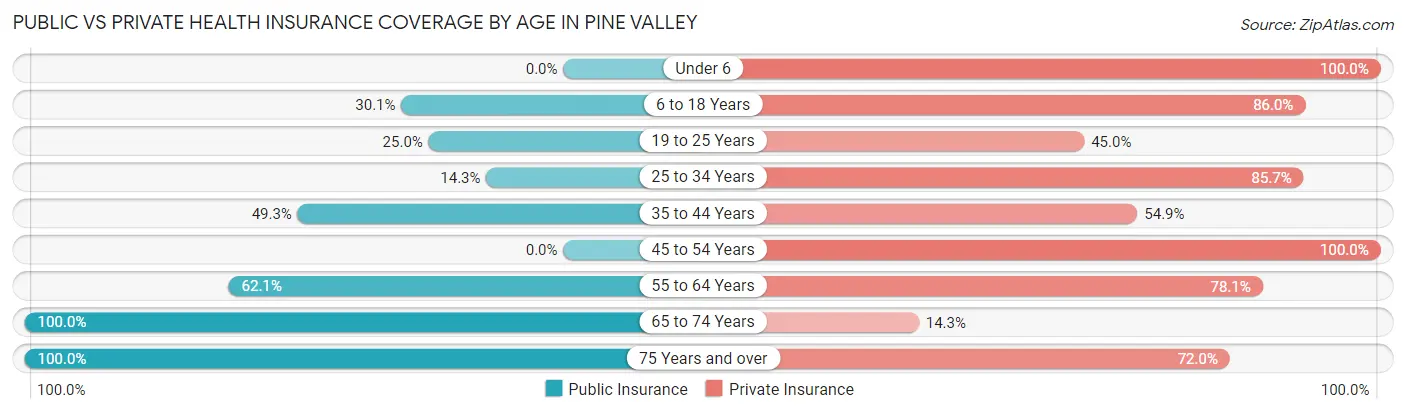
| Age Bracket | Public Insurance | Private Insurance |
| Under 6 | 0 (0.0%) | 32 (100.0%) |
| 6 to 18 Years | 43 (30.1%) | 123 (86.0%) |
| 19 to 25 Years | 5 (25.0%) | 9 (45.0%) |
| 25 to 34 Years | 5 (14.3%) | 30 (85.7%) |
| 35 to 44 Years | 71 (49.3%) | 79 (54.9%) |
| 45 to 54 Years | 0 (0.0%) | 13 (100.0%) |
| 55 to 64 Years | 105 (62.1%) | 132 (78.1%) |
| 65 to 74 Years | 28 (100.0%) | 4 (14.3%) |
| 75 Years and over | 25 (100.0%) | 18 (72.0%) |
| Total | 282 (46.3%) | 440 (72.3%) |
Disability Status by Sex by Age in Pine Valley
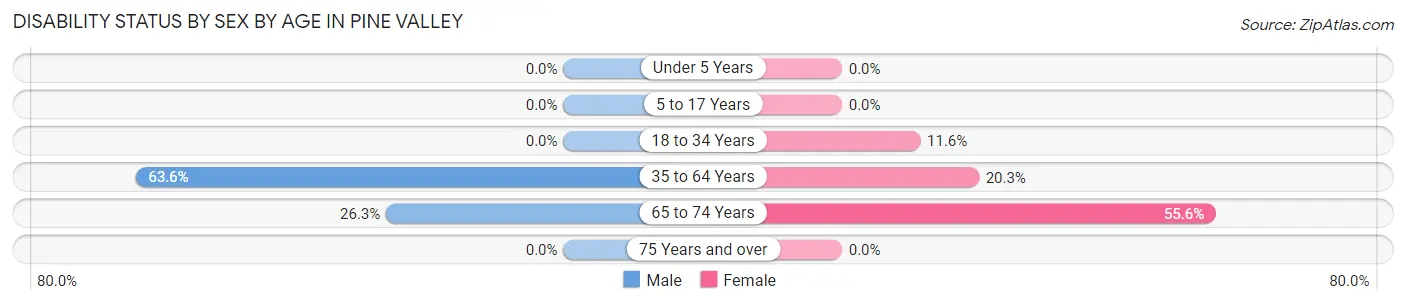
| Age Bracket | Male | Female |
| Under 5 Years | 0 (0.0%) | 0 (0.0%) |
| 5 to 17 Years | 0 (0.0%) | 0 (0.0%) |
| 18 to 34 Years | 0 (0.0%) | 5 (11.6%) |
| 35 to 64 Years | 129 (63.5%) | 25 (20.3%) |
| 65 to 74 Years | 5 (26.3%) | 5 (55.6%) |
| 75 Years and over | 0 (0.0%) | 0 (0.0%) |
Disability Class by Sex by Age in Pine Valley
Disability Class: Hearing Difficulty
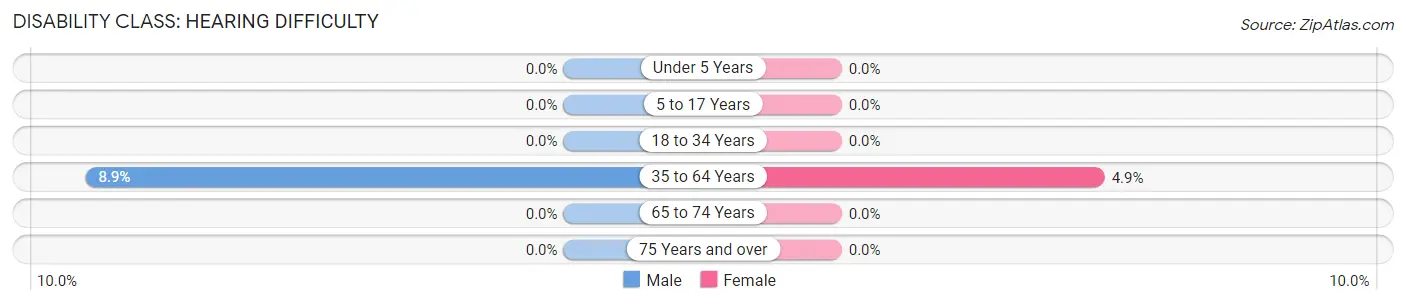
| Age Bracket | Male | Female |
| Under 5 Years | 0 (0.0%) | 0 (0.0%) |
| 5 to 17 Years | 0 (0.0%) | 0 (0.0%) |
| 18 to 34 Years | 0 (0.0%) | 0 (0.0%) |
| 35 to 64 Years | 18 (8.9%) | 6 (4.9%) |
| 65 to 74 Years | 0 (0.0%) | 0 (0.0%) |
| 75 Years and over | 0 (0.0%) | 0 (0.0%) |
Disability Class: Vision Difficulty
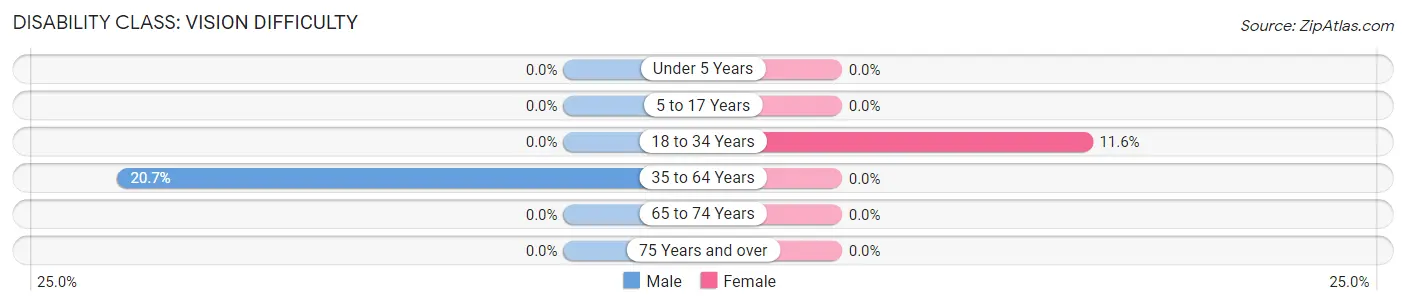
| Age Bracket | Male | Female |
| Under 5 Years | 0 (0.0%) | 0 (0.0%) |
| 5 to 17 Years | 0 (0.0%) | 0 (0.0%) |
| 18 to 34 Years | 0 (0.0%) | 5 (11.6%) |
| 35 to 64 Years | 42 (20.7%) | 0 (0.0%) |
| 65 to 74 Years | 0 (0.0%) | 0 (0.0%) |
| 75 Years and over | 0 (0.0%) | 0 (0.0%) |
Disability Class: Cognitive Difficulty
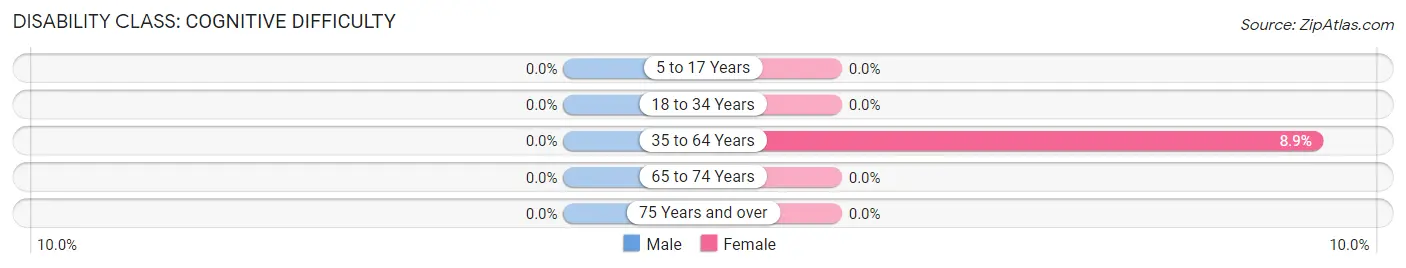
| Age Bracket | Male | Female |
| 5 to 17 Years | 0 (0.0%) | 0 (0.0%) |
| 18 to 34 Years | 0 (0.0%) | 0 (0.0%) |
| 35 to 64 Years | 0 (0.0%) | 11 (8.9%) |
| 65 to 74 Years | 0 (0.0%) | 0 (0.0%) |
| 75 Years and over | 0 (0.0%) | 0 (0.0%) |
Disability Class: Ambulatory Difficulty
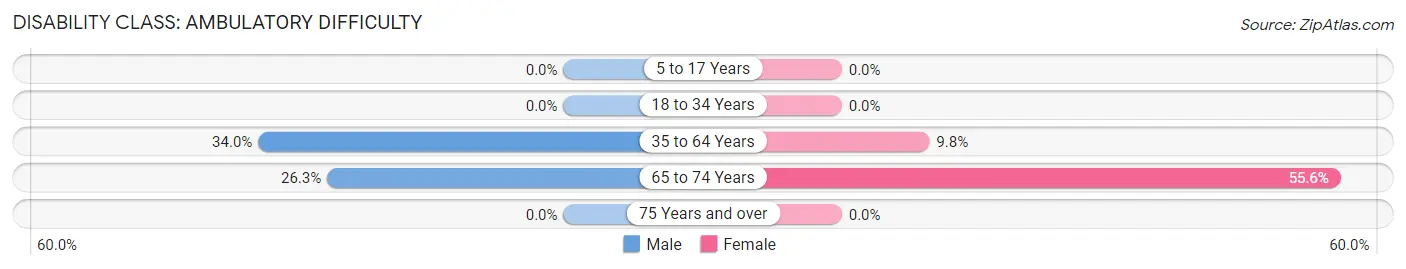
| Age Bracket | Male | Female |
| 5 to 17 Years | 0 (0.0%) | 0 (0.0%) |
| 18 to 34 Years | 0 (0.0%) | 0 (0.0%) |
| 35 to 64 Years | 69 (34.0%) | 12 (9.8%) |
| 65 to 74 Years | 5 (26.3%) | 5 (55.6%) |
| 75 Years and over | 0 (0.0%) | 0 (0.0%) |
Disability Class: Self-Care Difficulty
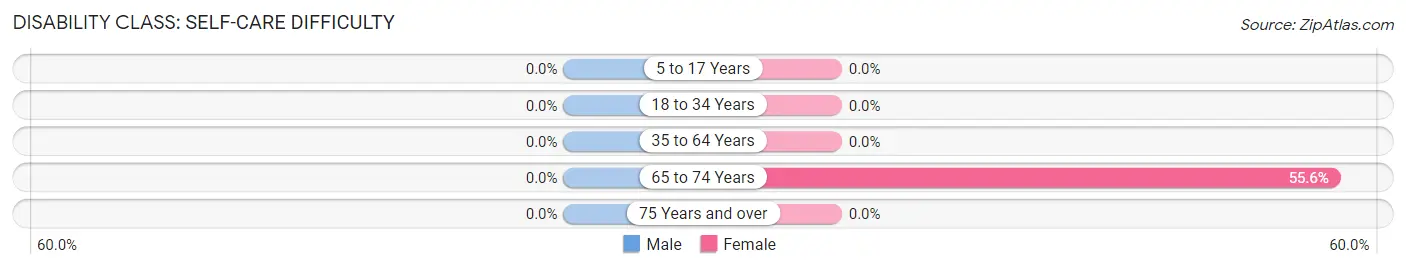
| Age Bracket | Male | Female |
| 5 to 17 Years | 0 (0.0%) | 0 (0.0%) |
| 18 to 34 Years | 0 (0.0%) | 0 (0.0%) |
| 35 to 64 Years | 0 (0.0%) | 0 (0.0%) |
| 65 to 74 Years | 0 (0.0%) | 5 (55.6%) |
| 75 Years and over | 0 (0.0%) | 0 (0.0%) |
Technology Access in Pine Valley
Computing Device Access in Pine Valley
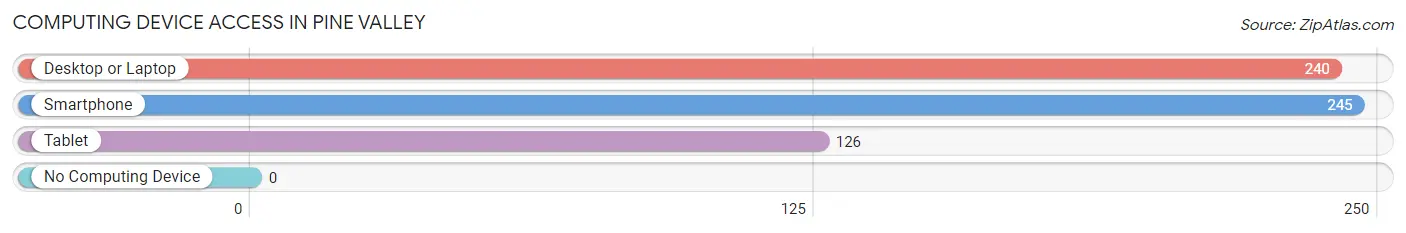
| Device Type | # Households | % Households |
| Desktop or Laptop | 240 | 90.2% |
| Smartphone | 245 | 92.1% |
| Tablet | 126 | 47.4% |
| No Computing Device | 0 | 0.0% |
| Total | 266 | 100.0% |
Internet Access in Pine Valley
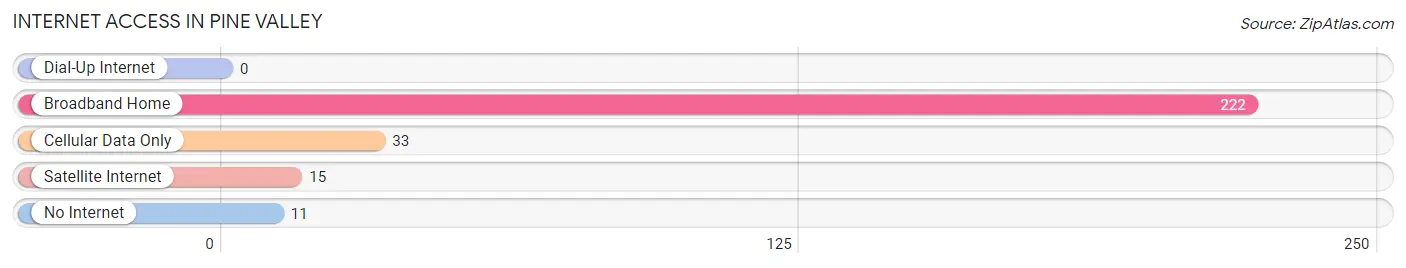
| Internet Type | # Households | % Households |
| Dial-Up Internet | 0 | 0.0% |
| Broadband Home | 222 | 83.5% |
| Cellular Data Only | 33 | 12.4% |
| Satellite Internet | 15 | 5.6% |
| No Internet | 11 | 4.1% |
| Total | 266 | 100.0% |
Pine Valley Summary
Pine Valley is a small town located in the Catskill Mountains of New York State. It is situated in the town of Hunter, Greene County, and is part of the Catskill Park. The town has a population of approximately 1,000 people and is known for its picturesque scenery and outdoor activities.
History
Pine Valley was first settled in the late 1700s by a group of Dutch settlers. The town was originally called “Pine Grove” and was part of the town of Hunter. In 1820, the town was renamed “Pine Valley” and was incorporated as a village in 1845.
The town was a popular destination for tourists in the late 19th and early 20th centuries. It was known for its scenic beauty and outdoor activities such as fishing, hunting, and camping. The town also had a thriving lumber industry, which provided jobs for many of the residents.
In the 1950s, the town began to decline as the lumber industry declined and tourism decreased. The town was eventually abandoned in the 1970s and remained largely uninhabited until the late 1990s.
Geography
Pine Valley is located in the Catskill Mountains of New York State. It is situated in the town of Hunter, Greene County, and is part of the Catskill Park. The town is surrounded by the Catskill Forest Preserve and is located near the Ashokan Reservoir.
The town is situated at an elevation of 1,400 feet and has a total area of 1.2 square miles. The terrain is mostly hilly and forested, with some open fields and meadows. The town is located near several ski resorts, including Hunter Mountain and Belleayre Mountain.
Economy
Pine Valley’s economy is largely based on tourism and outdoor recreation. The town is home to several ski resorts, including Hunter Mountain and Belleayre Mountain. The town also has several restaurants, shops, and lodging establishments.
The town is also home to several small businesses, including a general store, a hardware store, and a gas station. The town also has a post office and a library.
Demographics
As of the 2010 census, the population of Pine Valley was 1,000 people. The racial makeup of the town was 97.2% White, 0.7% African American, 0.3% Native American, 0.3% Asian, and 1.5% from other races. The median household income was $41,250 and the median family income was $50,000.
The town has a high rate of homeownership, with over 80% of the population owning their own homes. The town also has a high rate of educational attainment, with over 90% of the population having at least a high school diploma.
Conclusion
Pine Valley is a small town located in the Catskill Mountains of New York State. It is known for its picturesque scenery and outdoor activities, and is a popular destination for tourists. The town has a population of approximately 1,000 people and has a largely tourism-based economy. The town has a high rate of homeownership and educational attainment, and is home to several ski resorts.
Common Questions
What is Per Capita Income in Pine Valley?
Per Capita income in Pine Valley is $24,358.
What is the Median Family Income in Pine Valley?
Median Family Income in Pine Valley is $63,750.
What is the Median Household income in Pine Valley?
Median Household Income in Pine Valley is $54,643.
What is Income or Wage Gap in Pine Valley?
Income or Wage Gap in Pine Valley is 55.7%.
Women in Pine Valley earn 44.3 cents for every dollar earned by a man.
What is Inequality or Gini Index in Pine Valley?
Inequality or Gini Index in Pine Valley is 0.34.
What is the Total Population of Pine Valley?
Total Population of Pine Valley is 609.
What is the Total Male Population of Pine Valley?
Total Male Population of Pine Valley is 355.
What is the Total Female Population of Pine Valley?
Total Female Population of Pine Valley is 254.
What is the Ratio of Males per 100 Females in Pine Valley?
There are 139.76 Males per 100 Females in Pine Valley.
What is the Ratio of Females per 100 Males in Pine Valley?
There are 71.55 Females per 100 Males in Pine Valley.
What is the Median Population Age in Pine Valley?
Median Population Age in Pine Valley is 37.6 Years.
What is the Average Family Size in Pine Valley
Average Family Size in Pine Valley is 2.7 People.
What is the Average Household Size in Pine Valley
Average Household Size in Pine Valley is 2.3 People.
How Large is the Labor Force in Pine Valley?
There are 278 People in the Labor Forcein in Pine Valley.
What is the Percentage of People in the Labor Force in Pine Valley?
58.9% of People are in the Labor Force in Pine Valley.
What is the Unemployment Rate in Pine Valley?
Unemployment Rate in Pine Valley is 1.8%.