Niagara Falls, NY Map & Demographics
Niagara Falls Map
Niagara Falls Overview
$29,391
PER CAPITA INCOME
$61,708
AVG FAMILY INCOME
$45,932
AVG HOUSEHOLD INCOME
17.8%
WAGE / INCOME GAP [ % ]
82.2¢/ $1
WAGE / INCOME GAP [ $ ]
$12,249
FAMILY INCOME DEFICIT
0.49
INEQUALITY / GINI INDEX
48,502
TOTAL POPULATION
23,693
MALE POPULATION
24,809
FEMALE POPULATION
95.50
MALES / 100 FEMALES
104.71
FEMALES / 100 MALES
40.3
MEDIAN AGE
2.9
AVG FAMILY SIZE
2.1
AVG HOUSEHOLD SIZE
22,713
LABOR FORCE [ PEOPLE ]
57.6%
PERCENT IN LABOR FORCE
9.1%
UNEMPLOYMENT RATE
Niagara Falls Area Codes
Income in Niagara Falls
Income Overview in Niagara Falls
Per Capita Income in Niagara Falls is $29,391, while median incomes of families and households are $61,708 and $45,932 respectively.
| Characteristic | Number | Measure |
| Per Capita Income | 48,502 | $29,391 |
| Median Family Income | 11,704 | $61,708 |
| Mean Family Income | 11,704 | $74,287 |
| Median Household Income | 22,428 | $45,932 |
| Mean Household Income | 22,428 | $62,833 |
| Income Deficit | 11,704 | $12,249 |
| Wage / Income Gap (%) | 48,502 | 17.78% |
| Wage / Income Gap ($) | 48,502 | 82.22¢ per $1 |
| Gini / Inequality Index | 48,502 | 0.49 |
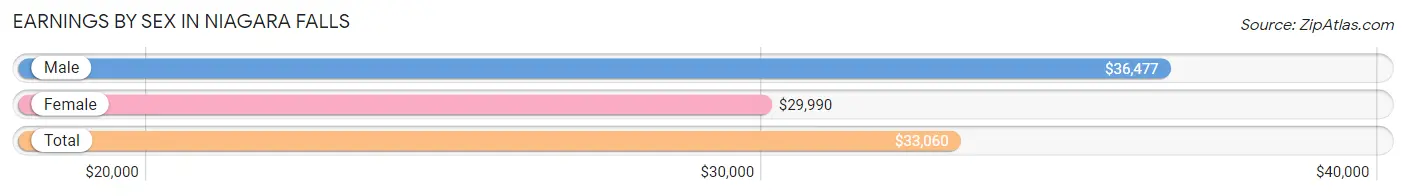
Earnings by Sex in Niagara Falls
Average Earnings in Niagara Falls are $33,060, $36,477 for men and $29,990 for women, a difference of 17.8%.
| Sex | Number | Average Earnings |
| Male | 11,821 (49.6%) | $36,477 |
| Female | 11,996 (50.4%) | $29,990 |
| Total | 23,817 (100.0%) | $33,060 |
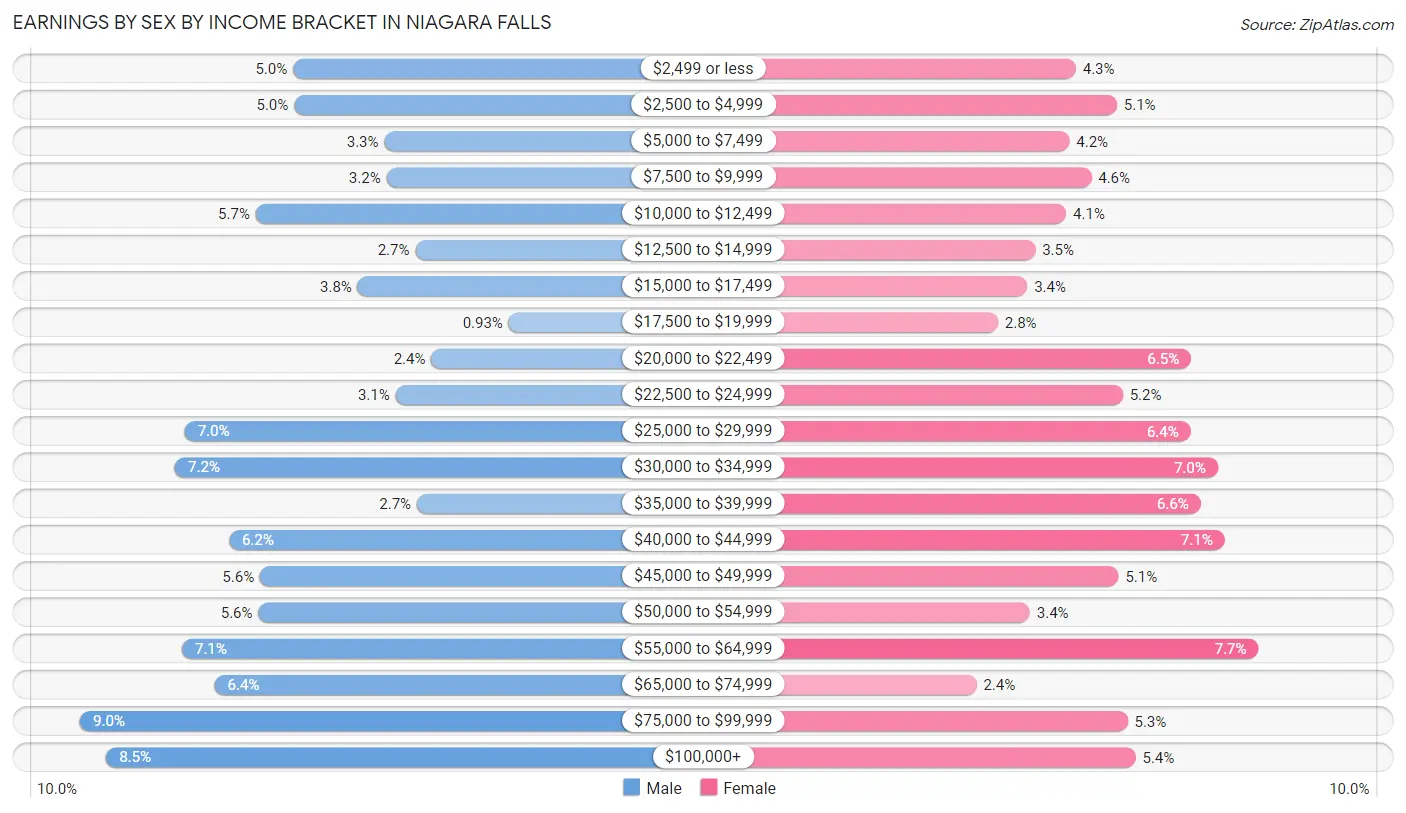
Earnings by Sex by Income Bracket in Niagara Falls
The most common earnings brackets in Niagara Falls are $75,000 to $99,999 for men (1,059 | 9.0%) and $55,000 to $64,999 for women (925 | 7.7%).
| Income | Male | Female |
| $2,499 or less | 588 (5.0%) | 515 (4.3%) |
| $2,500 to $4,999 | 585 (5.0%) | 607 (5.1%) |
| $5,000 to $7,499 | 385 (3.3%) | 500 (4.2%) |
| $7,500 to $9,999 | 381 (3.2%) | 549 (4.6%) |
| $10,000 to $12,499 | 670 (5.7%) | 493 (4.1%) |
| $12,500 to $14,999 | 317 (2.7%) | 424 (3.5%) |
| $15,000 to $17,499 | 445 (3.8%) | 405 (3.4%) |
| $17,500 to $19,999 | 110 (0.9%) | 340 (2.8%) |
| $20,000 to $22,499 | 281 (2.4%) | 774 (6.5%) |
| $22,500 to $24,999 | 361 (3.0%) | 620 (5.2%) |
| $25,000 to $29,999 | 828 (7.0%) | 773 (6.4%) |
| $30,000 to $34,999 | 849 (7.2%) | 834 (7.0%) |
| $35,000 to $39,999 | 313 (2.6%) | 795 (6.6%) |
| $40,000 to $44,999 | 729 (6.2%) | 849 (7.1%) |
| $45,000 to $49,999 | 661 (5.6%) | 610 (5.1%) |
| $50,000 to $54,999 | 664 (5.6%) | 411 (3.4%) |
| $55,000 to $64,999 | 833 (7.0%) | 925 (7.7%) |
| $65,000 to $74,999 | 761 (6.4%) | 292 (2.4%) |
| $75,000 to $99,999 | 1,059 (9.0%) | 631 (5.3%) |
| $100,000+ | 1,001 (8.5%) | 649 (5.4%) |
| Total | 11,821 (100.0%) | 11,996 (100.0%) |
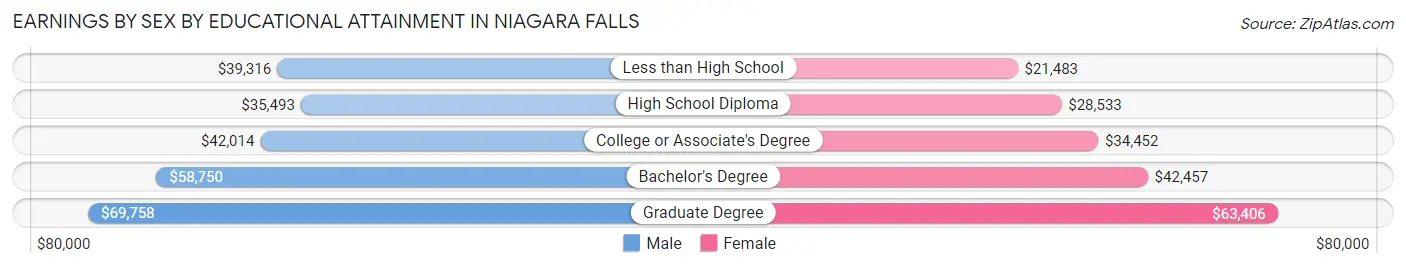
Earnings by Sex by Educational Attainment in Niagara Falls
Average earnings in Niagara Falls are $44,170 for men and $34,521 for women, a difference of 21.8%. Men with an educational attainment of graduate degree enjoy the highest average annual earnings of $69,758, while those with high school diploma education earn the least with $35,493. Women with an educational attainment of graduate degree earn the most with the average annual earnings of $63,406, while those with less than high school education have the smallest earnings of $21,483.
| Educational Attainment | Male Income | Female Income |
| Less than High School | $39,316 | $21,483 |
| High School Diploma | $35,493 | $28,533 |
| College or Associate's Degree | $42,014 | $34,452 |
| Bachelor's Degree | $58,750 | $42,457 |
| Graduate Degree | $69,758 | $63,406 |
| Total | $44,170 | $34,521 |
Family Income in Niagara Falls
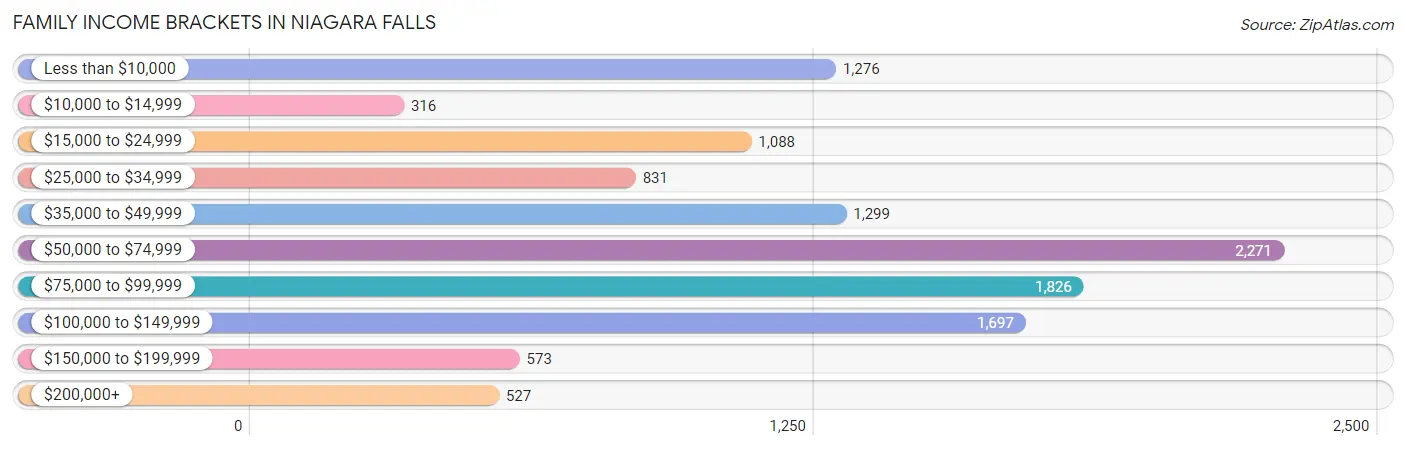
Family Income Brackets in Niagara Falls
According to the Niagara Falls family income data, there are 2,271 families falling into the $50,000 to $74,999 income range, which is the most common income bracket and makes up 19.4% of all families. Conversely, the $10,000 to $14,999 income bracket is the least frequent group with only 316 families (2.7%) belonging to this category.
| Income Bracket | # Families | % Families |
| Less than $10,000 | 1,276 | 10.9% |
| $10,000 to $14,999 | 316 | 2.7% |
| $15,000 to $24,999 | 1,088 | 9.3% |
| $25,000 to $34,999 | 831 | 7.1% |
| $35,000 to $49,999 | 1,299 | 11.1% |
| $50,000 to $74,999 | 2,271 | 19.4% |
| $75,000 to $99,999 | 1,826 | 15.6% |
| $100,000 to $149,999 | 1,697 | 14.5% |
| $150,000 to $199,999 | 573 | 4.9% |
| $200,000+ | 527 | 4.5% |
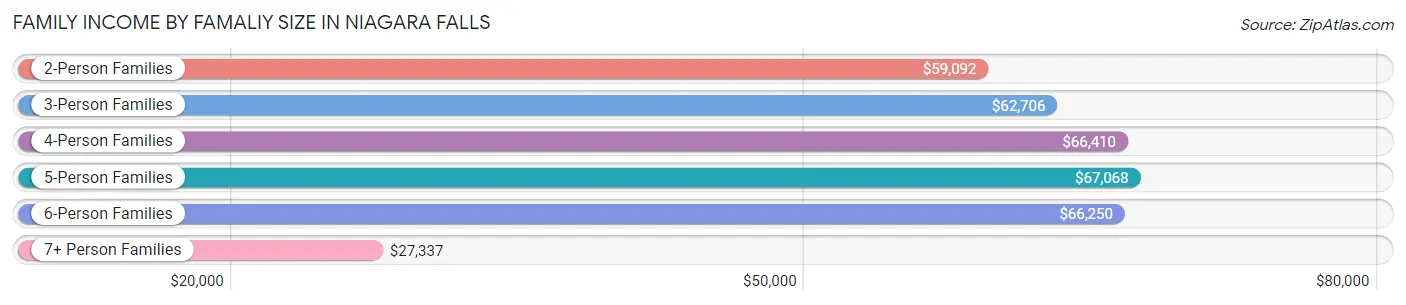
Family Income by Famaliy Size in Niagara Falls
5-person families (589 | 5.0%) account for the highest median family income in Niagara Falls with $67,068 per family, while 2-person families (6,150 | 52.5%) have the highest median income of $29,546 per family member.
| Income Bracket | # Families | Median Income |
| 2-Person Families | 6,150 (52.5%) | $59,092 |
| 3-Person Families | 2,800 (23.9%) | $62,706 |
| 4-Person Families | 1,946 (16.6%) | $66,410 |
| 5-Person Families | 589 (5.0%) | $67,068 |
| 6-Person Families | 68 (0.6%) | $66,250 |
| 7+ Person Families | 151 (1.3%) | $27,337 |
| Total | 11,704 (100.0%) | $61,708 |
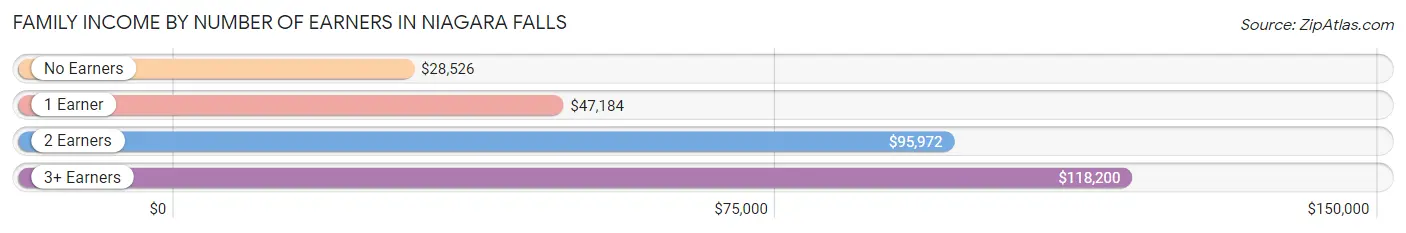
Family Income by Number of Earners in Niagara Falls
The median family income in Niagara Falls is $61,708, with families comprising 3+ earners (864) having the highest median family income of $118,200, while families with no earners (2,206) have the lowest median family income of $28,526, accounting for 7.4% and 18.9% of families, respectively.
| Number of Earners | # Families | Median Income |
| No Earners | 2,206 (18.9%) | $28,526 |
| 1 Earner | 4,935 (42.2%) | $47,184 |
| 2 Earners | 3,699 (31.6%) | $95,972 |
| 3+ Earners | 864 (7.4%) | $118,200 |
| Total | 11,704 (100.0%) | $61,708 |
Household Income in Niagara Falls
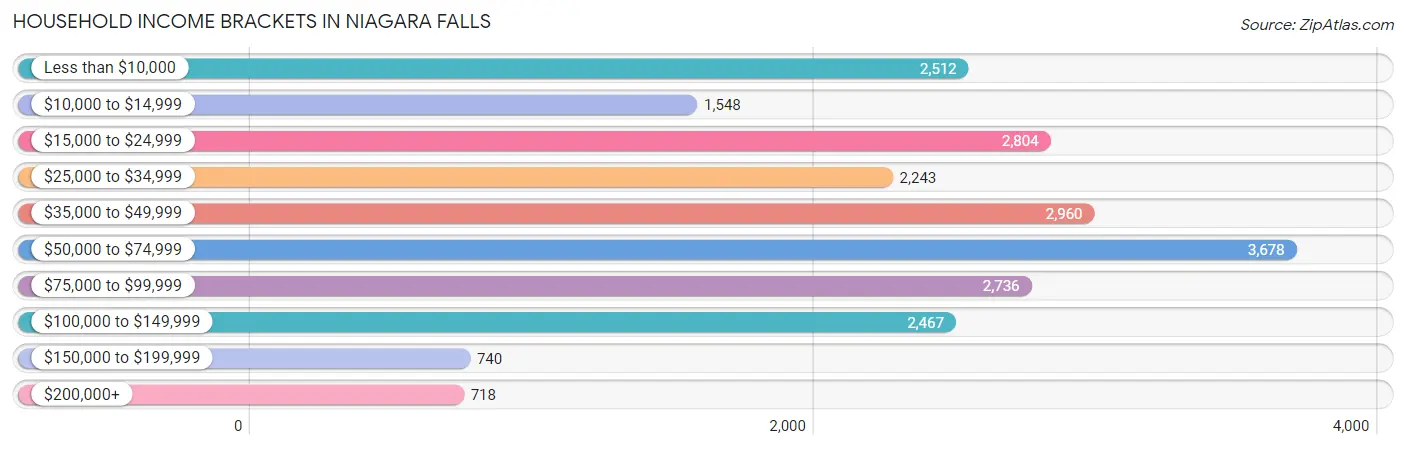
Household Income Brackets in Niagara Falls
With 3,678 households falling in the category, the $50,000 to $74,999 income range is the most frequent in Niagara Falls, accounting for 16.4% of all households. In contrast, only 718 households (3.2%) fall into the $200,000+ income bracket, making it the least populous group.
| Income Bracket | # Households | % Households |
| Less than $10,000 | 2,512 | 11.2% |
| $10,000 to $14,999 | 1,548 | 6.9% |
| $15,000 to $24,999 | 2,804 | 12.5% |
| $25,000 to $34,999 | 2,243 | 10.0% |
| $35,000 to $49,999 | 2,960 | 13.2% |
| $50,000 to $74,999 | 3,678 | 16.4% |
| $75,000 to $99,999 | 2,736 | 12.2% |
| $100,000 to $149,999 | 2,467 | 11.0% |
| $150,000 to $199,999 | 740 | 3.3% |
| $200,000+ | 718 | 3.2% |
Household Income by Householder Age in Niagara Falls
The median household income in Niagara Falls is $45,932, with the highest median household income of $52,796 found in the 25 to 44 years age bracket for the primary householder. A total of 7,058 households (31.5%) fall into this category. Meanwhile, the 15 to 24 years age bracket for the primary householder has the lowest median household income of $23,125, with 776 households (3.5%) in this group.
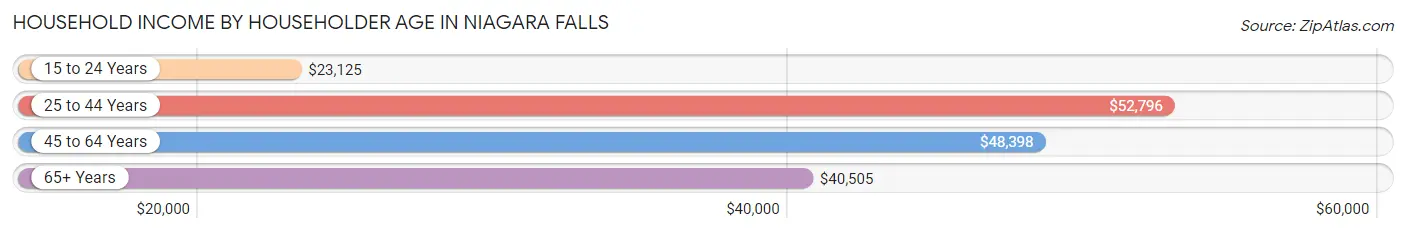
| Income Bracket | # Households | Median Income |
| 15 to 24 Years | 776 (3.5%) | $23,125 |
| 25 to 44 Years | 7,058 (31.5%) | $52,796 |
| 45 to 64 Years | 8,163 (36.4%) | $48,398 |
| 65+ Years | 6,431 (28.7%) | $40,505 |
| Total | 22,428 (100.0%) | $45,932 |
Poverty in Niagara Falls
Income Below Poverty by Sex and Age in Niagara Falls
With 22.9% poverty level for males and 27.1% for females among the residents of Niagara Falls, 6 to 11 year old males and under 5 year old females are the most vulnerable to poverty, with 813 males (44.4%) and 719 females (47.8%) in their respective age groups living below the poverty level.
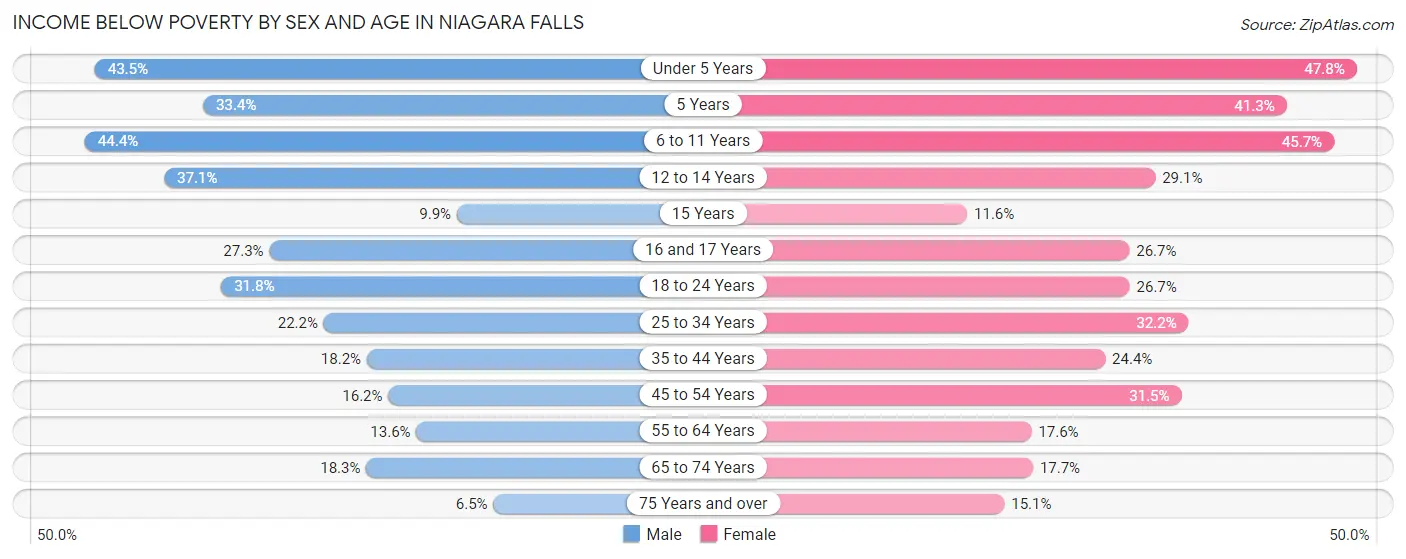
| Age Bracket | Male | Female |
| Under 5 Years | 557 (43.5%) | 719 (47.8%) |
| 5 Years | 109 (33.4%) | 161 (41.3%) |
| 6 to 11 Years | 813 (44.4%) | 733 (45.7%) |
| 12 to 14 Years | 306 (37.0%) | 185 (29.1%) |
| 15 Years | 16 (9.9%) | 35 (11.6%) |
| 16 and 17 Years | 230 (27.3%) | 111 (26.7%) |
| 18 to 24 Years | 627 (31.8%) | 530 (26.7%) |
| 25 to 34 Years | 694 (22.2%) | 1,123 (32.2%) |
| 35 to 44 Years | 515 (18.2%) | 821 (24.4%) |
| 45 to 54 Years | 473 (16.2%) | 849 (31.5%) |
| 55 to 64 Years | 464 (13.6%) | 626 (17.6%) |
| 65 to 74 Years | 499 (18.3%) | 462 (17.7%) |
| 75 Years and over | 83 (6.5%) | 305 (15.1%) |
| Total | 5,386 (22.9%) | 6,660 (27.1%) |
Income Above Poverty by Sex and Age in Niagara Falls
According to the poverty statistics in Niagara Falls, males aged 75 years and over and females aged 15 years are the age groups that are most secure financially, with 93.5% of males and 88.4% of females in these age groups living above the poverty line.
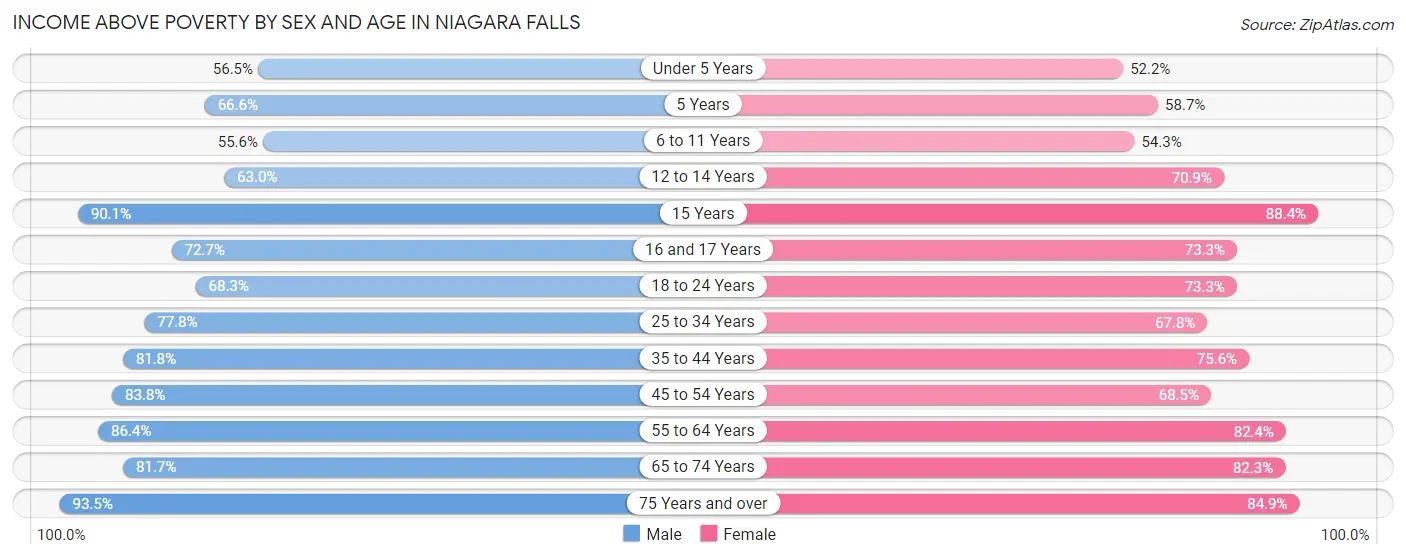
| Age Bracket | Male | Female |
| Under 5 Years | 724 (56.5%) | 786 (52.2%) |
| 5 Years | 217 (66.6%) | 229 (58.7%) |
| 6 to 11 Years | 1,018 (55.6%) | 872 (54.3%) |
| 12 to 14 Years | 520 (62.9%) | 451 (70.9%) |
| 15 Years | 146 (90.1%) | 266 (88.4%) |
| 16 and 17 Years | 613 (72.7%) | 305 (73.3%) |
| 18 to 24 Years | 1,348 (68.2%) | 1,454 (73.3%) |
| 25 to 34 Years | 2,428 (77.8%) | 2,367 (67.8%) |
| 35 to 44 Years | 2,310 (81.8%) | 2,538 (75.6%) |
| 45 to 54 Years | 2,440 (83.8%) | 1,845 (68.5%) |
| 55 to 64 Years | 2,937 (86.4%) | 2,930 (82.4%) |
| 65 to 74 Years | 2,229 (81.7%) | 2,142 (82.3%) |
| 75 Years and over | 1,196 (93.5%) | 1,717 (84.9%) |
| Total | 18,126 (77.1%) | 17,902 (72.9%) |
Income Below Poverty Among Married-Couple Families in Niagara Falls
The poverty statistics for married-couple families in Niagara Falls show that 6.9% or 440 of the total 6,384 families live below the poverty line. Families with 5 or more children have the highest poverty rate of 94.4%, comprising of 67 families. On the other hand, families with no children have the lowest poverty rate of 5.2%, which includes 217 families.
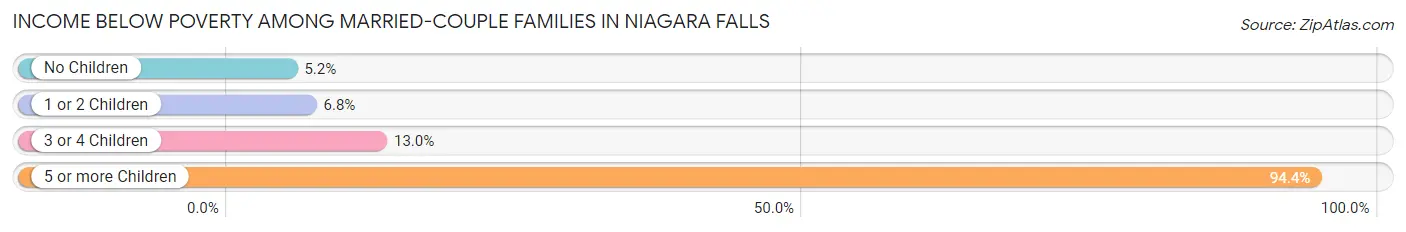
| Children | Above Poverty | Below Poverty |
| No Children | 3,981 (94.8%) | 217 (5.2%) |
| 1 or 2 Children | 1,798 (93.2%) | 132 (6.8%) |
| 3 or 4 Children | 161 (87.0%) | 24 (13.0%) |
| 5 or more Children | 4 (5.6%) | 67 (94.4%) |
| Total | 5,944 (93.1%) | 440 (6.9%) |
Income Below Poverty Among Single-Parent Households in Niagara Falls
According to the poverty data in Niagara Falls, 28.0% or 381 single-father households and 40.9% or 1,621 single-mother households are living below the poverty line. Among single-father households, those with 5 or more children have the highest poverty rate, with 24 households (100.0%) experiencing poverty. Likewise, among single-mother households, those with 3 or 4 children have the highest poverty rate, with 367 households (66.0%) falling below the poverty line.
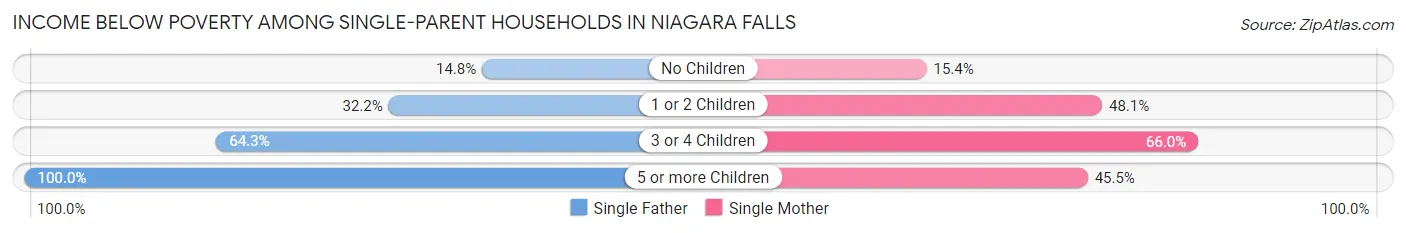
| Children | Single Father | Single Mother |
| No Children | 93 (14.8%) | 181 (15.4%) |
| 1 or 2 Children | 192 (32.2%) | 1,063 (48.1%) |
| 3 or 4 Children | 72 (64.3%) | 367 (66.0%) |
| 5 or more Children | 24 (100.0%) | 10 (45.5%) |
| Total | 381 (28.0%) | 1,621 (40.9%) |
Income Below Poverty Among Married-Couple vs Single-Parent Households in Niagara Falls
The poverty data for Niagara Falls shows that 440 of the married-couple family households (6.9%) and 2,002 of the single-parent households (37.6%) are living below the poverty level. Within the married-couple family households, those with 5 or more children have the highest poverty rate, with 67 households (94.4%) falling below the poverty line. Among the single-parent households, those with 5 or more children have the highest poverty rate, with 34 household (73.9%) living below poverty.
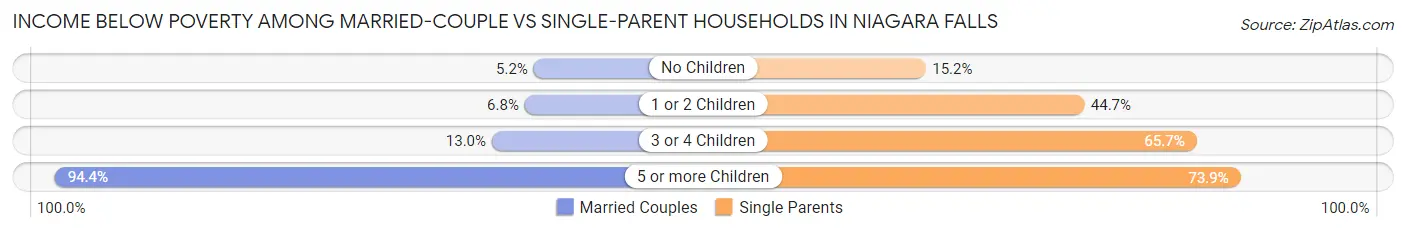
| Children | Married-Couple Families | Single-Parent Households |
| No Children | 217 (5.2%) | 274 (15.2%) |
| 1 or 2 Children | 132 (6.8%) | 1,255 (44.7%) |
| 3 or 4 Children | 24 (13.0%) | 439 (65.7%) |
| 5 or more Children | 67 (94.4%) | 34 (73.9%) |
| Total | 440 (6.9%) | 2,002 (37.6%) |
Race in Niagara Falls
The most populous races in Niagara Falls are White / Caucasian (32,343 | 66.7%), Black / African American (8,667 | 17.9%), and Two or more Races (4,790 | 9.9%).
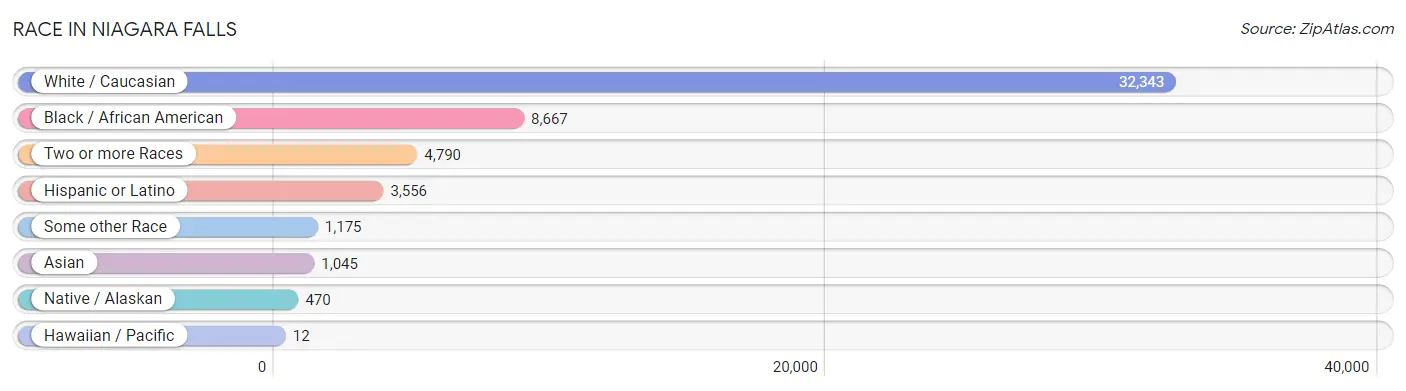
| Race | # Population | % Population |
| Asian | 1,045 | 2.1% |
| Black / African American | 8,667 | 17.9% |
| Hawaiian / Pacific | 12 | 0.0% |
| Hispanic or Latino | 3,556 | 7.3% |
| Native / Alaskan | 470 | 1.0% |
| White / Caucasian | 32,343 | 66.7% |
| Two or more Races | 4,790 | 9.9% |
| Some other Race | 1,175 | 2.4% |
| Total | 48,502 | 100.0% |
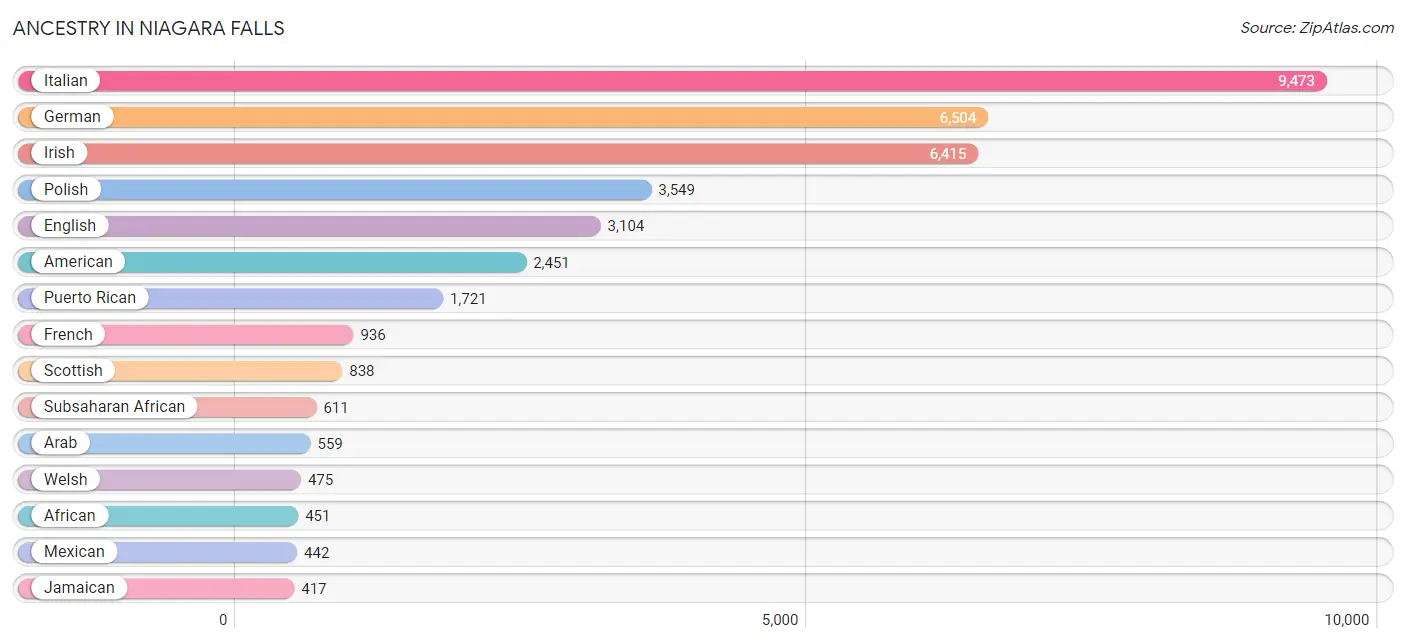
Ancestry in Niagara Falls
The most populous ancestries reported in Niagara Falls are Italian (9,473 | 19.5%), German (6,504 | 13.4%), Irish (6,415 | 13.2%), Polish (3,549 | 7.3%), and English (3,104 | 6.4%), together accounting for 59.9% of all Niagara Falls residents.
| Ancestry | # Population | % Population |
| African | 451 | 0.9% |
| Alaska Native | 15 | 0.0% |
| American | 2,451 | 5.1% |
| Arab | 559 | 1.1% |
| Armenian | 63 | 0.1% |
| Austrian | 12 | 0.0% |
| Bhutanese | 4 | 0.0% |
| Blackfeet | 15 | 0.0% |
| British | 39 | 0.1% |
| Bulgarian | 6 | 0.0% |
| Burmese | 80 | 0.2% |
| Canadian | 142 | 0.3% |
| Central American | 35 | 0.1% |
| Central American Indian | 34 | 0.1% |
| Cherokee | 39 | 0.1% |
| Chilean | 33 | 0.1% |
| Colombian | 85 | 0.2% |
| Creek | 238 | 0.5% |
| Croatian | 39 | 0.1% |
| Cuban | 88 | 0.2% |
| Czech | 65 | 0.1% |
| Czechoslovakian | 6 | 0.0% |
| Danish | 74 | 0.2% |
| Dominican | 220 | 0.4% |
| Dutch | 272 | 0.6% |
| Eastern European | 38 | 0.1% |
| Ecuadorian | 97 | 0.2% |
| Egyptian | 58 | 0.1% |
| English | 3,104 | 6.4% |
| Ethiopian | 7 | 0.0% |
| European | 233 | 0.5% |
| Finnish | 72 | 0.2% |
| French | 936 | 1.9% |
| French American Indian | 229 | 0.5% |
| French Canadian | 342 | 0.7% |
| German | 6,504 | 13.4% |
| Ghanaian | 27 | 0.1% |
| Greek | 217 | 0.4% |
| Guyanese | 8 | 0.0% |
| Haitian | 19 | 0.0% |
| Hungarian | 96 | 0.2% |
| Icelander | 45 | 0.1% |
| Indian (Asian) | 272 | 0.6% |
| Indonesian | 7 | 0.0% |
| Iranian | 25 | 0.1% |
| Iraqi | 35 | 0.1% |
| Irish | 6,415 | 13.2% |
| Iroquois | 296 | 0.6% |
| Israeli | 22 | 0.1% |
| Italian | 9,473 | 19.5% |
| Jamaican | 417 | 0.9% |
| Jordanian | 3 | 0.0% |
| Korean | 80 | 0.2% |
| Lebanese | 377 | 0.8% |
| Lithuanian | 74 | 0.2% |
| Lumbee | 11 | 0.0% |
| Malaysian | 17 | 0.0% |
| Maltese | 7 | 0.0% |
| Mexican | 442 | 0.9% |
| Moroccan | 20 | 0.0% |
| Native Hawaiian | 106 | 0.2% |
| Nigerian | 20 | 0.0% |
| Northern European | 27 | 0.1% |
| Norwegian | 121 | 0.3% |
| Pakistani | 22 | 0.1% |
| Panamanian | 33 | 0.1% |
| Pennsylvania German | 26 | 0.1% |
| Peruvian | 17 | 0.0% |
| Polish | 3,549 | 7.3% |
| Portuguese | 6 | 0.0% |
| Puerto Rican | 1,721 | 3.5% |
| Romanian | 17 | 0.0% |
| Russian | 134 | 0.3% |
| Salvadoran | 2 | 0.0% |
| Samoan | 84 | 0.2% |
| Scandinavian | 36 | 0.1% |
| Scotch-Irish | 319 | 0.7% |
| Scottish | 838 | 1.7% |
| Slavic | 3 | 0.0% |
| Slovak | 190 | 0.4% |
| Somali | 97 | 0.2% |
| South American | 276 | 0.6% |
| South American Indian | 13 | 0.0% |
| Spaniard | 208 | 0.4% |
| Spanish | 304 | 0.6% |
| Sri Lankan | 77 | 0.2% |
| Subsaharan African | 611 | 1.3% |
| Swedish | 201 | 0.4% |
| Swiss | 50 | 0.1% |
| Syrian | 10 | 0.0% |
| Thai | 295 | 0.6% |
| Turkish | 30 | 0.1% |
| Ukrainian | 187 | 0.4% |
| Venezuelan | 36 | 0.1% |
| Vietnamese | 24 | 0.1% |
| Welsh | 475 | 1.0% |
| West Indian | 34 | 0.1% |
| Yugoslavian | 39 | 0.1% | View All 98 Rows |
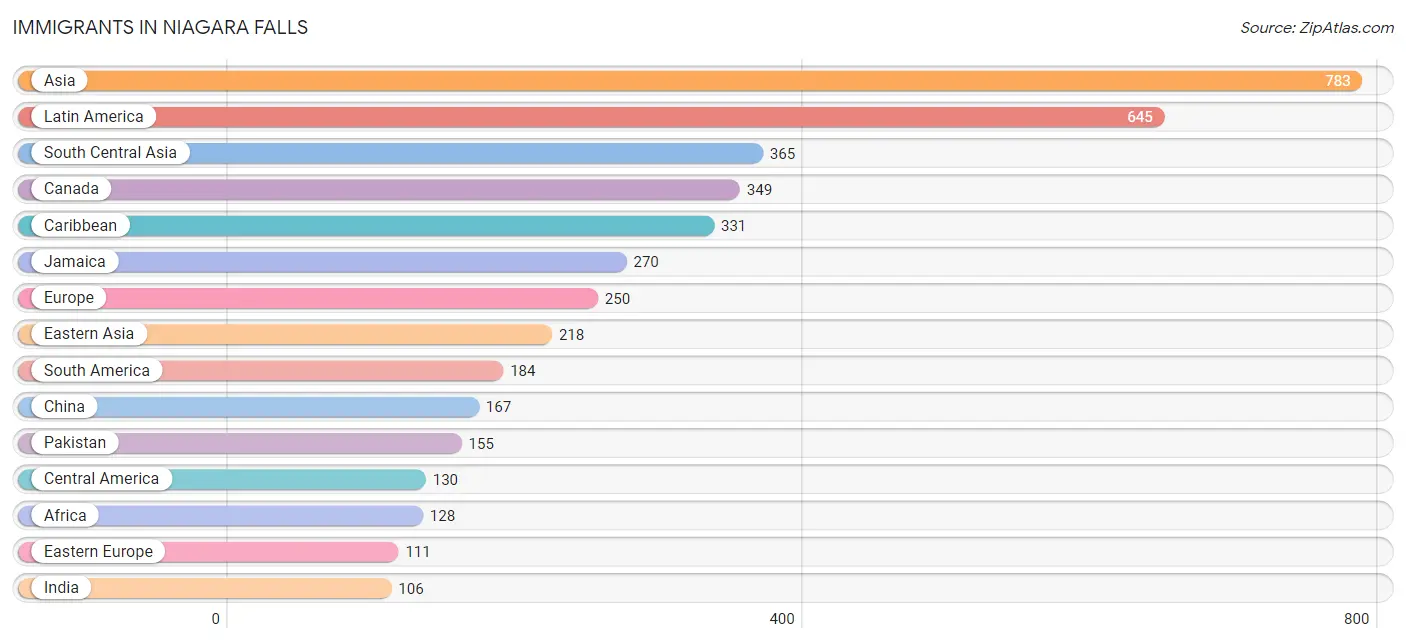
Immigrants in Niagara Falls
The most numerous immigrant groups reported in Niagara Falls came from Asia (783 | 1.6%), Latin America (645 | 1.3%), South Central Asia (365 | 0.7%), Canada (349 | 0.7%), and Caribbean (331 | 0.7%), together accounting for 5.1% of all Niagara Falls residents.
| Immigration Origin | # Population | % Population |
| Africa | 128 | 0.3% |
| Asia | 783 | 1.6% |
| Bangladesh | 11 | 0.0% |
| Bulgaria | 6 | 0.0% |
| Canada | 349 | 0.7% |
| Caribbean | 331 | 0.7% |
| Central America | 130 | 0.3% |
| Chile | 33 | 0.1% |
| China | 167 | 0.3% |
| Colombia | 35 | 0.1% |
| Costa Rica | 13 | 0.0% |
| Czechoslovakia | 10 | 0.0% |
| Denmark | 12 | 0.0% |
| Dominican Republic | 41 | 0.1% |
| Eastern Africa | 83 | 0.2% |
| Eastern Asia | 218 | 0.4% |
| Eastern Europe | 111 | 0.2% |
| Ecuador | 38 | 0.1% |
| Egypt | 25 | 0.1% |
| El Salvador | 55 | 0.1% |
| England | 35 | 0.1% |
| Ethiopia | 7 | 0.0% |
| Europe | 250 | 0.5% |
| Germany | 17 | 0.0% |
| Guatemala | 29 | 0.1% |
| Guyana | 25 | 0.1% |
| Haiti | 19 | 0.0% |
| Hong Kong | 10 | 0.0% |
| Hungary | 10 | 0.0% |
| India | 106 | 0.2% |
| Iran | 93 | 0.2% |
| Iraq | 35 | 0.1% |
| Italy | 49 | 0.1% |
| Jamaica | 270 | 0.6% |
| Japan | 4 | 0.0% |
| Jordan | 7 | 0.0% |
| Kenya | 39 | 0.1% |
| Korea | 47 | 0.1% |
| Laos | 17 | 0.0% |
| Latin America | 645 | 1.3% |
| Lebanon | 40 | 0.1% |
| Morocco | 20 | 0.0% |
| Netherlands | 12 | 0.0% |
| Northern Africa | 45 | 0.1% |
| Northern Europe | 51 | 0.1% |
| Pakistan | 155 | 0.3% |
| Panama | 33 | 0.1% |
| Peru | 17 | 0.0% |
| Philippines | 36 | 0.1% |
| Poland | 28 | 0.1% |
| Russia | 41 | 0.1% |
| Saudi Arabia | 16 | 0.0% |
| Scotland | 4 | 0.0% |
| Somalia | 37 | 0.1% |
| South America | 184 | 0.4% |
| South Central Asia | 365 | 0.7% |
| South Eastern Asia | 101 | 0.2% |
| Southern Europe | 59 | 0.1% |
| Trinidad and Tobago | 1 | 0.0% |
| Turkey | 1 | 0.0% |
| Ukraine | 10 | 0.0% |
| Venezuela | 36 | 0.1% |
| Vietnam | 41 | 0.1% |
| Western Asia | 99 | 0.2% |
| Western Europe | 29 | 0.1% | View All 65 Rows |
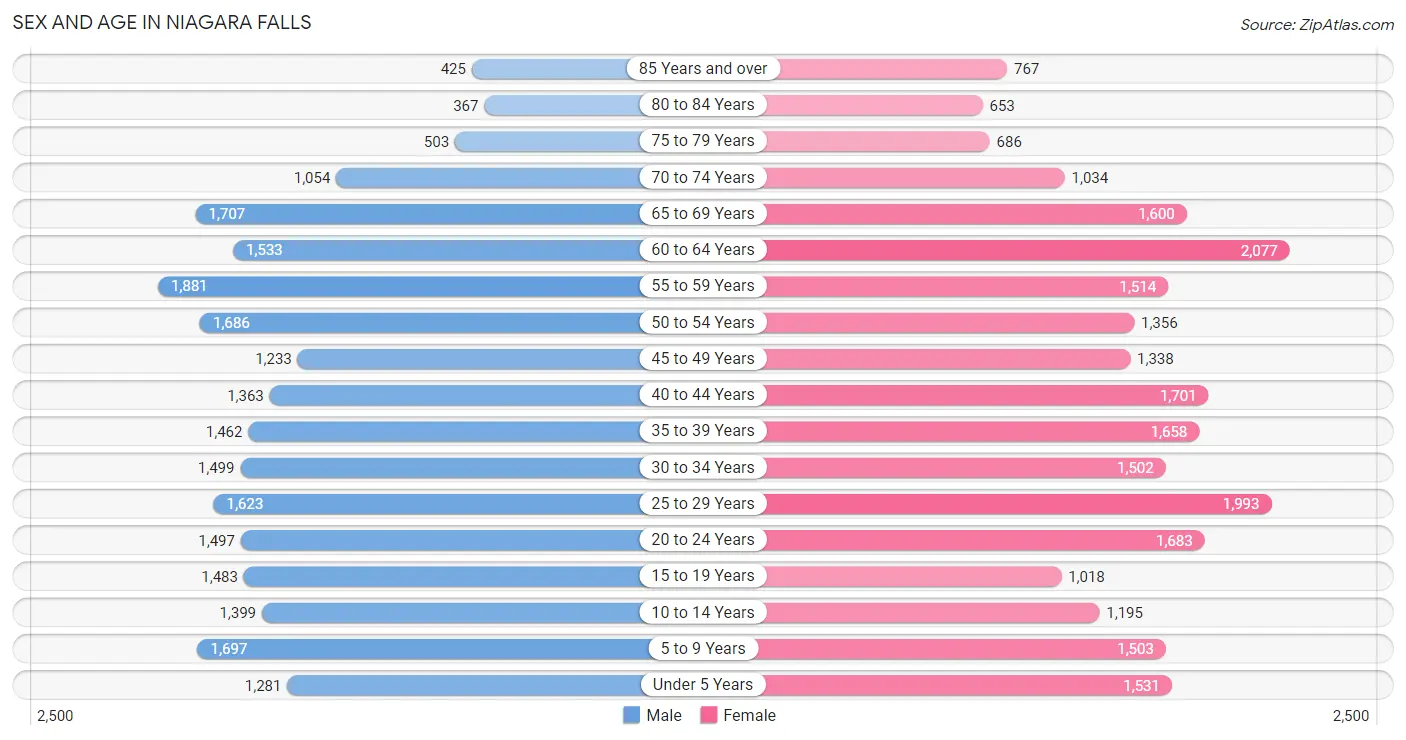
Sex and Age in Niagara Falls
Sex and Age in Niagara Falls
The most populous age groups in Niagara Falls are 55 to 59 Years (1,881 | 7.9%) for men and 60 to 64 Years (2,077 | 8.4%) for women.
| Age Bracket | Male | Female |
| Under 5 Years | 1,281 (5.4%) | 1,531 (6.2%) |
| 5 to 9 Years | 1,697 (7.2%) | 1,503 (6.1%) |
| 10 to 14 Years | 1,399 (5.9%) | 1,195 (4.8%) |
| 15 to 19 Years | 1,483 (6.3%) | 1,018 (4.1%) |
| 20 to 24 Years | 1,497 (6.3%) | 1,683 (6.8%) |
| 25 to 29 Years | 1,623 (6.9%) | 1,993 (8.0%) |
| 30 to 34 Years | 1,499 (6.3%) | 1,502 (6.0%) |
| 35 to 39 Years | 1,462 (6.2%) | 1,658 (6.7%) |
| 40 to 44 Years | 1,363 (5.8%) | 1,701 (6.9%) |
| 45 to 49 Years | 1,233 (5.2%) | 1,338 (5.4%) |
| 50 to 54 Years | 1,686 (7.1%) | 1,356 (5.5%) |
| 55 to 59 Years | 1,881 (7.9%) | 1,514 (6.1%) |
| 60 to 64 Years | 1,533 (6.5%) | 2,077 (8.4%) |
| 65 to 69 Years | 1,707 (7.2%) | 1,600 (6.5%) |
| 70 to 74 Years | 1,054 (4.4%) | 1,034 (4.2%) |
| 75 to 79 Years | 503 (2.1%) | 686 (2.8%) |
| 80 to 84 Years | 367 (1.5%) | 653 (2.6%) |
| 85 Years and over | 425 (1.8%) | 767 (3.1%) |
| Total | 23,693 (100.0%) | 24,809 (100.0%) |
Families and Households in Niagara Falls
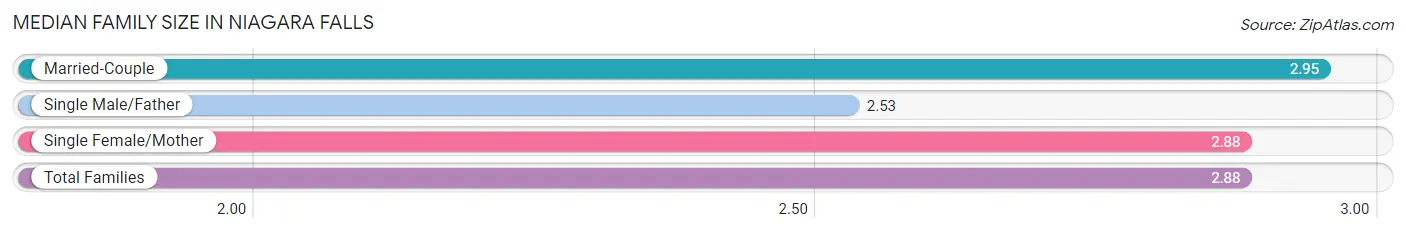
Median Family Size in Niagara Falls
The median family size in Niagara Falls is 2.88 persons per family, with married-couple families (6,384 | 54.5%) accounting for the largest median family size of 2.95 persons per family. On the other hand, single male/father families (1,361 | 11.6%) represent the smallest median family size with 2.53 persons per family.
| Family Type | # Families | Family Size |
| Married-Couple | 6,384 (54.5%) | 2.95 |
| Single Male/Father | 1,361 (11.6%) | 2.53 |
| Single Female/Mother | 3,959 (33.8%) | 2.88 |
| Total Families | 11,704 (100.0%) | 2.88 |
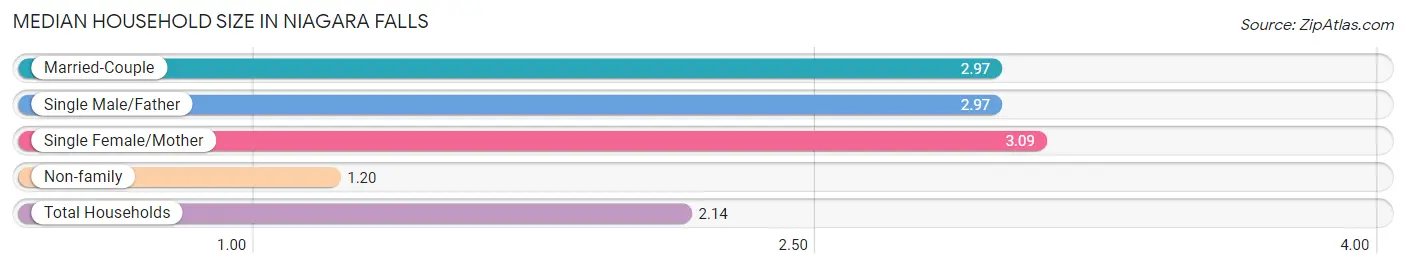
Median Household Size in Niagara Falls
The median household size in Niagara Falls is 2.14 persons per household, with single female/mother households (3,959 | 17.6%) accounting for the largest median household size of 3.09 persons per household. non-family households (10,724 | 47.8%) represent the smallest median household size with 1.20 persons per household.
| Household Type | # Households | Household Size |
| Married-Couple | 6,384 (28.5%) | 2.97 |
| Single Male/Father | 1,361 (6.1%) | 2.97 |
| Single Female/Mother | 3,959 (17.6%) | 3.09 |
| Non-family | 10,724 (47.8%) | 1.20 |
| Total Households | 22,428 (100.0%) | 2.14 |
Household Size by Marriage Status in Niagara Falls
Out of a total of 22,428 households in Niagara Falls, 11,704 (52.2%) are family households, while 10,724 (47.8%) are nonfamily households. The most numerous type of family households are 2-person households, comprising 5,547, and the most common type of nonfamily households are 1-person households, comprising 8,999.
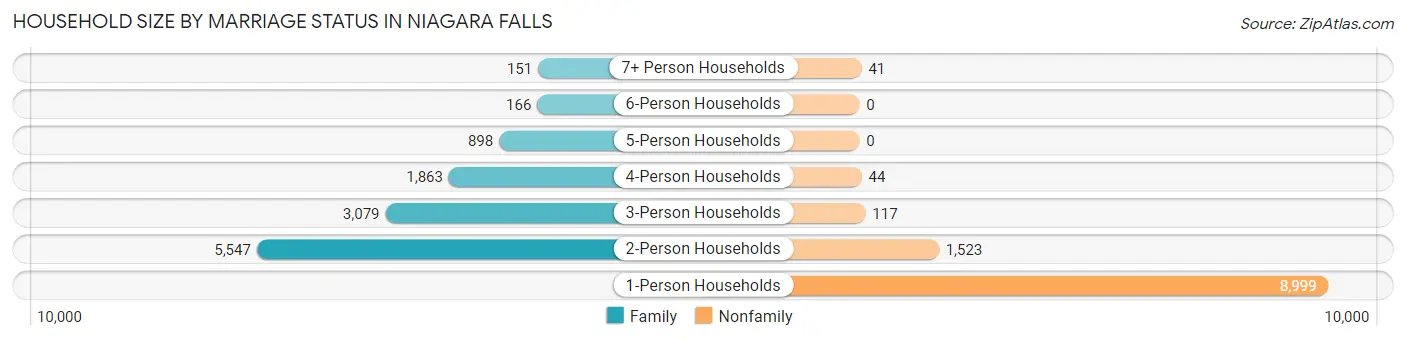
| Household Size | Family Households | Nonfamily Households |
| 1-Person Households | - | 8,999 (40.1%) |
| 2-Person Households | 5,547 (24.7%) | 1,523 (6.8%) |
| 3-Person Households | 3,079 (13.7%) | 117 (0.5%) |
| 4-Person Households | 1,863 (8.3%) | 44 (0.2%) |
| 5-Person Households | 898 (4.0%) | 0 (0.0%) |
| 6-Person Households | 166 (0.7%) | 0 (0.0%) |
| 7+ Person Households | 151 (0.7%) | 41 (0.2%) |
| Total | 11,704 (52.2%) | 10,724 (47.8%) |
Female Fertility in Niagara Falls
Fertility by Age in Niagara Falls
Average fertility rate in Niagara Falls is 53.0 births per 1,000 women. Women in the age bracket of 20 to 34 years have the highest fertility rate with 88.0 births per 1,000 women. Women in the age bracket of 20 to 34 years acount for 77.8% of all women with births.
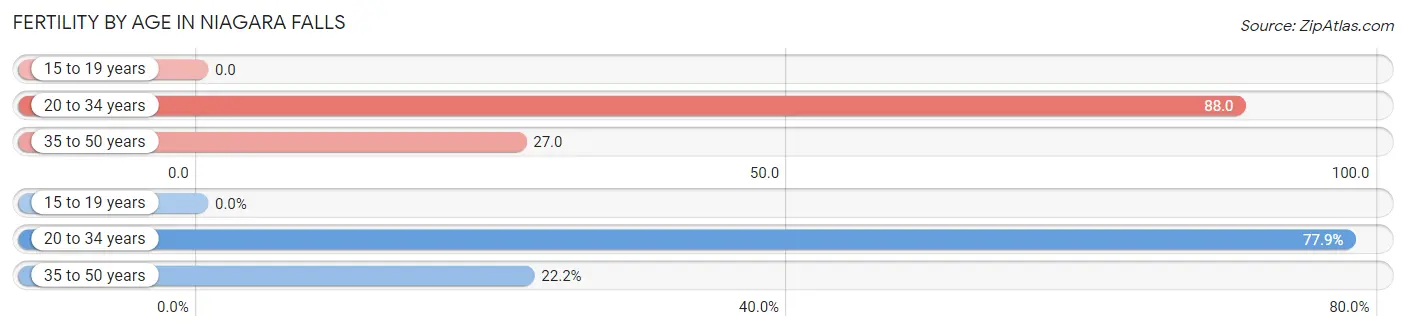
| Age Bracket | Women with Births | Births / 1,000 Women |
| 15 to 19 years | 0 (0.0%) | 0.0 |
| 20 to 34 years | 457 (77.8%) | 88.0 |
| 35 to 50 years | 130 (22.2%) | 27.0 |
| Total | 587 (100.0%) | 53.0 |
Fertility by Age by Marriage Status in Niagara Falls
32.0% of women with births (587) in Niagara Falls are married. The highest percentage of unmarried women with births falls into 20 to 34 years age bracket with 70.7% of them unmarried at the time of birth, while the lowest percentage of unmarried women with births belong to 35 to 50 years age bracket with 58.5% of them unmarried.
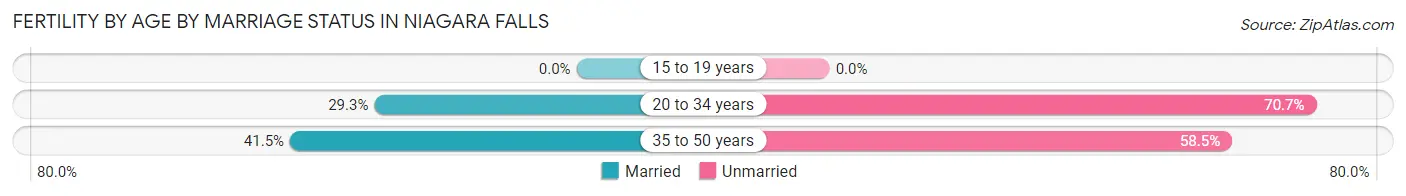
| Age Bracket | Married | Unmarried |
| 15 to 19 years | 0 (0.0%) | 0 (0.0%) |
| 20 to 34 years | 134 (29.3%) | 323 (70.7%) |
| 35 to 50 years | 54 (41.5%) | 76 (58.5%) |
| Total | 188 (32.0%) | 399 (68.0%) |
Fertility by Education in Niagara Falls
Average fertility rate in Niagara Falls is 53.0 births per 1,000 women. Women with the education attainment of high school diploma have the highest fertility rate of 75.0 births per 1,000 women, while women with the education attainment of college or associate's degree have the lowest fertility at 40.0 births per 1,000 women. Women with the education attainment of high school diploma represent 41.2% of all women with births.
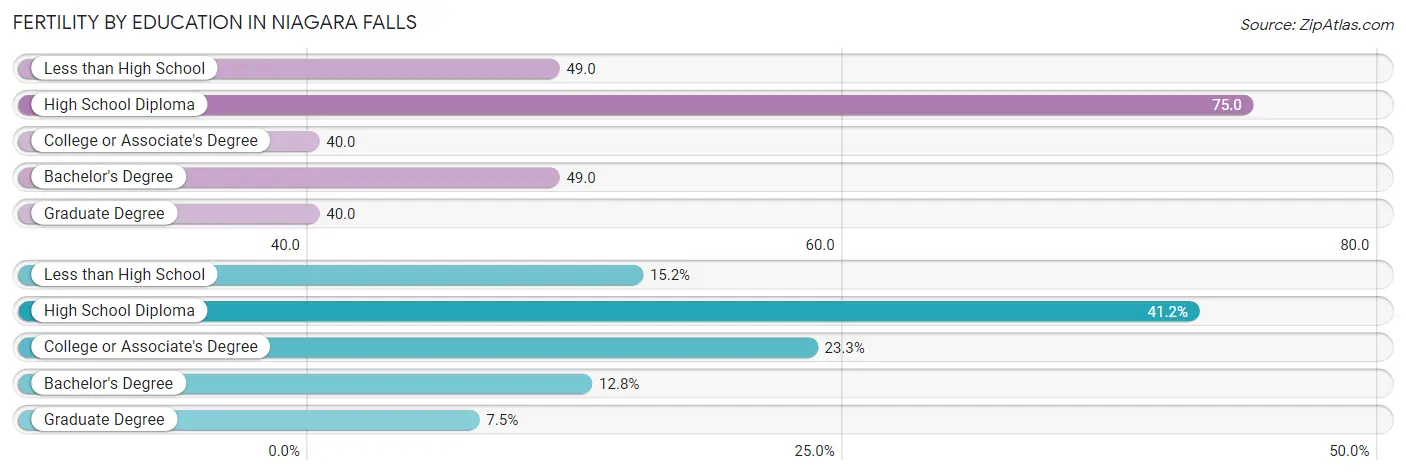
| Educational Attainment | Women with Births | Births / 1,000 Women |
| Less than High School | 89 (15.2%) | 49.0 |
| High School Diploma | 242 (41.2%) | 75.0 |
| College or Associate's Degree | 137 (23.3%) | 40.0 |
| Bachelor's Degree | 75 (12.8%) | 49.0 |
| Graduate Degree | 44 (7.5%) | 40.0 |
| Total | 587 (100.0%) | 53.0 |
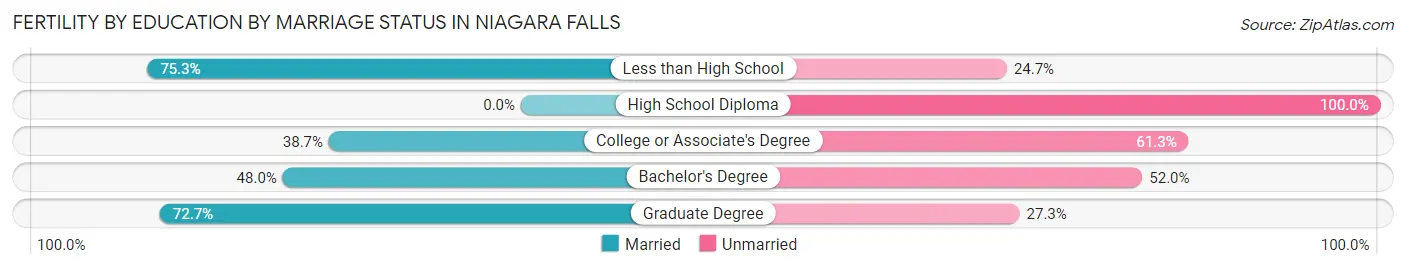
Fertility by Education by Marriage Status in Niagara Falls
68.0% of women with births in Niagara Falls are unmarried. Women with the educational attainment of less than high school are most likely to be married with 75.3% of them married at childbirth, while women with the educational attainment of high school diploma are least likely to be married with 100.0% of them unmarried at childbirth.
| Educational Attainment | Married | Unmarried |
| Less than High School | 67 (75.3%) | 22 (24.7%) |
| High School Diploma | 0 (0.0%) | 242 (100.0%) |
| College or Associate's Degree | 53 (38.7%) | 84 (61.3%) |
| Bachelor's Degree | 36 (48.0%) | 39 (52.0%) |
| Graduate Degree | 32 (72.7%) | 12 (27.3%) |
| Total | 188 (32.0%) | 399 (68.0%) |
Employment Characteristics in Niagara Falls
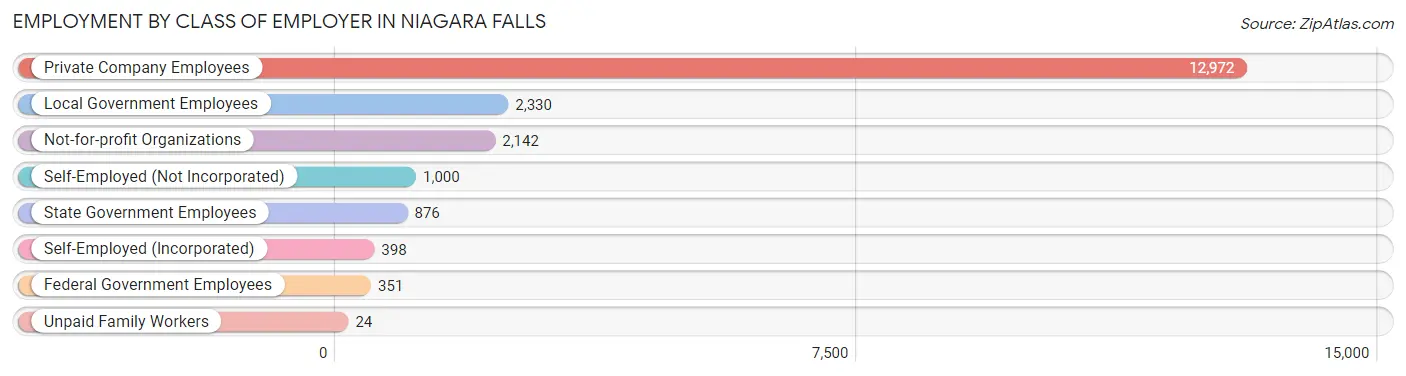
Employment by Class of Employer in Niagara Falls
Among the 20,093 employed individuals in Niagara Falls, private company employees (12,972 | 64.6%), local government employees (2,330 | 11.6%), and not-for-profit organizations (2,142 | 10.7%) make up the most common classes of employment.
| Employer Class | # Employees | % Employees |
| Private Company Employees | 12,972 | 64.6% |
| Self-Employed (Incorporated) | 398 | 2.0% |
| Self-Employed (Not Incorporated) | 1,000 | 5.0% |
| Not-for-profit Organizations | 2,142 | 10.7% |
| Local Government Employees | 2,330 | 11.6% |
| State Government Employees | 876 | 4.4% |
| Federal Government Employees | 351 | 1.8% |
| Unpaid Family Workers | 24 | 0.1% |
| Total | 20,093 | 100.0% |
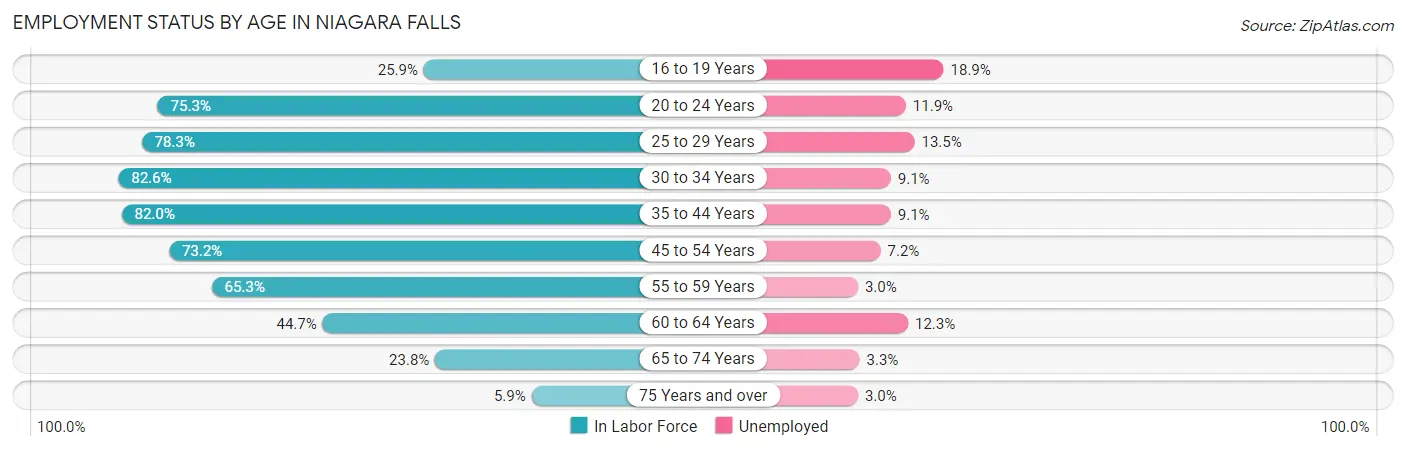
Employment Status by Age in Niagara Falls
According to the labor force statistics for Niagara Falls, out of the total population over 16 years of age (39,433), 57.6% or 22,713 individuals are in the labor force, with 9.1% or 2,067 of them unemployed. The age group with the highest labor force participation rate is 30 to 34 years, with 82.6% or 2,479 individuals in the labor force. Within the labor force, the 16 to 19 years age range has the highest percentage of unemployed individuals, with 18.9% or 100 of them being unemployed.
| Age Bracket | In Labor Force | Unemployed |
| 16 to 19 Years | 528 (25.9%) | 100 (18.9%) |
| 20 to 24 Years | 2,395 (75.3%) | 285 (11.9%) |
| 25 to 29 Years | 2,831 (78.3%) | 382 (13.5%) |
| 30 to 34 Years | 2,479 (82.6%) | 226 (9.1%) |
| 35 to 44 Years | 5,071 (82.0%) | 461 (9.1%) |
| 45 to 54 Years | 4,109 (73.2%) | 296 (7.2%) |
| 55 to 59 Years | 2,217 (65.3%) | 67 (3.0%) |
| 60 to 64 Years | 1,614 (44.7%) | 199 (12.3%) |
| 65 to 74 Years | 1,284 (23.8%) | 42 (3.3%) |
| 75 Years and over | 201 (5.9%) | 6 (3.0%) |
| Total | 22,713 (57.6%) | 2,067 (9.1%) |
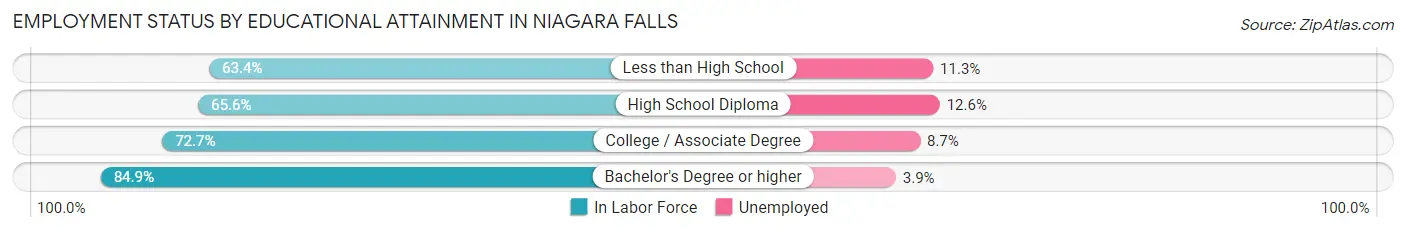
Employment Status by Educational Attainment in Niagara Falls
According to labor force statistics for Niagara Falls, 72.1% of individuals (18,327) out of the total population between 25 and 64 years of age (25,419) are in the labor force, with 8.9% or 1,631 of them being unemployed. The group with the highest labor force participation rate are those with the educational attainment of bachelor's degree or higher, with 84.9% or 4,966 individuals in the labor force. Within the labor force, individuals with high school diploma education have the highest percentage of unemployment, with 12.6% or 712 of them being unemployed.
| Educational Attainment | In Labor Force | Unemployed |
| Less than High School | 1,835 (63.4%) | 327 (11.3%) |
| High School Diploma | 5,654 (65.6%) | 1,086 (12.6%) |
| College / Associate Degree | 5,857 (72.7%) | 701 (8.7%) |
| Bachelor's Degree or higher | 4,966 (84.9%) | 228 (3.9%) |
| Total | 18,327 (72.1%) | 2,262 (8.9%) |
Employment Occupations by Sex in Niagara Falls
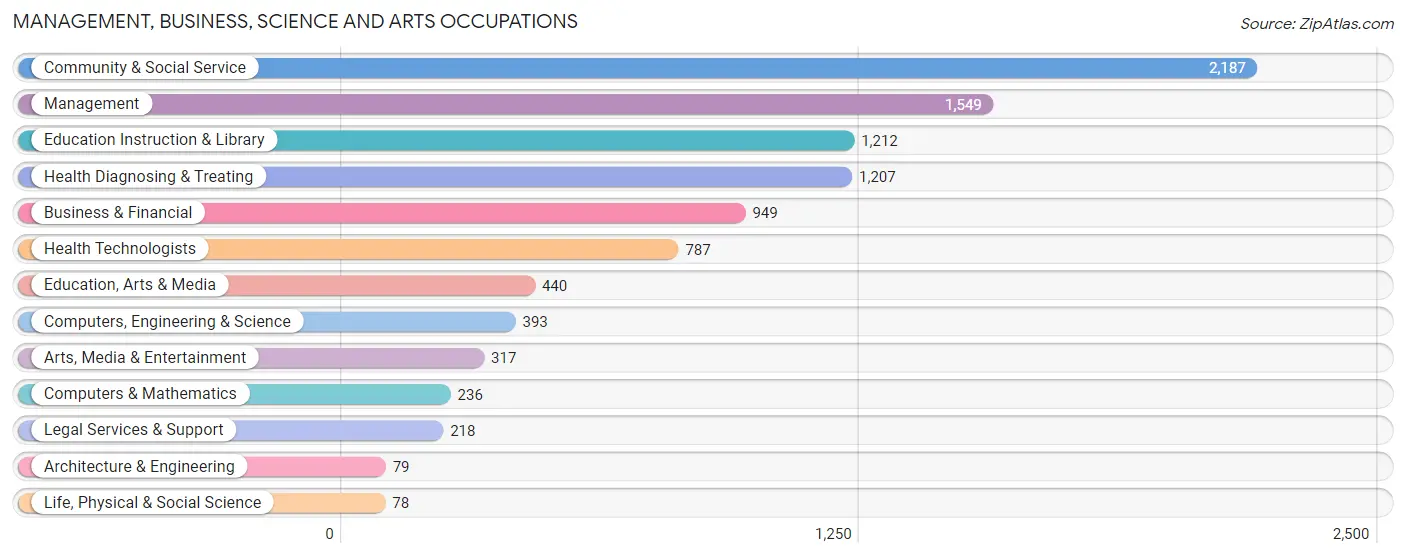
Management, Business, Science and Arts Occupations
The most common Management, Business, Science and Arts occupations in Niagara Falls are Community & Social Service (2,187 | 10.6%), Management (1,549 | 7.5%), Education Instruction & Library (1,212 | 5.9%), Health Diagnosing & Treating (1,207 | 5.8%), and Business & Financial (949 | 4.6%).
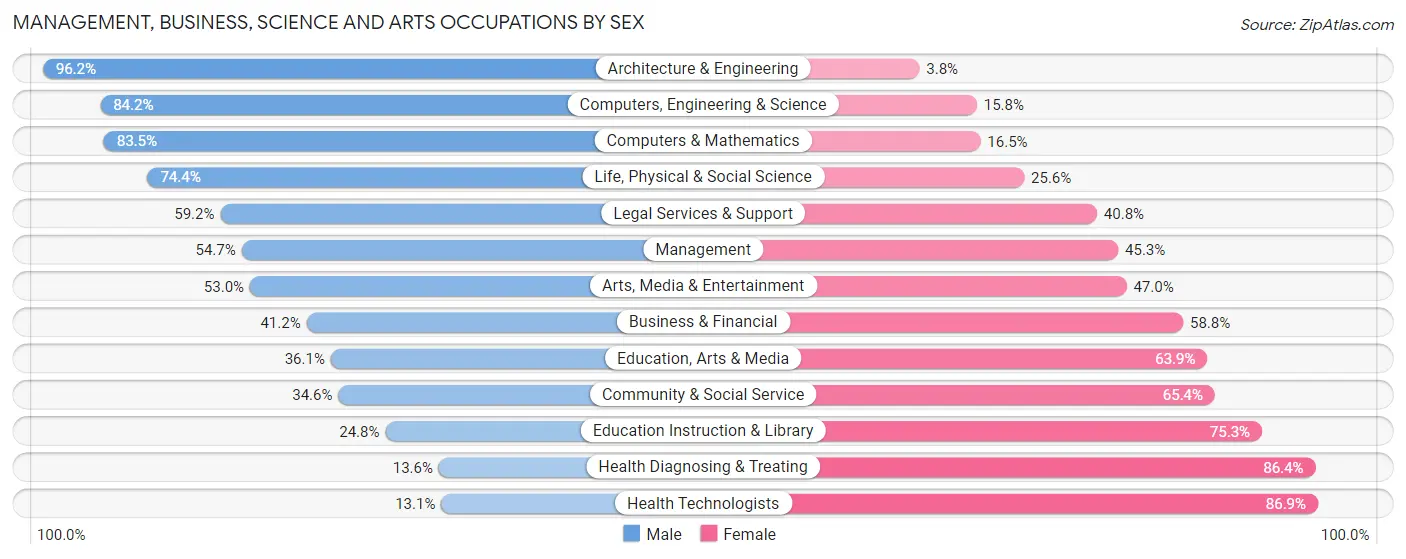
Management, Business, Science and Arts Occupations by Sex
Within the Management, Business, Science and Arts occupations in Niagara Falls, the most male-oriented occupations are Architecture & Engineering (96.2%), Computers, Engineering & Science (84.2%), and Computers & Mathematics (83.5%), while the most female-oriented occupations are Health Technologists (86.9%), Health Diagnosing & Treating (86.4%), and Education Instruction & Library (75.2%).
| Occupation | Male | Female |
| Management | 848 (54.7%) | 701 (45.3%) |
| Business & Financial | 391 (41.2%) | 558 (58.8%) |
| Computers, Engineering & Science | 331 (84.2%) | 62 (15.8%) |
| Computers & Mathematics | 197 (83.5%) | 39 (16.5%) |
| Architecture & Engineering | 76 (96.2%) | 3 (3.8%) |
| Life, Physical & Social Science | 58 (74.4%) | 20 (25.6%) |
| Community & Social Service | 756 (34.6%) | 1,431 (65.4%) |
| Education, Arts & Media | 159 (36.1%) | 281 (63.9%) |
| Legal Services & Support | 129 (59.2%) | 89 (40.8%) |
| Education Instruction & Library | 300 (24.7%) | 912 (75.2%) |
| Arts, Media & Entertainment | 168 (53.0%) | 149 (47.0%) |
| Health Diagnosing & Treating | 164 (13.6%) | 1,043 (86.4%) |
| Health Technologists | 103 (13.1%) | 684 (86.9%) |
| Total (Category) | 2,490 (39.6%) | 3,795 (60.4%) |
| Total (Overall) | 10,164 (49.2%) | 10,490 (50.8%) |
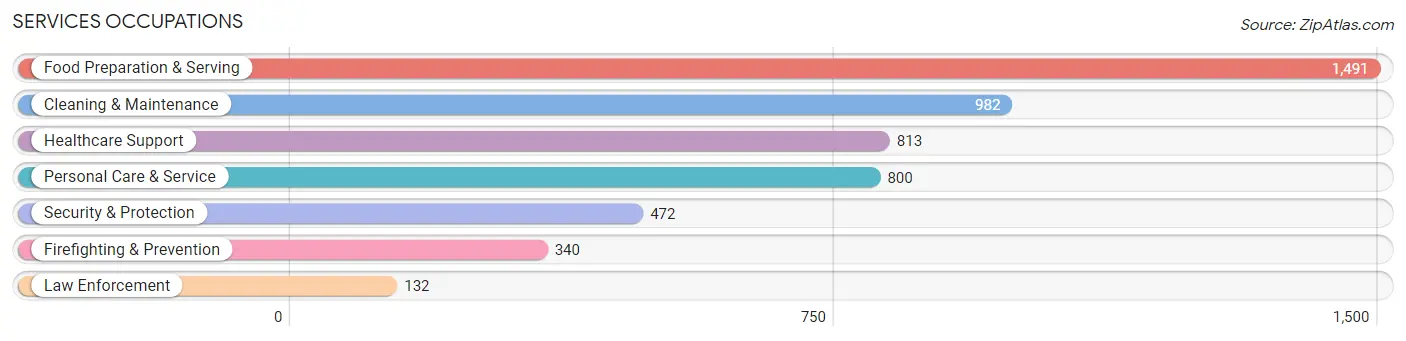
Services Occupations
The most common Services occupations in Niagara Falls are Food Preparation & Serving (1,491 | 7.2%), Cleaning & Maintenance (982 | 4.8%), Healthcare Support (813 | 3.9%), Personal Care & Service (800 | 3.9%), and Security & Protection (472 | 2.3%).
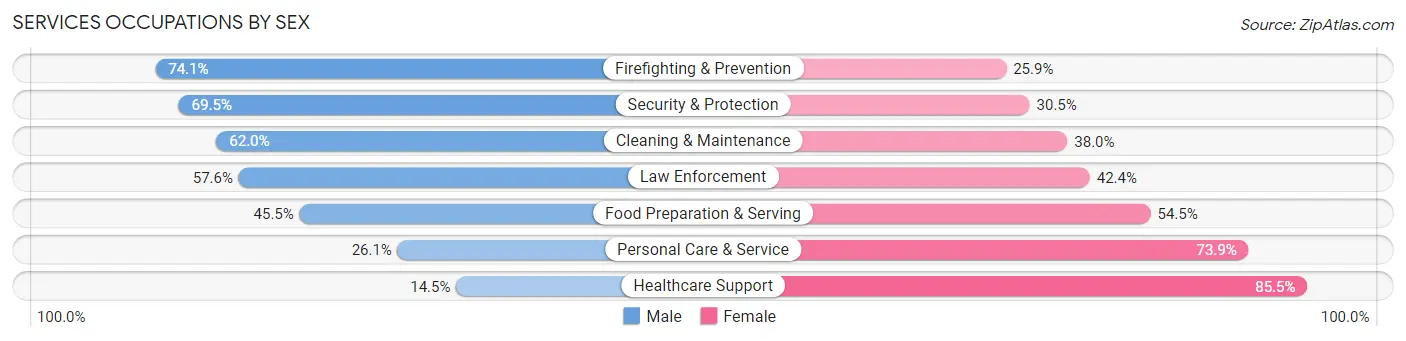
Services Occupations by Sex
Within the Services occupations in Niagara Falls, the most male-oriented occupations are Firefighting & Prevention (74.1%), Security & Protection (69.5%), and Cleaning & Maintenance (62.0%), while the most female-oriented occupations are Healthcare Support (85.5%), Personal Care & Service (73.9%), and Food Preparation & Serving (54.5%).
| Occupation | Male | Female |
| Healthcare Support | 118 (14.5%) | 695 (85.5%) |
| Security & Protection | 328 (69.5%) | 144 (30.5%) |
| Firefighting & Prevention | 252 (74.1%) | 88 (25.9%) |
| Law Enforcement | 76 (57.6%) | 56 (42.4%) |
| Food Preparation & Serving | 679 (45.5%) | 812 (54.5%) |
| Cleaning & Maintenance | 609 (62.0%) | 373 (38.0%) |
| Personal Care & Service | 209 (26.1%) | 591 (73.9%) |
| Total (Category) | 1,943 (42.6%) | 2,615 (57.4%) |
| Total (Overall) | 10,164 (49.2%) | 10,490 (50.8%) |
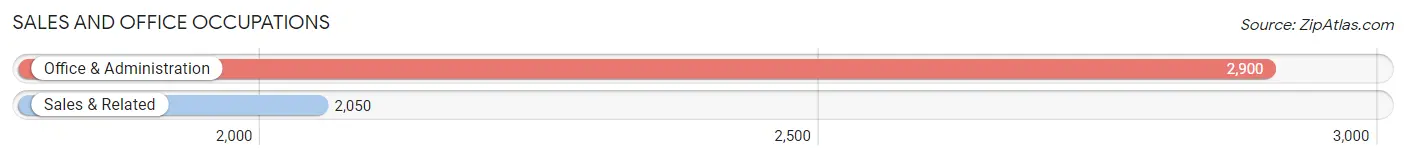
Sales and Office Occupations
The most common Sales and Office occupations in Niagara Falls are Office & Administration (2,900 | 14.0%), and Sales & Related (2,050 | 9.9%).
Sales and Office Occupations by Sex
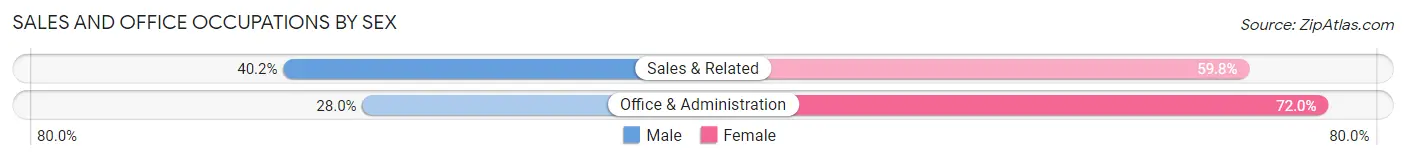
| Occupation | Male | Female |
| Sales & Related | 824 (40.2%) | 1,226 (59.8%) |
| Office & Administration | 813 (28.0%) | 2,087 (72.0%) |
| Total (Category) | 1,637 (33.1%) | 3,313 (66.9%) |
| Total (Overall) | 10,164 (49.2%) | 10,490 (50.8%) |
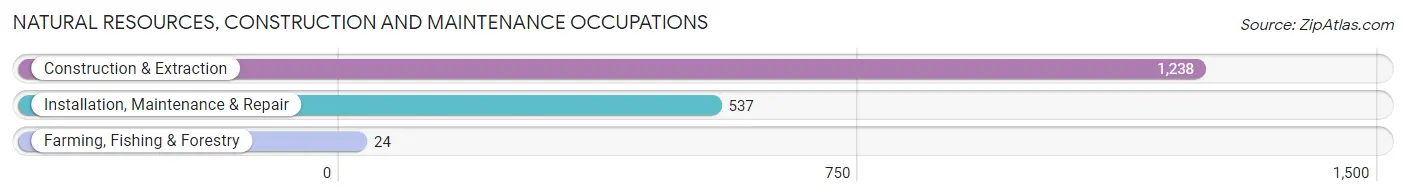
Natural Resources, Construction and Maintenance Occupations
The most common Natural Resources, Construction and Maintenance occupations in Niagara Falls are Construction & Extraction (1,238 | 6.0%), Installation, Maintenance & Repair (537 | 2.6%), and Farming, Fishing & Forestry (24 | 0.1%).
Natural Resources, Construction and Maintenance Occupations by Sex
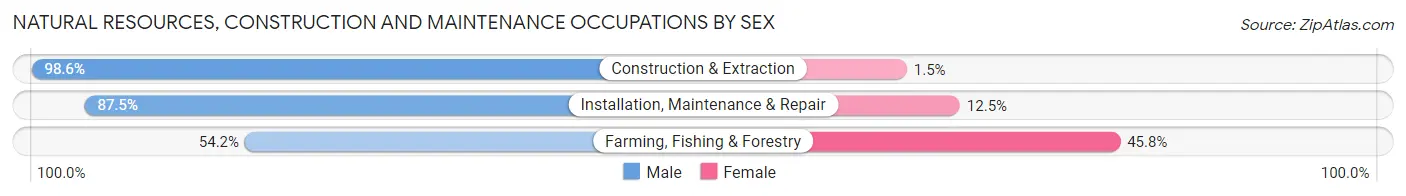
| Occupation | Male | Female |
| Farming, Fishing & Forestry | 13 (54.2%) | 11 (45.8%) |
| Construction & Extraction | 1,220 (98.6%) | 18 (1.5%) |
| Installation, Maintenance & Repair | 470 (87.5%) | 67 (12.5%) |
| Total (Category) | 1,703 (94.7%) | 96 (5.3%) |
| Total (Overall) | 10,164 (49.2%) | 10,490 (50.8%) |
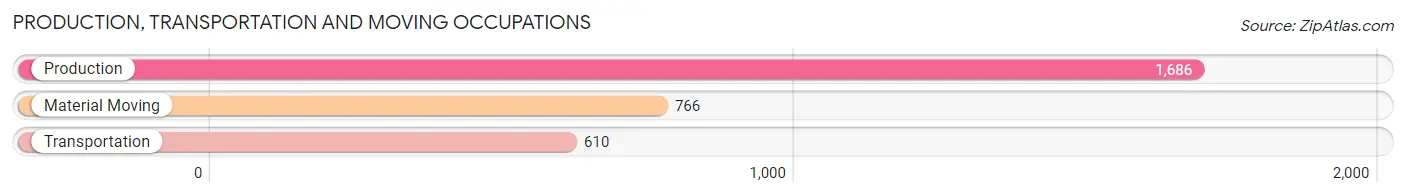
Production, Transportation and Moving Occupations
The most common Production, Transportation and Moving occupations in Niagara Falls are Production (1,686 | 8.2%), Material Moving (766 | 3.7%), and Transportation (610 | 2.9%).
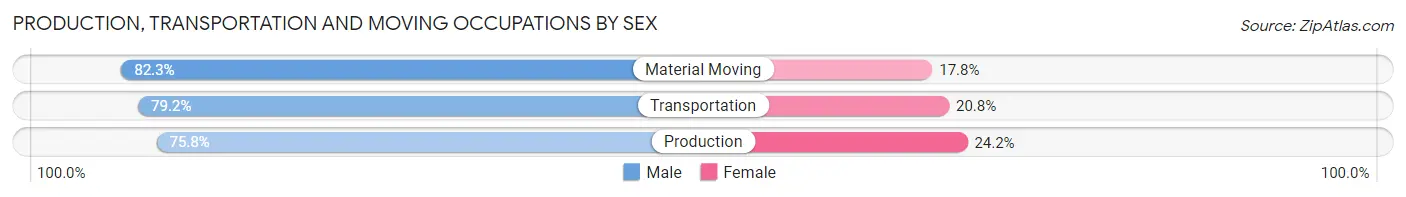
Production, Transportation and Moving Occupations by Sex
| Occupation | Male | Female |
| Production | 1,278 (75.8%) | 408 (24.2%) |
| Transportation | 483 (79.2%) | 127 (20.8%) |
| Material Moving | 630 (82.3%) | 136 (17.7%) |
| Total (Category) | 2,391 (78.1%) | 671 (21.9%) |
| Total (Overall) | 10,164 (49.2%) | 10,490 (50.8%) |
Employment Industries by Sex in Niagara Falls
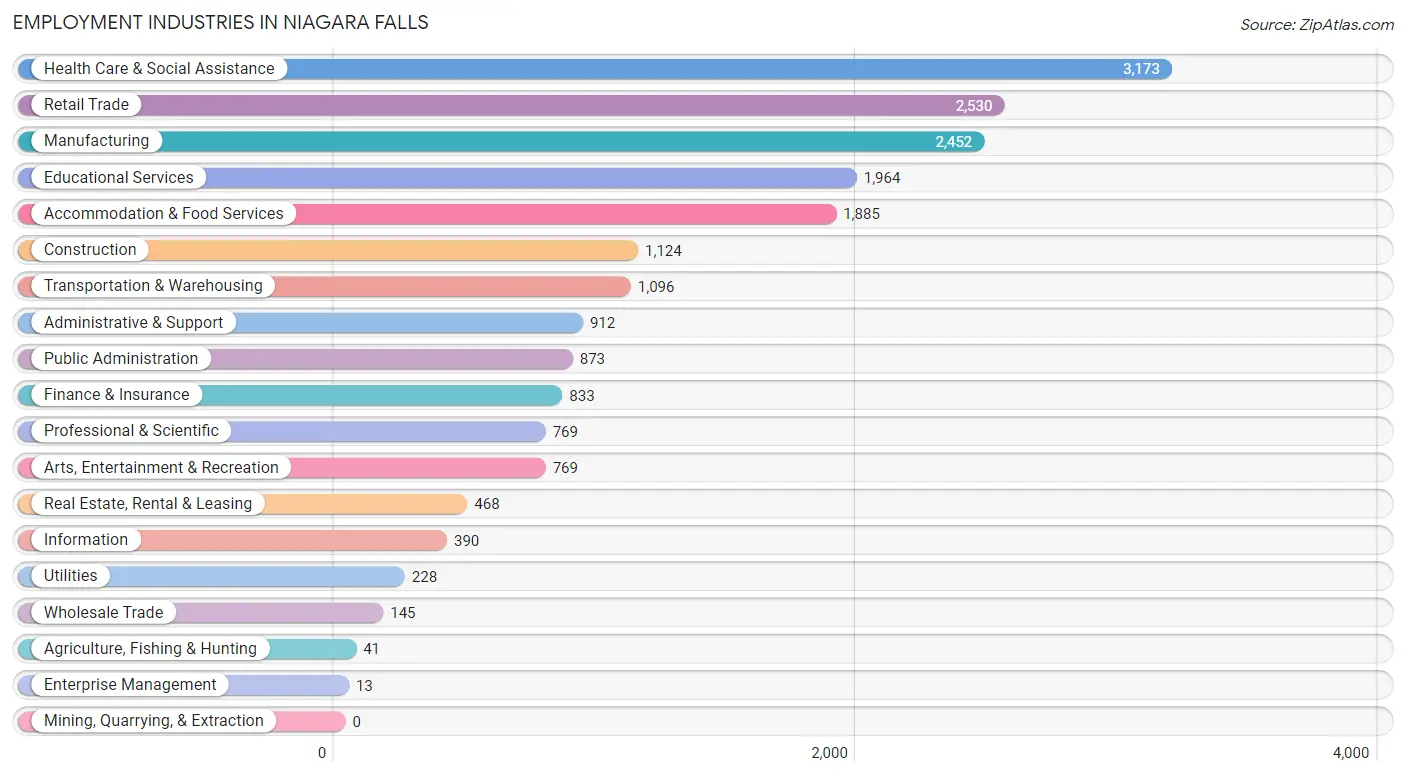
Employment Industries in Niagara Falls
The major employment industries in Niagara Falls include Health Care & Social Assistance (3,173 | 15.4%), Retail Trade (2,530 | 12.2%), Manufacturing (2,452 | 11.9%), Educational Services (1,964 | 9.5%), and Accommodation & Food Services (1,885 | 9.1%).
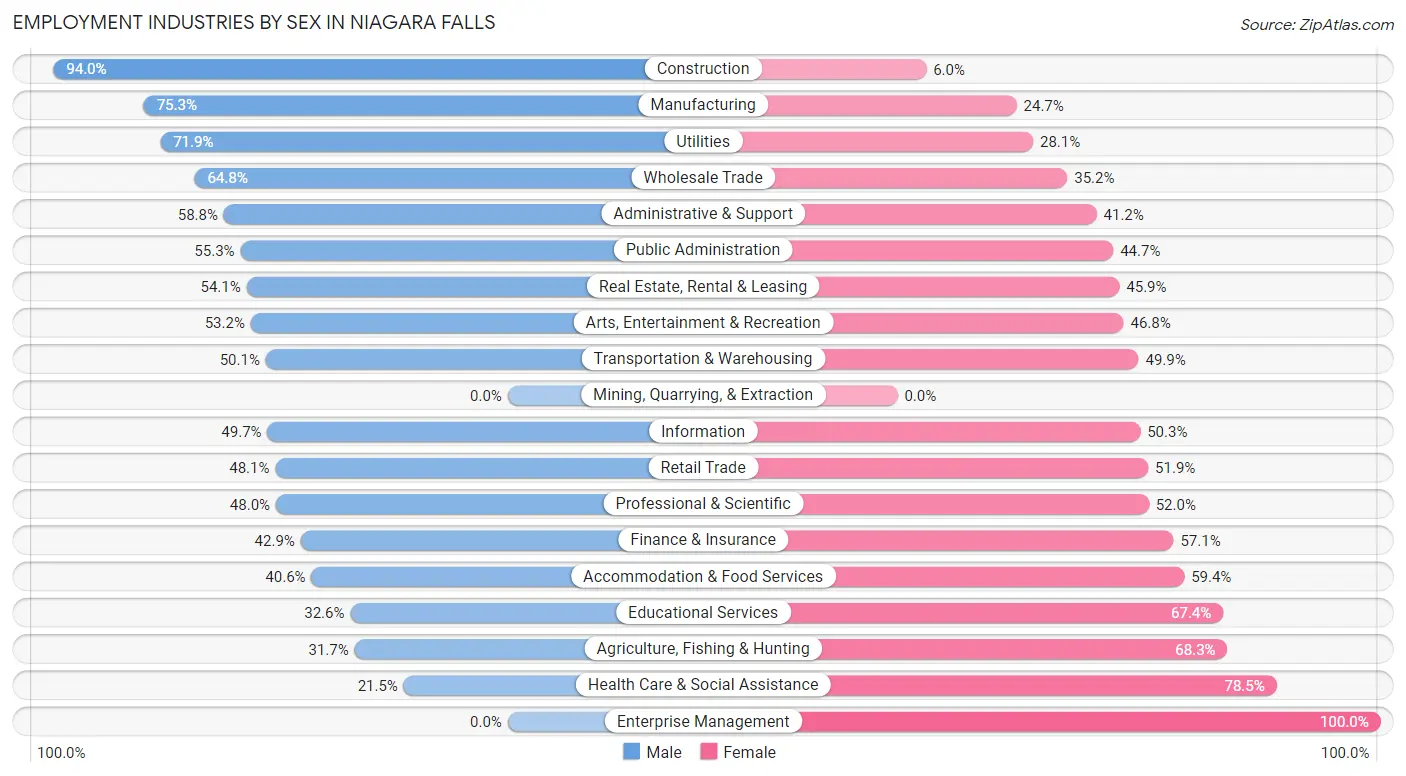
Employment Industries by Sex in Niagara Falls
The Niagara Falls industries that see more men than women are Construction (94.0%), Manufacturing (75.3%), and Utilities (71.9%), whereas the industries that tend to have a higher number of women are Enterprise Management (100.0%), Health Care & Social Assistance (78.5%), and Agriculture, Fishing & Hunting (68.3%).
| Industry | Male | Female |
| Agriculture, Fishing & Hunting | 13 (31.7%) | 28 (68.3%) |
| Mining, Quarrying, & Extraction | 0 (0.0%) | 0 (0.0%) |
| Construction | 1,057 (94.0%) | 67 (6.0%) |
| Manufacturing | 1,847 (75.3%) | 605 (24.7%) |
| Wholesale Trade | 94 (64.8%) | 51 (35.2%) |
| Retail Trade | 1,217 (48.1%) | 1,313 (51.9%) |
| Transportation & Warehousing | 549 (50.1%) | 547 (49.9%) |
| Utilities | 164 (71.9%) | 64 (28.1%) |
| Information | 194 (49.7%) | 196 (50.3%) |
| Finance & Insurance | 357 (42.9%) | 476 (57.1%) |
| Real Estate, Rental & Leasing | 253 (54.1%) | 215 (45.9%) |
| Professional & Scientific | 369 (48.0%) | 400 (52.0%) |
| Enterprise Management | 0 (0.0%) | 13 (100.0%) |
| Administrative & Support | 536 (58.8%) | 376 (41.2%) |
| Educational Services | 640 (32.6%) | 1,324 (67.4%) |
| Health Care & Social Assistance | 683 (21.5%) | 2,490 (78.5%) |
| Arts, Entertainment & Recreation | 409 (53.2%) | 360 (46.8%) |
| Accommodation & Food Services | 766 (40.6%) | 1,119 (59.4%) |
| Public Administration | 483 (55.3%) | 390 (44.7%) |
| Total | 10,164 (49.2%) | 10,490 (50.8%) |
Education in Niagara Falls
School Enrollment in Niagara Falls
The most common levels of schooling among the 10,659 students in Niagara Falls are high school (2,509 | 23.5%), elementary school (2,495 | 23.4%), and middle school (2,006 | 18.8%).
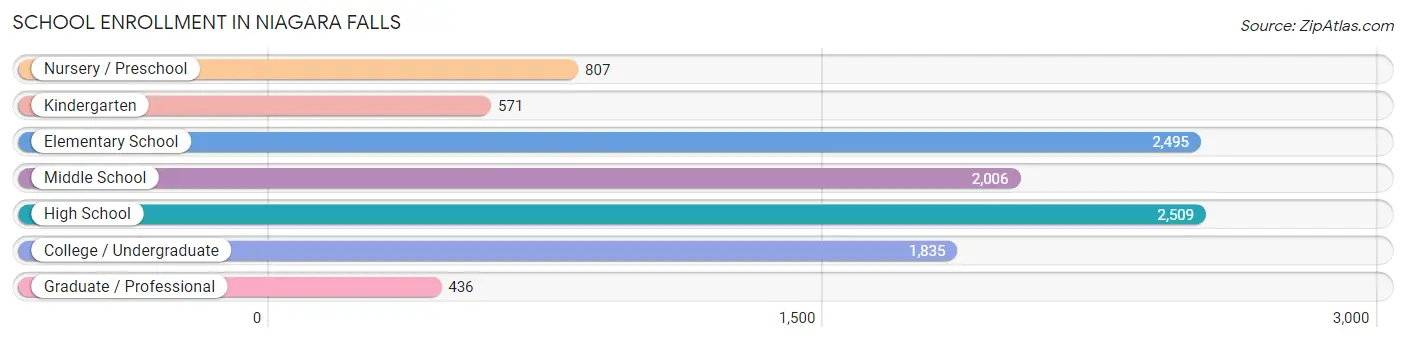
| School Level | # Students | % Students |
| Nursery / Preschool | 807 | 7.6% |
| Kindergarten | 571 | 5.4% |
| Elementary School | 2,495 | 23.4% |
| Middle School | 2,006 | 18.8% |
| High School | 2,509 | 23.5% |
| College / Undergraduate | 1,835 | 17.2% |
| Graduate / Professional | 436 | 4.1% |
| Total | 10,659 | 100.0% |
School Enrollment by Age by Funding Source in Niagara Falls
Out of a total of 10,659 students who are enrolled in schools in Niagara Falls, 1,535 (14.4%) attend a private institution, while the remaining 9,124 (85.6%) are enrolled in public schools. The age group of 3 to 4 year olds has the highest likelihood of being enrolled in private schools, with 224 (38.9% in the age bracket) enrolled. Conversely, the age group of 10 to 14 year olds has the lowest likelihood of being enrolled in a private school, with 2,353 (92.8% in the age bracket) attending a public institution.
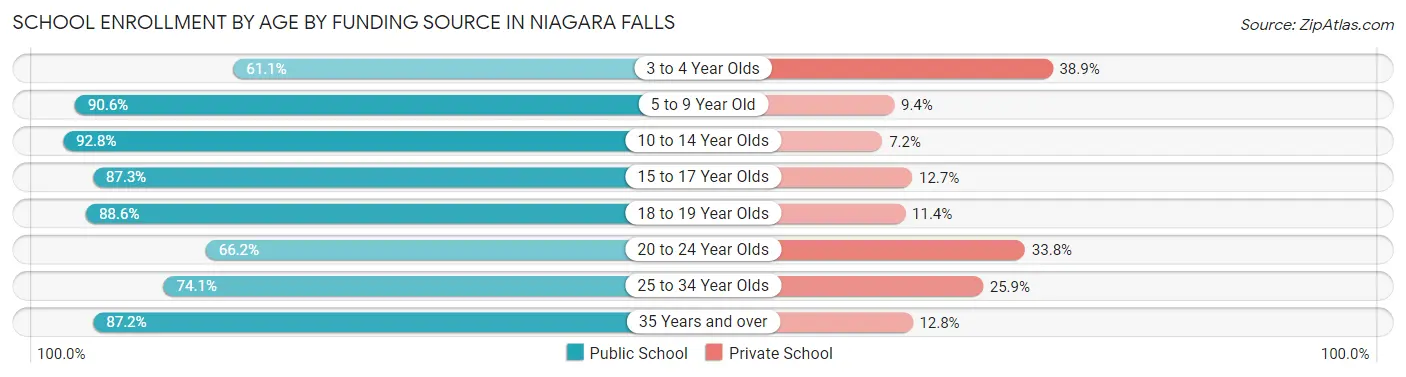
| Age Bracket | Public School | Private School |
| 3 to 4 Year Olds | 352 (61.1%) | 224 (38.9%) |
| 5 to 9 Year Old | 2,743 (90.6%) | 284 (9.4%) |
| 10 to 14 Year Olds | 2,353 (92.8%) | 182 (7.2%) |
| 15 to 17 Year Olds | 1,501 (87.3%) | 219 (12.7%) |
| 18 to 19 Year Olds | 503 (88.6%) | 65 (11.4%) |
| 20 to 24 Year Olds | 628 (66.2%) | 320 (33.8%) |
| 25 to 34 Year Olds | 449 (74.1%) | 157 (25.9%) |
| 35 Years and over | 592 (87.2%) | 87 (12.8%) |
| Total | 9,124 (85.6%) | 1,535 (14.4%) |
Educational Attainment by Field of Study in Niagara Falls
Business (1,618 | 20.0%), education (1,347 | 16.6%), science & technology (961 | 11.9%), social sciences (654 | 8.1%), and arts & humanities (582 | 7.2%) are the most common fields of study among 8,102 individuals in Niagara Falls who have obtained a bachelor's degree or higher.
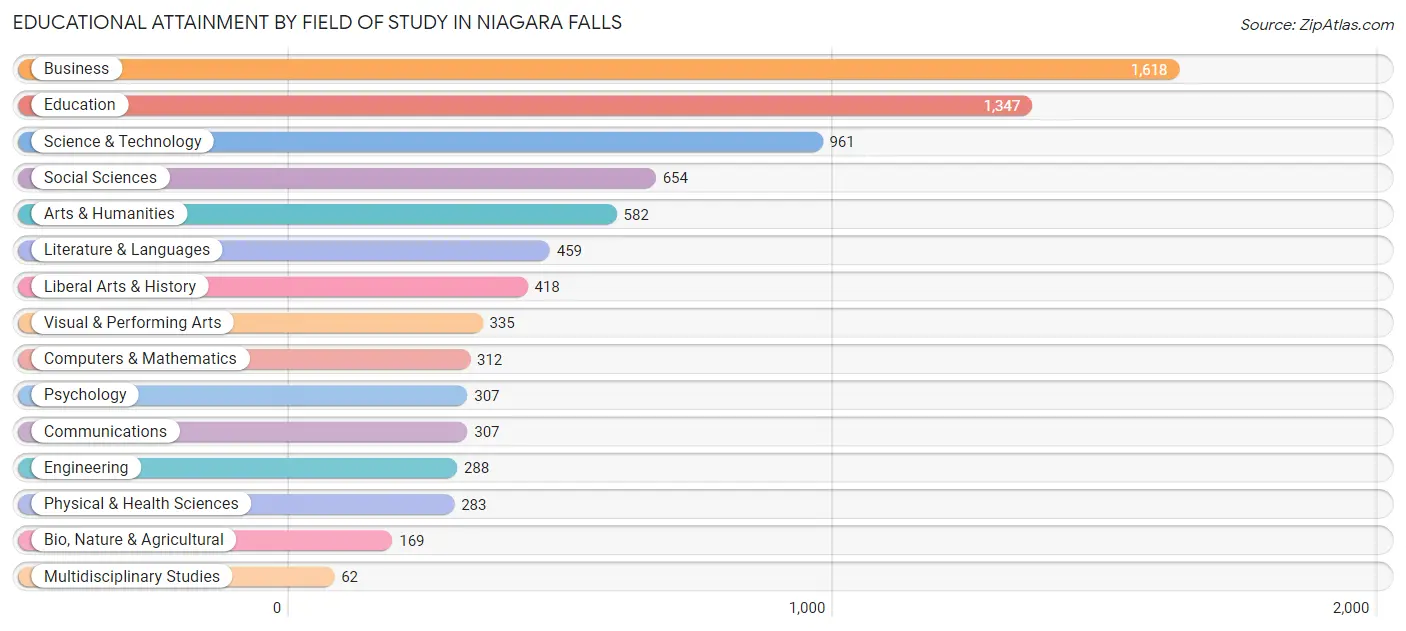
| Field of Study | # Graduates | % Graduates |
| Computers & Mathematics | 312 | 3.8% |
| Bio, Nature & Agricultural | 169 | 2.1% |
| Physical & Health Sciences | 283 | 3.5% |
| Psychology | 307 | 3.8% |
| Social Sciences | 654 | 8.1% |
| Engineering | 288 | 3.5% |
| Multidisciplinary Studies | 62 | 0.8% |
| Science & Technology | 961 | 11.9% |
| Business | 1,618 | 20.0% |
| Education | 1,347 | 16.6% |
| Literature & Languages | 459 | 5.7% |
| Liberal Arts & History | 418 | 5.2% |
| Visual & Performing Arts | 335 | 4.1% |
| Communications | 307 | 3.8% |
| Arts & Humanities | 582 | 7.2% |
| Total | 8,102 | 100.0% |
Transportation & Commute in Niagara Falls
Vehicle Availability by Sex in Niagara Falls
The most prevalent vehicle ownership categories in Niagara Falls are males with 2 vehicles (4,370, accounting for 44.1%) and females with 2 vehicles (3,841, making up 43.0%).
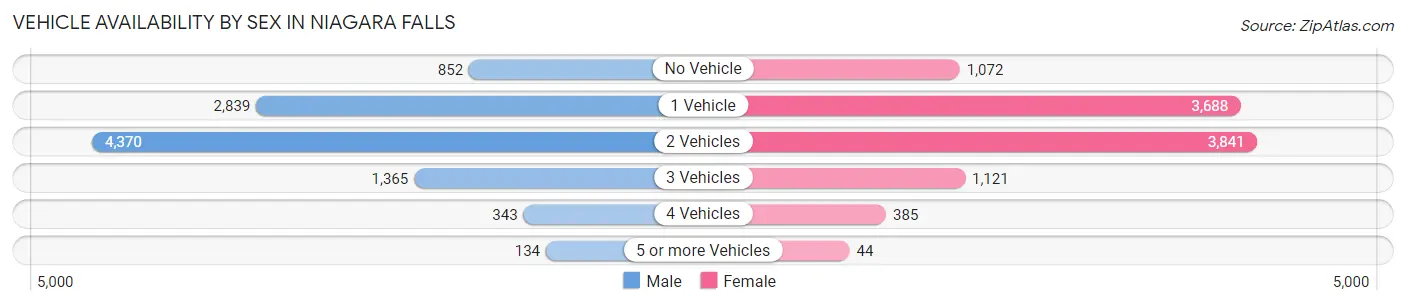
| Vehicles Available | Male | Female |
| No Vehicle | 852 (8.6%) | 1,072 (10.6%) |
| 1 Vehicle | 2,839 (28.7%) | 3,688 (36.3%) |
| 2 Vehicles | 4,370 (44.1%) | 3,841 (37.8%) |
| 3 Vehicles | 1,365 (13.8%) | 1,121 (11.0%) |
| 4 Vehicles | 343 (3.5%) | 385 (3.8%) |
| 5 or more Vehicles | 134 (1.3%) | 44 (0.4%) |
| Total | 9,903 (100.0%) | 10,151 (100.0%) |
Commute Time in Niagara Falls
The most frequently occuring commute durations in Niagara Falls are 10 to 14 minutes (3,850 commuters, 20.5%), 5 to 9 minutes (3,128 commuters, 16.6%), and 15 to 19 minutes (3,021 commuters, 16.1%).
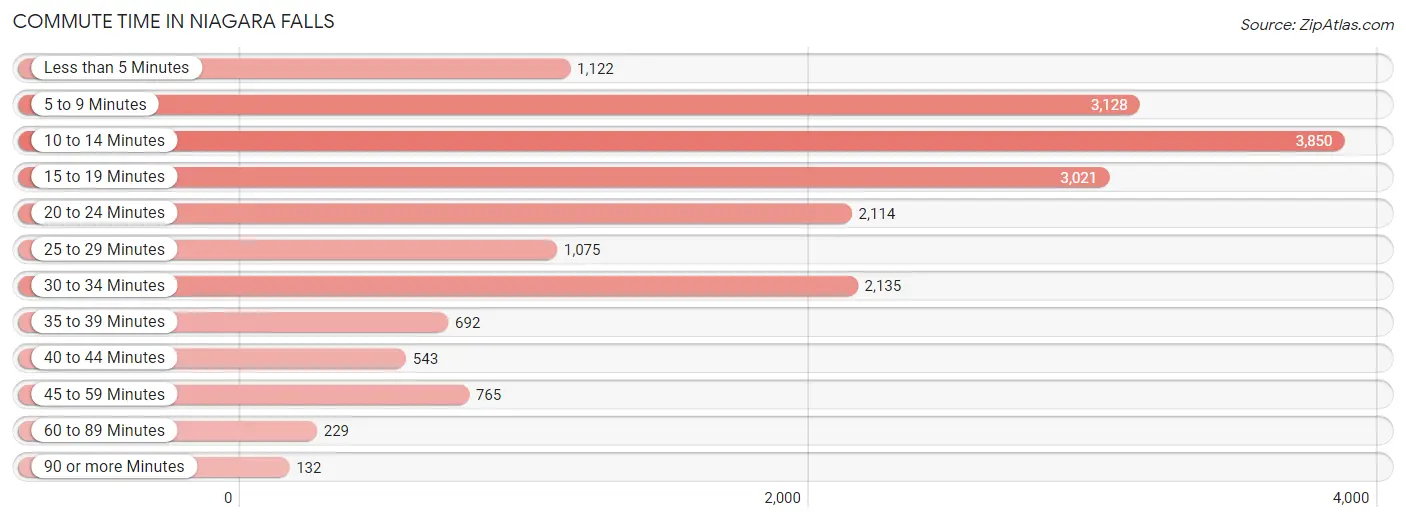
| Commute Time | # Commuters | % Commuters |
| Less than 5 Minutes | 1,122 | 6.0% |
| 5 to 9 Minutes | 3,128 | 16.6% |
| 10 to 14 Minutes | 3,850 | 20.5% |
| 15 to 19 Minutes | 3,021 | 16.1% |
| 20 to 24 Minutes | 2,114 | 11.2% |
| 25 to 29 Minutes | 1,075 | 5.7% |
| 30 to 34 Minutes | 2,135 | 11.4% |
| 35 to 39 Minutes | 692 | 3.7% |
| 40 to 44 Minutes | 543 | 2.9% |
| 45 to 59 Minutes | 765 | 4.1% |
| 60 to 89 Minutes | 229 | 1.2% |
| 90 or more Minutes | 132 | 0.7% |
Commute Time by Sex in Niagara Falls
The most common commute times in Niagara Falls are 5 to 9 minutes (1,788 commuters, 19.0%) for males and 10 to 14 minutes (2,124 commuters, 22.7%) for females.
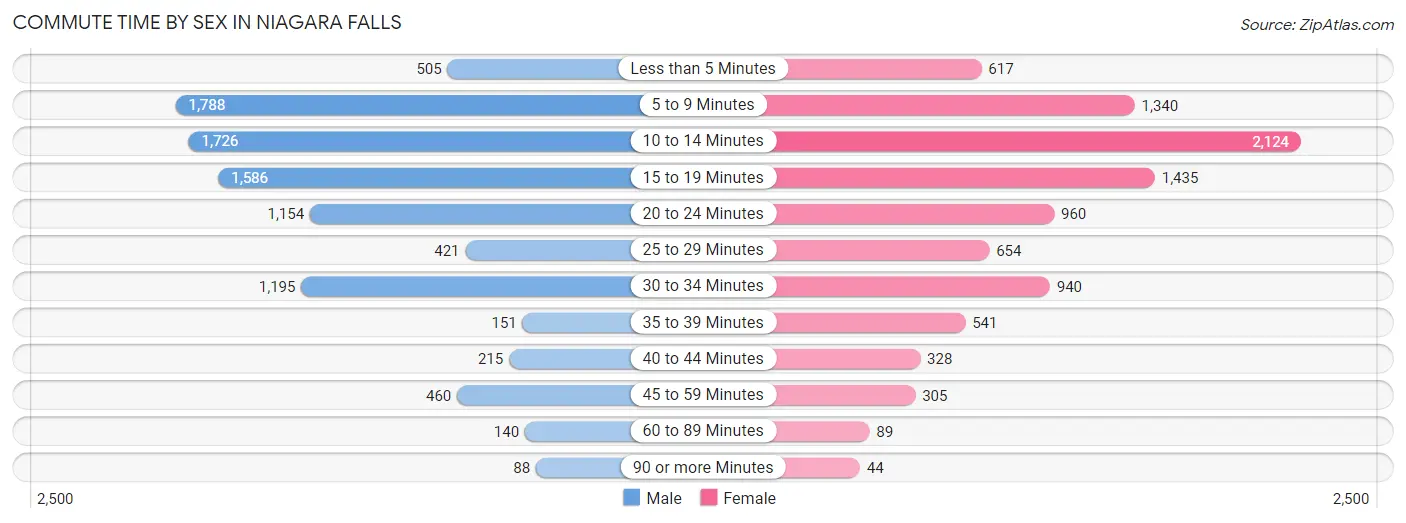
| Commute Time | Male | Female |
| Less than 5 Minutes | 505 (5.4%) | 617 (6.6%) |
| 5 to 9 Minutes | 1,788 (19.0%) | 1,340 (14.3%) |
| 10 to 14 Minutes | 1,726 (18.3%) | 2,124 (22.7%) |
| 15 to 19 Minutes | 1,586 (16.8%) | 1,435 (15.3%) |
| 20 to 24 Minutes | 1,154 (12.2%) | 960 (10.2%) |
| 25 to 29 Minutes | 421 (4.5%) | 654 (7.0%) |
| 30 to 34 Minutes | 1,195 (12.7%) | 940 (10.0%) |
| 35 to 39 Minutes | 151 (1.6%) | 541 (5.8%) |
| 40 to 44 Minutes | 215 (2.3%) | 328 (3.5%) |
| 45 to 59 Minutes | 460 (4.9%) | 305 (3.3%) |
| 60 to 89 Minutes | 140 (1.5%) | 89 (0.9%) |
| 90 or more Minutes | 88 (0.9%) | 44 (0.5%) |
Time of Departure to Work by Sex in Niagara Falls
The most frequent times of departure to work in Niagara Falls are 4:00 PM to 11:59 PM (1,301, 13.8%) for males and 7:30 AM to 7:59 AM (1,530, 16.3%) for females.
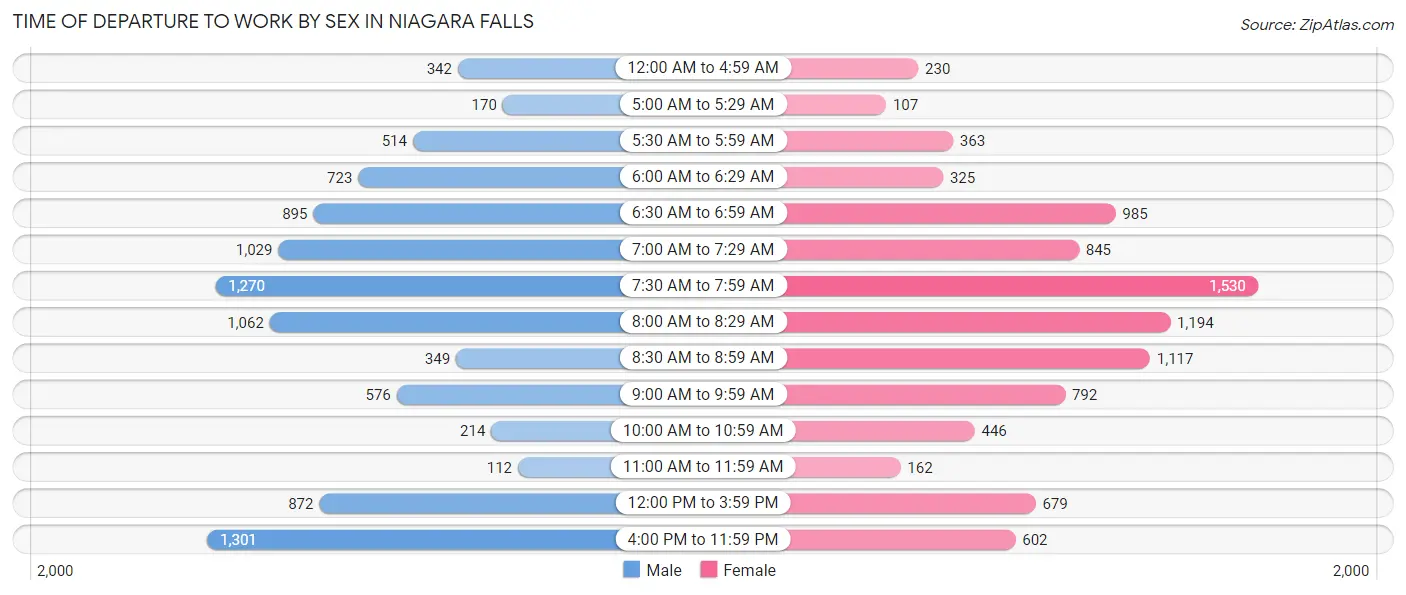
| Time of Departure | Male | Female |
| 12:00 AM to 4:59 AM | 342 (3.6%) | 230 (2.5%) |
| 5:00 AM to 5:29 AM | 170 (1.8%) | 107 (1.1%) |
| 5:30 AM to 5:59 AM | 514 (5.4%) | 363 (3.9%) |
| 6:00 AM to 6:29 AM | 723 (7.7%) | 325 (3.5%) |
| 6:30 AM to 6:59 AM | 895 (9.5%) | 985 (10.5%) |
| 7:00 AM to 7:29 AM | 1,029 (10.9%) | 845 (9.0%) |
| 7:30 AM to 7:59 AM | 1,270 (13.5%) | 1,530 (16.3%) |
| 8:00 AM to 8:29 AM | 1,062 (11.3%) | 1,194 (12.7%) |
| 8:30 AM to 8:59 AM | 349 (3.7%) | 1,117 (11.9%) |
| 9:00 AM to 9:59 AM | 576 (6.1%) | 792 (8.5%) |
| 10:00 AM to 10:59 AM | 214 (2.3%) | 446 (4.8%) |
| 11:00 AM to 11:59 AM | 112 (1.2%) | 162 (1.7%) |
| 12:00 PM to 3:59 PM | 872 (9.2%) | 679 (7.2%) |
| 4:00 PM to 11:59 PM | 1,301 (13.8%) | 602 (6.4%) |
| Total | 9,429 (100.0%) | 9,377 (100.0%) |
Housing Occupancy in Niagara Falls
Occupancy by Ownership in Niagara Falls
Of the total 22,428 dwellings in Niagara Falls, owner-occupied units account for 12,558 (56.0%), while renter-occupied units make up 9,870 (44.0%).
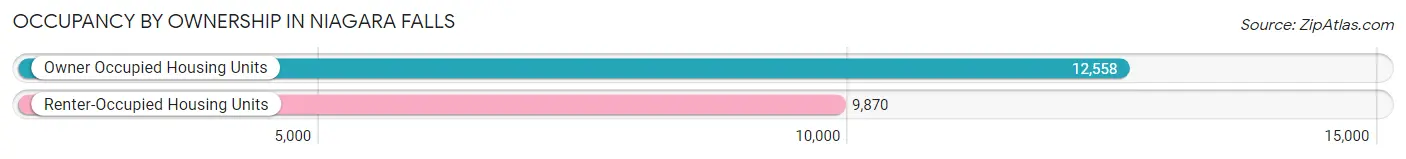
| Occupancy | # Housing Units | % Housing Units |
| Owner Occupied Housing Units | 12,558 | 56.0% |
| Renter-Occupied Housing Units | 9,870 | 44.0% |
| Total Occupied Housing Units | 22,428 | 100.0% |
Occupancy by Household Size in Niagara Falls
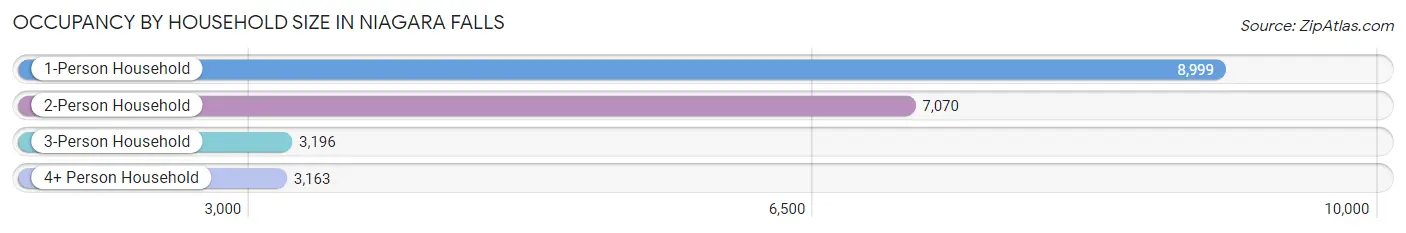
| Household Size | # Housing Units | % Housing Units |
| 1-Person Household | 8,999 | 40.1% |
| 2-Person Household | 7,070 | 31.5% |
| 3-Person Household | 3,196 | 14.2% |
| 4+ Person Household | 3,163 | 14.1% |
| Total Housing Units | 22,428 | 100.0% |
Occupancy by Ownership by Household Size in Niagara Falls
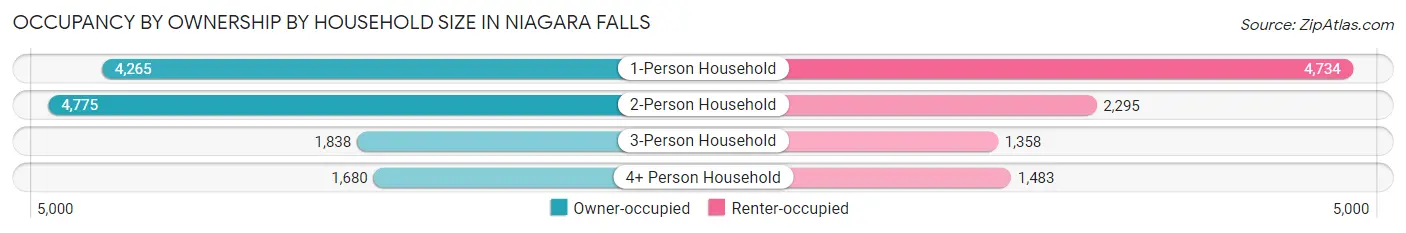
| Household Size | Owner-occupied | Renter-occupied |
| 1-Person Household | 4,265 (47.4%) | 4,734 (52.6%) |
| 2-Person Household | 4,775 (67.5%) | 2,295 (32.5%) |
| 3-Person Household | 1,838 (57.5%) | 1,358 (42.5%) |
| 4+ Person Household | 1,680 (53.1%) | 1,483 (46.9%) |
| Total Housing Units | 12,558 (56.0%) | 9,870 (44.0%) |
Occupancy by Educational Attainment in Niagara Falls
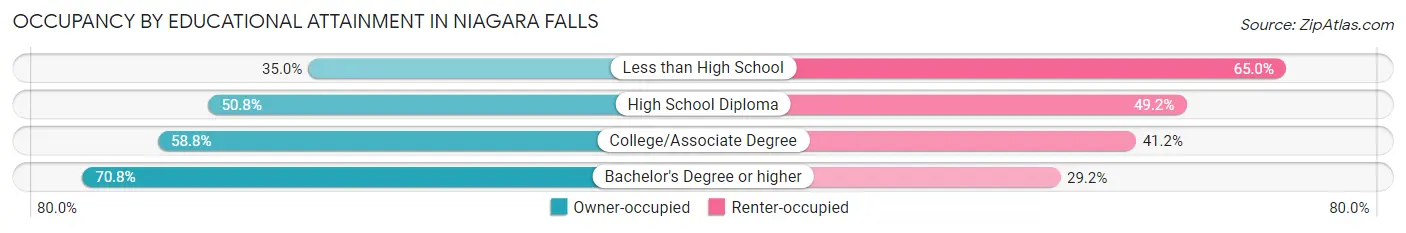
| Household Size | Owner-occupied | Renter-occupied |
| Less than High School | 962 (35.0%) | 1,784 (65.0%) |
| High School Diploma | 3,750 (50.8%) | 3,628 (49.2%) |
| College/Associate Degree | 4,262 (58.8%) | 2,983 (41.2%) |
| Bachelor's Degree or higher | 3,584 (70.8%) | 1,475 (29.2%) |
Occupancy by Age of Householder in Niagara Falls
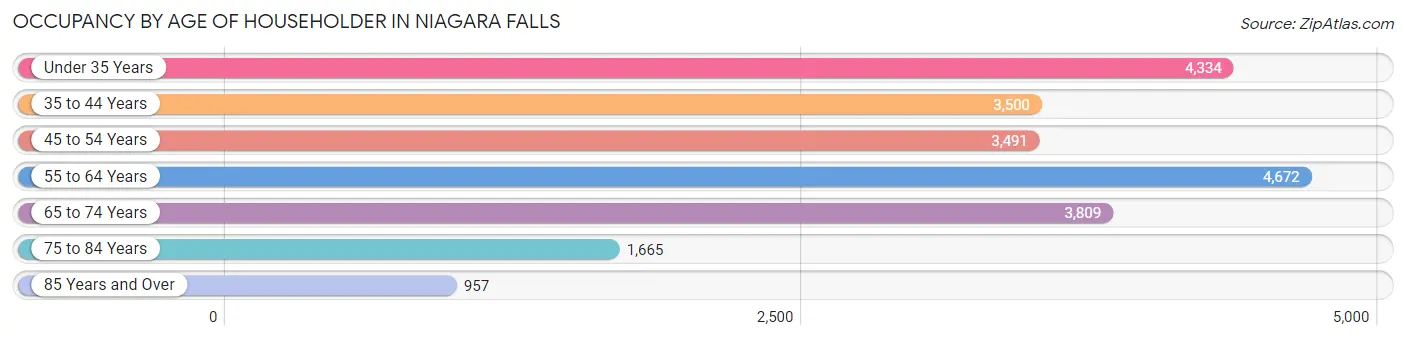
| Age Bracket | # Households | % Households |
| Under 35 Years | 4,334 | 19.3% |
| 35 to 44 Years | 3,500 | 15.6% |
| 45 to 54 Years | 3,491 | 15.6% |
| 55 to 64 Years | 4,672 | 20.8% |
| 65 to 74 Years | 3,809 | 17.0% |
| 75 to 84 Years | 1,665 | 7.4% |
| 85 Years and Over | 957 | 4.3% |
| Total | 22,428 | 100.0% |
Housing Finances in Niagara Falls
Median Income by Occupancy in Niagara Falls
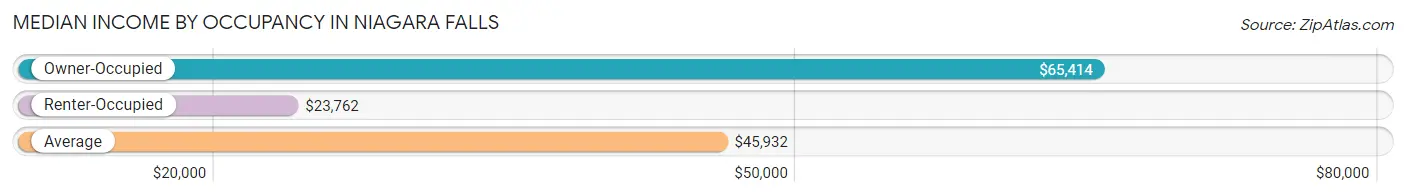
| Occupancy Type | # Households | Median Income |
| Owner-Occupied | 12,558 (56.0%) | $65,414 |
| Renter-Occupied | 9,870 (44.0%) | $23,762 |
| Average | 22,428 (100.0%) | $45,932 |
Occupancy by Householder Income Bracket in Niagara Falls
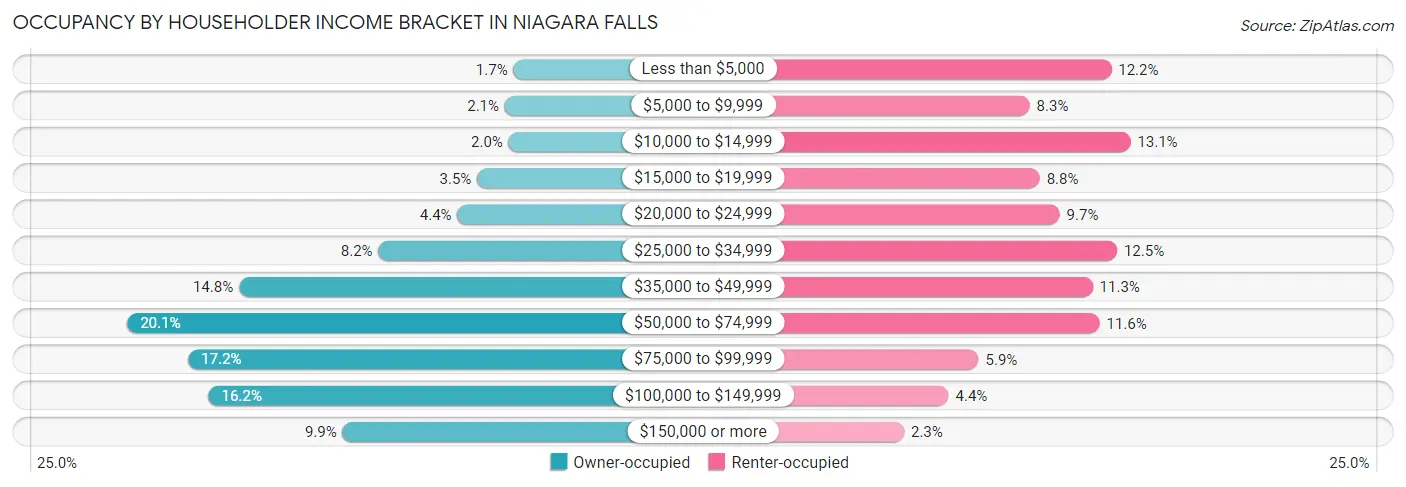
| Income Bracket | Owner-occupied | Renter-occupied |
| Less than $5,000 | 216 (1.7%) | 1,202 (12.2%) |
| $5,000 to $9,999 | 267 (2.1%) | 818 (8.3%) |
| $10,000 to $14,999 | 245 (1.9%) | 1,292 (13.1%) |
| $15,000 to $19,999 | 433 (3.5%) | 866 (8.8%) |
| $20,000 to $24,999 | 551 (4.4%) | 959 (9.7%) |
| $25,000 to $34,999 | 1,024 (8.2%) | 1,229 (12.4%) |
| $35,000 to $49,999 | 1,857 (14.8%) | 1,114 (11.3%) |
| $50,000 to $74,999 | 2,526 (20.1%) | 1,147 (11.6%) |
| $75,000 to $99,999 | 2,161 (17.2%) | 578 (5.9%) |
| $100,000 to $149,999 | 2,040 (16.2%) | 437 (4.4%) |
| $150,000 or more | 1,238 (9.9%) | 228 (2.3%) |
| Total | 12,558 (100.0%) | 9,870 (100.0%) |
Monthly Housing Cost Tiers in Niagara Falls
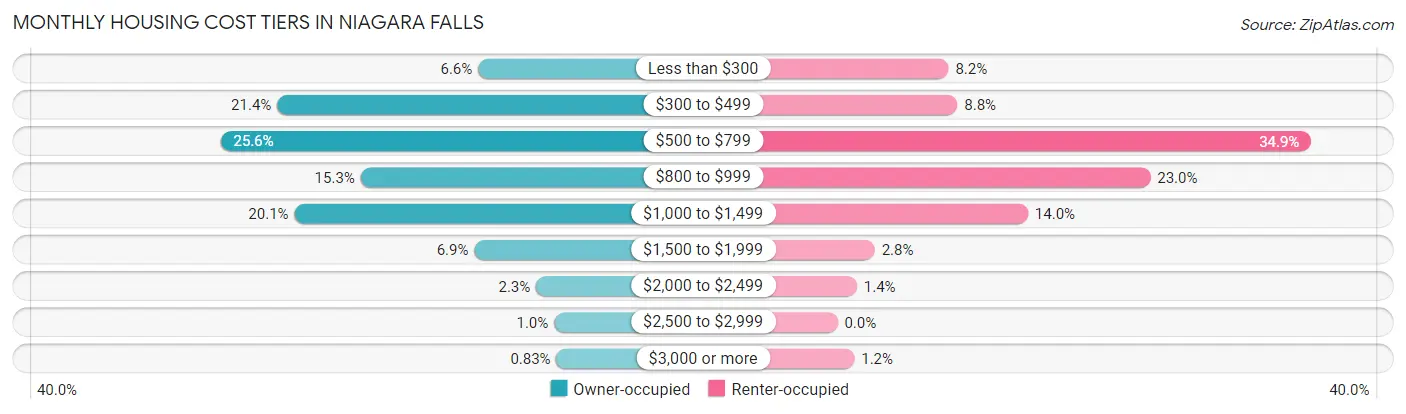
| Monthly Cost | Owner-occupied | Renter-occupied |
| Less than $300 | 829 (6.6%) | 807 (8.2%) |
| $300 to $499 | 2,687 (21.4%) | 872 (8.8%) |
| $500 to $799 | 3,212 (25.6%) | 3,444 (34.9%) |
| $800 to $999 | 1,915 (15.2%) | 2,274 (23.0%) |
| $1,000 to $1,499 | 2,528 (20.1%) | 1,385 (14.0%) |
| $1,500 to $1,999 | 864 (6.9%) | 271 (2.8%) |
| $2,000 to $2,499 | 293 (2.3%) | 141 (1.4%) |
| $2,500 to $2,999 | 126 (1.0%) | 0 (0.0%) |
| $3,000 or more | 104 (0.8%) | 122 (1.2%) |
| Total | 12,558 (100.0%) | 9,870 (100.0%) |
Physical Housing Characteristics in Niagara Falls
Housing Structures in Niagara Falls
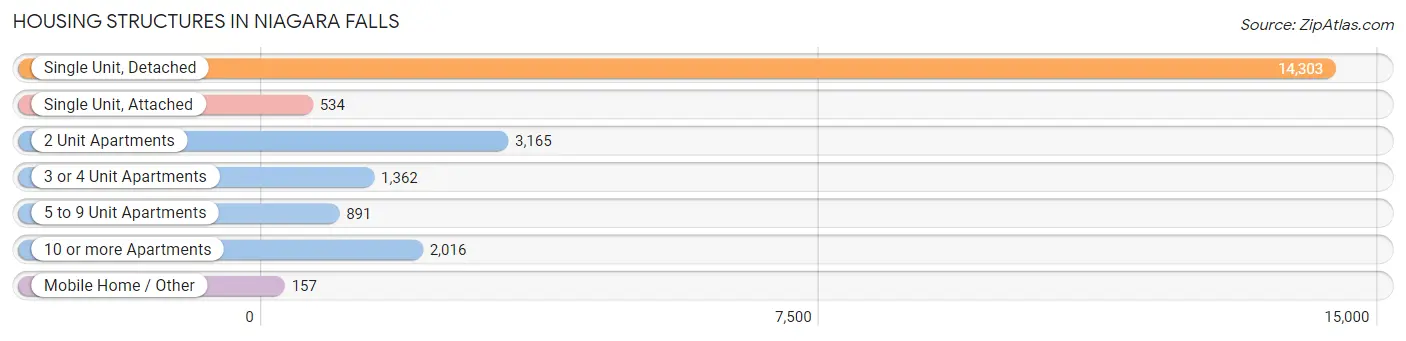
| Structure Type | # Housing Units | % Housing Units |
| Single Unit, Detached | 14,303 | 63.8% |
| Single Unit, Attached | 534 | 2.4% |
| 2 Unit Apartments | 3,165 | 14.1% |
| 3 or 4 Unit Apartments | 1,362 | 6.1% |
| 5 to 9 Unit Apartments | 891 | 4.0% |
| 10 or more Apartments | 2,016 | 9.0% |
| Mobile Home / Other | 157 | 0.7% |
| Total | 22,428 | 100.0% |
Housing Structures by Occupancy in Niagara Falls
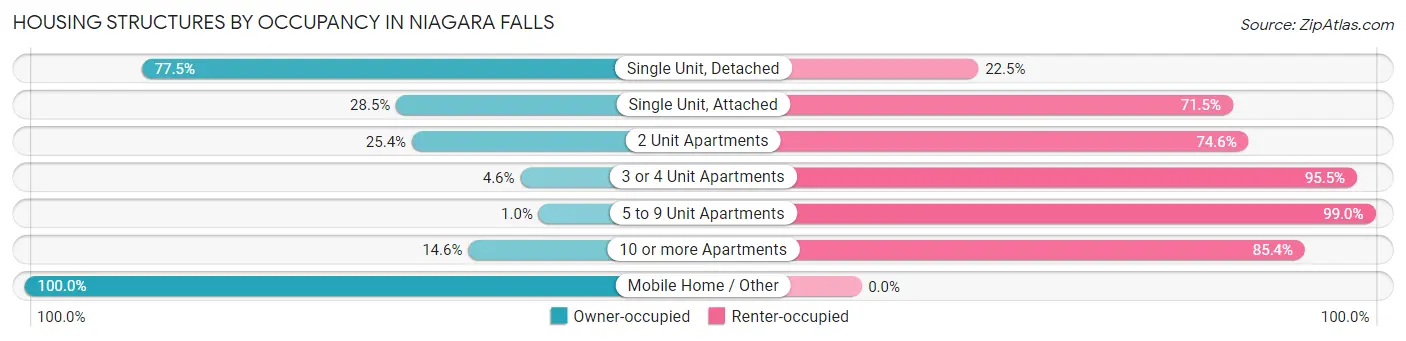
| Structure Type | Owner-occupied | Renter-occupied |
| Single Unit, Detached | 11,079 (77.5%) | 3,224 (22.5%) |
| Single Unit, Attached | 152 (28.5%) | 382 (71.5%) |
| 2 Unit Apartments | 805 (25.4%) | 2,360 (74.6%) |
| 3 or 4 Unit Apartments | 62 (4.5%) | 1,300 (95.5%) |
| 5 to 9 Unit Apartments | 9 (1.0%) | 882 (99.0%) |
| 10 or more Apartments | 294 (14.6%) | 1,722 (85.4%) |
| Mobile Home / Other | 157 (100.0%) | 0 (0.0%) |
| Total | 12,558 (56.0%) | 9,870 (44.0%) |
Housing Structures by Number of Rooms in Niagara Falls
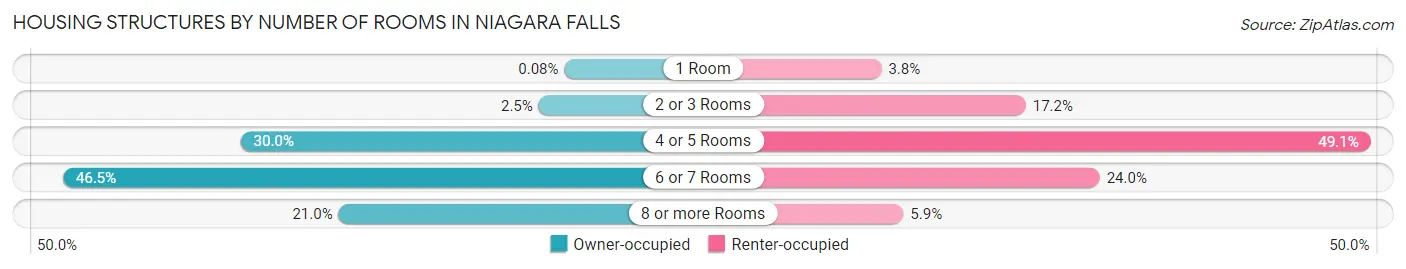
| Number of Rooms | Owner-occupied | Renter-occupied |
| 1 Room | 10 (0.1%) | 379 (3.8%) |
| 2 or 3 Rooms | 309 (2.5%) | 1,697 (17.2%) |
| 4 or 5 Rooms | 3,770 (30.0%) | 4,843 (49.1%) |
| 6 or 7 Rooms | 5,835 (46.5%) | 2,372 (24.0%) |
| 8 or more Rooms | 2,634 (21.0%) | 579 (5.9%) |
| Total | 12,558 (100.0%) | 9,870 (100.0%) |
Housing Structure by Heating Type in Niagara Falls
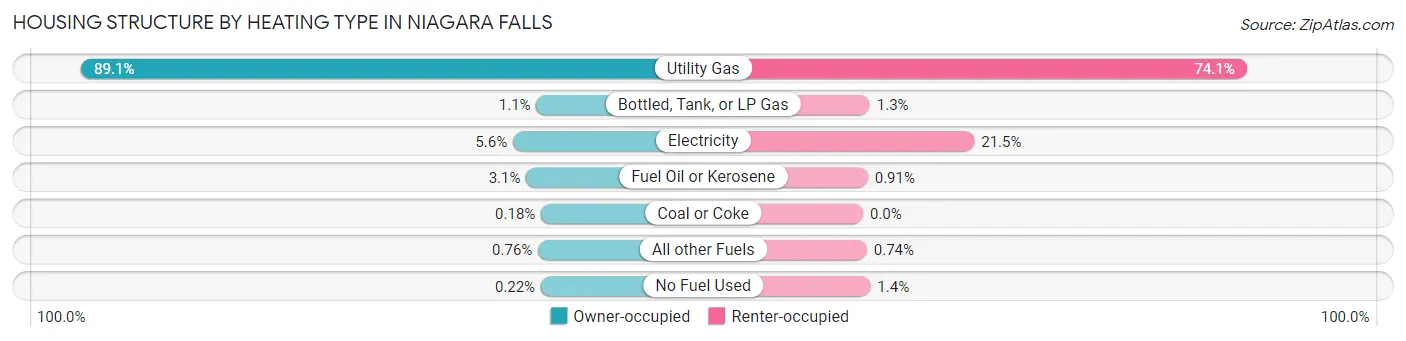
| Heating Type | Owner-occupied | Renter-occupied |
| Utility Gas | 11,184 (89.1%) | 7,316 (74.1%) |
| Bottled, Tank, or LP Gas | 138 (1.1%) | 129 (1.3%) |
| Electricity | 706 (5.6%) | 2,122 (21.5%) |
| Fuel Oil or Kerosene | 384 (3.1%) | 90 (0.9%) |
| Coal or Coke | 23 (0.2%) | 0 (0.0%) |
| All other Fuels | 95 (0.8%) | 73 (0.7%) |
| No Fuel Used | 28 (0.2%) | 140 (1.4%) |
| Total | 12,558 (100.0%) | 9,870 (100.0%) |
Household Vehicle Usage in Niagara Falls
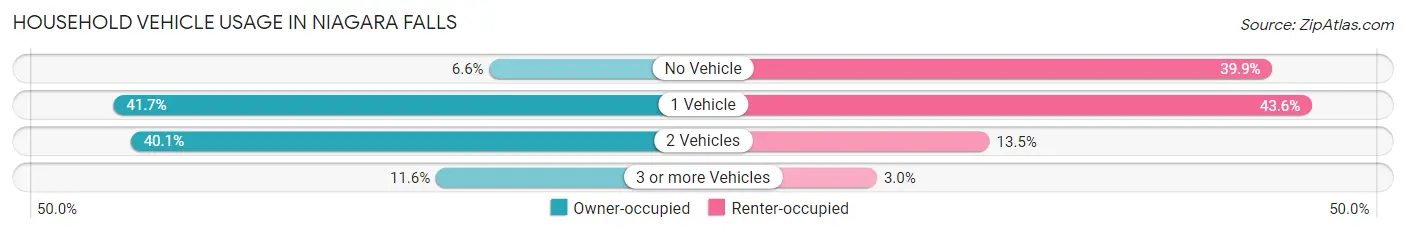
| Vehicles per Household | Owner-occupied | Renter-occupied |
| No Vehicle | 830 (6.6%) | 3,938 (39.9%) |
| 1 Vehicle | 5,238 (41.7%) | 4,304 (43.6%) |
| 2 Vehicles | 5,034 (40.1%) | 1,333 (13.5%) |
| 3 or more Vehicles | 1,456 (11.6%) | 295 (3.0%) |
| Total | 12,558 (100.0%) | 9,870 (100.0%) |
Real Estate & Mortgages in Niagara Falls
Real Estate and Mortgage Overview in Niagara Falls
| Characteristic | Without Mortgage | With Mortgage |
| Housing Units | 6,338 | 6,220 |
| Median Property Value | $85,300 | $111,100 |
| Median Household Income | $54,054 | $801 |
| Monthly Housing Costs | $483 | $45 |
| Real Estate Taxes | $2,242 | $301 |
Property Value by Mortgage Status in Niagara Falls
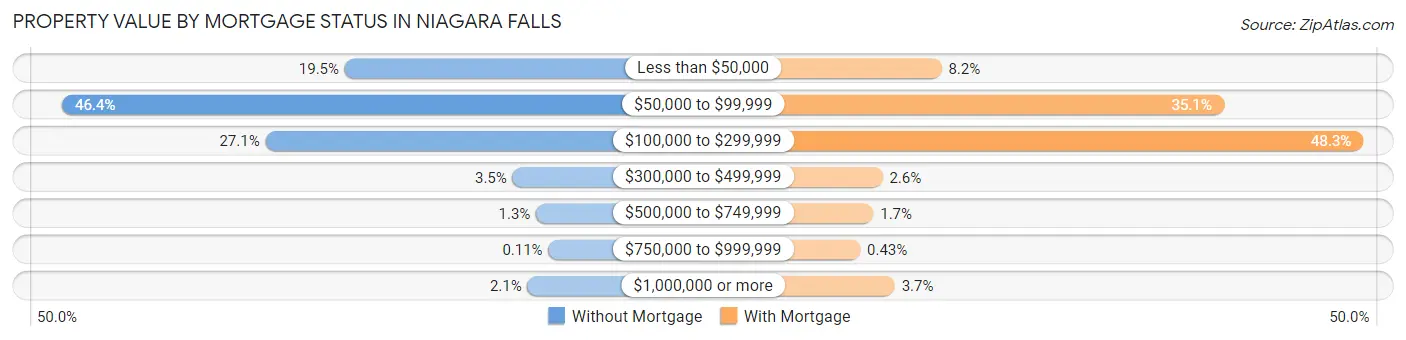
| Property Value | Without Mortgage | With Mortgage |
| Less than $50,000 | 1,236 (19.5%) | 509 (8.2%) |
| $50,000 to $99,999 | 2,943 (46.4%) | 2,181 (35.1%) |
| $100,000 to $299,999 | 1,715 (27.1%) | 3,007 (48.3%) |
| $300,000 to $499,999 | 223 (3.5%) | 159 (2.6%) |
| $500,000 to $749,999 | 81 (1.3%) | 105 (1.7%) |
| $750,000 to $999,999 | 7 (0.1%) | 27 (0.4%) |
| $1,000,000 or more | 133 (2.1%) | 232 (3.7%) |
| Total | 6,338 (100.0%) | 6,220 (100.0%) |
Household Income by Mortgage Status in Niagara Falls
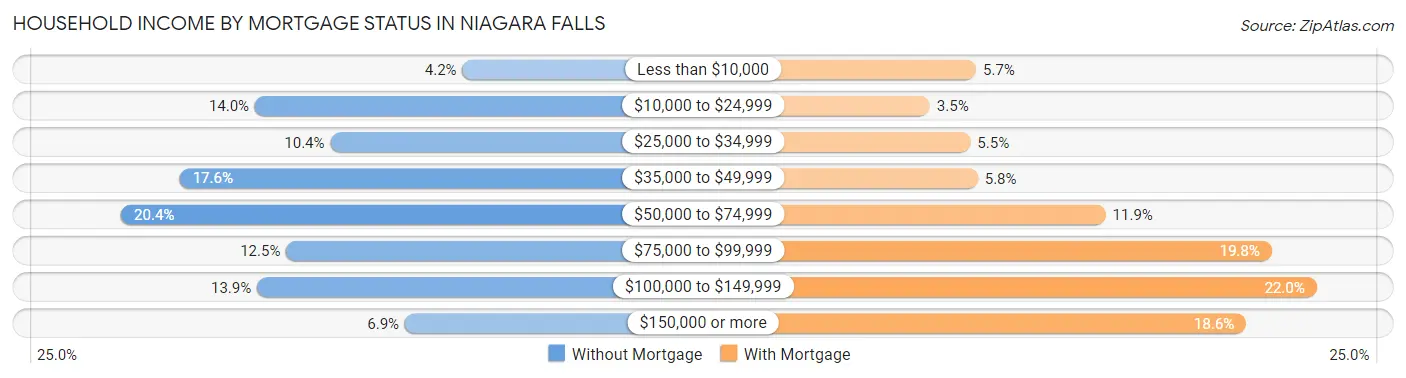
| Household Income | Without Mortgage | With Mortgage |
| Less than $10,000 | 263 (4.2%) | 357 (5.7%) |
| $10,000 to $24,999 | 889 (14.0%) | 220 (3.5%) |
| $25,000 to $34,999 | 662 (10.4%) | 340 (5.5%) |
| $35,000 to $49,999 | 1,116 (17.6%) | 362 (5.8%) |
| $50,000 to $74,999 | 1,293 (20.4%) | 741 (11.9%) |
| $75,000 to $99,999 | 795 (12.5%) | 1,233 (19.8%) |
| $100,000 to $149,999 | 883 (13.9%) | 1,366 (22.0%) |
| $150,000 or more | 437 (6.9%) | 1,157 (18.6%) |
| Total | 6,338 (100.0%) | 6,220 (100.0%) |
Property Value to Household Income Ratio in Niagara Falls
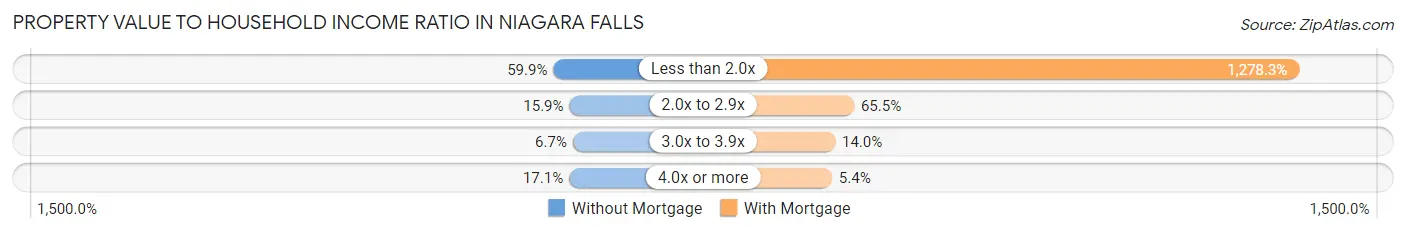
| Value-to-Income Ratio | Without Mortgage | With Mortgage |
| Less than 2.0x | 3,796 (59.9%) | 79,511 (1,278.3%) |
| 2.0x to 2.9x | 1,010 (15.9%) | 4,075 (65.5%) |
| 3.0x to 3.9x | 427 (6.7%) | 869 (14.0%) |
| 4.0x or more | 1,082 (17.1%) | 336 (5.4%) |
| Total | 6,338 (100.0%) | 6,220 (100.0%) |
Real Estate Taxes by Mortgage Status in Niagara Falls
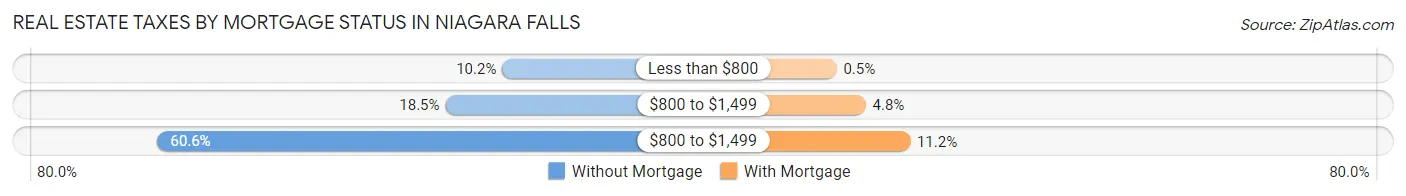
| Property Taxes | Without Mortgage | With Mortgage |
| Less than $800 | 647 (10.2%) | 31 (0.5%) |
| $800 to $1,499 | 1,174 (18.5%) | 296 (4.8%) |
| $800 to $1,499 | 3,840 (60.6%) | 699 (11.2%) |
| Total | 6,338 (100.0%) | 6,220 (100.0%) |
Health & Disability in Niagara Falls
Health Insurance Coverage by Age in Niagara Falls
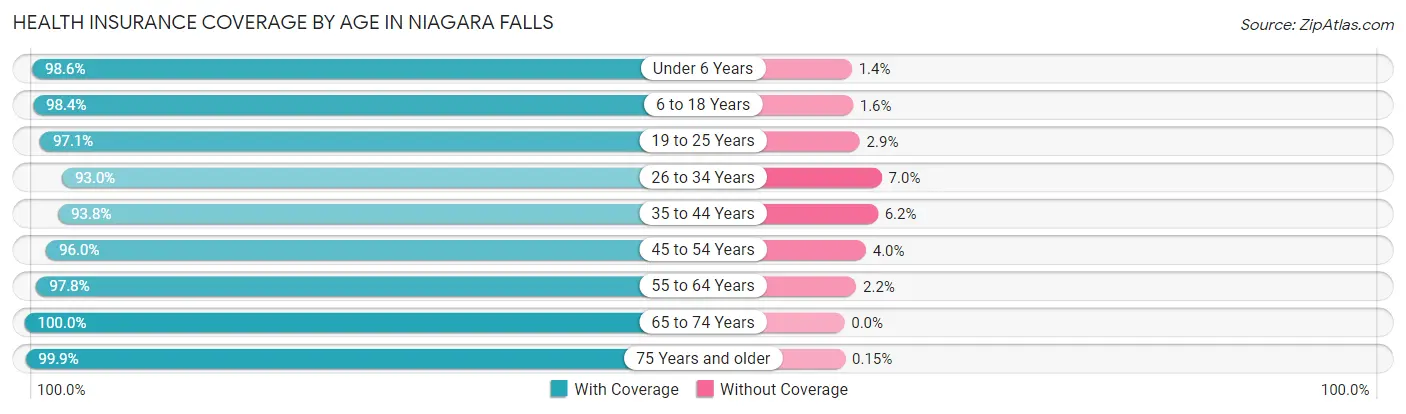
| Age Bracket | With Coverage | Without Coverage |
| Under 6 Years | 3,479 (98.6%) | 49 (1.4%) |
| 6 to 18 Years | 7,163 (98.4%) | 115 (1.6%) |
| 19 to 25 Years | 4,031 (97.1%) | 119 (2.9%) |
| 26 to 34 Years | 5,528 (93.0%) | 414 (7.0%) |
| 35 to 44 Years | 5,792 (93.8%) | 385 (6.2%) |
| 45 to 54 Years | 5,382 (96.0%) | 225 (4.0%) |
| 55 to 64 Years | 6,804 (97.8%) | 153 (2.2%) |
| 65 to 74 Years | 5,332 (100.0%) | 0 (0.0%) |
| 75 Years and older | 3,296 (99.9%) | 5 (0.2%) |
| Total | 46,807 (97.0%) | 1,465 (3.0%) |
Health Insurance Coverage by Citizenship Status in Niagara Falls
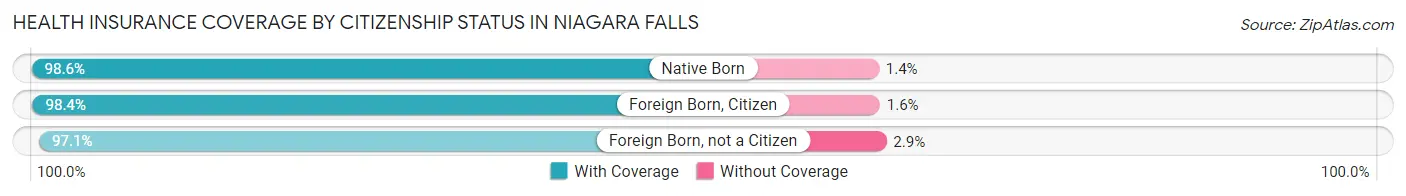
| Citizenship Status | With Coverage | Without Coverage |
| Native Born | 3,479 (98.6%) | 49 (1.4%) |
| Foreign Born, Citizen | 7,163 (98.4%) | 115 (1.6%) |
| Foreign Born, not a Citizen | 4,031 (97.1%) | 119 (2.9%) |
Health Insurance Coverage by Household Income in Niagara Falls
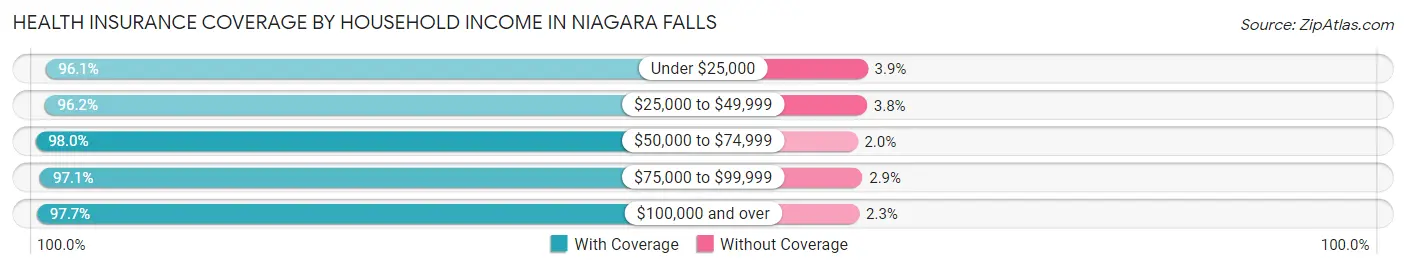
| Household Income | With Coverage | Without Coverage |
| Under $25,000 | 11,906 (96.1%) | 483 (3.9%) |
| $25,000 to $49,999 | 9,551 (96.2%) | 373 (3.8%) |
| $50,000 to $74,999 | 7,777 (98.0%) | 159 (2.0%) |
| $75,000 to $99,999 | 6,464 (97.1%) | 193 (2.9%) |
| $100,000 and over | 10,931 (97.7%) | 257 (2.3%) |
Public vs Private Health Insurance Coverage by Age in Niagara Falls
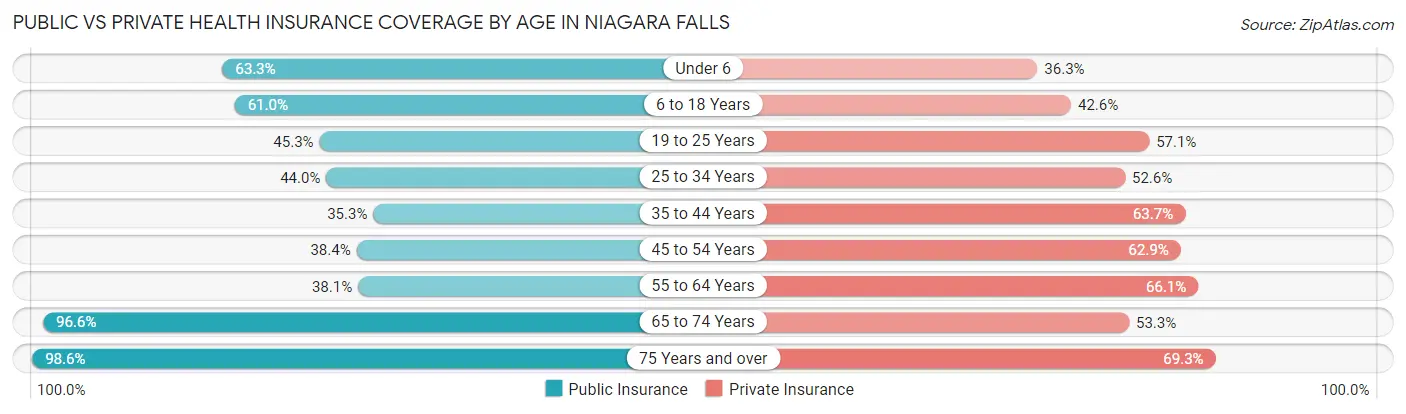
| Age Bracket | Public Insurance | Private Insurance |
| Under 6 | 2,233 (63.3%) | 1,281 (36.3%) |
| 6 to 18 Years | 4,439 (61.0%) | 3,097 (42.5%) |
| 19 to 25 Years | 1,879 (45.3%) | 2,368 (57.1%) |
| 25 to 34 Years | 2,615 (44.0%) | 3,124 (52.6%) |
| 35 to 44 Years | 2,180 (35.3%) | 3,934 (63.7%) |
| 45 to 54 Years | 2,153 (38.4%) | 3,526 (62.9%) |
| 55 to 64 Years | 2,652 (38.1%) | 4,601 (66.1%) |
| 65 to 74 Years | 5,149 (96.6%) | 2,843 (53.3%) |
| 75 Years and over | 3,254 (98.6%) | 2,289 (69.3%) |
| Total | 26,554 (55.0%) | 27,063 (56.1%) |
Disability Status by Sex by Age in Niagara Falls
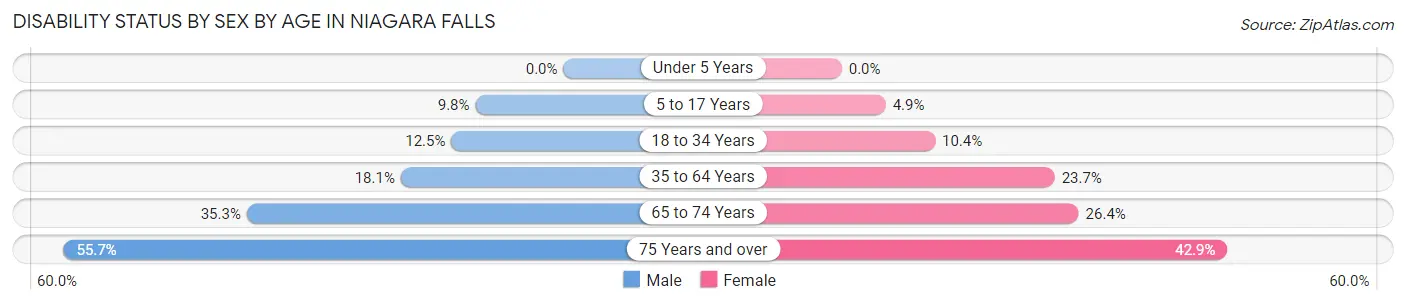
| Age Bracket | Male | Female |
| Under 5 Years | 0 (0.0%) | 0 (0.0%) |
| 5 to 17 Years | 402 (9.8%) | 167 (4.9%) |
| 18 to 34 Years | 636 (12.5%) | 568 (10.4%) |
| 35 to 64 Years | 1,654 (18.1%) | 2,278 (23.7%) |
| 65 to 74 Years | 962 (35.3%) | 687 (26.4%) |
| 75 Years and over | 712 (55.7%) | 868 (42.9%) |
Disability Class by Sex by Age in Niagara Falls
Disability Class: Hearing Difficulty
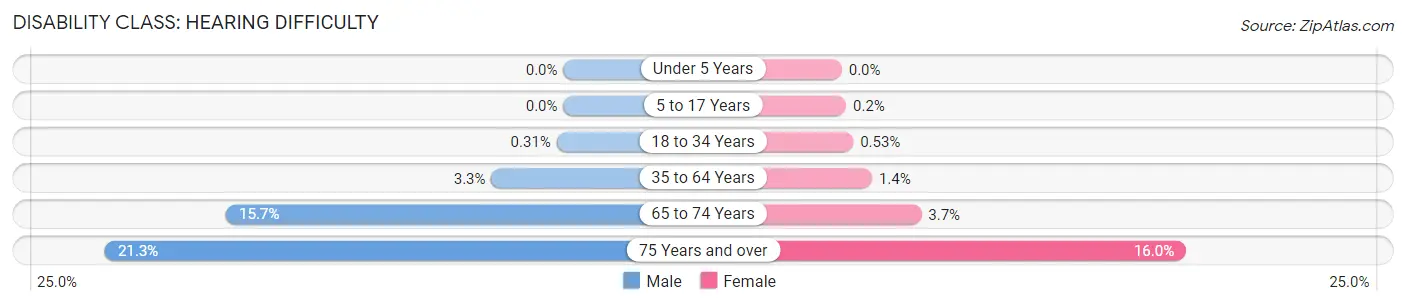
| Age Bracket | Male | Female |
| Under 5 Years | 0 (0.0%) | 0 (0.0%) |
| 5 to 17 Years | 0 (0.0%) | 7 (0.2%) |
| 18 to 34 Years | 16 (0.3%) | 29 (0.5%) |
| 35 to 64 Years | 305 (3.3%) | 135 (1.4%) |
| 65 to 74 Years | 427 (15.7%) | 96 (3.7%) |
| 75 Years and over | 272 (21.3%) | 323 (16.0%) |
Disability Class: Vision Difficulty
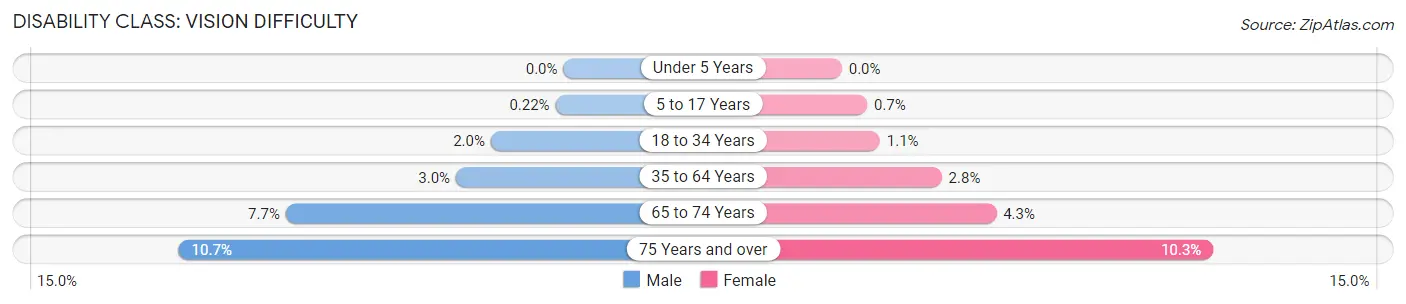
| Age Bracket | Male | Female |
| Under 5 Years | 0 (0.0%) | 0 (0.0%) |
| 5 to 17 Years | 9 (0.2%) | 24 (0.7%) |
| 18 to 34 Years | 103 (2.0%) | 58 (1.1%) |
| 35 to 64 Years | 273 (3.0%) | 267 (2.8%) |
| 65 to 74 Years | 211 (7.7%) | 112 (4.3%) |
| 75 Years and over | 137 (10.7%) | 209 (10.3%) |
Disability Class: Cognitive Difficulty
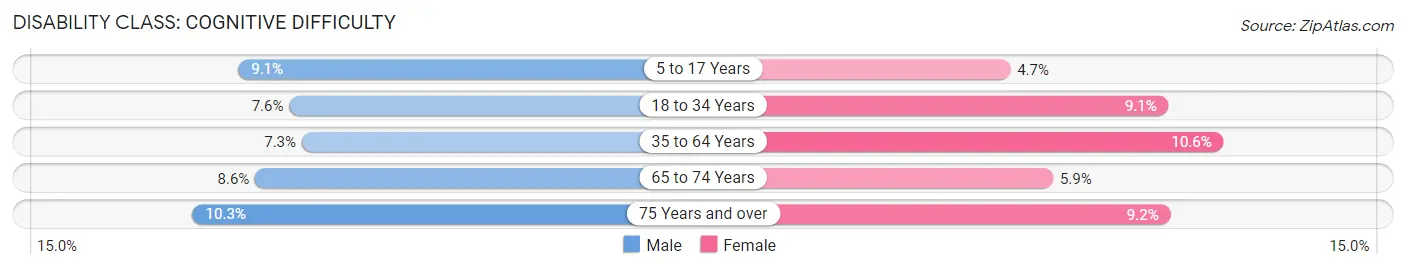
| Age Bracket | Male | Female |
| 5 to 17 Years | 371 (9.0%) | 160 (4.7%) |
| 18 to 34 Years | 389 (7.6%) | 498 (9.1%) |
| 35 to 64 Years | 665 (7.3%) | 1,021 (10.6%) |
| 65 to 74 Years | 234 (8.6%) | 153 (5.9%) |
| 75 Years and over | 132 (10.3%) | 185 (9.1%) |
Disability Class: Ambulatory Difficulty
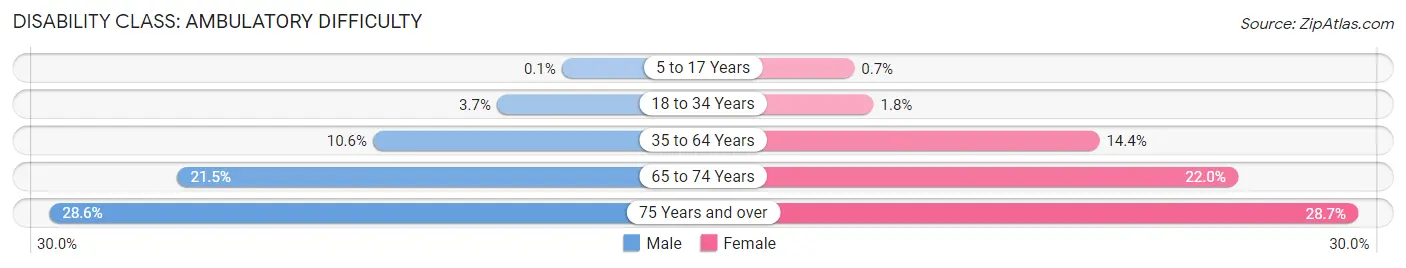
| Age Bracket | Male | Female |
| 5 to 17 Years | 4 (0.1%) | 24 (0.7%) |
| 18 to 34 Years | 189 (3.7%) | 97 (1.8%) |
| 35 to 64 Years | 969 (10.6%) | 1,379 (14.3%) |
| 65 to 74 Years | 586 (21.5%) | 574 (22.0%) |
| 75 Years and over | 366 (28.6%) | 581 (28.7%) |
Disability Class: Self-Care Difficulty
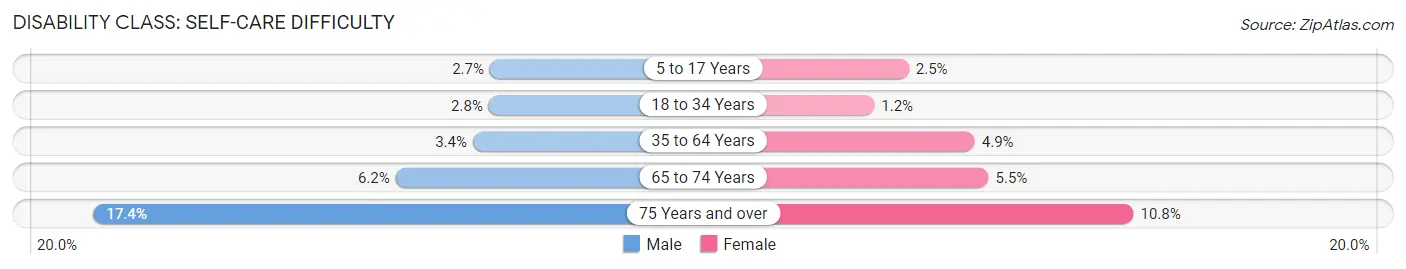
| Age Bracket | Male | Female |
| 5 to 17 Years | 112 (2.7%) | 85 (2.5%) |
| 18 to 34 Years | 141 (2.8%) | 66 (1.2%) |
| 35 to 64 Years | 307 (3.4%) | 475 (4.9%) |
| 65 to 74 Years | 170 (6.2%) | 142 (5.4%) |
| 75 Years and over | 223 (17.4%) | 219 (10.8%) |
Technology Access in Niagara Falls
Computing Device Access in Niagara Falls
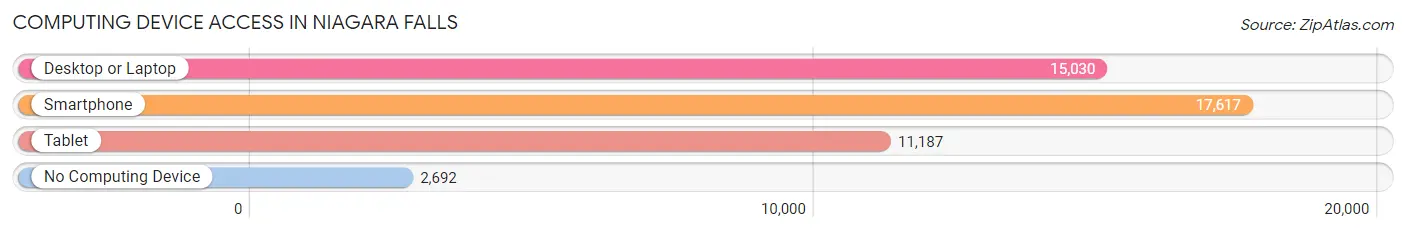
| Device Type | # Households | % Households |
| Desktop or Laptop | 15,030 | 67.0% |
| Smartphone | 17,617 | 78.5% |
| Tablet | 11,187 | 49.9% |
| No Computing Device | 2,692 | 12.0% |
| Total | 22,428 | 100.0% |
Internet Access in Niagara Falls
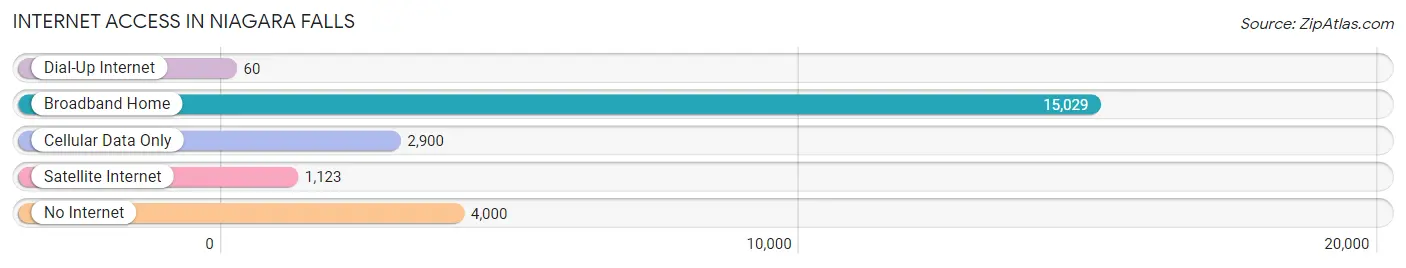
| Internet Type | # Households | % Households |
| Dial-Up Internet | 60 | 0.3% |
| Broadband Home | 15,029 | 67.0% |
| Cellular Data Only | 2,900 | 12.9% |
| Satellite Internet | 1,123 | 5.0% |
| No Internet | 4,000 | 17.8% |
| Total | 22,428 | 100.0% |
Niagara Falls Summary
Niagara Falls is a city located in Niagara County, New York, United States. It is situated on the Niagara River, which forms the border between the United States and Canada. The city is located within the Buffalo–Niagara Falls Metropolitan Statistical Area and the Western New York region. As of the 2010 census, the city had a total population of 50,193, making it the tenth largest city in New York. It is the largest city in Niagara County and the Niagara Frontier.
History
The area around Niagara Falls was first settled by the Neutral Nation of Native Americans in the mid-17th century. The first European to visit the area was Father Louis Hennepin, a French explorer, in 1678. The area was later settled by the British in 1764, and the city of Niagara Falls was incorporated in 1892.
The city was an important industrial center in the 19th and early 20th centuries, with the Niagara Falls Power Company providing power to the region. The city was also a major tourist destination, with the Niagara Falls State Park being established in 1885.
Geography
Niagara Falls is located in western New York, at the western end of the Niagara River. The city is situated on the Niagara Escarpment, a ridge of land that runs along the Niagara River. The city is bordered by the towns of Niagara, Lewiston, and Wheatfield.
The city has a total area of 14.2 square miles, of which 13.9 square miles is land and 0.3 square miles is water. The city is located within the Niagara Frontier, a region of western New York that includes Buffalo, Niagara Falls, and the surrounding area.
Economy
Niagara Falls has a diverse economy, with a mix of manufacturing, tourism, and service industries. The city is home to several large manufacturing companies, including General Motors, Delphi Automotive, and Niagara Machine & Tool Works.
The city is also a major tourist destination, with the Niagara Falls State Park being the most popular attraction. The park is home to the American Falls, Bridal Veil Falls, and Horseshoe Falls, and is visited by millions of tourists each year.
The city is also home to several casinos, including the Seneca Niagara Casino & Hotel, the Seneca Allegany Casino & Hotel, and the Seneca Buffalo Creek Casino.
Demographics
As of the 2010 census, the city had a population of 50,193. The racial makeup of the city was 79.2% White, 11.3% African American, 0.5% Native American, 1.7% Asian, 0.1% Pacific Islander, 4.2% from other races, and 3.0% from two or more races. Hispanic or Latino of any race were 11.3% of the population.
The median income for a household in the city was $35,945, and the median income for a family was $41,945. The per capita income for the city was $19,945. About 17.2% of families and 20.3% of the population were below the poverty line, including 28.3% of those under age 18 and 11.2% of those age 65 or over.
Conclusion
Niagara Falls is a city located in Niagara County, New York, United States. It is situated on the Niagara River, which forms the border between the United States and Canada. The city is home to several large manufacturing companies, as well as the popular Niagara Falls State Park. As of the 2010 census, the city had a population of 50,193, with a diverse racial makeup and a median household income of $35,945. The city is an important industrial center and a major tourist destination, with millions of visitors each year.
Common Questions
What is Per Capita Income in Niagara Falls?
Per Capita income in Niagara Falls is $29,391.
What is the Median Family Income in Niagara Falls?
Median Family Income in Niagara Falls is $61,708.
What is the Median Household income in Niagara Falls?
Median Household Income in Niagara Falls is $45,932.
What is Income or Wage Gap in Niagara Falls?
Income or Wage Gap in Niagara Falls is 17.8%.
Women in Niagara Falls earn 82.2 cents for every dollar earned by a man.
What is Family Income Deficit in Niagara Falls?
Family Income Deficit in Niagara Falls is $12,249.
Families that are below poverty line in Niagara Falls earn $12,249 less on average than the poverty threshold level.
What is Inequality or Gini Index in Niagara Falls?
Inequality or Gini Index in Niagara Falls is 0.49.
What is the Total Population of Niagara Falls?
Total Population of Niagara Falls is 48,502.
What is the Total Male Population of Niagara Falls?
Total Male Population of Niagara Falls is 23,693.
What is the Total Female Population of Niagara Falls?
Total Female Population of Niagara Falls is 24,809.
What is the Ratio of Males per 100 Females in Niagara Falls?
There are 95.50 Males per 100 Females in Niagara Falls.
What is the Ratio of Females per 100 Males in Niagara Falls?
There are 104.71 Females per 100 Males in Niagara Falls.
What is the Median Population Age in Niagara Falls?
Median Population Age in Niagara Falls is 40.3 Years.
What is the Average Family Size in Niagara Falls
Average Family Size in Niagara Falls is 2.9 People.
What is the Average Household Size in Niagara Falls
Average Household Size in Niagara Falls is 2.1 People.
How Large is the Labor Force in Niagara Falls?
There are 22,713 People in the Labor Forcein in Niagara Falls.
What is the Percentage of People in the Labor Force in Niagara Falls?
57.6% of People are in the Labor Force in Niagara Falls.
What is the Unemployment Rate in Niagara Falls?
Unemployment Rate in Niagara Falls is 9.1%.