Kingston, NY Map & Demographics
Kingston Map
Kingston Overview
$36,292
PER CAPITA INCOME
$79,310
AVG FAMILY INCOME
$62,071
AVG HOUSEHOLD INCOME
0.1%
WAGE / INCOME GAP [ % ]
99.9¢/ $1
WAGE / INCOME GAP [ $ ]
0.49
INEQUALITY / GINI INDEX
24,018
TOTAL POPULATION
11,779
MALE POPULATION
12,239
FEMALE POPULATION
96.24
MALES / 100 FEMALES
103.91
FEMALES / 100 MALES
36.0
MEDIAN AGE
3.1
AVG FAMILY SIZE
2.4
AVG HOUSEHOLD SIZE
12,986
LABOR FORCE [ PEOPLE ]
67.3%
PERCENT IN LABOR FORCE
6.0%
UNEMPLOYMENT RATE
Kingston Zip Codes
Income in Kingston
Income Overview in Kingston
Per Capita Income in Kingston is $36,292, while median incomes of families and households are $79,310 and $62,071 respectively.
| Characteristic | Number | Measure |
| Per Capita Income | 24,018 | $36,292 |
| Median Family Income | 5,196 | $79,310 |
| Mean Family Income | 5,196 | $102,385 |
| Median Household Income | 9,821 | $62,071 |
| Mean Household Income | 9,821 | $86,608 |
| Income Deficit | 5,196 | $0 |
| Wage / Income Gap (%) | 24,018 | 0.07% |
| Wage / Income Gap ($) | 24,018 | 99.93¢ per $1 |
| Gini / Inequality Index | 24,018 | 0.49 |
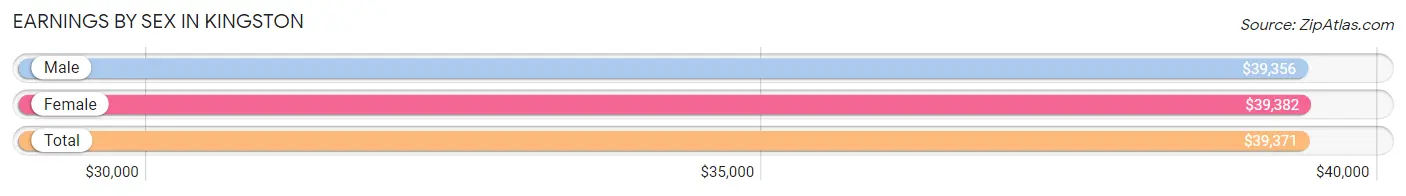
Earnings by Sex in Kingston
Average Earnings in Kingston are $39,371, $39,356 for men and $39,382 for women, a difference of 0.1%.
| Sex | Number | Average Earnings |
| Male | 6,834 (51.0%) | $39,356 |
| Female | 6,572 (49.0%) | $39,382 |
| Total | 13,406 (100.0%) | $39,371 |
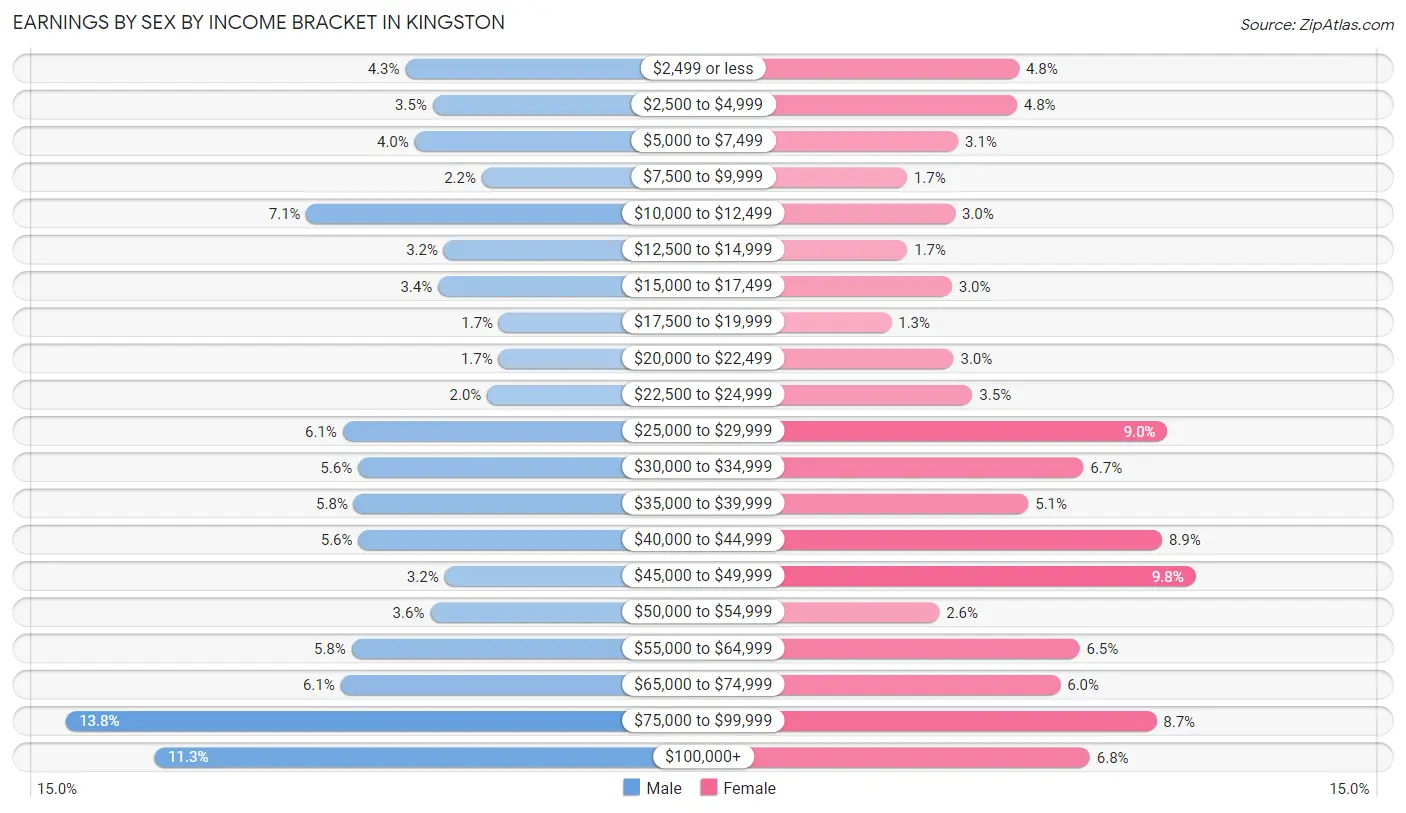
Earnings by Sex by Income Bracket in Kingston
The most common earnings brackets in Kingston are $75,000 to $99,999 for men (945 | 13.8%) and $45,000 to $49,999 for women (644 | 9.8%).
| Income | Male | Female |
| $2,499 or less | 294 (4.3%) | 318 (4.8%) |
| $2,500 to $4,999 | 241 (3.5%) | 314 (4.8%) |
| $5,000 to $7,499 | 276 (4.0%) | 206 (3.1%) |
| $7,500 to $9,999 | 147 (2.1%) | 111 (1.7%) |
| $10,000 to $12,499 | 484 (7.1%) | 200 (3.0%) |
| $12,500 to $14,999 | 220 (3.2%) | 112 (1.7%) |
| $15,000 to $17,499 | 231 (3.4%) | 194 (2.9%) |
| $17,500 to $19,999 | 114 (1.7%) | 82 (1.3%) |
| $20,000 to $22,499 | 115 (1.7%) | 197 (3.0%) |
| $22,500 to $24,999 | 137 (2.0%) | 232 (3.5%) |
| $25,000 to $29,999 | 414 (6.1%) | 592 (9.0%) |
| $30,000 to $34,999 | 385 (5.6%) | 437 (6.7%) |
| $35,000 to $39,999 | 393 (5.8%) | 335 (5.1%) |
| $40,000 to $44,999 | 384 (5.6%) | 582 (8.9%) |
| $45,000 to $49,999 | 219 (3.2%) | 644 (9.8%) |
| $50,000 to $54,999 | 246 (3.6%) | 171 (2.6%) |
| $55,000 to $64,999 | 397 (5.8%) | 430 (6.5%) |
| $65,000 to $74,999 | 418 (6.1%) | 394 (6.0%) |
| $75,000 to $99,999 | 945 (13.8%) | 572 (8.7%) |
| $100,000+ | 774 (11.3%) | 449 (6.8%) |
| Total | 6,834 (100.0%) | 6,572 (100.0%) |
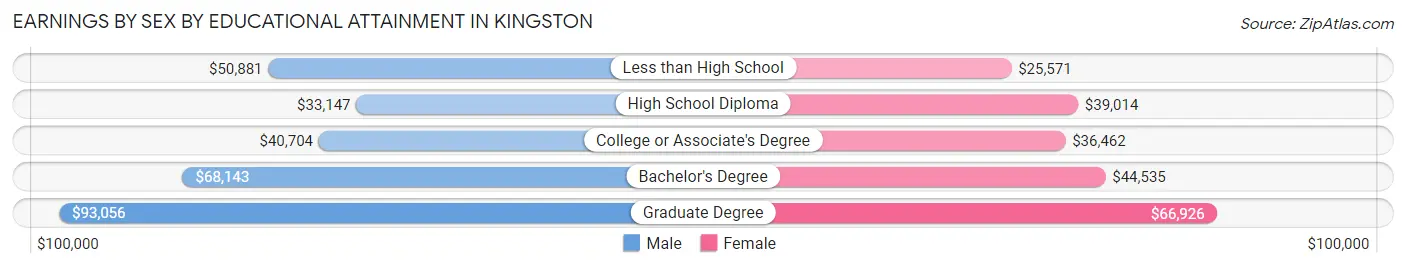
Earnings by Sex by Educational Attainment in Kingston
Average earnings in Kingston are $43,533 for men and $41,547 for women, a difference of 4.6%. Men with an educational attainment of graduate degree enjoy the highest average annual earnings of $93,056, while those with high school diploma education earn the least with $33,147. Women with an educational attainment of graduate degree earn the most with the average annual earnings of $66,926, while those with less than high school education have the smallest earnings of $25,571.
| Educational Attainment | Male Income | Female Income |
| Less than High School | $50,881 | $25,571 |
| High School Diploma | $33,147 | $39,014 |
| College or Associate's Degree | $40,704 | $36,462 |
| Bachelor's Degree | $68,143 | $44,535 |
| Graduate Degree | $93,056 | $66,926 |
| Total | $43,533 | $41,547 |
Family Income in Kingston
Family Income Brackets in Kingston
According to the Kingston family income data, there are 1,102 families falling into the $100,000 to $149,999 income range, which is the most common income bracket and makes up 21.2% of all families. Conversely, the $10,000 to $14,999 income bracket is the least frequent group with only 94 families (1.8%) belonging to this category.
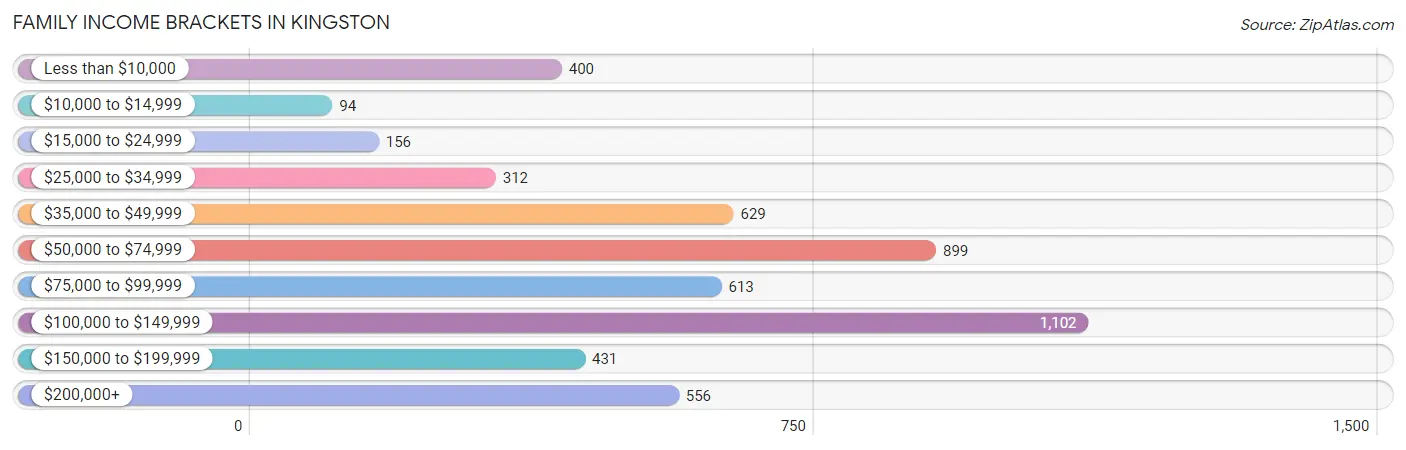
| Income Bracket | # Families | % Families |
| Less than $10,000 | 400 | 7.7% |
| $10,000 to $14,999 | 94 | 1.8% |
| $15,000 to $24,999 | 156 | 3.0% |
| $25,000 to $34,999 | 312 | 6.0% |
| $35,000 to $49,999 | 629 | 12.1% |
| $50,000 to $74,999 | 899 | 17.3% |
| $75,000 to $99,999 | 613 | 11.8% |
| $100,000 to $149,999 | 1,102 | 21.2% |
| $150,000 to $199,999 | 431 | 8.3% |
| $200,000+ | 556 | 10.7% |
Family Income by Famaliy Size in Kingston
7+ person families (34 | 0.6%) account for the highest median family income in Kingston with $250,001 per family, while 2-person families (2,313 | 44.5%) have the highest median income of $36,026 per family member.
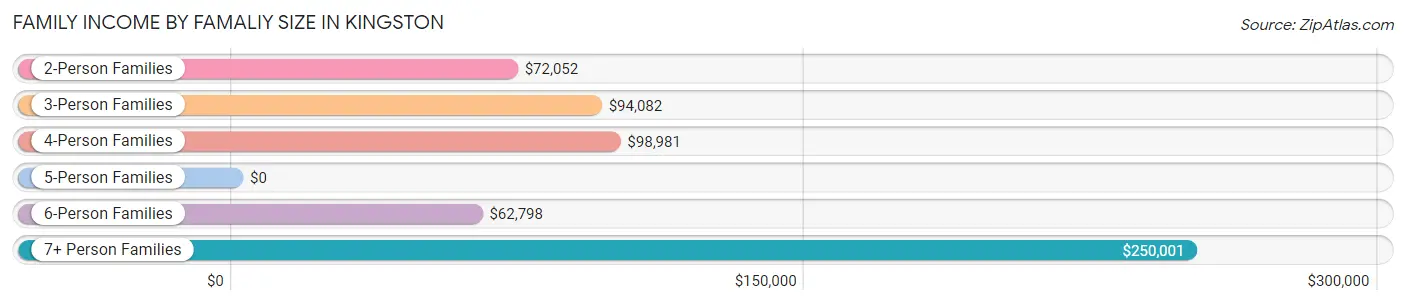
| Income Bracket | # Families | Median Income |
| 2-Person Families | 2,313 (44.5%) | $72,052 |
| 3-Person Families | 1,661 (32.0%) | $94,082 |
| 4-Person Families | 746 (14.4%) | $98,981 |
| 5-Person Families | 297 (5.7%) | $0 |
| 6-Person Families | 145 (2.8%) | $62,798 |
| 7+ Person Families | 34 (0.6%) | $250,001 |
| Total | 5,196 (100.0%) | $79,310 |
Family Income by Number of Earners in Kingston
The median family income in Kingston is $79,310, with families comprising 3+ earners (609) having the highest median family income of $131,477, while families with no earners (705) have the lowest median family income of $42,901, accounting for 11.7% and 13.6% of families, respectively.
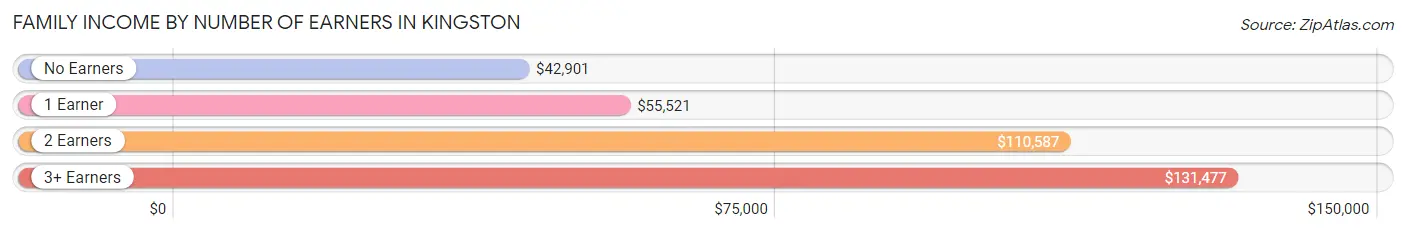
| Number of Earners | # Families | Median Income |
| No Earners | 705 (13.6%) | $42,901 |
| 1 Earner | 1,753 (33.7%) | $55,521 |
| 2 Earners | 2,129 (41.0%) | $110,587 |
| 3+ Earners | 609 (11.7%) | $131,477 |
| Total | 5,196 (100.0%) | $79,310 |
Household Income in Kingston
Household Income Brackets in Kingston
With 1,728 households falling in the category, the $50,000 to $74,999 income range is the most frequent in Kingston, accounting for 17.6% of all households. In contrast, only 511 households (5.2%) fall into the $150,000 to $199,999 income bracket, making it the least populous group.
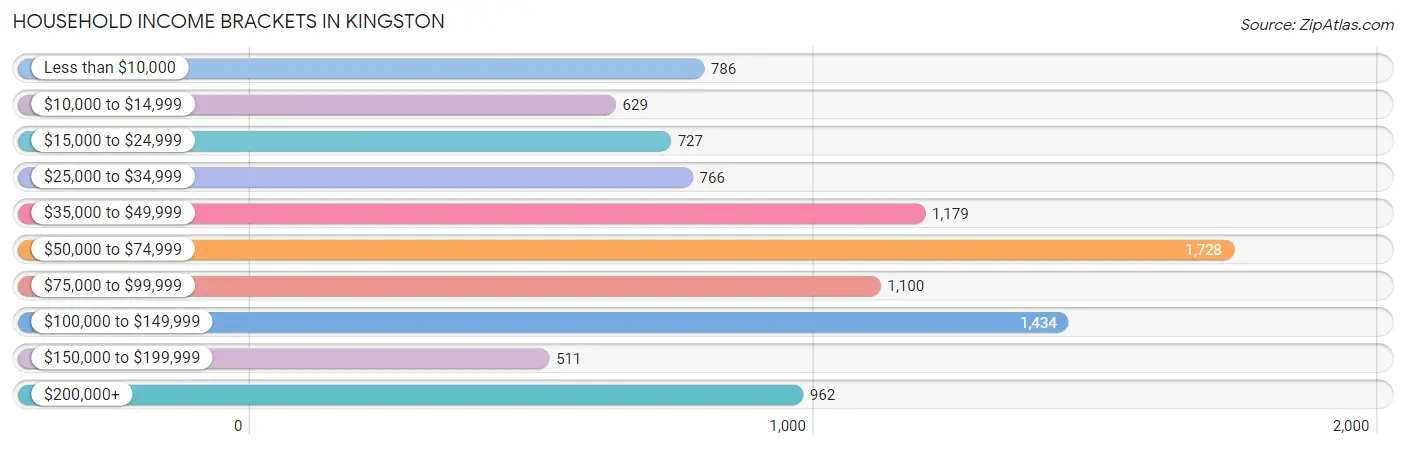
| Income Bracket | # Households | % Households |
| Less than $10,000 | 786 | 8.0% |
| $10,000 to $14,999 | 629 | 6.4% |
| $15,000 to $24,999 | 727 | 7.4% |
| $25,000 to $34,999 | 766 | 7.8% |
| $35,000 to $49,999 | 1,179 | 12.0% |
| $50,000 to $74,999 | 1,728 | 17.6% |
| $75,000 to $99,999 | 1,100 | 11.2% |
| $100,000 to $149,999 | 1,434 | 14.6% |
| $150,000 to $199,999 | 511 | 5.2% |
| $200,000+ | 962 | 9.8% |
Household Income by Householder Age in Kingston
The median household income in Kingston is $62,071, with the highest median household income of $66,869 found in the 25 to 44 years age bracket for the primary householder. A total of 3,550 households (36.1%) fall into this category. Meanwhile, the 15 to 24 years age bracket for the primary householder has the lowest median household income of $0, with 359 households (3.7%) in this group.
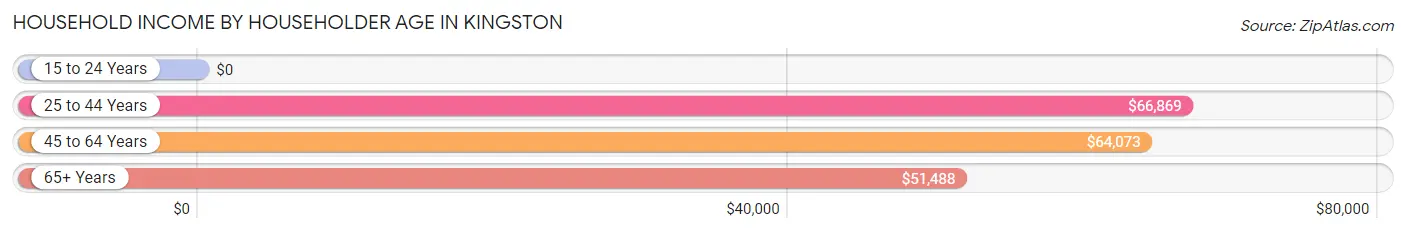
| Income Bracket | # Households | Median Income |
| 15 to 24 Years | 359 (3.7%) | $0 |
| 25 to 44 Years | 3,550 (36.1%) | $66,869 |
| 45 to 64 Years | 3,531 (35.9%) | $64,073 |
| 65+ Years | 2,381 (24.2%) | $51,488 |
| Total | 9,821 (100.0%) | $62,071 |
Poverty in Kingston
Income Below Poverty by Sex and Age in Kingston
With 19.1% poverty level for males and 17.8% for females among the residents of Kingston, 6 to 11 year old males and 15 year old females are the most vulnerable to poverty, with 252 males (30.7%) and 55 females (51.4%) in their respective age groups living below the poverty level.
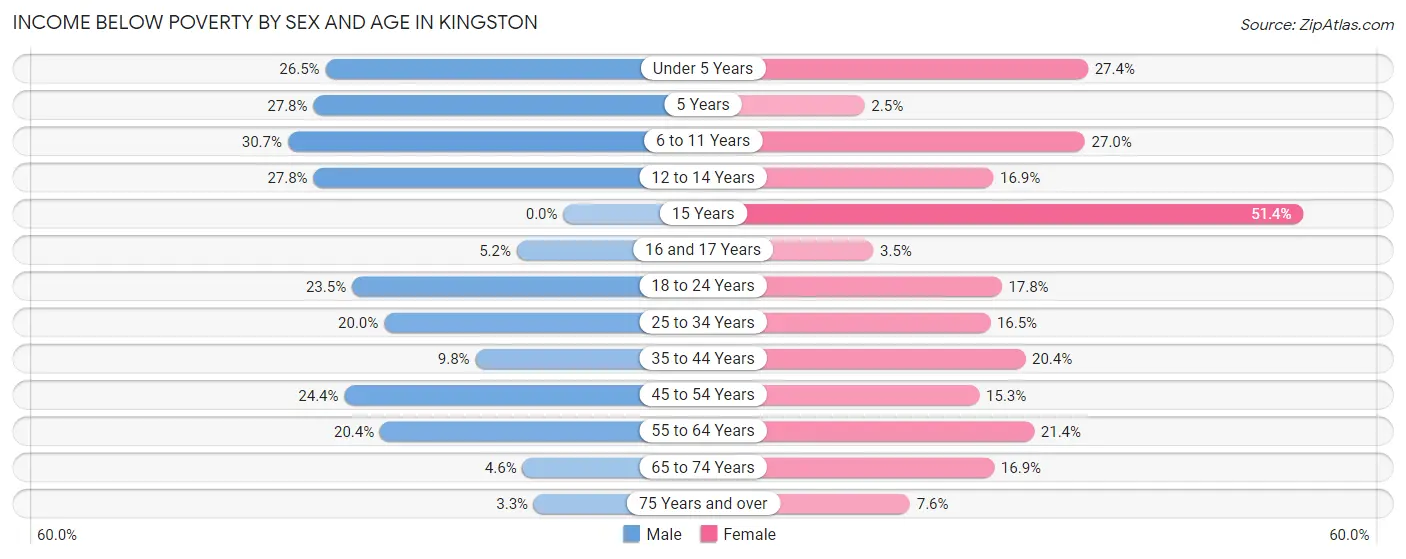
| Age Bracket | Male | Female |
| Under 5 Years | 239 (26.5%) | 195 (27.4%) |
| 5 Years | 49 (27.8%) | 9 (2.5%) |
| 6 to 11 Years | 252 (30.7%) | 202 (27.0%) |
| 12 to 14 Years | 96 (27.8%) | 76 (16.9%) |
| 15 Years | 0 (0.0%) | 55 (51.4%) |
| 16 and 17 Years | 10 (5.2%) | 9 (3.5%) |
| 18 to 24 Years | 242 (23.5%) | 163 (17.8%) |
| 25 to 34 Years | 471 (20.0%) | 337 (16.5%) |
| 35 to 44 Years | 145 (9.8%) | 329 (20.4%) |
| 45 to 54 Years | 367 (24.4%) | 229 (15.3%) |
| 55 to 64 Years | 291 (20.4%) | 270 (21.4%) |
| 65 to 74 Years | 37 (4.5%) | 197 (16.9%) |
| 75 Years and over | 18 (3.3%) | 64 (7.6%) |
| Total | 2,217 (19.1%) | 2,135 (17.8%) |
Income Above Poverty by Sex and Age in Kingston
According to the poverty statistics in Kingston, males aged 15 years and females aged 5 years are the age groups that are most secure financially, with 100.0% of males and 97.5% of females in these age groups living above the poverty line.
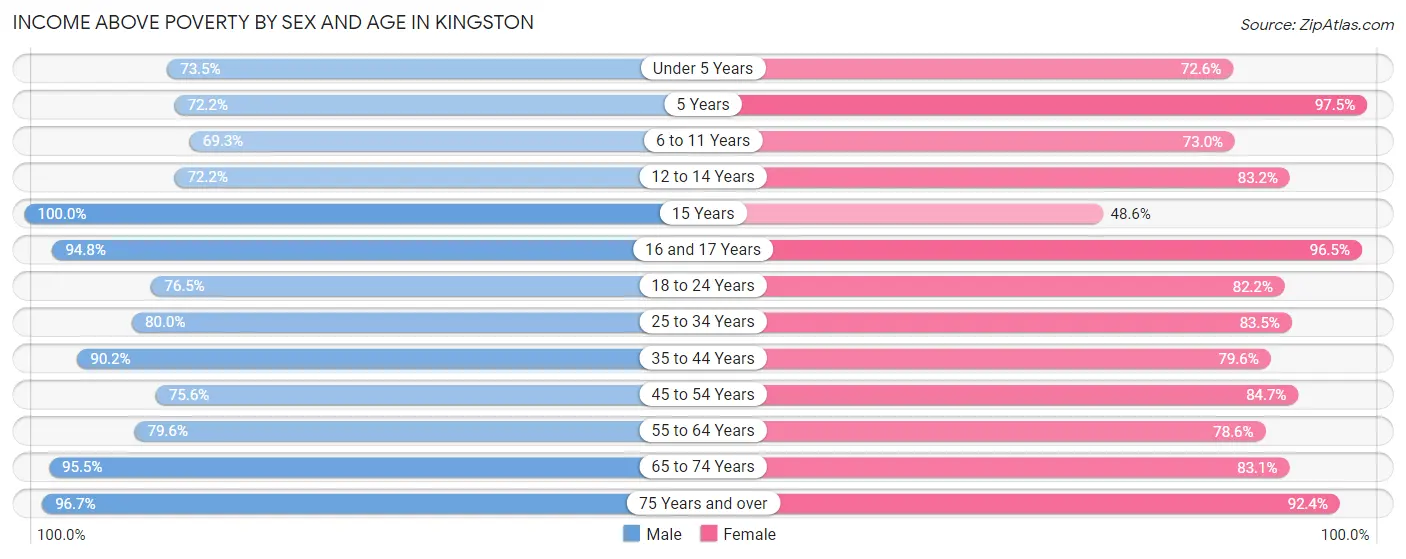
| Age Bracket | Male | Female |
| Under 5 Years | 663 (73.5%) | 517 (72.6%) |
| 5 Years | 127 (72.2%) | 348 (97.5%) |
| 6 to 11 Years | 569 (69.3%) | 545 (73.0%) |
| 12 to 14 Years | 249 (72.2%) | 375 (83.2%) |
| 15 Years | 18 (100.0%) | 52 (48.6%) |
| 16 and 17 Years | 183 (94.8%) | 249 (96.5%) |
| 18 to 24 Years | 786 (76.5%) | 754 (82.2%) |
| 25 to 34 Years | 1,889 (80.0%) | 1,705 (83.5%) |
| 35 to 44 Years | 1,336 (90.2%) | 1,283 (79.6%) |
| 45 to 54 Years | 1,138 (75.6%) | 1,269 (84.7%) |
| 55 to 64 Years | 1,135 (79.6%) | 992 (78.6%) |
| 65 to 74 Years | 777 (95.5%) | 966 (83.1%) |
| 75 Years and over | 530 (96.7%) | 782 (92.4%) |
| Total | 9,400 (80.9%) | 9,837 (82.2%) |
Income Below Poverty Among Married-Couple Families in Kingston
The poverty statistics for married-couple families in Kingston show that 3.0% or 94 of the total 3,145 families live below the poverty line. Families with 1 or 2 children have the highest poverty rate of 5.7%, comprising of 57 families. On the other hand, families with no children have the lowest poverty rate of 1.6%, which includes 30 families.
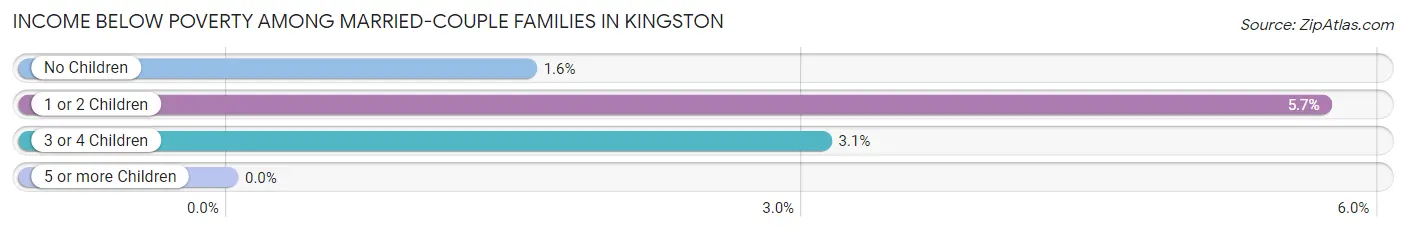
| Children | Above Poverty | Below Poverty |
| No Children | 1,891 (98.4%) | 30 (1.6%) |
| 1 or 2 Children | 941 (94.3%) | 57 (5.7%) |
| 3 or 4 Children | 219 (96.9%) | 7 (3.1%) |
| 5 or more Children | 0 (0.0%) | 0 (0.0%) |
| Total | 3,051 (97.0%) | 94 (3.0%) |
Income Below Poverty Among Single-Parent Households in Kingston
According to the poverty data in Kingston, 4.3% or 20 single-father households and 35.4% or 562 single-mother households are living below the poverty line. Among single-father households, those with no children have the highest poverty rate, with 10 households (4.8%) experiencing poverty. Likewise, among single-mother households, those with 3 or 4 children have the highest poverty rate, with 106 households (82.2%) falling below the poverty line.
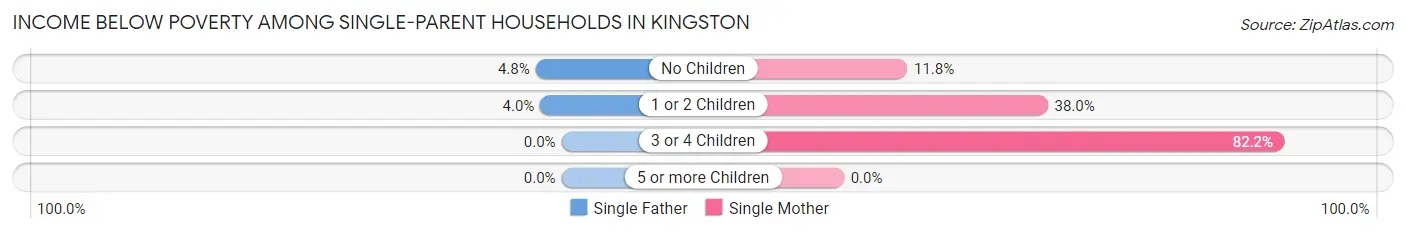
| Children | Single Father | Single Mother |
| No Children | 10 (4.8%) | 44 (11.8%) |
| 1 or 2 Children | 10 (4.0%) | 412 (38.0%) |
| 3 or 4 Children | 0 (0.0%) | 106 (82.2%) |
| 5 or more Children | 0 (0.0%) | 0 (0.0%) |
| Total | 20 (4.3%) | 562 (35.4%) |
Income Below Poverty Among Married-Couple vs Single-Parent Households in Kingston
The poverty data for Kingston shows that 94 of the married-couple family households (3.0%) and 582 of the single-parent households (28.4%) are living below the poverty level. Within the married-couple family households, those with 1 or 2 children have the highest poverty rate, with 57 households (5.7%) falling below the poverty line. Among the single-parent households, those with 3 or 4 children have the highest poverty rate, with 106 household (79.1%) living below poverty.
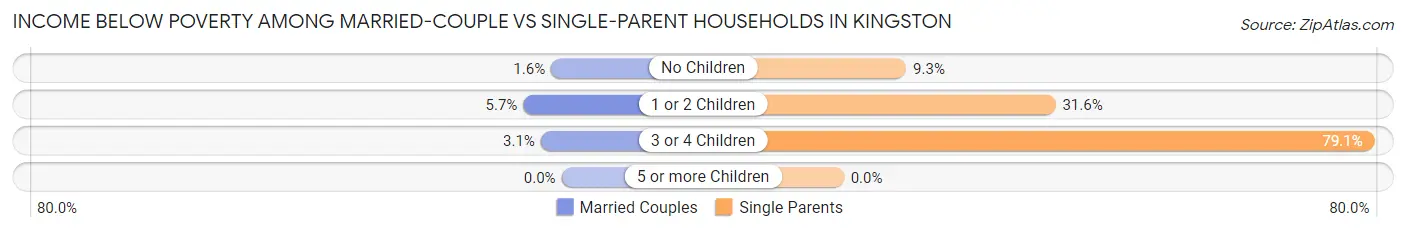
| Children | Married-Couple Families | Single-Parent Households |
| No Children | 30 (1.6%) | 54 (9.3%) |
| 1 or 2 Children | 57 (5.7%) | 422 (31.6%) |
| 3 or 4 Children | 7 (3.1%) | 106 (79.1%) |
| 5 or more Children | 0 (0.0%) | 0 (0.0%) |
| Total | 94 (3.0%) | 582 (28.4%) |
Race in Kingston
The most populous races in Kingston are White / Caucasian (16,206 | 67.5%), Hispanic or Latino (3,655 | 15.2%), and Black / African American (3,237 | 13.5%).
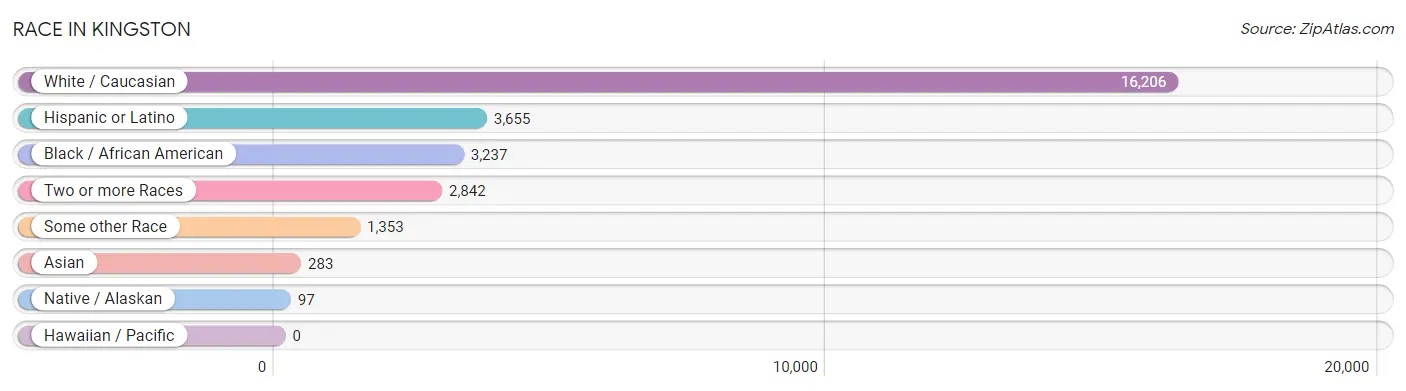
| Race | # Population | % Population |
| Asian | 283 | 1.2% |
| Black / African American | 3,237 | 13.5% |
| Hawaiian / Pacific | 0 | 0.0% |
| Hispanic or Latino | 3,655 | 15.2% |
| Native / Alaskan | 97 | 0.4% |
| White / Caucasian | 16,206 | 67.5% |
| Two or more Races | 2,842 | 11.8% |
| Some other Race | 1,353 | 5.6% |
| Total | 24,018 | 100.0% |
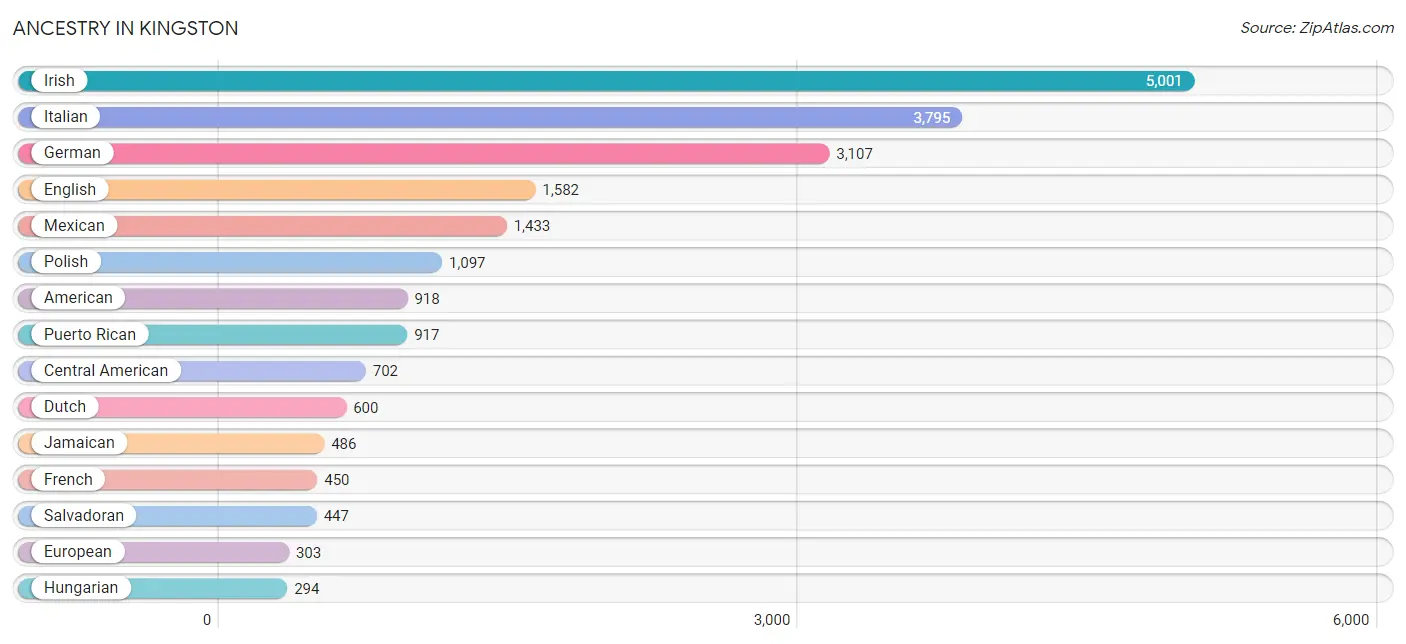
Ancestry in Kingston
The most populous ancestries reported in Kingston are Irish (5,001 | 20.8%), Italian (3,795 | 15.8%), German (3,107 | 12.9%), English (1,582 | 6.6%), and Mexican (1,433 | 6.0%), together accounting for 62.1% of all Kingston residents.
| Ancestry | # Population | % Population |
| African | 157 | 0.6% |
| American | 918 | 3.8% |
| Arab | 23 | 0.1% |
| Argentinean | 35 | 0.2% |
| Armenian | 23 | 0.1% |
| Australian | 88 | 0.4% |
| Austrian | 31 | 0.1% |
| Belgian | 7 | 0.0% |
| Bhutanese | 30 | 0.1% |
| Blackfeet | 12 | 0.1% |
| Brazilian | 55 | 0.2% |
| British | 70 | 0.3% |
| British West Indian | 60 | 0.3% |
| Burmese | 34 | 0.1% |
| Canadian | 47 | 0.2% |
| Central American | 702 | 2.9% |
| Central American Indian | 95 | 0.4% |
| Cherokee | 11 | 0.1% |
| Chilean | 17 | 0.1% |
| Colombian | 117 | 0.5% |
| Costa Rican | 14 | 0.1% |
| Cuban | 78 | 0.3% |
| Czech | 17 | 0.1% |
| Czechoslovakian | 16 | 0.1% |
| Danish | 23 | 0.1% |
| Dominican | 25 | 0.1% |
| Dutch | 600 | 2.5% |
| Eastern European | 249 | 1.0% |
| Ecuadorian | 36 | 0.2% |
| English | 1,582 | 6.6% |
| European | 303 | 1.3% |
| Finnish | 26 | 0.1% |
| French | 450 | 1.9% |
| French American Indian | 24 | 0.1% |
| French Canadian | 169 | 0.7% |
| German | 3,107 | 12.9% |
| Greek | 189 | 0.8% |
| Guatemalan | 172 | 0.7% |
| Guyanese | 139 | 0.6% |
| Haitian | 181 | 0.7% |
| Honduran | 54 | 0.2% |
| Hungarian | 294 | 1.2% |
| Indian (Asian) | 151 | 0.6% |
| Iranian | 18 | 0.1% |
| Irish | 5,001 | 20.8% |
| Iroquois | 27 | 0.1% |
| Italian | 3,795 | 15.8% |
| Jamaican | 486 | 2.0% |
| Korean | 114 | 0.5% |
| Lebanese | 23 | 0.1% |
| Lithuanian | 20 | 0.1% |
| Maltese | 16 | 0.1% |
| Mexican | 1,433 | 6.0% |
| Mexican American Indian | 113 | 0.5% |
| Northern European | 62 | 0.3% |
| Norwegian | 109 | 0.4% |
| Pakistani | 22 | 0.1% |
| Panamanian | 15 | 0.1% |
| Peruvian | 20 | 0.1% |
| Polish | 1,097 | 4.6% |
| Portuguese | 69 | 0.3% |
| Puerto Rican | 917 | 3.8% |
| Romanian | 208 | 0.9% |
| Russian | 243 | 1.0% |
| Salvadoran | 447 | 1.9% |
| Scandinavian | 69 | 0.3% |
| Scotch-Irish | 104 | 0.4% |
| Scottish | 242 | 1.0% |
| Sioux | 7 | 0.0% |
| Slovak | 177 | 0.7% |
| South American | 264 | 1.1% |
| Spaniard | 69 | 0.3% |
| Spanish | 100 | 0.4% |
| Subsaharan African | 157 | 0.6% |
| Swedish | 122 | 0.5% |
| Swiss | 11 | 0.1% |
| Thai | 11 | 0.1% |
| Ukrainian | 121 | 0.5% |
| Uruguayan | 29 | 0.1% |
| Venezuelan | 10 | 0.0% |
| Vietnamese | 18 | 0.1% |
| Welsh | 145 | 0.6% | View All 82 Rows |
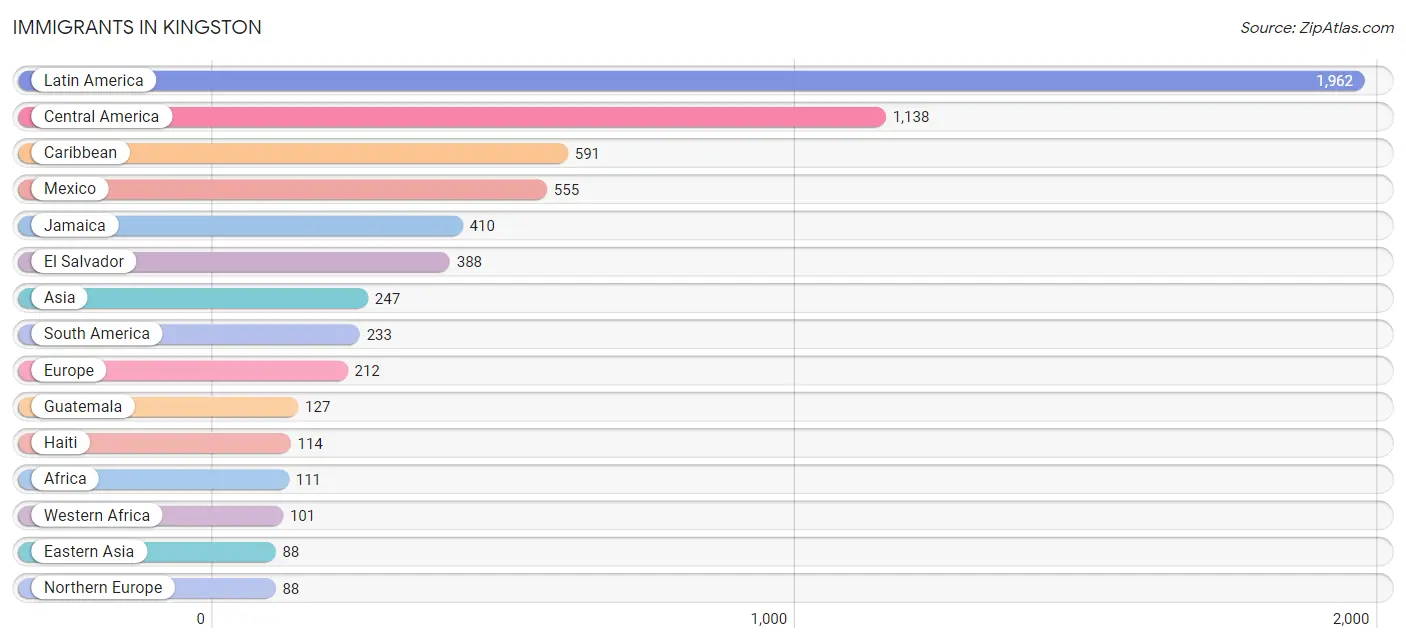
Immigrants in Kingston
The most numerous immigrant groups reported in Kingston came from Latin America (1,962 | 8.2%), Central America (1,138 | 4.7%), Caribbean (591 | 2.5%), Mexico (555 | 2.3%), and Jamaica (410 | 1.7%), together accounting for 19.4% of all Kingston residents.
| Immigration Origin | # Population | % Population |
| Africa | 111 | 0.5% |
| Argentina | 35 | 0.2% |
| Asia | 247 | 1.0% |
| Australia | 25 | 0.1% |
| Bangladesh | 25 | 0.1% |
| Brazil | 38 | 0.2% |
| Canada | 39 | 0.2% |
| Caribbean | 591 | 2.5% |
| Central America | 1,138 | 4.7% |
| Chile | 8 | 0.0% |
| China | 70 | 0.3% |
| Colombia | 46 | 0.2% |
| Costa Rica | 14 | 0.1% |
| Cuba | 20 | 0.1% |
| Dominican Republic | 28 | 0.1% |
| Eastern Asia | 88 | 0.4% |
| Eastern Europe | 57 | 0.2% |
| Ecuador | 10 | 0.0% |
| El Salvador | 388 | 1.6% |
| England | 12 | 0.1% |
| Europe | 212 | 0.9% |
| France | 17 | 0.1% |
| Germany | 12 | 0.1% |
| Guatemala | 127 | 0.5% |
| Guyana | 42 | 0.2% |
| Haiti | 114 | 0.5% |
| Honduras | 54 | 0.2% |
| India | 11 | 0.1% |
| Indonesia | 29 | 0.1% |
| Italy | 31 | 0.1% |
| Jamaica | 410 | 1.7% |
| Japan | 4 | 0.0% |
| Korea | 14 | 0.1% |
| Latin America | 1,962 | 8.2% |
| Mexico | 555 | 2.3% |
| Netherlands | 7 | 0.0% |
| Nigeria | 32 | 0.1% |
| Northern Europe | 88 | 0.4% |
| Oceania | 25 | 0.1% |
| Pakistan | 47 | 0.2% |
| Peru | 20 | 0.1% |
| Philippines | 27 | 0.1% |
| Poland | 26 | 0.1% |
| Russia | 26 | 0.1% |
| Scotland | 9 | 0.0% |
| South Africa | 10 | 0.0% |
| South America | 233 | 1.0% |
| South Central Asia | 83 | 0.4% |
| South Eastern Asia | 56 | 0.2% |
| Southern Europe | 31 | 0.1% |
| Ukraine | 5 | 0.0% |
| Uruguay | 7 | 0.0% |
| Venezuela | 27 | 0.1% |
| Western Africa | 101 | 0.4% |
| Western Asia | 20 | 0.1% |
| Western Europe | 36 | 0.2% | View All 56 Rows |
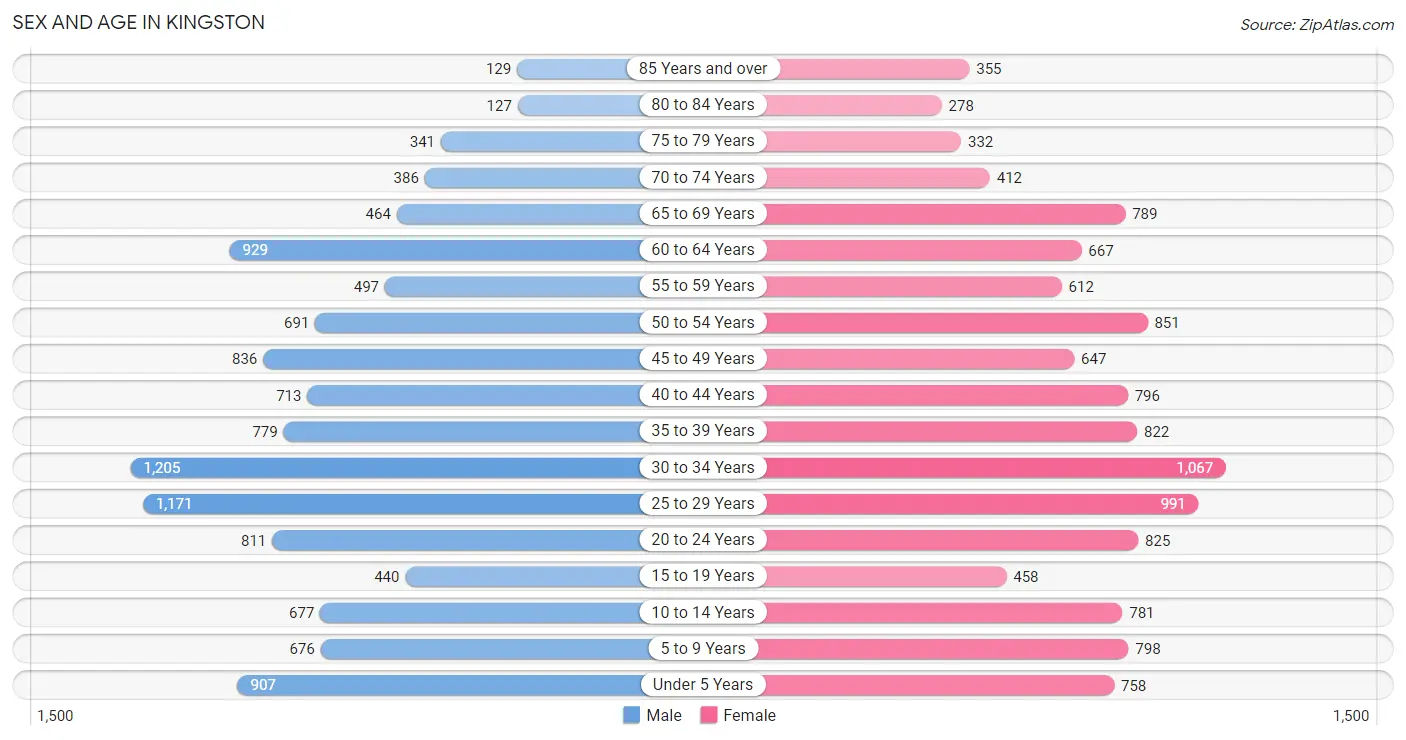
Sex and Age in Kingston
Sex and Age in Kingston
The most populous age groups in Kingston are 30 to 34 Years (1,205 | 10.2%) for men and 30 to 34 Years (1,067 | 8.7%) for women.
| Age Bracket | Male | Female |
| Under 5 Years | 907 (7.7%) | 758 (6.2%) |
| 5 to 9 Years | 676 (5.7%) | 798 (6.5%) |
| 10 to 14 Years | 677 (5.8%) | 781 (6.4%) |
| 15 to 19 Years | 440 (3.7%) | 458 (3.7%) |
| 20 to 24 Years | 811 (6.9%) | 825 (6.7%) |
| 25 to 29 Years | 1,171 (9.9%) | 991 (8.1%) |
| 30 to 34 Years | 1,205 (10.2%) | 1,067 (8.7%) |
| 35 to 39 Years | 779 (6.6%) | 822 (6.7%) |
| 40 to 44 Years | 713 (6.0%) | 796 (6.5%) |
| 45 to 49 Years | 836 (7.1%) | 647 (5.3%) |
| 50 to 54 Years | 691 (5.9%) | 851 (7.0%) |
| 55 to 59 Years | 497 (4.2%) | 612 (5.0%) |
| 60 to 64 Years | 929 (7.9%) | 667 (5.4%) |
| 65 to 69 Years | 464 (3.9%) | 789 (6.5%) |
| 70 to 74 Years | 386 (3.3%) | 412 (3.4%) |
| 75 to 79 Years | 341 (2.9%) | 332 (2.7%) |
| 80 to 84 Years | 127 (1.1%) | 278 (2.3%) |
| 85 Years and over | 129 (1.1%) | 355 (2.9%) |
| Total | 11,779 (100.0%) | 12,239 (100.0%) |
Families and Households in Kingston
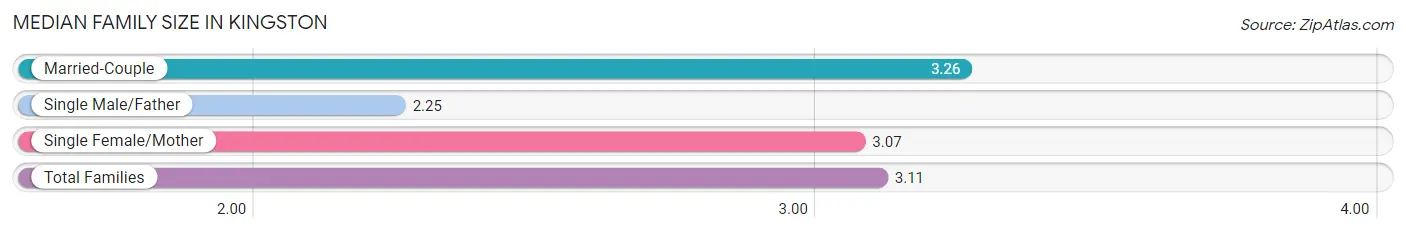
Median Family Size in Kingston
The median family size in Kingston is 3.11 persons per family, with married-couple families (3,145 | 60.5%) accounting for the largest median family size of 3.26 persons per family. On the other hand, single male/father families (464 | 8.9%) represent the smallest median family size with 2.25 persons per family.
| Family Type | # Families | Family Size |
| Married-Couple | 3,145 (60.5%) | 3.26 |
| Single Male/Father | 464 (8.9%) | 2.25 |
| Single Female/Mother | 1,587 (30.5%) | 3.07 |
| Total Families | 5,196 (100.0%) | 3.11 |
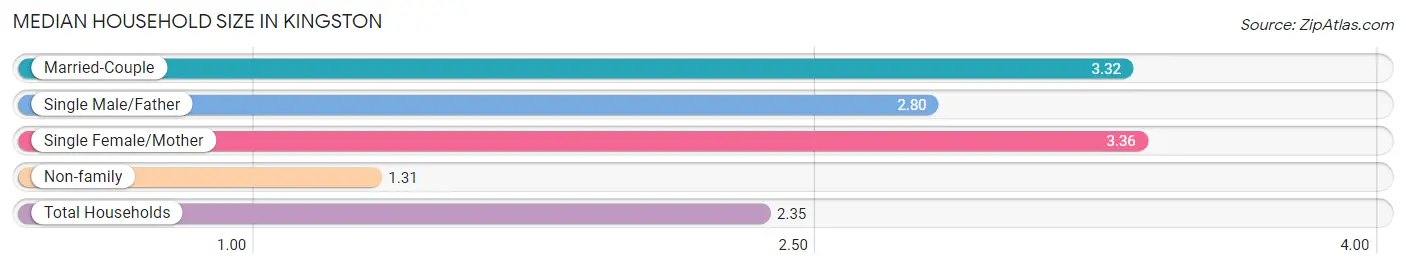
Median Household Size in Kingston
The median household size in Kingston is 2.35 persons per household, with single female/mother households (1,587 | 16.2%) accounting for the largest median household size of 3.36 persons per household. non-family households (4,625 | 47.1%) represent the smallest median household size with 1.31 persons per household.
| Household Type | # Households | Household Size |
| Married-Couple | 3,145 (32.0%) | 3.32 |
| Single Male/Father | 464 (4.7%) | 2.80 |
| Single Female/Mother | 1,587 (16.2%) | 3.36 |
| Non-family | 4,625 (47.1%) | 1.31 |
| Total Households | 9,821 (100.0%) | 2.35 |
Household Size by Marriage Status in Kingston
Out of a total of 9,821 households in Kingston, 5,196 (52.9%) are family households, while 4,625 (47.1%) are nonfamily households. The most numerous type of family households are 2-person households, comprising 2,015, and the most common type of nonfamily households are 1-person households, comprising 3,653.
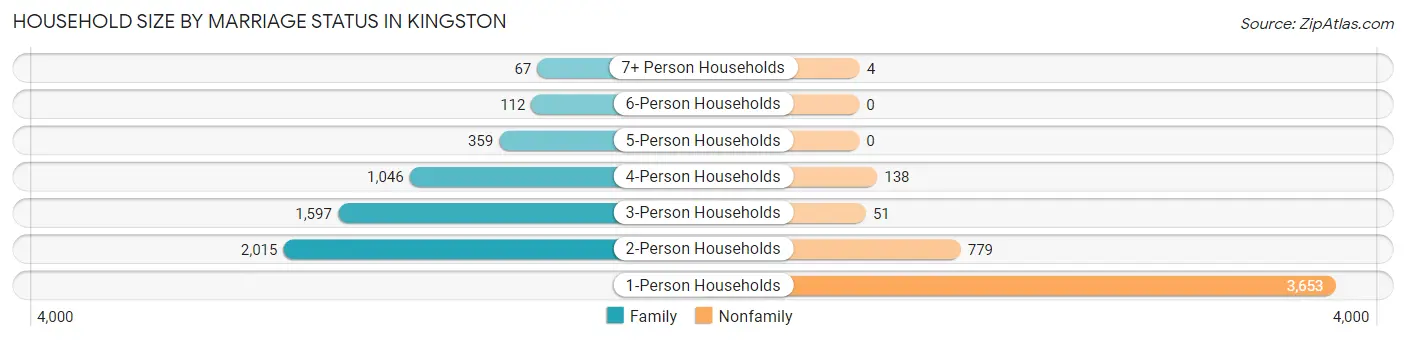
| Household Size | Family Households | Nonfamily Households |
| 1-Person Households | - | 3,653 (37.2%) |
| 2-Person Households | 2,015 (20.5%) | 779 (7.9%) |
| 3-Person Households | 1,597 (16.3%) | 51 (0.5%) |
| 4-Person Households | 1,046 (10.6%) | 138 (1.4%) |
| 5-Person Households | 359 (3.7%) | 0 (0.0%) |
| 6-Person Households | 112 (1.1%) | 0 (0.0%) |
| 7+ Person Households | 67 (0.7%) | 4 (0.0%) |
| Total | 5,196 (52.9%) | 4,625 (47.1%) |
Female Fertility in Kingston
Fertility by Age in Kingston
Average fertility rate in Kingston is 52.0 births per 1,000 women. Women in the age bracket of 20 to 34 years have the highest fertility rate with 91.0 births per 1,000 women. Women in the age bracket of 20 to 34 years acount for 88.3% of all women with births.
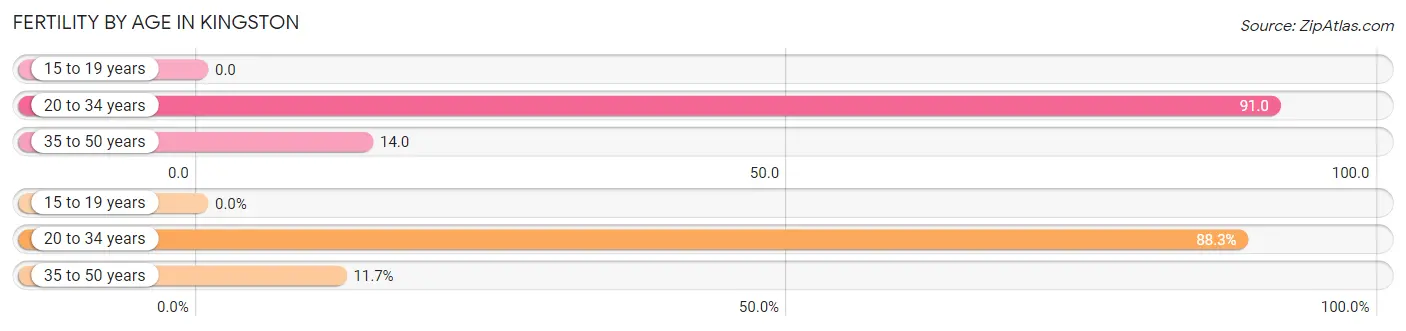
| Age Bracket | Women with Births | Births / 1,000 Women |
| 15 to 19 years | 0 (0.0%) | 0.0 |
| 20 to 34 years | 263 (88.3%) | 91.0 |
| 35 to 50 years | 35 (11.7%) | 14.0 |
| Total | 298 (100.0%) | 52.0 |
Fertility by Age by Marriage Status in Kingston
58.4% of women with births (298) in Kingston are married. The highest percentage of unmarried women with births falls into 20 to 34 years age bracket with 47.1% of them unmarried at the time of birth, while the lowest percentage of unmarried women with births belong to 35 to 50 years age bracket with 0.0% of them unmarried.
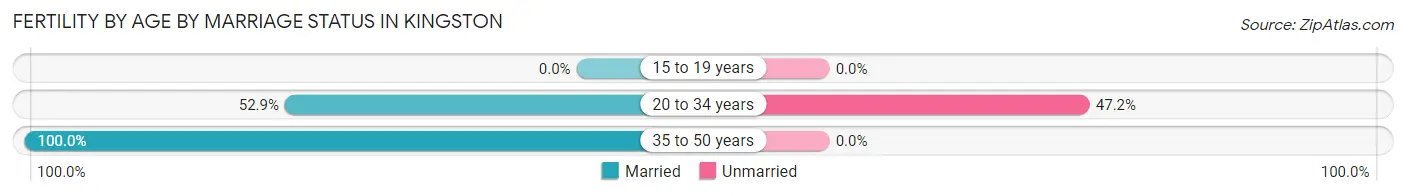
| Age Bracket | Married | Unmarried |
| 15 to 19 years | 0 (0.0%) | 0 (0.0%) |
| 20 to 34 years | 139 (52.8%) | 124 (47.1%) |
| 35 to 50 years | 35 (100.0%) | 0 (0.0%) |
| Total | 174 (58.4%) | 124 (41.6%) |
Fertility by Education in Kingston
Average fertility rate in Kingston is 52.0 births per 1,000 women. Women with the education attainment of college or associate's degree have the highest fertility rate of 73.0 births per 1,000 women, while women with the education attainment of graduate degree have the lowest fertility at 20.0 births per 1,000 women. Women with the education attainment of college or associate's degree represent 37.6% of all women with births.
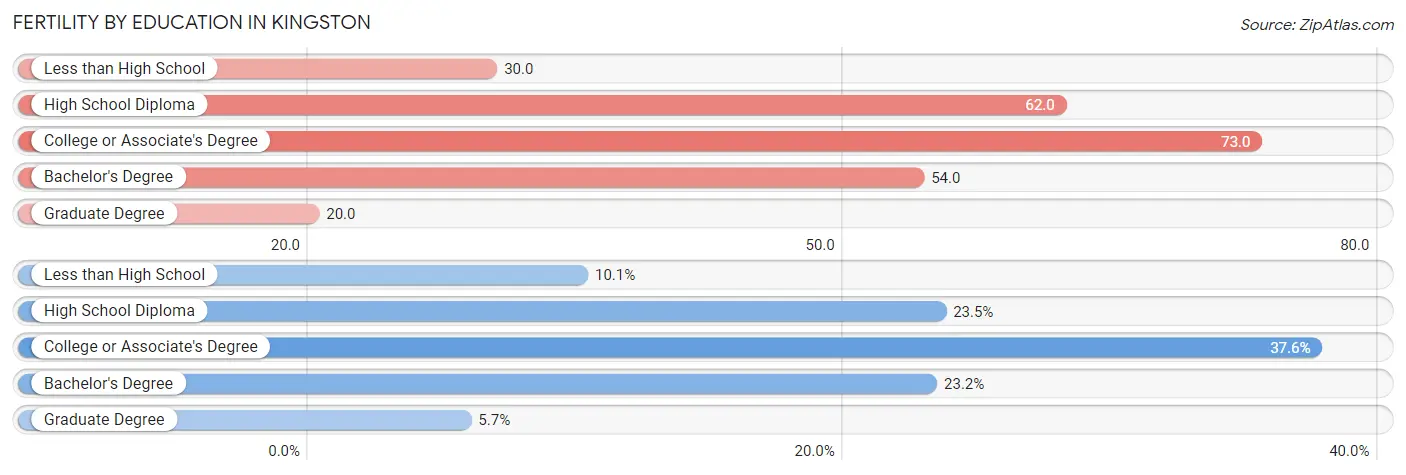
| Educational Attainment | Women with Births | Births / 1,000 Women |
| Less than High School | 30 (10.1%) | 30.0 |
| High School Diploma | 70 (23.5%) | 62.0 |
| College or Associate's Degree | 112 (37.6%) | 73.0 |
| Bachelor's Degree | 69 (23.2%) | 54.0 |
| Graduate Degree | 17 (5.7%) | 20.0 |
| Total | 298 (100.0%) | 52.0 |
Fertility by Education by Marriage Status in Kingston
41.6% of women with births in Kingston are unmarried. Women with the educational attainment of less than high school are most likely to be married with 100.0% of them married at childbirth, while women with the educational attainment of college or associate's degree are least likely to be married with 92.0% of them unmarried at childbirth.
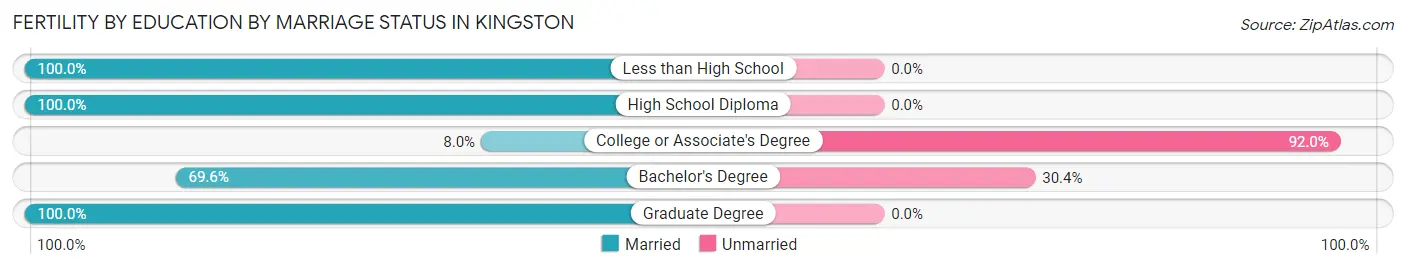
| Educational Attainment | Married | Unmarried |
| Less than High School | 30 (100.0%) | 0 (0.0%) |
| High School Diploma | 70 (100.0%) | 0 (0.0%) |
| College or Associate's Degree | 9 (8.0%) | 103 (92.0%) |
| Bachelor's Degree | 48 (69.6%) | 21 (30.4%) |
| Graduate Degree | 17 (100.0%) | 0 (0.0%) |
| Total | 174 (58.4%) | 124 (41.6%) |
Employment Characteristics in Kingston
Employment by Class of Employer in Kingston
Among the 11,849 employed individuals in Kingston, private company employees (7,450 | 62.9%), not-for-profit organizations (1,506 | 12.7%), and local government employees (1,098 | 9.3%) make up the most common classes of employment.
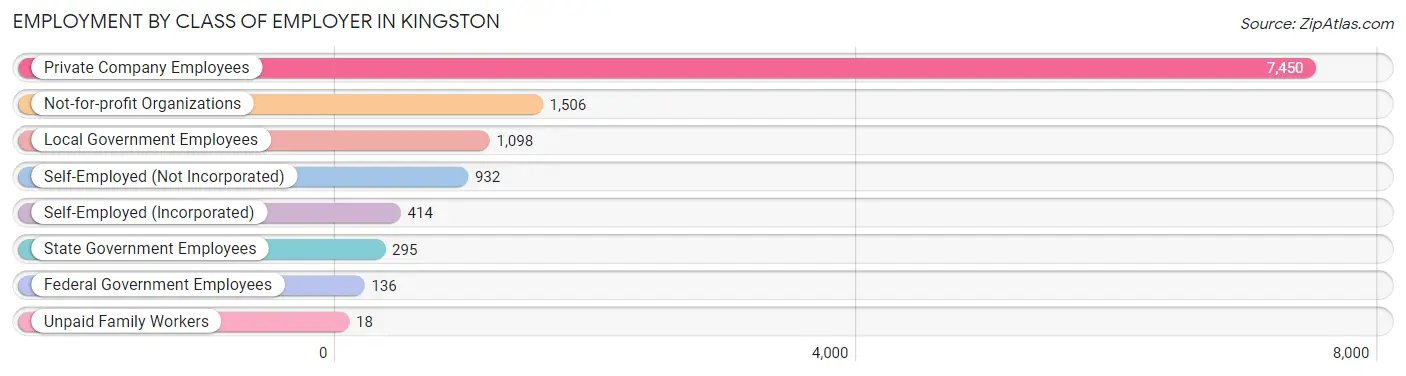
| Employer Class | # Employees | % Employees |
| Private Company Employees | 7,450 | 62.9% |
| Self-Employed (Incorporated) | 414 | 3.5% |
| Self-Employed (Not Incorporated) | 932 | 7.9% |
| Not-for-profit Organizations | 1,506 | 12.7% |
| Local Government Employees | 1,098 | 9.3% |
| State Government Employees | 295 | 2.5% |
| Federal Government Employees | 136 | 1.1% |
| Unpaid Family Workers | 18 | 0.2% |
| Total | 11,849 | 100.0% |
Employment Status by Age in Kingston
According to the labor force statistics for Kingston, out of the total population over 16 years of age (19,295), 67.3% or 12,986 individuals are in the labor force, with 6.0% or 779 of them unemployed. The age group with the highest labor force participation rate is 30 to 34 years, with 89.8% or 2,040 individuals in the labor force. Within the labor force, the 75 years and over age range has the highest percentage of unemployed individuals, with 25.0% or 38 of them being unemployed.
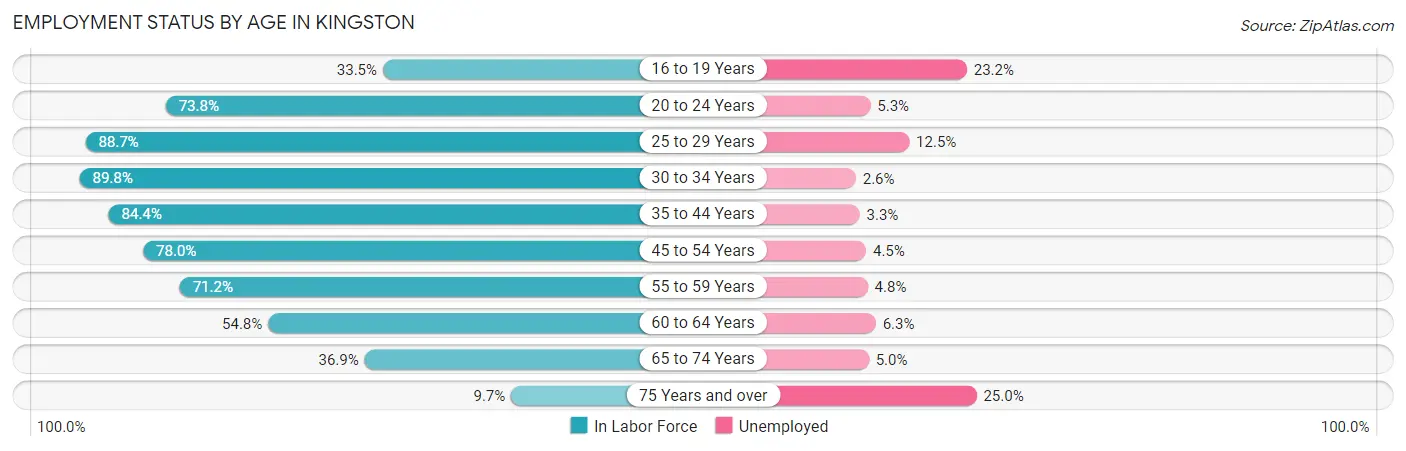
| Age Bracket | In Labor Force | Unemployed |
| 16 to 19 Years | 259 (33.5%) | 60 (23.2%) |
| 20 to 24 Years | 1,207 (73.8%) | 64 (5.3%) |
| 25 to 29 Years | 1,918 (88.7%) | 240 (12.5%) |
| 30 to 34 Years | 2,040 (89.8%) | 53 (2.6%) |
| 35 to 44 Years | 2,625 (84.4%) | 87 (3.3%) |
| 45 to 54 Years | 2,360 (78.0%) | 106 (4.5%) |
| 55 to 59 Years | 790 (71.2%) | 38 (4.8%) |
| 60 to 64 Years | 875 (54.8%) | 55 (6.3%) |
| 65 to 74 Years | 757 (36.9%) | 38 (5.0%) |
| 75 Years and over | 152 (9.7%) | 38 (25.0%) |
| Total | 12,986 (67.3%) | 779 (6.0%) |
Employment Status by Educational Attainment in Kingston
According to labor force statistics for Kingston, 79.9% of individuals (10,606) out of the total population between 25 and 64 years of age (13,274) are in the labor force, with 5.5% or 583 of them being unemployed. The group with the highest labor force participation rate are those with the educational attainment of bachelor's degree or higher, with 91.1% or 3,537 individuals in the labor force. Within the labor force, individuals with high school diploma education have the highest percentage of unemployment, with 11.6% or 355 of them being unemployed.
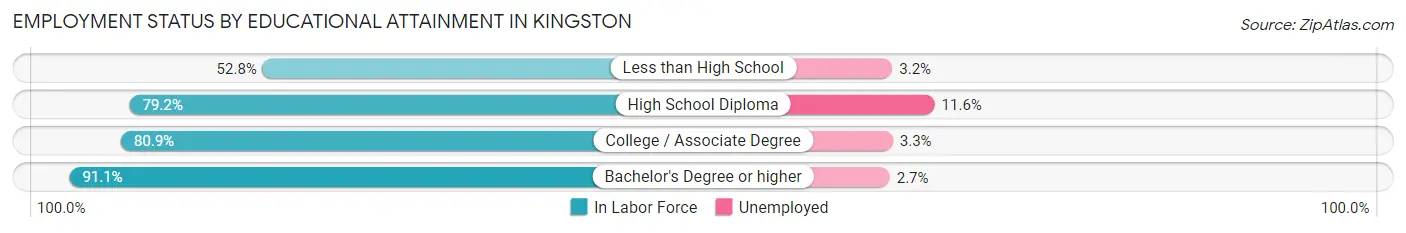
| Educational Attainment | In Labor Force | Unemployed |
| Less than High School | 872 (52.8%) | 53 (3.2%) |
| High School Diploma | 3,064 (79.2%) | 449 (11.6%) |
| College / Associate Degree | 3,132 (80.9%) | 128 (3.3%) |
| Bachelor's Degree or higher | 3,537 (91.1%) | 105 (2.7%) |
| Total | 10,606 (79.9%) | 730 (5.5%) |
Employment Occupations by Sex in Kingston
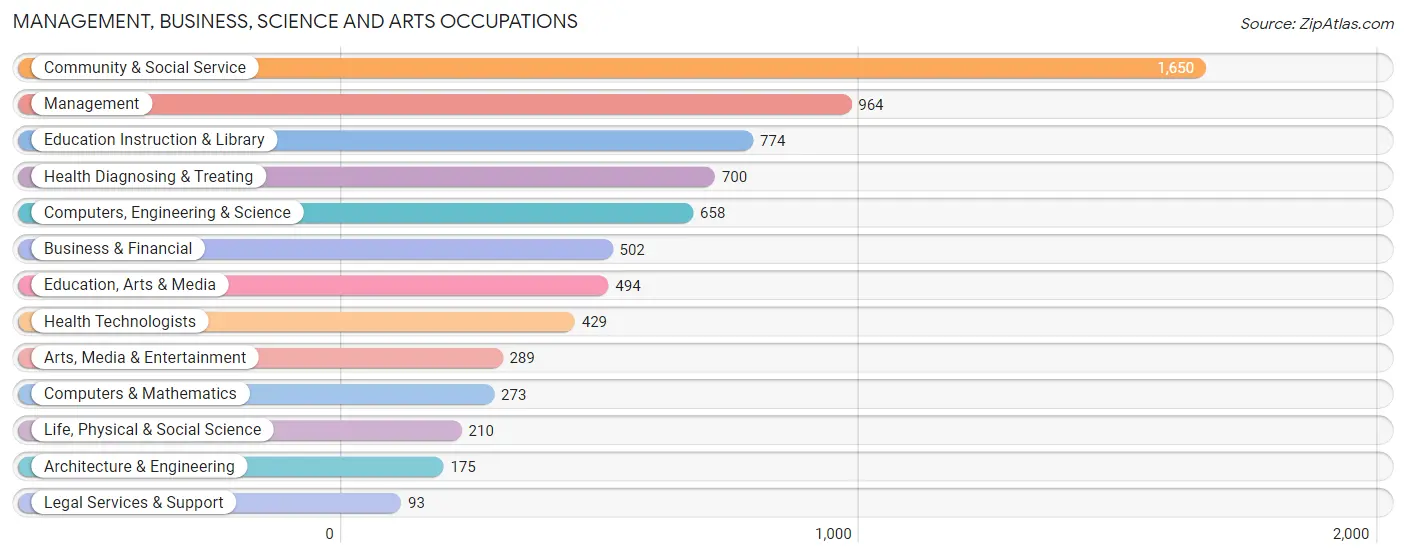
Management, Business, Science and Arts Occupations
The most common Management, Business, Science and Arts occupations in Kingston are Community & Social Service (1,650 | 13.5%), Management (964 | 7.9%), Education Instruction & Library (774 | 6.4%), Health Diagnosing & Treating (700 | 5.7%), and Computers, Engineering & Science (658 | 5.4%).
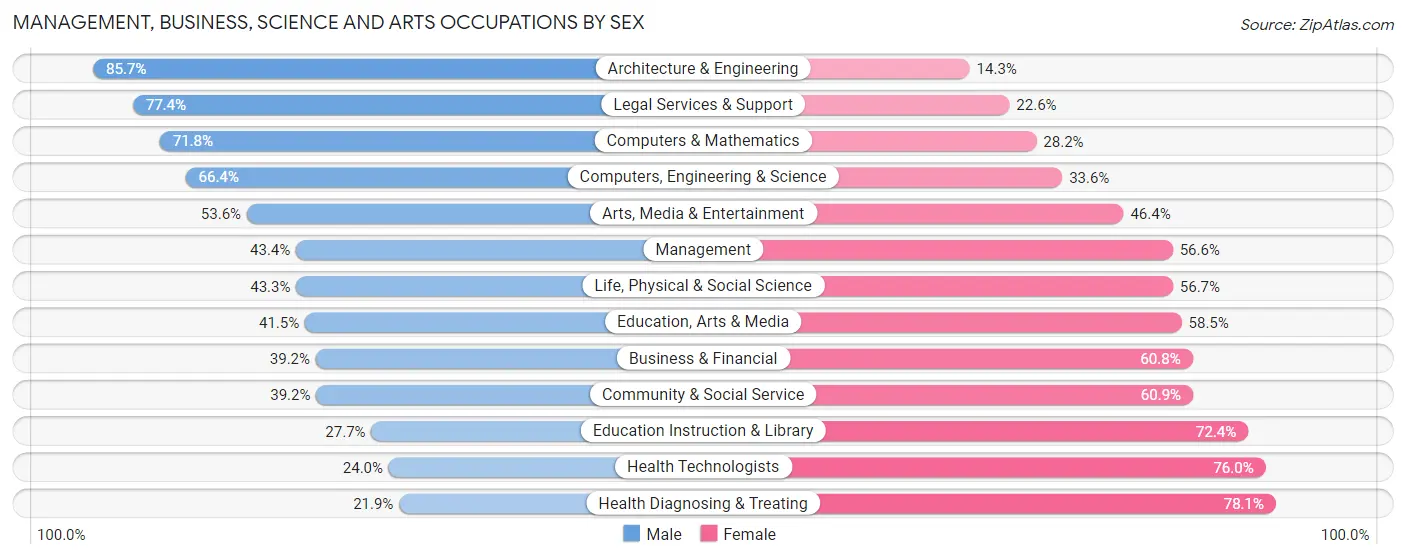
Management, Business, Science and Arts Occupations by Sex
Within the Management, Business, Science and Arts occupations in Kingston, the most male-oriented occupations are Architecture & Engineering (85.7%), Legal Services & Support (77.4%), and Computers & Mathematics (71.8%), while the most female-oriented occupations are Health Diagnosing & Treating (78.1%), Health Technologists (76.0%), and Education Instruction & Library (72.4%).
| Occupation | Male | Female |
| Management | 418 (43.4%) | 546 (56.6%) |
| Business & Financial | 197 (39.2%) | 305 (60.8%) |
| Computers, Engineering & Science | 437 (66.4%) | 221 (33.6%) |
| Computers & Mathematics | 196 (71.8%) | 77 (28.2%) |
| Architecture & Engineering | 150 (85.7%) | 25 (14.3%) |
| Life, Physical & Social Science | 91 (43.3%) | 119 (56.7%) |
| Community & Social Service | 646 (39.2%) | 1,004 (60.9%) |
| Education, Arts & Media | 205 (41.5%) | 289 (58.5%) |
| Legal Services & Support | 72 (77.4%) | 21 (22.6%) |
| Education Instruction & Library | 214 (27.7%) | 560 (72.4%) |
| Arts, Media & Entertainment | 155 (53.6%) | 134 (46.4%) |
| Health Diagnosing & Treating | 153 (21.9%) | 547 (78.1%) |
| Health Technologists | 103 (24.0%) | 326 (76.0%) |
| Total (Category) | 1,851 (41.4%) | 2,623 (58.6%) |
| Total (Overall) | 5,996 (49.2%) | 6,202 (50.8%) |
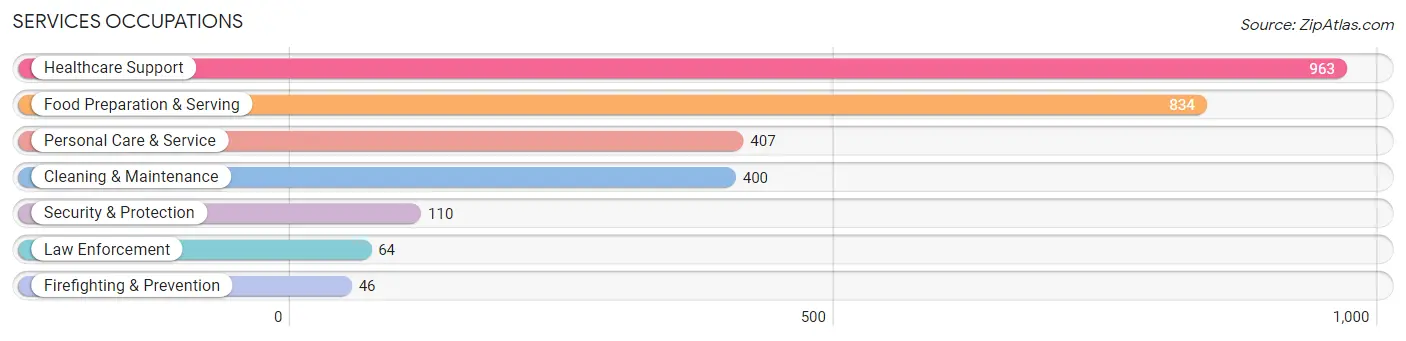
Services Occupations
The most common Services occupations in Kingston are Healthcare Support (963 | 7.9%), Food Preparation & Serving (834 | 6.8%), Personal Care & Service (407 | 3.3%), Cleaning & Maintenance (400 | 3.3%), and Security & Protection (110 | 0.9%).
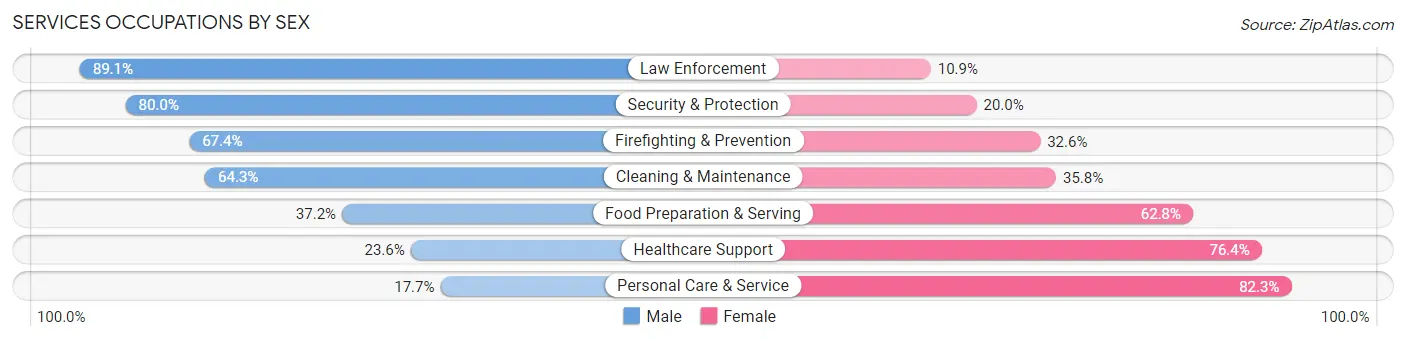
Services Occupations by Sex
Within the Services occupations in Kingston, the most male-oriented occupations are Law Enforcement (89.1%), Security & Protection (80.0%), and Firefighting & Prevention (67.4%), while the most female-oriented occupations are Personal Care & Service (82.3%), Healthcare Support (76.4%), and Food Preparation & Serving (62.8%).
| Occupation | Male | Female |
| Healthcare Support | 227 (23.6%) | 736 (76.4%) |
| Security & Protection | 88 (80.0%) | 22 (20.0%) |
| Firefighting & Prevention | 31 (67.4%) | 15 (32.6%) |
| Law Enforcement | 57 (89.1%) | 7 (10.9%) |
| Food Preparation & Serving | 310 (37.2%) | 524 (62.8%) |
| Cleaning & Maintenance | 257 (64.2%) | 143 (35.7%) |
| Personal Care & Service | 72 (17.7%) | 335 (82.3%) |
| Total (Category) | 954 (35.1%) | 1,760 (64.8%) |
| Total (Overall) | 5,996 (49.2%) | 6,202 (50.8%) |
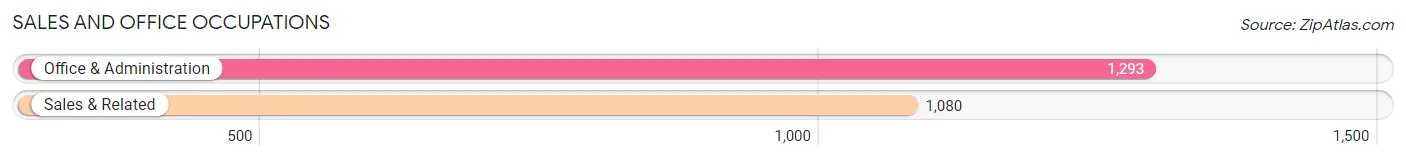
Sales and Office Occupations
The most common Sales and Office occupations in Kingston are Office & Administration (1,293 | 10.6%), and Sales & Related (1,080 | 8.8%).
Sales and Office Occupations by Sex
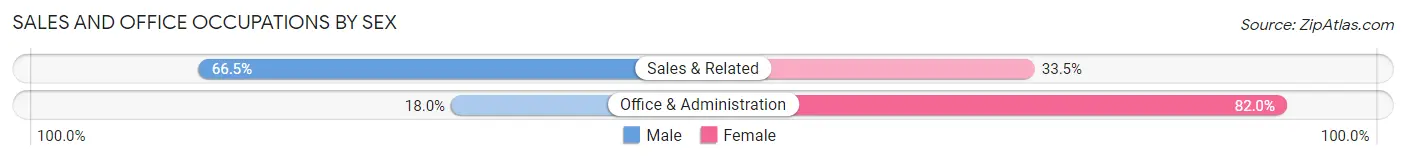
| Occupation | Male | Female |
| Sales & Related | 718 (66.5%) | 362 (33.5%) |
| Office & Administration | 233 (18.0%) | 1,060 (82.0%) |
| Total (Category) | 951 (40.1%) | 1,422 (59.9%) |
| Total (Overall) | 5,996 (49.2%) | 6,202 (50.8%) |
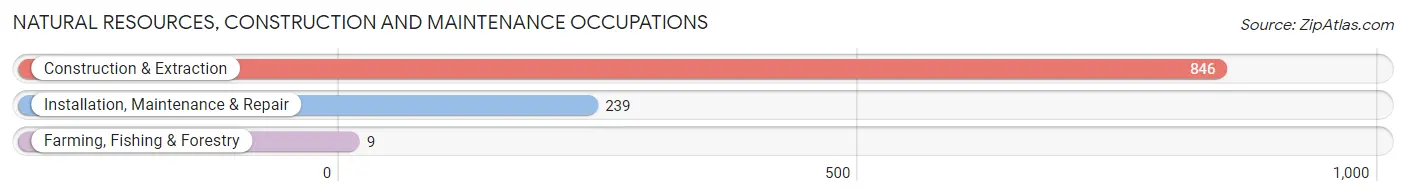
Natural Resources, Construction and Maintenance Occupations
The most common Natural Resources, Construction and Maintenance occupations in Kingston are Construction & Extraction (846 | 6.9%), Installation, Maintenance & Repair (239 | 2.0%), and Farming, Fishing & Forestry (9 | 0.1%).
Natural Resources, Construction and Maintenance Occupations by Sex
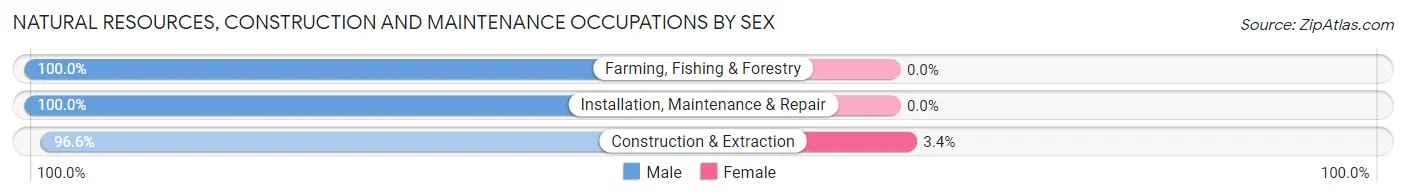
| Occupation | Male | Female |
| Farming, Fishing & Forestry | 9 (100.0%) | 0 (0.0%) |
| Construction & Extraction | 817 (96.6%) | 29 (3.4%) |
| Installation, Maintenance & Repair | 239 (100.0%) | 0 (0.0%) |
| Total (Category) | 1,065 (97.4%) | 29 (2.6%) |
| Total (Overall) | 5,996 (49.2%) | 6,202 (50.8%) |
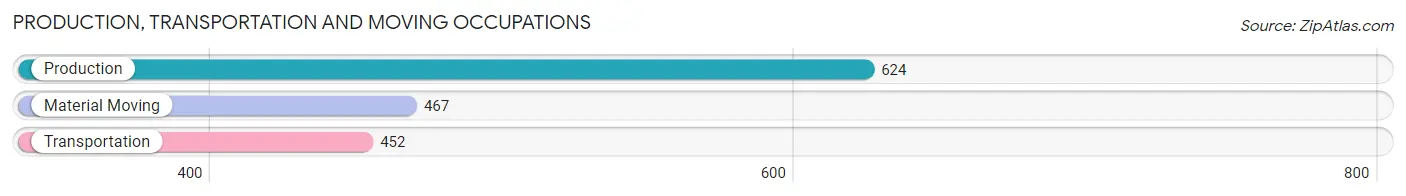
Production, Transportation and Moving Occupations
The most common Production, Transportation and Moving occupations in Kingston are Production (624 | 5.1%), Material Moving (467 | 3.8%), and Transportation (452 | 3.7%).
Production, Transportation and Moving Occupations by Sex
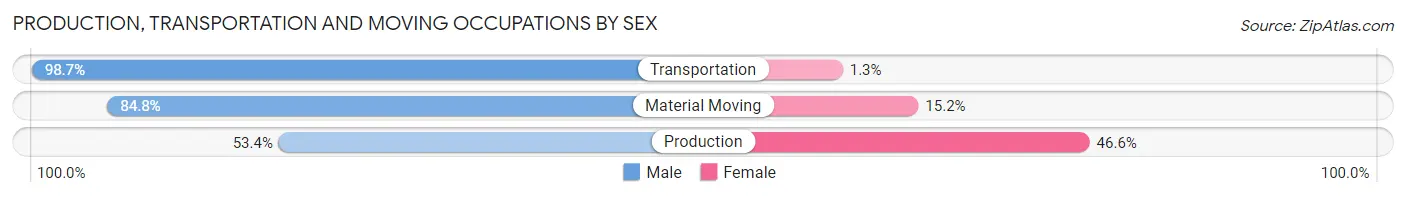
| Occupation | Male | Female |
| Production | 333 (53.4%) | 291 (46.6%) |
| Transportation | 446 (98.7%) | 6 (1.3%) |
| Material Moving | 396 (84.8%) | 71 (15.2%) |
| Total (Category) | 1,175 (76.1%) | 368 (23.8%) |
| Total (Overall) | 5,996 (49.2%) | 6,202 (50.8%) |
Employment Industries by Sex in Kingston
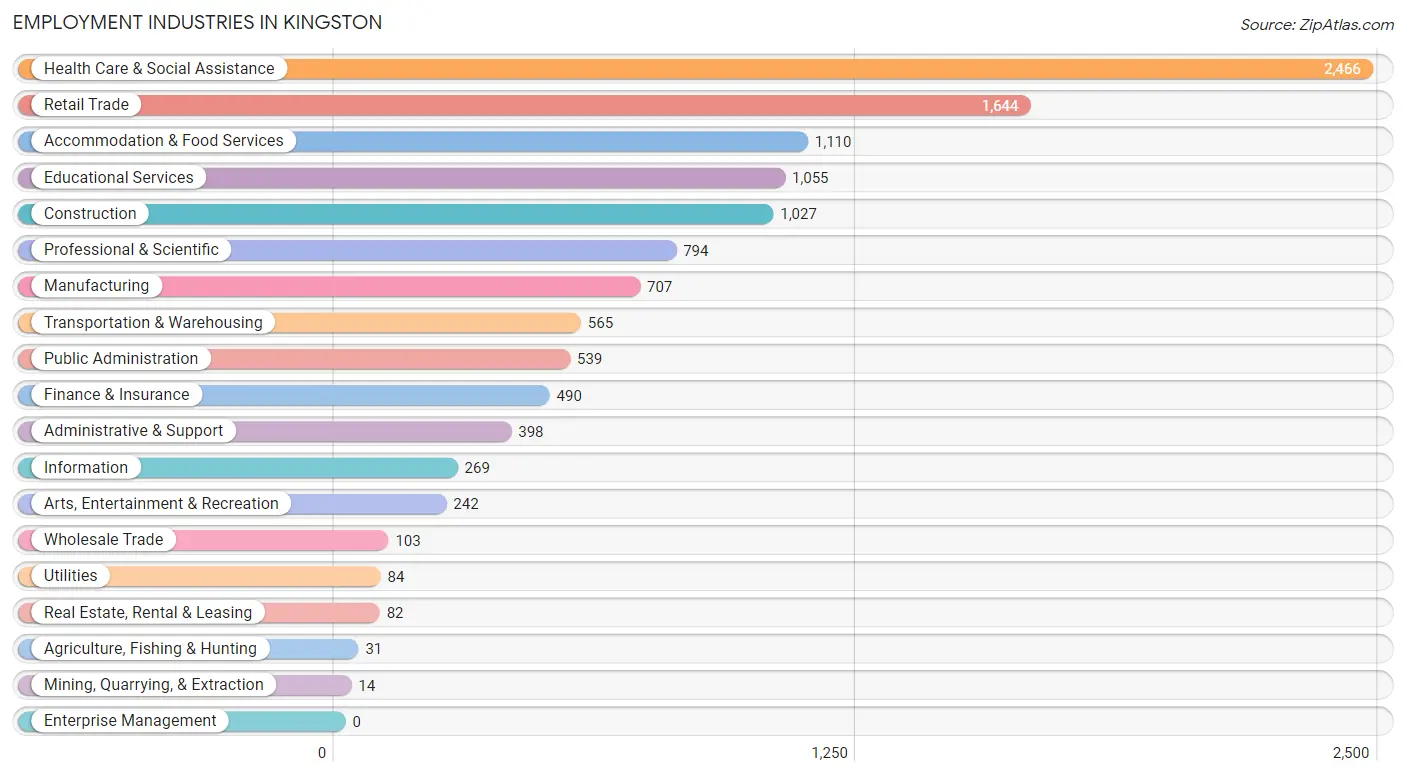
Employment Industries in Kingston
The major employment industries in Kingston include Health Care & Social Assistance (2,466 | 20.2%), Retail Trade (1,644 | 13.5%), Accommodation & Food Services (1,110 | 9.1%), Educational Services (1,055 | 8.6%), and Construction (1,027 | 8.4%).
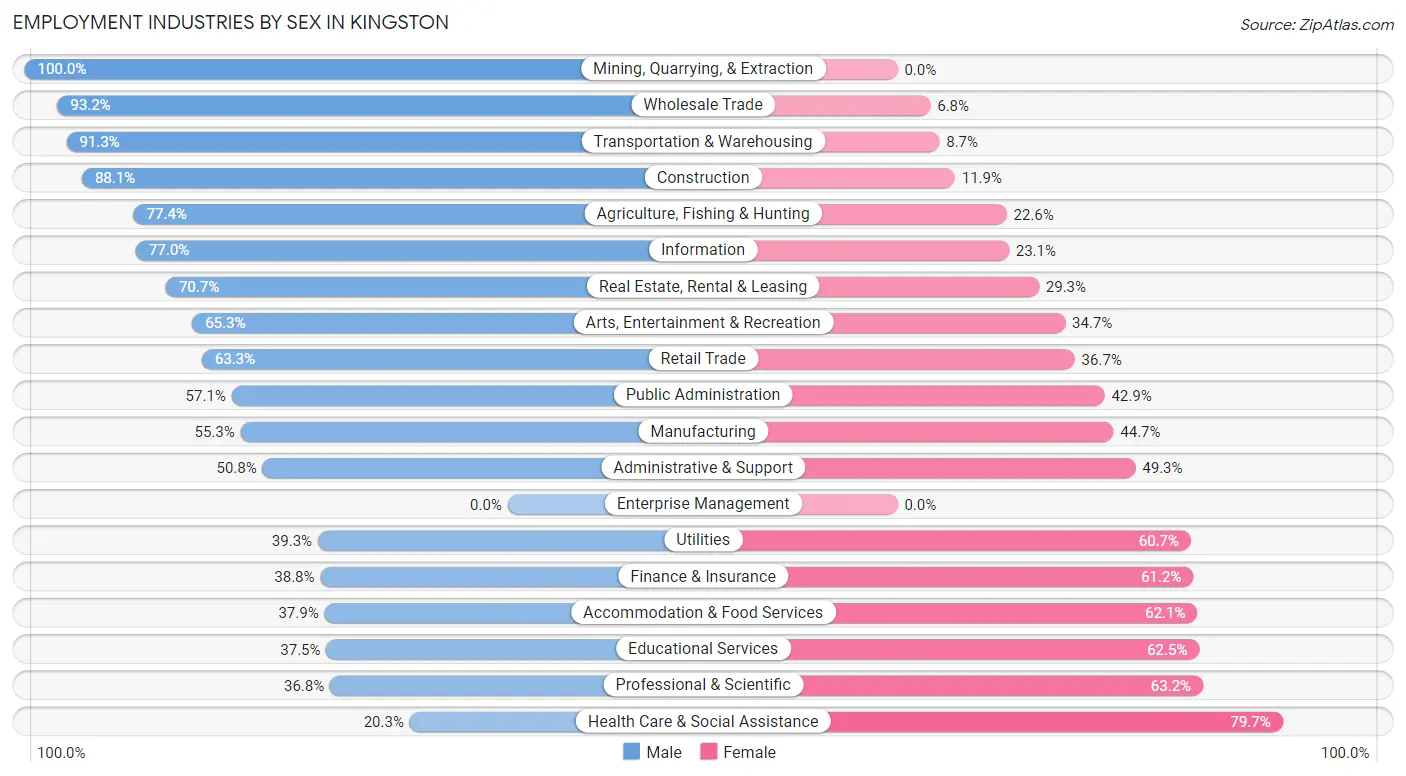
Employment Industries by Sex in Kingston
The Kingston industries that see more men than women are Mining, Quarrying, & Extraction (100.0%), Wholesale Trade (93.2%), and Transportation & Warehousing (91.3%), whereas the industries that tend to have a higher number of women are Health Care & Social Assistance (79.7%), Professional & Scientific (63.2%), and Educational Services (62.5%).
| Industry | Male | Female |
| Agriculture, Fishing & Hunting | 24 (77.4%) | 7 (22.6%) |
| Mining, Quarrying, & Extraction | 14 (100.0%) | 0 (0.0%) |
| Construction | 905 (88.1%) | 122 (11.9%) |
| Manufacturing | 391 (55.3%) | 316 (44.7%) |
| Wholesale Trade | 96 (93.2%) | 7 (6.8%) |
| Retail Trade | 1,041 (63.3%) | 603 (36.7%) |
| Transportation & Warehousing | 516 (91.3%) | 49 (8.7%) |
| Utilities | 33 (39.3%) | 51 (60.7%) |
| Information | 207 (76.9%) | 62 (23.1%) |
| Finance & Insurance | 190 (38.8%) | 300 (61.2%) |
| Real Estate, Rental & Leasing | 58 (70.7%) | 24 (29.3%) |
| Professional & Scientific | 292 (36.8%) | 502 (63.2%) |
| Enterprise Management | 0 (0.0%) | 0 (0.0%) |
| Administrative & Support | 202 (50.7%) | 196 (49.2%) |
| Educational Services | 396 (37.5%) | 659 (62.5%) |
| Health Care & Social Assistance | 500 (20.3%) | 1,966 (79.7%) |
| Arts, Entertainment & Recreation | 158 (65.3%) | 84 (34.7%) |
| Accommodation & Food Services | 421 (37.9%) | 689 (62.1%) |
| Public Administration | 308 (57.1%) | 231 (42.9%) |
| Total | 5,996 (49.2%) | 6,202 (50.8%) |
Education in Kingston
School Enrollment in Kingston
The most common levels of schooling among the 4,994 students in Kingston are middle school (1,190 | 23.8%), college / undergraduate (1,061 | 21.2%), and elementary school (1,009 | 20.2%).
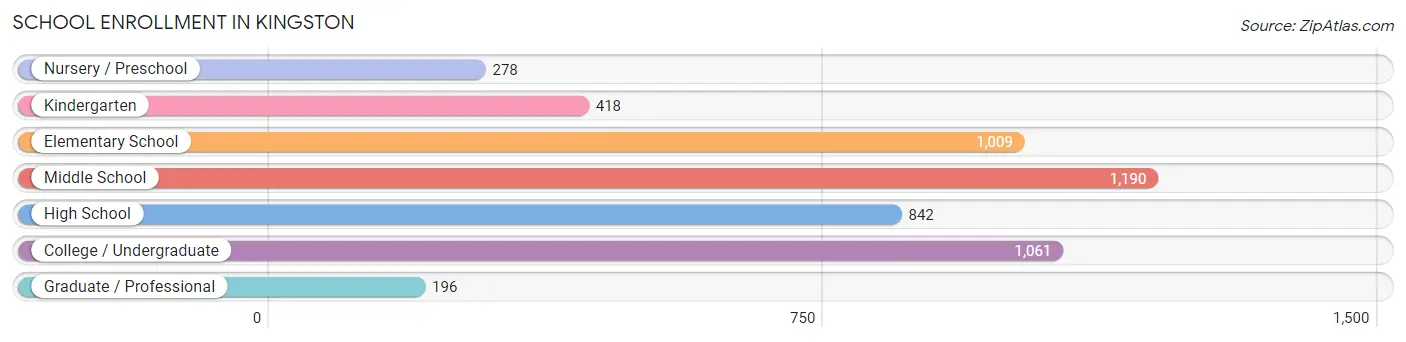
| School Level | # Students | % Students |
| Nursery / Preschool | 278 | 5.6% |
| Kindergarten | 418 | 8.4% |
| Elementary School | 1,009 | 20.2% |
| Middle School | 1,190 | 23.8% |
| High School | 842 | 16.9% |
| College / Undergraduate | 1,061 | 21.2% |
| Graduate / Professional | 196 | 3.9% |
| Total | 4,994 | 100.0% |
School Enrollment by Age by Funding Source in Kingston
Out of a total of 4,994 students who are enrolled in schools in Kingston, 769 (15.4%) attend a private institution, while the remaining 4,225 (84.6%) are enrolled in public schools. The age group of 3 to 4 year olds has the highest likelihood of being enrolled in private schools, with 92 (39.3% in the age bracket) enrolled. Conversely, the age group of 10 to 14 year olds has the lowest likelihood of being enrolled in a private school, with 1,335 (91.6% in the age bracket) attending a public institution.
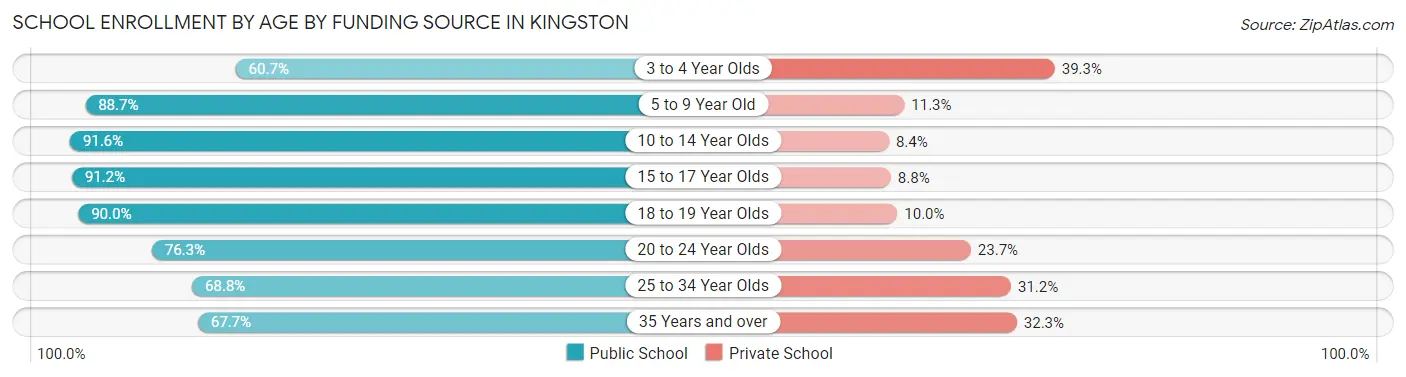
| Age Bracket | Public School | Private School |
| 3 to 4 Year Olds | 142 (60.7%) | 92 (39.3%) |
| 5 to 9 Year Old | 1,193 (88.7%) | 152 (11.3%) |
| 10 to 14 Year Olds | 1,335 (91.6%) | 123 (8.4%) |
| 15 to 17 Year Olds | 518 (91.2%) | 50 (8.8%) |
| 18 to 19 Year Olds | 198 (90.0%) | 22 (10.0%) |
| 20 to 24 Year Olds | 396 (76.3%) | 123 (23.7%) |
| 25 to 34 Year Olds | 298 (68.8%) | 135 (31.2%) |
| 35 Years and over | 147 (67.7%) | 70 (32.3%) |
| Total | 4,225 (84.6%) | 769 (15.4%) |
Educational Attainment by Field of Study in Kingston
Education (777 | 14.6%), visual & performing arts (739 | 13.9%), business (708 | 13.3%), social sciences (682 | 12.8%), and literature & languages (315 | 5.9%) are the most common fields of study among 5,312 individuals in Kingston who have obtained a bachelor's degree or higher.
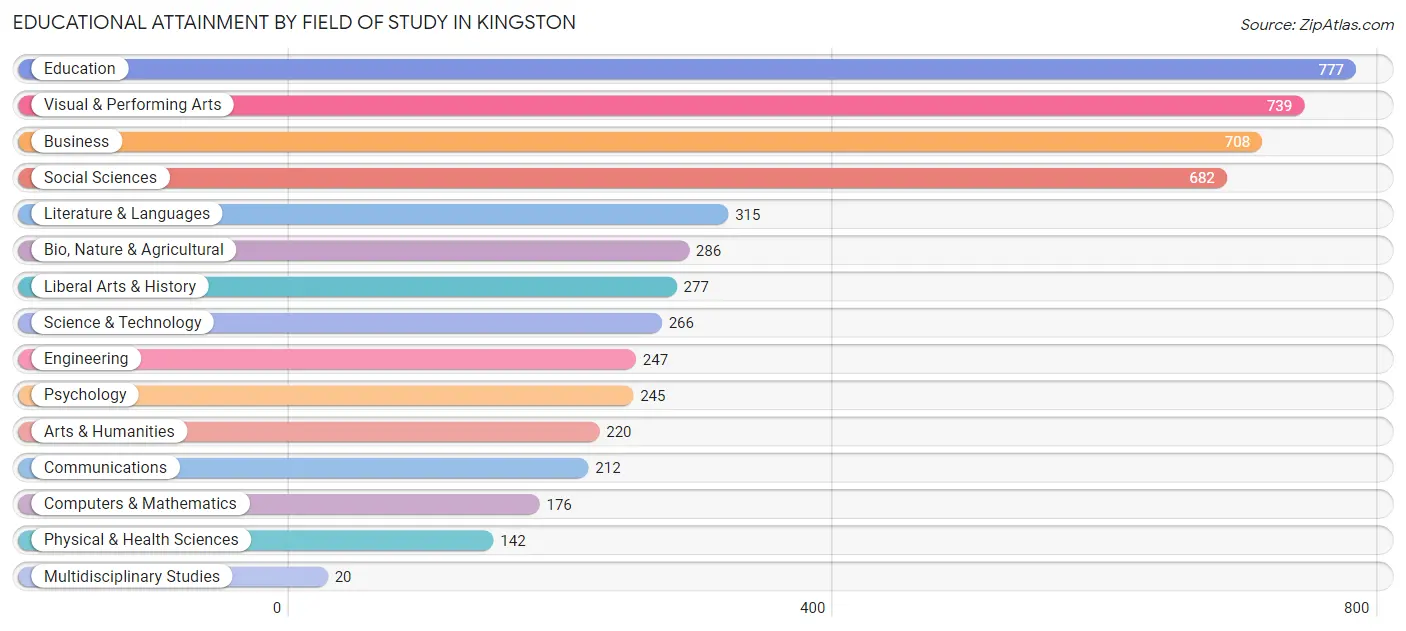
| Field of Study | # Graduates | % Graduates |
| Computers & Mathematics | 176 | 3.3% |
| Bio, Nature & Agricultural | 286 | 5.4% |
| Physical & Health Sciences | 142 | 2.7% |
| Psychology | 245 | 4.6% |
| Social Sciences | 682 | 12.8% |
| Engineering | 247 | 4.6% |
| Multidisciplinary Studies | 20 | 0.4% |
| Science & Technology | 266 | 5.0% |
| Business | 708 | 13.3% |
| Education | 777 | 14.6% |
| Literature & Languages | 315 | 5.9% |
| Liberal Arts & History | 277 | 5.2% |
| Visual & Performing Arts | 739 | 13.9% |
| Communications | 212 | 4.0% |
| Arts & Humanities | 220 | 4.1% |
| Total | 5,312 | 100.0% |
Transportation & Commute in Kingston
Vehicle Availability by Sex in Kingston
The most prevalent vehicle ownership categories in Kingston are males with 2 vehicles (2,325, accounting for 39.7%) and females with 2 vehicles (2,508, making up 39.3%).
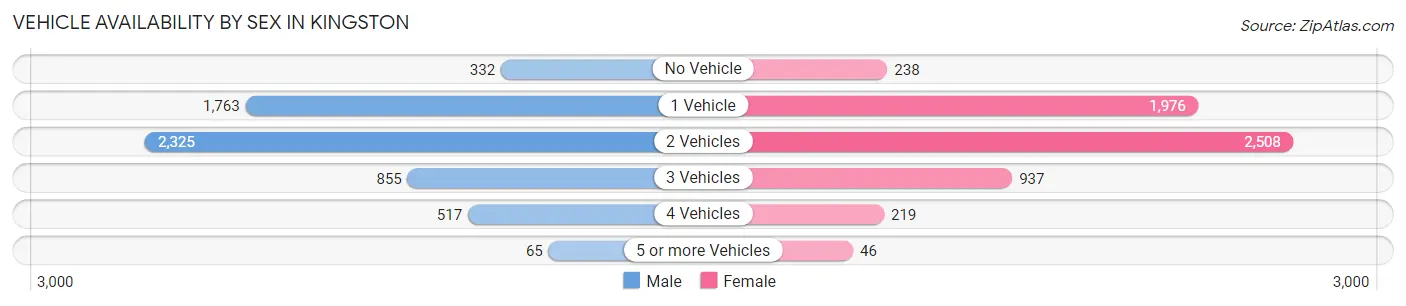
| Vehicles Available | Male | Female |
| No Vehicle | 332 (5.7%) | 238 (4.0%) |
| 1 Vehicle | 1,763 (30.1%) | 1,976 (33.4%) |
| 2 Vehicles | 2,325 (39.7%) | 2,508 (42.3%) |
| 3 Vehicles | 855 (14.6%) | 937 (15.8%) |
| 4 Vehicles | 517 (8.8%) | 219 (3.7%) |
| 5 or more Vehicles | 65 (1.1%) | 46 (0.8%) |
| Total | 5,857 (100.0%) | 5,924 (100.0%) |
Commute Time in Kingston
The most frequently occuring commute durations in Kingston are 10 to 14 minutes (2,081 commuters, 19.8%), 15 to 19 minutes (1,962 commuters, 18.7%), and 5 to 9 minutes (1,447 commuters, 13.8%).
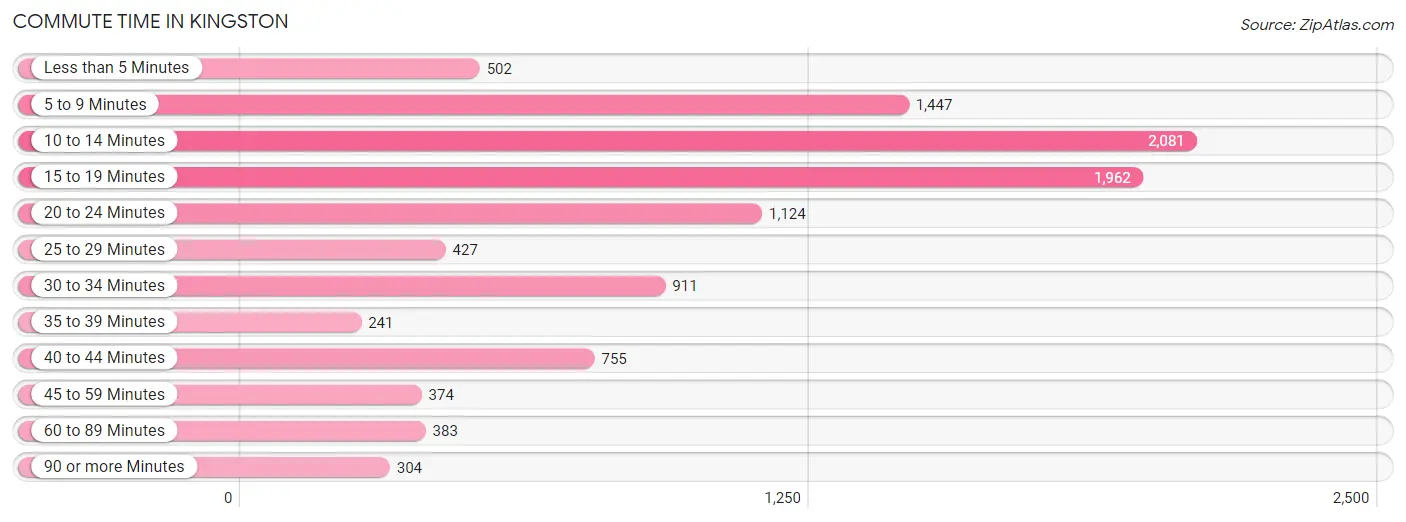
| Commute Time | # Commuters | % Commuters |
| Less than 5 Minutes | 502 | 4.8% |
| 5 to 9 Minutes | 1,447 | 13.8% |
| 10 to 14 Minutes | 2,081 | 19.8% |
| 15 to 19 Minutes | 1,962 | 18.7% |
| 20 to 24 Minutes | 1,124 | 10.7% |
| 25 to 29 Minutes | 427 | 4.1% |
| 30 to 34 Minutes | 911 | 8.7% |
| 35 to 39 Minutes | 241 | 2.3% |
| 40 to 44 Minutes | 755 | 7.2% |
| 45 to 59 Minutes | 374 | 3.6% |
| 60 to 89 Minutes | 383 | 3.6% |
| 90 or more Minutes | 304 | 2.9% |
Commute Time by Sex in Kingston
The most common commute times in Kingston are 15 to 19 minutes (890 commuters, 17.0%) for males and 10 to 14 minutes (1,264 commuters, 24.0%) for females.
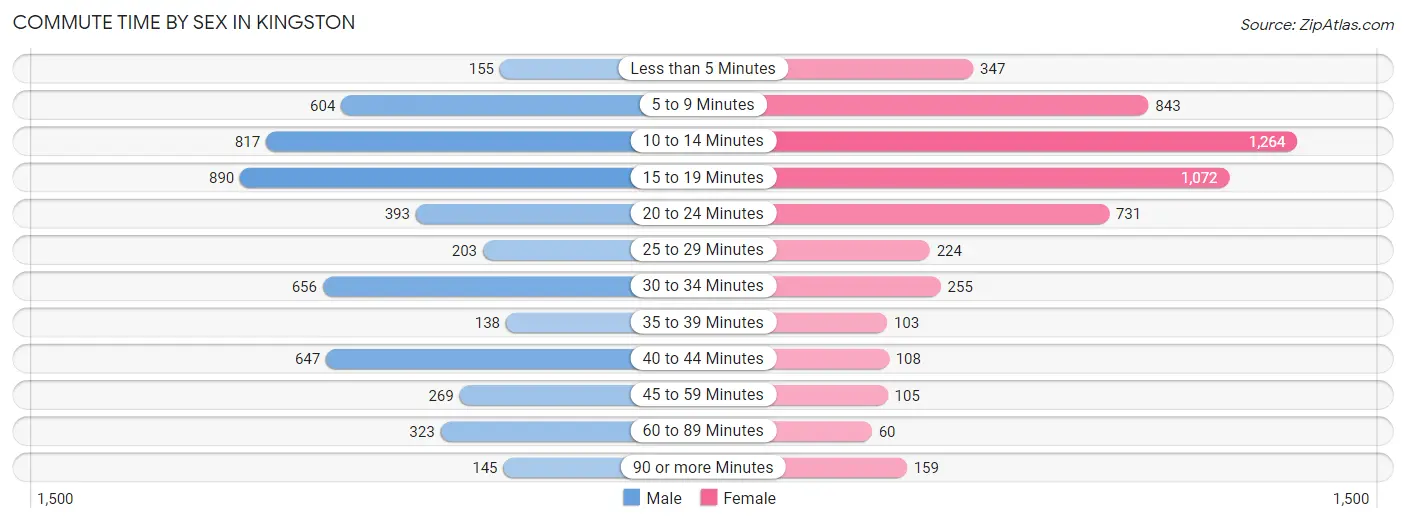
| Commute Time | Male | Female |
| Less than 5 Minutes | 155 (3.0%) | 347 (6.6%) |
| 5 to 9 Minutes | 604 (11.5%) | 843 (16.0%) |
| 10 to 14 Minutes | 817 (15.6%) | 1,264 (24.0%) |
| 15 to 19 Minutes | 890 (17.0%) | 1,072 (20.3%) |
| 20 to 24 Minutes | 393 (7.5%) | 731 (13.9%) |
| 25 to 29 Minutes | 203 (3.9%) | 224 (4.3%) |
| 30 to 34 Minutes | 656 (12.5%) | 255 (4.8%) |
| 35 to 39 Minutes | 138 (2.6%) | 103 (1.9%) |
| 40 to 44 Minutes | 647 (12.3%) | 108 (2.1%) |
| 45 to 59 Minutes | 269 (5.1%) | 105 (2.0%) |
| 60 to 89 Minutes | 323 (6.2%) | 60 (1.1%) |
| 90 or more Minutes | 145 (2.8%) | 159 (3.0%) |
Time of Departure to Work by Sex in Kingston
The most frequent times of departure to work in Kingston are 6:00 AM to 6:29 AM (762, 14.5%) for males and 7:30 AM to 7:59 AM (1,000, 19.0%) for females.
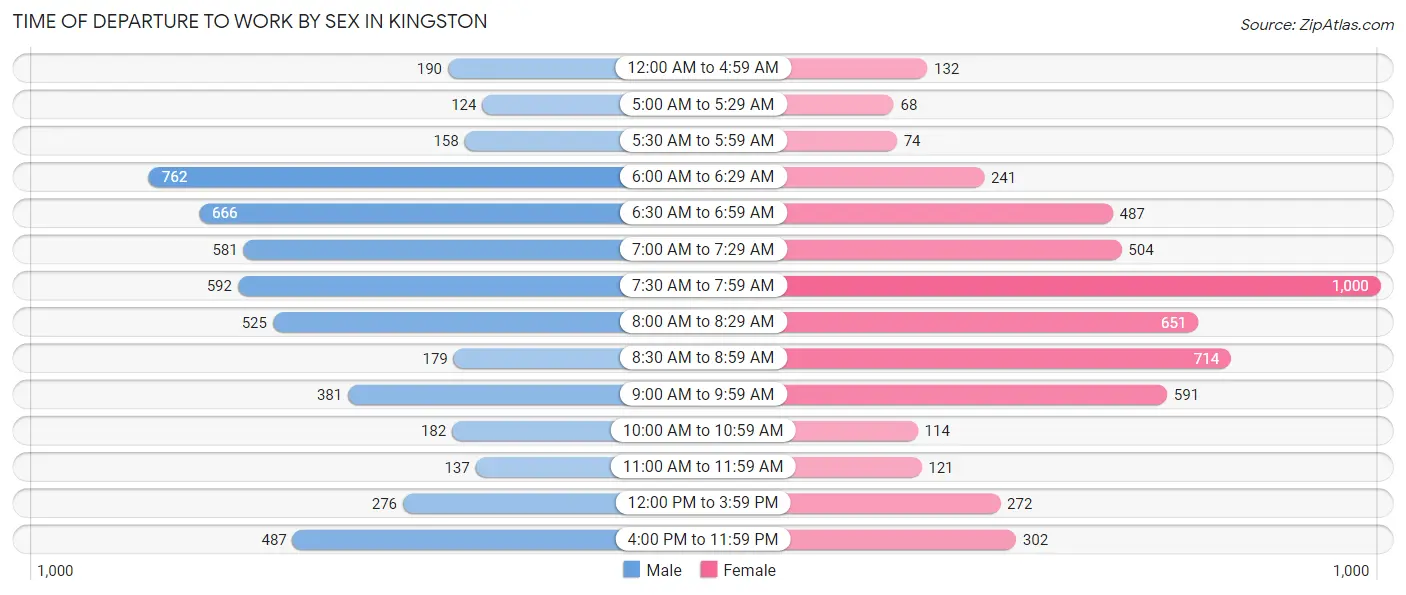
| Time of Departure | Male | Female |
| 12:00 AM to 4:59 AM | 190 (3.6%) | 132 (2.5%) |
| 5:00 AM to 5:29 AM | 124 (2.4%) | 68 (1.3%) |
| 5:30 AM to 5:59 AM | 158 (3.0%) | 74 (1.4%) |
| 6:00 AM to 6:29 AM | 762 (14.5%) | 241 (4.6%) |
| 6:30 AM to 6:59 AM | 666 (12.7%) | 487 (9.2%) |
| 7:00 AM to 7:29 AM | 581 (11.1%) | 504 (9.6%) |
| 7:30 AM to 7:59 AM | 592 (11.3%) | 1,000 (19.0%) |
| 8:00 AM to 8:29 AM | 525 (10.0%) | 651 (12.3%) |
| 8:30 AM to 8:59 AM | 179 (3.4%) | 714 (13.6%) |
| 9:00 AM to 9:59 AM | 381 (7.3%) | 591 (11.2%) |
| 10:00 AM to 10:59 AM | 182 (3.5%) | 114 (2.2%) |
| 11:00 AM to 11:59 AM | 137 (2.6%) | 121 (2.3%) |
| 12:00 PM to 3:59 PM | 276 (5.3%) | 272 (5.2%) |
| 4:00 PM to 11:59 PM | 487 (9.3%) | 302 (5.7%) |
| Total | 5,240 (100.0%) | 5,271 (100.0%) |
Housing Occupancy in Kingston
Occupancy by Ownership in Kingston
Of the total 9,821 dwellings in Kingston, owner-occupied units account for 4,686 (47.7%), while renter-occupied units make up 5,135 (52.3%).
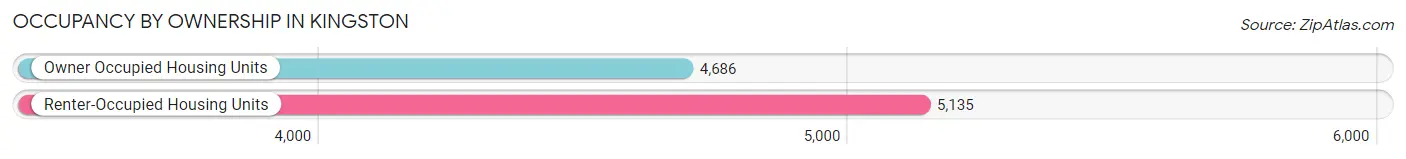
| Occupancy | # Housing Units | % Housing Units |
| Owner Occupied Housing Units | 4,686 | 47.7% |
| Renter-Occupied Housing Units | 5,135 | 52.3% |
| Total Occupied Housing Units | 9,821 | 100.0% |
Occupancy by Household Size in Kingston
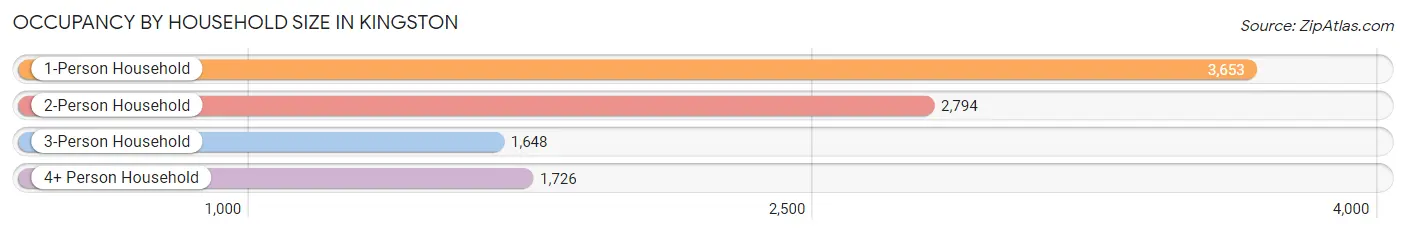
| Household Size | # Housing Units | % Housing Units |
| 1-Person Household | 3,653 | 37.2% |
| 2-Person Household | 2,794 | 28.4% |
| 3-Person Household | 1,648 | 16.8% |
| 4+ Person Household | 1,726 | 17.6% |
| Total Housing Units | 9,821 | 100.0% |
Occupancy by Ownership by Household Size in Kingston
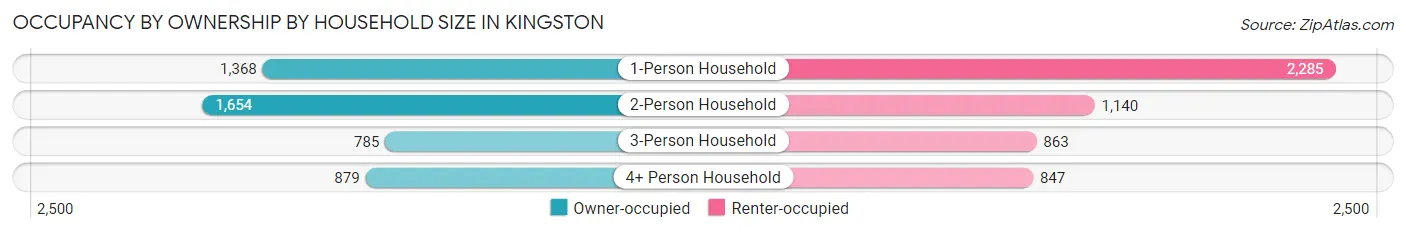
| Household Size | Owner-occupied | Renter-occupied |
| 1-Person Household | 1,368 (37.4%) | 2,285 (62.5%) |
| 2-Person Household | 1,654 (59.2%) | 1,140 (40.8%) |
| 3-Person Household | 785 (47.6%) | 863 (52.4%) |
| 4+ Person Household | 879 (50.9%) | 847 (49.1%) |
| Total Housing Units | 4,686 (47.7%) | 5,135 (52.3%) |
Occupancy by Educational Attainment in Kingston
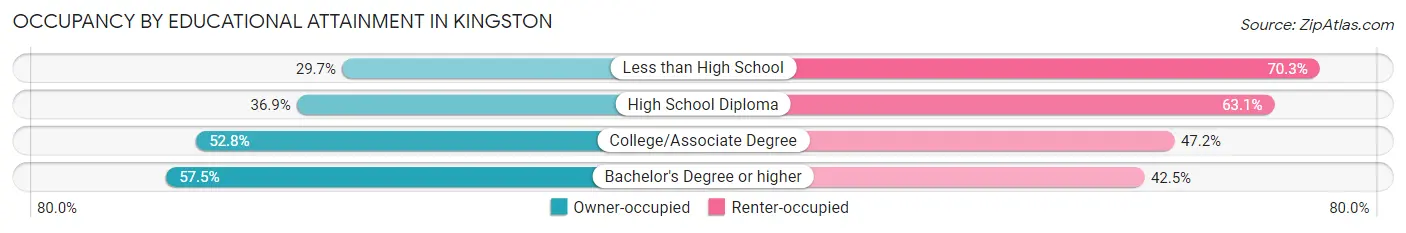
| Household Size | Owner-occupied | Renter-occupied |
| Less than High School | 288 (29.7%) | 682 (70.3%) |
| High School Diploma | 993 (36.9%) | 1,700 (63.1%) |
| College/Associate Degree | 1,525 (52.8%) | 1,365 (47.2%) |
| Bachelor's Degree or higher | 1,880 (57.5%) | 1,388 (42.5%) |
Occupancy by Age of Householder in Kingston
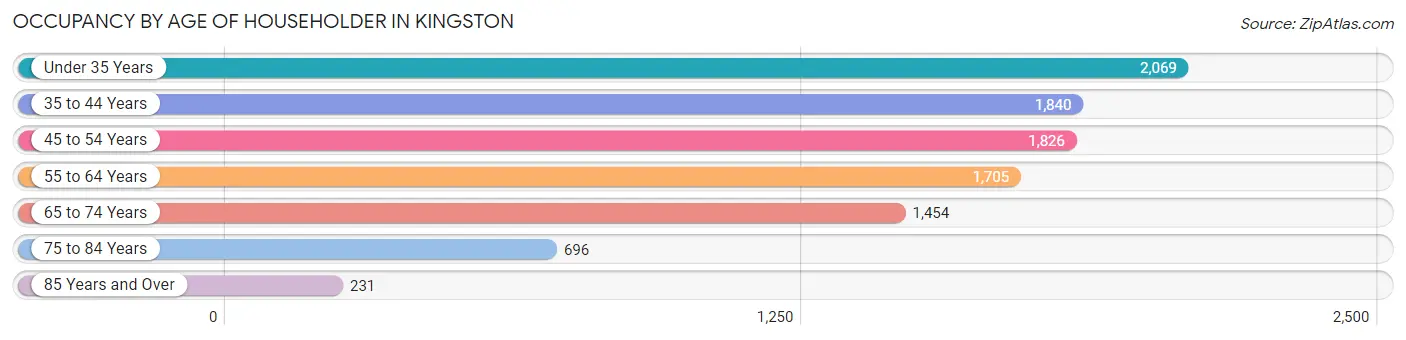
| Age Bracket | # Households | % Households |
| Under 35 Years | 2,069 | 21.1% |
| 35 to 44 Years | 1,840 | 18.7% |
| 45 to 54 Years | 1,826 | 18.6% |
| 55 to 64 Years | 1,705 | 17.4% |
| 65 to 74 Years | 1,454 | 14.8% |
| 75 to 84 Years | 696 | 7.1% |
| 85 Years and Over | 231 | 2.4% |
| Total | 9,821 | 100.0% |
Housing Finances in Kingston
Median Income by Occupancy in Kingston
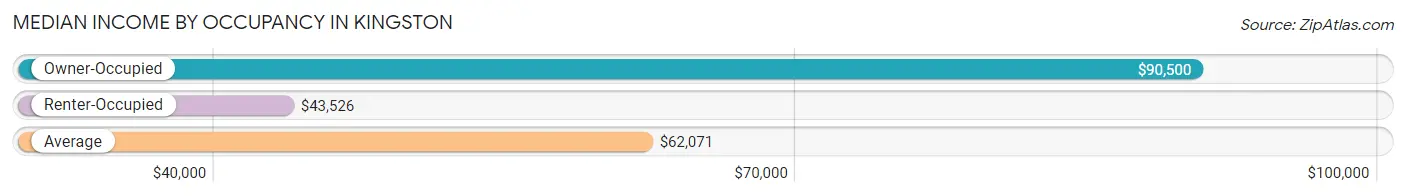
| Occupancy Type | # Households | Median Income |
| Owner-Occupied | 4,686 (47.7%) | $90,500 |
| Renter-Occupied | 5,135 (52.3%) | $43,526 |
| Average | 9,821 (100.0%) | $62,071 |
Occupancy by Householder Income Bracket in Kingston
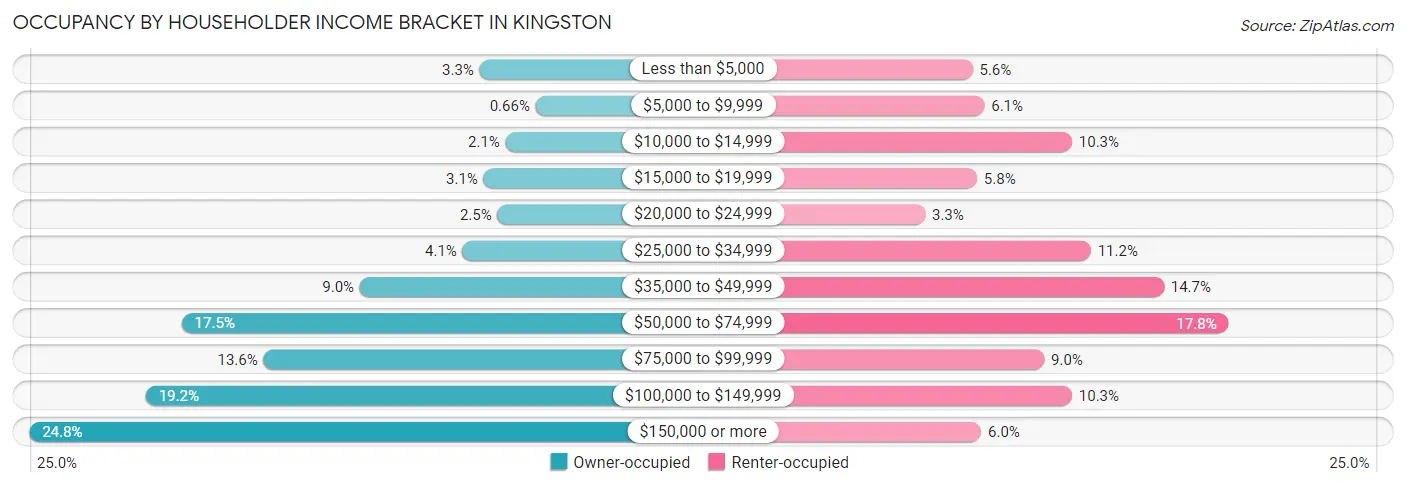
| Income Bracket | Owner-occupied | Renter-occupied |
| Less than $5,000 | 156 (3.3%) | 286 (5.6%) |
| $5,000 to $9,999 | 31 (0.7%) | 315 (6.1%) |
| $10,000 to $14,999 | 98 (2.1%) | 529 (10.3%) |
| $15,000 to $19,999 | 147 (3.1%) | 297 (5.8%) |
| $20,000 to $24,999 | 116 (2.5%) | 170 (3.3%) |
| $25,000 to $34,999 | 194 (4.1%) | 575 (11.2%) |
| $35,000 to $49,999 | 423 (9.0%) | 754 (14.7%) |
| $50,000 to $74,999 | 821 (17.5%) | 912 (17.8%) |
| $75,000 to $99,999 | 638 (13.6%) | 461 (9.0%) |
| $100,000 to $149,999 | 901 (19.2%) | 529 (10.3%) |
| $150,000 or more | 1,161 (24.8%) | 307 (6.0%) |
| Total | 4,686 (100.0%) | 5,135 (100.0%) |
Monthly Housing Cost Tiers in Kingston
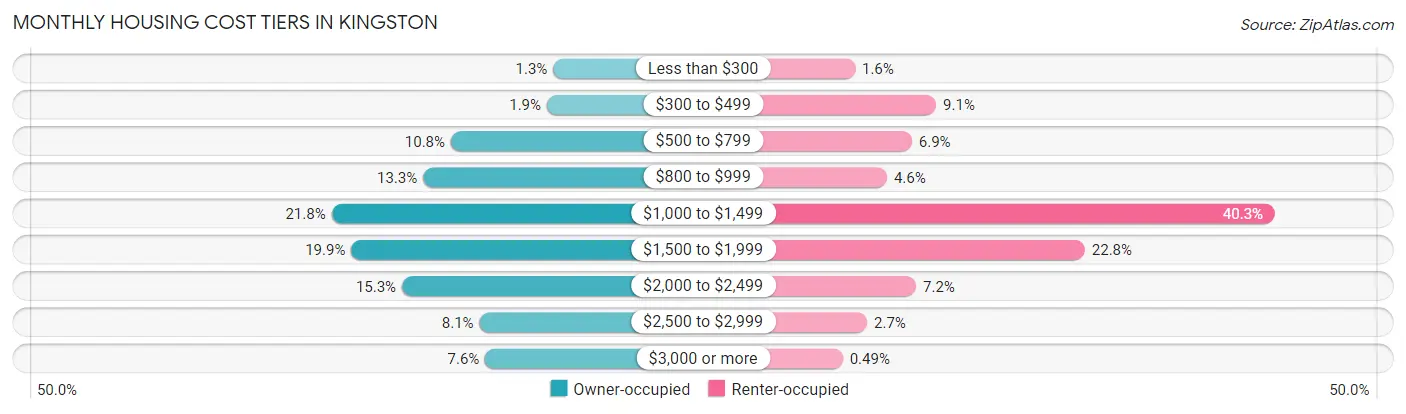
| Monthly Cost | Owner-occupied | Renter-occupied |
| Less than $300 | 63 (1.3%) | 83 (1.6%) |
| $300 to $499 | 90 (1.9%) | 467 (9.1%) |
| $500 to $799 | 504 (10.8%) | 352 (6.9%) |
| $800 to $999 | 624 (13.3%) | 234 (4.6%) |
| $1,000 to $1,499 | 1,019 (21.7%) | 2,068 (40.3%) |
| $1,500 to $1,999 | 934 (19.9%) | 1,170 (22.8%) |
| $2,000 to $2,499 | 715 (15.3%) | 372 (7.2%) |
| $2,500 to $2,999 | 381 (8.1%) | 140 (2.7%) |
| $3,000 or more | 356 (7.6%) | 25 (0.5%) |
| Total | 4,686 (100.0%) | 5,135 (100.0%) |
Physical Housing Characteristics in Kingston
Housing Structures in Kingston
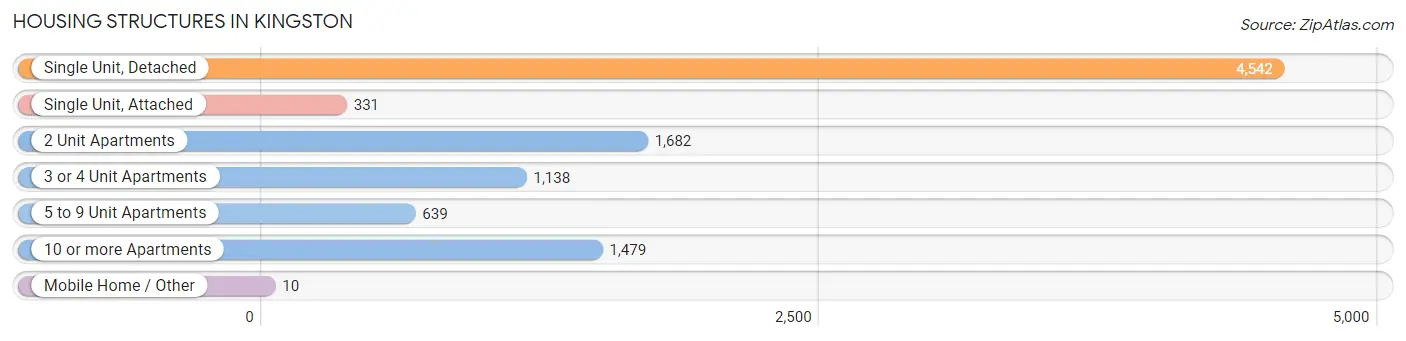
| Structure Type | # Housing Units | % Housing Units |
| Single Unit, Detached | 4,542 | 46.3% |
| Single Unit, Attached | 331 | 3.4% |
| 2 Unit Apartments | 1,682 | 17.1% |
| 3 or 4 Unit Apartments | 1,138 | 11.6% |
| 5 to 9 Unit Apartments | 639 | 6.5% |
| 10 or more Apartments | 1,479 | 15.1% |
| Mobile Home / Other | 10 | 0.1% |
| Total | 9,821 | 100.0% |
Housing Structures by Occupancy in Kingston
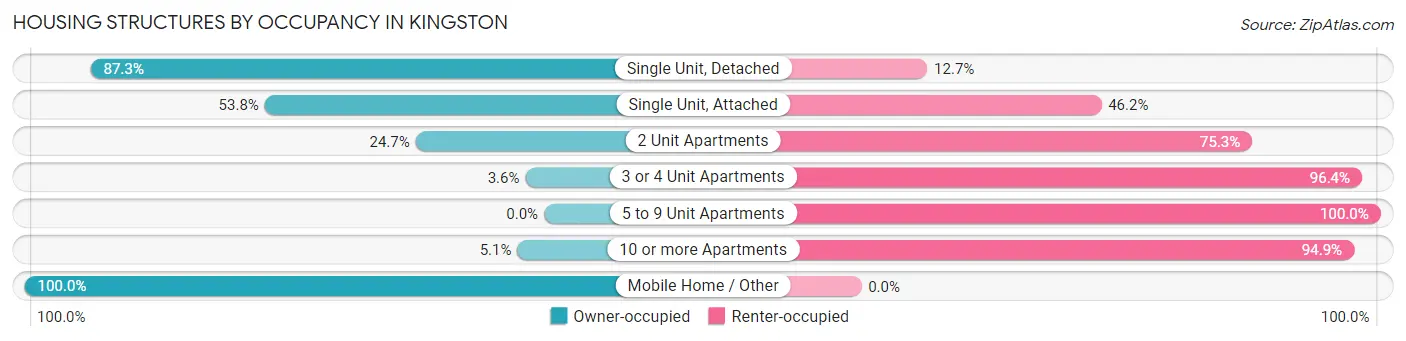
| Structure Type | Owner-occupied | Renter-occupied |
| Single Unit, Detached | 3,965 (87.3%) | 577 (12.7%) |
| Single Unit, Attached | 178 (53.8%) | 153 (46.2%) |
| 2 Unit Apartments | 416 (24.7%) | 1,266 (75.3%) |
| 3 or 4 Unit Apartments | 41 (3.6%) | 1,097 (96.4%) |
| 5 to 9 Unit Apartments | 0 (0.0%) | 639 (100.0%) |
| 10 or more Apartments | 76 (5.1%) | 1,403 (94.9%) |
| Mobile Home / Other | 10 (100.0%) | 0 (0.0%) |
| Total | 4,686 (47.7%) | 5,135 (52.3%) |
Housing Structures by Number of Rooms in Kingston
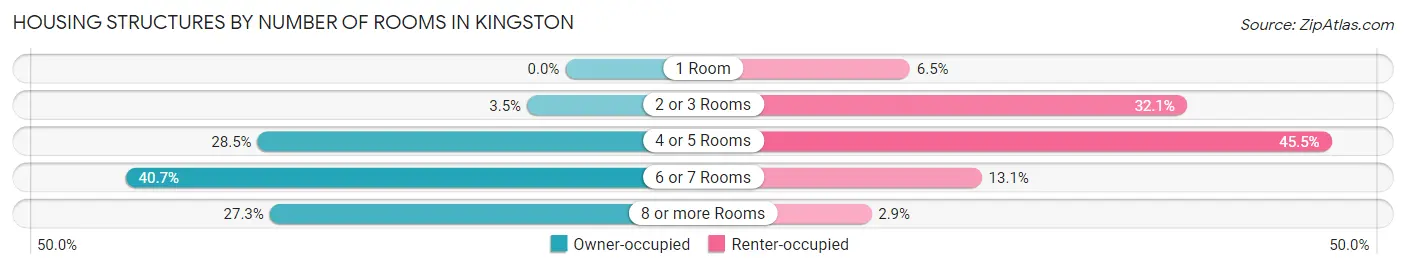
| Number of Rooms | Owner-occupied | Renter-occupied |
| 1 Room | 0 (0.0%) | 332 (6.5%) |
| 2 or 3 Rooms | 166 (3.5%) | 1,647 (32.1%) |
| 4 or 5 Rooms | 1,334 (28.5%) | 2,334 (45.5%) |
| 6 or 7 Rooms | 1,905 (40.6%) | 673 (13.1%) |
| 8 or more Rooms | 1,281 (27.3%) | 149 (2.9%) |
| Total | 4,686 (100.0%) | 5,135 (100.0%) |
Housing Structure by Heating Type in Kingston
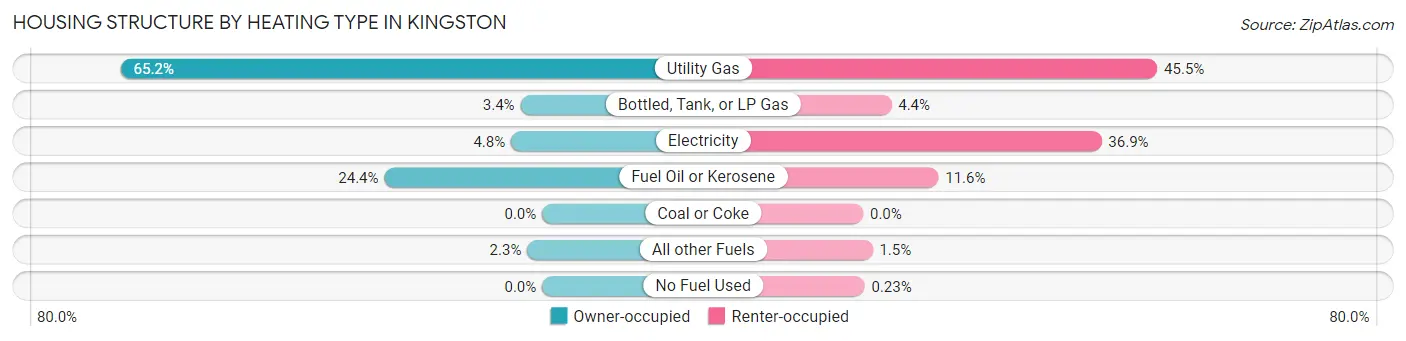
| Heating Type | Owner-occupied | Renter-occupied |
| Utility Gas | 3,053 (65.1%) | 2,335 (45.5%) |
| Bottled, Tank, or LP Gas | 157 (3.4%) | 224 (4.4%) |
| Electricity | 225 (4.8%) | 1,892 (36.8%) |
| Fuel Oil or Kerosene | 1,143 (24.4%) | 597 (11.6%) |
| Coal or Coke | 0 (0.0%) | 0 (0.0%) |
| All other Fuels | 108 (2.3%) | 75 (1.5%) |
| No Fuel Used | 0 (0.0%) | 12 (0.2%) |
| Total | 4,686 (100.0%) | 5,135 (100.0%) |
Household Vehicle Usage in Kingston
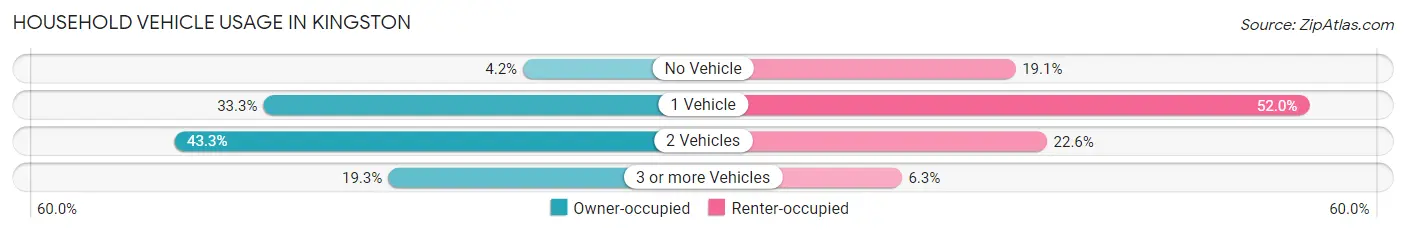
| Vehicles per Household | Owner-occupied | Renter-occupied |
| No Vehicle | 196 (4.2%) | 980 (19.1%) |
| 1 Vehicle | 1,559 (33.3%) | 2,670 (52.0%) |
| 2 Vehicles | 2,027 (43.3%) | 1,160 (22.6%) |
| 3 or more Vehicles | 904 (19.3%) | 325 (6.3%) |
| Total | 4,686 (100.0%) | 5,135 (100.0%) |
Real Estate & Mortgages in Kingston
Real Estate and Mortgage Overview in Kingston
| Characteristic | Without Mortgage | With Mortgage |
| Housing Units | 1,629 | 3,057 |
| Median Property Value | $228,100 | $261,200 |
| Median Household Income | $64,375 | $845 |
| Monthly Housing Costs | $875 | $349 |
| Real Estate Taxes | $4,858 | $71 |
Property Value by Mortgage Status in Kingston
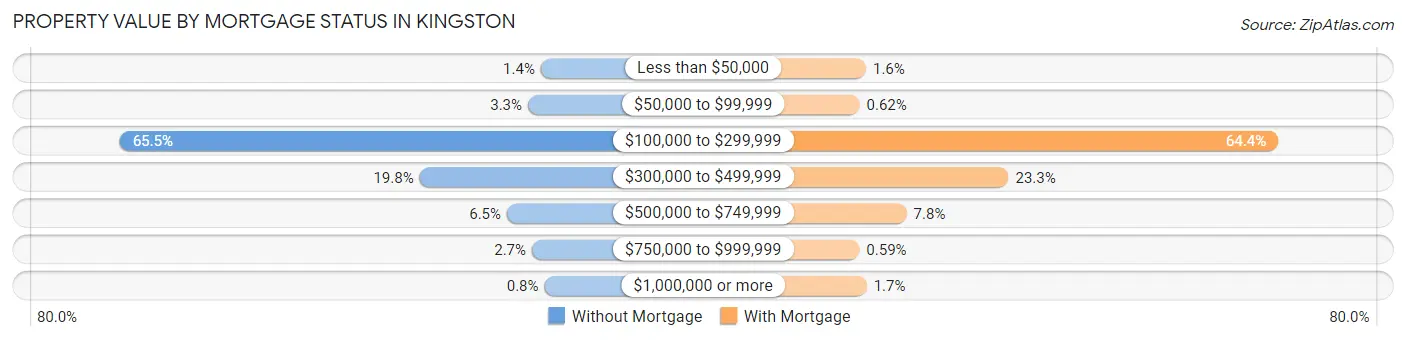
| Property Value | Without Mortgage | With Mortgage |
| Less than $50,000 | 22 (1.3%) | 49 (1.6%) |
| $50,000 to $99,999 | 54 (3.3%) | 19 (0.6%) |
| $100,000 to $299,999 | 1,067 (65.5%) | 1,968 (64.4%) |
| $300,000 to $499,999 | 323 (19.8%) | 713 (23.3%) |
| $500,000 to $749,999 | 106 (6.5%) | 238 (7.8%) |
| $750,000 to $999,999 | 44 (2.7%) | 18 (0.6%) |
| $1,000,000 or more | 13 (0.8%) | 52 (1.7%) |
| Total | 1,629 (100.0%) | 3,057 (100.0%) |
Household Income by Mortgage Status in Kingston
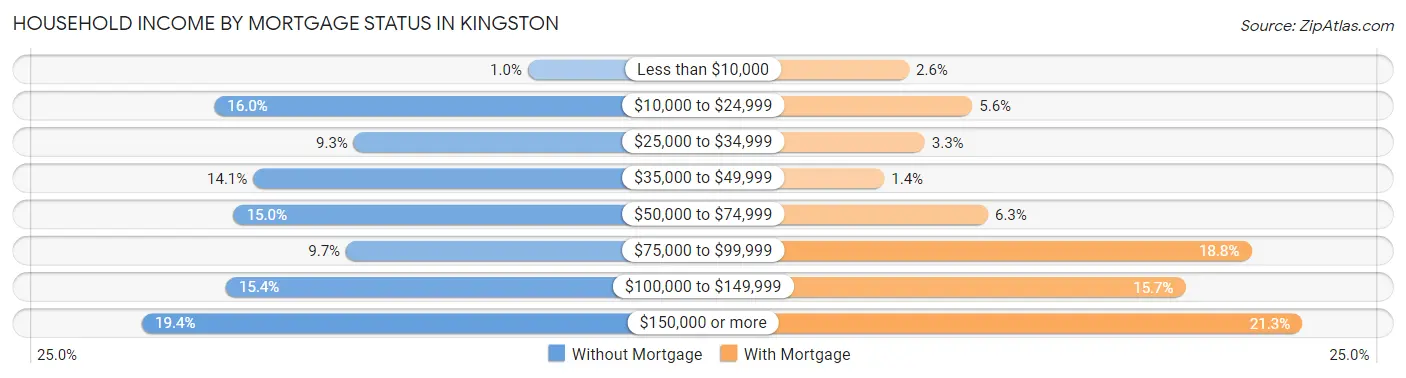
| Household Income | Without Mortgage | With Mortgage |
| Less than $10,000 | 17 (1.0%) | 78 (2.5%) |
| $10,000 to $24,999 | 260 (16.0%) | 170 (5.6%) |
| $25,000 to $34,999 | 152 (9.3%) | 101 (3.3%) |
| $35,000 to $49,999 | 230 (14.1%) | 42 (1.4%) |
| $50,000 to $74,999 | 245 (15.0%) | 193 (6.3%) |
| $75,000 to $99,999 | 158 (9.7%) | 576 (18.8%) |
| $100,000 to $149,999 | 251 (15.4%) | 480 (15.7%) |
| $150,000 or more | 316 (19.4%) | 650 (21.3%) |
| Total | 1,629 (100.0%) | 3,057 (100.0%) |
Property Value to Household Income Ratio in Kingston
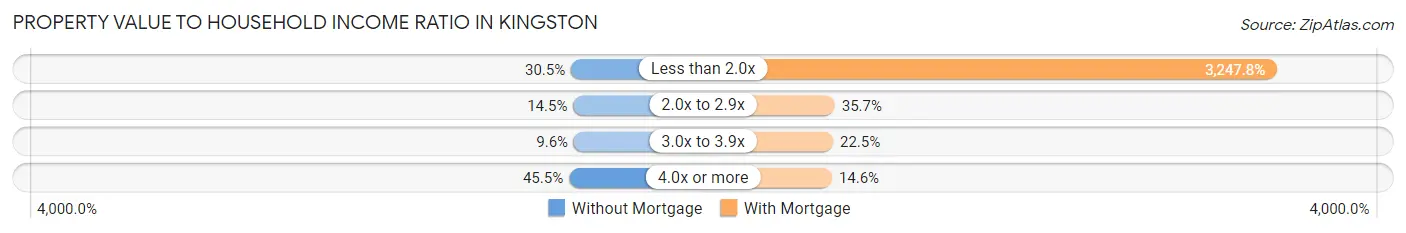
| Value-to-Income Ratio | Without Mortgage | With Mortgage |
| Less than 2.0x | 496 (30.4%) | 99,284 (3,247.8%) |
| 2.0x to 2.9x | 236 (14.5%) | 1,090 (35.7%) |
| 3.0x to 3.9x | 156 (9.6%) | 689 (22.5%) |
| 4.0x or more | 741 (45.5%) | 447 (14.6%) |
| Total | 1,629 (100.0%) | 3,057 (100.0%) |
Real Estate Taxes by Mortgage Status in Kingston
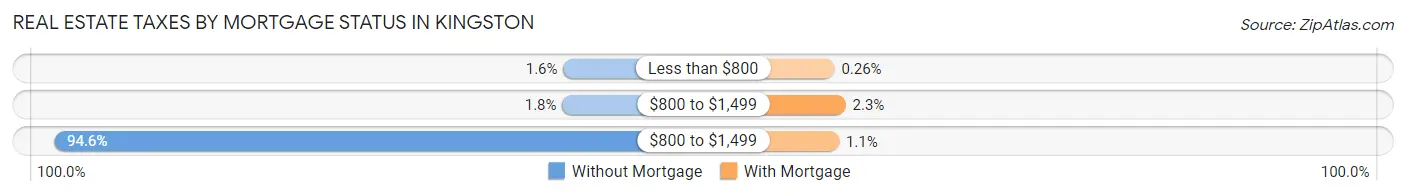
| Property Taxes | Without Mortgage | With Mortgage |
| Less than $800 | 26 (1.6%) | 8 (0.3%) |
| $800 to $1,499 | 29 (1.8%) | 70 (2.3%) |
| $800 to $1,499 | 1,541 (94.6%) | 33 (1.1%) |
| Total | 1,629 (100.0%) | 3,057 (100.0%) |
Health & Disability in Kingston
Health Insurance Coverage by Age in Kingston
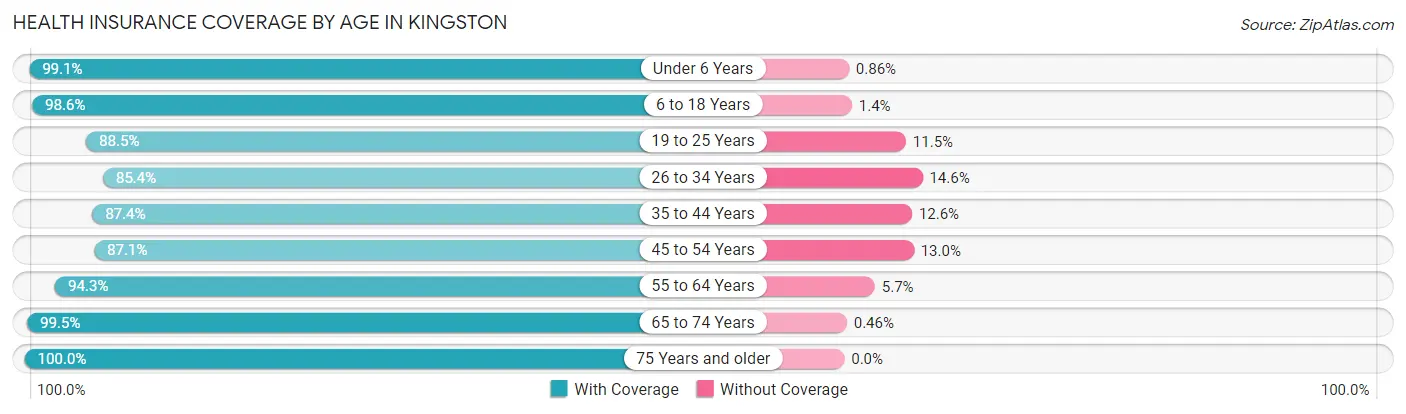
| Age Bracket | With Coverage | Without Coverage |
| Under 6 Years | 2,179 (99.1%) | 19 (0.9%) |
| 6 to 18 Years | 3,079 (98.6%) | 44 (1.4%) |
| 19 to 25 Years | 1,771 (88.5%) | 230 (11.5%) |
| 26 to 34 Years | 3,585 (85.4%) | 612 (14.6%) |
| 35 to 44 Years | 2,701 (87.4%) | 390 (12.6%) |
| 45 to 54 Years | 2,614 (87.1%) | 389 (13.0%) |
| 55 to 64 Years | 2,535 (94.3%) | 153 (5.7%) |
| 65 to 74 Years | 1,968 (99.5%) | 9 (0.5%) |
| 75 Years and older | 1,394 (100.0%) | 0 (0.0%) |
| Total | 21,826 (92.2%) | 1,846 (7.8%) |
Health Insurance Coverage by Citizenship Status in Kingston
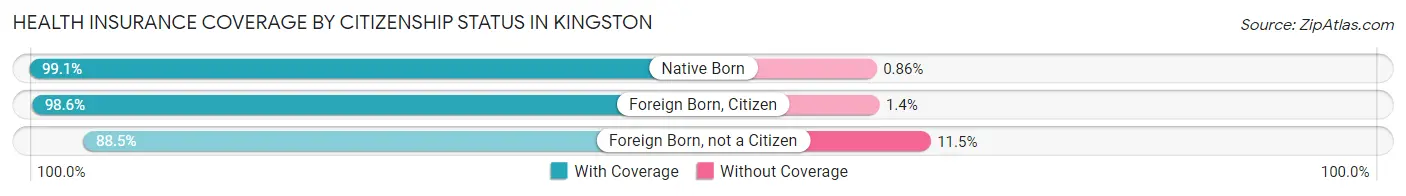
| Citizenship Status | With Coverage | Without Coverage |
| Native Born | 2,179 (99.1%) | 19 (0.9%) |
| Foreign Born, Citizen | 3,079 (98.6%) | 44 (1.4%) |
| Foreign Born, not a Citizen | 1,771 (88.5%) | 230 (11.5%) |
Health Insurance Coverage by Household Income in Kingston
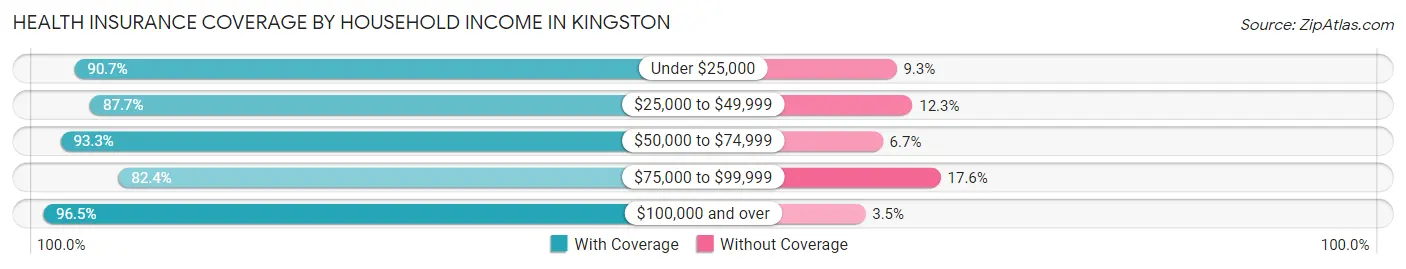
| Household Income | With Coverage | Without Coverage |
| Under $25,000 | 3,128 (90.7%) | 321 (9.3%) |
| $25,000 to $49,999 | 3,411 (87.7%) | 477 (12.3%) |
| $50,000 to $74,999 | 3,746 (93.3%) | 270 (6.7%) |
| $75,000 to $99,999 | 2,007 (82.4%) | 428 (17.6%) |
| $100,000 and over | 9,009 (96.5%) | 323 (3.5%) |
Public vs Private Health Insurance Coverage by Age in Kingston
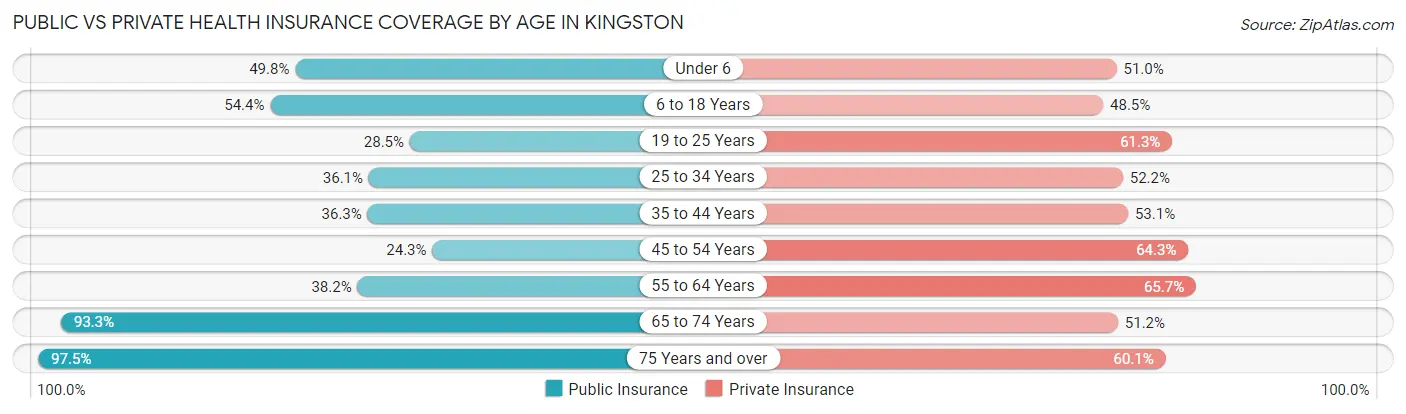
| Age Bracket | Public Insurance | Private Insurance |
| Under 6 | 1,094 (49.8%) | 1,121 (51.0%) |
| 6 to 18 Years | 1,699 (54.4%) | 1,515 (48.5%) |
| 19 to 25 Years | 570 (28.5%) | 1,227 (61.3%) |
| 25 to 34 Years | 1,515 (36.1%) | 2,189 (52.2%) |
| 35 to 44 Years | 1,123 (36.3%) | 1,642 (53.1%) |
| 45 to 54 Years | 730 (24.3%) | 1,931 (64.3%) |
| 55 to 64 Years | 1,027 (38.2%) | 1,767 (65.7%) |
| 65 to 74 Years | 1,844 (93.3%) | 1,013 (51.2%) |
| 75 Years and over | 1,359 (97.5%) | 838 (60.1%) |
| Total | 10,961 (46.3%) | 13,243 (55.9%) |
Disability Status by Sex by Age in Kingston
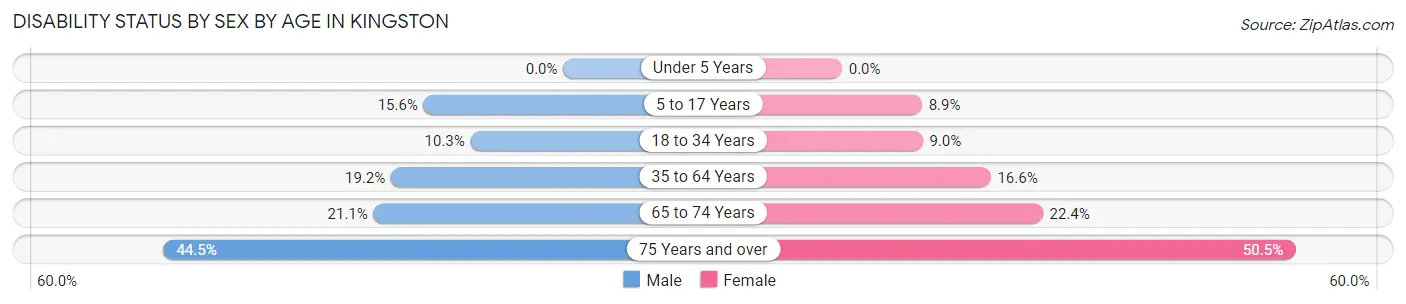
| Age Bracket | Male | Female |
| Under 5 Years | 0 (0.0%) | 0 (0.0%) |
| 5 to 17 Years | 243 (15.5%) | 173 (8.9%) |
| 18 to 34 Years | 350 (10.3%) | 266 (9.0%) |
| 35 to 64 Years | 846 (19.2%) | 724 (16.6%) |
| 65 to 74 Years | 172 (21.1%) | 260 (22.4%) |
| 75 Years and over | 244 (44.5%) | 427 (50.5%) |
Disability Class by Sex by Age in Kingston
Disability Class: Hearing Difficulty
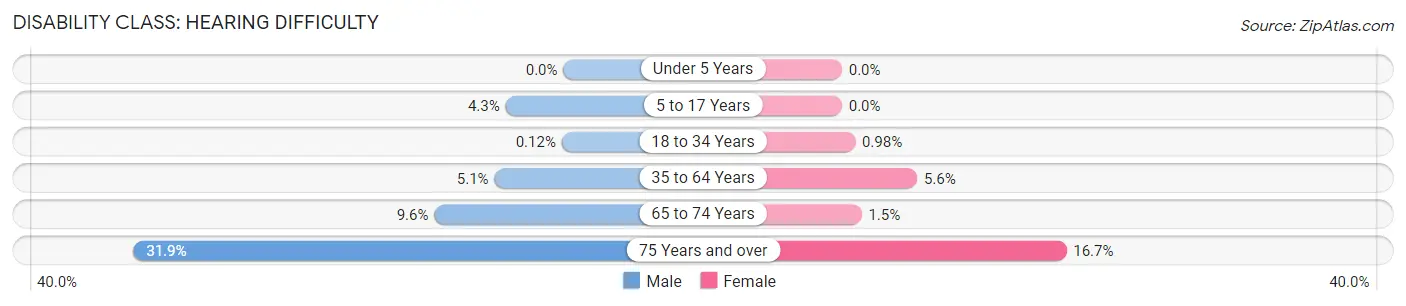
| Age Bracket | Male | Female |
| Under 5 Years | 0 (0.0%) | 0 (0.0%) |
| 5 to 17 Years | 67 (4.3%) | 0 (0.0%) |
| 18 to 34 Years | 4 (0.1%) | 29 (1.0%) |
| 35 to 64 Years | 226 (5.1%) | 244 (5.6%) |
| 65 to 74 Years | 78 (9.6%) | 17 (1.5%) |
| 75 Years and over | 175 (31.9%) | 141 (16.7%) |
Disability Class: Vision Difficulty
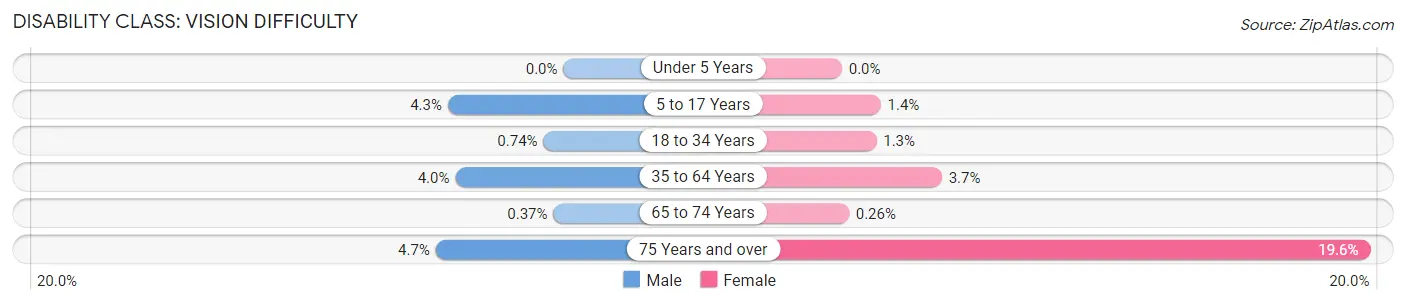
| Age Bracket | Male | Female |
| Under 5 Years | 0 (0.0%) | 0 (0.0%) |
| 5 to 17 Years | 67 (4.3%) | 28 (1.4%) |
| 18 to 34 Years | 25 (0.7%) | 38 (1.3%) |
| 35 to 64 Years | 177 (4.0%) | 162 (3.7%) |
| 65 to 74 Years | 3 (0.4%) | 3 (0.3%) |
| 75 Years and over | 26 (4.7%) | 166 (19.6%) |
Disability Class: Cognitive Difficulty
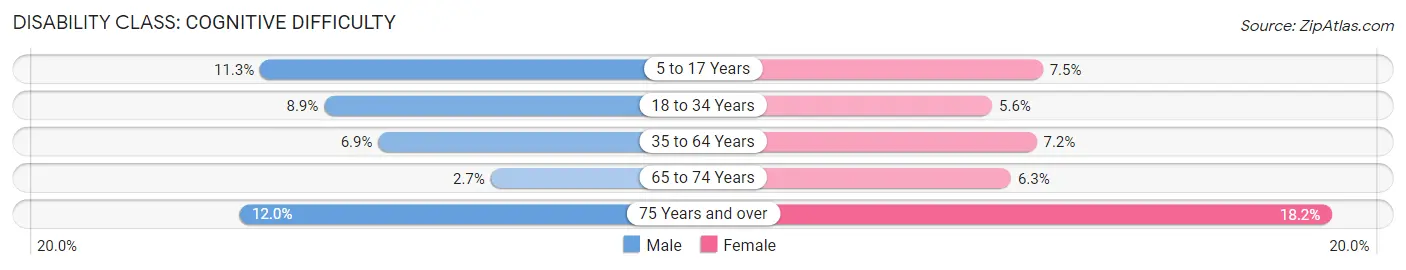
| Age Bracket | Male | Female |
| 5 to 17 Years | 176 (11.3%) | 145 (7.5%) |
| 18 to 34 Years | 301 (8.9%) | 165 (5.6%) |
| 35 to 64 Years | 303 (6.9%) | 316 (7.2%) |
| 65 to 74 Years | 22 (2.7%) | 73 (6.3%) |
| 75 Years and over | 66 (12.0%) | 154 (18.2%) |
Disability Class: Ambulatory Difficulty
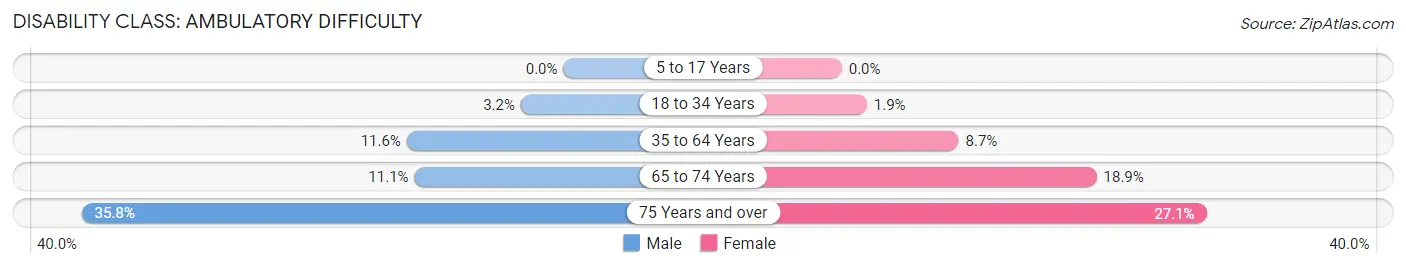
| Age Bracket | Male | Female |
| 5 to 17 Years | 0 (0.0%) | 0 (0.0%) |
| 18 to 34 Years | 107 (3.2%) | 55 (1.9%) |
| 35 to 64 Years | 513 (11.6%) | 379 (8.7%) |
| 65 to 74 Years | 90 (11.1%) | 220 (18.9%) |
| 75 Years and over | 196 (35.8%) | 229 (27.1%) |
Disability Class: Self-Care Difficulty
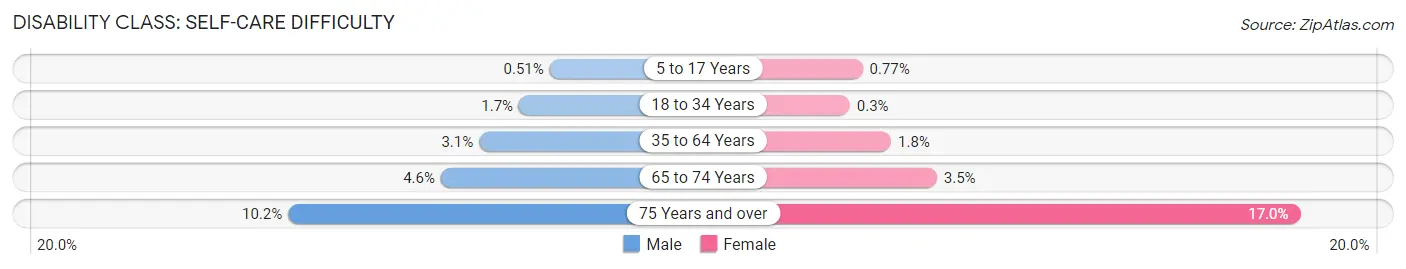
| Age Bracket | Male | Female |
| 5 to 17 Years | 8 (0.5%) | 15 (0.8%) |
| 18 to 34 Years | 56 (1.7%) | 9 (0.3%) |
| 35 to 64 Years | 138 (3.1%) | 80 (1.8%) |
| 65 to 74 Years | 37 (4.5%) | 41 (3.5%) |
| 75 Years and over | 56 (10.2%) | 144 (17.0%) |
Technology Access in Kingston
Computing Device Access in Kingston
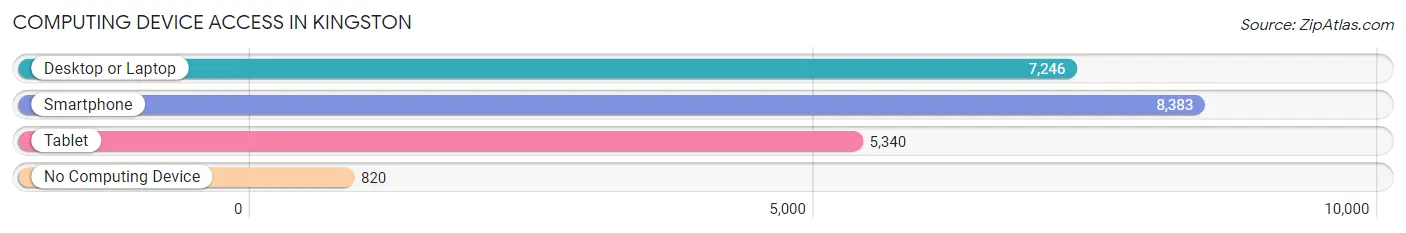
| Device Type | # Households | % Households |
| Desktop or Laptop | 7,246 | 73.8% |
| Smartphone | 8,383 | 85.4% |
| Tablet | 5,340 | 54.4% |
| No Computing Device | 820 | 8.4% |
| Total | 9,821 | 100.0% |
Internet Access in Kingston
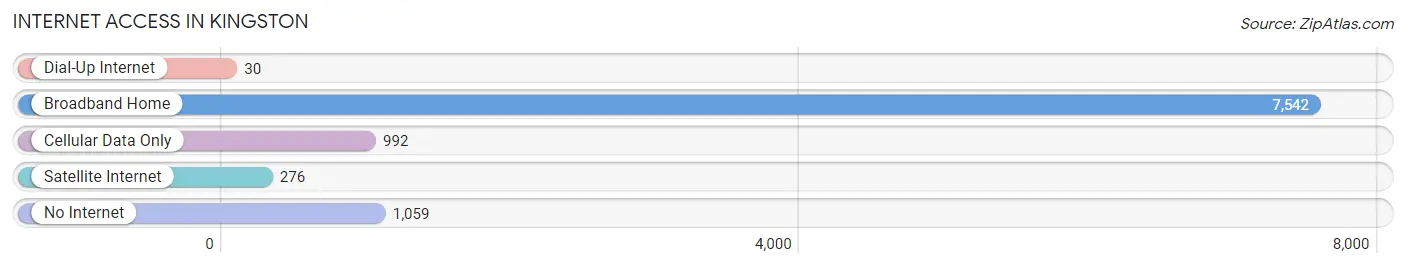
| Internet Type | # Households | % Households |
| Dial-Up Internet | 30 | 0.3% |
| Broadband Home | 7,542 | 76.8% |
| Cellular Data Only | 992 | 10.1% |
| Satellite Internet | 276 | 2.8% |
| No Internet | 1,059 | 10.8% |
| Total | 9,821 | 100.0% |
Kingston Summary
Kingston, New York is a city located in Ulster County, New York, United States. It is the county seat of Ulster County and the largest city in the county. The city is situated on the Hudson River, about 90 miles north of New York City. As of the 2010 census, the city had a population of 23,893.
History
The area that is now Kingston was originally inhabited by the Esopus Indians, a branch of the Lenape tribe. The first European settlers arrived in the area in 1652, when Dutch settlers established a trading post. The settlement was named Wiltwyck, which is believed to be a Dutch translation of the Lenape name for the area, Esopus.
In 1664, the English took control of the area and renamed it Kingston. The city was named after Kingston upon Thames in England. The city was the first capital of New York State from 1777 to 1797. During the Revolutionary War, the city was the site of the Battle of Kingston, which was a major victory for the American forces.
Geography
Kingston is located in the Hudson Valley region of New York State. The city is situated on the west bank of the Hudson River, about 90 miles north of New York City. The city has a total area of 8.3 square miles, of which 8.2 square miles is land and 0.1 square miles is water.
The city is located in the Catskill Mountains and is surrounded by several mountain ranges, including the Catskill Mountains, the Shawangunk Mountains, and the Catskill Escarpment. The city is also located near several major rivers, including the Hudson River, the Rondout Creek, and the Wallkill River.
Economy
Kingston is the economic center of Ulster County. The city is home to several major employers, including IBM, HealthAlliance of the Hudson Valley, and the State University of New York at New Paltz. The city is also home to several major industries, including manufacturing, healthcare, and tourism.
The city is also home to several major shopping centers, including the Hudson Valley Mall and the Kingston Plaza. The city is also home to several major cultural attractions, including the Hudson Valley Shakespeare Festival, the Hudson Valley Philharmonic, and the Hudson Valley Ballet.
Demographics
As of the 2010 census, the city had a population of 23,893. The racial makeup of the city was 79.2% White, 11.3% African American, 0.3% Native American, 2.2% Asian, 0.1% Pacific Islander, 4.2% from other races, and 2.9% from two or more races. Hispanic or Latino of any race were 11.3% of the population.
The median income for a household in the city was $41,945, and the median income for a family was $50,945. The per capita income for the city was $22,845. About 15.2% of families and 19.2% of the population were below the poverty line, including 28.2% of those under age 18 and 8.2% of those age 65 or over.
Common Questions
What is Per Capita Income in Kingston?
Per Capita income in Kingston is $36,292.
What is the Median Family Income in Kingston?
Median Family Income in Kingston is $79,310.
What is the Median Household income in Kingston?
Median Household Income in Kingston is $62,071.
What is Income or Wage Gap in Kingston?
Income or Wage Gap in Kingston is 0.1%.
Women in Kingston earn 99.9 cents for every dollar earned by a man.
What is Inequality or Gini Index in Kingston?
Inequality or Gini Index in Kingston is 0.49.
What is the Total Population of Kingston?
Total Population of Kingston is 24,018.
What is the Total Male Population of Kingston?
Total Male Population of Kingston is 11,779.
What is the Total Female Population of Kingston?
Total Female Population of Kingston is 12,239.
What is the Ratio of Males per 100 Females in Kingston?
There are 96.24 Males per 100 Females in Kingston.
What is the Ratio of Females per 100 Males in Kingston?
There are 103.91 Females per 100 Males in Kingston.
What is the Median Population Age in Kingston?
Median Population Age in Kingston is 36.0 Years.
What is the Average Family Size in Kingston
Average Family Size in Kingston is 3.1 People.
What is the Average Household Size in Kingston
Average Household Size in Kingston is 2.4 People.
How Large is the Labor Force in Kingston?
There are 12,986 People in the Labor Forcein in Kingston.
What is the Percentage of People in the Labor Force in Kingston?
67.3% of People are in the Labor Force in Kingston.
What is the Unemployment Rate in Kingston?
Unemployment Rate in Kingston is 6.0%.