Fort Drum, NY Map & Demographics
Fort Drum Map
Fort Drum Overview
$21,970
PER CAPITA INCOME
$58,671
AVG FAMILY INCOME
$56,559
AVG HOUSEHOLD INCOME
40.0%
WAGE / INCOME GAP [ % ]
60.0¢/ $1
WAGE / INCOME GAP [ $ ]
$11,044
FAMILY INCOME DEFICIT
0.33
INEQUALITY / GINI INDEX
16,298
TOTAL POPULATION
9,664
MALE POPULATION
6,634
FEMALE POPULATION
145.67
MALES / 100 FEMALES
68.65
FEMALES / 100 MALES
22.0
MEDIAN AGE
3.4
AVG FAMILY SIZE
3.0
AVG HOUSEHOLD SIZE
8,636
LABOR FORCE [ PEOPLE ]
79.0%
PERCENT IN LABOR FORCE
9.7%
UNEMPLOYMENT RATE
Fort Drum Zip Codes
Fort Drum Area Codes
Income in Fort Drum
Income Overview in Fort Drum
Per Capita Income in Fort Drum is $21,970, while median incomes of families and households are $58,671 and $56,559 respectively.
| Characteristic | Number | Measure |
| Per Capita Income | 16,298 | $21,970 |
| Median Family Income | 3,837 | $58,671 |
| Mean Family Income | 3,837 | $66,417 |
| Median Household Income | 4,586 | $56,559 |
| Mean Household Income | 4,586 | $63,366 |
| Income Deficit | 3,837 | $11,044 |
| Wage / Income Gap (%) | 16,298 | 39.99% |
| Wage / Income Gap ($) | 16,298 | 60.01¢ per $1 |
| Gini / Inequality Index | 16,298 | 0.33 |
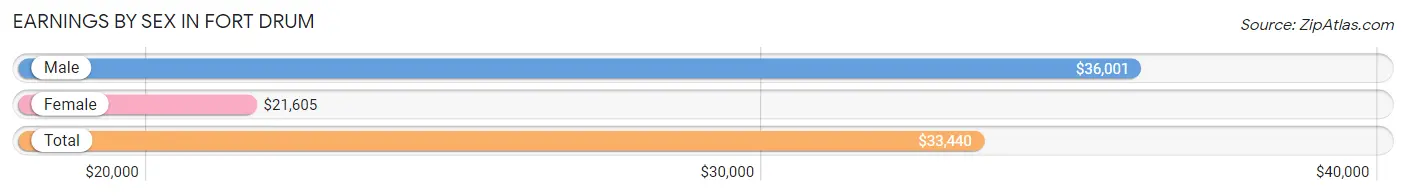
Earnings by Sex in Fort Drum
Average Earnings in Fort Drum are $33,440, $36,001 for men and $21,605 for women, a difference of 40.0%.
| Sex | Number | Average Earnings |
| Male | 6,573 (73.9%) | $36,001 |
| Female | 2,325 (26.1%) | $21,605 |
| Total | 8,898 (100.0%) | $33,440 |
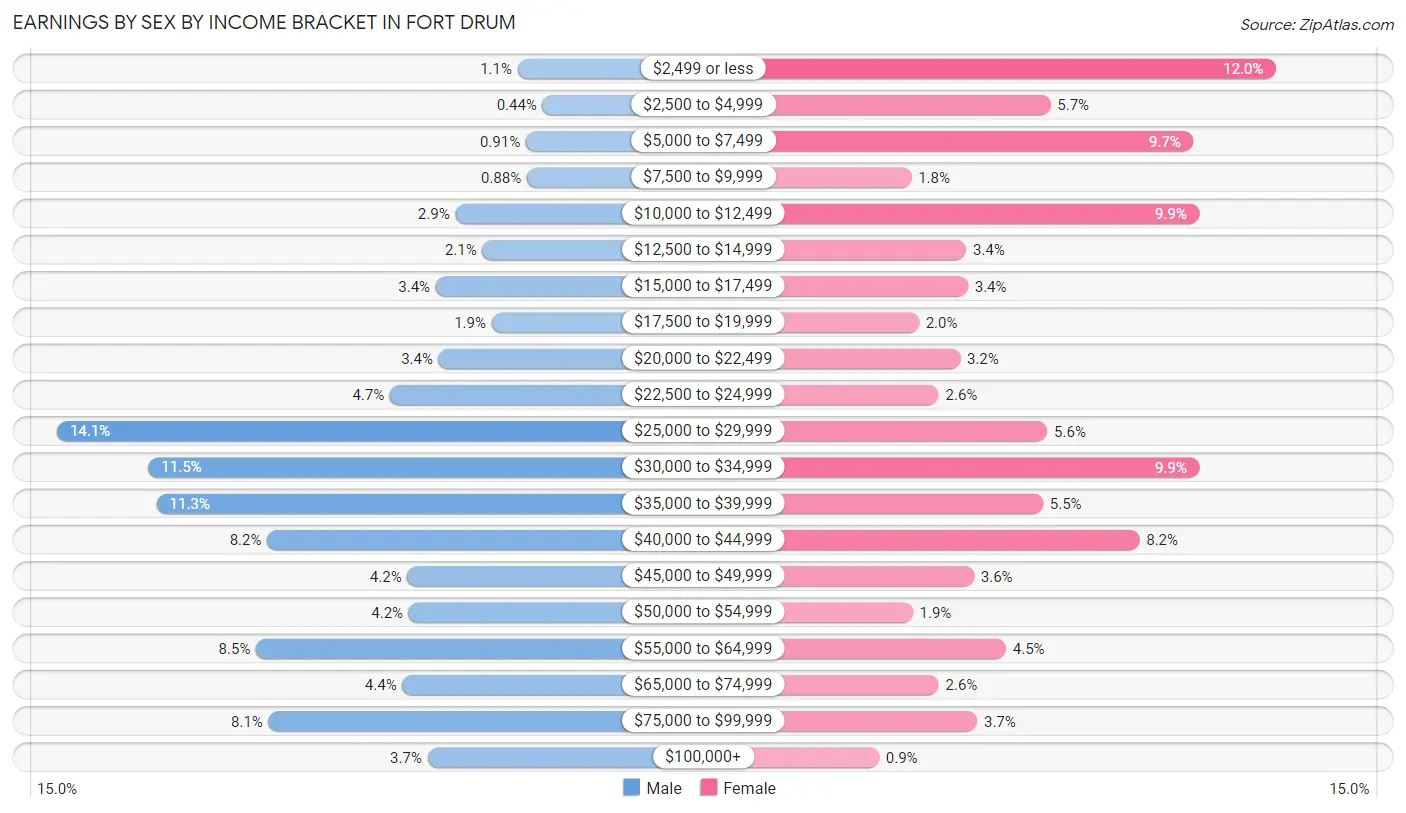
Earnings by Sex by Income Bracket in Fort Drum
The most common earnings brackets in Fort Drum are $25,000 to $29,999 for men (926 | 14.1%) and $2,499 or less for women (280 | 12.0%).
| Income | Male | Female |
| $2,499 or less | 75 (1.1%) | 280 (12.0%) |
| $2,500 to $4,999 | 29 (0.4%) | 133 (5.7%) |
| $5,000 to $7,499 | 60 (0.9%) | 226 (9.7%) |
| $7,500 to $9,999 | 58 (0.9%) | 42 (1.8%) |
| $10,000 to $12,499 | 190 (2.9%) | 230 (9.9%) |
| $12,500 to $14,999 | 140 (2.1%) | 78 (3.4%) |
| $15,000 to $17,499 | 226 (3.4%) | 79 (3.4%) |
| $17,500 to $19,999 | 123 (1.9%) | 47 (2.0%) |
| $20,000 to $22,499 | 221 (3.4%) | 74 (3.2%) |
| $22,500 to $24,999 | 311 (4.7%) | 60 (2.6%) |
| $25,000 to $29,999 | 926 (14.1%) | 131 (5.6%) |
| $30,000 to $34,999 | 757 (11.5%) | 230 (9.9%) |
| $35,000 to $39,999 | 742 (11.3%) | 128 (5.5%) |
| $40,000 to $44,999 | 538 (8.2%) | 191 (8.2%) |
| $45,000 to $49,999 | 279 (4.2%) | 83 (3.6%) |
| $50,000 to $54,999 | 276 (4.2%) | 43 (1.8%) |
| $55,000 to $64,999 | 558 (8.5%) | 104 (4.5%) |
| $65,000 to $74,999 | 288 (4.4%) | 60 (2.6%) |
| $75,000 to $99,999 | 535 (8.1%) | 85 (3.7%) |
| $100,000+ | 241 (3.7%) | 21 (0.9%) |
| Total | 6,573 (100.0%) | 2,325 (100.0%) |
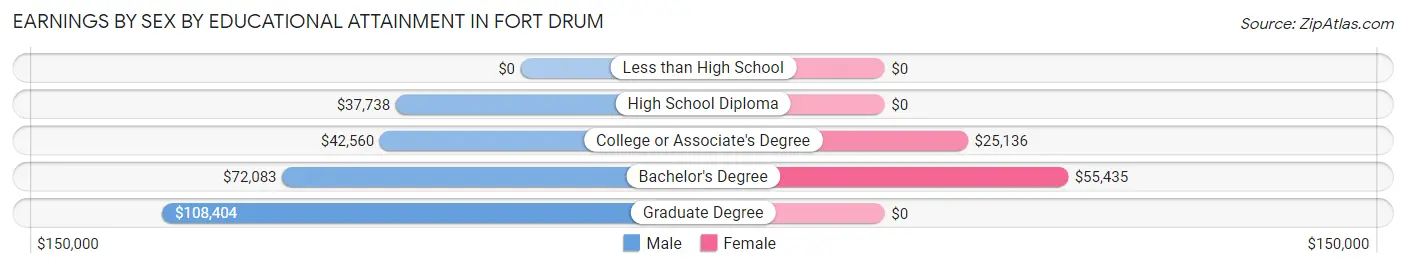
Earnings by Sex by Educational Attainment in Fort Drum
Average earnings in Fort Drum are $46,090 for men and $25,598 for women, a difference of 44.5%. Men with an educational attainment of graduate degree enjoy the highest average annual earnings of $108,404, while those with high school diploma education earn the least with $37,738. Women with an educational attainment of bachelor's degree earn the most with the average annual earnings of $55,435, while those with college or associate's degree education have the smallest earnings of $25,136.
| Educational Attainment | Male Income | Female Income |
| Less than High School | - | - |
| High School Diploma | $37,738 | $0 |
| College or Associate's Degree | $42,560 | $25,136 |
| Bachelor's Degree | $72,083 | $55,435 |
| Graduate Degree | $108,404 | $0 |
| Total | $46,090 | $25,598 |
Family Income in Fort Drum
Family Income Brackets in Fort Drum
According to the Fort Drum family income data, there are 879 families falling into the $35,000 to $49,999 income range, which is the most common income bracket and makes up 22.9% of all families. Conversely, the $200,000+ income bracket is the least frequent group with only 19 families (0.5%) belonging to this category.
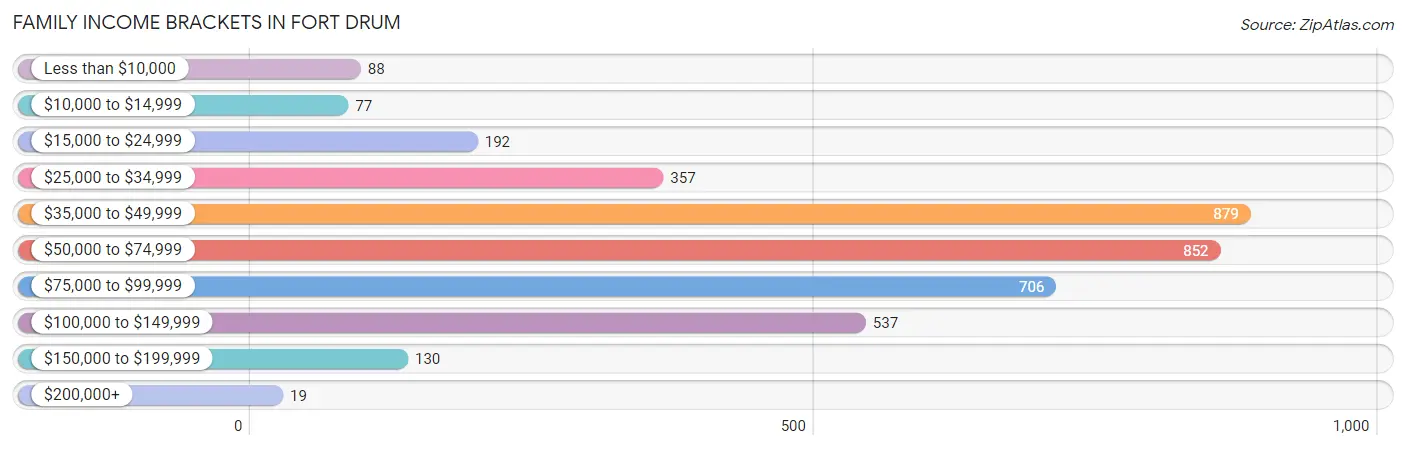
| Income Bracket | # Families | % Families |
| Less than $10,000 | 88 | 2.3% |
| $10,000 to $14,999 | 77 | 2.0% |
| $15,000 to $24,999 | 192 | 5.0% |
| $25,000 to $34,999 | 357 | 9.3% |
| $35,000 to $49,999 | 879 | 22.9% |
| $50,000 to $74,999 | 852 | 22.2% |
| $75,000 to $99,999 | 706 | 18.4% |
| $100,000 to $149,999 | 537 | 14.0% |
| $150,000 to $199,999 | 130 | 3.4% |
| $200,000+ | 19 | 0.5% |
Family Income by Famaliy Size in Fort Drum
6-person families (166 | 4.3%) account for the highest median family income in Fort Drum with $112,927 per family, while 2-person families (1,275 | 33.2%) have the highest median income of $29,358 per family member.
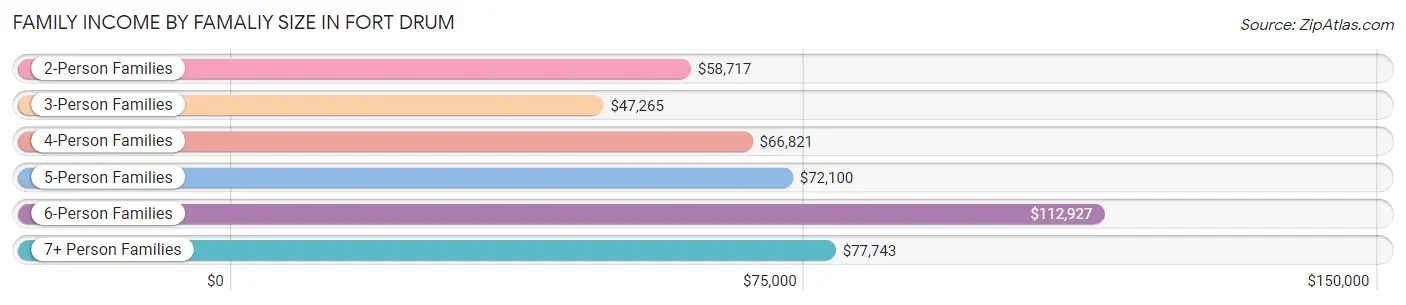
| Income Bracket | # Families | Median Income |
| 2-Person Families | 1,275 (33.2%) | $58,717 |
| 3-Person Families | 872 (22.7%) | $47,265 |
| 4-Person Families | 901 (23.5%) | $66,821 |
| 5-Person Families | 548 (14.3%) | $72,100 |
| 6-Person Families | 166 (4.3%) | $112,927 |
| 7+ Person Families | 75 (1.9%) | $77,743 |
| Total | 3,837 (100.0%) | $58,671 |
Family Income by Number of Earners in Fort Drum
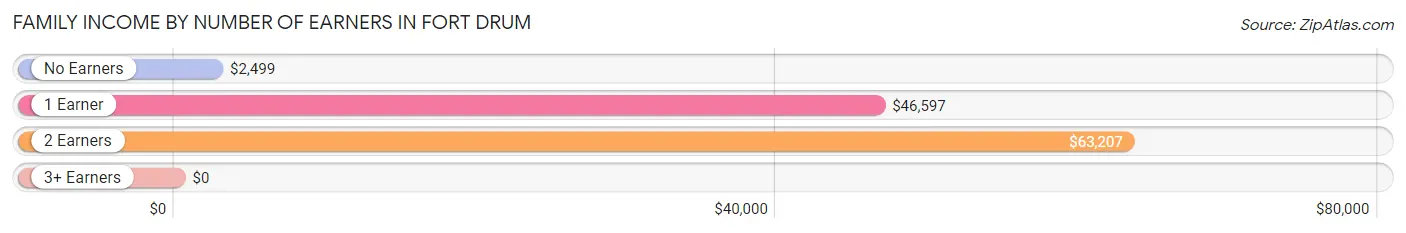
| Number of Earners | # Families | Median Income |
| No Earners | 32 (0.8%) | $2,499 |
| 1 Earner | 1,730 (45.1%) | $46,597 |
| 2 Earners | 2,057 (53.6%) | $63,207 |
| 3+ Earners | 18 (0.5%) | $0 |
| Total | 3,837 (100.0%) | $58,671 |
Household Income in Fort Drum
Household Income Brackets in Fort Drum
With 1,096 households falling in the category, the $35,000 to $49,999 income range is the most frequent in Fort Drum, accounting for 23.9% of all households. In contrast, only 18 households (0.4%) fall into the $200,000+ income bracket, making it the least populous group.
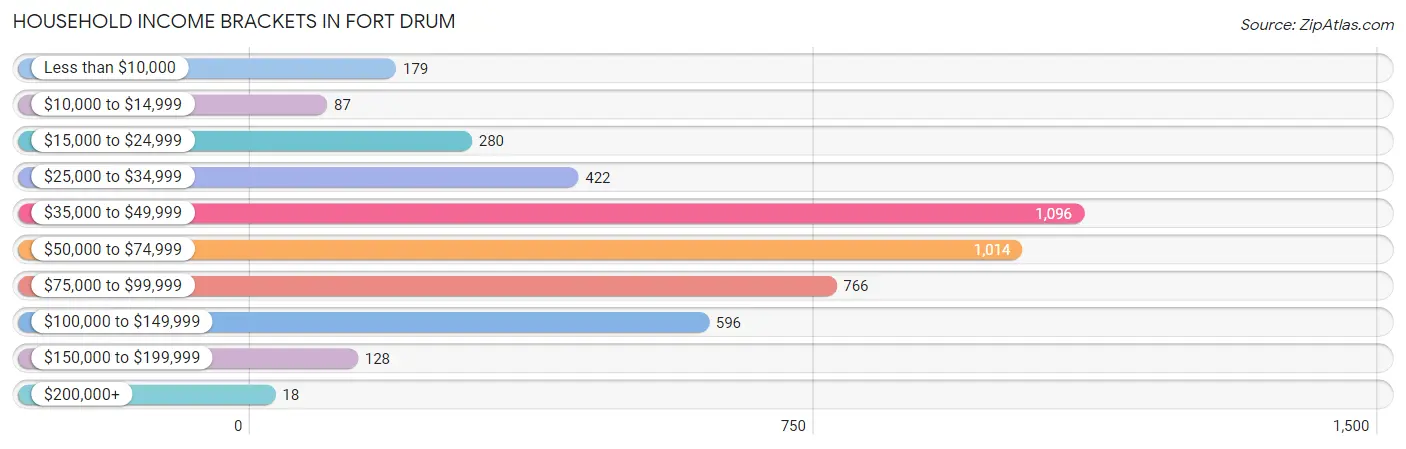
| Income Bracket | # Households | % Households |
| Less than $10,000 | 179 | 3.9% |
| $10,000 to $14,999 | 87 | 1.9% |
| $15,000 to $24,999 | 280 | 6.1% |
| $25,000 to $34,999 | 422 | 9.2% |
| $35,000 to $49,999 | 1,096 | 23.9% |
| $50,000 to $74,999 | 1,014 | 22.1% |
| $75,000 to $99,999 | 766 | 16.7% |
| $100,000 to $149,999 | 596 | 13.0% |
| $150,000 to $199,999 | 128 | 2.8% |
| $200,000+ | 18 | 0.4% |
Household Income by Householder Age in Fort Drum
The median household income in Fort Drum is $56,559, with the highest median household income of $105,642 found in the 45 to 64 years age bracket for the primary householder. A total of 277 households (6.0%) fall into this category. Meanwhile, the 65+ years age bracket for the primary householder has the lowest median household income of $0, with 19 households (0.4%) in this group.
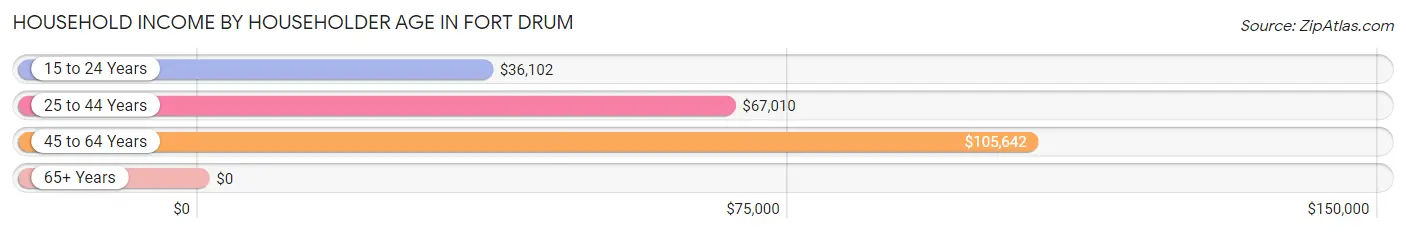
| Income Bracket | # Households | Median Income |
| 15 to 24 Years | 1,225 (26.7%) | $36,102 |
| 25 to 44 Years | 3,065 (66.8%) | $67,010 |
| 45 to 64 Years | 277 (6.0%) | $105,642 |
| 65+ Years | 19 (0.4%) | $0 |
| Total | 4,586 (100.0%) | $56,559 |
Poverty in Fort Drum
Income Below Poverty by Sex and Age in Fort Drum
With 7.7% poverty level for males and 9.5% for females among the residents of Fort Drum, 16 and 17 year old males and 55 to 64 year old females are the most vulnerable to poverty, with 19 males (23.2%) and 25 females (54.3%) in their respective age groups living below the poverty level.
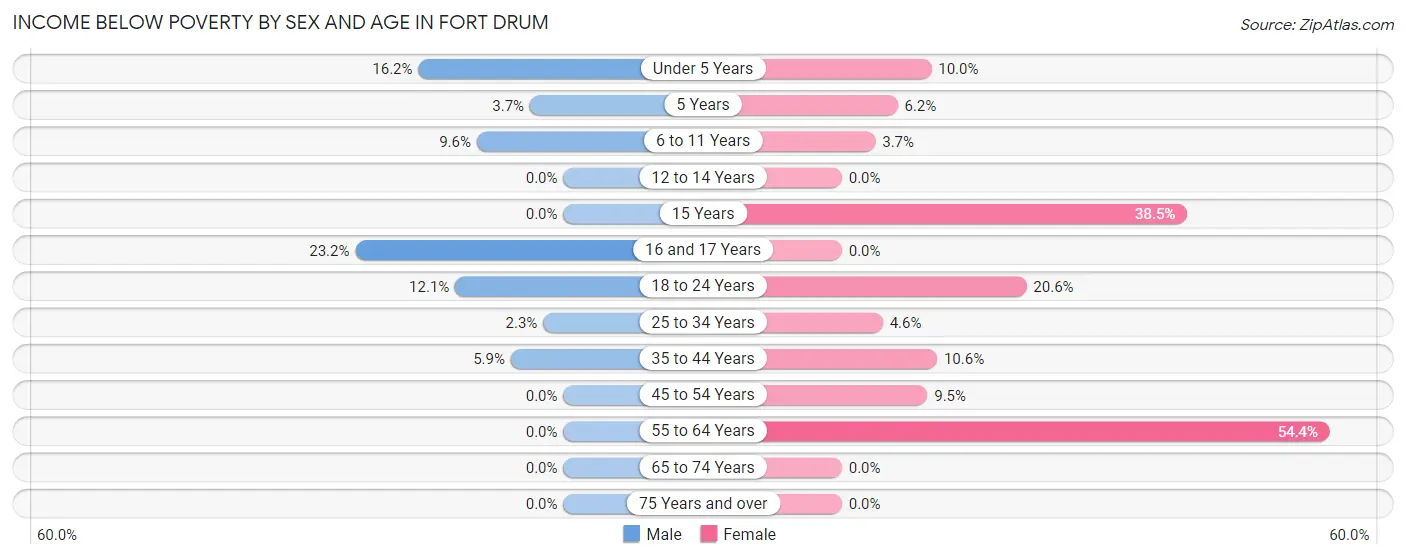
| Age Bracket | Male | Female |
| Under 5 Years | 219 (16.2%) | 137 (10.0%) |
| 5 Years | 12 (3.7%) | 9 (6.2%) |
| 6 to 11 Years | 82 (9.6%) | 33 (3.7%) |
| 12 to 14 Years | 0 (0.0%) | 0 (0.0%) |
| 15 Years | 0 (0.0%) | 5 (38.5%) |
| 16 and 17 Years | 19 (23.2%) | 0 (0.0%) |
| 18 to 24 Years | 147 (12.0%) | 229 (20.6%) |
| 25 to 34 Years | 49 (2.2%) | 84 (4.6%) |
| 35 to 44 Years | 48 (5.9%) | 76 (10.6%) |
| 45 to 54 Years | 0 (0.0%) | 10 (9.5%) |
| 55 to 64 Years | 0 (0.0%) | 25 (54.3%) |
| 65 to 74 Years | 0 (0.0%) | 0 (0.0%) |
| 75 Years and over | 0 (0.0%) | 0 (0.0%) |
| Total | 576 (7.7%) | 608 (9.5%) |
Income Above Poverty by Sex and Age in Fort Drum
According to the poverty statistics in Fort Drum, males aged 12 to 14 years and females aged 12 to 14 years are the age groups that are most secure financially, with 100.0% of males and 100.0% of females in these age groups living above the poverty line.
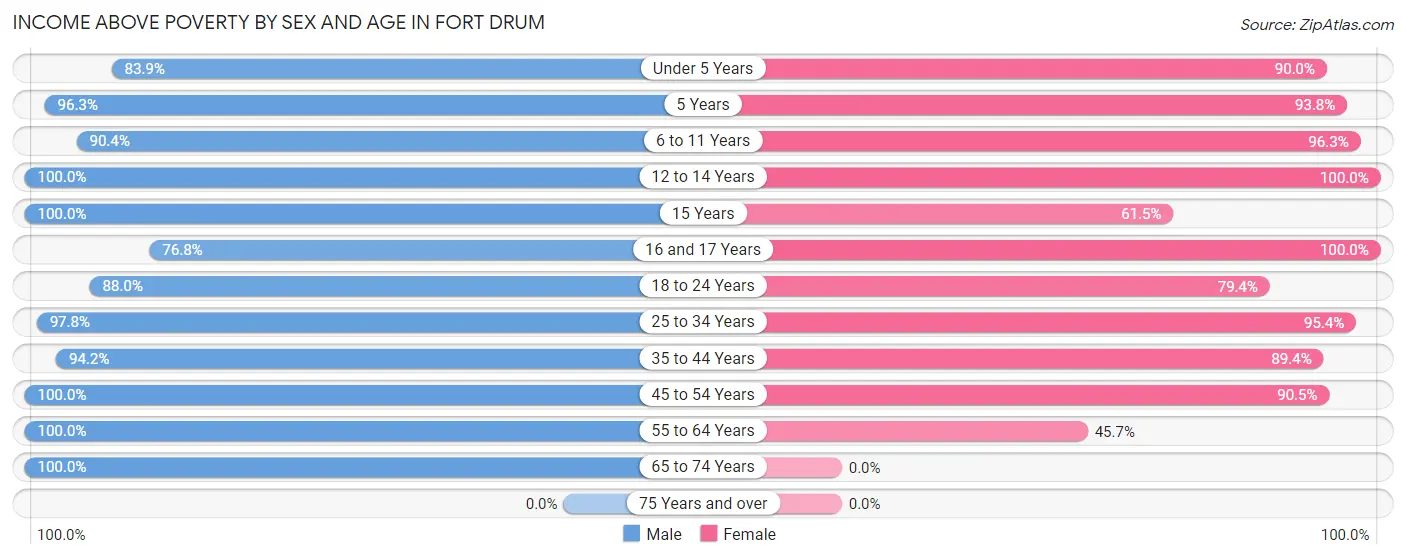
| Age Bracket | Male | Female |
| Under 5 Years | 1,137 (83.9%) | 1,237 (90.0%) |
| 5 Years | 311 (96.3%) | 136 (93.8%) |
| 6 to 11 Years | 769 (90.4%) | 851 (96.3%) |
| 12 to 14 Years | 253 (100.0%) | 56 (100.0%) |
| 15 Years | 51 (100.0%) | 8 (61.5%) |
| 16 and 17 Years | 63 (76.8%) | 134 (100.0%) |
| 18 to 24 Years | 1,073 (87.9%) | 885 (79.4%) |
| 25 to 34 Years | 2,131 (97.8%) | 1,760 (95.4%) |
| 35 to 44 Years | 773 (94.2%) | 641 (89.4%) |
| 45 to 54 Years | 268 (100.0%) | 95 (90.5%) |
| 55 to 64 Years | 6 (100.0%) | 21 (45.7%) |
| 65 to 74 Years | 33 (100.0%) | 0 (0.0%) |
| 75 Years and over | 0 (0.0%) | 0 (0.0%) |
| Total | 6,868 (92.3%) | 5,824 (90.5%) |
Income Below Poverty Among Married-Couple Families in Fort Drum
The poverty statistics for married-couple families in Fort Drum show that 5.9% or 218 of the total 3,670 families live below the poverty line. Families with 3 or 4 children have the highest poverty rate of 8.7%, comprising of 56 families. On the other hand, families with 5 or more children have the lowest poverty rate of 0.0%, which includes 0 families.
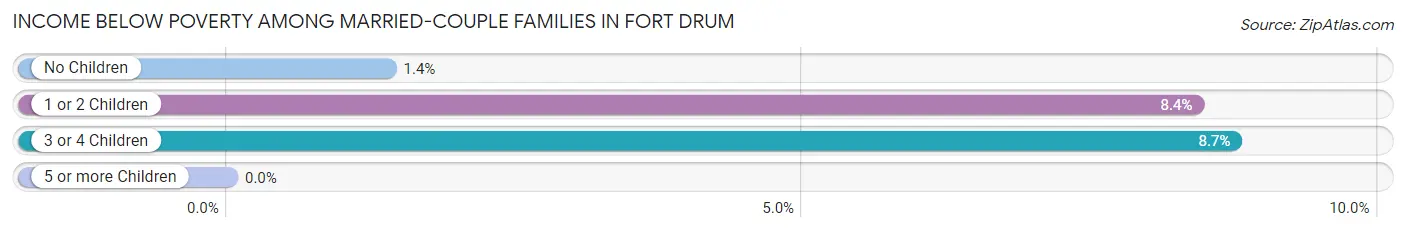
| Children | Above Poverty | Below Poverty |
| No Children | 1,212 (98.6%) | 17 (1.4%) |
| 1 or 2 Children | 1,580 (91.6%) | 145 (8.4%) |
| 3 or 4 Children | 585 (91.3%) | 56 (8.7%) |
| 5 or more Children | 75 (100.0%) | 0 (0.0%) |
| Total | 3,452 (94.1%) | 218 (5.9%) |
Income Below Poverty Among Single-Parent Households in Fort Drum
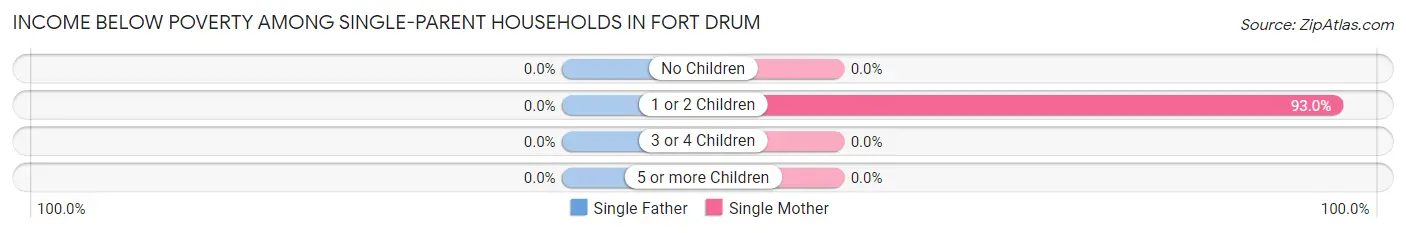
| Children | Single Father | Single Mother |
| No Children | 0 (0.0%) | 0 (0.0%) |
| 1 or 2 Children | 0 (0.0%) | 93 (93.0%) |
| 3 or 4 Children | 0 (0.0%) | 0 (0.0%) |
| 5 or more Children | 0 (0.0%) | 0 (0.0%) |
| Total | 0 (0.0%) | 93 (62.4%) |
Income Below Poverty Among Married-Couple vs Single-Parent Households in Fort Drum
The poverty data for Fort Drum shows that 218 of the married-couple family households (5.9%) and 93 of the single-parent households (55.7%) are living below the poverty level. Within the married-couple family households, those with 3 or 4 children have the highest poverty rate, with 56 households (8.7%) falling below the poverty line. Among the single-parent households, those with 1 or 2 children have the highest poverty rate, with 93 household (78.8%) living below poverty.
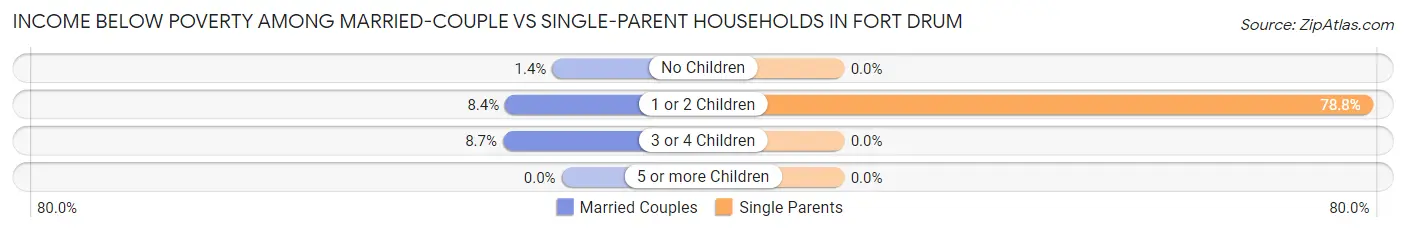
| Children | Married-Couple Families | Single-Parent Households |
| No Children | 17 (1.4%) | 0 (0.0%) |
| 1 or 2 Children | 145 (8.4%) | 93 (78.8%) |
| 3 or 4 Children | 56 (8.7%) | 0 (0.0%) |
| 5 or more Children | 0 (0.0%) | 0 (0.0%) |
| Total | 218 (5.9%) | 93 (55.7%) |
Race in Fort Drum
The most populous races in Fort Drum are White / Caucasian (11,312 | 69.4%), Hispanic or Latino (3,611 | 22.2%), and Black / African American (2,008 | 12.3%).
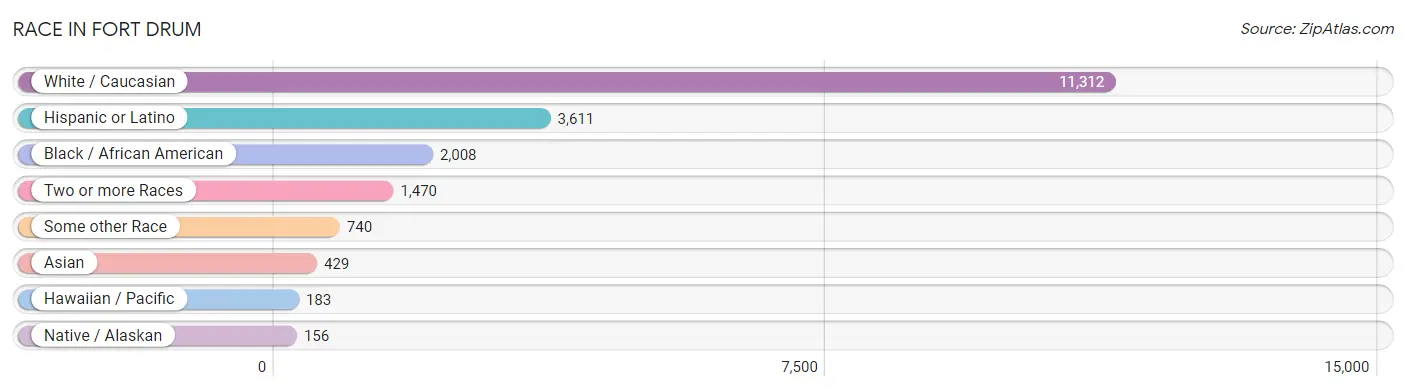
| Race | # Population | % Population |
| Asian | 429 | 2.6% |
| Black / African American | 2,008 | 12.3% |
| Hawaiian / Pacific | 183 | 1.1% |
| Hispanic or Latino | 3,611 | 22.2% |
| Native / Alaskan | 156 | 1.0% |
| White / Caucasian | 11,312 | 69.4% |
| Two or more Races | 1,470 | 9.0% |
| Some other Race | 740 | 4.5% |
| Total | 16,298 | 100.0% |
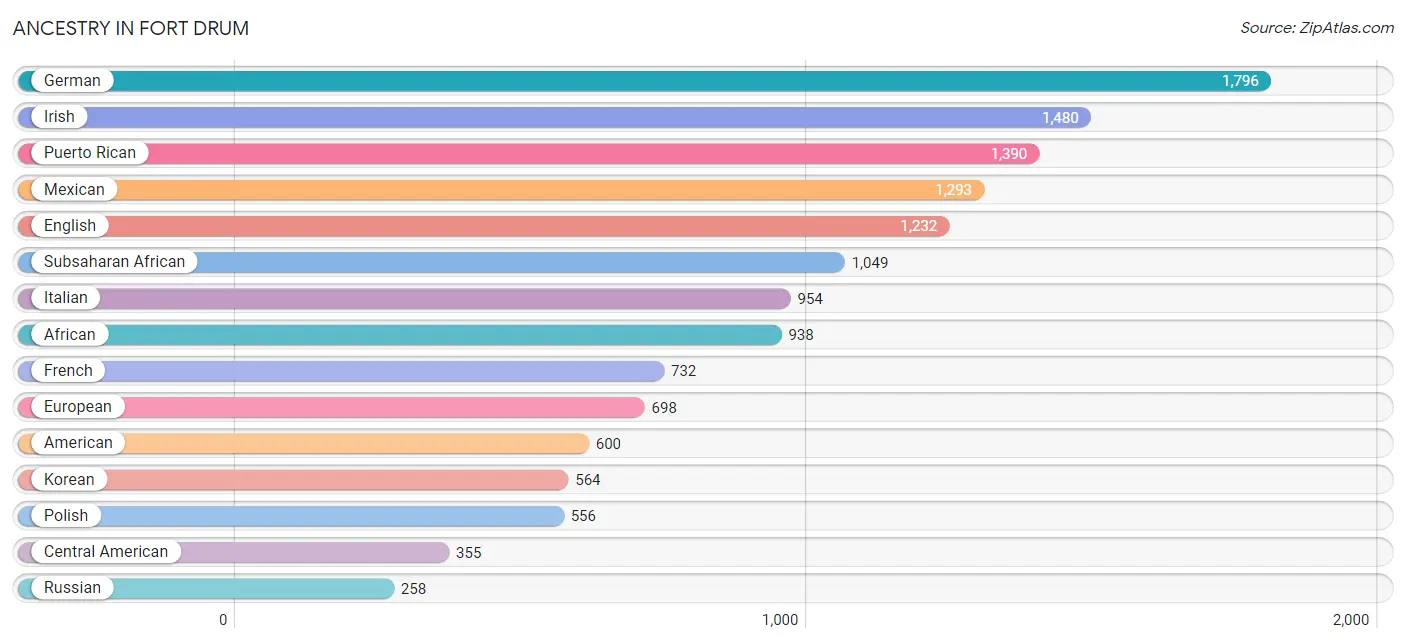
Ancestry in Fort Drum
The most populous ancestries reported in Fort Drum are German (1,796 | 11.0%), Irish (1,480 | 9.1%), Puerto Rican (1,390 | 8.5%), Mexican (1,293 | 7.9%), and English (1,232 | 7.6%), together accounting for 44.1% of all Fort Drum residents.
| Ancestry | # Population | % Population |
| Afghan | 15 | 0.1% |
| African | 938 | 5.8% |
| Albanian | 1 | 0.0% |
| American | 600 | 3.7% |
| Arab | 64 | 0.4% |
| Bhutanese | 92 | 0.6% |
| Blackfeet | 5 | 0.0% |
| Bolivian | 32 | 0.2% |
| Brazilian | 14 | 0.1% |
| British | 24 | 0.2% |
| Burmese | 98 | 0.6% |
| Cambodian | 3 | 0.0% |
| Canadian | 28 | 0.2% |
| Celtic | 12 | 0.1% |
| Central American | 355 | 2.2% |
| Central American Indian | 103 | 0.6% |
| Cherokee | 18 | 0.1% |
| Colombian | 60 | 0.4% |
| Croatian | 52 | 0.3% |
| Cuban | 6 | 0.0% |
| Czech | 40 | 0.3% |
| Czechoslovakian | 47 | 0.3% |
| Danish | 35 | 0.2% |
| Dominican | 139 | 0.9% |
| Dutch | 71 | 0.4% |
| Eastern European | 30 | 0.2% |
| Ecuadorian | 77 | 0.5% |
| English | 1,232 | 7.6% |
| European | 698 | 4.3% |
| Fijian | 36 | 0.2% |
| French | 732 | 4.5% |
| French Canadian | 61 | 0.4% |
| German | 1,796 | 11.0% |
| Ghanaian | 16 | 0.1% |
| Greek | 8 | 0.1% |
| Guamanian / Chamorro | 44 | 0.3% |
| Guatemalan | 76 | 0.5% |
| Haitian | 22 | 0.1% |
| Honduran | 55 | 0.3% |
| Hungarian | 11 | 0.1% |
| Indian (Asian) | 110 | 0.7% |
| Inupiat | 16 | 0.1% |
| Irish | 1,480 | 9.1% |
| Iroquois | 12 | 0.1% |
| Israeli | 50 | 0.3% |
| Italian | 954 | 5.9% |
| Jamaican | 53 | 0.3% |
| Kenyan | 18 | 0.1% |
| Korean | 564 | 3.5% |
| Lebanese | 12 | 0.1% |
| Mexican | 1,293 | 7.9% |
| Mexican American Indian | 4 | 0.0% |
| Native Hawaiian | 66 | 0.4% |
| Navajo | 25 | 0.2% |
| Nigerian | 73 | 0.4% |
| Norwegian | 111 | 0.7% |
| Panamanian | 140 | 0.9% |
| Peruvian | 65 | 0.4% |
| Polish | 556 | 3.4% |
| Portuguese | 72 | 0.4% |
| Puerto Rican | 1,390 | 8.5% |
| Russian | 258 | 1.6% |
| Salvadoran | 84 | 0.5% |
| Samoan | 64 | 0.4% |
| Scandinavian | 122 | 0.7% |
| Scotch-Irish | 62 | 0.4% |
| Scottish | 81 | 0.5% |
| Slovak | 4 | 0.0% |
| Somali | 4 | 0.0% |
| South American | 242 | 1.5% |
| Spaniard | 64 | 0.4% |
| Spanish | 72 | 0.4% |
| Subsaharan African | 1,049 | 6.4% |
| Swedish | 35 | 0.2% |
| Syrian | 10 | 0.1% |
| Thai | 235 | 1.4% |
| Tongan | 55 | 0.3% |
| Trinidadian and Tobagonian | 4 | 0.0% |
| Ukrainian | 4 | 0.0% |
| Venezuelan | 8 | 0.1% |
| Welsh | 41 | 0.3% | View All 81 Rows |
Immigrants in Fort Drum
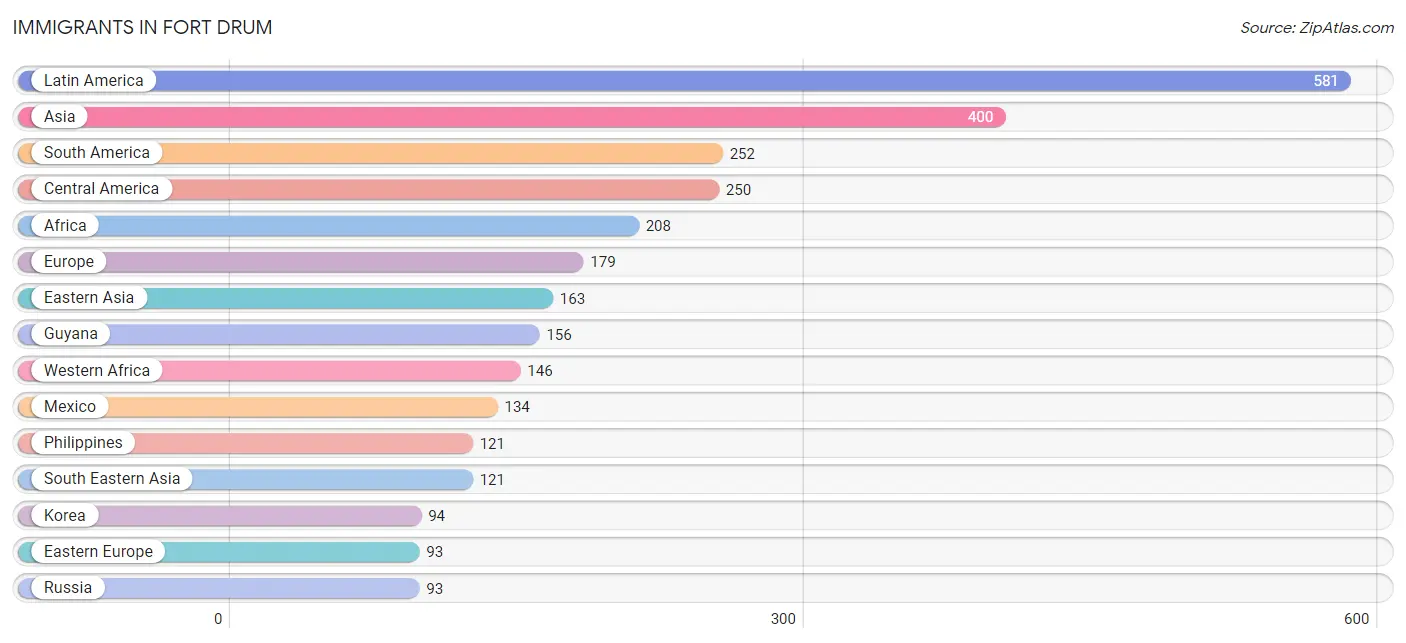
The most numerous immigrant groups reported in Fort Drum came from Latin America (581 | 3.6%), Asia (400 | 2.5%), South America (252 | 1.5%), Central America (250 | 1.5%), and Africa (208 | 1.3%), together accounting for 10.4% of all Fort Drum residents.
| Immigration Origin | # Population | % Population |
| Afghanistan | 15 | 0.1% |
| Africa | 208 | 1.3% |
| Asia | 400 | 2.5% |
| Bolivia | 20 | 0.1% |
| Brazil | 5 | 0.0% |
| Canada | 5 | 0.0% |
| Caribbean | 79 | 0.5% |
| Central America | 250 | 1.5% |
| China | 58 | 0.4% |
| Colombia | 17 | 0.1% |
| Cuba | 2 | 0.0% |
| Dominica | 24 | 0.2% |
| Dominican Republic | 38 | 0.2% |
| Eastern Africa | 18 | 0.1% |
| Eastern Asia | 163 | 1.0% |
| Eastern Europe | 93 | 0.6% |
| Ecuador | 54 | 0.3% |
| El Salvador | 9 | 0.1% |
| Europe | 179 | 1.1% |
| France | 56 | 0.3% |
| Ghana | 16 | 0.1% |
| Guyana | 156 | 1.0% |
| Haiti | 13 | 0.1% |
| Honduras | 55 | 0.3% |
| Israel | 32 | 0.2% |
| Jamaica | 1 | 0.0% |
| Japan | 8 | 0.1% |
| Kazakhstan | 14 | 0.1% |
| Kenya | 18 | 0.1% |
| Korea | 94 | 0.6% |
| Latin America | 581 | 3.6% |
| Mexico | 134 | 0.8% |
| Middle Africa | 44 | 0.3% |
| Nepal | 45 | 0.3% |
| Nigeria | 15 | 0.1% |
| Northern Europe | 6 | 0.0% |
| Panama | 52 | 0.3% |
| Philippines | 121 | 0.7% |
| Russia | 93 | 0.6% |
| Senegal | 11 | 0.1% |
| South America | 252 | 1.5% |
| South Central Asia | 74 | 0.4% |
| South Eastern Asia | 121 | 0.7% |
| Southern Europe | 24 | 0.2% |
| Spain | 24 | 0.2% |
| St. Vincent and the Grenadines | 1 | 0.0% |
| Syria | 10 | 0.1% |
| Western Africa | 146 | 0.9% |
| Western Asia | 42 | 0.3% |
| Western Europe | 56 | 0.3% |
| Zaire | 17 | 0.1% | View All 51 Rows |
Sex and Age in Fort Drum
Sex and Age in Fort Drum
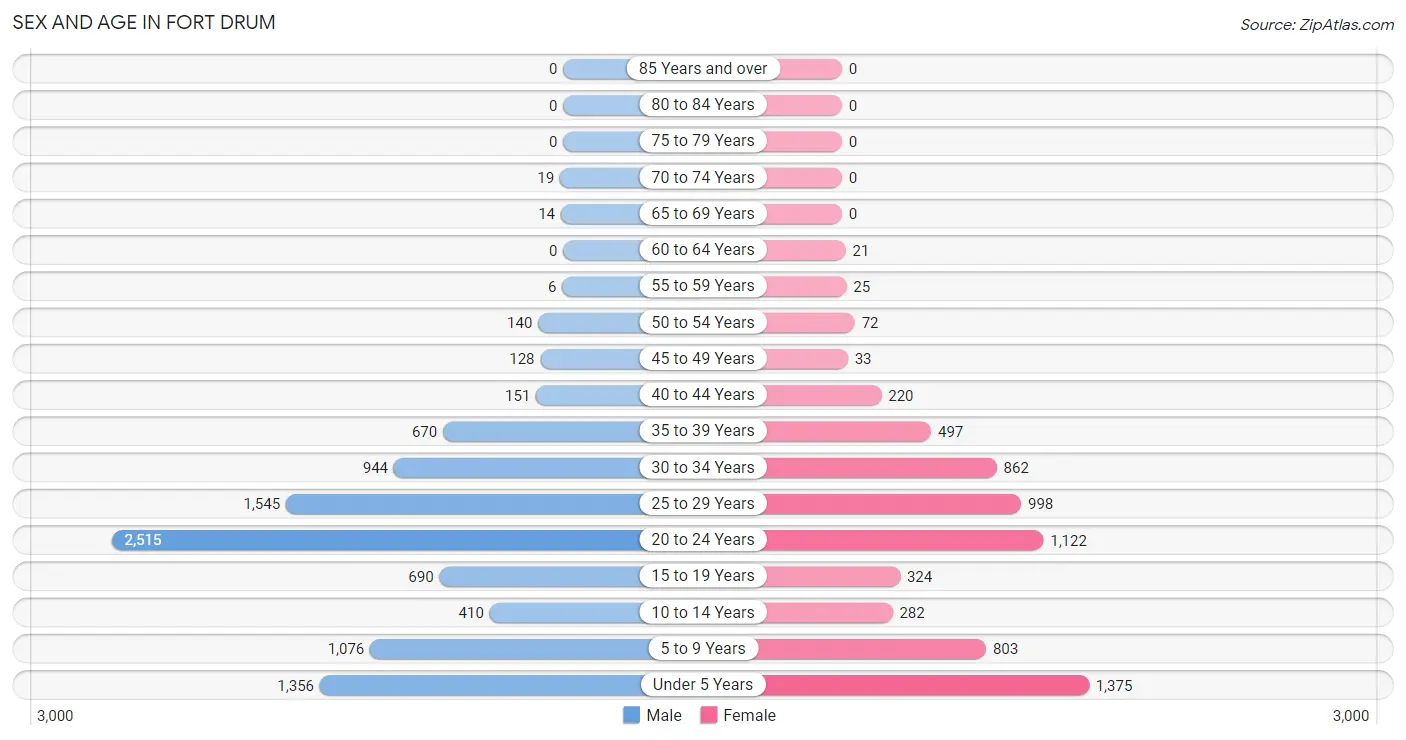
The most populous age groups in Fort Drum are 20 to 24 Years (2,515 | 26.0%) for men and Under 5 Years (1,375 | 20.7%) for women.
| Age Bracket | Male | Female |
| Under 5 Years | 1,356 (14.0%) | 1,375 (20.7%) |
| 5 to 9 Years | 1,076 (11.1%) | 803 (12.1%) |
| 10 to 14 Years | 410 (4.2%) | 282 (4.3%) |
| 15 to 19 Years | 690 (7.1%) | 324 (4.9%) |
| 20 to 24 Years | 2,515 (26.0%) | 1,122 (16.9%) |
| 25 to 29 Years | 1,545 (16.0%) | 998 (15.0%) |
| 30 to 34 Years | 944 (9.8%) | 862 (13.0%) |
| 35 to 39 Years | 670 (6.9%) | 497 (7.5%) |
| 40 to 44 Years | 151 (1.6%) | 220 (3.3%) |
| 45 to 49 Years | 128 (1.3%) | 33 (0.5%) |
| 50 to 54 Years | 140 (1.5%) | 72 (1.1%) |
| 55 to 59 Years | 6 (0.1%) | 25 (0.4%) |
| 60 to 64 Years | 0 (0.0%) | 21 (0.3%) |
| 65 to 69 Years | 14 (0.1%) | 0 (0.0%) |
| 70 to 74 Years | 19 (0.2%) | 0 (0.0%) |
| 75 to 79 Years | 0 (0.0%) | 0 (0.0%) |
| 80 to 84 Years | 0 (0.0%) | 0 (0.0%) |
| 85 Years and over | 0 (0.0%) | 0 (0.0%) |
| Total | 9,664 (100.0%) | 6,634 (100.0%) |
Families and Households in Fort Drum
Median Family Size in Fort Drum
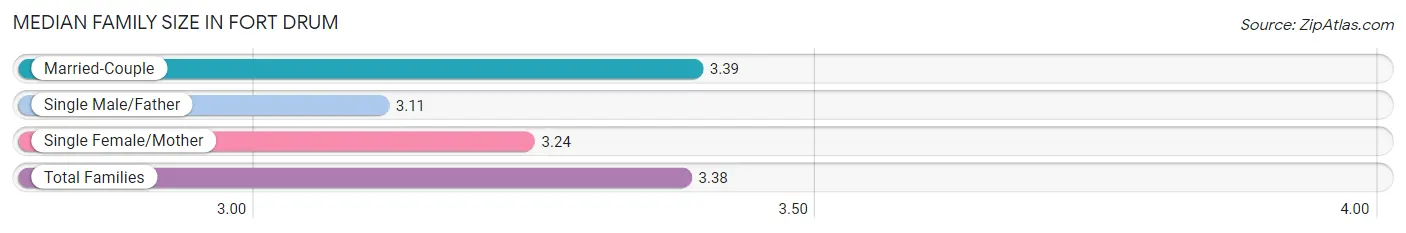
The median family size in Fort Drum is 3.38 persons per family, with married-couple families (3,670 | 95.7%) accounting for the largest median family size of 3.39 persons per family. On the other hand, single male/father families (18 | 0.5%) represent the smallest median family size with 3.11 persons per family.
| Family Type | # Families | Family Size |
| Married-Couple | 3,670 (95.7%) | 3.39 |
| Single Male/Father | 18 (0.5%) | 3.11 |
| Single Female/Mother | 149 (3.9%) | 3.24 |
| Total Families | 3,837 (100.0%) | 3.38 |
Median Household Size in Fort Drum
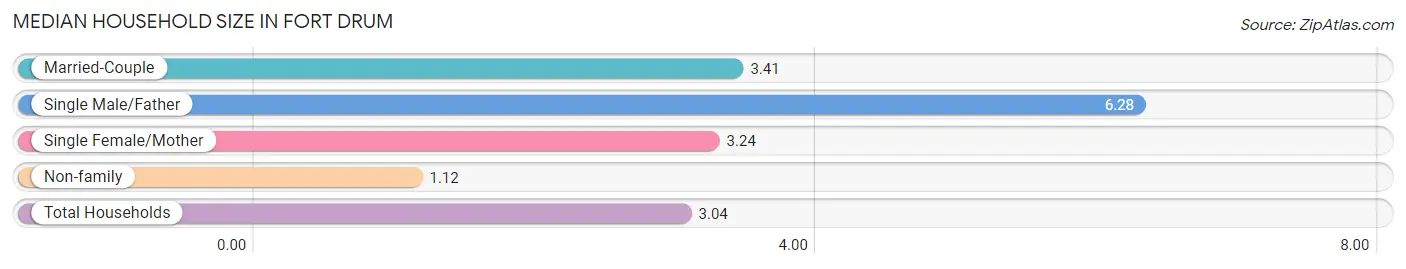
The median household size in Fort Drum is 3.04 persons per household, with single male/father households (18 | 0.4%) accounting for the largest median household size of 6.28 persons per household. non-family households (749 | 16.3%) represent the smallest median household size with 1.12 persons per household.
| Household Type | # Households | Household Size |
| Married-Couple | 3,670 (80.0%) | 3.41 |
| Single Male/Father | 18 (0.4%) | 6.28 |
| Single Female/Mother | 149 (3.3%) | 3.24 |
| Non-family | 749 (16.3%) | 1.12 |
| Total Households | 4,586 (100.0%) | 3.04 |
Household Size by Marriage Status in Fort Drum
Out of a total of 4,586 households in Fort Drum, 3,837 (83.7%) are family households, while 749 (16.3%) are nonfamily households. The most numerous type of family households are 2-person households, comprising 1,257, and the most common type of nonfamily households are 1-person households, comprising 666.
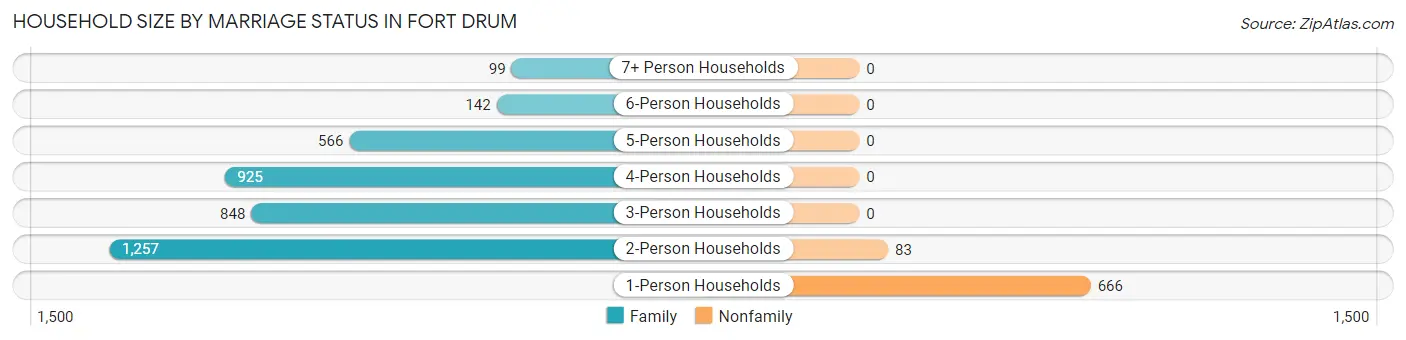
| Household Size | Family Households | Nonfamily Households |
| 1-Person Households | - | 666 (14.5%) |
| 2-Person Households | 1,257 (27.4%) | 83 (1.8%) |
| 3-Person Households | 848 (18.5%) | 0 (0.0%) |
| 4-Person Households | 925 (20.2%) | 0 (0.0%) |
| 5-Person Households | 566 (12.3%) | 0 (0.0%) |
| 6-Person Households | 142 (3.1%) | 0 (0.0%) |
| 7+ Person Households | 99 (2.2%) | 0 (0.0%) |
| Total | 3,837 (83.7%) | 749 (16.3%) |
Female Fertility in Fort Drum
Fertility by Age in Fort Drum
Average fertility rate in Fort Drum is 189.0 births per 1,000 women. Women in the age bracket of 35 to 50 years have the highest fertility rate with 207.0 births per 1,000 women. Women in the age bracket of 20 to 34 years acount for 77.7% of all women with births.
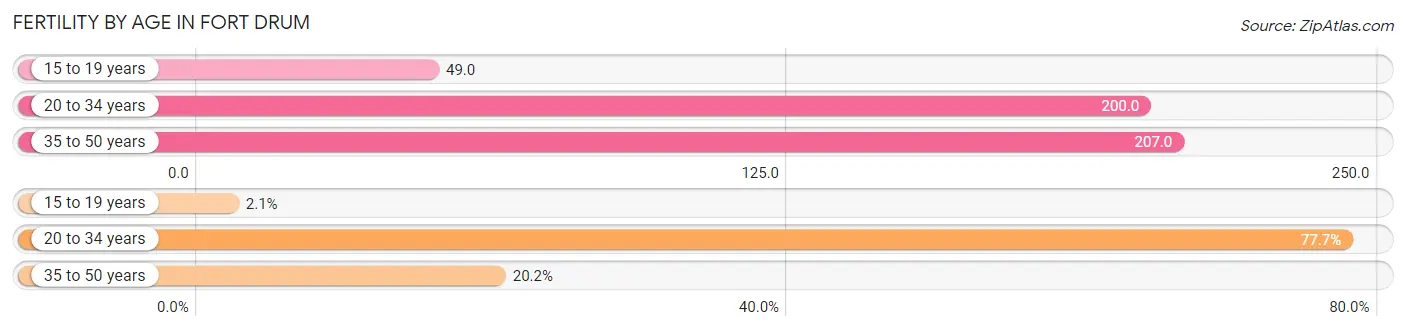
| Age Bracket | Women with Births | Births / 1,000 Women |
| 15 to 19 years | 16 (2.1%) | 49.0 |
| 20 to 34 years | 596 (77.7%) | 200.0 |
| 35 to 50 years | 155 (20.2%) | 207.0 |
| Total | 767 (100.0%) | 189.0 |
Fertility by Age by Marriage Status in Fort Drum
94.1% of women with births (767) in Fort Drum are married. The highest percentage of unmarried women with births falls into 20 to 34 years age bracket with 7.5% of them unmarried at the time of birth, while the lowest percentage of unmarried women with births belong to 15 to 19 years age bracket with 0.0% of them unmarried.
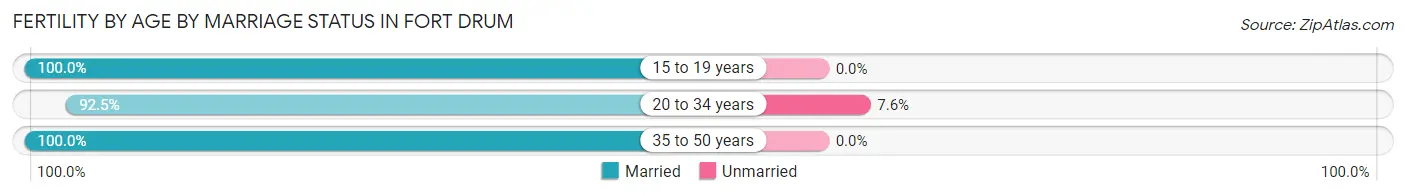
| Age Bracket | Married | Unmarried |
| 15 to 19 years | 16 (100.0%) | 0 (0.0%) |
| 20 to 34 years | 551 (92.4%) | 45 (7.5%) |
| 35 to 50 years | 155 (100.0%) | 0 (0.0%) |
| Total | 722 (94.1%) | 45 (5.9%) |
Fertility by Education in Fort Drum
Average fertility rate in Fort Drum is 189.0 births per 1,000 women. Women with the education attainment of bachelor's degree have the highest fertility rate of 276.0 births per 1,000 women, while women with the education attainment of college or associate's degree have the lowest fertility at 111.0 births per 1,000 women. Women with the education attainment of bachelor's degree represent 34.0% of all women with births.
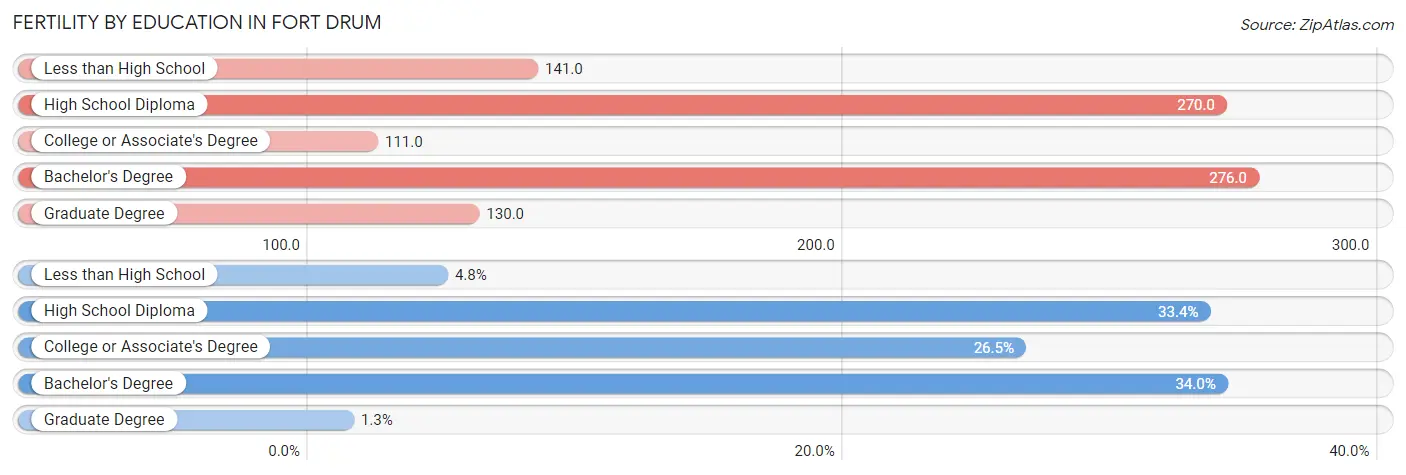
| Educational Attainment | Women with Births | Births / 1,000 Women |
| Less than High School | 37 (4.8%) | 141.0 |
| High School Diploma | 256 (33.4%) | 270.0 |
| College or Associate's Degree | 203 (26.5%) | 111.0 |
| Bachelor's Degree | 261 (34.0%) | 276.0 |
| Graduate Degree | 10 (1.3%) | 130.0 |
| Total | 767 (100.0%) | 189.0 |
Fertility by Education by Marriage Status in Fort Drum
5.9% of women with births in Fort Drum are unmarried. Women with the educational attainment of less than high school are most likely to be married with 100.0% of them married at childbirth, while women with the educational attainment of high school diploma are least likely to be married with 17.6% of them unmarried at childbirth.
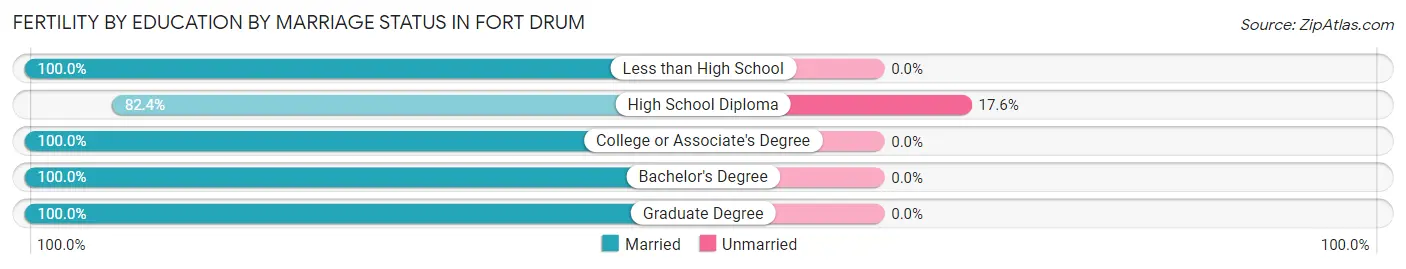
| Educational Attainment | Married | Unmarried |
| Less than High School | 37 (100.0%) | 0 (0.0%) |
| High School Diploma | 211 (82.4%) | 45 (17.6%) |
| College or Associate's Degree | 203 (100.0%) | 0 (0.0%) |
| Bachelor's Degree | 261 (100.0%) | 0 (0.0%) |
| Graduate Degree | 10 (100.0%) | 0 (0.0%) |
| Total | 722 (94.1%) | 45 (5.9%) |
Employment Characteristics in Fort Drum
Employment by Class of Employer in Fort Drum
Among the 8,291 employed individuals in Fort Drum, federal government employees (6,572 | 79.3%), private company employees (1,106 | 13.3%), and self-employed (not incorporated) (321 | 3.9%) make up the most common classes of employment.
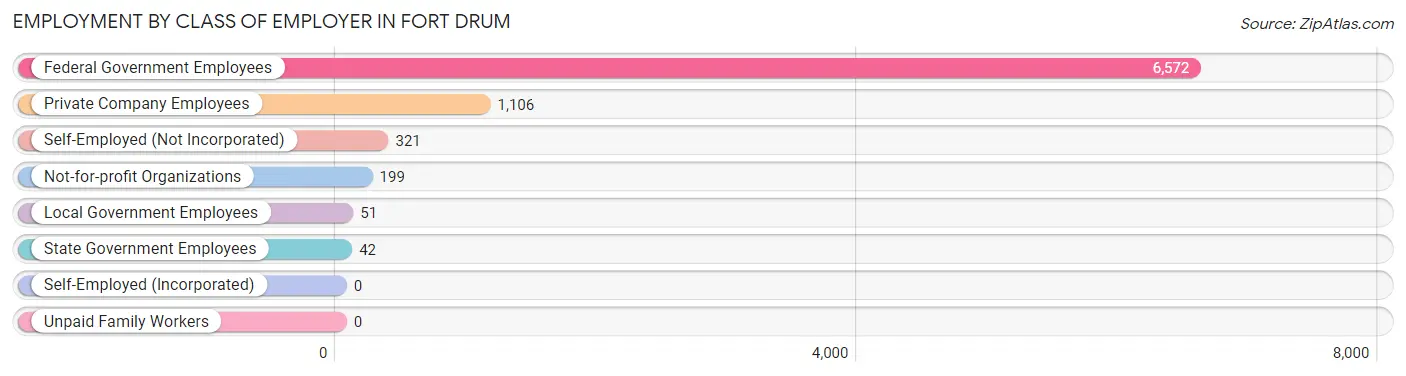
| Employer Class | # Employees | % Employees |
| Private Company Employees | 1,106 | 13.3% |
| Self-Employed (Incorporated) | 0 | 0.0% |
| Self-Employed (Not Incorporated) | 321 | 3.9% |
| Not-for-profit Organizations | 199 | 2.4% |
| Local Government Employees | 51 | 0.6% |
| State Government Employees | 42 | 0.5% |
| Federal Government Employees | 6,572 | 79.3% |
| Unpaid Family Workers | 0 | 0.0% |
| Total | 8,291 | 100.0% |
Employment Status by Age in Fort Drum
According to the labor force statistics for Fort Drum, out of the total population over 16 years of age (10,932), 79.0% or 8,636 individuals are in the labor force, with 9.7% or 838 of them unemployed. The age group with the highest labor force participation rate is 60 to 64 years, with 100.0% or 21 individuals in the labor force. Within the labor force, the 30 to 34 years age range has the highest percentage of unemployed individuals, with 26.2% or 352 of them being unemployed.
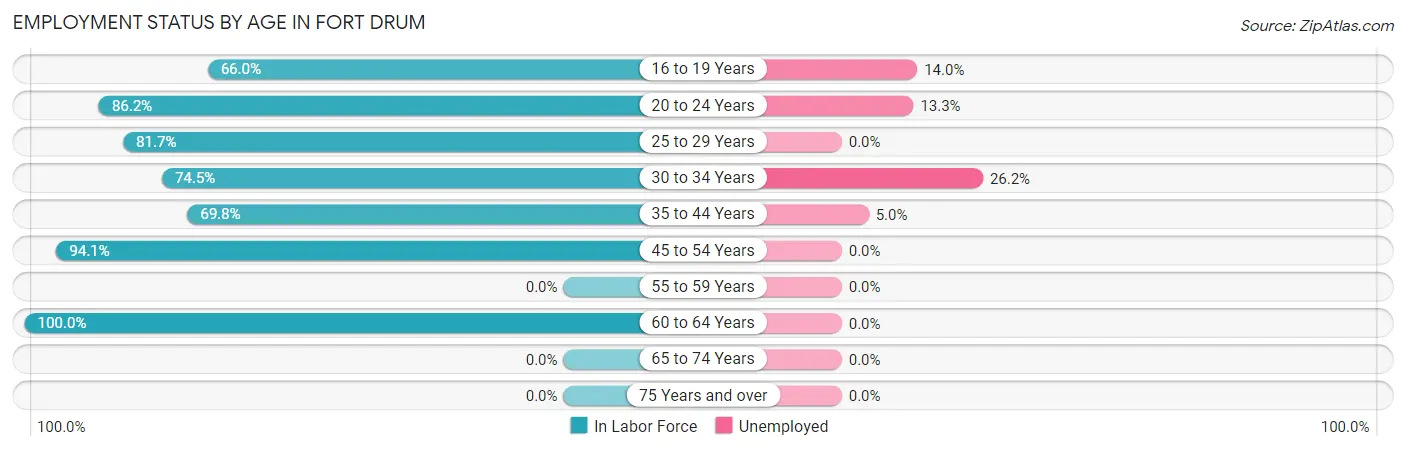
| Age Bracket | In Labor Force | Unemployed |
| 16 to 19 Years | 627 (66.0%) | 88 (14.0%) |
| 20 to 24 Years | 3,135 (86.2%) | 417 (13.3%) |
| 25 to 29 Years | 2,078 (81.7%) | 0 (0.0%) |
| 30 to 34 Years | 1,345 (74.5%) | 352 (26.2%) |
| 35 to 44 Years | 1,074 (69.8%) | 54 (5.0%) |
| 45 to 54 Years | 351 (94.1%) | 0 (0.0%) |
| 55 to 59 Years | 0 (0.0%) | 0 (0.0%) |
| 60 to 64 Years | 21 (100.0%) | 0 (0.0%) |
| 65 to 74 Years | 0 (0.0%) | 0 (0.0%) |
| 75 Years and over | 0 (0.0%) | 0 (0.0%) |
| Total | 8,636 (79.0%) | 838 (9.7%) |
Employment Status by Educational Attainment in Fort Drum
According to labor force statistics for Fort Drum, 77.2% of individuals (4,873) out of the total population between 25 and 64 years of age (6,312) are in the labor force, with 7.9% or 385 of them being unemployed. The group with the highest labor force participation rate are those with the educational attainment of high school diploma, with 81.0% or 861 individuals in the labor force. Within the labor force, individuals with bachelor's degree or higher education have the highest percentage of unemployment, with 15.4% or 207 of them being unemployed.
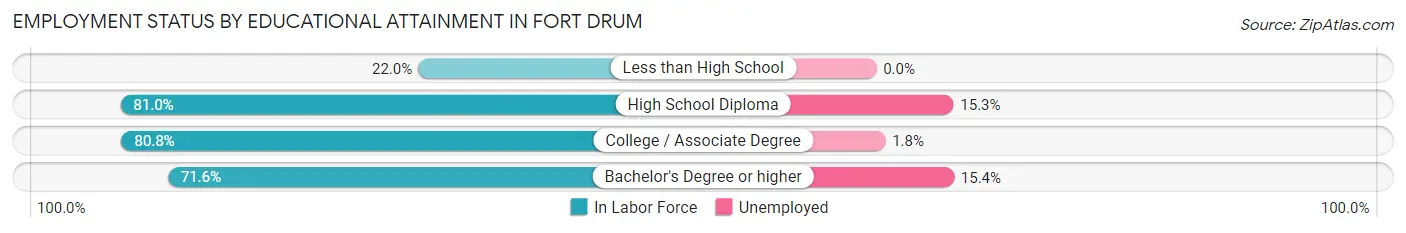
| Educational Attainment | In Labor Force | Unemployed |
| Less than High School | 22 (22.0%) | 0 (0.0%) |
| High School Diploma | 861 (81.0%) | 163 (15.3%) |
| College / Associate Degree | 2,642 (80.8%) | 59 (1.8%) |
| Bachelor's Degree or higher | 1,345 (71.6%) | 289 (15.4%) |
| Total | 4,873 (77.2%) | 499 (7.9%) |
Employment Occupations by Sex in Fort Drum
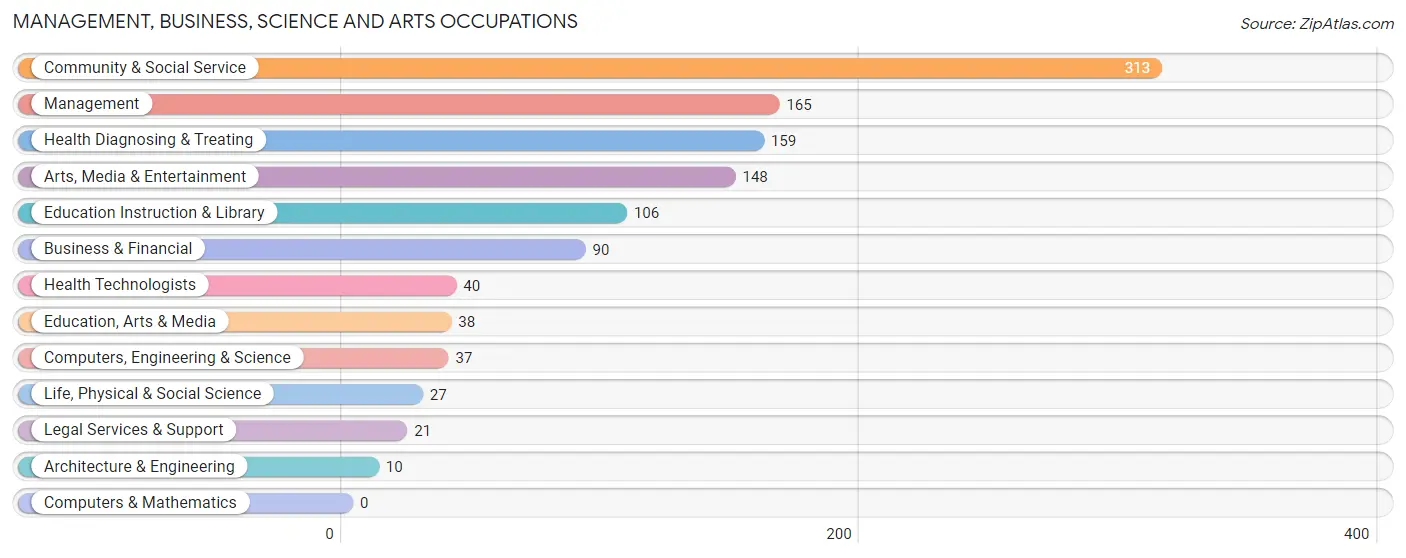
Management, Business, Science and Arts Occupations
The most common Management, Business, Science and Arts occupations in Fort Drum are Community & Social Service (313 | 13.0%), Management (165 | 6.9%), Health Diagnosing & Treating (159 | 6.6%), Arts, Media & Entertainment (148 | 6.1%), and Education Instruction & Library (106 | 4.4%).
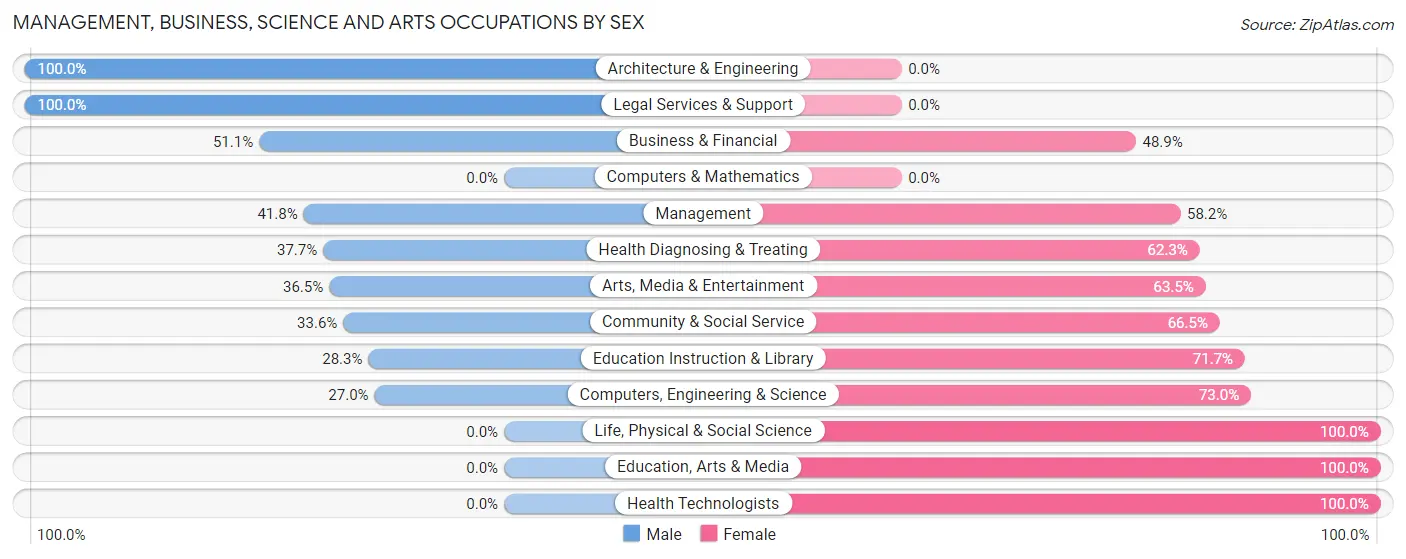
Management, Business, Science and Arts Occupations by Sex
Within the Management, Business, Science and Arts occupations in Fort Drum, the most male-oriented occupations are Architecture & Engineering (100.0%), Legal Services & Support (100.0%), and Business & Financial (51.1%), while the most female-oriented occupations are Life, Physical & Social Science (100.0%), Education, Arts & Media (100.0%), and Health Technologists (100.0%).
| Occupation | Male | Female |
| Management | 69 (41.8%) | 96 (58.2%) |
| Business & Financial | 46 (51.1%) | 44 (48.9%) |
| Computers, Engineering & Science | 10 (27.0%) | 27 (73.0%) |
| Computers & Mathematics | 0 (0.0%) | 0 (0.0%) |
| Architecture & Engineering | 10 (100.0%) | 0 (0.0%) |
| Life, Physical & Social Science | 0 (0.0%) | 27 (100.0%) |
| Community & Social Service | 105 (33.6%) | 208 (66.4%) |
| Education, Arts & Media | 0 (0.0%) | 38 (100.0%) |
| Legal Services & Support | 21 (100.0%) | 0 (0.0%) |
| Education Instruction & Library | 30 (28.3%) | 76 (71.7%) |
| Arts, Media & Entertainment | 54 (36.5%) | 94 (63.5%) |
| Health Diagnosing & Treating | 60 (37.7%) | 99 (62.3%) |
| Health Technologists | 0 (0.0%) | 40 (100.0%) |
| Total (Category) | 290 (38.0%) | 474 (62.0%) |
| Total (Overall) | 891 (37.0%) | 1,519 (63.0%) |
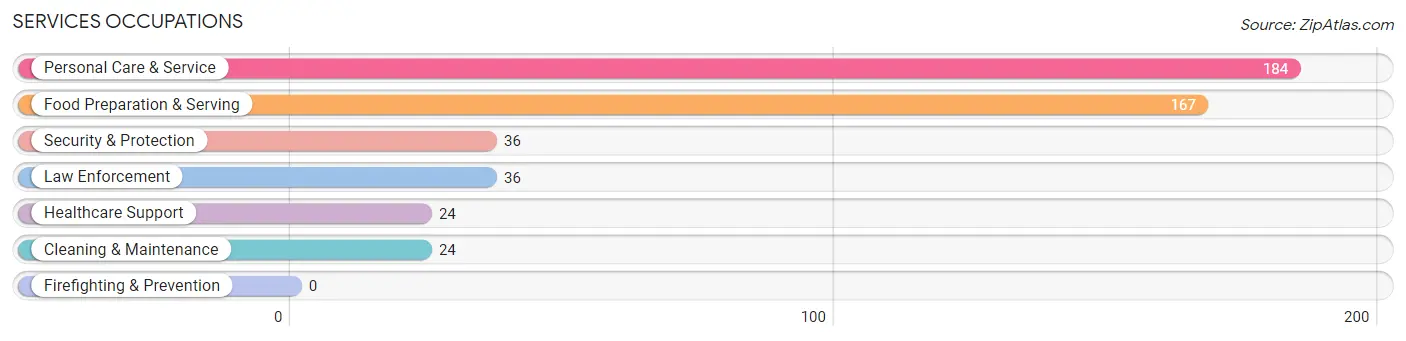
Services Occupations
The most common Services occupations in Fort Drum are Personal Care & Service (184 | 7.6%), Food Preparation & Serving (167 | 6.9%), Security & Protection (36 | 1.5%), Law Enforcement (36 | 1.5%), and Healthcare Support (24 | 1.0%).
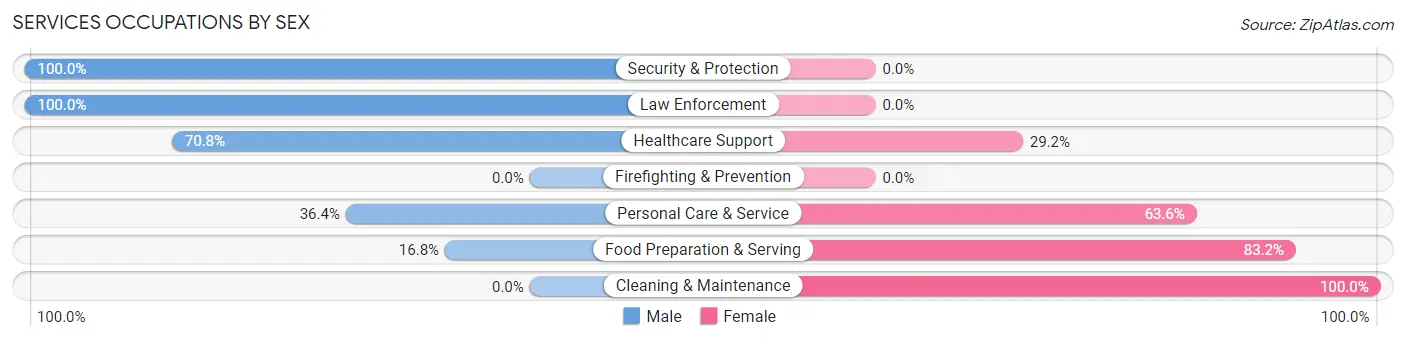
Services Occupations by Sex
Within the Services occupations in Fort Drum, the most male-oriented occupations are Security & Protection (100.0%), Law Enforcement (100.0%), and Healthcare Support (70.8%), while the most female-oriented occupations are Cleaning & Maintenance (100.0%), Food Preparation & Serving (83.2%), and Personal Care & Service (63.6%).
| Occupation | Male | Female |
| Healthcare Support | 17 (70.8%) | 7 (29.2%) |
| Security & Protection | 36 (100.0%) | 0 (0.0%) |
| Firefighting & Prevention | 0 (0.0%) | 0 (0.0%) |
| Law Enforcement | 36 (100.0%) | 0 (0.0%) |
| Food Preparation & Serving | 28 (16.8%) | 139 (83.2%) |
| Cleaning & Maintenance | 0 (0.0%) | 24 (100.0%) |
| Personal Care & Service | 67 (36.4%) | 117 (63.6%) |
| Total (Category) | 148 (34.0%) | 287 (66.0%) |
| Total (Overall) | 891 (37.0%) | 1,519 (63.0%) |
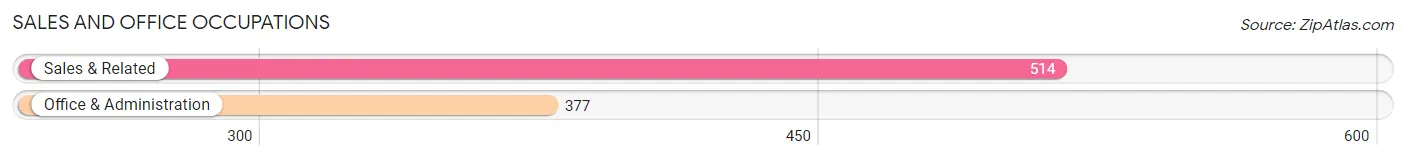
Sales and Office Occupations
The most common Sales and Office occupations in Fort Drum are Sales & Related (514 | 21.3%), and Office & Administration (377 | 15.6%).
Sales and Office Occupations by Sex
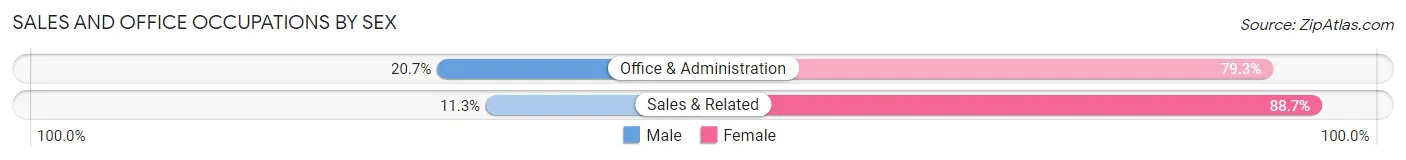
| Occupation | Male | Female |
| Sales & Related | 58 (11.3%) | 456 (88.7%) |
| Office & Administration | 78 (20.7%) | 299 (79.3%) |
| Total (Category) | 136 (15.3%) | 755 (84.7%) |
| Total (Overall) | 891 (37.0%) | 1,519 (63.0%) |
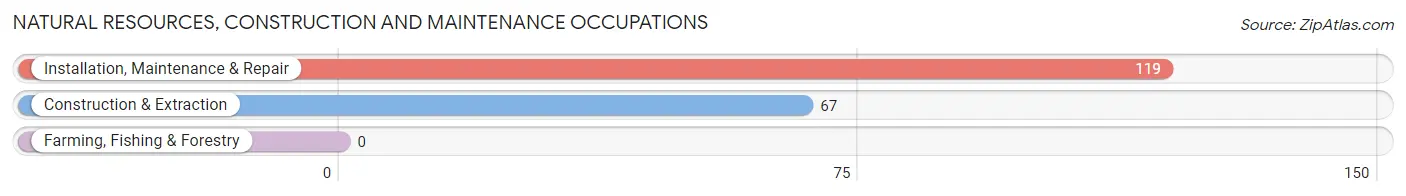
Natural Resources, Construction and Maintenance Occupations
The most common Natural Resources, Construction and Maintenance occupations in Fort Drum are Installation, Maintenance & Repair (119 | 4.9%), and Construction & Extraction (67 | 2.8%).
Natural Resources, Construction and Maintenance Occupations by Sex
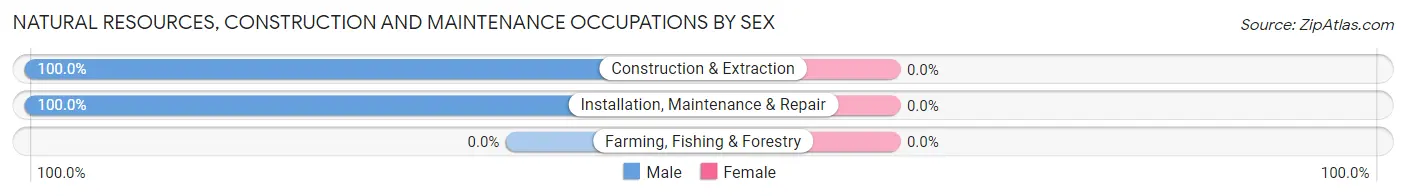
| Occupation | Male | Female |
| Farming, Fishing & Forestry | 0 (0.0%) | 0 (0.0%) |
| Construction & Extraction | 67 (100.0%) | 0 (0.0%) |
| Installation, Maintenance & Repair | 119 (100.0%) | 0 (0.0%) |
| Total (Category) | 186 (100.0%) | 0 (0.0%) |
| Total (Overall) | 891 (37.0%) | 1,519 (63.0%) |
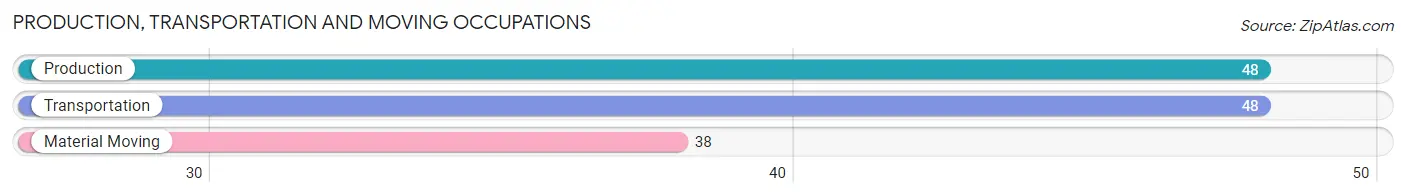
Production, Transportation and Moving Occupations
The most common Production, Transportation and Moving occupations in Fort Drum are Production (48 | 2.0%), Transportation (48 | 2.0%), and Material Moving (38 | 1.6%).
Production, Transportation and Moving Occupations by Sex
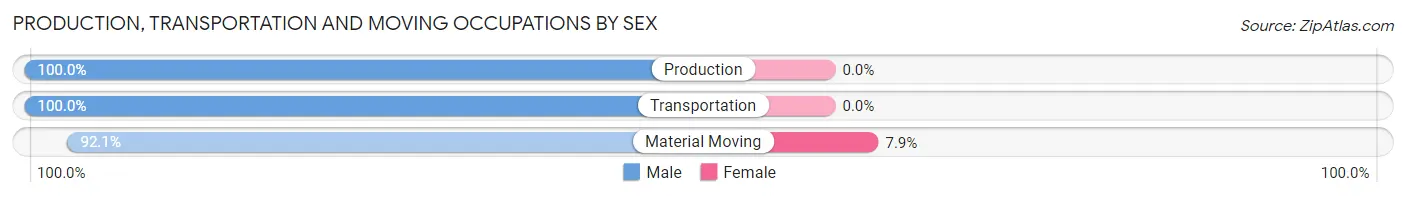
| Occupation | Male | Female |
| Production | 48 (100.0%) | 0 (0.0%) |
| Transportation | 48 (100.0%) | 0 (0.0%) |
| Material Moving | 35 (92.1%) | 3 (7.9%) |
| Total (Category) | 131 (97.8%) | 3 (2.2%) |
| Total (Overall) | 891 (37.0%) | 1,519 (63.0%) |
Employment Industries by Sex in Fort Drum
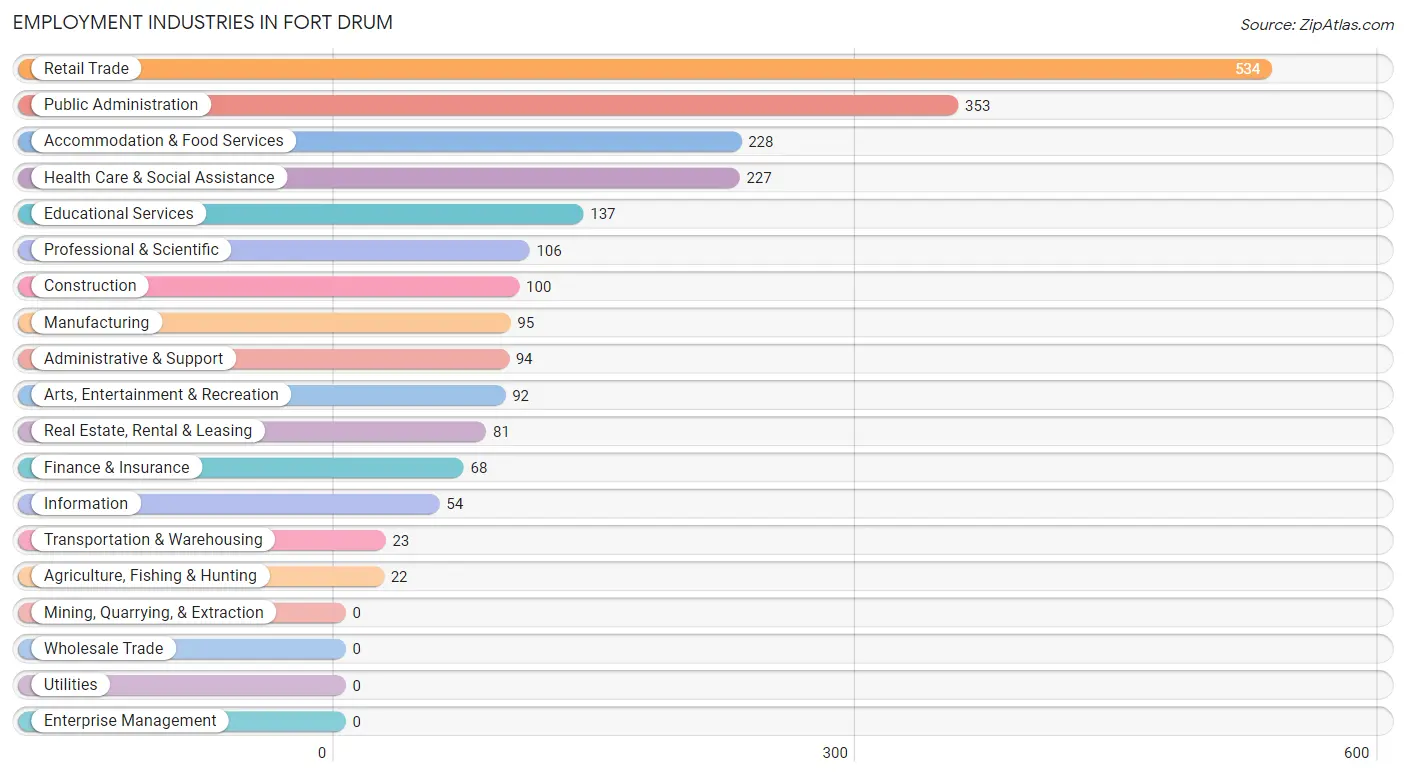
Employment Industries in Fort Drum
The major employment industries in Fort Drum include Retail Trade (534 | 22.2%), Public Administration (353 | 14.6%), Accommodation & Food Services (228 | 9.5%), Health Care & Social Assistance (227 | 9.4%), and Educational Services (137 | 5.7%).
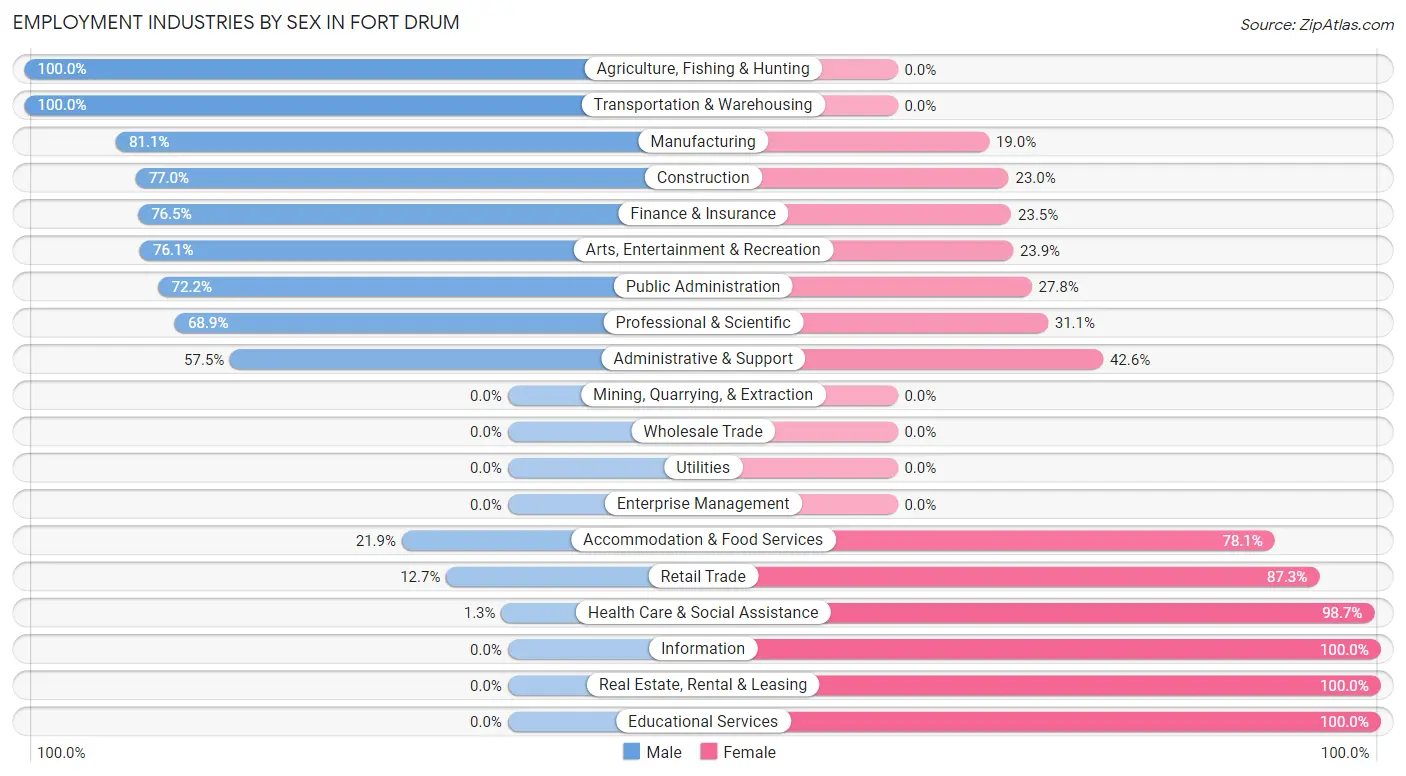
Employment Industries by Sex in Fort Drum
The Fort Drum industries that see more men than women are Agriculture, Fishing & Hunting (100.0%), Transportation & Warehousing (100.0%), and Manufacturing (81.0%), whereas the industries that tend to have a higher number of women are Information (100.0%), Real Estate, Rental & Leasing (100.0%), and Educational Services (100.0%).
| Industry | Male | Female |
| Agriculture, Fishing & Hunting | 22 (100.0%) | 0 (0.0%) |
| Mining, Quarrying, & Extraction | 0 (0.0%) | 0 (0.0%) |
| Construction | 77 (77.0%) | 23 (23.0%) |
| Manufacturing | 77 (81.0%) | 18 (19.0%) |
| Wholesale Trade | 0 (0.0%) | 0 (0.0%) |
| Retail Trade | 68 (12.7%) | 466 (87.3%) |
| Transportation & Warehousing | 23 (100.0%) | 0 (0.0%) |
| Utilities | 0 (0.0%) | 0 (0.0%) |
| Information | 0 (0.0%) | 54 (100.0%) |
| Finance & Insurance | 52 (76.5%) | 16 (23.5%) |
| Real Estate, Rental & Leasing | 0 (0.0%) | 81 (100.0%) |
| Professional & Scientific | 73 (68.9%) | 33 (31.1%) |
| Enterprise Management | 0 (0.0%) | 0 (0.0%) |
| Administrative & Support | 54 (57.5%) | 40 (42.5%) |
| Educational Services | 0 (0.0%) | 137 (100.0%) |
| Health Care & Social Assistance | 3 (1.3%) | 224 (98.7%) |
| Arts, Entertainment & Recreation | 70 (76.1%) | 22 (23.9%) |
| Accommodation & Food Services | 50 (21.9%) | 178 (78.1%) |
| Public Administration | 255 (72.2%) | 98 (27.8%) |
| Total | 891 (37.0%) | 1,519 (63.0%) |
Education in Fort Drum
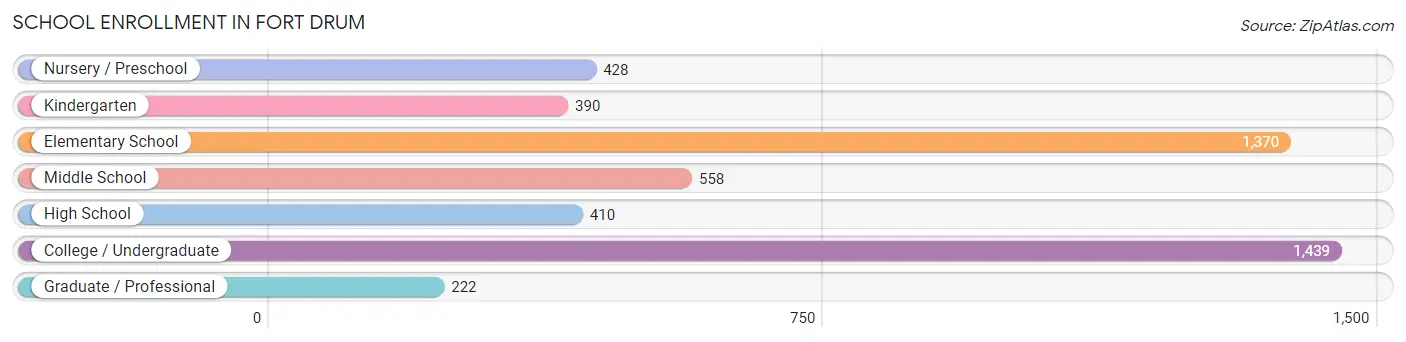
School Enrollment in Fort Drum
The most common levels of schooling among the 4,817 students in Fort Drum are college / undergraduate (1,439 | 29.9%), elementary school (1,370 | 28.4%), and middle school (558 | 11.6%).
| School Level | # Students | % Students |
| Nursery / Preschool | 428 | 8.9% |
| Kindergarten | 390 | 8.1% |
| Elementary School | 1,370 | 28.4% |
| Middle School | 558 | 11.6% |
| High School | 410 | 8.5% |
| College / Undergraduate | 1,439 | 29.9% |
| Graduate / Professional | 222 | 4.6% |
| Total | 4,817 | 100.0% |
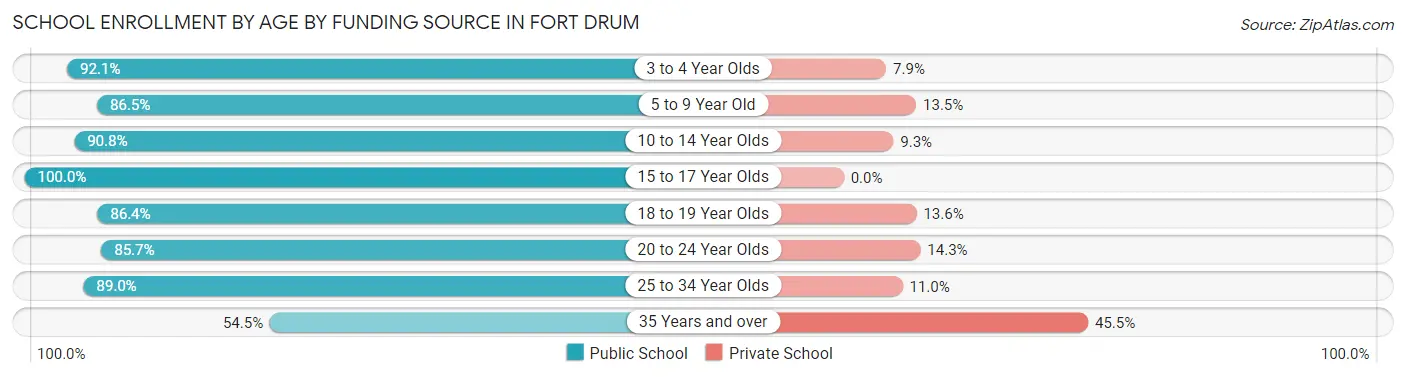
School Enrollment by Age by Funding Source in Fort Drum
Out of a total of 4,817 students who are enrolled in schools in Fort Drum, 641 (13.3%) attend a private institution, while the remaining 4,176 (86.7%) are enrolled in public schools. The age group of 35 years and over has the highest likelihood of being enrolled in private schools, with 122 (45.5% in the age bracket) enrolled. Conversely, the age group of 15 to 17 year olds has the lowest likelihood of being enrolled in a private school, with 283 (100.0% in the age bracket) attending a public institution.
| Age Bracket | Public School | Private School |
| 3 to 4 Year Olds | 256 (92.1%) | 22 (7.9%) |
| 5 to 9 Year Old | 1,584 (86.5%) | 247 (13.5%) |
| 10 to 14 Year Olds | 628 (90.7%) | 64 (9.2%) |
| 15 to 17 Year Olds | 283 (100.0%) | 0 (0.0%) |
| 18 to 19 Year Olds | 153 (86.4%) | 24 (13.6%) |
| 20 to 24 Year Olds | 588 (85.7%) | 98 (14.3%) |
| 25 to 34 Year Olds | 536 (89.0%) | 66 (11.0%) |
| 35 Years and over | 146 (54.5%) | 122 (45.5%) |
| Total | 4,176 (86.7%) | 641 (13.3%) |
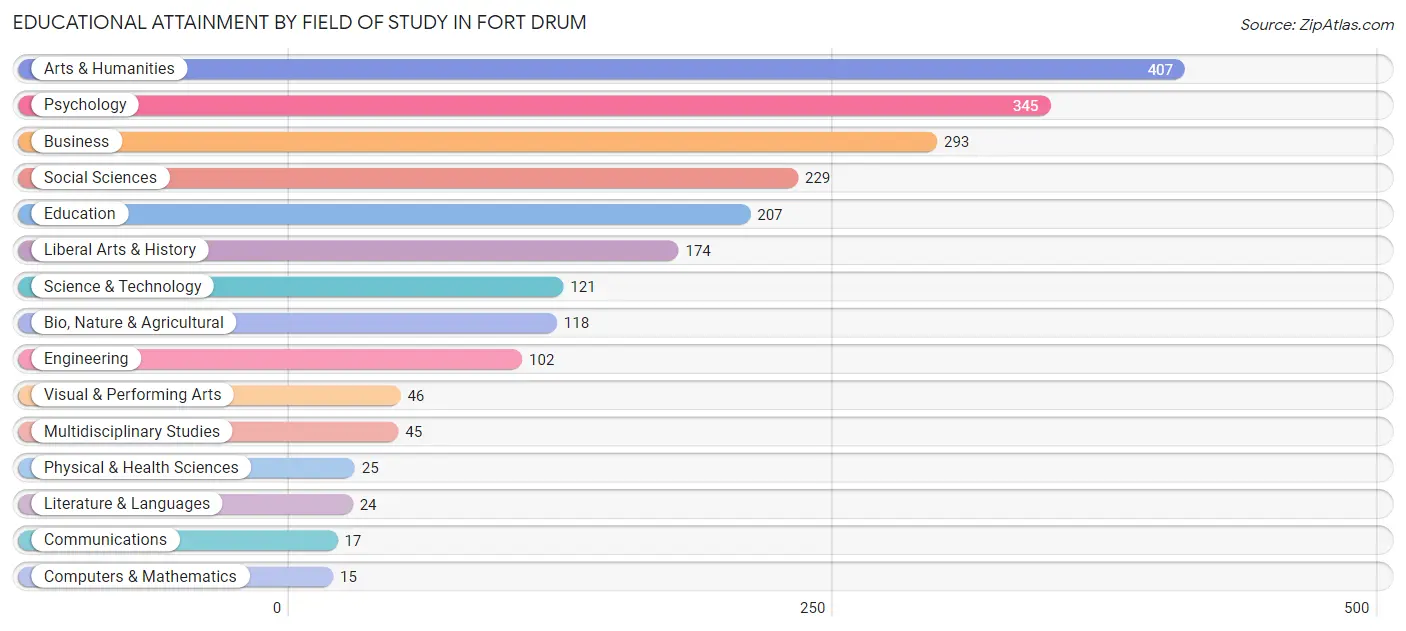
Educational Attainment by Field of Study in Fort Drum
Arts & humanities (407 | 18.8%), psychology (345 | 15.9%), business (293 | 13.5%), social sciences (229 | 10.6%), and education (207 | 9.6%) are the most common fields of study among 2,168 individuals in Fort Drum who have obtained a bachelor's degree or higher.
| Field of Study | # Graduates | % Graduates |
| Computers & Mathematics | 15 | 0.7% |
| Bio, Nature & Agricultural | 118 | 5.4% |
| Physical & Health Sciences | 25 | 1.1% |
| Psychology | 345 | 15.9% |
| Social Sciences | 229 | 10.6% |
| Engineering | 102 | 4.7% |
| Multidisciplinary Studies | 45 | 2.1% |
| Science & Technology | 121 | 5.6% |
| Business | 293 | 13.5% |
| Education | 207 | 9.6% |
| Literature & Languages | 24 | 1.1% |
| Liberal Arts & History | 174 | 8.0% |
| Visual & Performing Arts | 46 | 2.1% |
| Communications | 17 | 0.8% |
| Arts & Humanities | 407 | 18.8% |
| Total | 2,168 | 100.0% |
Transportation & Commute in Fort Drum
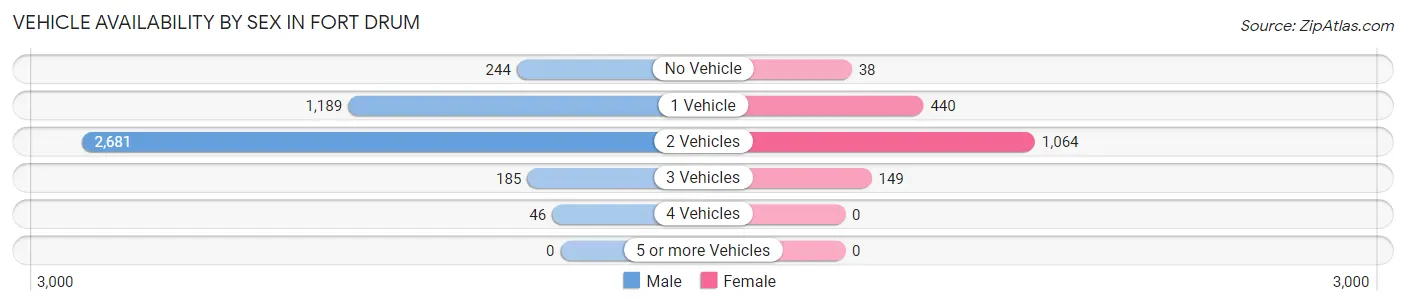
Vehicle Availability by Sex in Fort Drum
The most prevalent vehicle ownership categories in Fort Drum are males with 2 vehicles (2,681, accounting for 61.7%) and females with 2 vehicles (1,064, making up 158.5%).
| Vehicles Available | Male | Female |
| No Vehicle | 244 (5.6%) | 38 (2.2%) |
| 1 Vehicle | 1,189 (27.4%) | 440 (26.0%) |
| 2 Vehicles | 2,681 (61.7%) | 1,064 (62.9%) |
| 3 Vehicles | 185 (4.3%) | 149 (8.8%) |
| 4 Vehicles | 46 (1.1%) | 0 (0.0%) |
| 5 or more Vehicles | 0 (0.0%) | 0 (0.0%) |
| Total | 4,345 (100.0%) | 1,691 (100.0%) |
Commute Time in Fort Drum
The most frequently occuring commute durations in Fort Drum are 5 to 9 minutes (2,607 commuters, 36.3%), 10 to 14 minutes (1,689 commuters, 23.5%), and 15 to 19 minutes (1,069 commuters, 14.9%).
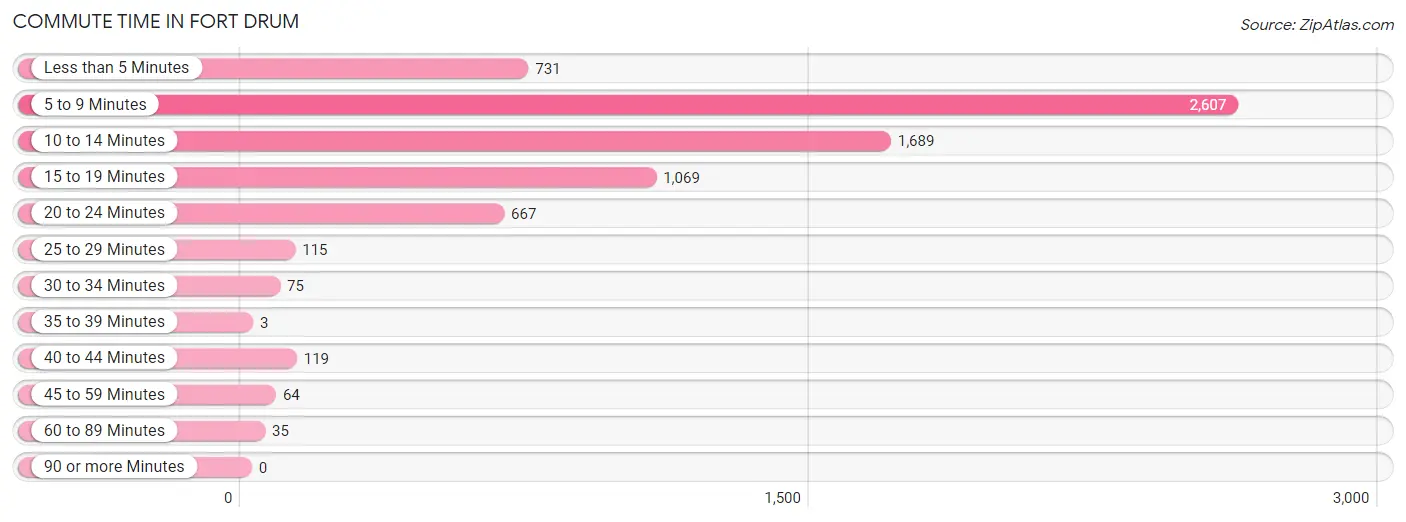
| Commute Time | # Commuters | % Commuters |
| Less than 5 Minutes | 731 | 10.2% |
| 5 to 9 Minutes | 2,607 | 36.3% |
| 10 to 14 Minutes | 1,689 | 23.5% |
| 15 to 19 Minutes | 1,069 | 14.9% |
| 20 to 24 Minutes | 667 | 9.3% |
| 25 to 29 Minutes | 115 | 1.6% |
| 30 to 34 Minutes | 75 | 1.1% |
| 35 to 39 Minutes | 3 | 0.0% |
| 40 to 44 Minutes | 119 | 1.7% |
| 45 to 59 Minutes | 64 | 0.9% |
| 60 to 89 Minutes | 35 | 0.5% |
| 90 or more Minutes | 0 | 0.0% |
Commute Time by Sex in Fort Drum
The most common commute times in Fort Drum are 5 to 9 minutes (2,082 commuters, 36.6%) for males and 5 to 9 minutes (525 commuters, 35.2%) for females.
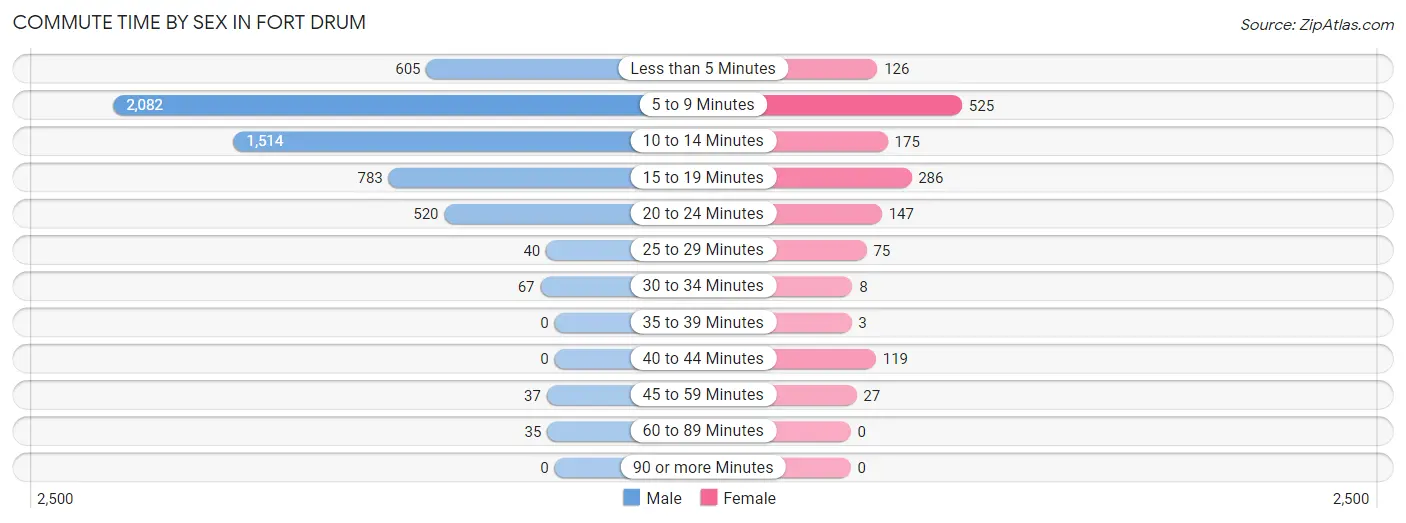
| Commute Time | Male | Female |
| Less than 5 Minutes | 605 (10.6%) | 126 (8.5%) |
| 5 to 9 Minutes | 2,082 (36.6%) | 525 (35.2%) |
| 10 to 14 Minutes | 1,514 (26.6%) | 175 (11.7%) |
| 15 to 19 Minutes | 783 (13.8%) | 286 (19.2%) |
| 20 to 24 Minutes | 520 (9.1%) | 147 (9.9%) |
| 25 to 29 Minutes | 40 (0.7%) | 75 (5.0%) |
| 30 to 34 Minutes | 67 (1.2%) | 8 (0.5%) |
| 35 to 39 Minutes | 0 (0.0%) | 3 (0.2%) |
| 40 to 44 Minutes | 0 (0.0%) | 119 (8.0%) |
| 45 to 59 Minutes | 37 (0.6%) | 27 (1.8%) |
| 60 to 89 Minutes | 35 (0.6%) | 0 (0.0%) |
| 90 or more Minutes | 0 (0.0%) | 0 (0.0%) |
Time of Departure to Work by Sex in Fort Drum
The most frequent times of departure to work in Fort Drum are 5:30 AM to 5:59 AM (1,743, 30.7%) for males and 12:00 PM to 3:59 PM (247, 16.6%) for females.
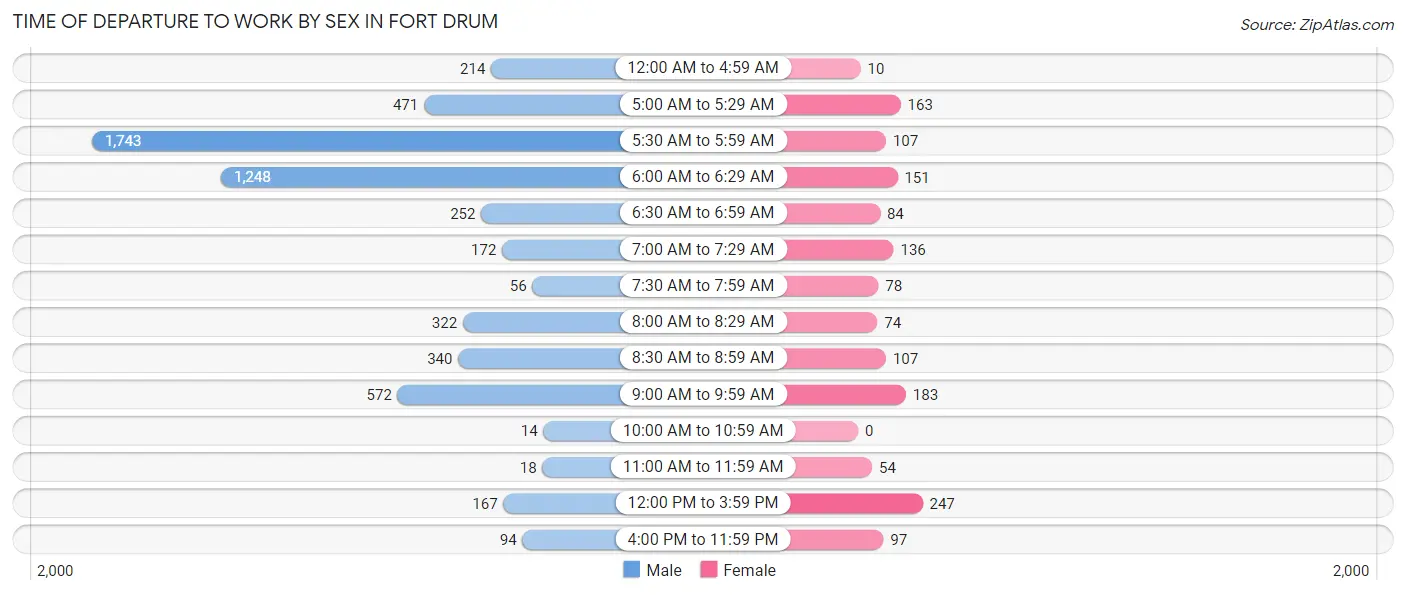
| Time of Departure | Male | Female |
| 12:00 AM to 4:59 AM | 214 (3.8%) | 10 (0.7%) |
| 5:00 AM to 5:29 AM | 471 (8.3%) | 163 (10.9%) |
| 5:30 AM to 5:59 AM | 1,743 (30.7%) | 107 (7.2%) |
| 6:00 AM to 6:29 AM | 1,248 (22.0%) | 151 (10.1%) |
| 6:30 AM to 6:59 AM | 252 (4.4%) | 84 (5.6%) |
| 7:00 AM to 7:29 AM | 172 (3.0%) | 136 (9.1%) |
| 7:30 AM to 7:59 AM | 56 (1.0%) | 78 (5.2%) |
| 8:00 AM to 8:29 AM | 322 (5.7%) | 74 (5.0%) |
| 8:30 AM to 8:59 AM | 340 (6.0%) | 107 (7.2%) |
| 9:00 AM to 9:59 AM | 572 (10.1%) | 183 (12.3%) |
| 10:00 AM to 10:59 AM | 14 (0.3%) | 0 (0.0%) |
| 11:00 AM to 11:59 AM | 18 (0.3%) | 54 (3.6%) |
| 12:00 PM to 3:59 PM | 167 (2.9%) | 247 (16.6%) |
| 4:00 PM to 11:59 PM | 94 (1.7%) | 97 (6.5%) |
| Total | 5,683 (100.0%) | 1,491 (100.0%) |
Housing Occupancy in Fort Drum
Occupancy by Ownership in Fort Drum
Of the total 4,586 dwellings in Fort Drum, owner-occupied units account for 127 (2.8%), while renter-occupied units make up 4,459 (97.2%).
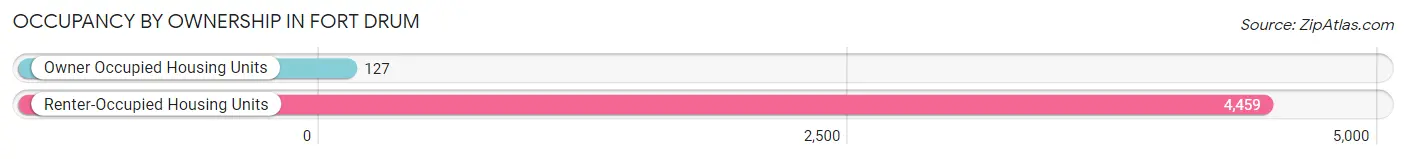
| Occupancy | # Housing Units | % Housing Units |
| Owner Occupied Housing Units | 127 | 2.8% |
| Renter-Occupied Housing Units | 4,459 | 97.2% |
| Total Occupied Housing Units | 4,586 | 100.0% |
Occupancy by Household Size in Fort Drum
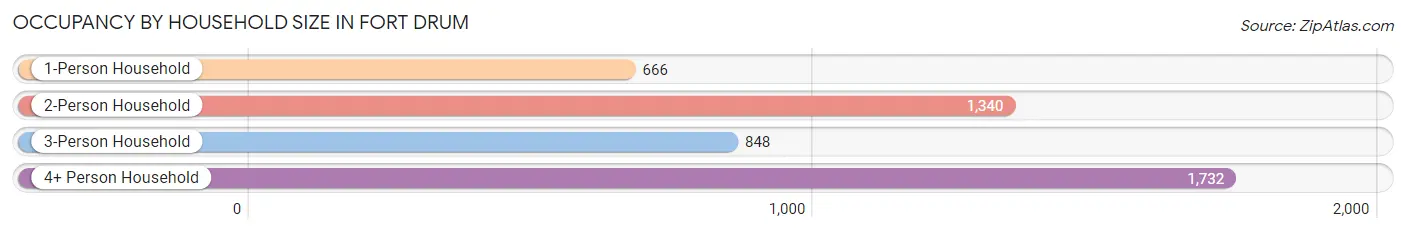
| Household Size | # Housing Units | % Housing Units |
| 1-Person Household | 666 | 14.5% |
| 2-Person Household | 1,340 | 29.2% |
| 3-Person Household | 848 | 18.5% |
| 4+ Person Household | 1,732 | 37.8% |
| Total Housing Units | 4,586 | 100.0% |
Occupancy by Ownership by Household Size in Fort Drum
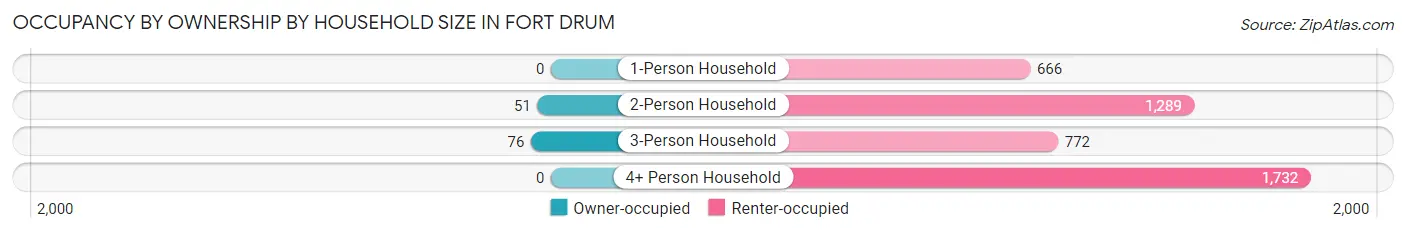
| Household Size | Owner-occupied | Renter-occupied |
| 1-Person Household | 0 (0.0%) | 666 (100.0%) |
| 2-Person Household | 51 (3.8%) | 1,289 (96.2%) |
| 3-Person Household | 76 (9.0%) | 772 (91.0%) |
| 4+ Person Household | 0 (0.0%) | 1,732 (100.0%) |
| Total Housing Units | 127 (2.8%) | 4,459 (97.2%) |
Occupancy by Educational Attainment in Fort Drum
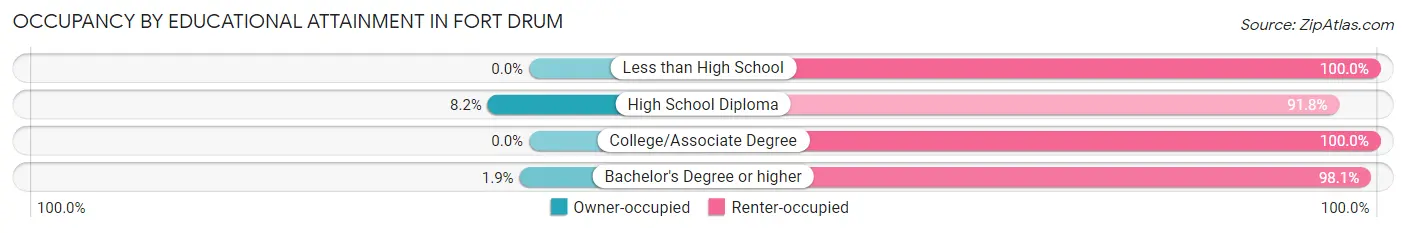
| Household Size | Owner-occupied | Renter-occupied |
| Less than High School | 0 (0.0%) | 18 (100.0%) |
| High School Diploma | 102 (8.2%) | 1,144 (91.8%) |
| College/Associate Degree | 0 (0.0%) | 2,005 (100.0%) |
| Bachelor's Degree or higher | 25 (1.9%) | 1,292 (98.1%) |
Occupancy by Age of Householder in Fort Drum
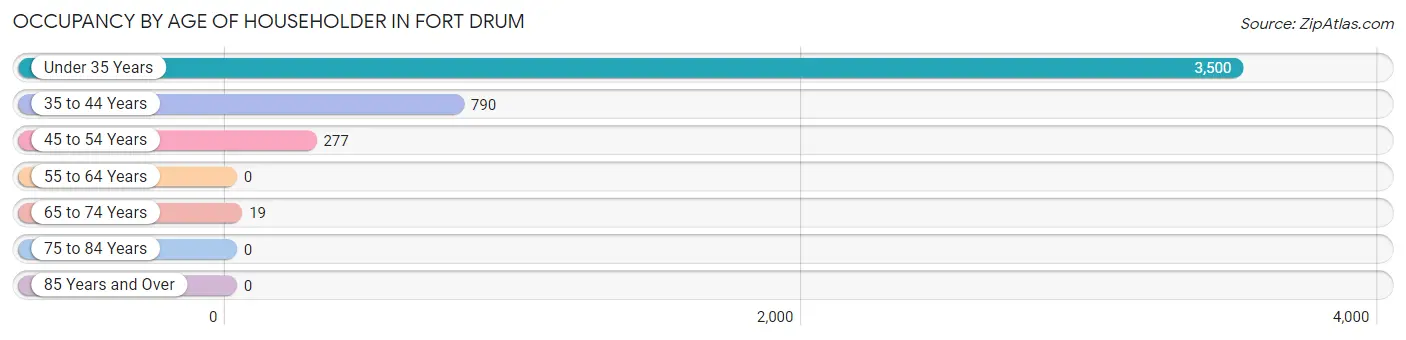
| Age Bracket | # Households | % Households |
| Under 35 Years | 3,500 | 76.3% |
| 35 to 44 Years | 790 | 17.2% |
| 45 to 54 Years | 277 | 6.0% |
| 55 to 64 Years | 0 | 0.0% |
| 65 to 74 Years | 19 | 0.4% |
| 75 to 84 Years | 0 | 0.0% |
| 85 Years and Over | 0 | 0.0% |
| Total | 4,586 | 100.0% |
Housing Finances in Fort Drum
Median Income by Occupancy in Fort Drum
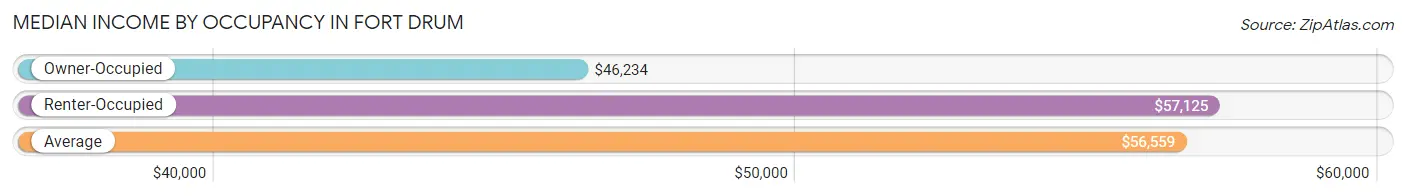
| Occupancy Type | # Households | Median Income |
| Owner-Occupied | 127 (2.8%) | $46,234 |
| Renter-Occupied | 4,459 (97.2%) | $57,125 |
| Average | 4,586 (100.0%) | $56,559 |
Occupancy by Householder Income Bracket in Fort Drum
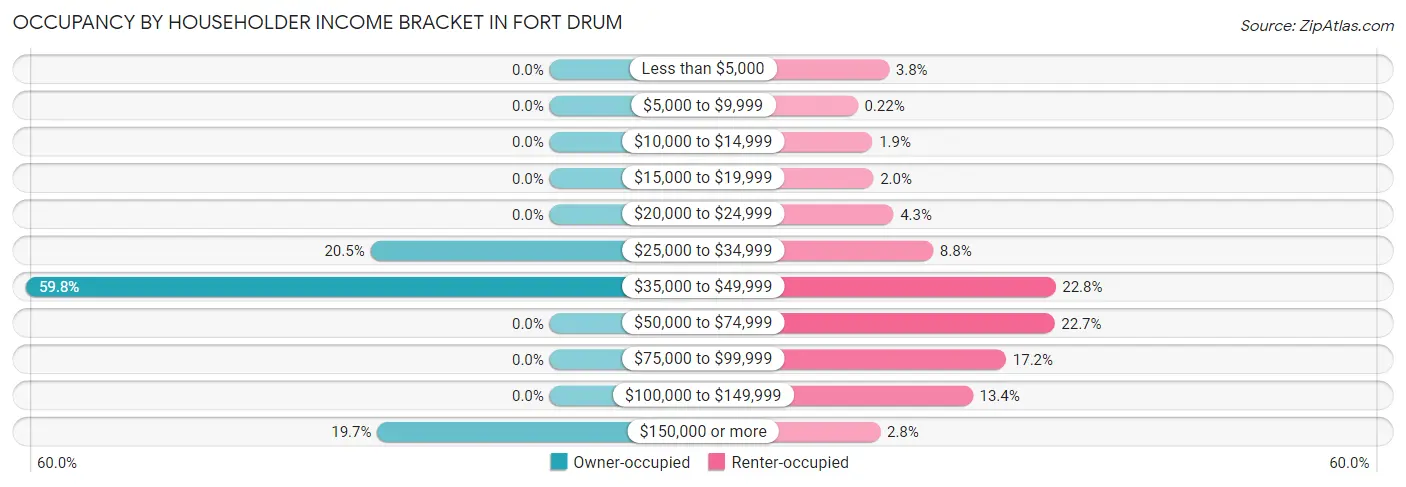
| Income Bracket | Owner-occupied | Renter-occupied |
| Less than $5,000 | 0 (0.0%) | 170 (3.8%) |
| $5,000 to $9,999 | 0 (0.0%) | 10 (0.2%) |
| $10,000 to $14,999 | 0 (0.0%) | 85 (1.9%) |
| $15,000 to $19,999 | 0 (0.0%) | 90 (2.0%) |
| $20,000 to $24,999 | 0 (0.0%) | 192 (4.3%) |
| $25,000 to $34,999 | 26 (20.5%) | 394 (8.8%) |
| $35,000 to $49,999 | 76 (59.8%) | 1,018 (22.8%) |
| $50,000 to $74,999 | 0 (0.0%) | 1,013 (22.7%) |
| $75,000 to $99,999 | 0 (0.0%) | 766 (17.2%) |
| $100,000 to $149,999 | 0 (0.0%) | 596 (13.4%) |
| $150,000 or more | 25 (19.7%) | 125 (2.8%) |
| Total | 127 (100.0%) | 4,459 (100.0%) |
Monthly Housing Cost Tiers in Fort Drum
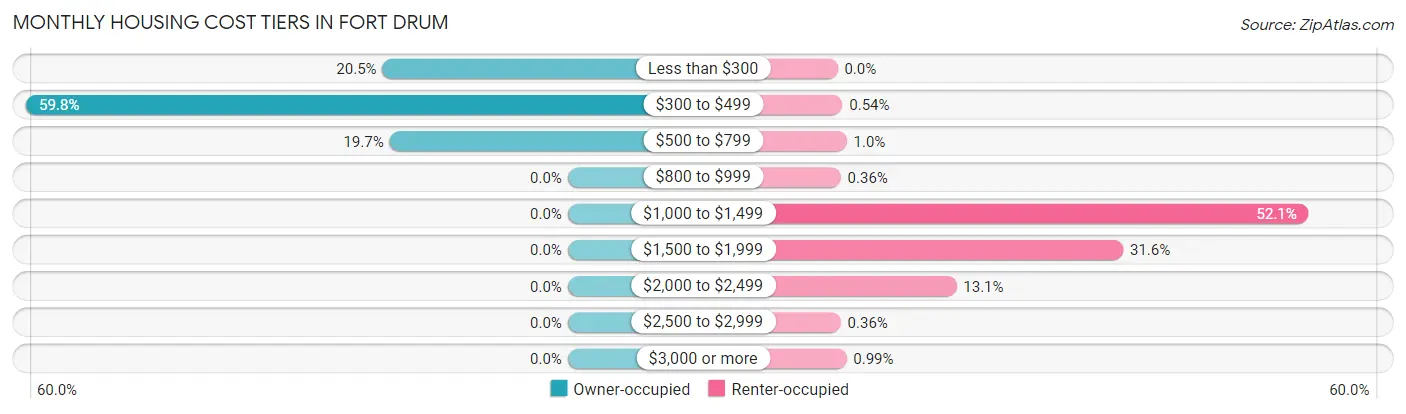
| Monthly Cost | Owner-occupied | Renter-occupied |
| Less than $300 | 26 (20.5%) | 0 (0.0%) |
| $300 to $499 | 76 (59.8%) | 24 (0.5%) |
| $500 to $799 | 25 (19.7%) | 45 (1.0%) |
| $800 to $999 | 0 (0.0%) | 16 (0.4%) |
| $1,000 to $1,499 | 0 (0.0%) | 2,321 (52.0%) |
| $1,500 to $1,999 | 0 (0.0%) | 1,407 (31.6%) |
| $2,000 to $2,499 | 0 (0.0%) | 586 (13.1%) |
| $2,500 to $2,999 | 0 (0.0%) | 16 (0.4%) |
| $3,000 or more | 0 (0.0%) | 44 (1.0%) |
| Total | 127 (100.0%) | 4,459 (100.0%) |
Physical Housing Characteristics in Fort Drum
Housing Structures in Fort Drum
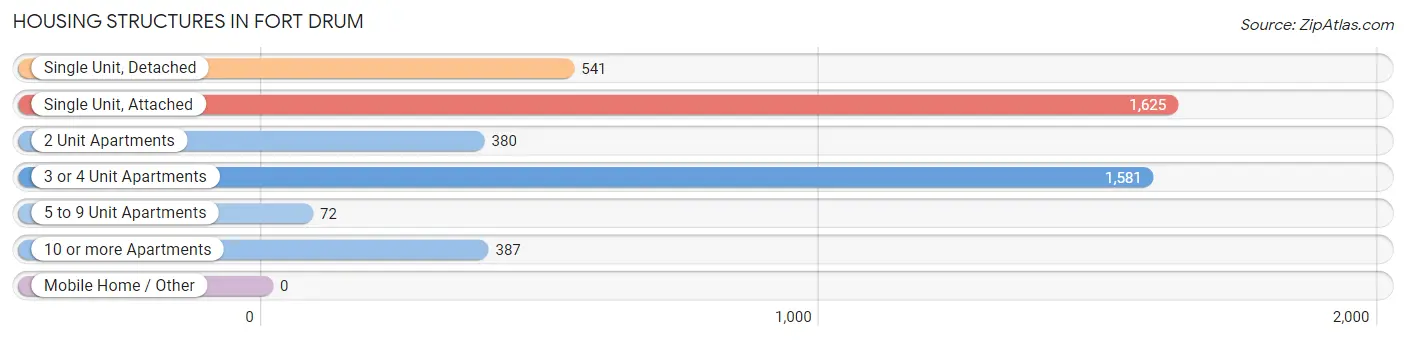
| Structure Type | # Housing Units | % Housing Units |
| Single Unit, Detached | 541 | 11.8% |
| Single Unit, Attached | 1,625 | 35.4% |
| 2 Unit Apartments | 380 | 8.3% |
| 3 or 4 Unit Apartments | 1,581 | 34.5% |
| 5 to 9 Unit Apartments | 72 | 1.6% |
| 10 or more Apartments | 387 | 8.4% |
| Mobile Home / Other | 0 | 0.0% |
| Total | 4,586 | 100.0% |
Housing Structures by Occupancy in Fort Drum
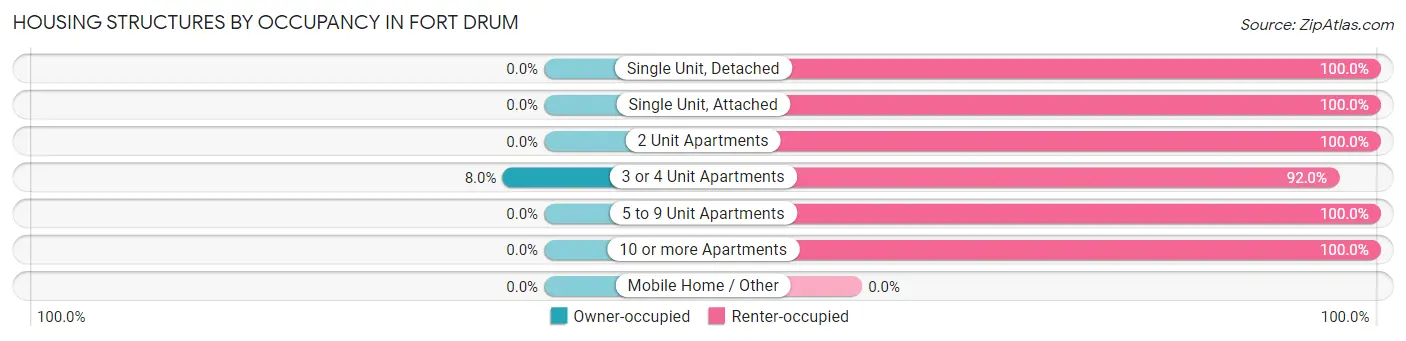
| Structure Type | Owner-occupied | Renter-occupied |
| Single Unit, Detached | 0 (0.0%) | 541 (100.0%) |
| Single Unit, Attached | 0 (0.0%) | 1,625 (100.0%) |
| 2 Unit Apartments | 0 (0.0%) | 380 (100.0%) |
| 3 or 4 Unit Apartments | 127 (8.0%) | 1,454 (92.0%) |
| 5 to 9 Unit Apartments | 0 (0.0%) | 72 (100.0%) |
| 10 or more Apartments | 0 (0.0%) | 387 (100.0%) |
| Mobile Home / Other | 0 (0.0%) | 0 (0.0%) |
| Total | 127 (2.8%) | 4,459 (97.2%) |
Housing Structures by Number of Rooms in Fort Drum
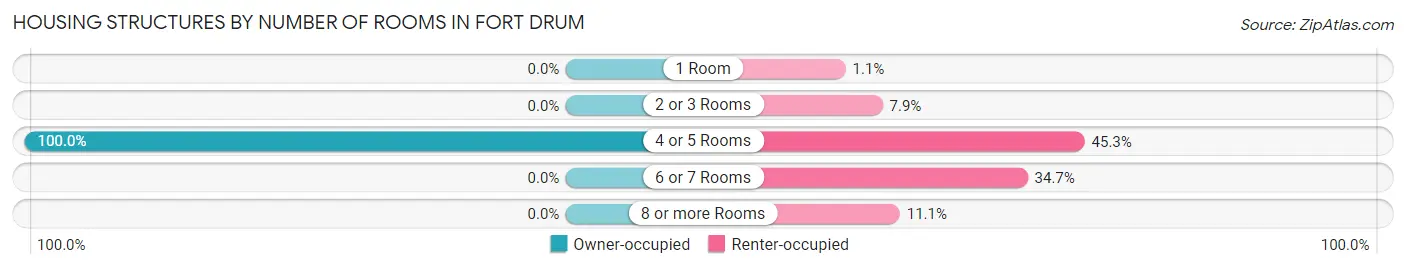
| Number of Rooms | Owner-occupied | Renter-occupied |
| 1 Room | 0 (0.0%) | 47 (1.1%) |
| 2 or 3 Rooms | 0 (0.0%) | 352 (7.9%) |
| 4 or 5 Rooms | 127 (100.0%) | 2,018 (45.3%) |
| 6 or 7 Rooms | 0 (0.0%) | 1,548 (34.7%) |
| 8 or more Rooms | 0 (0.0%) | 494 (11.1%) |
| Total | 127 (100.0%) | 4,459 (100.0%) |
Housing Structure by Heating Type in Fort Drum
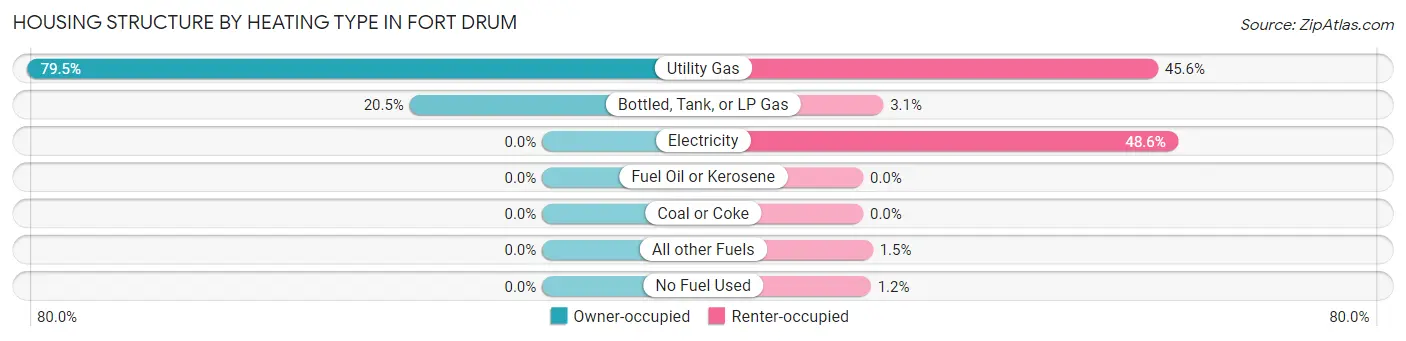
| Heating Type | Owner-occupied | Renter-occupied |
| Utility Gas | 101 (79.5%) | 2,032 (45.6%) |
| Bottled, Tank, or LP Gas | 26 (20.5%) | 139 (3.1%) |
| Electricity | 0 (0.0%) | 2,168 (48.6%) |
| Fuel Oil or Kerosene | 0 (0.0%) | 0 (0.0%) |
| Coal or Coke | 0 (0.0%) | 0 (0.0%) |
| All other Fuels | 0 (0.0%) | 67 (1.5%) |
| No Fuel Used | 0 (0.0%) | 53 (1.2%) |
| Total | 127 (100.0%) | 4,459 (100.0%) |
Household Vehicle Usage in Fort Drum
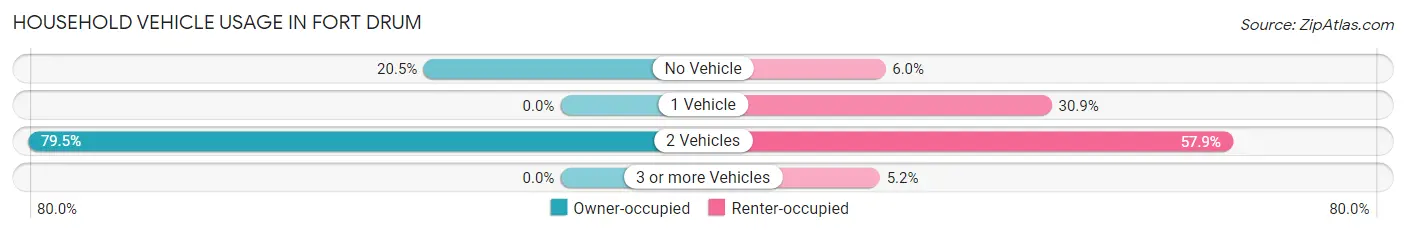
| Vehicles per Household | Owner-occupied | Renter-occupied |
| No Vehicle | 26 (20.5%) | 269 (6.0%) |
| 1 Vehicle | 0 (0.0%) | 1,376 (30.9%) |
| 2 Vehicles | 101 (79.5%) | 2,582 (57.9%) |
| 3 or more Vehicles | 0 (0.0%) | 232 (5.2%) |
| Total | 127 (100.0%) | 4,459 (100.0%) |
Real Estate & Mortgages in Fort Drum
Real Estate and Mortgage Overview in Fort Drum
| Characteristic | Without Mortgage | With Mortgage |
| Housing Units | 127 | 0 |
| Median Property Value | - | - |
| Median Household Income | $46,234 | $0 |
| Monthly Housing Costs | $325 | $0 |
| Real Estate Taxes | - | - |
Property Value by Mortgage Status in Fort Drum
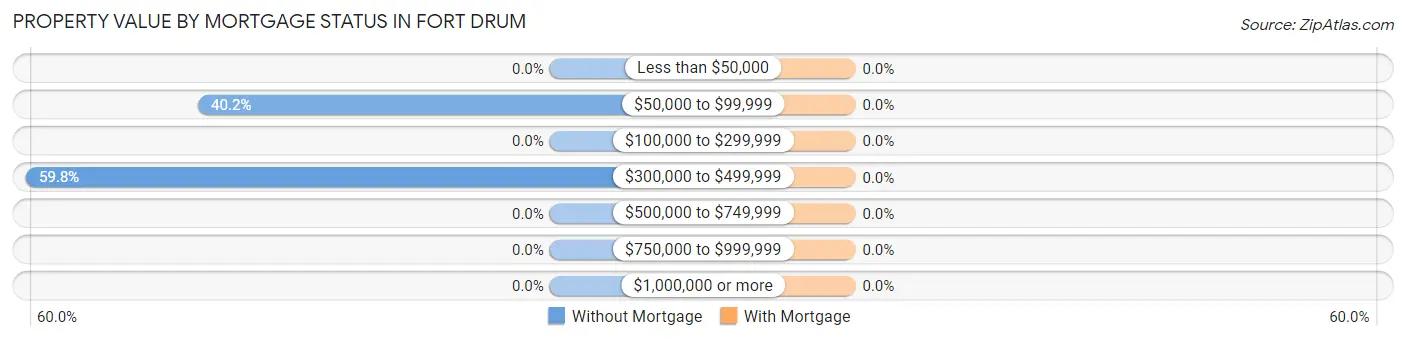
| Property Value | Without Mortgage | With Mortgage |
| Less than $50,000 | 0 (0.0%) | 0 (0.0%) |
| $50,000 to $99,999 | 51 (40.2%) | 0 (0.0%) |
| $100,000 to $299,999 | 0 (0.0%) | 0 (0.0%) |
| $300,000 to $499,999 | 76 (59.8%) | 0 (0.0%) |
| $500,000 to $749,999 | 0 (0.0%) | 0 (0.0%) |
| $750,000 to $999,999 | 0 (0.0%) | 0 (0.0%) |
| $1,000,000 or more | 0 (0.0%) | 0 (0.0%) |
| Total | 127 (100.0%) | 0 (0.0%) |
Household Income by Mortgage Status in Fort Drum
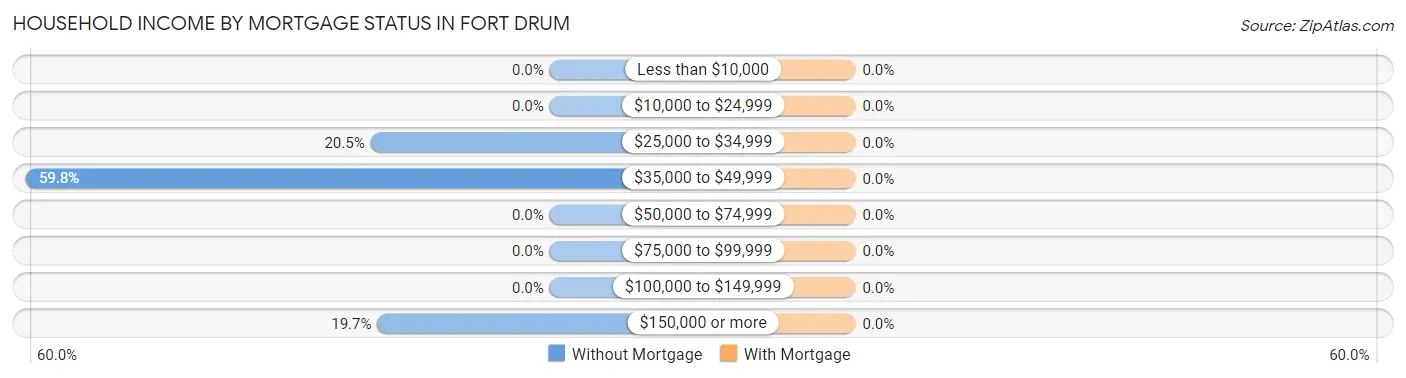
| Household Income | Without Mortgage | With Mortgage |
| Less than $10,000 | 0 (0.0%) | 0 (0.0%) |
| $10,000 to $24,999 | 0 (0.0%) | 0 (0.0%) |
| $25,000 to $34,999 | 26 (20.5%) | 0 (0.0%) |
| $35,000 to $49,999 | 76 (59.8%) | 0 (0.0%) |
| $50,000 to $74,999 | 0 (0.0%) | 0 (0.0%) |
| $75,000 to $99,999 | 0 (0.0%) | 0 (0.0%) |
| $100,000 to $149,999 | 0 (0.0%) | 0 (0.0%) |
| $150,000 or more | 25 (19.7%) | 0 (0.0%) |
| Total | 127 (100.0%) | 0 (0.0%) |
Property Value to Household Income Ratio in Fort Drum
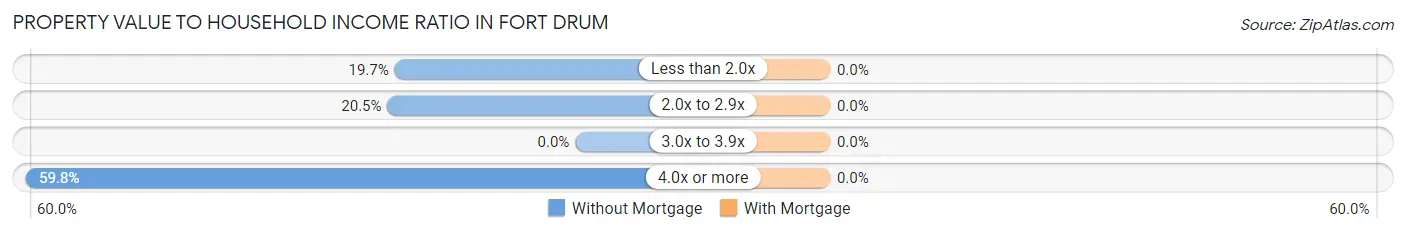
| Value-to-Income Ratio | Without Mortgage | With Mortgage |
| Less than 2.0x | 25 (19.7%) | 0 (0.0%) |
| 2.0x to 2.9x | 26 (20.5%) | 0 (0.0%) |
| 3.0x to 3.9x | 0 (0.0%) | 0 (0.0%) |
| 4.0x or more | 76 (59.8%) | 0 (0.0%) |
| Total | 127 (100.0%) | 0 (0.0%) |
Real Estate Taxes by Mortgage Status in Fort Drum
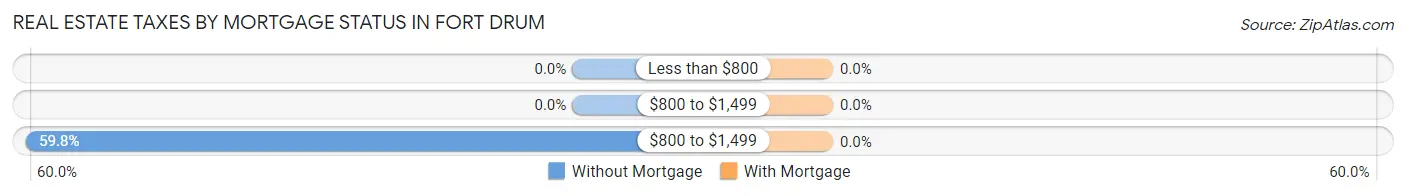
| Property Taxes | Without Mortgage | With Mortgage |
| Less than $800 | 0 (0.0%) | 0 (0.0%) |
| $800 to $1,499 | 0 (0.0%) | 0 (0.0%) |
| $800 to $1,499 | 76 (59.8%) | 0 (0.0%) |
| Total | 127 (100.0%) | 0 (0.0%) |
Health & Disability in Fort Drum
Health Insurance Coverage by Age in Fort Drum
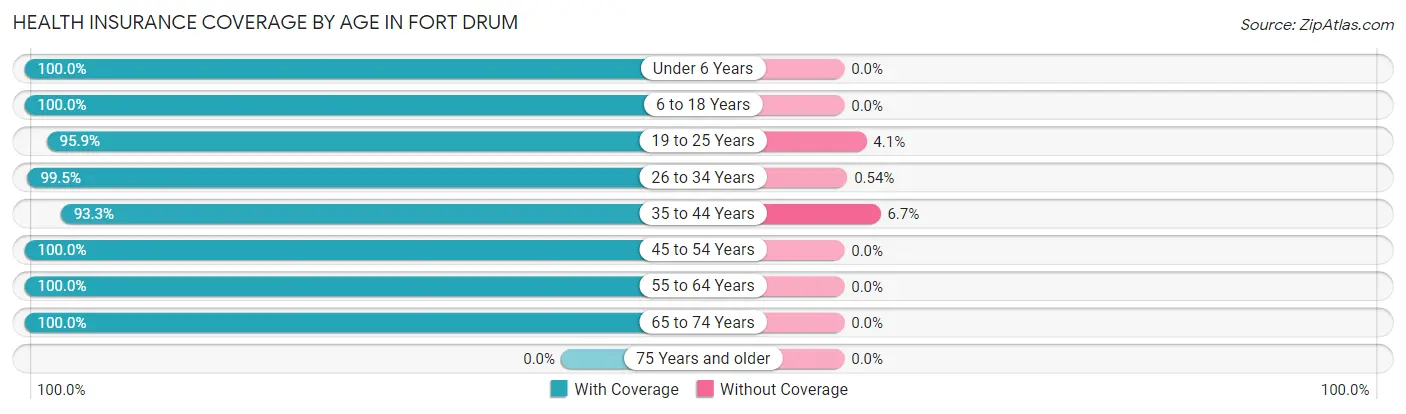
| Age Bracket | With Coverage | Without Coverage |
| Under 6 Years | 3,199 (100.0%) | 0 (0.0%) |
| 6 to 18 Years | 2,449 (100.0%) | 0 (0.0%) |
| 19 to 25 Years | 1,279 (95.9%) | 55 (4.1%) |
| 26 to 34 Years | 1,836 (99.5%) | 10 (0.5%) |
| 35 to 44 Years | 913 (93.3%) | 66 (6.7%) |
| 45 to 54 Years | 229 (100.0%) | 0 (0.0%) |
| 55 to 64 Years | 52 (100.0%) | 0 (0.0%) |
| 65 to 74 Years | 33 (100.0%) | 0 (0.0%) |
| 75 Years and older | 0 (0.0%) | 0 (0.0%) |
| Total | 9,990 (98.7%) | 131 (1.3%) |
Health Insurance Coverage by Citizenship Status in Fort Drum
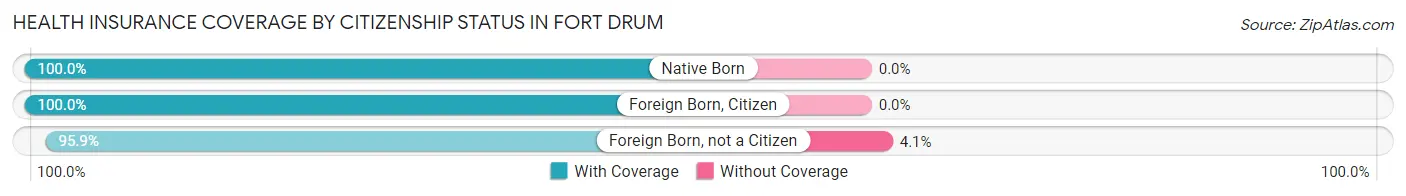
| Citizenship Status | With Coverage | Without Coverage |
| Native Born | 3,199 (100.0%) | 0 (0.0%) |
| Foreign Born, Citizen | 2,449 (100.0%) | 0 (0.0%) |
| Foreign Born, not a Citizen | 1,279 (95.9%) | 55 (4.1%) |
Health Insurance Coverage by Household Income in Fort Drum
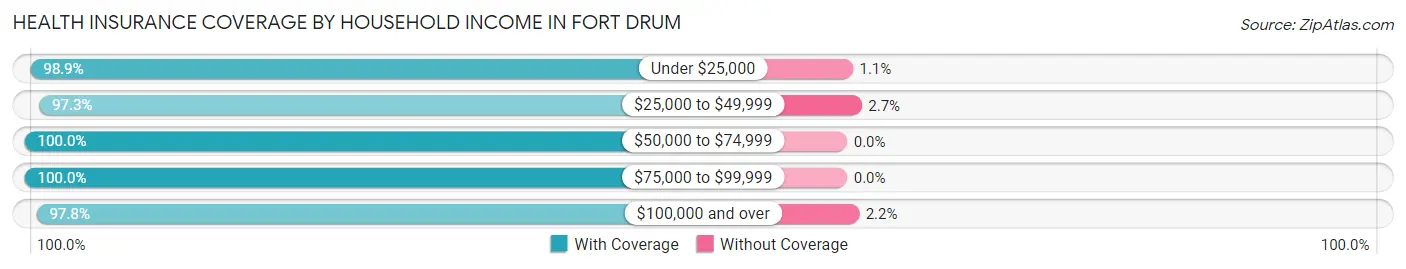
| Household Income | With Coverage | Without Coverage |
| Under $25,000 | 927 (98.9%) | 10 (1.1%) |
| $25,000 to $49,999 | 2,497 (97.3%) | 70 (2.7%) |
| $50,000 to $74,999 | 2,071 (100.0%) | 0 (0.0%) |
| $75,000 to $99,999 | 2,263 (100.0%) | 0 (0.0%) |
| $100,000 and over | 2,232 (97.8%) | 51 (2.2%) |
Public vs Private Health Insurance Coverage by Age in Fort Drum
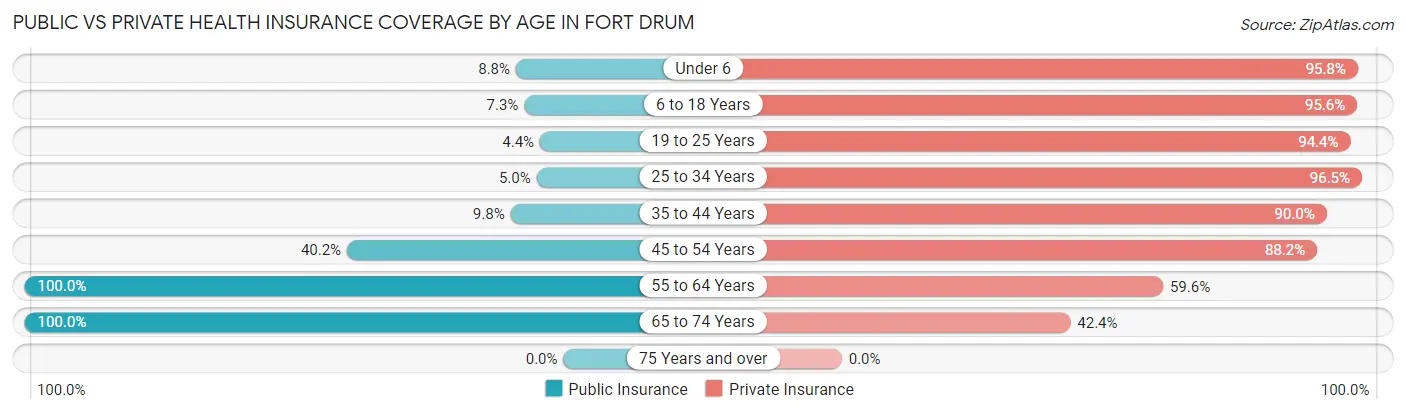
| Age Bracket | Public Insurance | Private Insurance |
| Under 6 | 282 (8.8%) | 3,063 (95.8%) |
| 6 to 18 Years | 178 (7.3%) | 2,342 (95.6%) |
| 19 to 25 Years | 58 (4.3%) | 1,259 (94.4%) |
| 25 to 34 Years | 92 (5.0%) | 1,782 (96.5%) |
| 35 to 44 Years | 96 (9.8%) | 881 (90.0%) |
| 45 to 54 Years | 92 (40.2%) | 202 (88.2%) |
| 55 to 64 Years | 52 (100.0%) | 31 (59.6%) |
| 65 to 74 Years | 33 (100.0%) | 14 (42.4%) |
| 75 Years and over | 0 (0.0%) | 0 (0.0%) |
| Total | 883 (8.7%) | 9,574 (94.6%) |
Disability Status by Sex by Age in Fort Drum
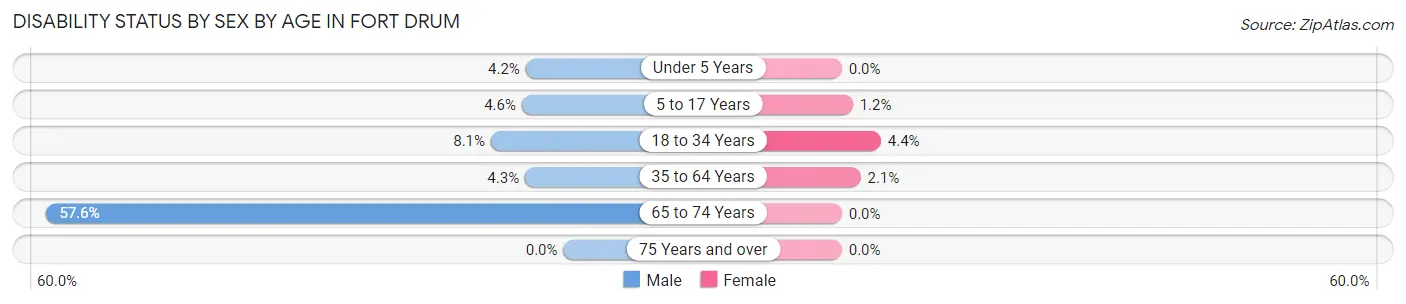
| Age Bracket | Male | Female |
| Under 5 Years | 57 (4.2%) | 0 (0.0%) |
| 5 to 17 Years | 75 (4.6%) | 15 (1.2%) |
| 18 to 34 Years | 41 (8.1%) | 119 (4.3%) |
| 35 to 64 Years | 17 (4.3%) | 18 (2.1%) |
| 65 to 74 Years | 19 (57.6%) | 0 (0.0%) |
| 75 Years and over | 0 (0.0%) | 0 (0.0%) |
Disability Class by Sex by Age in Fort Drum
Disability Class: Hearing Difficulty
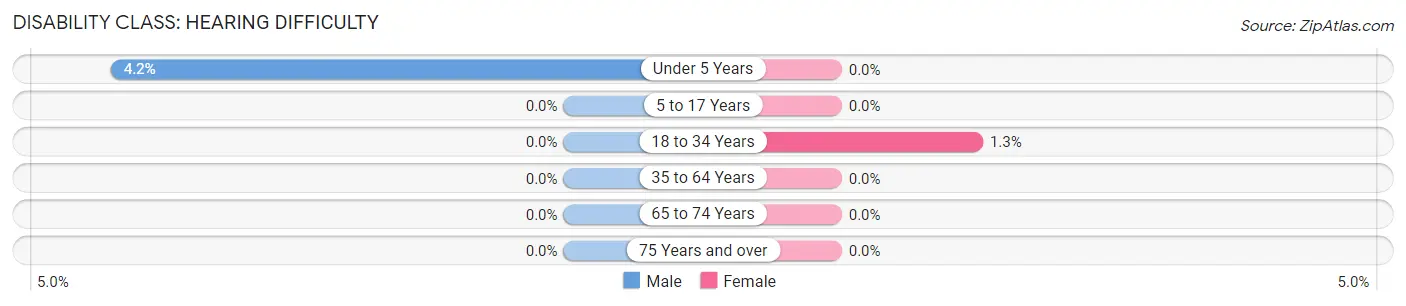
| Age Bracket | Male | Female |
| Under 5 Years | 57 (4.2%) | 0 (0.0%) |
| 5 to 17 Years | 0 (0.0%) | 0 (0.0%) |
| 18 to 34 Years | 0 (0.0%) | 36 (1.3%) |
| 35 to 64 Years | 0 (0.0%) | 0 (0.0%) |
| 65 to 74 Years | 0 (0.0%) | 0 (0.0%) |
| 75 Years and over | 0 (0.0%) | 0 (0.0%) |
Disability Class: Vision Difficulty
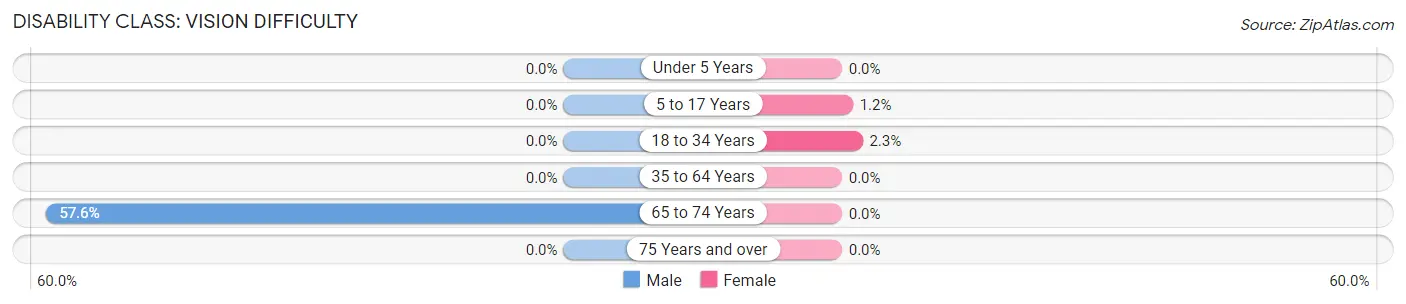
| Age Bracket | Male | Female |
| Under 5 Years | 0 (0.0%) | 0 (0.0%) |
| 5 to 17 Years | 0 (0.0%) | 15 (1.2%) |
| 18 to 34 Years | 0 (0.0%) | 63 (2.3%) |
| 35 to 64 Years | 0 (0.0%) | 0 (0.0%) |
| 65 to 74 Years | 19 (57.6%) | 0 (0.0%) |
| 75 Years and over | 0 (0.0%) | 0 (0.0%) |
Disability Class: Cognitive Difficulty
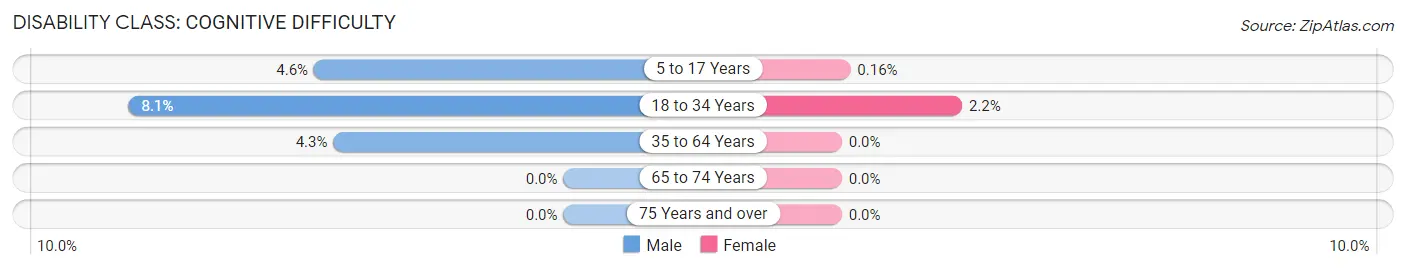
| Age Bracket | Male | Female |
| 5 to 17 Years | 75 (4.6%) | 2 (0.2%) |
| 18 to 34 Years | 41 (8.1%) | 61 (2.2%) |
| 35 to 64 Years | 17 (4.3%) | 0 (0.0%) |
| 65 to 74 Years | 0 (0.0%) | 0 (0.0%) |
| 75 Years and over | 0 (0.0%) | 0 (0.0%) |
Disability Class: Ambulatory Difficulty
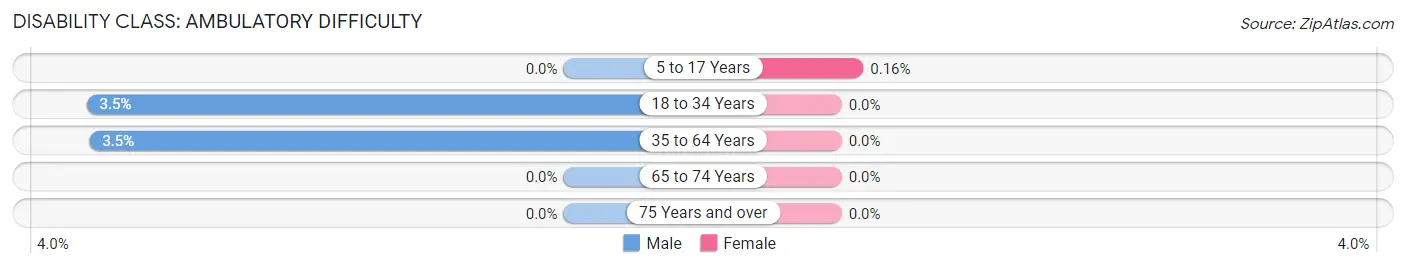
| Age Bracket | Male | Female |
| 5 to 17 Years | 0 (0.0%) | 2 (0.2%) |
| 18 to 34 Years | 18 (3.5%) | 0 (0.0%) |
| 35 to 64 Years | 14 (3.5%) | 0 (0.0%) |
| 65 to 74 Years | 0 (0.0%) | 0 (0.0%) |
| 75 Years and over | 0 (0.0%) | 0 (0.0%) |
Disability Class: Self-Care Difficulty
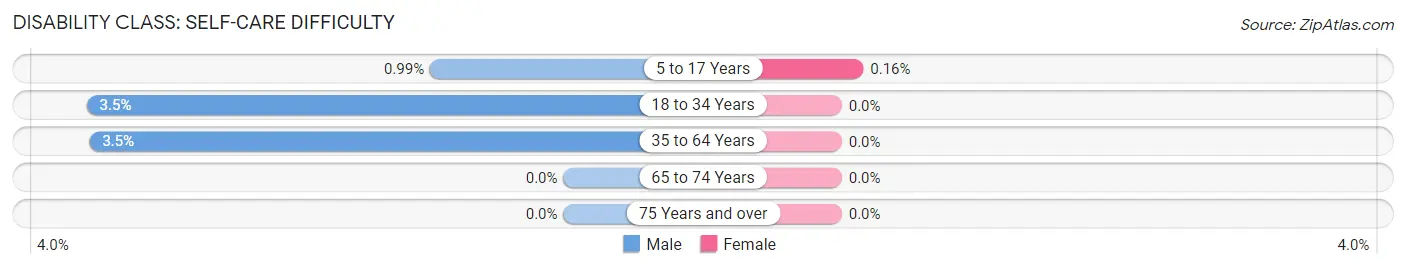
| Age Bracket | Male | Female |
| 5 to 17 Years | 16 (1.0%) | 2 (0.2%) |
| 18 to 34 Years | 18 (3.5%) | 0 (0.0%) |
| 35 to 64 Years | 14 (3.5%) | 0 (0.0%) |
| 65 to 74 Years | 0 (0.0%) | 0 (0.0%) |
| 75 Years and over | 0 (0.0%) | 0 (0.0%) |
Technology Access in Fort Drum
Computing Device Access in Fort Drum
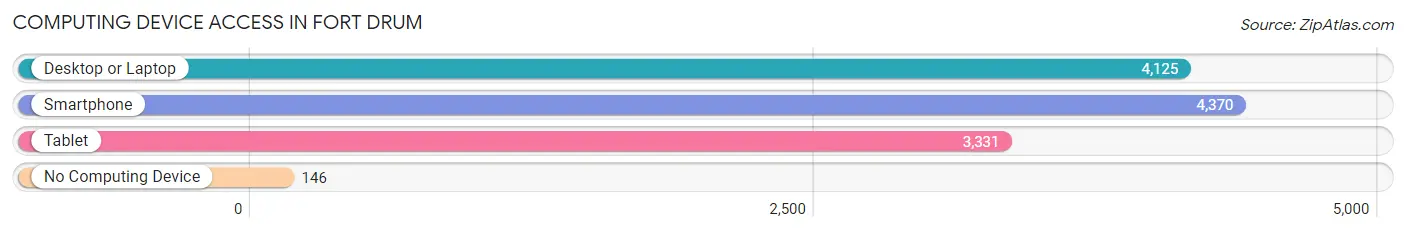
| Device Type | # Households | % Households |
| Desktop or Laptop | 4,125 | 89.9% |
| Smartphone | 4,370 | 95.3% |
| Tablet | 3,331 | 72.6% |
| No Computing Device | 146 | 3.2% |
| Total | 4,586 | 100.0% |
Internet Access in Fort Drum
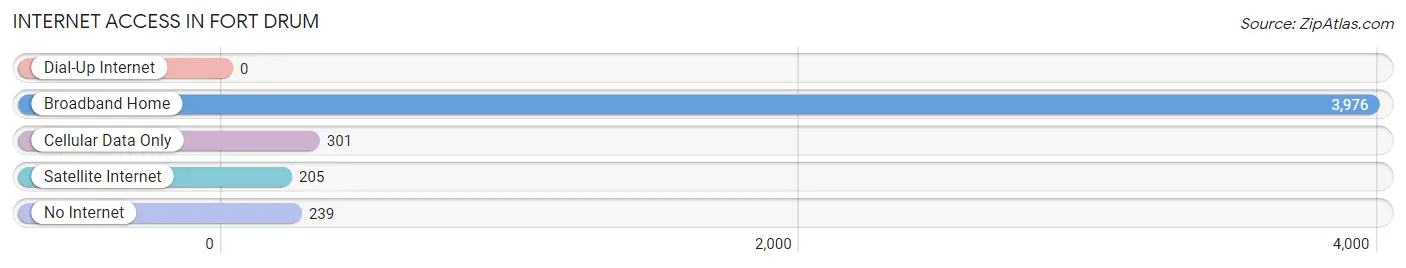
| Internet Type | # Households | % Households |
| Dial-Up Internet | 0 | 0.0% |
| Broadband Home | 3,976 | 86.7% |
| Cellular Data Only | 301 | 6.6% |
| Satellite Internet | 205 | 4.5% |
| No Internet | 239 | 5.2% |
| Total | 4,586 | 100.0% |
Fort Drum Summary
Fort Drum is a United States Army installation located in Jefferson County, New York. It is the largest military installation in the state and is home to the 10th Mountain Division. The base is located in the northern part of the state, near the Canadian border, and is approximately 30 miles south of the city of Watertown.
History
Fort Drum was established in 1908 as Pine Camp, a training site for the New York National Guard. The site was chosen due to its proximity to the Canadian border and its location in the Adirondack Mountains. The camp was renamed Camp Drum in 1951 in honor of Major General Hugh A. Drum, who served as Chief of Staff of the United States Army from 1941 to 1945. In 1975, the camp was officially designated as a permanent Army installation and renamed Fort Drum.
Geography
Fort Drum is located in the northern part of New York State, near the Canadian border. It is situated in the Adirondack Mountains, approximately 30 miles south of the city of Watertown. The base covers an area of approximately 107,265 acres and is surrounded by the towns of LeRay, Wilna, and Theresa. The terrain of the base is mostly forested and hilly, with elevations ranging from 600 to 1,400 feet.
Economy
Fort Drum is a major economic driver for the region, providing jobs and economic activity to the surrounding communities. The base is home to more than 20,000 military personnel and their families, as well as more than 5,000 civilian employees. The base has an annual economic impact of more than $1.5 billion, making it one of the largest employers in the region.
Demographics
As of 2019, the population of Fort Drum was estimated to be 24,845. The population is composed of military personnel, their families, and civilian employees. The racial makeup of the base is 73.3% White, 11.2% African American, 8.2% Hispanic or Latino, and 4.3% Asian. The median household income is $50,845, and the median age is 28.7 years.
Conclusion
Fort Drum is a major United States Army installation located in Jefferson County, New York. It is the largest military installation in the state and is home to the 10th Mountain Division. The base covers an area of approximately 107,265 acres and is surrounded by the towns of LeRay, Wilna, and Theresa. Fort Drum is a major economic driver for the region, providing jobs and economic activity to the surrounding communities. The population of Fort Drum is composed of military personnel, their families, and civilian employees. The racial makeup of the base is 73.3% White, 11.2% African American, 8.2% Hispanic or Latino, and 4.3% Asian. The median household income is $50,845, and the median age is 28.7 years.
Common Questions
What is Per Capita Income in Fort Drum?
Per Capita income in Fort Drum is $21,970.
What is the Median Family Income in Fort Drum?
Median Family Income in Fort Drum is $58,671.
What is the Median Household income in Fort Drum?
Median Household Income in Fort Drum is $56,559.
What is Income or Wage Gap in Fort Drum?
Income or Wage Gap in Fort Drum is 40.0%.
Women in Fort Drum earn 60.0 cents for every dollar earned by a man.
What is Family Income Deficit in Fort Drum?
Family Income Deficit in Fort Drum is $11,044.
Families that are below poverty line in Fort Drum earn $11,044 less on average than the poverty threshold level.
What is Inequality or Gini Index in Fort Drum?
Inequality or Gini Index in Fort Drum is 0.33.
What is the Total Population of Fort Drum?
Total Population of Fort Drum is 16,298.
What is the Total Male Population of Fort Drum?
Total Male Population of Fort Drum is 9,664.
What is the Total Female Population of Fort Drum?
Total Female Population of Fort Drum is 6,634.
What is the Ratio of Males per 100 Females in Fort Drum?
There are 145.67 Males per 100 Females in Fort Drum.
What is the Ratio of Females per 100 Males in Fort Drum?
There are 68.65 Females per 100 Males in Fort Drum.
What is the Median Population Age in Fort Drum?
Median Population Age in Fort Drum is 22.0 Years.
What is the Average Family Size in Fort Drum
Average Family Size in Fort Drum is 3.4 People.
What is the Average Household Size in Fort Drum
Average Household Size in Fort Drum is 3.0 People.
How Large is the Labor Force in Fort Drum?
There are 8,636 People in the Labor Forcein in Fort Drum.
What is the Percentage of People in the Labor Force in Fort Drum?
79.0% of People are in the Labor Force in Fort Drum.
What is the Unemployment Rate in Fort Drum?
Unemployment Rate in Fort Drum is 9.7%.