East Cape Girardeau, IL Map & Demographics
East Cape Girardeau Map
East Cape Girardeau Overview
$15,940
PER CAPITA INCOME
$53,750
AVG FAMILY INCOME
$41,250
AVG HOUSEHOLD INCOME
0.41
INEQUALITY / GINI INDEX
343
TOTAL POPULATION
179
MALE POPULATION
164
FEMALE POPULATION
109.15
MALES / 100 FEMALES
91.62
FEMALES / 100 MALES
38.2
MEDIAN AGE
4.3
AVG FAMILY SIZE
3.9
AVG HOUSEHOLD SIZE
109
LABOR FORCE [ PEOPLE ]
41.6%
PERCENT IN LABOR FORCE
Income in East Cape Girardeau
Income Overview in East Cape Girardeau
Per Capita Income in East Cape Girardeau is $15,940, while median incomes of families and households are $53,750 and $41,250 respectively.
| Characteristic | Number | Measure |
| Per Capita Income | 343 | $15,940 |
| Median Family Income | 56 | $53,750 |
| Mean Family Income | 56 | $70,282 |
| Median Household Income | 88 | $41,250 |
| Mean Household Income | 88 | $55,067 |
| Income Deficit | 56 | $0 |
| Wage / Income Gap (%) | 343 | 0.00% |
| Wage / Income Gap ($) | 343 | 100.00¢ per $1 |
| Gini / Inequality Index | 343 | 0.41 |
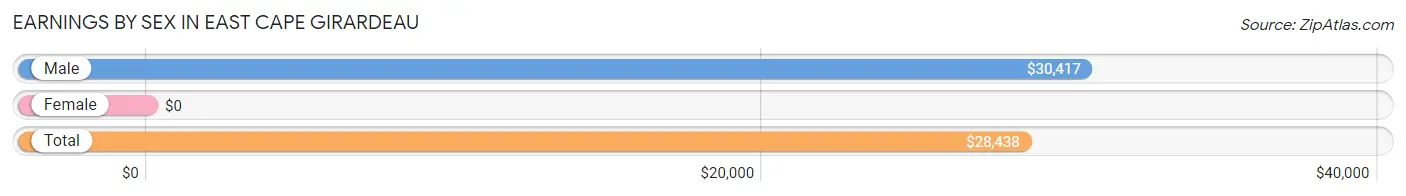
Earnings by Sex in East Cape Girardeau
| Sex | Number | Average Earnings |
| Male | 71 (64.0%) | $30,417 |
| Female | 40 (36.0%) | $0 |
| Total | 111 (100.0%) | $28,438 |
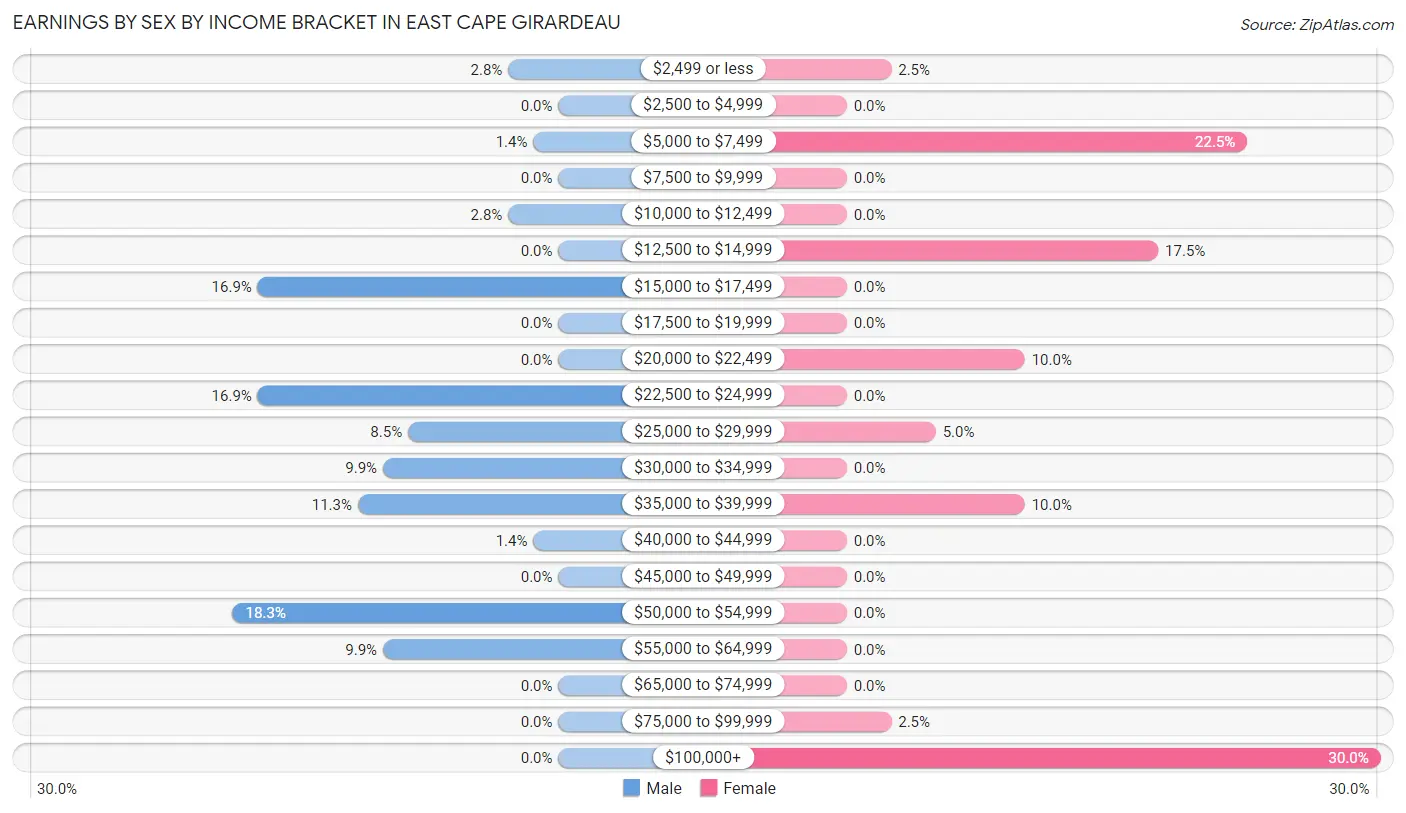
Earnings by Sex by Income Bracket in East Cape Girardeau
The most common earnings brackets in East Cape Girardeau are $50,000 to $54,999 for men (13 | 18.3%) and $100,000+ for women (12 | 30.0%).
| Income | Male | Female |
| $2,499 or less | 2 (2.8%) | 1 (2.5%) |
| $2,500 to $4,999 | 0 (0.0%) | 0 (0.0%) |
| $5,000 to $7,499 | 1 (1.4%) | 9 (22.5%) |
| $7,500 to $9,999 | 0 (0.0%) | 0 (0.0%) |
| $10,000 to $12,499 | 2 (2.8%) | 0 (0.0%) |
| $12,500 to $14,999 | 0 (0.0%) | 7 (17.5%) |
| $15,000 to $17,499 | 12 (16.9%) | 0 (0.0%) |
| $17,500 to $19,999 | 0 (0.0%) | 0 (0.0%) |
| $20,000 to $22,499 | 0 (0.0%) | 4 (10.0%) |
| $22,500 to $24,999 | 12 (16.9%) | 0 (0.0%) |
| $25,000 to $29,999 | 6 (8.5%) | 2 (5.0%) |
| $30,000 to $34,999 | 7 (9.9%) | 0 (0.0%) |
| $35,000 to $39,999 | 8 (11.3%) | 4 (10.0%) |
| $40,000 to $44,999 | 1 (1.4%) | 0 (0.0%) |
| $45,000 to $49,999 | 0 (0.0%) | 0 (0.0%) |
| $50,000 to $54,999 | 13 (18.3%) | 0 (0.0%) |
| $55,000 to $64,999 | 7 (9.9%) | 0 (0.0%) |
| $65,000 to $74,999 | 0 (0.0%) | 0 (0.0%) |
| $75,000 to $99,999 | 0 (0.0%) | 1 (2.5%) |
| $100,000+ | 0 (0.0%) | 12 (30.0%) |
| Total | 71 (100.0%) | 40 (100.0%) |
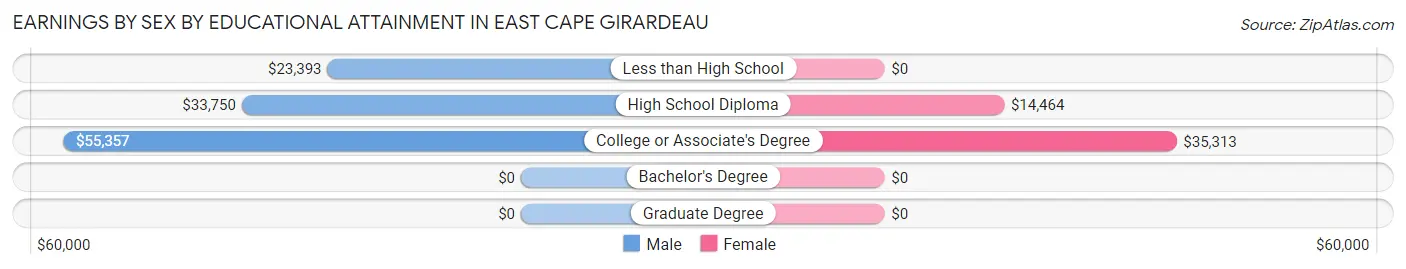
Earnings by Sex by Educational Attainment in East Cape Girardeau
| Educational Attainment | Male Income | Female Income |
| Less than High School | $23,393 | $0 |
| High School Diploma | $33,750 | $14,464 |
| College or Associate's Degree | $55,357 | $35,313 |
| Bachelor's Degree | - | - |
| Graduate Degree | - | - |
| Total | $31,250 | $0 |
Family Income in East Cape Girardeau
Family Income Brackets in East Cape Girardeau
According to the East Cape Girardeau family income data, there are 16 families falling into the $50,000 to $74,999 income range, which is the most common income bracket and makes up 28.6% of all families.
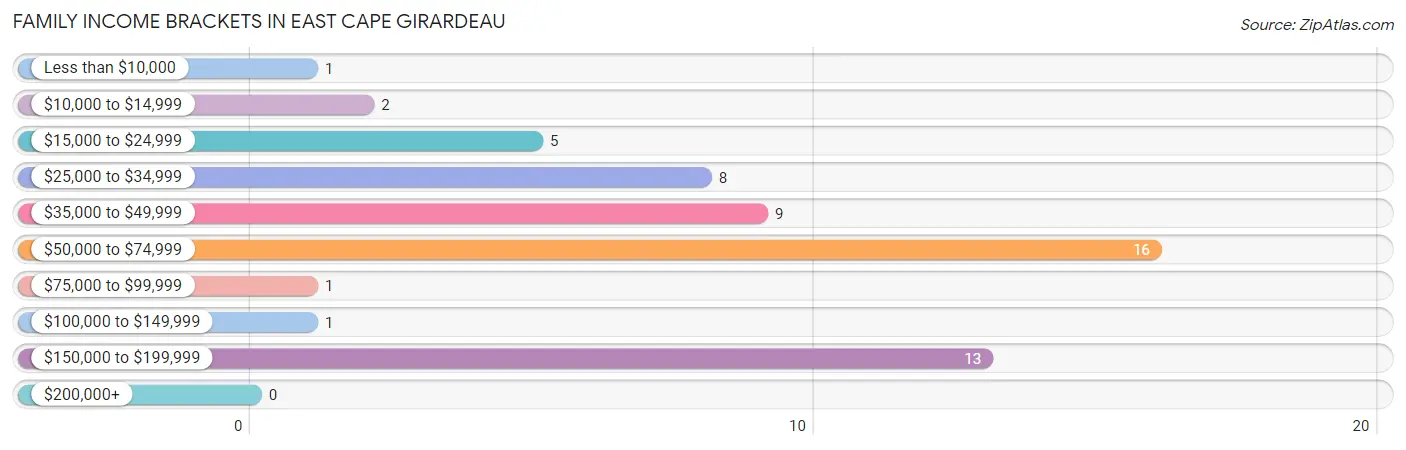
| Income Bracket | # Families | % Families |
| Less than $10,000 | 1 | 1.8% |
| $10,000 to $14,999 | 2 | 3.6% |
| $15,000 to $24,999 | 5 | 8.9% |
| $25,000 to $34,999 | 8 | 14.3% |
| $35,000 to $49,999 | 9 | 16.1% |
| $50,000 to $74,999 | 16 | 28.6% |
| $75,000 to $99,999 | 1 | 1.8% |
| $100,000 to $149,999 | 1 | 1.8% |
| $150,000 to $199,999 | 13 | 23.2% |
| $200,000+ | 0 | 0.0% |
Family Income by Famaliy Size in East Cape Girardeau
3-person families (21 | 37.5%) account for the highest median family income in East Cape Girardeau with $153,021 per family, while 3-person families (21 | 37.5%) have the highest median income of $51,007 per family member.
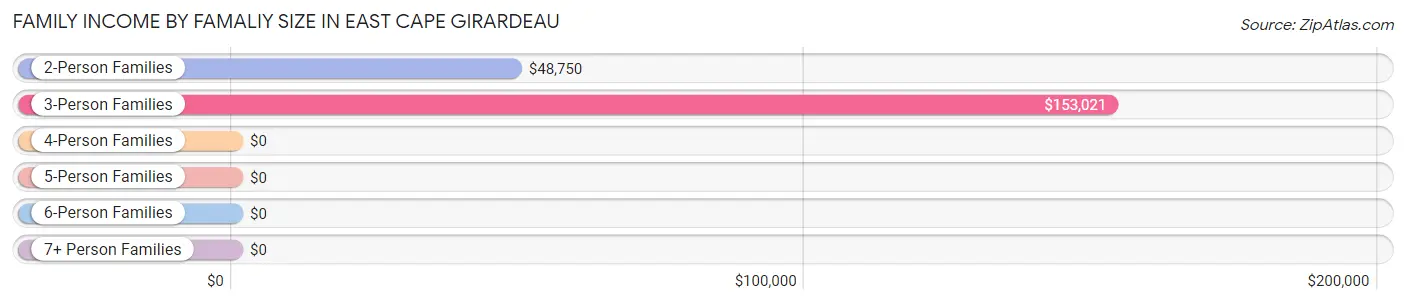
| Income Bracket | # Families | Median Income |
| 2-Person Families | 26 (46.4%) | $48,750 |
| 3-Person Families | 21 (37.5%) | $153,021 |
| 4-Person Families | 5 (8.9%) | $0 |
| 5-Person Families | 4 (7.1%) | $0 |
| 6-Person Families | 0 (0.0%) | $0 |
| 7+ Person Families | 0 (0.0%) | $0 |
| Total | 56 (100.0%) | $53,750 |
Family Income by Number of Earners in East Cape Girardeau
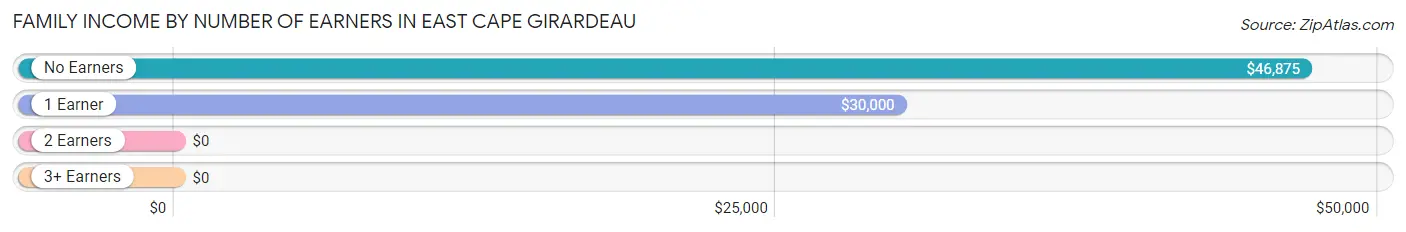
| Number of Earners | # Families | Median Income |
| No Earners | 5 (8.9%) | $46,875 |
| 1 Earner | 24 (42.9%) | $30,000 |
| 2 Earners | 26 (46.4%) | $0 |
| 3+ Earners | 1 (1.8%) | $0 |
| Total | 56 (100.0%) | $53,750 |
Household Income in East Cape Girardeau
Household Income Brackets in East Cape Girardeau
With 25 households falling in the category, the $35,000 to $49,999 income range is the most frequent in East Cape Girardeau, accounting for 28.4% of all households.
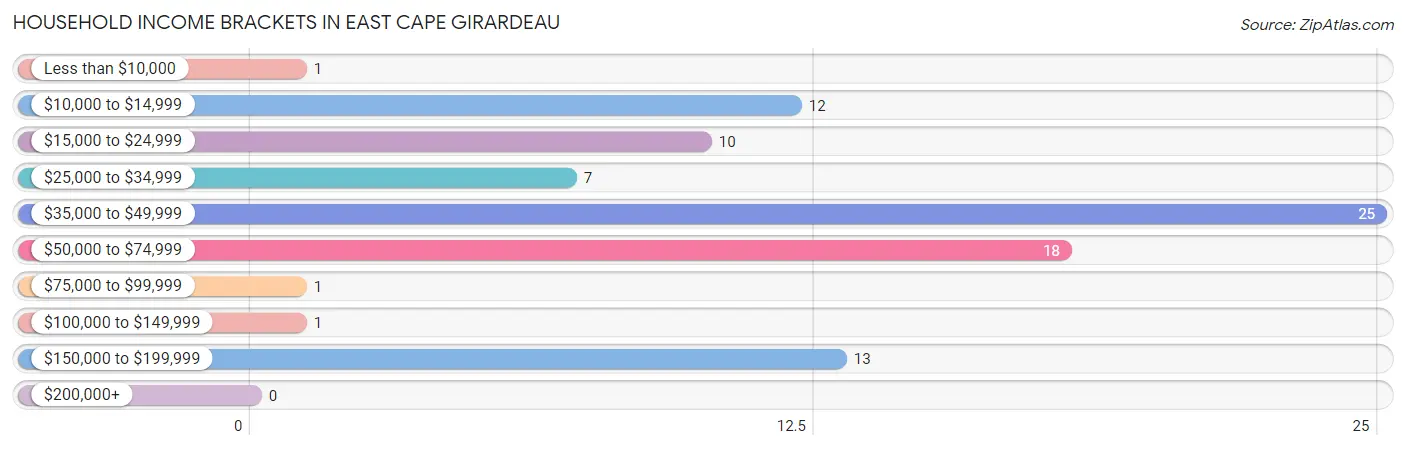
| Income Bracket | # Households | % Households |
| Less than $10,000 | 1 | 1.1% |
| $10,000 to $14,999 | 12 | 13.6% |
| $15,000 to $24,999 | 10 | 11.4% |
| $25,000 to $34,999 | 7 | 8.0% |
| $35,000 to $49,999 | 25 | 28.4% |
| $50,000 to $74,999 | 18 | 20.5% |
| $75,000 to $99,999 | 1 | 1.1% |
| $100,000 to $149,999 | 1 | 1.1% |
| $150,000 to $199,999 | 13 | 14.8% |
| $200,000+ | 0 | 0.0% |
Household Income by Householder Age in East Cape Girardeau
The median household income in East Cape Girardeau is $41,250, with the highest median household income of $52,917 found in the 45 to 64 years age bracket for the primary householder. A total of 48 households (54.5%) fall into this category.
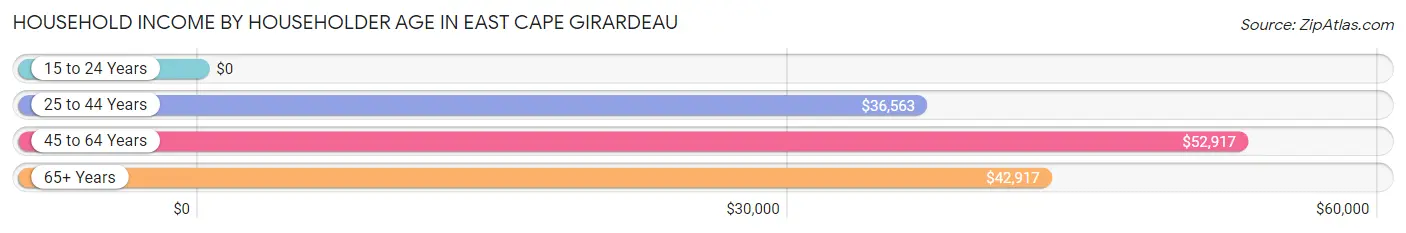
| Income Bracket | # Households | Median Income |
| 15 to 24 Years | 0 (0.0%) | $0 |
| 25 to 44 Years | 15 (17.1%) | $36,563 |
| 45 to 64 Years | 48 (54.5%) | $52,917 |
| 65+ Years | 25 (28.4%) | $42,917 |
| Total | 88 (100.0%) | $41,250 |
Poverty in East Cape Girardeau
Income Below Poverty by Sex and Age in East Cape Girardeau
With 26.2% poverty level for males and 44.5% for females among the residents of East Cape Girardeau, 35 to 44 year old males and under 5 year old females are the most vulnerable to poverty, with 26 males (68.4%) and 6 females (100.0%) in their respective age groups living below the poverty level.
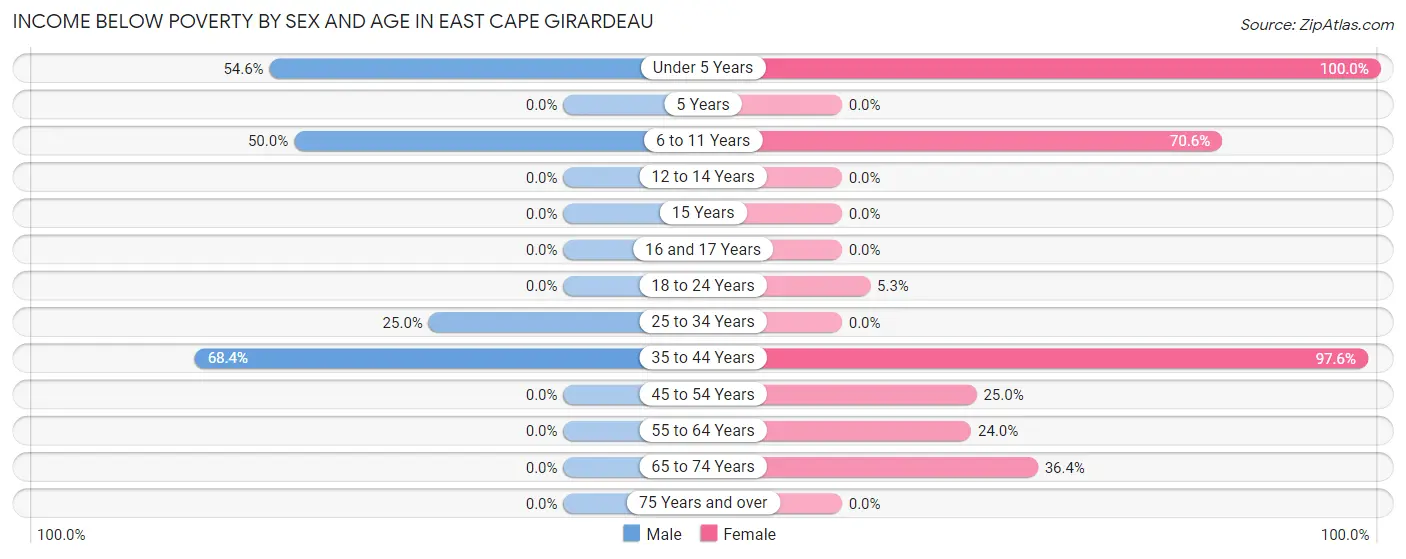
| Age Bracket | Male | Female |
| Under 5 Years | 6 (54.5%) | 6 (100.0%) |
| 5 Years | 0 (0.0%) | 0 (0.0%) |
| 6 to 11 Years | 10 (50.0%) | 12 (70.6%) |
| 12 to 14 Years | 0 (0.0%) | 0 (0.0%) |
| 15 Years | 0 (0.0%) | 0 (0.0%) |
| 16 and 17 Years | 0 (0.0%) | 0 (0.0%) |
| 18 to 24 Years | 0 (0.0%) | 1 (5.3%) |
| 25 to 34 Years | 3 (25.0%) | 0 (0.0%) |
| 35 to 44 Years | 26 (68.4%) | 41 (97.6%) |
| 45 to 54 Years | 0 (0.0%) | 3 (25.0%) |
| 55 to 64 Years | 0 (0.0%) | 6 (24.0%) |
| 65 to 74 Years | 0 (0.0%) | 4 (36.4%) |
| 75 Years and over | 0 (0.0%) | 0 (0.0%) |
| Total | 45 (26.2%) | 73 (44.5%) |
Income Above Poverty by Sex and Age in East Cape Girardeau
According to the poverty statistics in East Cape Girardeau, males aged 5 years and females aged 16 and 17 years are the age groups that are most secure financially, with 100.0% of males and 100.0% of females in these age groups living above the poverty line.
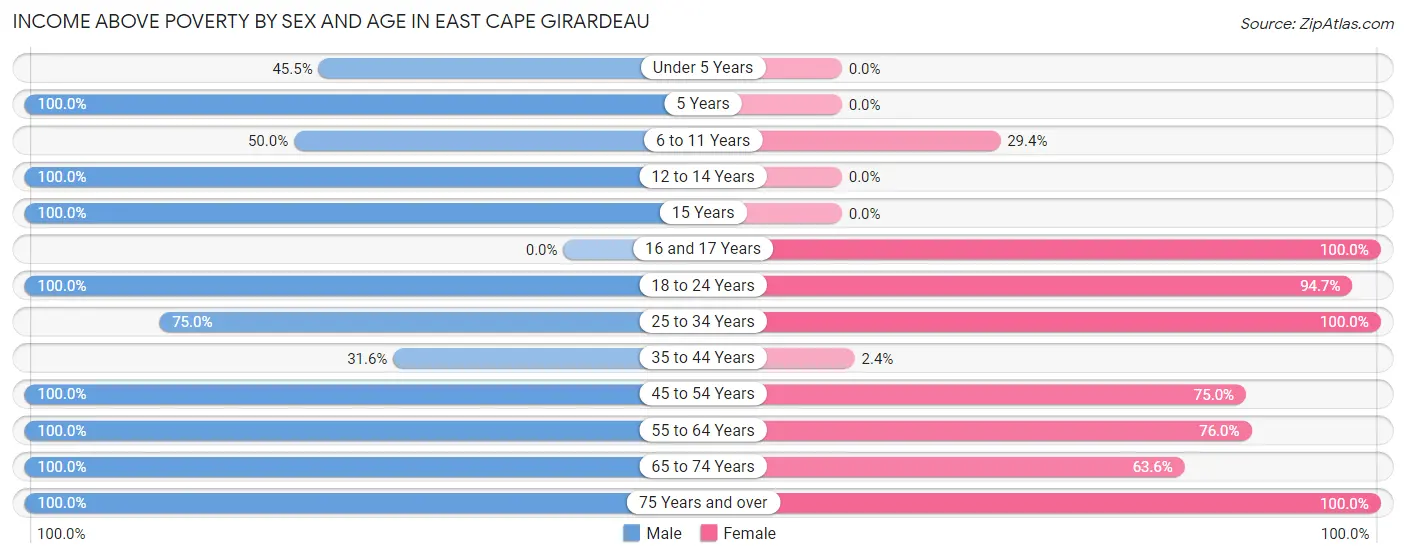
| Age Bracket | Male | Female |
| Under 5 Years | 5 (45.5%) | 0 (0.0%) |
| 5 Years | 10 (100.0%) | 0 (0.0%) |
| 6 to 11 Years | 10 (50.0%) | 5 (29.4%) |
| 12 to 14 Years | 7 (100.0%) | 0 (0.0%) |
| 15 Years | 3 (100.0%) | 0 (0.0%) |
| 16 and 17 Years | 0 (0.0%) | 23 (100.0%) |
| 18 to 24 Years | 2 (100.0%) | 18 (94.7%) |
| 25 to 34 Years | 9 (75.0%) | 7 (100.0%) |
| 35 to 44 Years | 12 (31.6%) | 1 (2.4%) |
| 45 to 54 Years | 42 (100.0%) | 9 (75.0%) |
| 55 to 64 Years | 8 (100.0%) | 19 (76.0%) |
| 65 to 74 Years | 8 (100.0%) | 7 (63.6%) |
| 75 Years and over | 11 (100.0%) | 2 (100.0%) |
| Total | 127 (73.8%) | 91 (55.5%) |
Income Below Poverty Among Married-Couple Families in East Cape Girardeau
The poverty statistics for married-couple families in East Cape Girardeau show that 2.6% or 1 of the total 39 families live below the poverty line. Families with 1 or 2 children have the highest poverty rate of 6.2%, comprising of 1 families. On the other hand, families with no children have the lowest poverty rate of 0.0%, which includes 0 families.
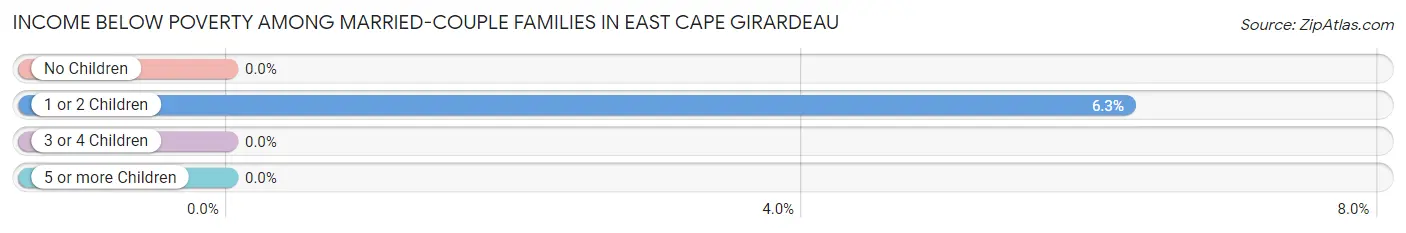
| Children | Above Poverty | Below Poverty |
| No Children | 19 (100.0%) | 0 (0.0%) |
| 1 or 2 Children | 15 (93.8%) | 1 (6.2%) |
| 3 or 4 Children | 4 (100.0%) | 0 (0.0%) |
| 5 or more Children | 0 (0.0%) | 0 (0.0%) |
| Total | 38 (97.4%) | 1 (2.6%) |
Income Below Poverty Among Single-Parent Households in East Cape Girardeau
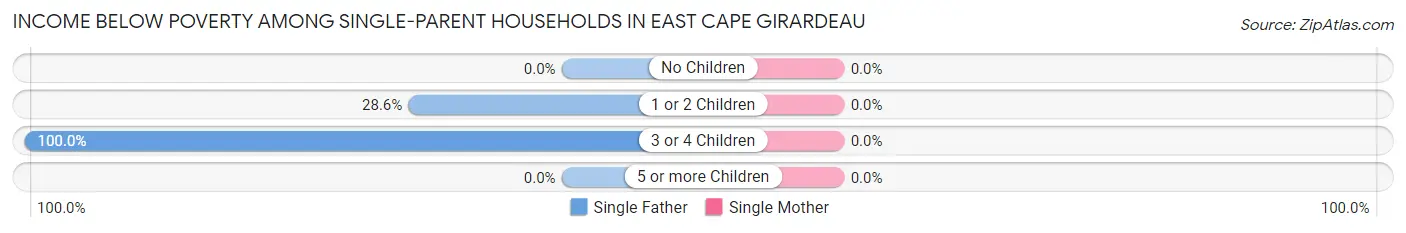
| Children | Single Father | Single Mother |
| No Children | 0 (0.0%) | 0 (0.0%) |
| 1 or 2 Children | 2 (28.6%) | 0 (0.0%) |
| 3 or 4 Children | 4 (100.0%) | 0 (0.0%) |
| 5 or more Children | 0 (0.0%) | 0 (0.0%) |
| Total | 6 (37.5%) | 0 (0.0%) |
Income Below Poverty Among Married-Couple vs Single-Parent Households in East Cape Girardeau
The poverty data for East Cape Girardeau shows that 1 of the married-couple family households (2.6%) and 6 of the single-parent households (35.3%) are living below the poverty level. Within the married-couple family households, those with 1 or 2 children have the highest poverty rate, with 1 households (6.2%) falling below the poverty line. Among the single-parent households, those with 3 or 4 children have the highest poverty rate, with 4 household (100.0%) living below poverty.
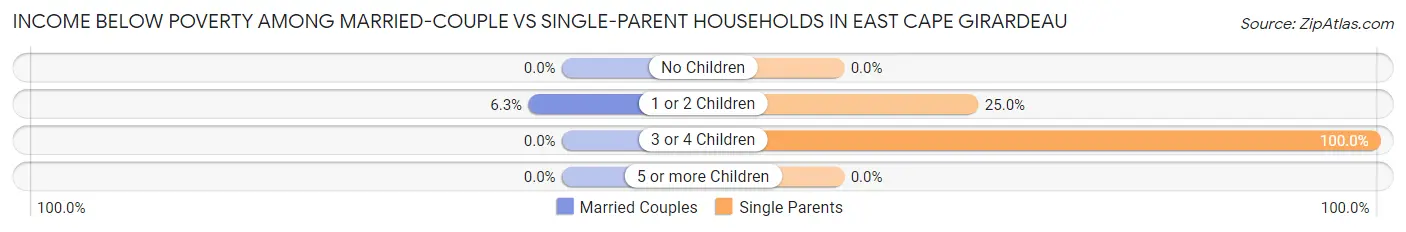
| Children | Married-Couple Families | Single-Parent Households |
| No Children | 0 (0.0%) | 0 (0.0%) |
| 1 or 2 Children | 1 (6.2%) | 2 (25.0%) |
| 3 or 4 Children | 0 (0.0%) | 4 (100.0%) |
| 5 or more Children | 0 (0.0%) | 0 (0.0%) |
| Total | 1 (2.6%) | 6 (35.3%) |
Race in East Cape Girardeau
The most populous races in East Cape Girardeau are White / Caucasian (304 | 88.6%), Two or more Races (27 | 7.9%), and Black / African American (11 | 3.2%).
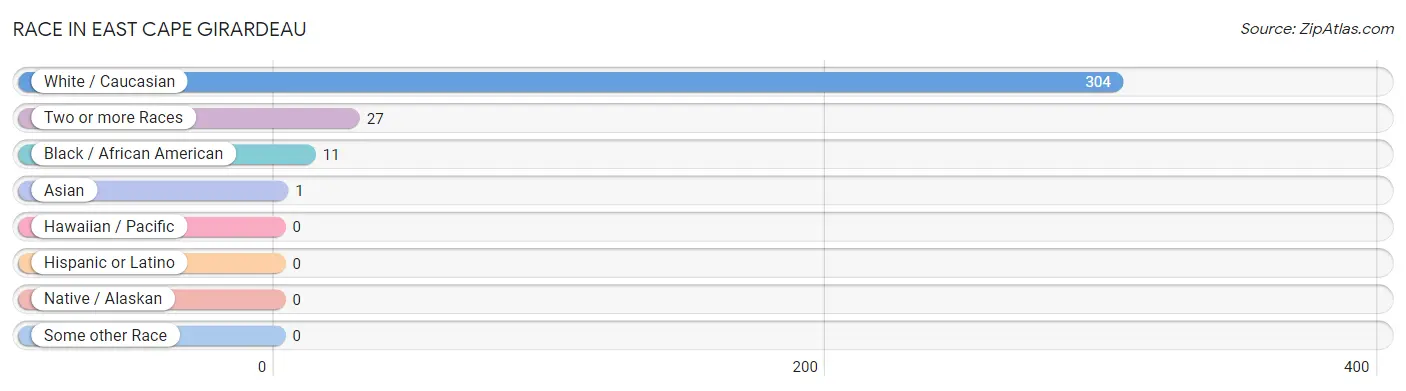
| Race | # Population | % Population |
| Asian | 1 | 0.3% |
| Black / African American | 11 | 3.2% |
| Hawaiian / Pacific | 0 | 0.0% |
| Hispanic or Latino | 0 | 0.0% |
| Native / Alaskan | 0 | 0.0% |
| White / Caucasian | 304 | 88.6% |
| Two or more Races | 27 | 7.9% |
| Some other Race | 0 | 0.0% |
| Total | 343 | 100.0% |
Ancestry in East Cape Girardeau
The most populous ancestries reported in East Cape Girardeau are German (81 | 23.6%), Irish (42 | 12.2%), English (19 | 5.5%), American (5 | 1.5%), and Jamaican (3 | 0.9%), together accounting for 43.7% of all East Cape Girardeau residents.
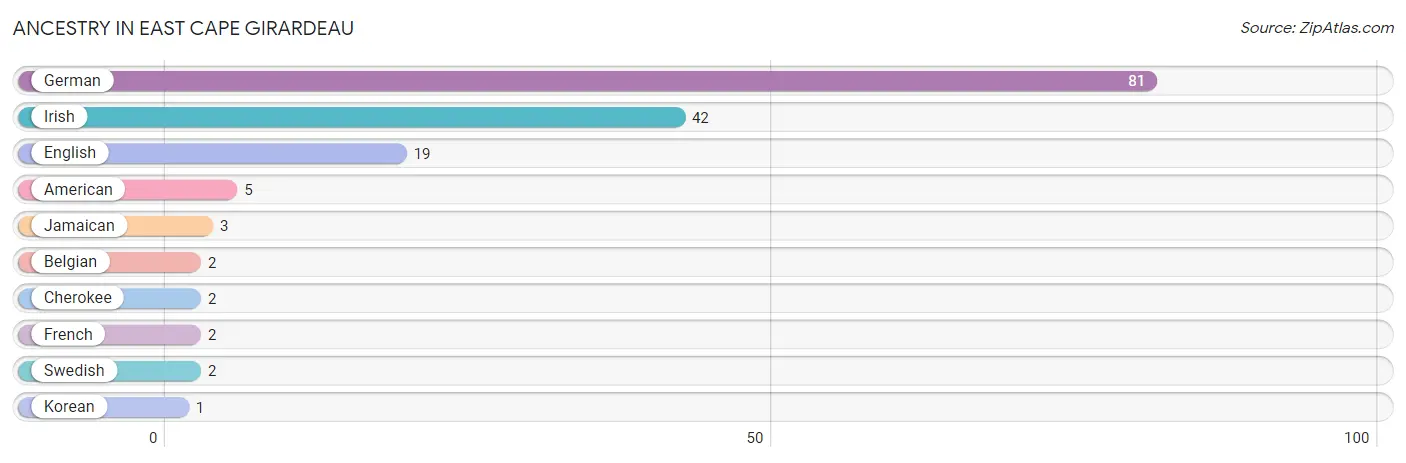
| Ancestry | # Population | % Population |
| American | 5 | 1.5% |
| Belgian | 2 | 0.6% |
| Cherokee | 2 | 0.6% |
| English | 19 | 5.5% |
| French | 2 | 0.6% |
| German | 81 | 23.6% |
| Irish | 42 | 12.2% |
| Jamaican | 3 | 0.9% |
| Korean | 1 | 0.3% |
| Swedish | 2 | 0.6% | View All 10 Rows |
Immigrants in East Cape Girardeau
The most numerous immigrant groups reported in East Cape Girardeau came from Asia (1 | 0.3%), Caribbean (1 | 0.3%), Eastern Asia (1 | 0.3%), Jamaica (1 | 0.3%), and Korea (1 | 0.3%), together accounting for 1.4% of all East Cape Girardeau residents.
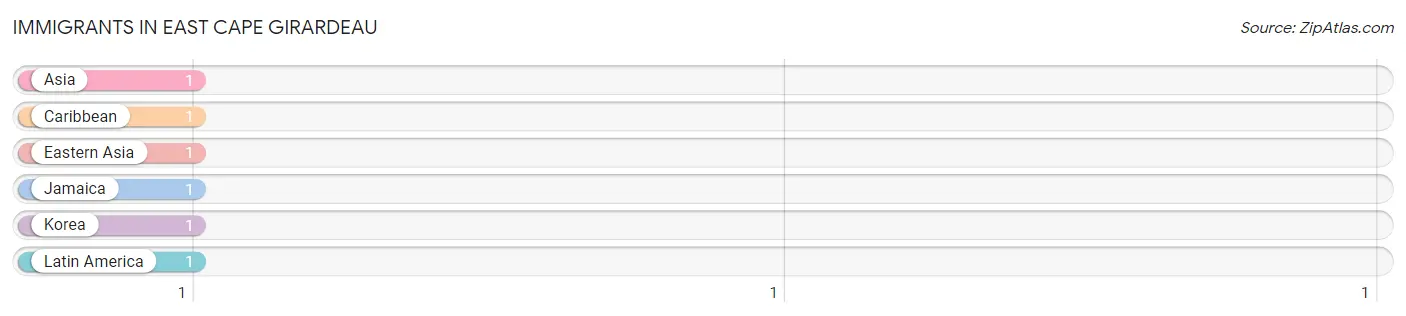
| Immigration Origin | # Population | % Population |
| Asia | 1 | 0.3% |
| Caribbean | 1 | 0.3% |
| Eastern Asia | 1 | 0.3% |
| Jamaica | 1 | 0.3% |
| Korea | 1 | 0.3% |
| Latin America | 1 | 0.3% | View All 6 Rows |
Sex and Age in East Cape Girardeau
Sex and Age in East Cape Girardeau
The most populous age groups in East Cape Girardeau are 50 to 54 Years (42 | 23.5%) for men and 15 to 19 Years (32 | 19.5%) for women.
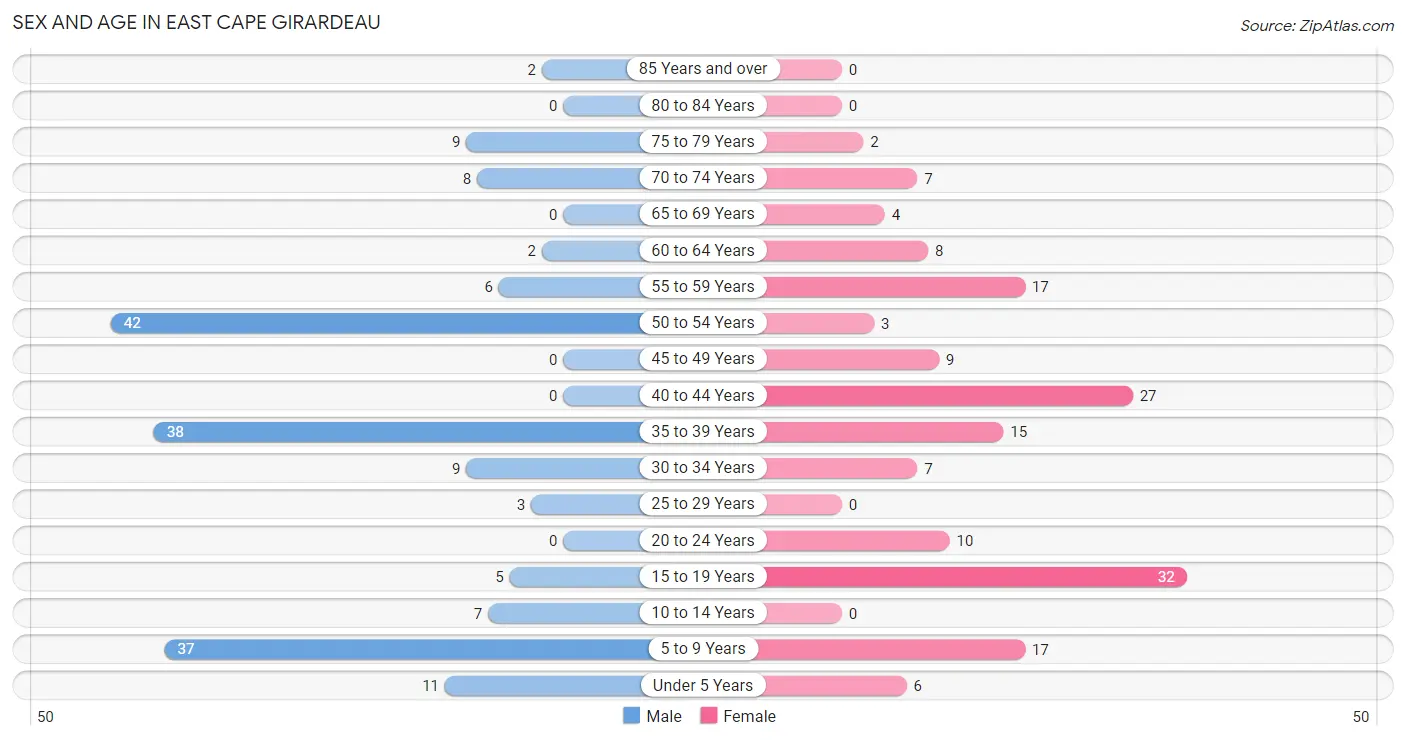
| Age Bracket | Male | Female |
| Under 5 Years | 11 (6.1%) | 6 (3.7%) |
| 5 to 9 Years | 37 (20.7%) | 17 (10.4%) |
| 10 to 14 Years | 7 (3.9%) | 0 (0.0%) |
| 15 to 19 Years | 5 (2.8%) | 32 (19.5%) |
| 20 to 24 Years | 0 (0.0%) | 10 (6.1%) |
| 25 to 29 Years | 3 (1.7%) | 0 (0.0%) |
| 30 to 34 Years | 9 (5.0%) | 7 (4.3%) |
| 35 to 39 Years | 38 (21.2%) | 15 (9.1%) |
| 40 to 44 Years | 0 (0.0%) | 27 (16.5%) |
| 45 to 49 Years | 0 (0.0%) | 9 (5.5%) |
| 50 to 54 Years | 42 (23.5%) | 3 (1.8%) |
| 55 to 59 Years | 6 (3.4%) | 17 (10.4%) |
| 60 to 64 Years | 2 (1.1%) | 8 (4.9%) |
| 65 to 69 Years | 0 (0.0%) | 4 (2.4%) |
| 70 to 74 Years | 8 (4.5%) | 7 (4.3%) |
| 75 to 79 Years | 9 (5.0%) | 2 (1.2%) |
| 80 to 84 Years | 0 (0.0%) | 0 (0.0%) |
| 85 Years and over | 2 (1.1%) | 0 (0.0%) |
| Total | 179 (100.0%) | 164 (100.0%) |
Families and Households in East Cape Girardeau
Median Family Size in East Cape Girardeau
The median family size in East Cape Girardeau is 4.30 persons per family, with single female/mother families (1 | 1.8%) accounting for the largest median family size of 23 persons per family. On the other hand, married-couple families (39 | 69.6%) represent the smallest median family size with 3.85 persons per family.
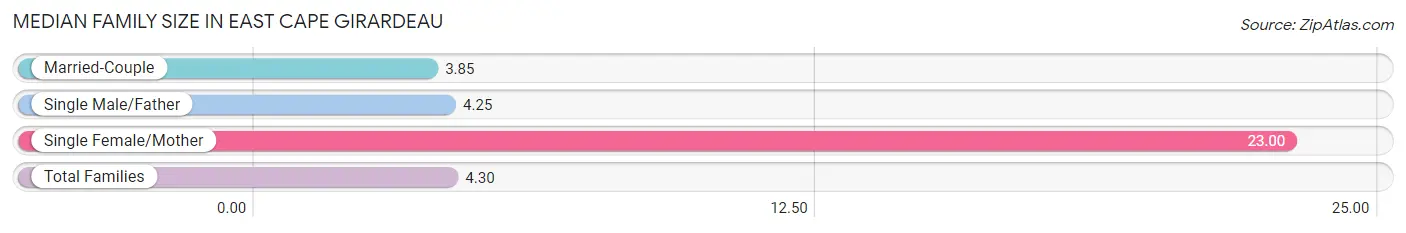
| Family Type | # Families | Family Size |
| Married-Couple | 39 (69.6%) | 3.85 |
| Single Male/Father | 16 (28.6%) | 4.25 |
| Single Female/Mother | 1 (1.8%) | 23.00 |
| Total Families | 56 (100.0%) | 4.30 |
Median Household Size in East Cape Girardeau
The median household size in East Cape Girardeau is 3.90 persons per household, with single female/mother households (1 | 1.1%) accounting for the largest median household size of 23 persons per household. non-family households (32 | 36.4%) represent the smallest median household size with 2.75 persons per household.
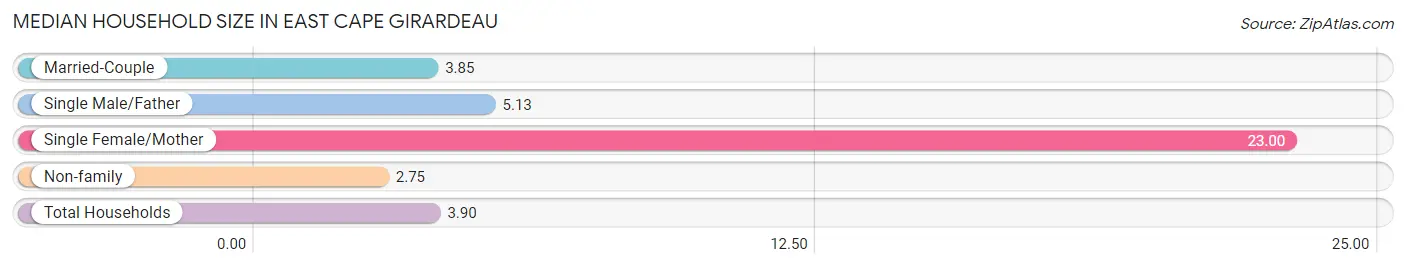
| Household Type | # Households | Household Size |
| Married-Couple | 39 (44.3%) | 3.85 |
| Single Male/Father | 16 (18.2%) | 5.13 |
| Single Female/Mother | 1 (1.1%) | 23.00 |
| Non-family | 32 (36.4%) | 2.75 |
| Total Households | 88 (100.0%) | 3.90 |
Household Size by Marriage Status in East Cape Girardeau
Out of a total of 88 households in East Cape Girardeau, 56 (63.6%) are family households, while 32 (36.4%) are nonfamily households. The most numerous type of family households are 2-person households, comprising 26, and the most common type of nonfamily households are 1-person households, comprising 22.
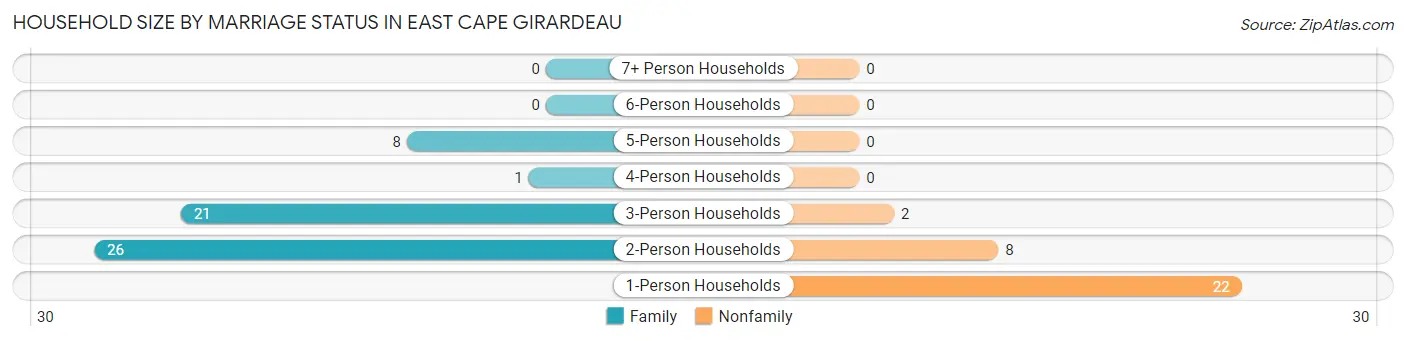
| Household Size | Family Households | Nonfamily Households |
| 1-Person Households | - | 22 (25.0%) |
| 2-Person Households | 26 (29.5%) | 8 (9.1%) |
| 3-Person Households | 21 (23.9%) | 2 (2.3%) |
| 4-Person Households | 1 (1.1%) | 0 (0.0%) |
| 5-Person Households | 8 (9.1%) | 0 (0.0%) |
| 6-Person Households | 0 (0.0%) | 0 (0.0%) |
| 7+ Person Households | 0 (0.0%) | 0 (0.0%) |
| Total | 56 (63.6%) | 32 (36.4%) |
Female Fertility in East Cape Girardeau
Fertility by Age in East Cape Girardeau
Average fertility rate in East Cape Girardeau is 10.0 births per 1,000 women. Women in the age bracket of 20 to 34 years have the highest fertility rate with 59.0 births per 1,000 women. Women in the age bracket of 20 to 34 years acount for 100.0% of all women with births.
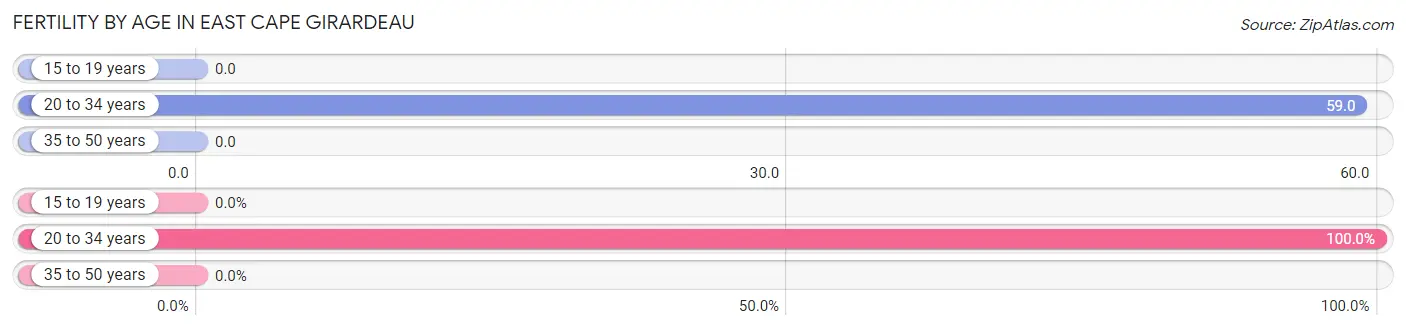
| Age Bracket | Women with Births | Births / 1,000 Women |
| 15 to 19 years | 0 (0.0%) | 0.0 |
| 20 to 34 years | 1 (100.0%) | 59.0 |
| 35 to 50 years | 0 (0.0%) | 0.0 |
| Total | 1 (100.0%) | 10.0 |
Fertility by Age by Marriage Status in East Cape Girardeau
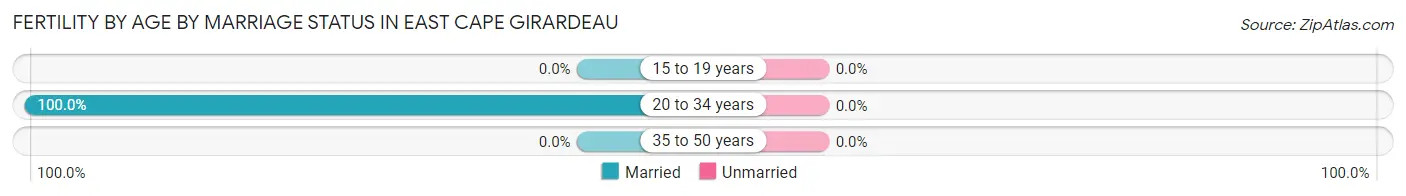
| Age Bracket | Married | Unmarried |
| 15 to 19 years | 0 (0.0%) | 0 (0.0%) |
| 20 to 34 years | 1 (100.0%) | 0 (0.0%) |
| 35 to 50 years | 0 (0.0%) | 0 (0.0%) |
| Total | 1 (100.0%) | 0 (0.0%) |
Fertility by Education in East Cape Girardeau
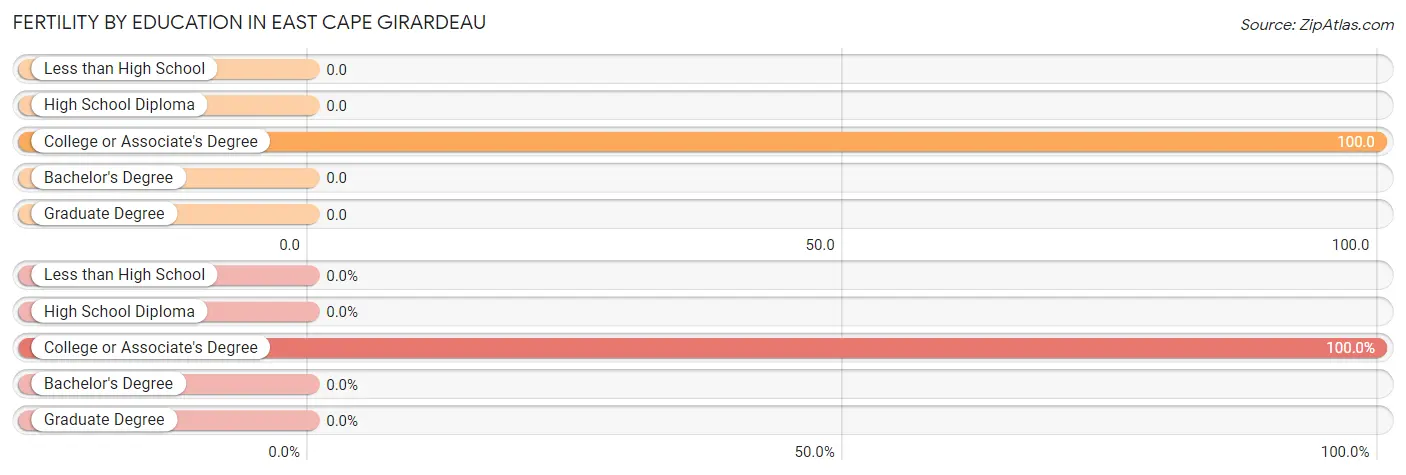
| Educational Attainment | Women with Births | Births / 1,000 Women |
| Less than High School | 0 (0.0%) | 0.0 |
| High School Diploma | 0 (0.0%) | 0.0 |
| College or Associate's Degree | 1 (100.0%) | 100.0 |
| Bachelor's Degree | 0 (0.0%) | 0.0 |
| Graduate Degree | 0 (0.0%) | 0.0 |
| Total | 1 (100.0%) | 10.0 |
Fertility by Education by Marriage Status in East Cape Girardeau
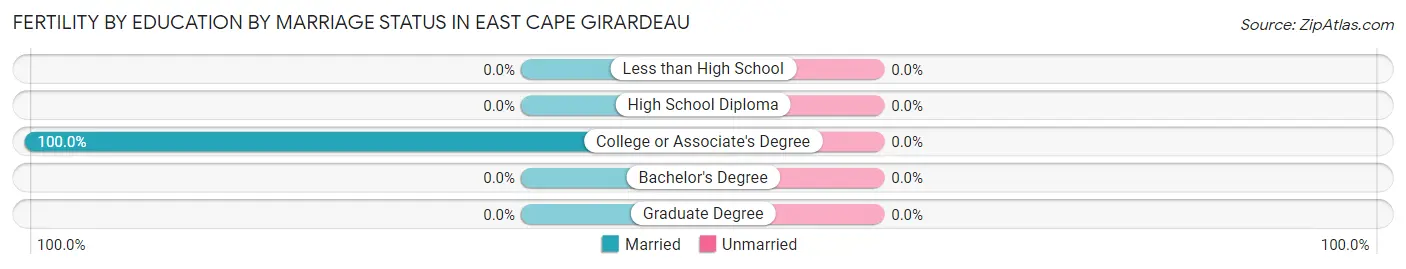
| Educational Attainment | Married | Unmarried |
| Less than High School | 0 (0.0%) | 0 (0.0%) |
| High School Diploma | 0 (0.0%) | 0 (0.0%) |
| College or Associate's Degree | 1 (100.0%) | 0 (0.0%) |
| Bachelor's Degree | 0 (0.0%) | 0 (0.0%) |
| Graduate Degree | 0 (0.0%) | 0 (0.0%) |
| Total | 1 (100.0%) | 0 (0.0%) |
Employment Characteristics in East Cape Girardeau
Employment by Class of Employer in East Cape Girardeau
Among the 109 employed individuals in East Cape Girardeau, private company employees (98 | 89.9%), local government employees (7 | 6.4%), and self-employed (incorporated) (2 | 1.8%) make up the most common classes of employment.
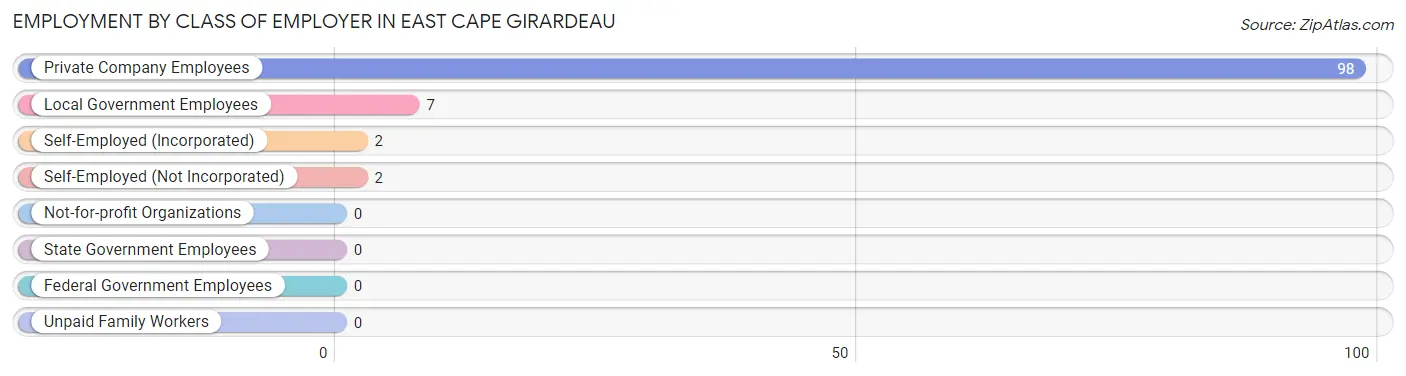
| Employer Class | # Employees | % Employees |
| Private Company Employees | 98 | 89.9% |
| Self-Employed (Incorporated) | 2 | 1.8% |
| Self-Employed (Not Incorporated) | 2 | 1.8% |
| Not-for-profit Organizations | 0 | 0.0% |
| Local Government Employees | 7 | 6.4% |
| State Government Employees | 0 | 0.0% |
| Federal Government Employees | 0 | 0.0% |
| Unpaid Family Workers | 0 | 0.0% |
| Total | 109 | 100.0% |
Employment Status by Age in East Cape Girardeau
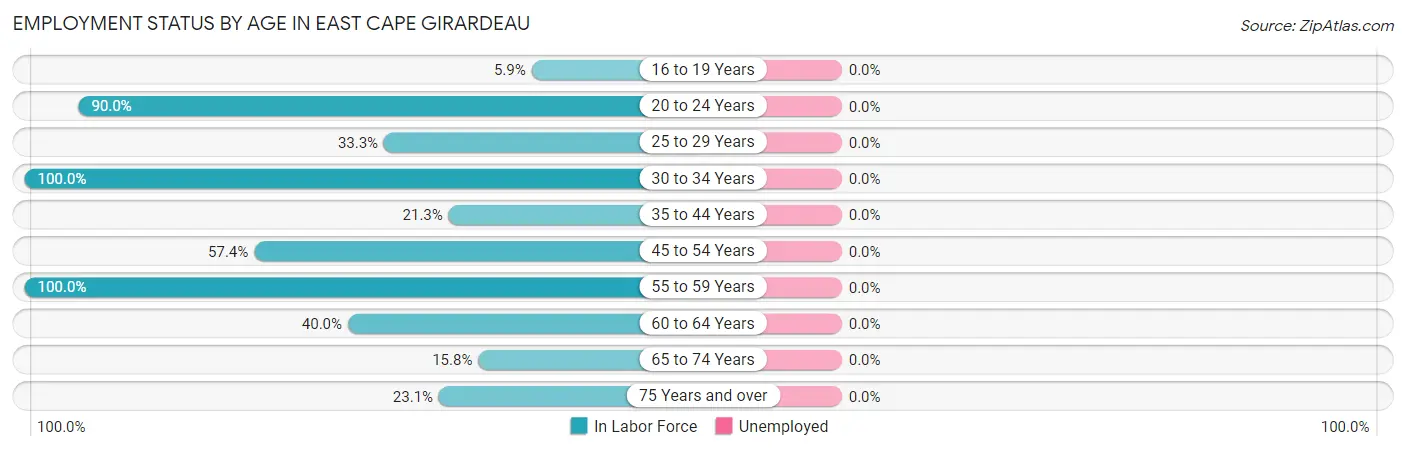
| Age Bracket | In Labor Force | Unemployed |
| 16 to 19 Years | 2 (5.9%) | 0 (0.0%) |
| 20 to 24 Years | 9 (90.0%) | 0 (0.0%) |
| 25 to 29 Years | 1 (33.3%) | 0 (0.0%) |
| 30 to 34 Years | 16 (100.0%) | 0 (0.0%) |
| 35 to 44 Years | 17 (21.3%) | 0 (0.0%) |
| 45 to 54 Years | 31 (57.4%) | 0 (0.0%) |
| 55 to 59 Years | 23 (100.0%) | 0 (0.0%) |
| 60 to 64 Years | 4 (40.0%) | 0 (0.0%) |
| 65 to 74 Years | 3 (15.8%) | 0 (0.0%) |
| 75 Years and over | 3 (23.1%) | 0 (0.0%) |
| Total | 109 (41.6%) | 0 (0.0%) |
Employment Status by Educational Attainment in East Cape Girardeau
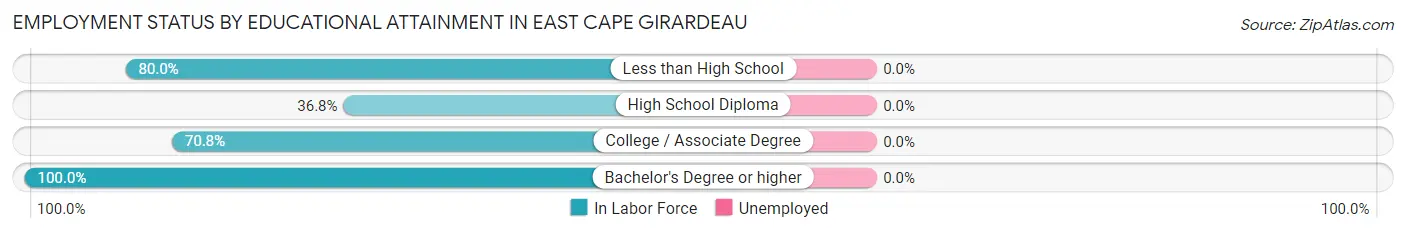
| Educational Attainment | In Labor Force | Unemployed |
| Less than High School | 12 (80.0%) | 0 (0.0%) |
| High School Diploma | 49 (36.8%) | 0 (0.0%) |
| College / Associate Degree | 17 (70.8%) | 0 (0.0%) |
| Bachelor's Degree or higher | 14 (100.0%) | 0 (0.0%) |
| Total | 92 (49.5%) | 0 (0.0%) |
Employment Occupations by Sex in East Cape Girardeau
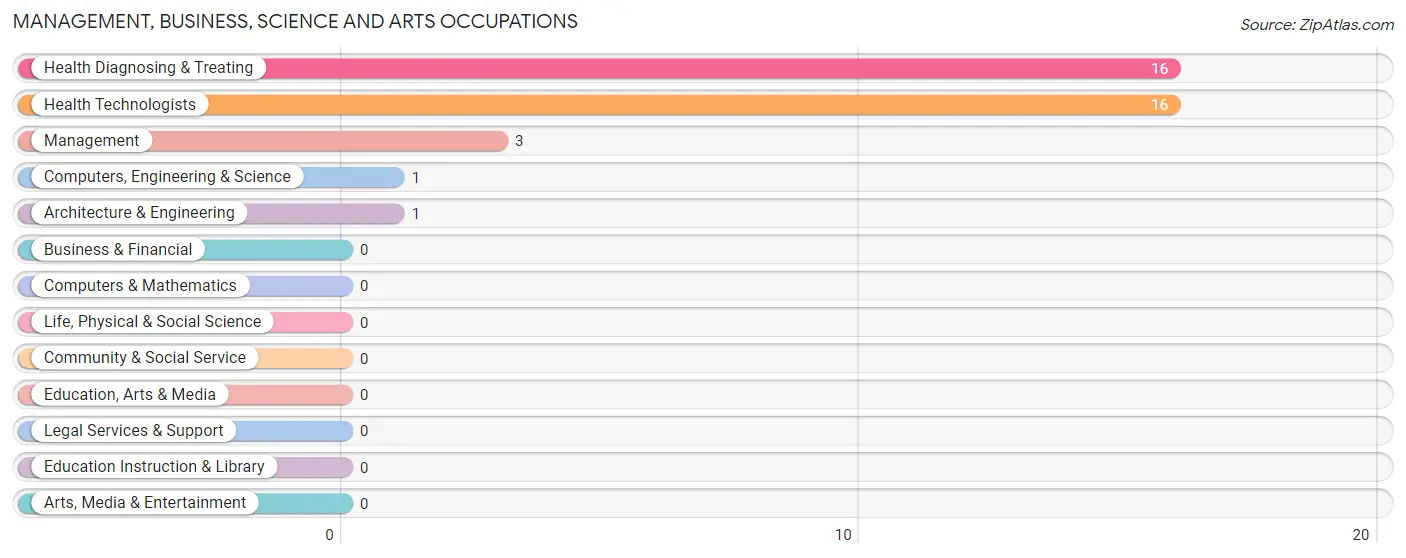
Management, Business, Science and Arts Occupations
The most common Management, Business, Science and Arts occupations in East Cape Girardeau are Health Diagnosing & Treating (16 | 14.7%), Health Technologists (16 | 14.7%), Management (3 | 2.8%), Computers, Engineering & Science (1 | 0.9%), and Architecture & Engineering (1 | 0.9%).
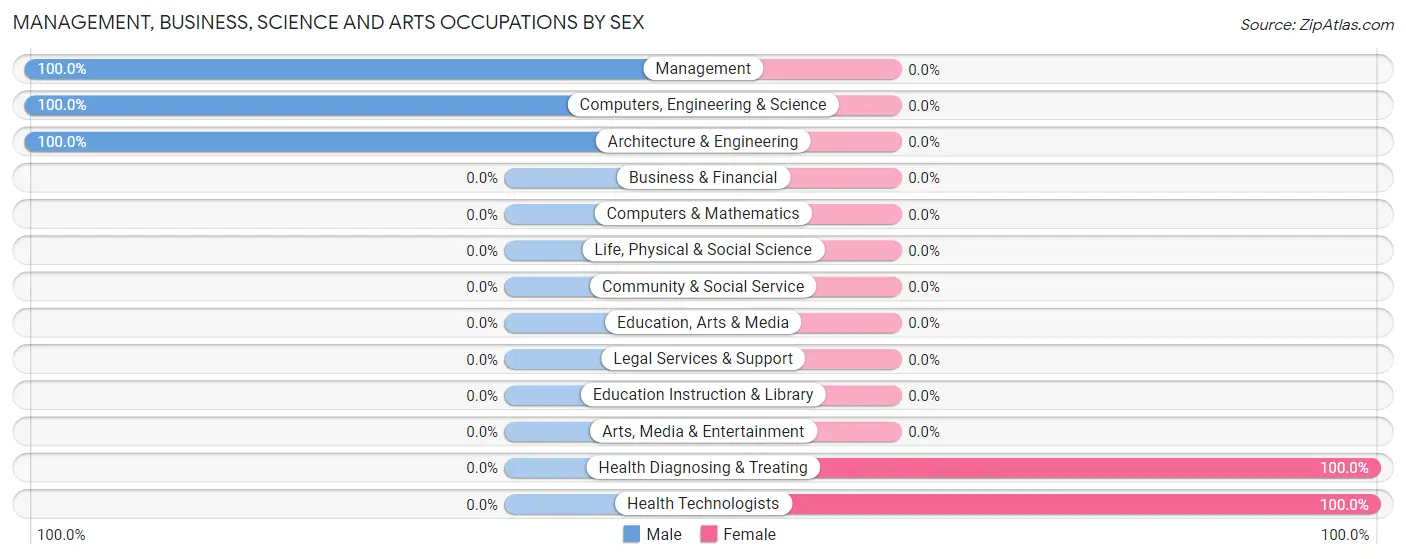
Management, Business, Science and Arts Occupations by Sex
Within the Management, Business, Science and Arts occupations in East Cape Girardeau, the most male-oriented occupations are Management (100.0%), Computers, Engineering & Science (100.0%), and Architecture & Engineering (100.0%), while the most female-oriented occupations are Health Diagnosing & Treating (100.0%), and Health Technologists (100.0%).
| Occupation | Male | Female |
| Management | 3 (100.0%) | 0 (0.0%) |
| Business & Financial | 0 (0.0%) | 0 (0.0%) |
| Computers, Engineering & Science | 1 (100.0%) | 0 (0.0%) |
| Computers & Mathematics | 0 (0.0%) | 0 (0.0%) |
| Architecture & Engineering | 1 (100.0%) | 0 (0.0%) |
| Life, Physical & Social Science | 0 (0.0%) | 0 (0.0%) |
| Community & Social Service | 0 (0.0%) | 0 (0.0%) |
| Education, Arts & Media | 0 (0.0%) | 0 (0.0%) |
| Legal Services & Support | 0 (0.0%) | 0 (0.0%) |
| Education Instruction & Library | 0 (0.0%) | 0 (0.0%) |
| Arts, Media & Entertainment | 0 (0.0%) | 0 (0.0%) |
| Health Diagnosing & Treating | 0 (0.0%) | 16 (100.0%) |
| Health Technologists | 0 (0.0%) | 16 (100.0%) |
| Total (Category) | 4 (20.0%) | 16 (80.0%) |
| Total (Overall) | 69 (63.3%) | 40 (36.7%) |
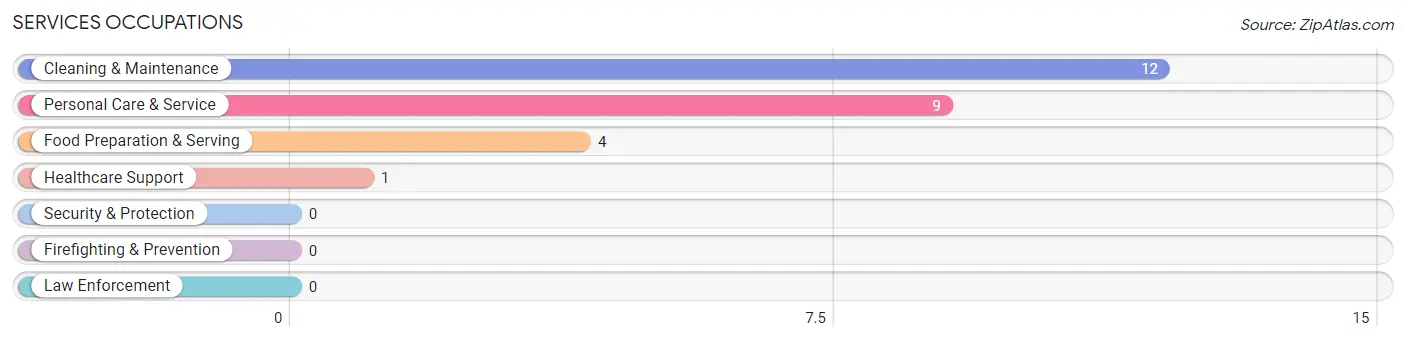
Services Occupations
The most common Services occupations in East Cape Girardeau are Cleaning & Maintenance (12 | 11.0%), Personal Care & Service (9 | 8.3%), Food Preparation & Serving (4 | 3.7%), and Healthcare Support (1 | 0.9%).
Services Occupations by Sex
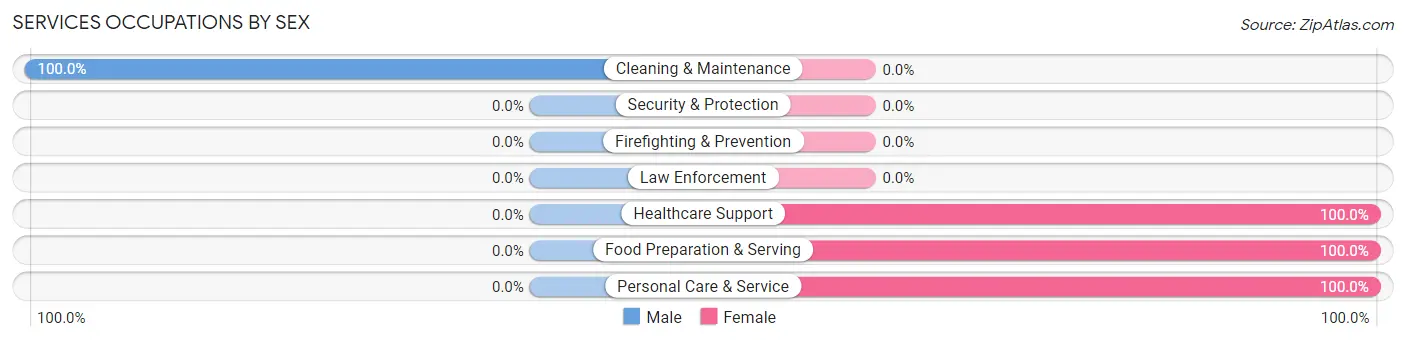
| Occupation | Male | Female |
| Healthcare Support | 0 (0.0%) | 1 (100.0%) |
| Security & Protection | 0 (0.0%) | 0 (0.0%) |
| Firefighting & Prevention | 0 (0.0%) | 0 (0.0%) |
| Law Enforcement | 0 (0.0%) | 0 (0.0%) |
| Food Preparation & Serving | 0 (0.0%) | 4 (100.0%) |
| Cleaning & Maintenance | 12 (100.0%) | 0 (0.0%) |
| Personal Care & Service | 0 (0.0%) | 9 (100.0%) |
| Total (Category) | 12 (46.2%) | 14 (53.8%) |
| Total (Overall) | 69 (63.3%) | 40 (36.7%) |
Sales and Office Occupations
The most common Sales and Office occupations in East Cape Girardeau are Sales & Related (9 | 8.3%), and Office & Administration (7 | 6.4%).
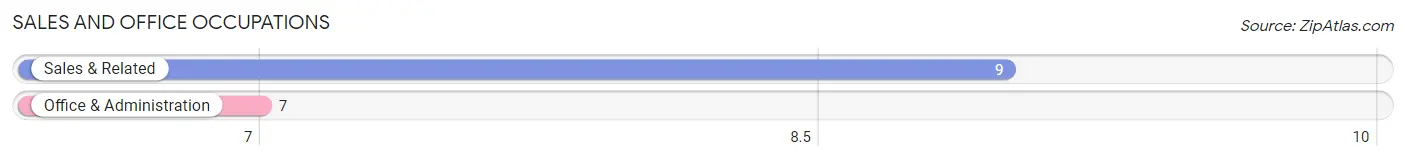
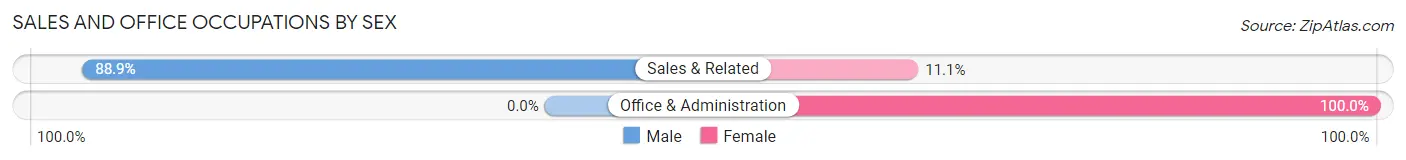
Sales and Office Occupations by Sex
| Occupation | Male | Female |
| Sales & Related | 8 (88.9%) | 1 (11.1%) |
| Office & Administration | 0 (0.0%) | 7 (100.0%) |
| Total (Category) | 8 (50.0%) | 8 (50.0%) |
| Total (Overall) | 69 (63.3%) | 40 (36.7%) |
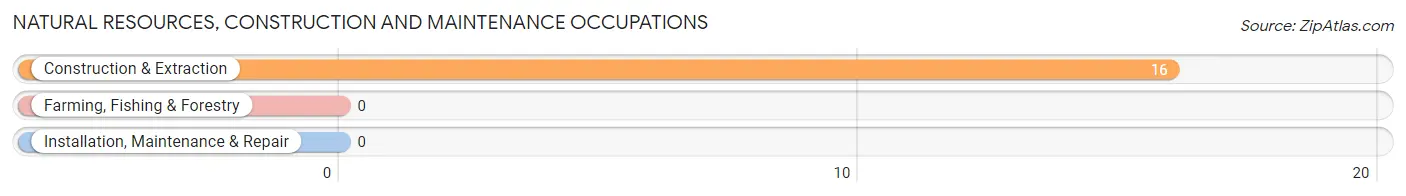
Natural Resources, Construction and Maintenance Occupations
The most common Natural Resources, Construction and Maintenance occupations in East Cape Girardeau are , and Construction & Extraction (16 | 14.7%).
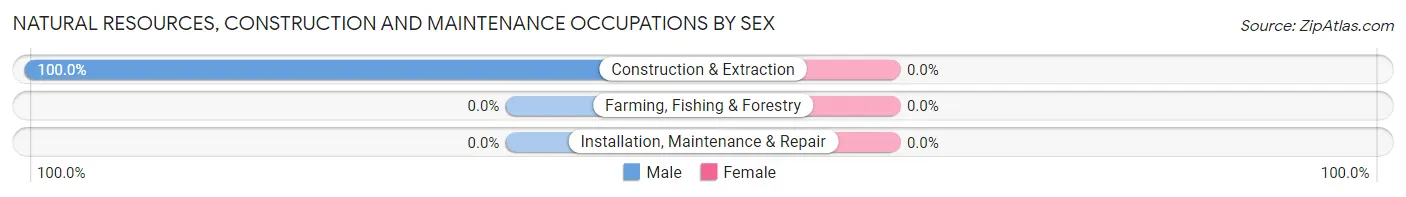
Natural Resources, Construction and Maintenance Occupations by Sex
| Occupation | Male | Female |
| Farming, Fishing & Forestry | 0 (0.0%) | 0 (0.0%) |
| Construction & Extraction | 16 (100.0%) | 0 (0.0%) |
| Installation, Maintenance & Repair | 0 (0.0%) | 0 (0.0%) |
| Total (Category) | 16 (100.0%) | 0 (0.0%) |
| Total (Overall) | 69 (63.3%) | 40 (36.7%) |
Production, Transportation and Moving Occupations
The most common Production, Transportation and Moving occupations in East Cape Girardeau are Transportation (15 | 13.8%), Material Moving (14 | 12.8%), and Production (2 | 1.8%).
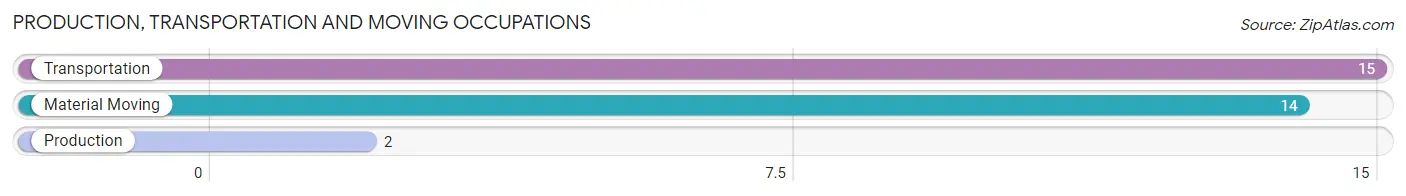
Production, Transportation and Moving Occupations by Sex
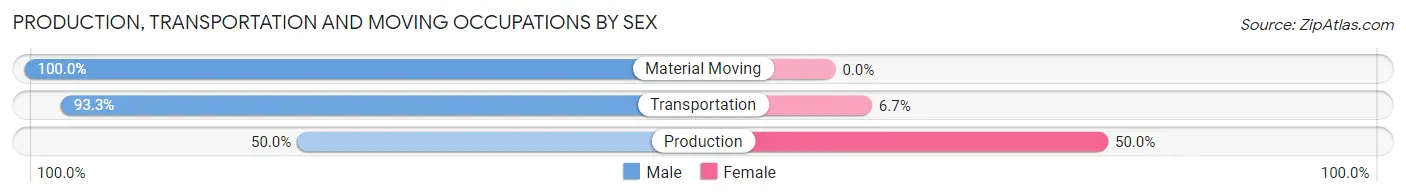
| Occupation | Male | Female |
| Production | 1 (50.0%) | 1 (50.0%) |
| Transportation | 14 (93.3%) | 1 (6.7%) |
| Material Moving | 14 (100.0%) | 0 (0.0%) |
| Total (Category) | 29 (93.5%) | 2 (6.5%) |
| Total (Overall) | 69 (63.3%) | 40 (36.7%) |
Employment Industries by Sex in East Cape Girardeau
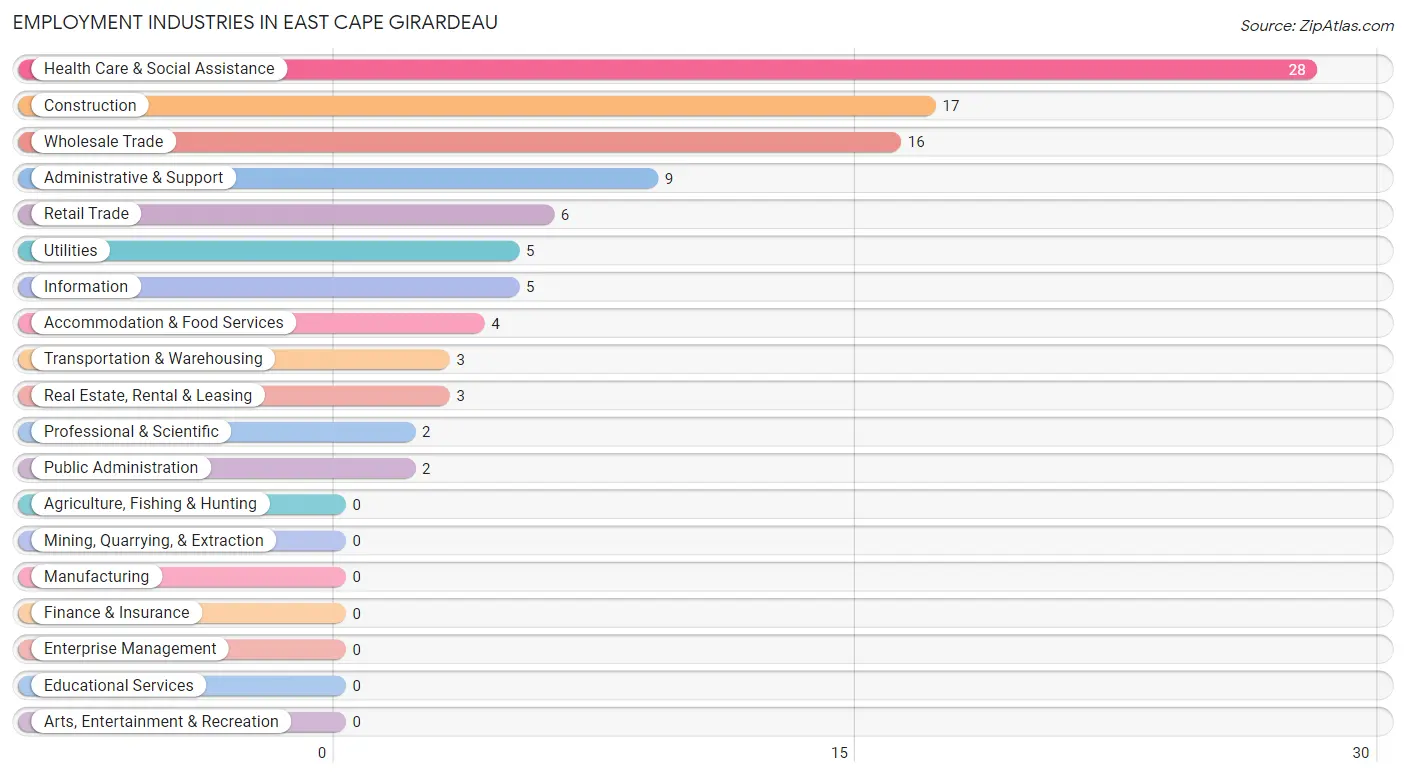
Employment Industries in East Cape Girardeau
The major employment industries in East Cape Girardeau include Health Care & Social Assistance (28 | 25.7%), Construction (17 | 15.6%), Wholesale Trade (16 | 14.7%), Administrative & Support (9 | 8.3%), and Retail Trade (6 | 5.5%).
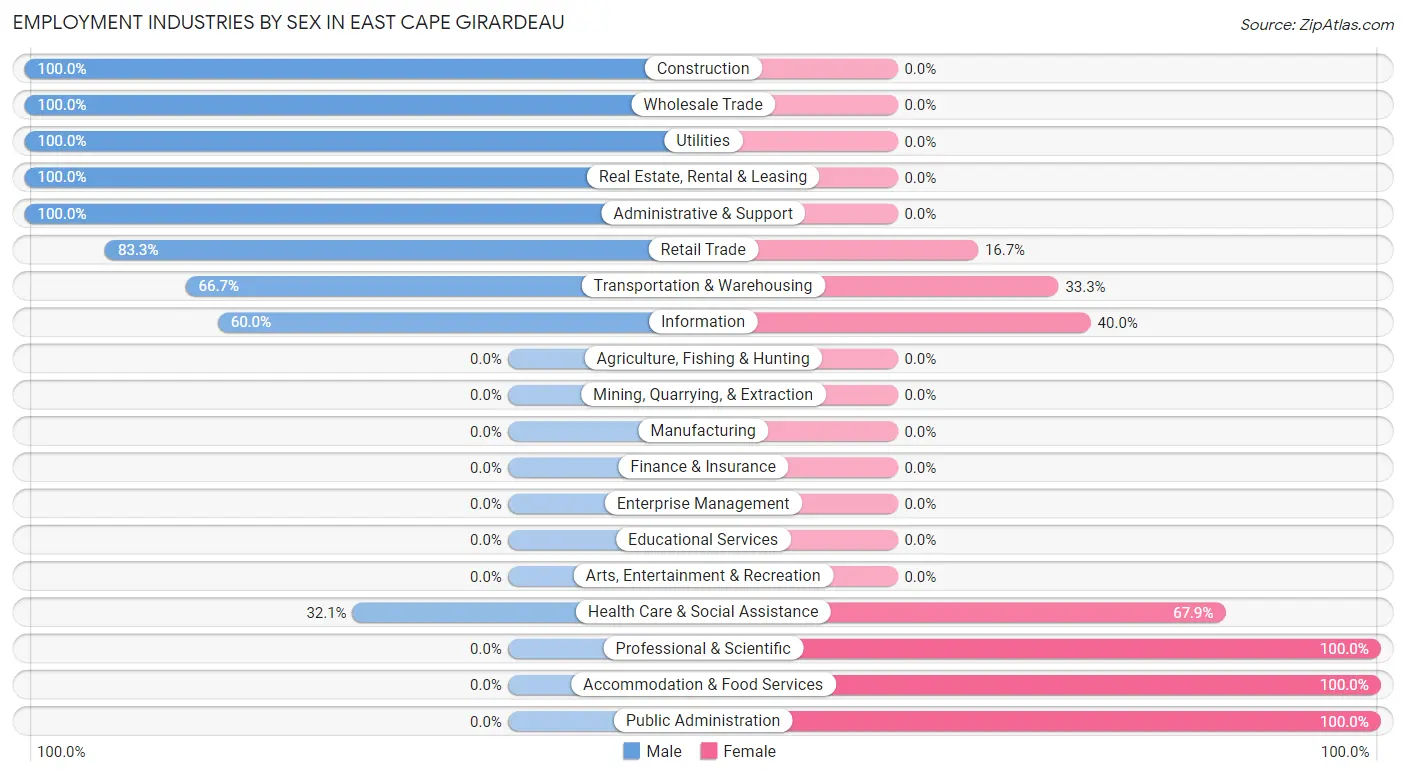
Employment Industries by Sex in East Cape Girardeau
The East Cape Girardeau industries that see more men than women are Construction (100.0%), Wholesale Trade (100.0%), and Utilities (100.0%), whereas the industries that tend to have a higher number of women are Professional & Scientific (100.0%), Accommodation & Food Services (100.0%), and Public Administration (100.0%).
| Industry | Male | Female |
| Agriculture, Fishing & Hunting | 0 (0.0%) | 0 (0.0%) |
| Mining, Quarrying, & Extraction | 0 (0.0%) | 0 (0.0%) |
| Construction | 17 (100.0%) | 0 (0.0%) |
| Manufacturing | 0 (0.0%) | 0 (0.0%) |
| Wholesale Trade | 16 (100.0%) | 0 (0.0%) |
| Retail Trade | 5 (83.3%) | 1 (16.7%) |
| Transportation & Warehousing | 2 (66.7%) | 1 (33.3%) |
| Utilities | 5 (100.0%) | 0 (0.0%) |
| Information | 3 (60.0%) | 2 (40.0%) |
| Finance & Insurance | 0 (0.0%) | 0 (0.0%) |
| Real Estate, Rental & Leasing | 3 (100.0%) | 0 (0.0%) |
| Professional & Scientific | 0 (0.0%) | 2 (100.0%) |
| Enterprise Management | 0 (0.0%) | 0 (0.0%) |
| Administrative & Support | 9 (100.0%) | 0 (0.0%) |
| Educational Services | 0 (0.0%) | 0 (0.0%) |
| Health Care & Social Assistance | 9 (32.1%) | 19 (67.9%) |
| Arts, Entertainment & Recreation | 0 (0.0%) | 0 (0.0%) |
| Accommodation & Food Services | 0 (0.0%) | 4 (100.0%) |
| Public Administration | 0 (0.0%) | 2 (100.0%) |
| Total | 69 (63.3%) | 40 (36.7%) |
Education in East Cape Girardeau
School Enrollment in East Cape Girardeau
The most common levels of schooling among the 104 students in East Cape Girardeau are elementary school (32 | 30.8%), high school (26 | 25.0%), and middle school (19 | 18.3%).
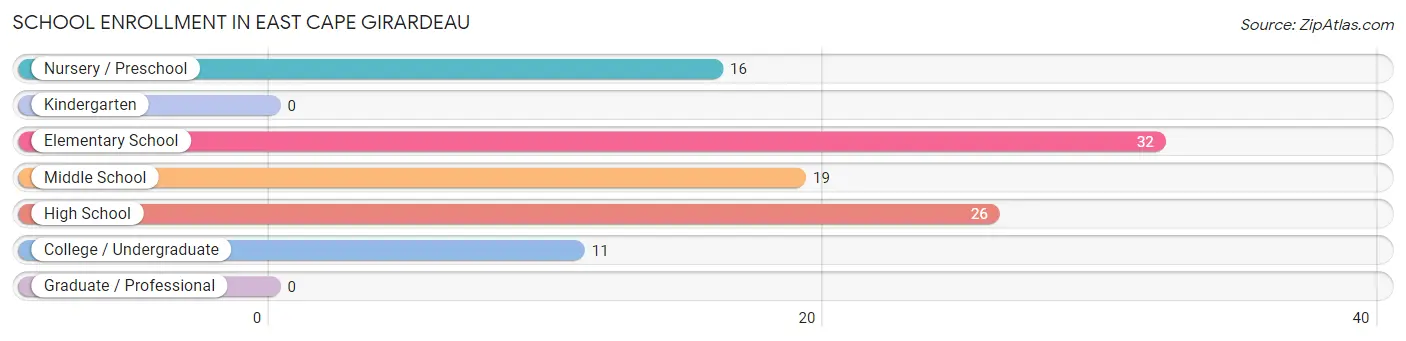
| School Level | # Students | % Students |
| Nursery / Preschool | 16 | 15.4% |
| Kindergarten | 0 | 0.0% |
| Elementary School | 32 | 30.8% |
| Middle School | 19 | 18.3% |
| High School | 26 | 25.0% |
| College / Undergraduate | 11 | 10.6% |
| Graduate / Professional | 0 | 0.0% |
| Total | 104 | 100.0% |
School Enrollment by Age by Funding Source in East Cape Girardeau
Out of a total of 104 students who are enrolled in schools in East Cape Girardeau, 21 (20.2%) attend a private institution, while the remaining 83 (79.8%) are enrolled in public schools. The age group of 15 to 17 year olds has the highest likelihood of being enrolled in private schools, with 19 (73.1% in the age bracket) enrolled. Conversely, the age group of 5 to 9 year old has the lowest likelihood of being enrolled in a private school, with 54 (100.0% in the age bracket) attending a public institution.
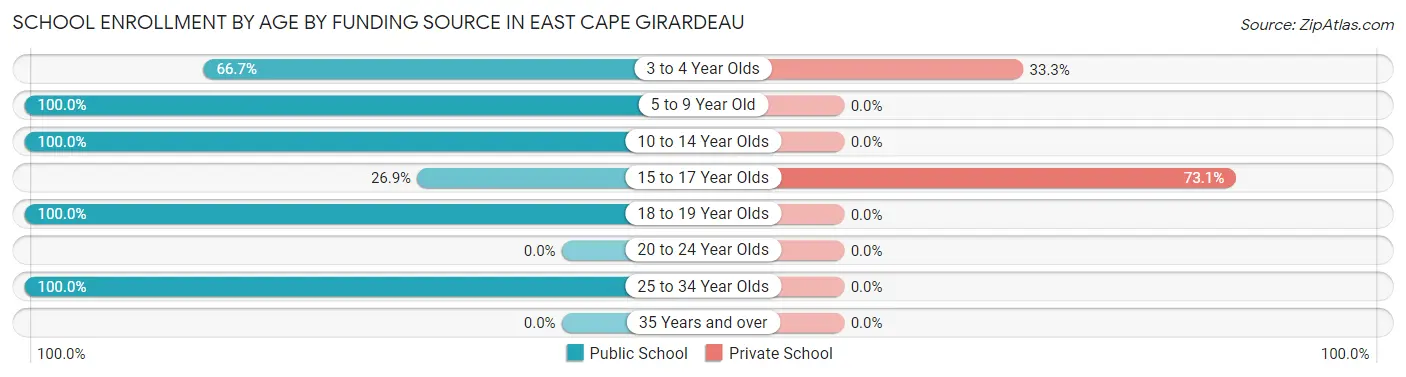
| Age Bracket | Public School | Private School |
| 3 to 4 Year Olds | 4 (66.7%) | 2 (33.3%) |
| 5 to 9 Year Old | 54 (100.0%) | 0 (0.0%) |
| 10 to 14 Year Olds | 7 (100.0%) | 0 (0.0%) |
| 15 to 17 Year Olds | 7 (26.9%) | 19 (73.1%) |
| 18 to 19 Year Olds | 9 (100.0%) | 0 (0.0%) |
| 20 to 24 Year Olds | 0 (0.0%) | 0 (0.0%) |
| 25 to 34 Year Olds | 2 (100.0%) | 0 (0.0%) |
| 35 Years and over | 0 (0.0%) | 0 (0.0%) |
| Total | 83 (79.8%) | 21 (20.2%) |
Educational Attainment by Field of Study in East Cape Girardeau
Science & technology (12 | 70.6%), computers & mathematics (2 | 11.8%), education (2 | 11.8%), and business (1 | 5.9%) are the most common fields of study among 17 individuals in East Cape Girardeau who have obtained a bachelor's degree or higher.
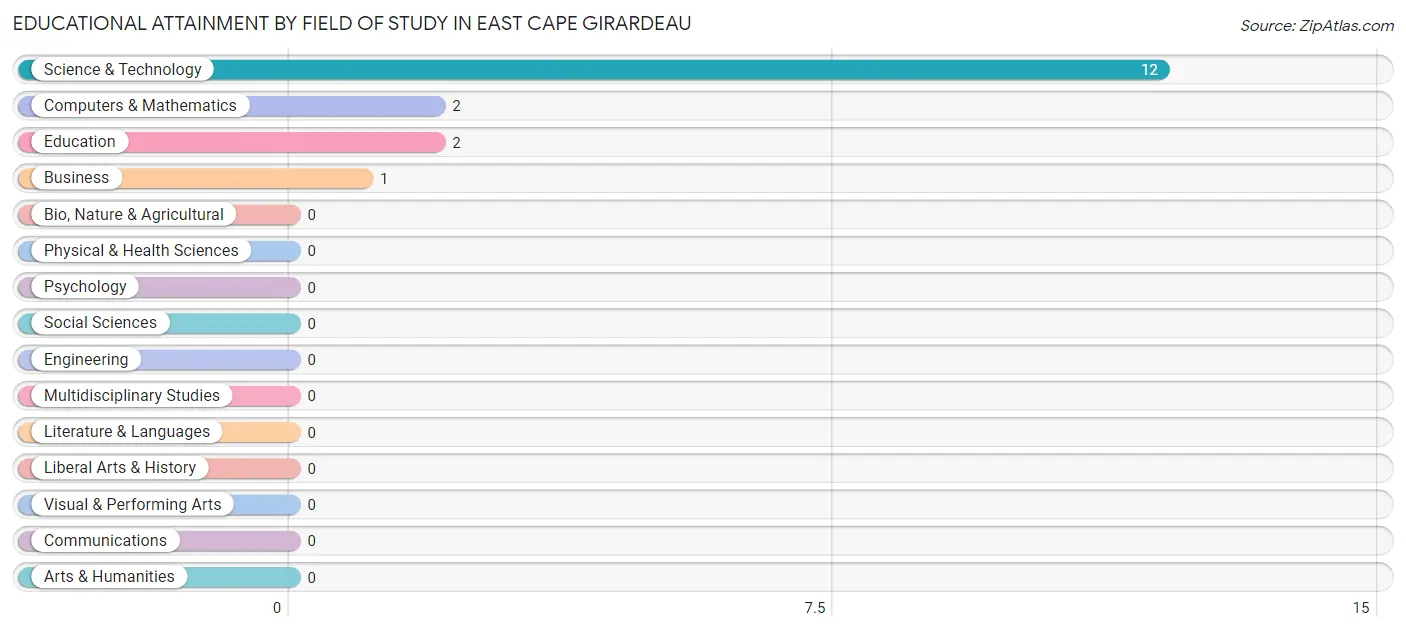
| Field of Study | # Graduates | % Graduates |
| Computers & Mathematics | 2 | 11.8% |
| Bio, Nature & Agricultural | 0 | 0.0% |
| Physical & Health Sciences | 0 | 0.0% |
| Psychology | 0 | 0.0% |
| Social Sciences | 0 | 0.0% |
| Engineering | 0 | 0.0% |
| Multidisciplinary Studies | 0 | 0.0% |
| Science & Technology | 12 | 70.6% |
| Business | 1 | 5.9% |
| Education | 2 | 11.8% |
| Literature & Languages | 0 | 0.0% |
| Liberal Arts & History | 0 | 0.0% |
| Visual & Performing Arts | 0 | 0.0% |
| Communications | 0 | 0.0% |
| Arts & Humanities | 0 | 0.0% |
| Total | 17 | 100.0% |
Transportation & Commute in East Cape Girardeau
Vehicle Availability by Sex in East Cape Girardeau
The most prevalent vehicle ownership categories in East Cape Girardeau are males with 2 vehicles (34, accounting for 49.3%) and females with 2 vehicles (10, making up 85.0%).
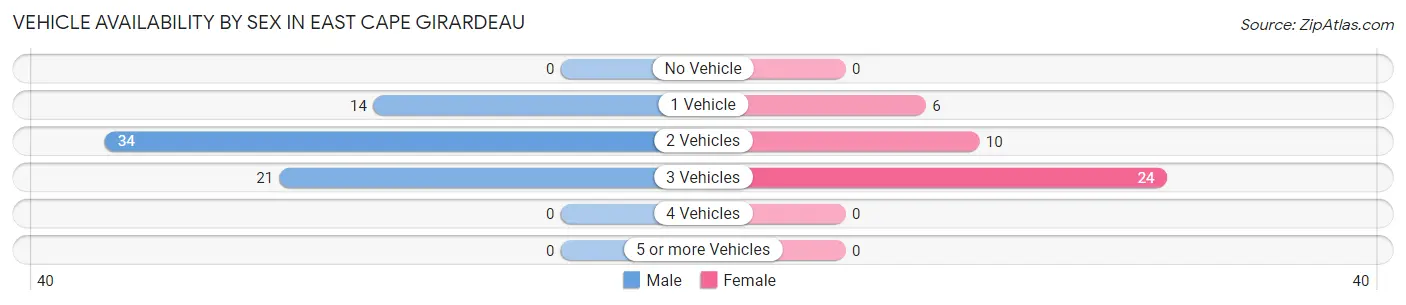
| Vehicles Available | Male | Female |
| No Vehicle | 0 (0.0%) | 0 (0.0%) |
| 1 Vehicle | 14 (20.3%) | 6 (15.0%) |
| 2 Vehicles | 34 (49.3%) | 10 (25.0%) |
| 3 Vehicles | 21 (30.4%) | 24 (60.0%) |
| 4 Vehicles | 0 (0.0%) | 0 (0.0%) |
| 5 or more Vehicles | 0 (0.0%) | 0 (0.0%) |
| Total | 69 (100.0%) | 40 (100.0%) |
Commute Time in East Cape Girardeau
The most frequently occuring commute durations in East Cape Girardeau are 30 to 34 minutes (44 commuters, 40.7%), 20 to 24 minutes (24 commuters, 22.2%), and 15 to 19 minutes (15 commuters, 13.9%).
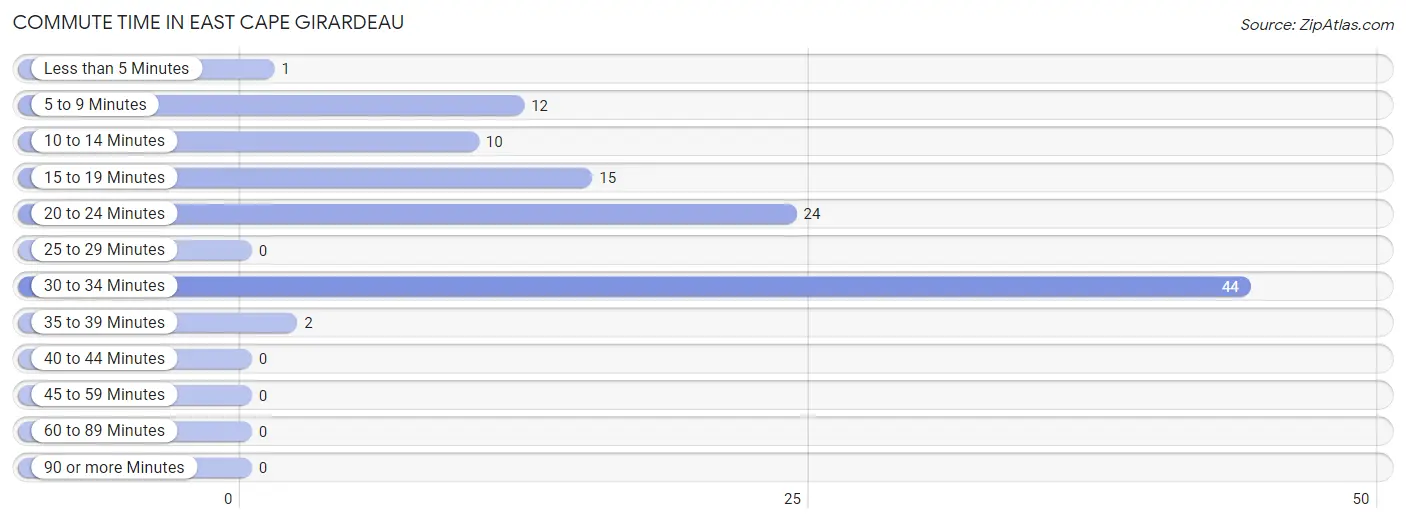
| Commute Time | # Commuters | % Commuters |
| Less than 5 Minutes | 1 | 0.9% |
| 5 to 9 Minutes | 12 | 11.1% |
| 10 to 14 Minutes | 10 | 9.3% |
| 15 to 19 Minutes | 15 | 13.9% |
| 20 to 24 Minutes | 24 | 22.2% |
| 25 to 29 Minutes | 0 | 0.0% |
| 30 to 34 Minutes | 44 | 40.7% |
| 35 to 39 Minutes | 2 | 1.8% |
| 40 to 44 Minutes | 0 | 0.0% |
| 45 to 59 Minutes | 0 | 0.0% |
| 60 to 89 Minutes | 0 | 0.0% |
| 90 or more Minutes | 0 | 0.0% |
Commute Time by Sex in East Cape Girardeau
The most common commute times in East Cape Girardeau are 30 to 34 minutes (26 commuters, 37.7%) for males and 30 to 34 minutes (18 commuters, 46.2%) for females.
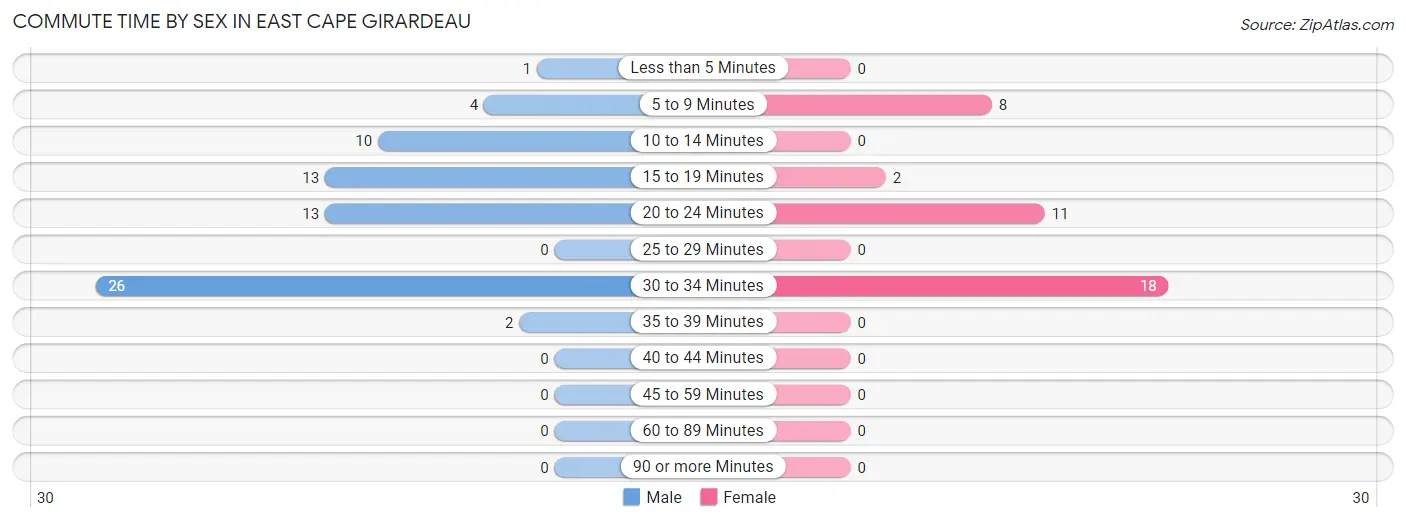
| Commute Time | Male | Female |
| Less than 5 Minutes | 1 (1.5%) | 0 (0.0%) |
| 5 to 9 Minutes | 4 (5.8%) | 8 (20.5%) |
| 10 to 14 Minutes | 10 (14.5%) | 0 (0.0%) |
| 15 to 19 Minutes | 13 (18.8%) | 2 (5.1%) |
| 20 to 24 Minutes | 13 (18.8%) | 11 (28.2%) |
| 25 to 29 Minutes | 0 (0.0%) | 0 (0.0%) |
| 30 to 34 Minutes | 26 (37.7%) | 18 (46.2%) |
| 35 to 39 Minutes | 2 (2.9%) | 0 (0.0%) |
| 40 to 44 Minutes | 0 (0.0%) | 0 (0.0%) |
| 45 to 59 Minutes | 0 (0.0%) | 0 (0.0%) |
| 60 to 89 Minutes | 0 (0.0%) | 0 (0.0%) |
| 90 or more Minutes | 0 (0.0%) | 0 (0.0%) |
Time of Departure to Work by Sex in East Cape Girardeau
The most frequent times of departure to work in East Cape Girardeau are 8:00 AM to 8:29 AM (25, 36.2%) for males and 8:00 AM to 8:29 AM (12, 30.8%) for females.
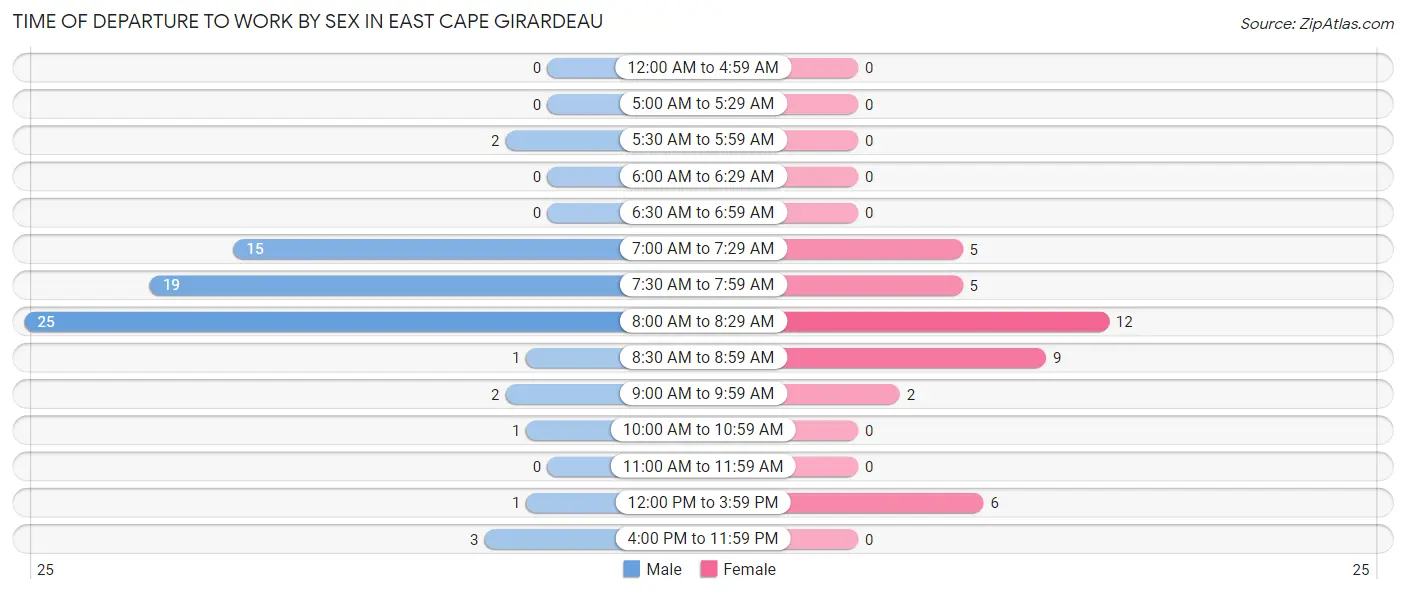
| Time of Departure | Male | Female |
| 12:00 AM to 4:59 AM | 0 (0.0%) | 0 (0.0%) |
| 5:00 AM to 5:29 AM | 0 (0.0%) | 0 (0.0%) |
| 5:30 AM to 5:59 AM | 2 (2.9%) | 0 (0.0%) |
| 6:00 AM to 6:29 AM | 0 (0.0%) | 0 (0.0%) |
| 6:30 AM to 6:59 AM | 0 (0.0%) | 0 (0.0%) |
| 7:00 AM to 7:29 AM | 15 (21.7%) | 5 (12.8%) |
| 7:30 AM to 7:59 AM | 19 (27.5%) | 5 (12.8%) |
| 8:00 AM to 8:29 AM | 25 (36.2%) | 12 (30.8%) |
| 8:30 AM to 8:59 AM | 1 (1.5%) | 9 (23.1%) |
| 9:00 AM to 9:59 AM | 2 (2.9%) | 2 (5.1%) |
| 10:00 AM to 10:59 AM | 1 (1.5%) | 0 (0.0%) |
| 11:00 AM to 11:59 AM | 0 (0.0%) | 0 (0.0%) |
| 12:00 PM to 3:59 PM | 1 (1.5%) | 6 (15.4%) |
| 4:00 PM to 11:59 PM | 3 (4.3%) | 0 (0.0%) |
| Total | 69 (100.0%) | 39 (100.0%) |
Housing Occupancy in East Cape Girardeau
Occupancy by Ownership in East Cape Girardeau
Of the total 88 dwellings in East Cape Girardeau, owner-occupied units account for 55 (62.5%), while renter-occupied units make up 33 (37.5%).
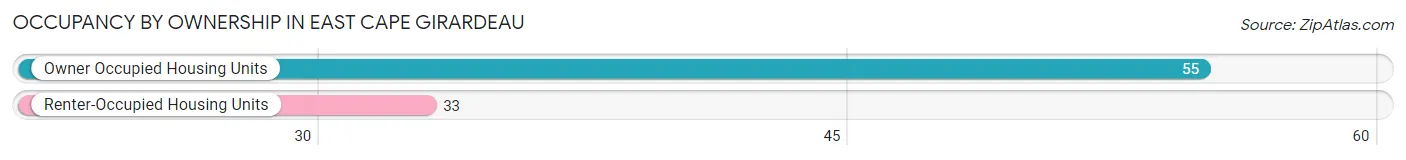
| Occupancy | # Housing Units | % Housing Units |
| Owner Occupied Housing Units | 55 | 62.5% |
| Renter-Occupied Housing Units | 33 | 37.5% |
| Total Occupied Housing Units | 88 | 100.0% |
Occupancy by Household Size in East Cape Girardeau
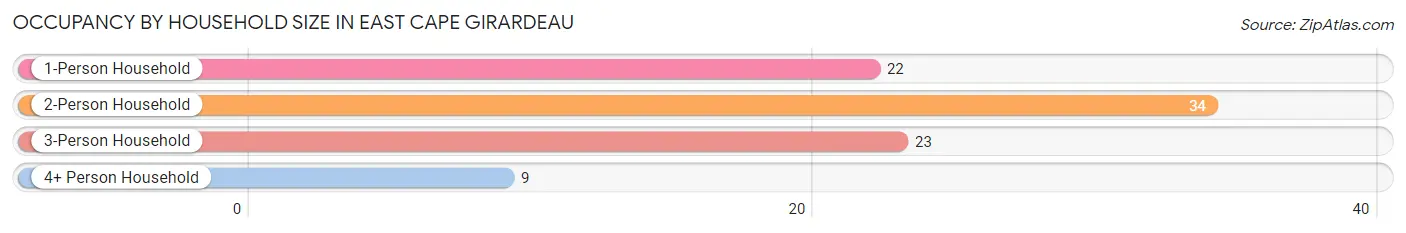
| Household Size | # Housing Units | % Housing Units |
| 1-Person Household | 22 | 25.0% |
| 2-Person Household | 34 | 38.6% |
| 3-Person Household | 23 | 26.1% |
| 4+ Person Household | 9 | 10.2% |
| Total Housing Units | 88 | 100.0% |
Occupancy by Ownership by Household Size in East Cape Girardeau
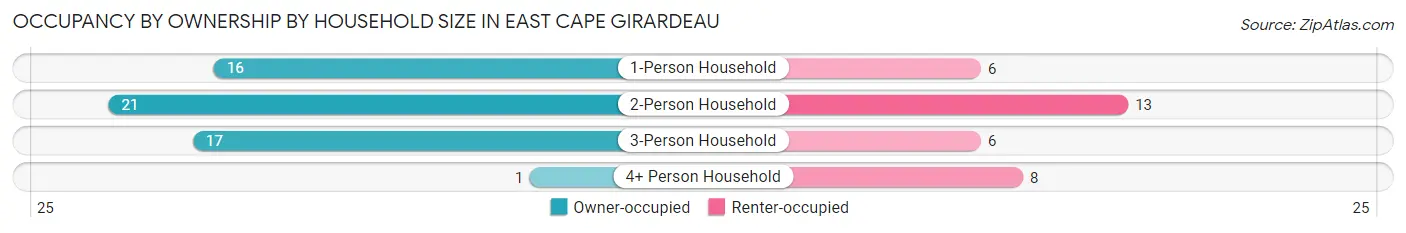
| Household Size | Owner-occupied | Renter-occupied |
| 1-Person Household | 16 (72.7%) | 6 (27.3%) |
| 2-Person Household | 21 (61.8%) | 13 (38.2%) |
| 3-Person Household | 17 (73.9%) | 6 (26.1%) |
| 4+ Person Household | 1 (11.1%) | 8 (88.9%) |
| Total Housing Units | 55 (62.5%) | 33 (37.5%) |
Occupancy by Educational Attainment in East Cape Girardeau
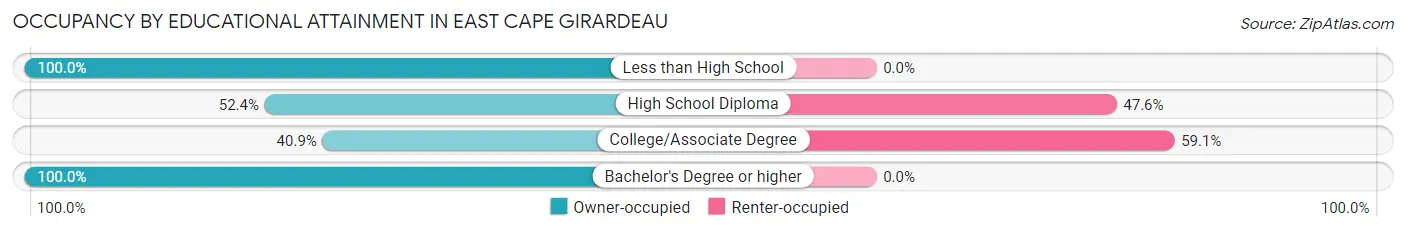
| Household Size | Owner-occupied | Renter-occupied |
| Less than High School | 9 (100.0%) | 0 (0.0%) |
| High School Diploma | 22 (52.4%) | 20 (47.6%) |
| College/Associate Degree | 9 (40.9%) | 13 (59.1%) |
| Bachelor's Degree or higher | 15 (100.0%) | 0 (0.0%) |
Occupancy by Age of Householder in East Cape Girardeau
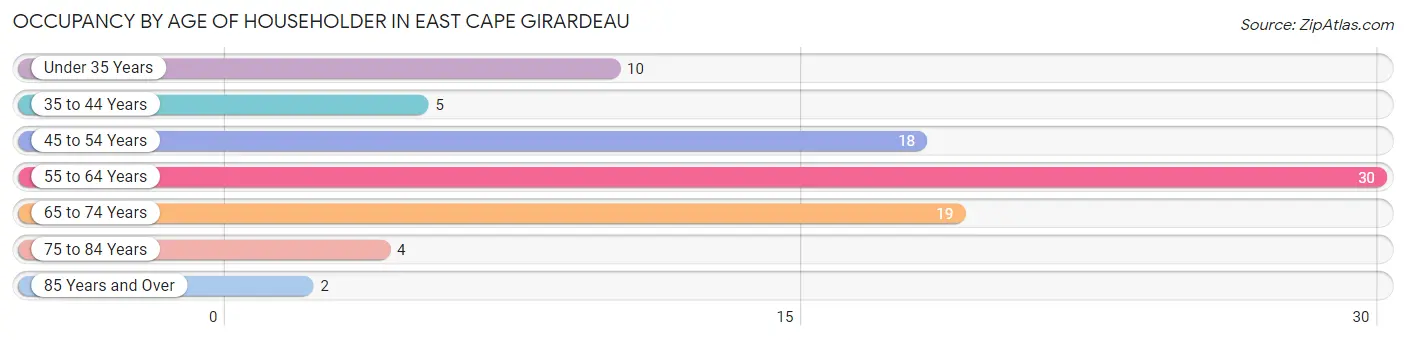
| Age Bracket | # Households | % Households |
| Under 35 Years | 10 | 11.4% |
| 35 to 44 Years | 5 | 5.7% |
| 45 to 54 Years | 18 | 20.4% |
| 55 to 64 Years | 30 | 34.1% |
| 65 to 74 Years | 19 | 21.6% |
| 75 to 84 Years | 4 | 4.5% |
| 85 Years and Over | 2 | 2.3% |
| Total | 88 | 100.0% |
Housing Finances in East Cape Girardeau
Median Income by Occupancy in East Cape Girardeau
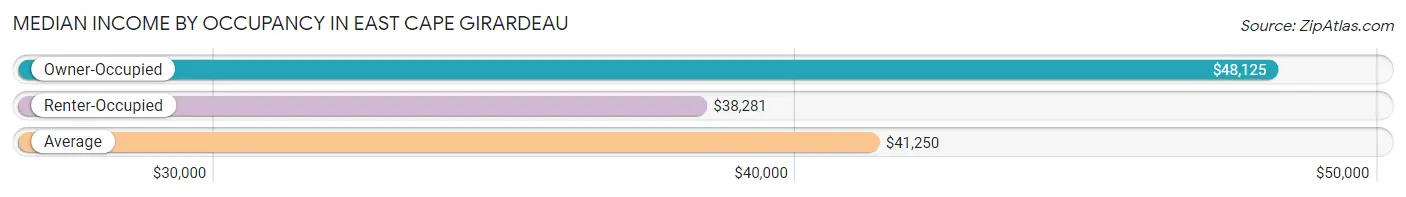
| Occupancy Type | # Households | Median Income |
| Owner-Occupied | 55 (62.5%) | $48,125 |
| Renter-Occupied | 33 (37.5%) | $38,281 |
| Average | 88 (100.0%) | $41,250 |
Occupancy by Householder Income Bracket in East Cape Girardeau
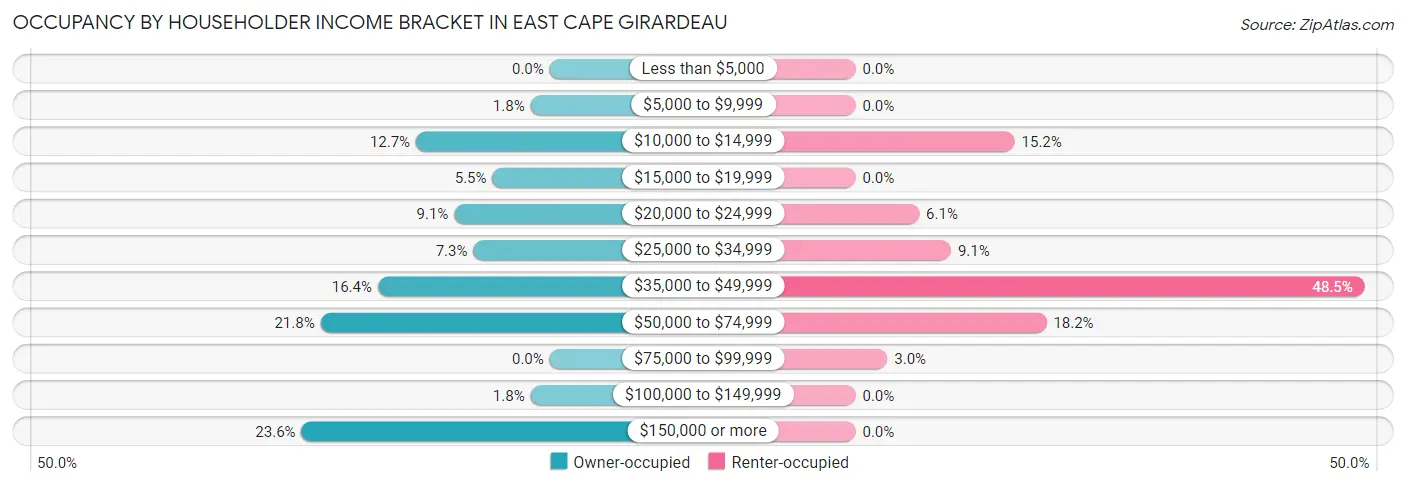
| Income Bracket | Owner-occupied | Renter-occupied |
| Less than $5,000 | 0 (0.0%) | 0 (0.0%) |
| $5,000 to $9,999 | 1 (1.8%) | 0 (0.0%) |
| $10,000 to $14,999 | 7 (12.7%) | 5 (15.1%) |
| $15,000 to $19,999 | 3 (5.4%) | 0 (0.0%) |
| $20,000 to $24,999 | 5 (9.1%) | 2 (6.1%) |
| $25,000 to $34,999 | 4 (7.3%) | 3 (9.1%) |
| $35,000 to $49,999 | 9 (16.4%) | 16 (48.5%) |
| $50,000 to $74,999 | 12 (21.8%) | 6 (18.2%) |
| $75,000 to $99,999 | 0 (0.0%) | 1 (3.0%) |
| $100,000 to $149,999 | 1 (1.8%) | 0 (0.0%) |
| $150,000 or more | 13 (23.6%) | 0 (0.0%) |
| Total | 55 (100.0%) | 33 (100.0%) |
Monthly Housing Cost Tiers in East Cape Girardeau
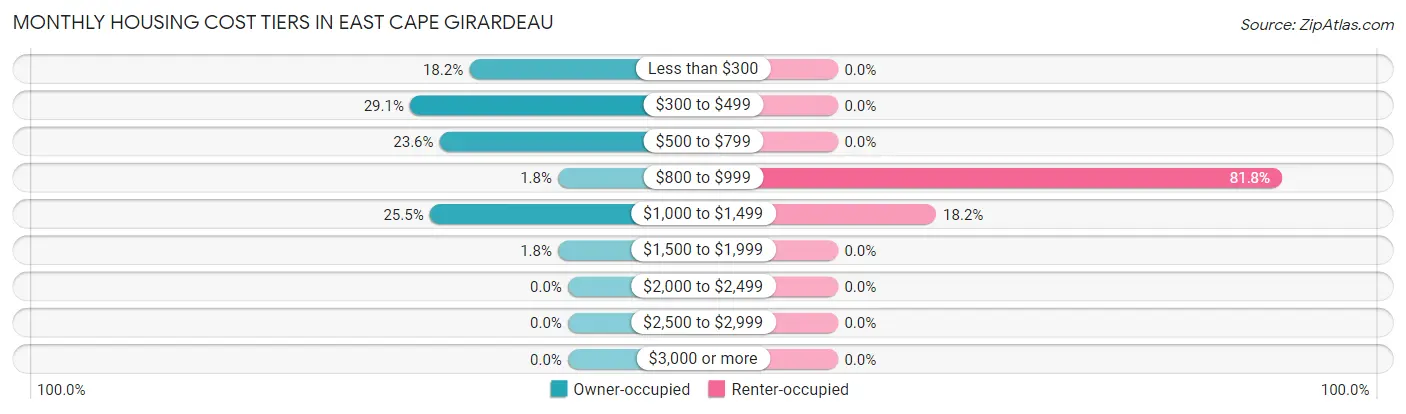
| Monthly Cost | Owner-occupied | Renter-occupied |
| Less than $300 | 10 (18.2%) | 0 (0.0%) |
| $300 to $499 | 16 (29.1%) | 0 (0.0%) |
| $500 to $799 | 13 (23.6%) | 0 (0.0%) |
| $800 to $999 | 1 (1.8%) | 27 (81.8%) |
| $1,000 to $1,499 | 14 (25.5%) | 6 (18.2%) |
| $1,500 to $1,999 | 1 (1.8%) | 0 (0.0%) |
| $2,000 to $2,499 | 0 (0.0%) | 0 (0.0%) |
| $2,500 to $2,999 | 0 (0.0%) | 0 (0.0%) |
| $3,000 or more | 0 (0.0%) | 0 (0.0%) |
| Total | 55 (100.0%) | 33 (100.0%) |
Physical Housing Characteristics in East Cape Girardeau
Housing Structures in East Cape Girardeau
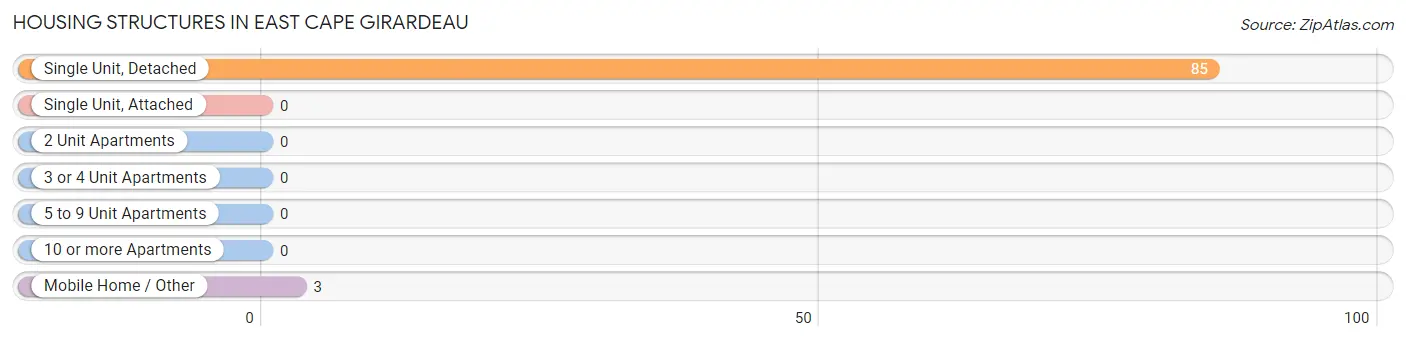
| Structure Type | # Housing Units | % Housing Units |
| Single Unit, Detached | 85 | 96.6% |
| Single Unit, Attached | 0 | 0.0% |
| 2 Unit Apartments | 0 | 0.0% |
| 3 or 4 Unit Apartments | 0 | 0.0% |
| 5 to 9 Unit Apartments | 0 | 0.0% |
| 10 or more Apartments | 0 | 0.0% |
| Mobile Home / Other | 3 | 3.4% |
| Total | 88 | 100.0% |
Housing Structures by Occupancy in East Cape Girardeau
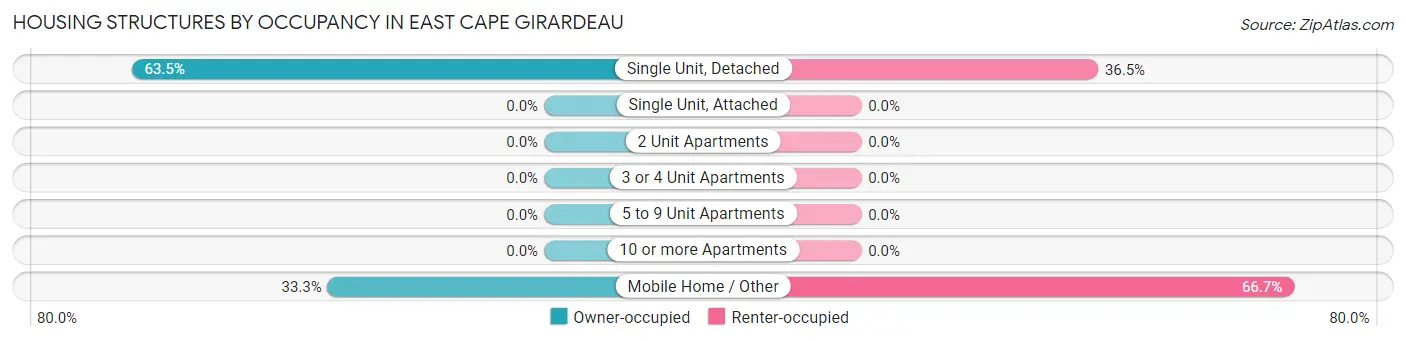
| Structure Type | Owner-occupied | Renter-occupied |
| Single Unit, Detached | 54 (63.5%) | 31 (36.5%) |
| Single Unit, Attached | 0 (0.0%) | 0 (0.0%) |
| 2 Unit Apartments | 0 (0.0%) | 0 (0.0%) |
| 3 or 4 Unit Apartments | 0 (0.0%) | 0 (0.0%) |
| 5 to 9 Unit Apartments | 0 (0.0%) | 0 (0.0%) |
| 10 or more Apartments | 0 (0.0%) | 0 (0.0%) |
| Mobile Home / Other | 1 (33.3%) | 2 (66.7%) |
| Total | 55 (62.5%) | 33 (37.5%) |
Housing Structures by Number of Rooms in East Cape Girardeau
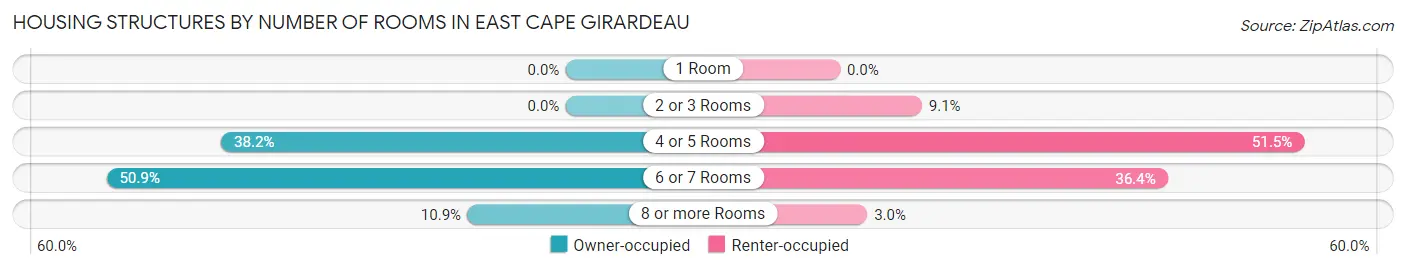
| Number of Rooms | Owner-occupied | Renter-occupied |
| 1 Room | 0 (0.0%) | 0 (0.0%) |
| 2 or 3 Rooms | 0 (0.0%) | 3 (9.1%) |
| 4 or 5 Rooms | 21 (38.2%) | 17 (51.5%) |
| 6 or 7 Rooms | 28 (50.9%) | 12 (36.4%) |
| 8 or more Rooms | 6 (10.9%) | 1 (3.0%) |
| Total | 55 (100.0%) | 33 (100.0%) |
Housing Structure by Heating Type in East Cape Girardeau
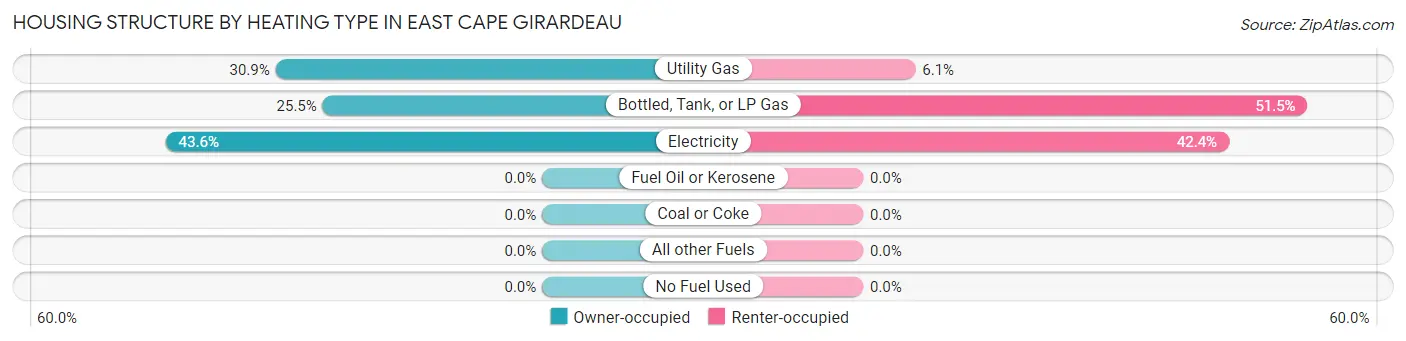
| Heating Type | Owner-occupied | Renter-occupied |
| Utility Gas | 17 (30.9%) | 2 (6.1%) |
| Bottled, Tank, or LP Gas | 14 (25.5%) | 17 (51.5%) |
| Electricity | 24 (43.6%) | 14 (42.4%) |
| Fuel Oil or Kerosene | 0 (0.0%) | 0 (0.0%) |
| Coal or Coke | 0 (0.0%) | 0 (0.0%) |
| All other Fuels | 0 (0.0%) | 0 (0.0%) |
| No Fuel Used | 0 (0.0%) | 0 (0.0%) |
| Total | 55 (100.0%) | 33 (100.0%) |
Household Vehicle Usage in East Cape Girardeau
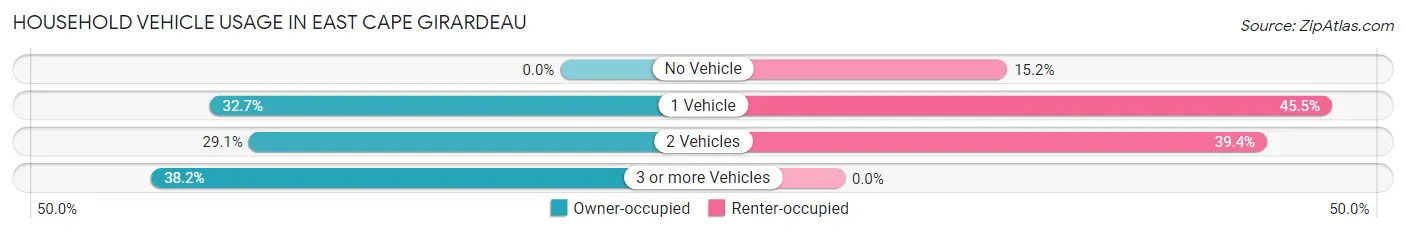
| Vehicles per Household | Owner-occupied | Renter-occupied |
| No Vehicle | 0 (0.0%) | 5 (15.1%) |
| 1 Vehicle | 18 (32.7%) | 15 (45.5%) |
| 2 Vehicles | 16 (29.1%) | 13 (39.4%) |
| 3 or more Vehicles | 21 (38.2%) | 0 (0.0%) |
| Total | 55 (100.0%) | 33 (100.0%) |
Real Estate & Mortgages in East Cape Girardeau
Real Estate and Mortgage Overview in East Cape Girardeau
| Characteristic | Without Mortgage | With Mortgage |
| Housing Units | 37 | 18 |
| Median Property Value | $47,000 | $66,200 |
| Median Household Income | $42,917 | $12 |
| Monthly Housing Costs | $396 | $0 |
| Real Estate Taxes | $817 | $1 |
Property Value by Mortgage Status in East Cape Girardeau
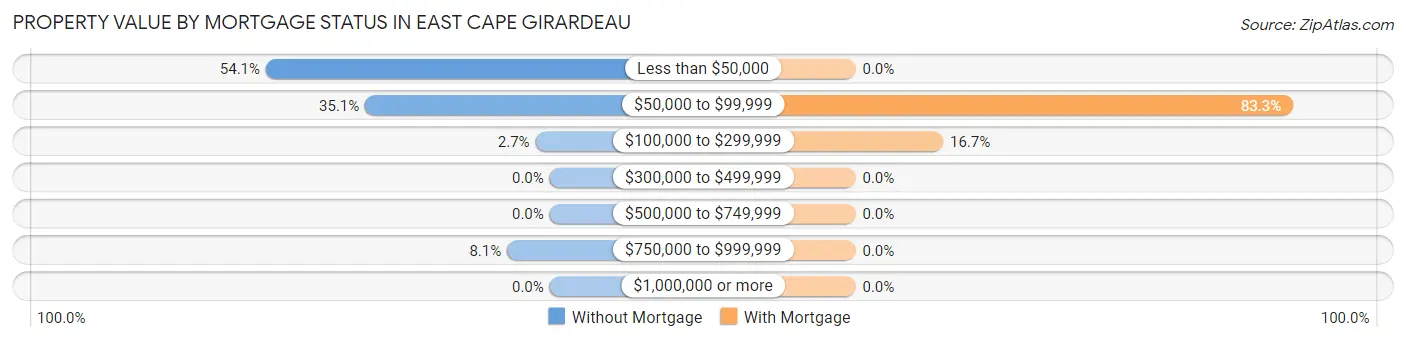
| Property Value | Without Mortgage | With Mortgage |
| Less than $50,000 | 20 (54.0%) | 0 (0.0%) |
| $50,000 to $99,999 | 13 (35.1%) | 15 (83.3%) |
| $100,000 to $299,999 | 1 (2.7%) | 3 (16.7%) |
| $300,000 to $499,999 | 0 (0.0%) | 0 (0.0%) |
| $500,000 to $749,999 | 0 (0.0%) | 0 (0.0%) |
| $750,000 to $999,999 | 3 (8.1%) | 0 (0.0%) |
| $1,000,000 or more | 0 (0.0%) | 0 (0.0%) |
| Total | 37 (100.0%) | 18 (100.0%) |
Household Income by Mortgage Status in East Cape Girardeau
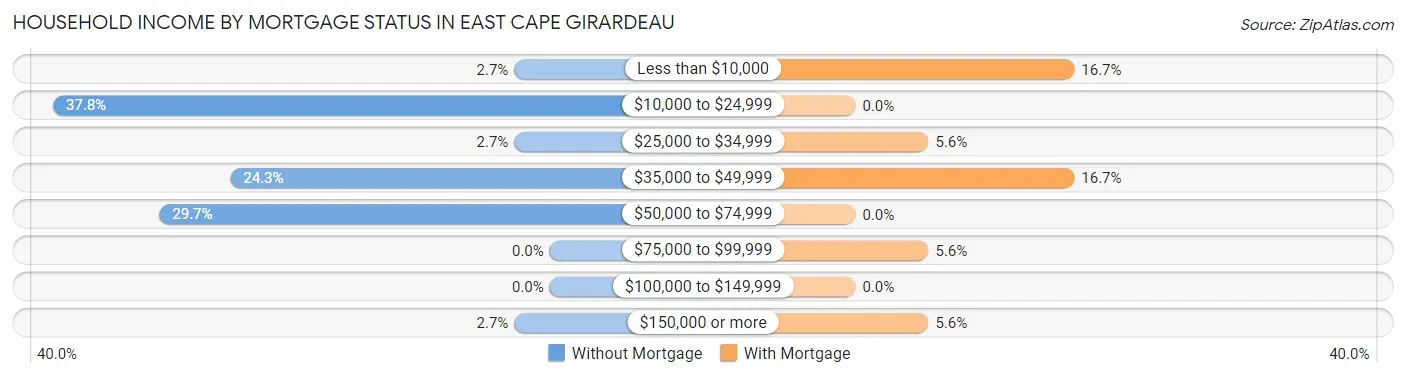
| Household Income | Without Mortgage | With Mortgage |
| Less than $10,000 | 1 (2.7%) | 3 (16.7%) |
| $10,000 to $24,999 | 14 (37.8%) | 0 (0.0%) |
| $25,000 to $34,999 | 1 (2.7%) | 1 (5.6%) |
| $35,000 to $49,999 | 9 (24.3%) | 3 (16.7%) |
| $50,000 to $74,999 | 11 (29.7%) | 0 (0.0%) |
| $75,000 to $99,999 | 0 (0.0%) | 1 (5.6%) |
| $100,000 to $149,999 | 0 (0.0%) | 0 (0.0%) |
| $150,000 or more | 1 (2.7%) | 1 (5.6%) |
| Total | 37 (100.0%) | 18 (100.0%) |
Property Value to Household Income Ratio in East Cape Girardeau
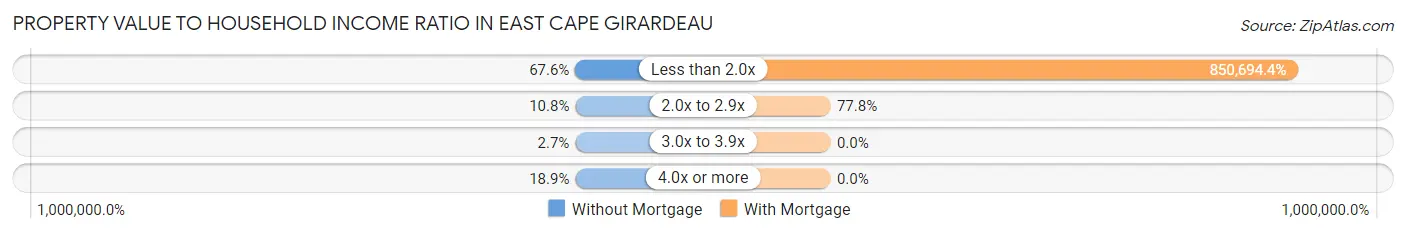
| Value-to-Income Ratio | Without Mortgage | With Mortgage |
| Less than 2.0x | 25 (67.6%) | 153,125 (850,694.4%) |
| 2.0x to 2.9x | 4 (10.8%) | 14 (77.8%) |
| 3.0x to 3.9x | 1 (2.7%) | 0 (0.0%) |
| 4.0x or more | 7 (18.9%) | 0 (0.0%) |
| Total | 37 (100.0%) | 18 (100.0%) |
Real Estate Taxes by Mortgage Status in East Cape Girardeau
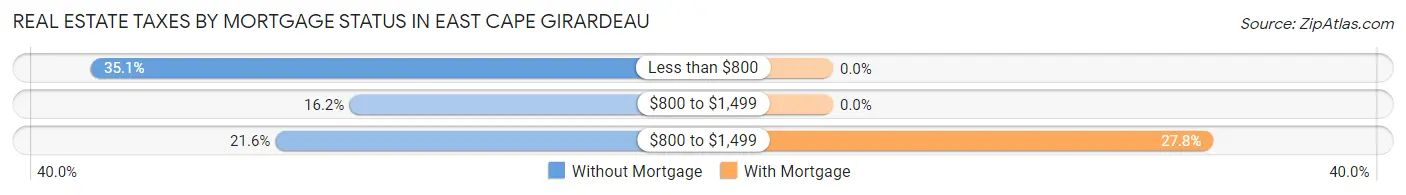
| Property Taxes | Without Mortgage | With Mortgage |
| Less than $800 | 13 (35.1%) | 0 (0.0%) |
| $800 to $1,499 | 6 (16.2%) | 0 (0.0%) |
| $800 to $1,499 | 8 (21.6%) | 5 (27.8%) |
| Total | 37 (100.0%) | 18 (100.0%) |
Health & Disability in East Cape Girardeau
Health Insurance Coverage by Age in East Cape Girardeau
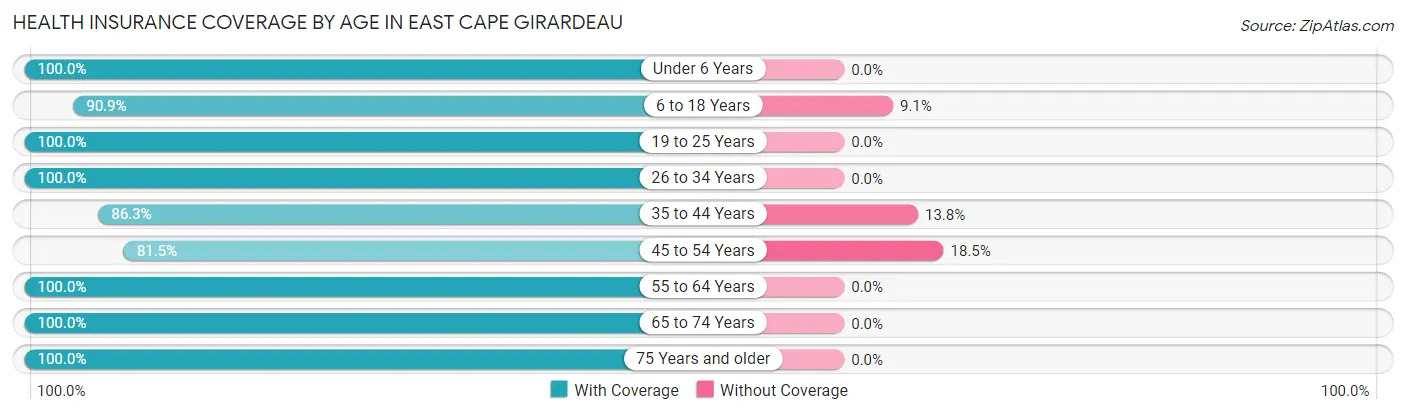
| Age Bracket | With Coverage | Without Coverage |
| Under 6 Years | 27 (100.0%) | 0 (0.0%) |
| 6 to 18 Years | 70 (90.9%) | 7 (9.1%) |
| 19 to 25 Years | 21 (100.0%) | 0 (0.0%) |
| 26 to 34 Years | 19 (100.0%) | 0 (0.0%) |
| 35 to 44 Years | 69 (86.3%) | 11 (13.8%) |
| 45 to 54 Years | 44 (81.5%) | 10 (18.5%) |
| 55 to 64 Years | 33 (100.0%) | 0 (0.0%) |
| 65 to 74 Years | 19 (100.0%) | 0 (0.0%) |
| 75 Years and older | 13 (100.0%) | 0 (0.0%) |
| Total | 315 (91.8%) | 28 (8.2%) |
Health Insurance Coverage by Citizenship Status in East Cape Girardeau
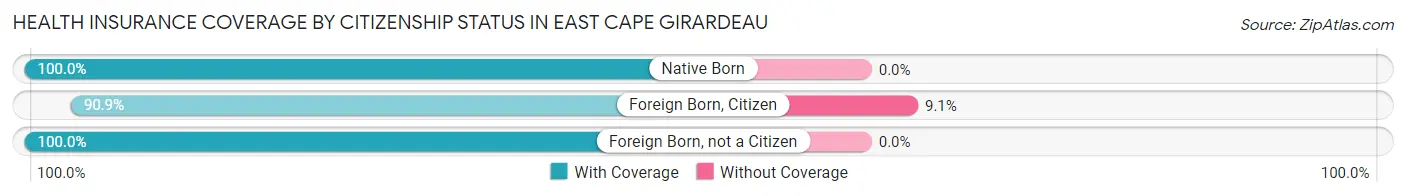
| Citizenship Status | With Coverage | Without Coverage |
| Native Born | 27 (100.0%) | 0 (0.0%) |
| Foreign Born, Citizen | 70 (90.9%) | 7 (9.1%) |
| Foreign Born, not a Citizen | 21 (100.0%) | 0 (0.0%) |
Health Insurance Coverage by Household Income in East Cape Girardeau
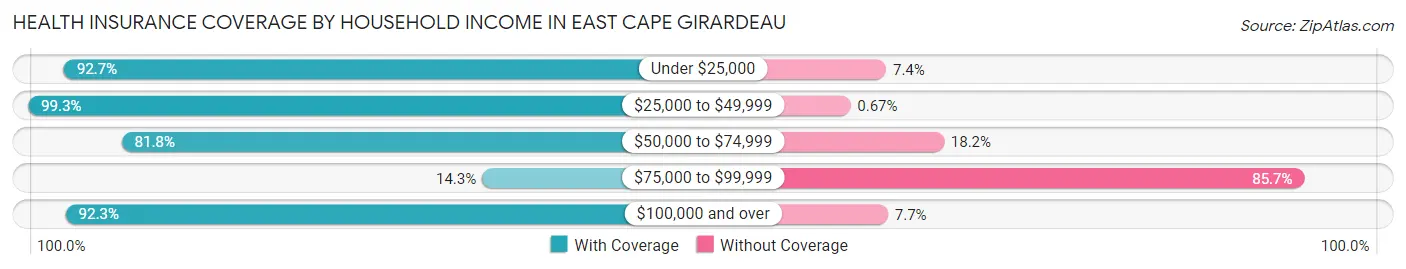
| Household Income | With Coverage | Without Coverage |
| Under $25,000 | 63 (92.6%) | 5 (7.3%) |
| $25,000 to $49,999 | 149 (99.3%) | 1 (0.7%) |
| $50,000 to $74,999 | 54 (81.8%) | 12 (18.2%) |
| $75,000 to $99,999 | 1 (14.3%) | 6 (85.7%) |
| $100,000 and over | 48 (92.3%) | 4 (7.7%) |
Public vs Private Health Insurance Coverage by Age in East Cape Girardeau
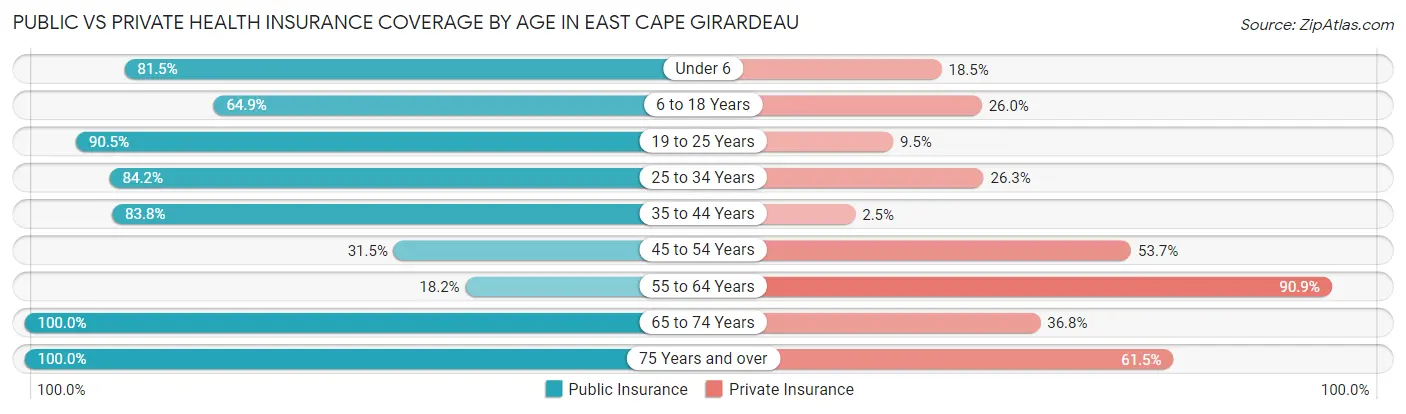
| Age Bracket | Public Insurance | Private Insurance |
| Under 6 | 22 (81.5%) | 5 (18.5%) |
| 6 to 18 Years | 50 (64.9%) | 20 (26.0%) |
| 19 to 25 Years | 19 (90.5%) | 2 (9.5%) |
| 25 to 34 Years | 16 (84.2%) | 5 (26.3%) |
| 35 to 44 Years | 67 (83.8%) | 2 (2.5%) |
| 45 to 54 Years | 17 (31.5%) | 29 (53.7%) |
| 55 to 64 Years | 6 (18.2%) | 30 (90.9%) |
| 65 to 74 Years | 19 (100.0%) | 7 (36.8%) |
| 75 Years and over | 13 (100.0%) | 8 (61.5%) |
| Total | 229 (66.8%) | 108 (31.5%) |
Disability Status by Sex by Age in East Cape Girardeau
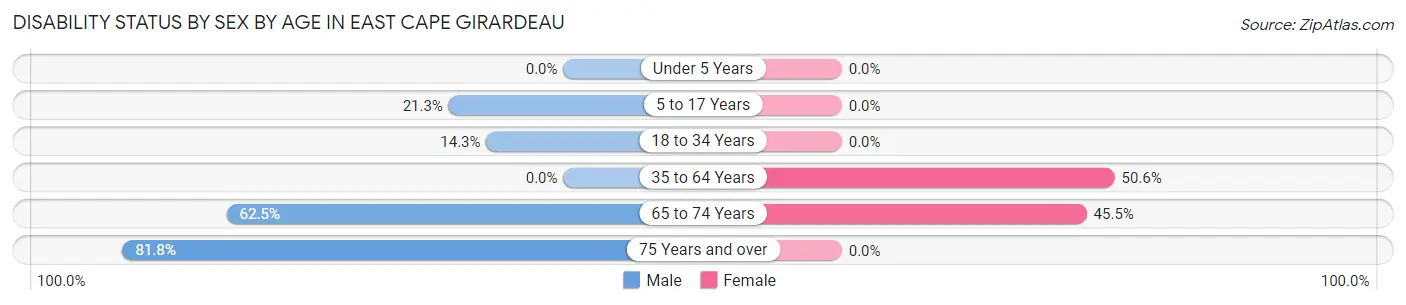
| Age Bracket | Male | Female |
| Under 5 Years | 0 (0.0%) | 0 (0.0%) |
| 5 to 17 Years | 10 (21.3%) | 0 (0.0%) |
| 18 to 34 Years | 2 (14.3%) | 0 (0.0%) |
| 35 to 64 Years | 0 (0.0%) | 40 (50.6%) |
| 65 to 74 Years | 5 (62.5%) | 5 (45.5%) |
| 75 Years and over | 9 (81.8%) | 0 (0.0%) |
Disability Class by Sex by Age in East Cape Girardeau
Disability Class: Hearing Difficulty
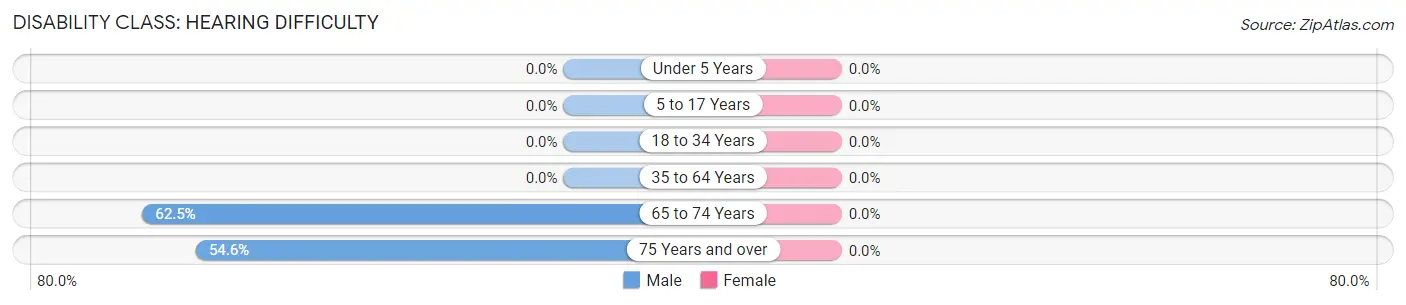
| Age Bracket | Male | Female |
| Under 5 Years | 0 (0.0%) | 0 (0.0%) |
| 5 to 17 Years | 0 (0.0%) | 0 (0.0%) |
| 18 to 34 Years | 0 (0.0%) | 0 (0.0%) |
| 35 to 64 Years | 0 (0.0%) | 0 (0.0%) |
| 65 to 74 Years | 5 (62.5%) | 0 (0.0%) |
| 75 Years and over | 6 (54.5%) | 0 (0.0%) |
Disability Class: Vision Difficulty
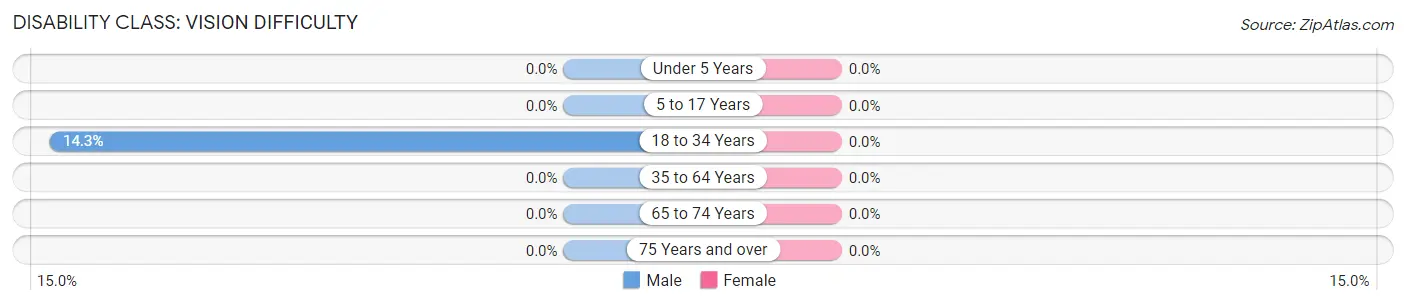
| Age Bracket | Male | Female |
| Under 5 Years | 0 (0.0%) | 0 (0.0%) |
| 5 to 17 Years | 0 (0.0%) | 0 (0.0%) |
| 18 to 34 Years | 2 (14.3%) | 0 (0.0%) |
| 35 to 64 Years | 0 (0.0%) | 0 (0.0%) |
| 65 to 74 Years | 0 (0.0%) | 0 (0.0%) |
| 75 Years and over | 0 (0.0%) | 0 (0.0%) |
Disability Class: Cognitive Difficulty
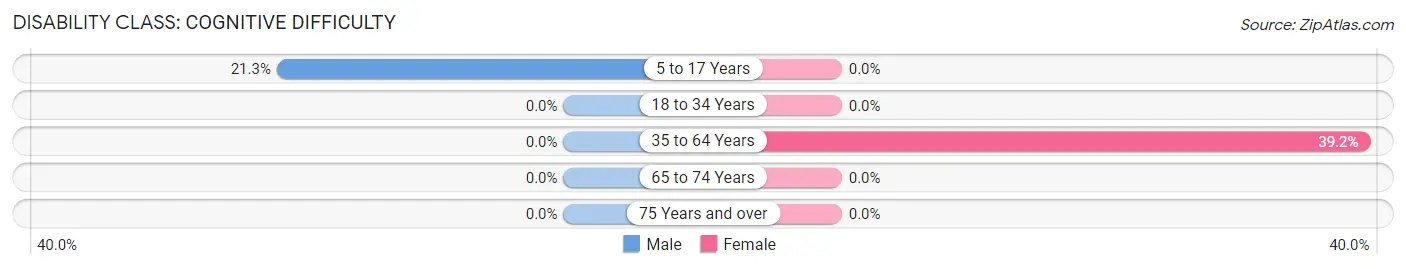
| Age Bracket | Male | Female |
| 5 to 17 Years | 10 (21.3%) | 0 (0.0%) |
| 18 to 34 Years | 0 (0.0%) | 0 (0.0%) |
| 35 to 64 Years | 0 (0.0%) | 31 (39.2%) |
| 65 to 74 Years | 0 (0.0%) | 0 (0.0%) |
| 75 Years and over | 0 (0.0%) | 0 (0.0%) |
Disability Class: Ambulatory Difficulty
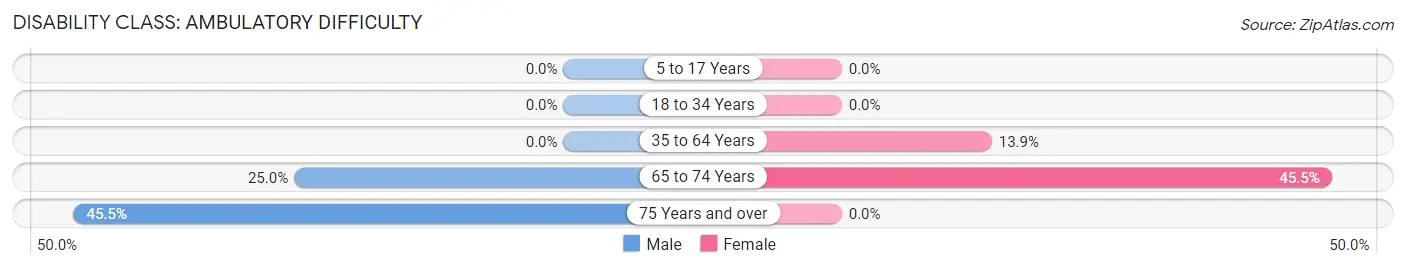
| Age Bracket | Male | Female |
| 5 to 17 Years | 0 (0.0%) | 0 (0.0%) |
| 18 to 34 Years | 0 (0.0%) | 0 (0.0%) |
| 35 to 64 Years | 0 (0.0%) | 11 (13.9%) |
| 65 to 74 Years | 2 (25.0%) | 5 (45.5%) |
| 75 Years and over | 5 (45.5%) | 0 (0.0%) |
Disability Class: Self-Care Difficulty
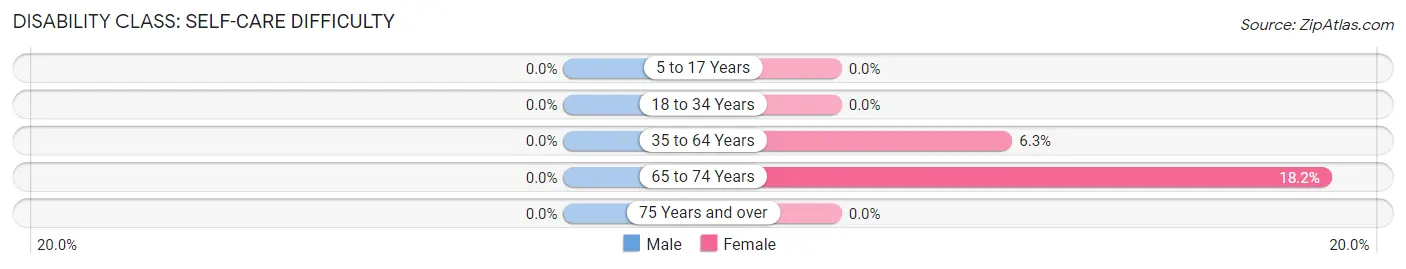
| Age Bracket | Male | Female |
| 5 to 17 Years | 0 (0.0%) | 0 (0.0%) |
| 18 to 34 Years | 0 (0.0%) | 0 (0.0%) |
| 35 to 64 Years | 0 (0.0%) | 5 (6.3%) |
| 65 to 74 Years | 0 (0.0%) | 2 (18.2%) |
| 75 Years and over | 0 (0.0%) | 0 (0.0%) |
Technology Access in East Cape Girardeau
Computing Device Access in East Cape Girardeau
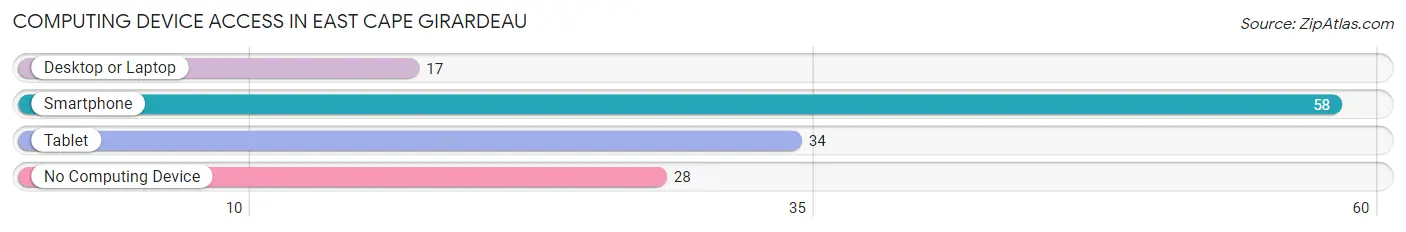
| Device Type | # Households | % Households |
| Desktop or Laptop | 17 | 19.3% |
| Smartphone | 58 | 65.9% |
| Tablet | 34 | 38.6% |
| No Computing Device | 28 | 31.8% |
| Total | 88 | 100.0% |
Internet Access in East Cape Girardeau
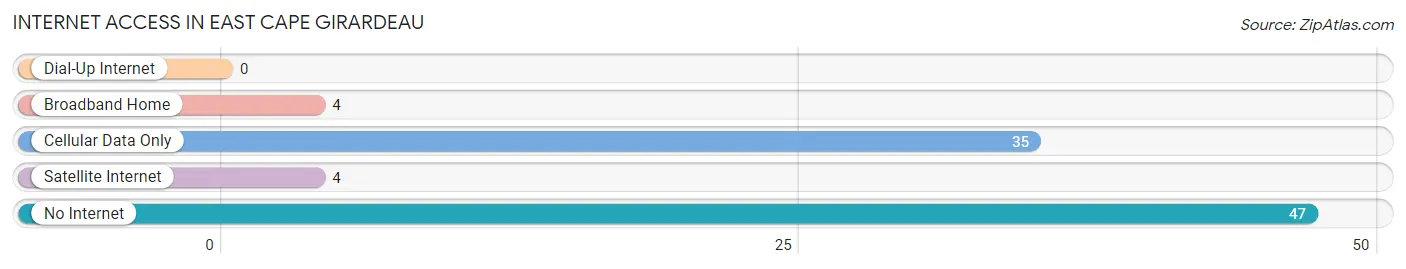
| Internet Type | # Households | % Households |
| Dial-Up Internet | 0 | 0.0% |
| Broadband Home | 4 | 4.5% |
| Cellular Data Only | 35 | 39.8% |
| Satellite Internet | 4 | 4.5% |
| No Internet | 47 | 53.4% |
| Total | 88 | 100.0% |
East Cape Girardeau Summary
East Cape Girardeau is a small village located in Jackson County, Illinois, United States. It is situated on the banks of the Mississippi River, just south of the city of Cape Girardeau, Missouri. The village has a population of approximately 500 people and is part of the Cape Girardeau–Jackson, MO–IL Metropolitan Statistical Area.
History
East Cape Girardeau was first settled in the early 1800s by French and German immigrants. The village was originally known as "L'Anse a la Graisse," which translates to "the fat bend," due to the abundance of wild game in the area. The village was later renamed East Cape Girardeau in 1837, after the nearby city of Cape Girardeau, Missouri.
In the late 1800s, East Cape Girardeau was a bustling river port town. The village was home to several steamboat landings, a sawmill, a grist mill, and a general store. The village was also home to a ferry service that connected East Cape Girardeau to the city of Cape Girardeau, Missouri.
In the early 1900s, the village began to decline as the river trade shifted to larger cities. The village was eventually bypassed by the railroad and the population began to dwindle. By the mid-1900s, the village had become a quiet, rural community.
Geography
East Cape Girardeau is located in Jackson County, Illinois, on the banks of the Mississippi River. The village is situated just south of the city of Cape Girardeau, Missouri. The village is located at an elevation of approximately 400 feet above sea level.
The village is surrounded by rolling hills and farmland. The nearby Mississippi River provides a variety of recreational activities, including fishing, boating, and swimming.
Economy
The economy of East Cape Girardeau is largely based on agriculture and tourism. The village is home to several small businesses, including a general store, a restaurant, and a bed and breakfast. The village also has a small marina that provides boat rentals and fishing supplies.
The village is also home to several small farms that produce a variety of crops, including corn, soybeans, and wheat. The nearby Mississippi River provides a variety of recreational activities, including fishing, boating, and swimming.
Demographics
As of the 2010 census, the population of East Cape Girardeau was 498. The racial makeup of the village was 97.2% White, 0.2% African American, 0.2% Native American, 0.2% Asian, 0.2% from other races, and 1.8% from two or more races. Hispanic or Latino of any race were 0.8% of the population.
The median household income in East Cape Girardeau was $37,500, and the median family income was $45,000. The per capita income for the village was $17,000. About 11.2% of families and 14.2% of the population were below the poverty line, including 18.2% of those under age 18 and 8.2% of those age 65 or over.
Common Questions
What is Per Capita Income in East Cape Girardeau?
Per Capita income in East Cape Girardeau is $15,940.
What is the Median Family Income in East Cape Girardeau?
Median Family Income in East Cape Girardeau is $53,750.
What is the Median Household income in East Cape Girardeau?
Median Household Income in East Cape Girardeau is $41,250.
What is Inequality or Gini Index in East Cape Girardeau?
Inequality or Gini Index in East Cape Girardeau is 0.41.
What is the Total Population of East Cape Girardeau?
Total Population of East Cape Girardeau is 343.
What is the Total Male Population of East Cape Girardeau?
Total Male Population of East Cape Girardeau is 179.
What is the Total Female Population of East Cape Girardeau?
Total Female Population of East Cape Girardeau is 164.
What is the Ratio of Males per 100 Females in East Cape Girardeau?
There are 109.15 Males per 100 Females in East Cape Girardeau.
What is the Ratio of Females per 100 Males in East Cape Girardeau?
There are 91.62 Females per 100 Males in East Cape Girardeau.
What is the Median Population Age in East Cape Girardeau?
Median Population Age in East Cape Girardeau is 38.2 Years.
What is the Average Family Size in East Cape Girardeau
Average Family Size in East Cape Girardeau is 4.3 People.
What is the Average Household Size in East Cape Girardeau
Average Household Size in East Cape Girardeau is 3.9 People.
How Large is the Labor Force in East Cape Girardeau?
There are 109 People in the Labor Forcein in East Cape Girardeau.
What is the Percentage of People in the Labor Force in East Cape Girardeau?
41.6% of People are in the Labor Force in East Cape Girardeau.