Macomb, IL Map & Demographics
Macomb Map
Macomb Overview
$26,489
PER CAPITA INCOME
$77,656
AVG FAMILY INCOME
$35,064
AVG HOUSEHOLD INCOME
36.9%
WAGE / INCOME GAP [ % ]
63.1¢/ $1
WAGE / INCOME GAP [ $ ]
$8,592
FAMILY INCOME DEFICIT
0.55
INEQUALITY / GINI INDEX
15,207
TOTAL POPULATION
7,071
MALE POPULATION
8,136
FEMALE POPULATION
86.91
MALES / 100 FEMALES
115.06
FEMALES / 100 MALES
27.4
MEDIAN AGE
3.1
AVG FAMILY SIZE
2.0
AVG HOUSEHOLD SIZE
7,637
LABOR FORCE [ PEOPLE ]
57.8%
PERCENT IN LABOR FORCE
11.3%
UNEMPLOYMENT RATE
Macomb Zip Codes
Macomb Area Codes
Income in Macomb
Income Overview in Macomb
Per Capita Income in Macomb is $26,489, while median incomes of families and households are $77,656 and $35,064 respectively.
| Characteristic | Number | Measure |
| Per Capita Income | 15,207 | $26,489 |
| Median Family Income | 2,413 | $77,656 |
| Mean Family Income | 2,413 | $97,564 |
| Median Household Income | 6,203 | $35,064 |
| Mean Household Income | 6,203 | $60,171 |
| Income Deficit | 2,413 | $8,592 |
| Wage / Income Gap (%) | 15,207 | 36.95% |
| Wage / Income Gap ($) | 15,207 | 63.05¢ per $1 |
| Gini / Inequality Index | 15,207 | 0.55 |
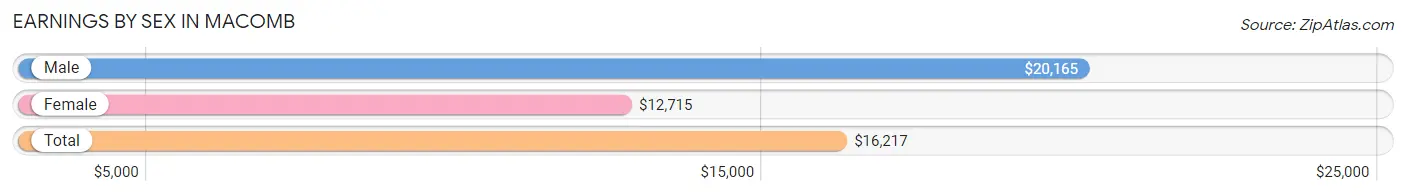
Earnings by Sex in Macomb
Average Earnings in Macomb are $16,217, $20,165 for men and $12,715 for women, a difference of 36.9%.
| Sex | Number | Average Earnings |
| Male | 4,404 (49.0%) | $20,165 |
| Female | 4,583 (51.0%) | $12,715 |
| Total | 8,987 (100.0%) | $16,217 |
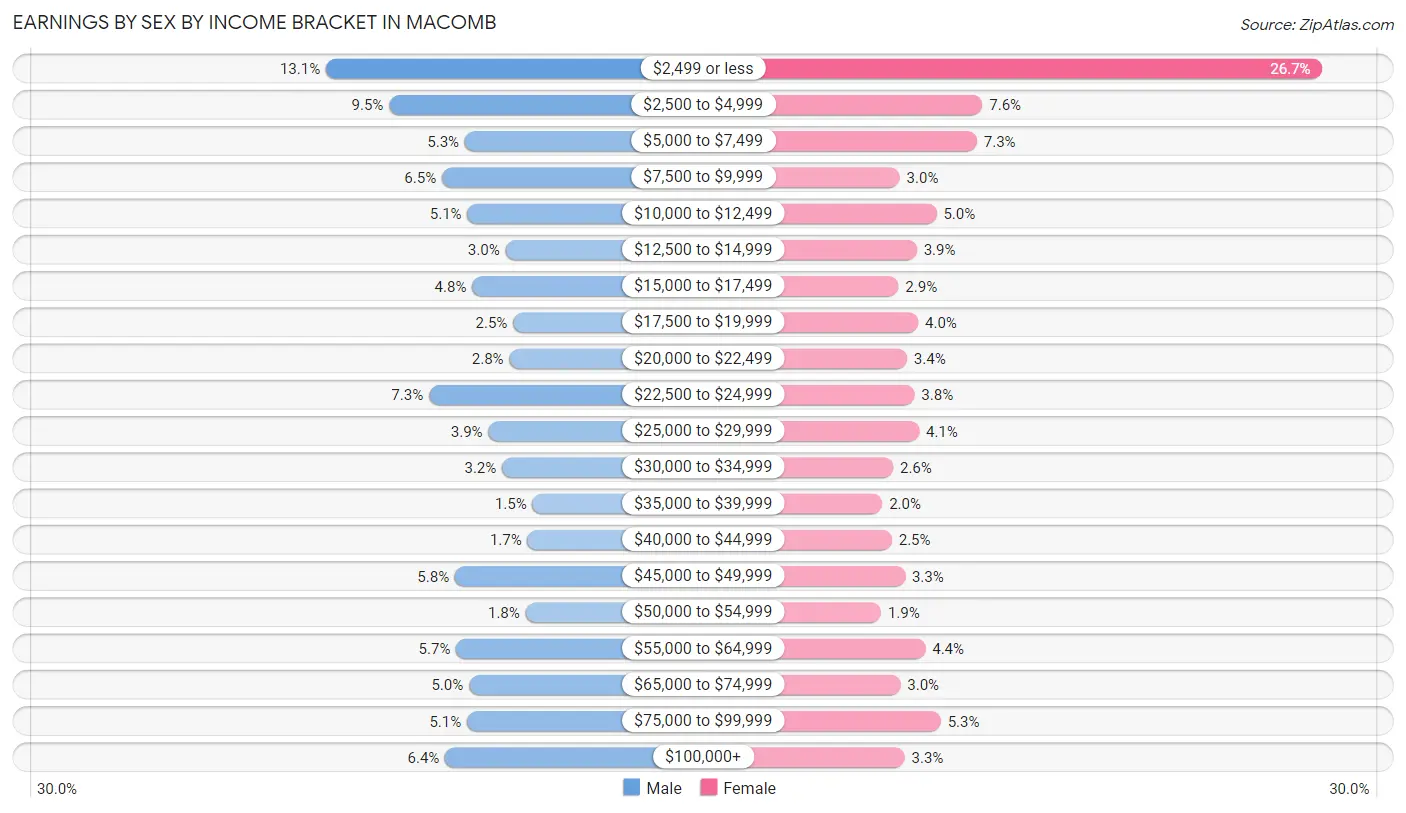
Earnings by Sex by Income Bracket in Macomb
The most common earnings brackets in Macomb are $2,499 or less for men (575 | 13.1%) and $2,499 or less for women (1,225 | 26.7%).
| Income | Male | Female |
| $2,499 or less | 575 (13.1%) | 1,225 (26.7%) |
| $2,500 to $4,999 | 419 (9.5%) | 349 (7.6%) |
| $5,000 to $7,499 | 231 (5.2%) | 335 (7.3%) |
| $7,500 to $9,999 | 288 (6.5%) | 136 (3.0%) |
| $10,000 to $12,499 | 225 (5.1%) | 231 (5.0%) |
| $12,500 to $14,999 | 131 (3.0%) | 180 (3.9%) |
| $15,000 to $17,499 | 213 (4.8%) | 133 (2.9%) |
| $17,500 to $19,999 | 112 (2.5%) | 184 (4.0%) |
| $20,000 to $22,499 | 121 (2.8%) | 155 (3.4%) |
| $22,500 to $24,999 | 320 (7.3%) | 174 (3.8%) |
| $25,000 to $29,999 | 173 (3.9%) | 186 (4.1%) |
| $30,000 to $34,999 | 139 (3.2%) | 119 (2.6%) |
| $35,000 to $39,999 | 64 (1.5%) | 91 (2.0%) |
| $40,000 to $44,999 | 76 (1.7%) | 116 (2.5%) |
| $45,000 to $49,999 | 256 (5.8%) | 150 (3.3%) |
| $50,000 to $54,999 | 81 (1.8%) | 88 (1.9%) |
| $55,000 to $64,999 | 253 (5.7%) | 202 (4.4%) |
| $65,000 to $74,999 | 221 (5.0%) | 138 (3.0%) |
| $75,000 to $99,999 | 226 (5.1%) | 242 (5.3%) |
| $100,000+ | 280 (6.4%) | 149 (3.3%) |
| Total | 4,404 (100.0%) | 4,583 (100.0%) |
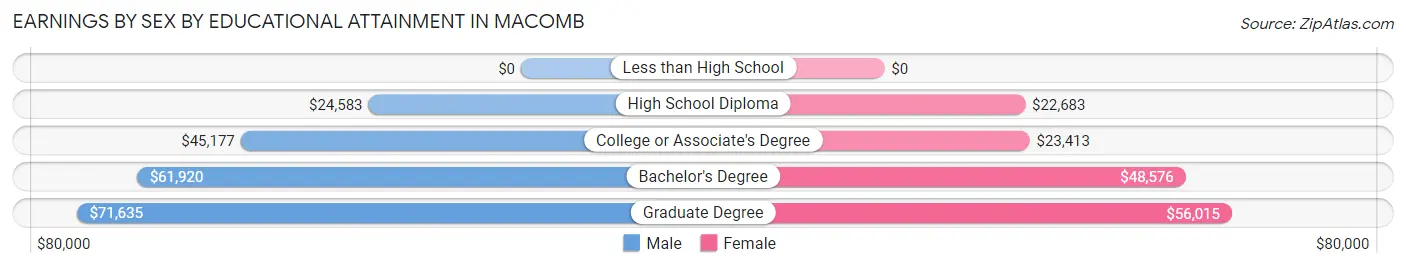
Earnings by Sex by Educational Attainment in Macomb
Average earnings in Macomb are $45,616 for men and $31,412 for women, a difference of 31.1%. Men with an educational attainment of graduate degree enjoy the highest average annual earnings of $71,635, while those with high school diploma education earn the least with $24,583. Women with an educational attainment of graduate degree earn the most with the average annual earnings of $56,015, while those with high school diploma education have the smallest earnings of $22,683.
| Educational Attainment | Male Income | Female Income |
| Less than High School | - | - |
| High School Diploma | $24,583 | $22,683 |
| College or Associate's Degree | $45,177 | $23,413 |
| Bachelor's Degree | $61,920 | $48,576 |
| Graduate Degree | $71,635 | $56,015 |
| Total | $45,616 | $31,412 |
Family Income in Macomb
Family Income Brackets in Macomb
According to the Macomb family income data, there are 466 families falling into the $100,000 to $149,999 income range, which is the most common income bracket and makes up 19.3% of all families. Conversely, the $10,000 to $14,999 income bracket is the least frequent group with only 133 families (5.5%) belonging to this category.
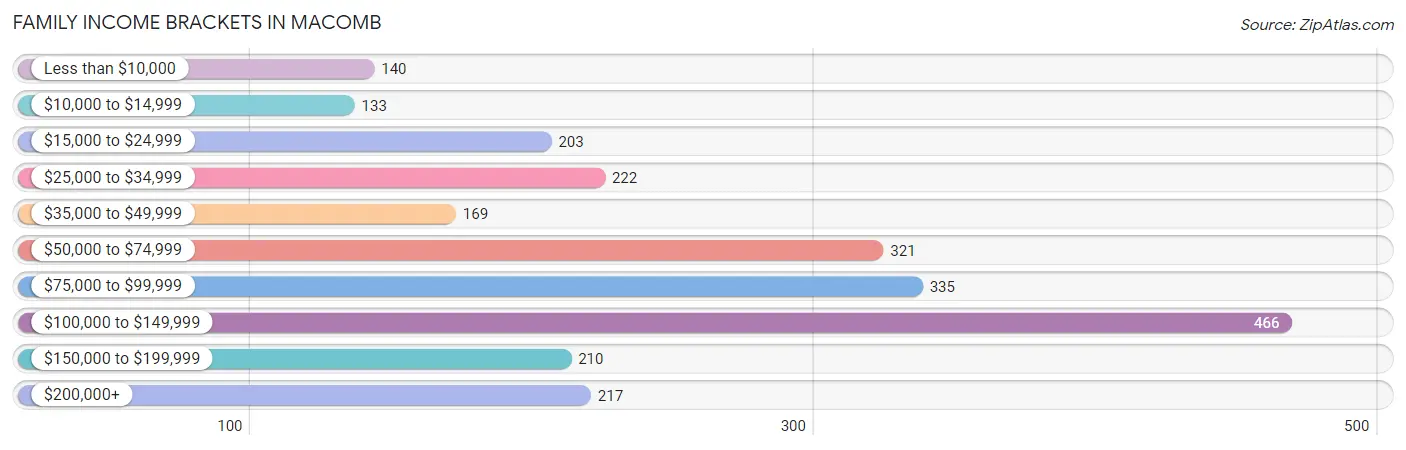
| Income Bracket | # Families | % Families |
| Less than $10,000 | 140 | 5.8% |
| $10,000 to $14,999 | 133 | 5.5% |
| $15,000 to $24,999 | 203 | 8.4% |
| $25,000 to $34,999 | 222 | 9.2% |
| $35,000 to $49,999 | 169 | 7.0% |
| $50,000 to $74,999 | 321 | 13.3% |
| $75,000 to $99,999 | 335 | 13.9% |
| $100,000 to $149,999 | 466 | 19.3% |
| $150,000 to $199,999 | 210 | 8.7% |
| $200,000+ | 217 | 9.0% |
Family Income by Famaliy Size in Macomb
5-person families (177 | 7.3%) account for the highest median family income in Macomb with $183,267 per family, while 5-person families (177 | 7.3%) have the highest median income of $36,653 per family member.
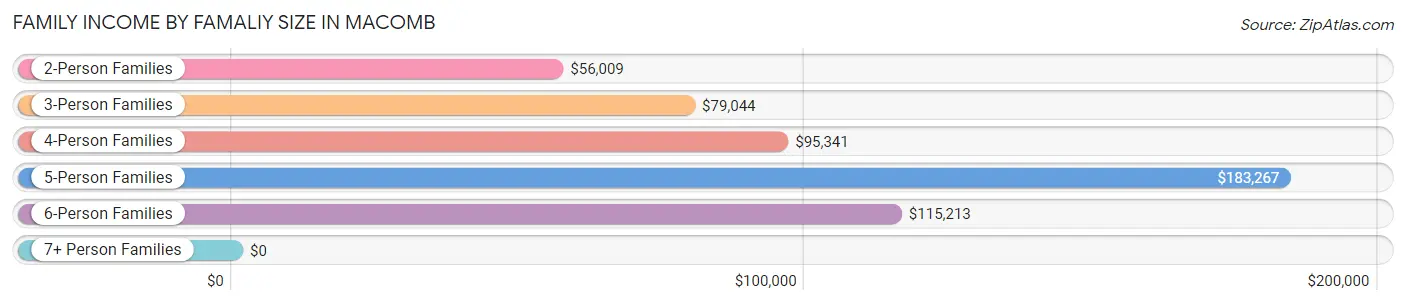
| Income Bracket | # Families | Median Income |
| 2-Person Families | 1,408 (58.4%) | $56,009 |
| 3-Person Families | 383 (15.9%) | $79,044 |
| 4-Person Families | 339 (14.1%) | $95,341 |
| 5-Person Families | 177 (7.3%) | $183,267 |
| 6-Person Families | 94 (3.9%) | $115,213 |
| 7+ Person Families | 12 (0.5%) | $0 |
| Total | 2,413 (100.0%) | $77,656 |
Family Income by Number of Earners in Macomb
The median family income in Macomb is $77,656, with families comprising 3+ earners (257) having the highest median family income of $126,875, while families with 1 earner (913) have the lowest median family income of $35,489, accounting for 10.6% and 37.8% of families, respectively.
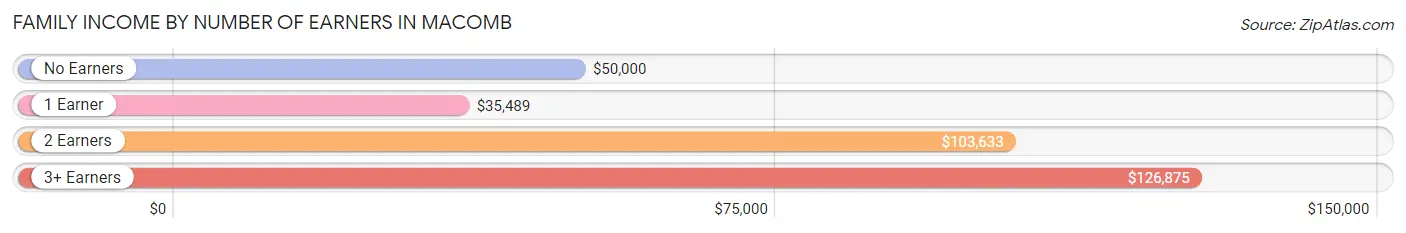
| Number of Earners | # Families | Median Income |
| No Earners | 494 (20.5%) | $50,000 |
| 1 Earner | 913 (37.8%) | $35,489 |
| 2 Earners | 749 (31.0%) | $103,633 |
| 3+ Earners | 257 (10.6%) | $126,875 |
| Total | 2,413 (100.0%) | $77,656 |
Household Income in Macomb
Household Income Brackets in Macomb
With 986 households falling in the category, the less than $10,000 income range is the most frequent in Macomb, accounting for 15.9% of all households. In contrast, only 230 households (3.7%) fall into the $200,000+ income bracket, making it the least populous group.
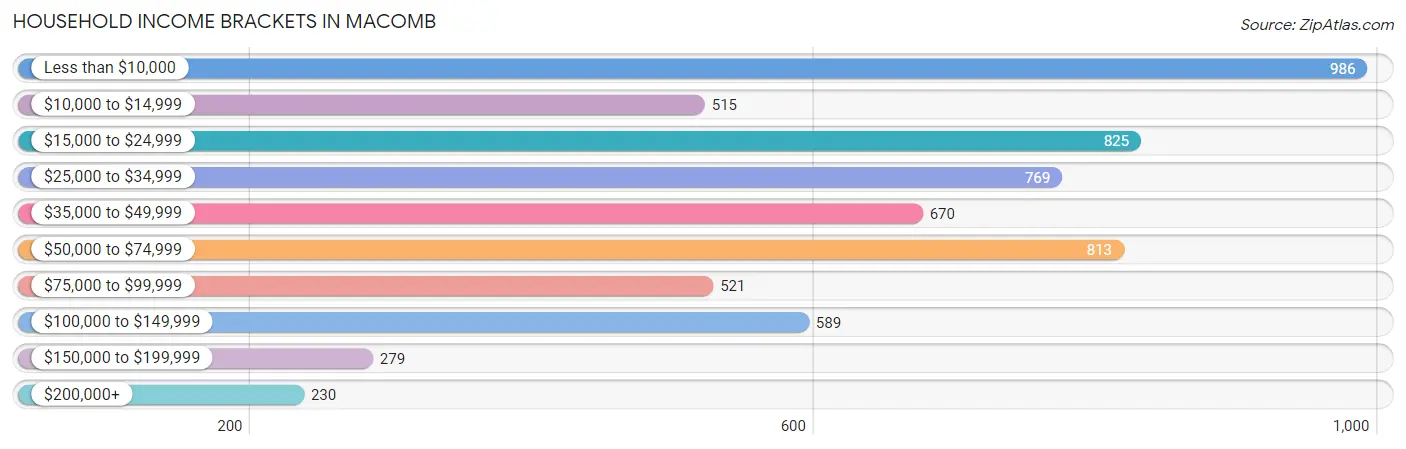
| Income Bracket | # Households | % Households |
| Less than $10,000 | 986 | 15.9% |
| $10,000 to $14,999 | 515 | 8.3% |
| $15,000 to $24,999 | 825 | 13.3% |
| $25,000 to $34,999 | 769 | 12.4% |
| $35,000 to $49,999 | 670 | 10.8% |
| $50,000 to $74,999 | 813 | 13.1% |
| $75,000 to $99,999 | 521 | 8.4% |
| $100,000 to $149,999 | 589 | 9.5% |
| $150,000 to $199,999 | 279 | 4.5% |
| $200,000+ | 230 | 3.7% |
Household Income by Householder Age in Macomb
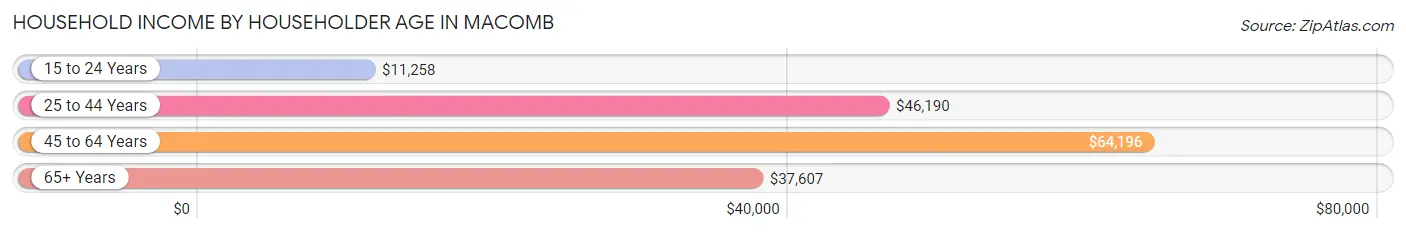
The median household income in Macomb is $35,064, with the highest median household income of $64,196 found in the 45 to 64 years age bracket for the primary householder. A total of 1,446 households (23.3%) fall into this category. Meanwhile, the 15 to 24 years age bracket for the primary householder has the lowest median household income of $11,258, with 1,370 households (22.1%) in this group.
| Income Bracket | # Households | Median Income |
| 15 to 24 Years | 1,370 (22.1%) | $11,258 |
| 25 to 44 Years | 1,808 (29.1%) | $46,190 |
| 45 to 64 Years | 1,446 (23.3%) | $64,196 |
| 65+ Years | 1,579 (25.5%) | $37,607 |
| Total | 6,203 (100.0%) | $35,064 |
Poverty in Macomb
Income Below Poverty by Sex and Age in Macomb
With 22.8% poverty level for males and 32.0% for females among the residents of Macomb, 18 to 24 year old males and 18 to 24 year old females are the most vulnerable to poverty, with 647 males (54.6%) and 1,027 females (73.6%) in their respective age groups living below the poverty level.
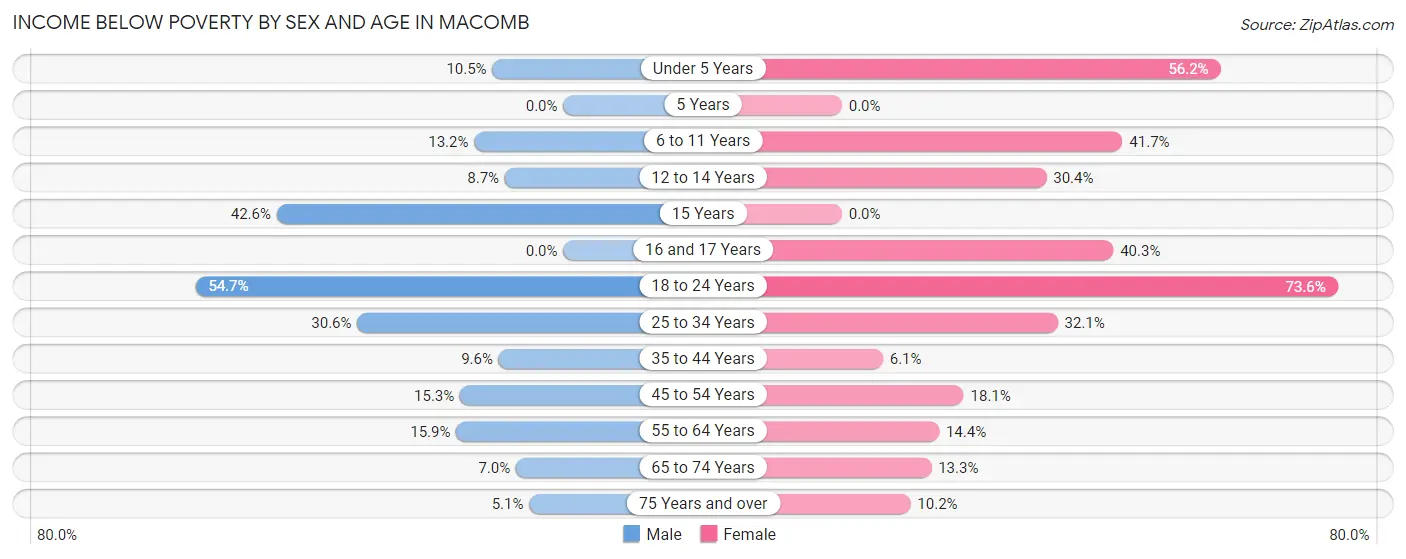
| Age Bracket | Male | Female |
| Under 5 Years | 28 (10.5%) | 104 (56.2%) |
| 5 Years | 0 (0.0%) | 0 (0.0%) |
| 6 to 11 Years | 43 (13.2%) | 205 (41.7%) |
| 12 to 14 Years | 29 (8.7%) | 65 (30.4%) |
| 15 Years | 20 (42.5%) | 0 (0.0%) |
| 16 and 17 Years | 0 (0.0%) | 79 (40.3%) |
| 18 to 24 Years | 647 (54.6%) | 1,027 (73.6%) |
| 25 to 34 Years | 282 (30.6%) | 266 (32.1%) |
| 35 to 44 Years | 72 (9.6%) | 45 (6.1%) |
| 45 to 54 Years | 88 (15.3%) | 85 (18.1%) |
| 55 to 64 Years | 97 (15.9%) | 99 (14.4%) |
| 65 to 74 Years | 35 (7.0%) | 98 (13.3%) |
| 75 Years and over | 16 (5.1%) | 66 (10.2%) |
| Total | 1,357 (22.8%) | 2,139 (32.0%) |
Income Above Poverty by Sex and Age in Macomb
According to the poverty statistics in Macomb, males aged 5 years and females aged 5 years are the age groups that are most secure financially, with 100.0% of males and 100.0% of females in these age groups living above the poverty line.
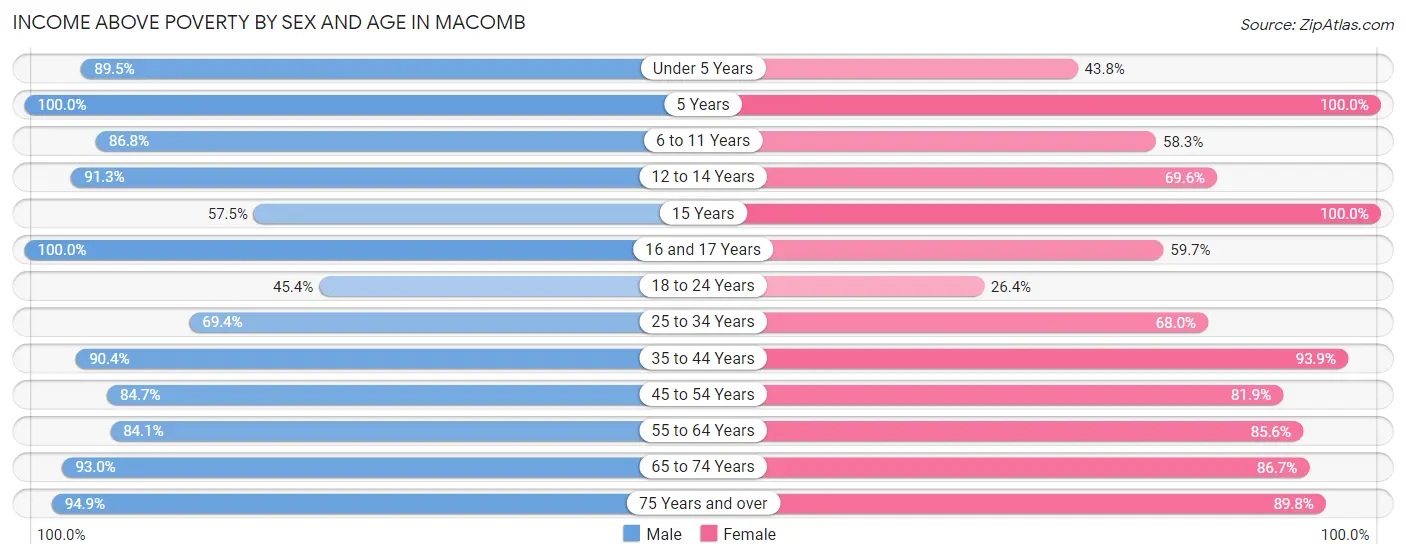
| Age Bracket | Male | Female |
| Under 5 Years | 238 (89.5%) | 81 (43.8%) |
| 5 Years | 38 (100.0%) | 51 (100.0%) |
| 6 to 11 Years | 282 (86.8%) | 287 (58.3%) |
| 12 to 14 Years | 305 (91.3%) | 149 (69.6%) |
| 15 Years | 27 (57.5%) | 33 (100.0%) |
| 16 and 17 Years | 82 (100.0%) | 117 (59.7%) |
| 18 to 24 Years | 537 (45.4%) | 368 (26.4%) |
| 25 to 34 Years | 640 (69.4%) | 564 (67.9%) |
| 35 to 44 Years | 679 (90.4%) | 694 (93.9%) |
| 45 to 54 Years | 486 (84.7%) | 385 (81.9%) |
| 55 to 64 Years | 513 (84.1%) | 587 (85.6%) |
| 65 to 74 Years | 463 (93.0%) | 640 (86.7%) |
| 75 Years and over | 300 (94.9%) | 582 (89.8%) |
| Total | 4,590 (77.2%) | 4,538 (68.0%) |
Income Below Poverty Among Married-Couple Families in Macomb
The poverty statistics for married-couple families in Macomb show that 5.0% or 83 of the total 1,674 families live below the poverty line. Families with no children have the highest poverty rate of 6.5%, comprising of 64 families. On the other hand, families with 3 or 4 children have the lowest poverty rate of 0.0%, which includes 0 families.
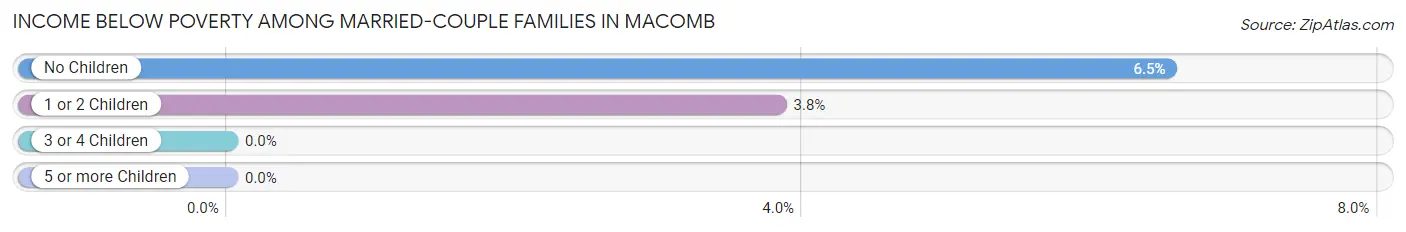
| Children | Above Poverty | Below Poverty |
| No Children | 915 (93.5%) | 64 (6.5%) |
| 1 or 2 Children | 478 (96.2%) | 19 (3.8%) |
| 3 or 4 Children | 192 (100.0%) | 0 (0.0%) |
| 5 or more Children | 6 (100.0%) | 0 (0.0%) |
| Total | 1,591 (95.0%) | 83 (5.0%) |
Income Below Poverty Among Single-Parent Households in Macomb
According to the poverty data in Macomb, 55.8% or 58 single-father households and 43.9% or 279 single-mother households are living below the poverty line. Among single-father households, those with 1 or 2 children have the highest poverty rate, with 51 households (65.4%) experiencing poverty. Likewise, among single-mother households, those with 3 or 4 children have the highest poverty rate, with 42 households (100.0%) falling below the poverty line.
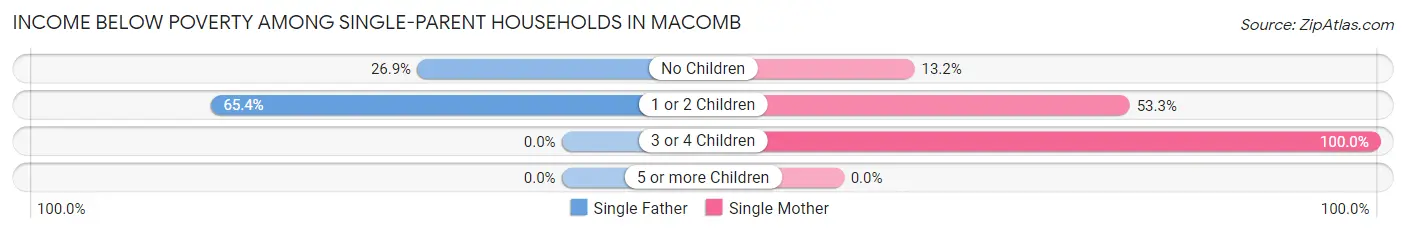
| Children | Single Father | Single Mother |
| No Children | 7 (26.9%) | 26 (13.2%) |
| 1 or 2 Children | 51 (65.4%) | 211 (53.3%) |
| 3 or 4 Children | 0 (0.0%) | 42 (100.0%) |
| 5 or more Children | 0 (0.0%) | 0 (0.0%) |
| Total | 58 (55.8%) | 279 (43.9%) |
Income Below Poverty Among Married-Couple vs Single-Parent Households in Macomb
The poverty data for Macomb shows that 83 of the married-couple family households (5.0%) and 337 of the single-parent households (45.6%) are living below the poverty level. Within the married-couple family households, those with no children have the highest poverty rate, with 64 households (6.5%) falling below the poverty line. Among the single-parent households, those with 3 or 4 children have the highest poverty rate, with 42 household (100.0%) living below poverty.
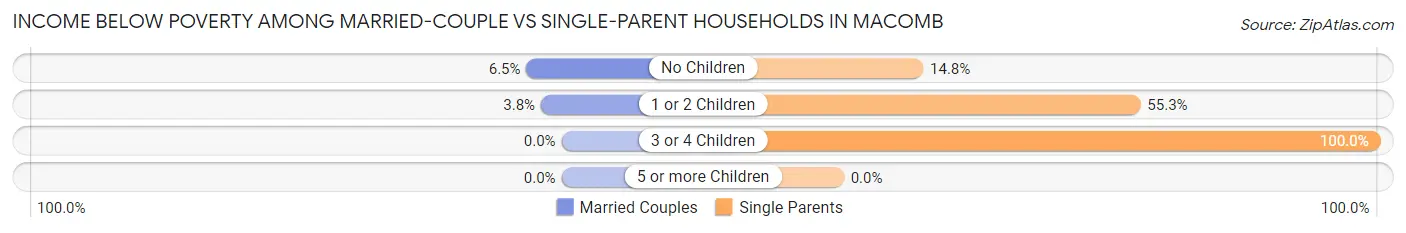
| Children | Married-Couple Families | Single-Parent Households |
| No Children | 64 (6.5%) | 33 (14.8%) |
| 1 or 2 Children | 19 (3.8%) | 262 (55.3%) |
| 3 or 4 Children | 0 (0.0%) | 42 (100.0%) |
| 5 or more Children | 0 (0.0%) | 0 (0.0%) |
| Total | 83 (5.0%) | 337 (45.6%) |
Race in Macomb
The most populous races in Macomb are White / Caucasian (12,623 | 83.0%), Black / African American (1,312 | 8.6%), and Hispanic or Latino (693 | 4.6%).
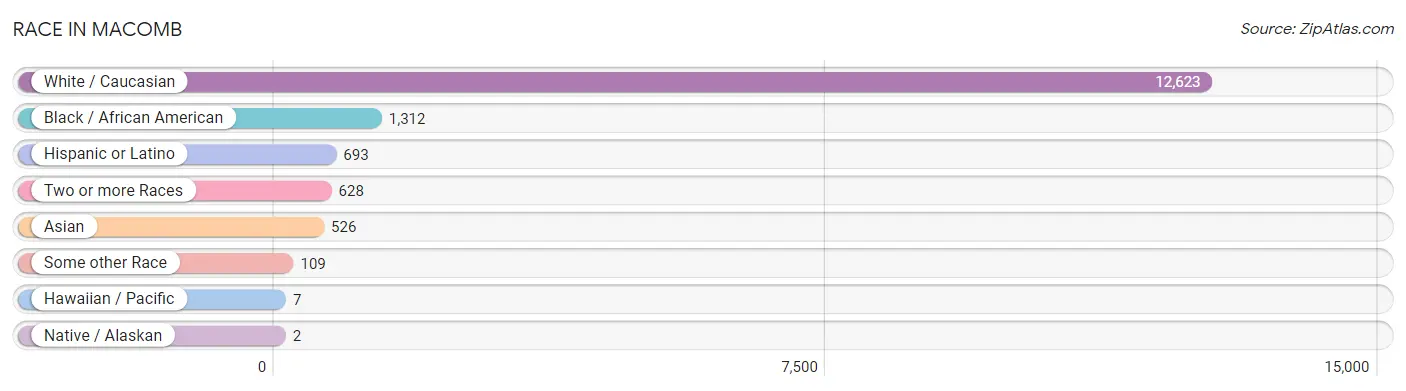
| Race | # Population | % Population |
| Asian | 526 | 3.5% |
| Black / African American | 1,312 | 8.6% |
| Hawaiian / Pacific | 7 | 0.1% |
| Hispanic or Latino | 693 | 4.6% |
| Native / Alaskan | 2 | 0.0% |
| White / Caucasian | 12,623 | 83.0% |
| Two or more Races | 628 | 4.1% |
| Some other Race | 109 | 0.7% |
| Total | 15,207 | 100.0% |
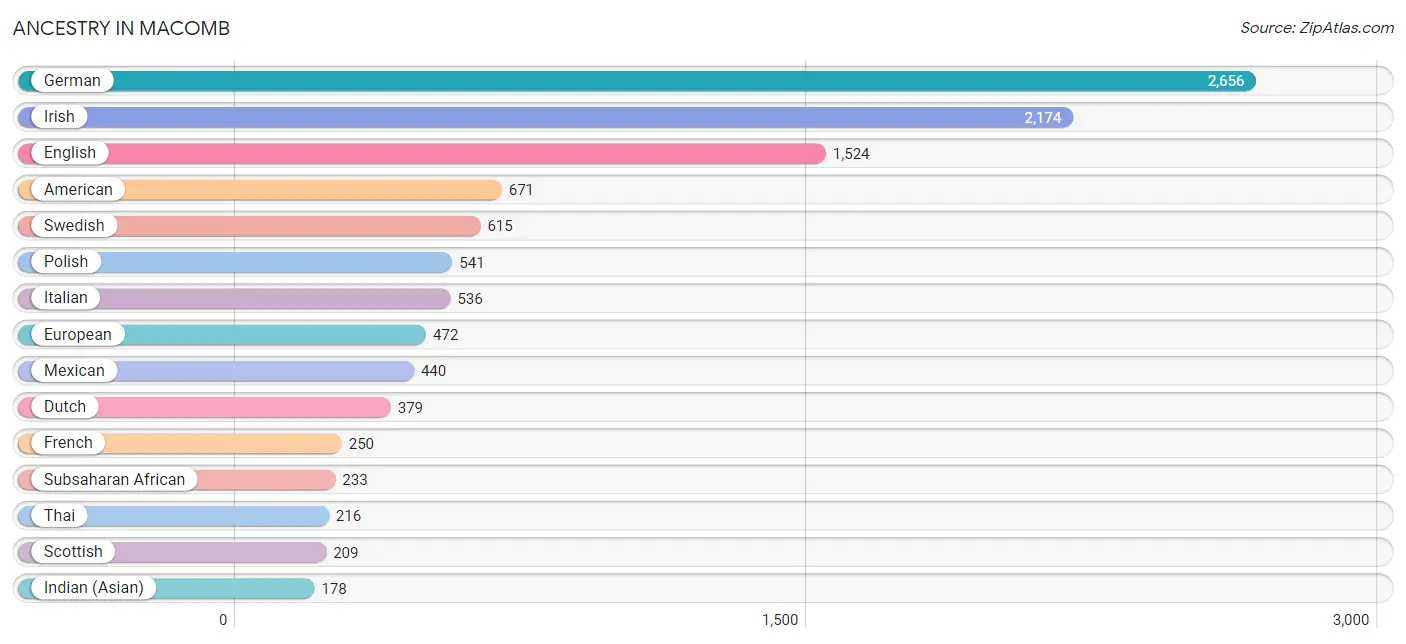
Ancestry in Macomb
The most populous ancestries reported in Macomb are German (2,656 | 17.5%), Irish (2,174 | 14.3%), English (1,524 | 10.0%), American (671 | 4.4%), and Swedish (615 | 4.0%), together accounting for 50.2% of all Macomb residents.
| Ancestry | # Population | % Population |
| African | 161 | 1.1% |
| American | 671 | 4.4% |
| Argentinean | 11 | 0.1% |
| Barbadian | 10 | 0.1% |
| Belgian | 42 | 0.3% |
| Bermudan | 10 | 0.1% |
| Brazilian | 9 | 0.1% |
| British | 147 | 1.0% |
| Central American | 23 | 0.2% |
| Costa Rican | 6 | 0.0% |
| Croatian | 6 | 0.0% |
| Cuban | 37 | 0.2% |
| Czech | 16 | 0.1% |
| Danish | 105 | 0.7% |
| Dutch | 379 | 2.5% |
| English | 1,524 | 10.0% |
| European | 472 | 3.1% |
| Finnish | 66 | 0.4% |
| French | 250 | 1.6% |
| French Canadian | 43 | 0.3% |
| German | 2,656 | 17.5% |
| Greek | 104 | 0.7% |
| Guatemalan | 17 | 0.1% |
| Hungarian | 18 | 0.1% |
| Indian (Asian) | 178 | 1.2% |
| Iranian | 18 | 0.1% |
| Irish | 2,174 | 14.3% |
| Italian | 536 | 3.5% |
| Korean | 109 | 0.7% |
| Mexican | 440 | 2.9% |
| Mexican American Indian | 2 | 0.0% |
| Mongolian | 13 | 0.1% |
| Native Hawaiian | 7 | 0.1% |
| Nigerian | 58 | 0.4% |
| Northern European | 26 | 0.2% |
| Norwegian | 119 | 0.8% |
| Peruvian | 22 | 0.1% |
| Polish | 541 | 3.6% |
| Puerto Rican | 78 | 0.5% |
| Romanian | 13 | 0.1% |
| Russian | 36 | 0.2% |
| Scandinavian | 41 | 0.3% |
| Scotch-Irish | 78 | 0.5% |
| Scottish | 209 | 1.4% |
| Serbian | 10 | 0.1% |
| Sioux | 7 | 0.1% |
| South American | 45 | 0.3% |
| Spaniard | 8 | 0.1% |
| Spanish | 13 | 0.1% |
| Subsaharan African | 233 | 1.5% |
| Swedish | 615 | 4.0% |
| Swiss | 32 | 0.2% |
| Thai | 216 | 1.4% |
| Tongan | 4 | 0.0% |
| Trinidadian and Tobagonian | 74 | 0.5% |
| Venezuelan | 12 | 0.1% |
| Welsh | 63 | 0.4% |
| West Indian | 11 | 0.1% |
| Yugoslavian | 13 | 0.1% | View All 59 Rows |
Immigrants in Macomb
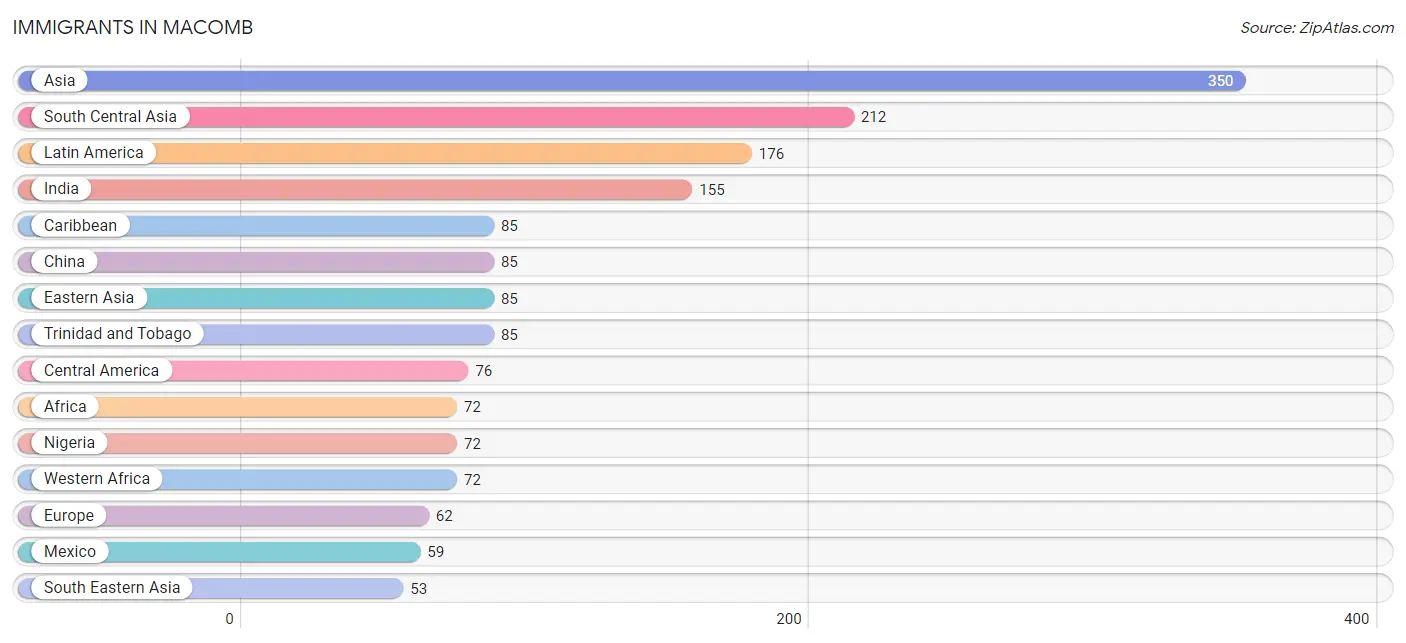
The most numerous immigrant groups reported in Macomb came from Asia (350 | 2.3%), South Central Asia (212 | 1.4%), Latin America (176 | 1.2%), India (155 | 1.0%), and Caribbean (85 | 0.6%), together accounting for 6.4% of all Macomb residents.
| Immigration Origin | # Population | % Population |
| Africa | 72 | 0.5% |
| Asia | 350 | 2.3% |
| Brazil | 9 | 0.1% |
| Caribbean | 85 | 0.6% |
| Central America | 76 | 0.5% |
| China | 85 | 0.6% |
| Costa Rica | 6 | 0.0% |
| Czechoslovakia | 8 | 0.1% |
| Eastern Asia | 85 | 0.6% |
| Eastern Europe | 33 | 0.2% |
| Europe | 62 | 0.4% |
| Germany | 13 | 0.1% |
| Guatemala | 11 | 0.1% |
| India | 155 | 1.0% |
| Ireland | 13 | 0.1% |
| Kazakhstan | 18 | 0.1% |
| Latin America | 176 | 1.2% |
| Malaysia | 13 | 0.1% |
| Mexico | 59 | 0.4% |
| Nigeria | 72 | 0.5% |
| Northern Europe | 13 | 0.1% |
| Oceania | 6 | 0.0% |
| Pakistan | 39 | 0.3% |
| Peru | 6 | 0.0% |
| Philippines | 40 | 0.3% |
| Poland | 12 | 0.1% |
| Romania | 13 | 0.1% |
| South America | 15 | 0.1% |
| South Central Asia | 212 | 1.4% |
| South Eastern Asia | 53 | 0.4% |
| Southern Europe | 3 | 0.0% |
| Spain | 3 | 0.0% |
| Taiwan | 36 | 0.2% |
| Trinidad and Tobago | 85 | 0.6% |
| Western Africa | 72 | 0.5% |
| Western Europe | 13 | 0.1% | View All 36 Rows |
Sex and Age in Macomb
Sex and Age in Macomb
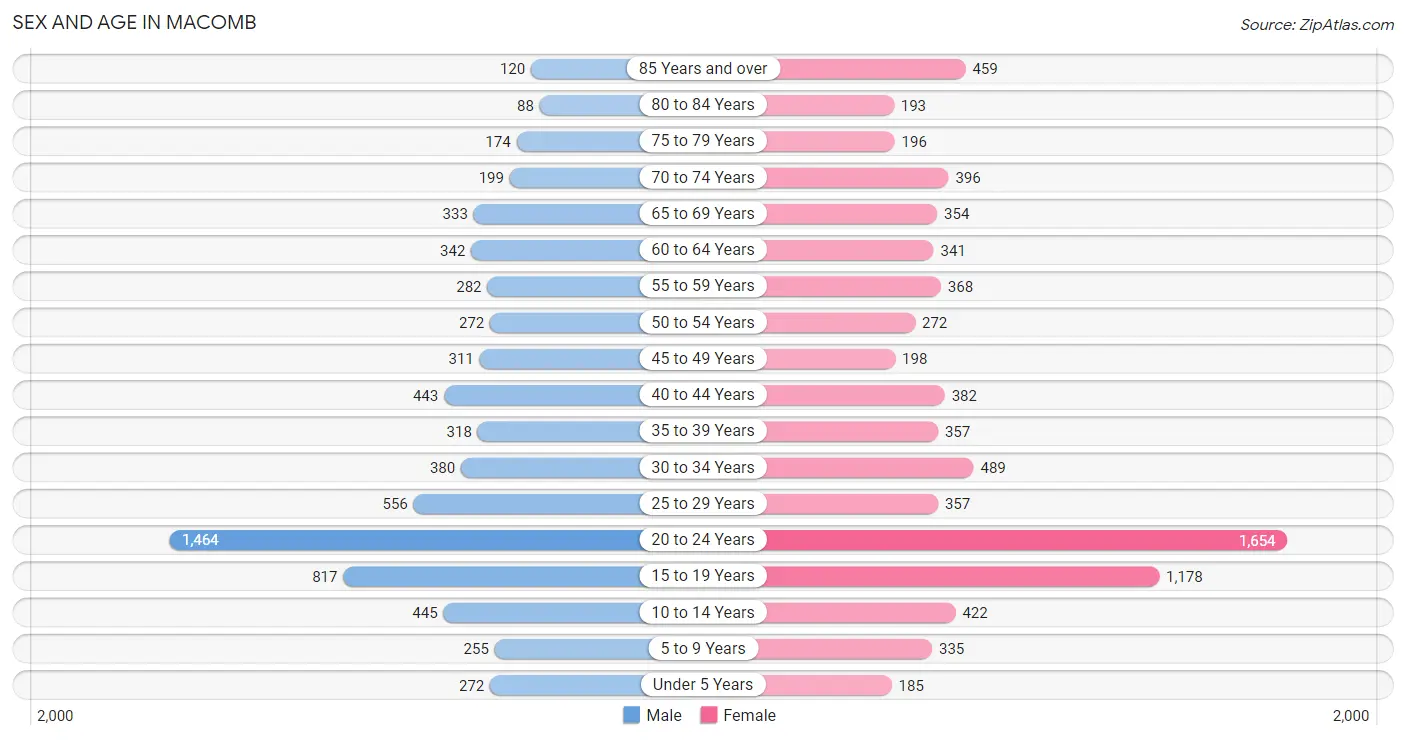
The most populous age groups in Macomb are 20 to 24 Years (1,464 | 20.7%) for men and 20 to 24 Years (1,654 | 20.3%) for women.
| Age Bracket | Male | Female |
| Under 5 Years | 272 (3.8%) | 185 (2.3%) |
| 5 to 9 Years | 255 (3.6%) | 335 (4.1%) |
| 10 to 14 Years | 445 (6.3%) | 422 (5.2%) |
| 15 to 19 Years | 817 (11.6%) | 1,178 (14.5%) |
| 20 to 24 Years | 1,464 (20.7%) | 1,654 (20.3%) |
| 25 to 29 Years | 556 (7.9%) | 357 (4.4%) |
| 30 to 34 Years | 380 (5.4%) | 489 (6.0%) |
| 35 to 39 Years | 318 (4.5%) | 357 (4.4%) |
| 40 to 44 Years | 443 (6.3%) | 382 (4.7%) |
| 45 to 49 Years | 311 (4.4%) | 198 (2.4%) |
| 50 to 54 Years | 272 (3.8%) | 272 (3.3%) |
| 55 to 59 Years | 282 (4.0%) | 368 (4.5%) |
| 60 to 64 Years | 342 (4.8%) | 341 (4.2%) |
| 65 to 69 Years | 333 (4.7%) | 354 (4.3%) |
| 70 to 74 Years | 199 (2.8%) | 396 (4.9%) |
| 75 to 79 Years | 174 (2.5%) | 196 (2.4%) |
| 80 to 84 Years | 88 (1.2%) | 193 (2.4%) |
| 85 Years and over | 120 (1.7%) | 459 (5.6%) |
| Total | 7,071 (100.0%) | 8,136 (100.0%) |
Families and Households in Macomb
Median Family Size in Macomb
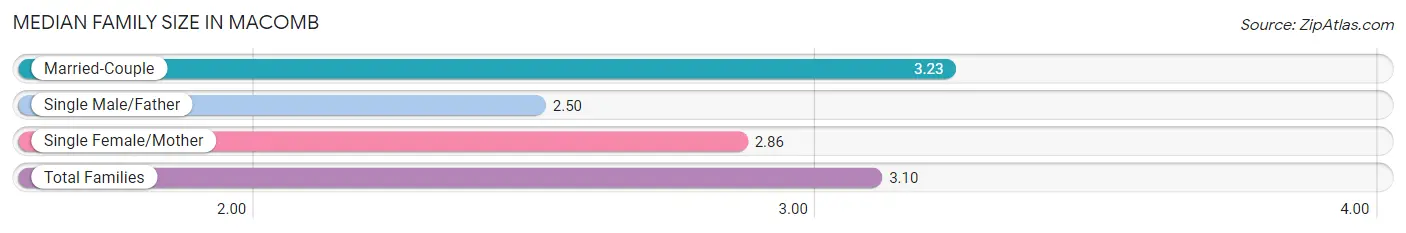
The median family size in Macomb is 3.10 persons per family, with married-couple families (1,674 | 69.4%) accounting for the largest median family size of 3.23 persons per family. On the other hand, single male/father families (104 | 4.3%) represent the smallest median family size with 2.50 persons per family.
| Family Type | # Families | Family Size |
| Married-Couple | 1,674 (69.4%) | 3.23 |
| Single Male/Father | 104 (4.3%) | 2.50 |
| Single Female/Mother | 635 (26.3%) | 2.86 |
| Total Families | 2,413 (100.0%) | 3.10 |
Median Household Size in Macomb
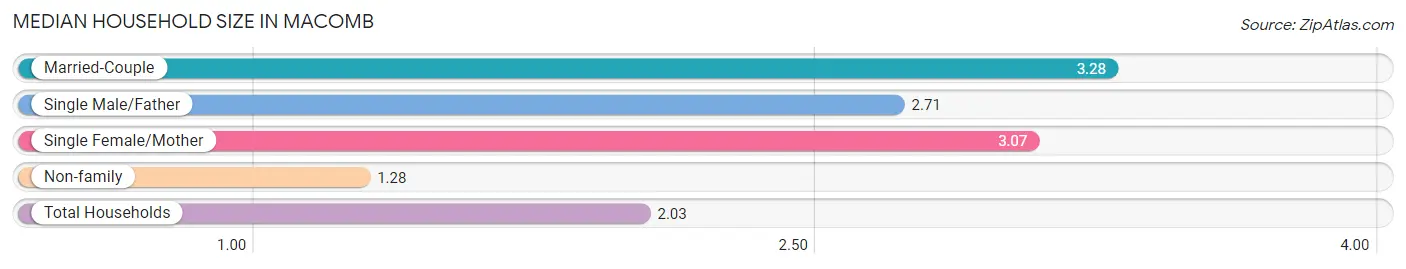
The median household size in Macomb is 2.03 persons per household, with married-couple households (1,674 | 27.0%) accounting for the largest median household size of 3.28 persons per household. non-family households (3,790 | 61.1%) represent the smallest median household size with 1.28 persons per household.
| Household Type | # Households | Household Size |
| Married-Couple | 1,674 (27.0%) | 3.28 |
| Single Male/Father | 104 (1.7%) | 2.71 |
| Single Female/Mother | 635 (10.2%) | 3.07 |
| Non-family | 3,790 (61.1%) | 1.28 |
| Total Households | 6,203 (100.0%) | 2.03 |
Household Size by Marriage Status in Macomb
Out of a total of 6,203 households in Macomb, 2,413 (38.9%) are family households, while 3,790 (61.1%) are nonfamily households. The most numerous type of family households are 2-person households, comprising 1,286, and the most common type of nonfamily households are 1-person households, comprising 3,067.
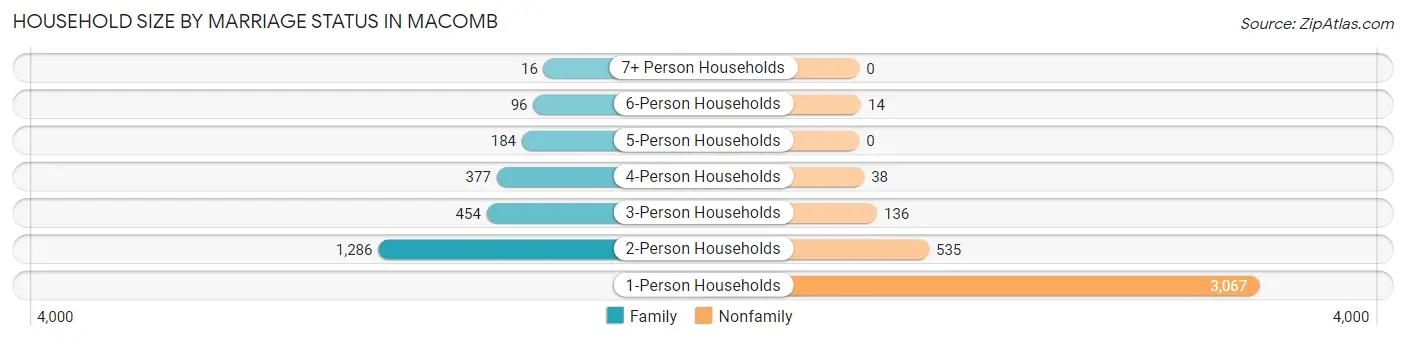
| Household Size | Family Households | Nonfamily Households |
| 1-Person Households | - | 3,067 (49.4%) |
| 2-Person Households | 1,286 (20.7%) | 535 (8.6%) |
| 3-Person Households | 454 (7.3%) | 136 (2.2%) |
| 4-Person Households | 377 (6.1%) | 38 (0.6%) |
| 5-Person Households | 184 (3.0%) | 0 (0.0%) |
| 6-Person Households | 96 (1.5%) | 14 (0.2%) |
| 7+ Person Households | 16 (0.3%) | 0 (0.0%) |
| Total | 2,413 (38.9%) | 3,790 (61.1%) |
Female Fertility in Macomb
Fertility by Age in Macomb
Average fertility rate in Macomb is 5.0 births per 1,000 women. Women in the age bracket of 20 to 34 years have the highest fertility rate with 9.0 births per 1,000 women. Women in the age bracket of 20 to 34 years acount for 100.0% of all women with births.
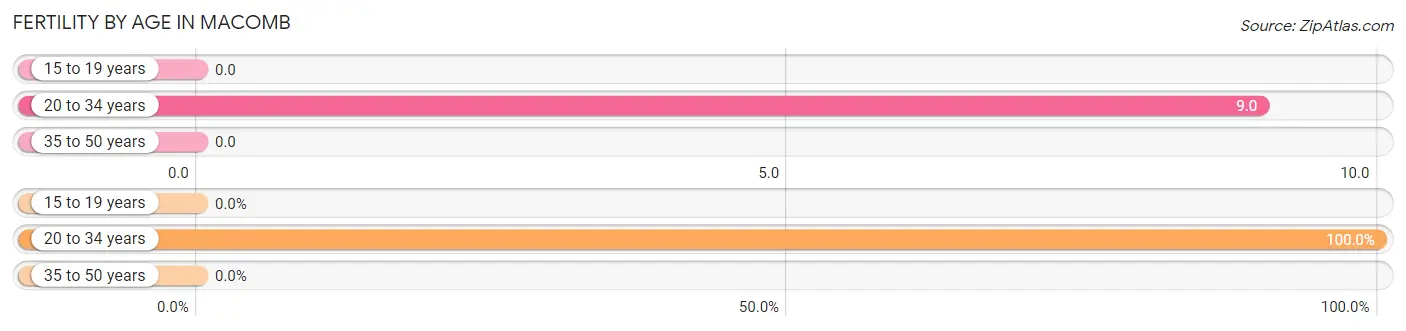
| Age Bracket | Women with Births | Births / 1,000 Women |
| 15 to 19 years | 0 (0.0%) | 0.0 |
| 20 to 34 years | 22 (100.0%) | 9.0 |
| 35 to 50 years | 0 (0.0%) | 0.0 |
| Total | 22 (100.0%) | 5.0 |
Fertility by Age by Marriage Status in Macomb
40.9% of women with births (22) in Macomb are married. The highest percentage of unmarried women with births falls into 20 to 34 years age bracket with 59.1% of them unmarried at the time of birth, while the lowest percentage of unmarried women with births belong to 20 to 34 years age bracket with 59.1% of them unmarried.
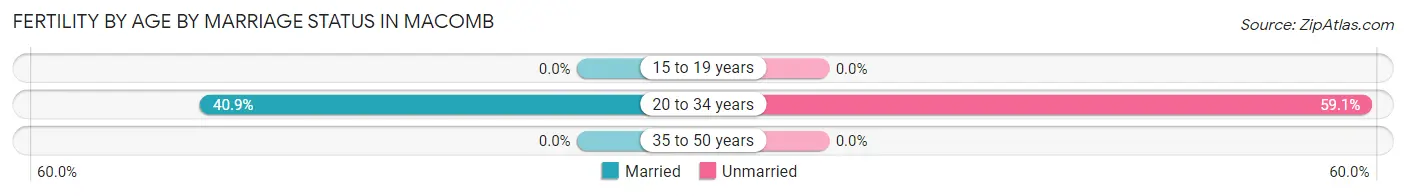
| Age Bracket | Married | Unmarried |
| 15 to 19 years | 0 (0.0%) | 0 (0.0%) |
| 20 to 34 years | 9 (40.9%) | 13 (59.1%) |
| 35 to 50 years | 0 (0.0%) | 0 (0.0%) |
| Total | 9 (40.9%) | 13 (59.1%) |
Fertility by Education in Macomb
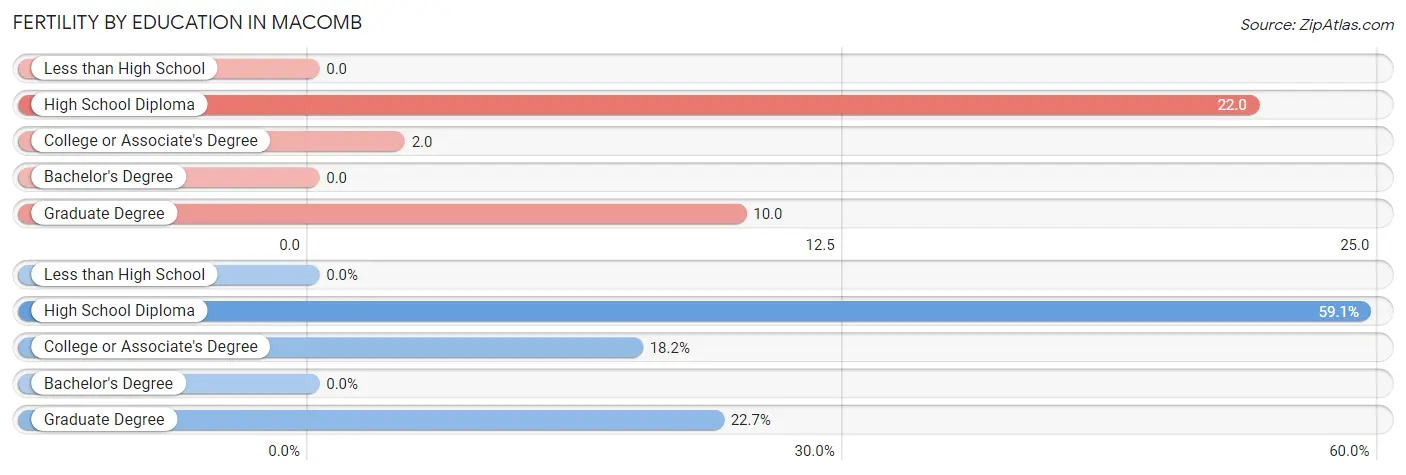
| Educational Attainment | Women with Births | Births / 1,000 Women |
| Less than High School | 0 (0.0%) | 0.0 |
| High School Diploma | 13 (59.1%) | 22.0 |
| College or Associate's Degree | 4 (18.2%) | 2.0 |
| Bachelor's Degree | 0 (0.0%) | 0.0 |
| Graduate Degree | 5 (22.7%) | 10.0 |
| Total | 22 (100.0%) | 5.0 |
Fertility by Education by Marriage Status in Macomb
59.1% of women with births in Macomb are unmarried. Women with the educational attainment of college or associate's degree are most likely to be married with 100.0% of them married at childbirth, while women with the educational attainment of high school diploma are least likely to be married with 100.0% of them unmarried at childbirth.
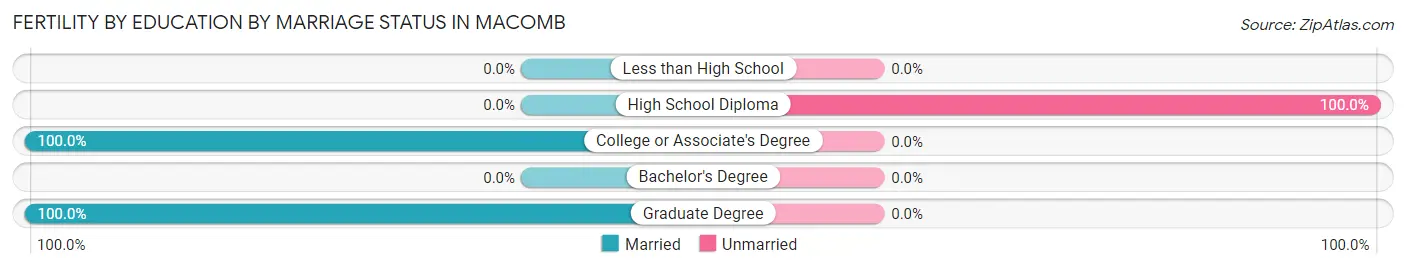
| Educational Attainment | Married | Unmarried |
| Less than High School | 0 (0.0%) | 0 (0.0%) |
| High School Diploma | 0 (0.0%) | 13 (100.0%) |
| College or Associate's Degree | 4 (100.0%) | 0 (0.0%) |
| Bachelor's Degree | 0 (0.0%) | 0 (0.0%) |
| Graduate Degree | 5 (100.0%) | 0 (0.0%) |
| Total | 9 (40.9%) | 13 (59.1%) |
Employment Characteristics in Macomb
Employment by Class of Employer in Macomb
Among the 6,608 employed individuals in Macomb, private company employees (3,685 | 55.8%), state government employees (1,195 | 18.1%), and not-for-profit organizations (610 | 9.2%) make up the most common classes of employment.
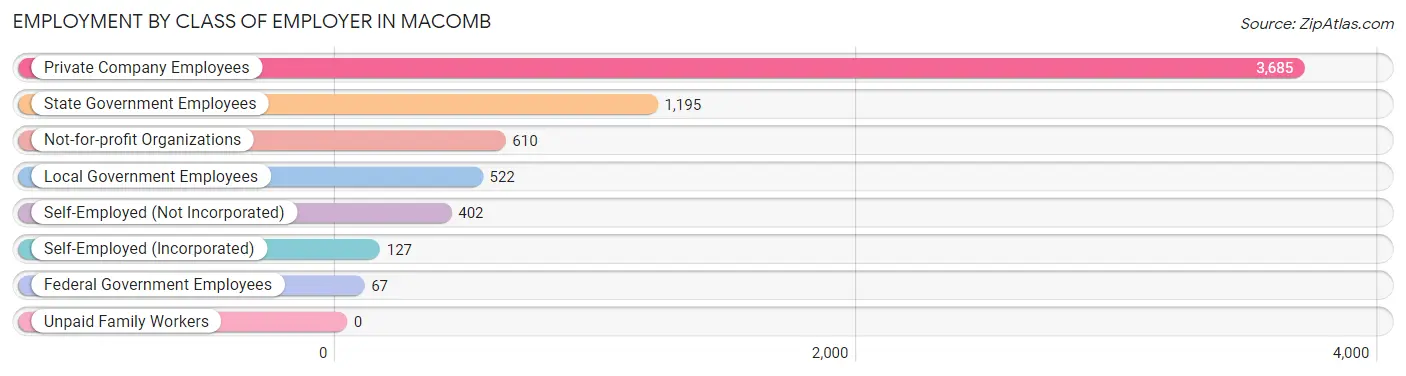
| Employer Class | # Employees | % Employees |
| Private Company Employees | 3,685 | 55.8% |
| Self-Employed (Incorporated) | 127 | 1.9% |
| Self-Employed (Not Incorporated) | 402 | 6.1% |
| Not-for-profit Organizations | 610 | 9.2% |
| Local Government Employees | 522 | 7.9% |
| State Government Employees | 1,195 | 18.1% |
| Federal Government Employees | 67 | 1.0% |
| Unpaid Family Workers | 0 | 0.0% |
| Total | 6,608 | 100.0% |
Employment Status by Age in Macomb
According to the labor force statistics for Macomb, out of the total population over 16 years of age (13,213), 57.8% or 7,637 individuals are in the labor force, with 11.3% or 863 of them unemployed. The age group with the highest labor force participation rate is 25 to 29 years, with 88.7% or 810 individuals in the labor force. Within the labor force, the 20 to 24 years age range has the highest percentage of unemployed individuals, with 18.2% or 387 of them being unemployed.
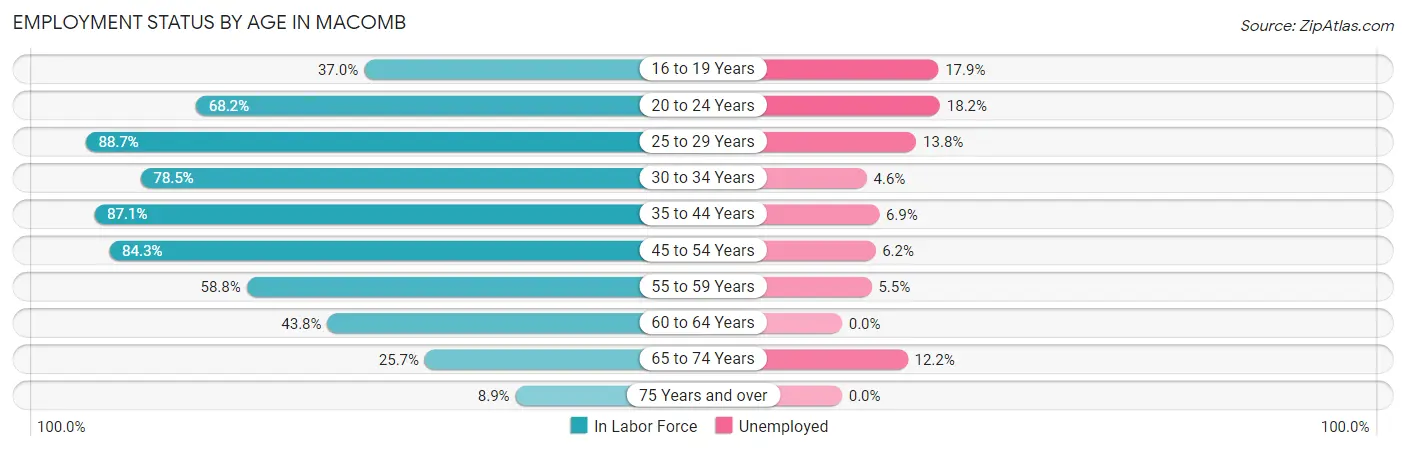
| Age Bracket | In Labor Force | Unemployed |
| 16 to 19 Years | 709 (37.0%) | 127 (17.9%) |
| 20 to 24 Years | 2,126 (68.2%) | 387 (18.2%) |
| 25 to 29 Years | 810 (88.7%) | 112 (13.8%) |
| 30 to 34 Years | 682 (78.5%) | 31 (4.6%) |
| 35 to 44 Years | 1,306 (87.1%) | 90 (6.9%) |
| 45 to 54 Years | 888 (84.3%) | 55 (6.2%) |
| 55 to 59 Years | 382 (58.8%) | 21 (5.5%) |
| 60 to 64 Years | 299 (43.8%) | 0 (0.0%) |
| 65 to 74 Years | 329 (25.7%) | 40 (12.2%) |
| 75 Years and over | 109 (8.9%) | 0 (0.0%) |
| Total | 7,637 (57.8%) | 863 (11.3%) |
Employment Status by Educational Attainment in Macomb
According to labor force statistics for Macomb, 77.1% of individuals (4,370) out of the total population between 25 and 64 years of age (5,668) are in the labor force, with 7.1% or 310 of them being unemployed. The group with the highest labor force participation rate are those with the educational attainment of bachelor's degree or higher, with 88.4% or 2,009 individuals in the labor force. Within the labor force, individuals with high school diploma education have the highest percentage of unemployment, with 18.9% or 171 of them being unemployed.
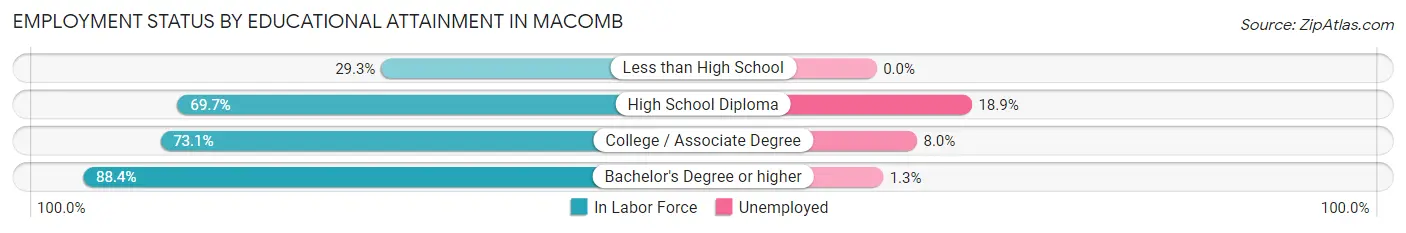
| Educational Attainment | In Labor Force | Unemployed |
| Less than High School | 54 (29.3%) | 0 (0.0%) |
| High School Diploma | 905 (69.7%) | 246 (18.9%) |
| College / Associate Degree | 1,398 (73.1%) | 153 (8.0%) |
| Bachelor's Degree or higher | 2,009 (88.4%) | 30 (1.3%) |
| Total | 4,370 (77.1%) | 402 (7.1%) |
Employment Occupations by Sex in Macomb
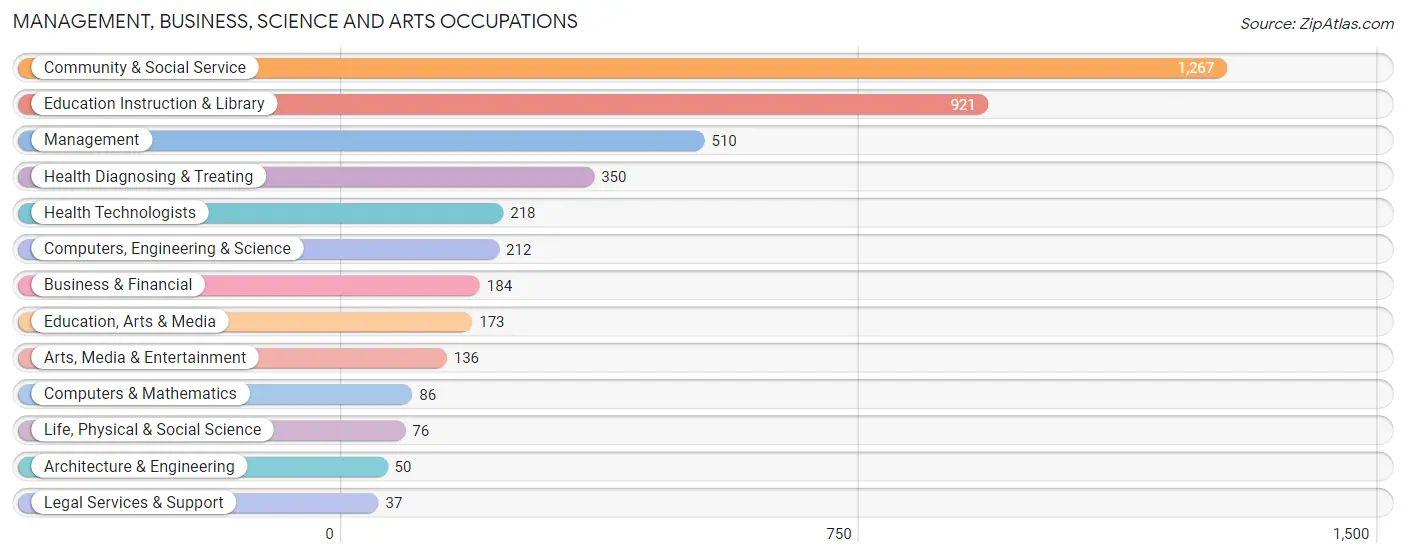
Management, Business, Science and Arts Occupations
The most common Management, Business, Science and Arts occupations in Macomb are Community & Social Service (1,267 | 18.7%), Education Instruction & Library (921 | 13.6%), Management (510 | 7.5%), Health Diagnosing & Treating (350 | 5.2%), and Health Technologists (218 | 3.2%).
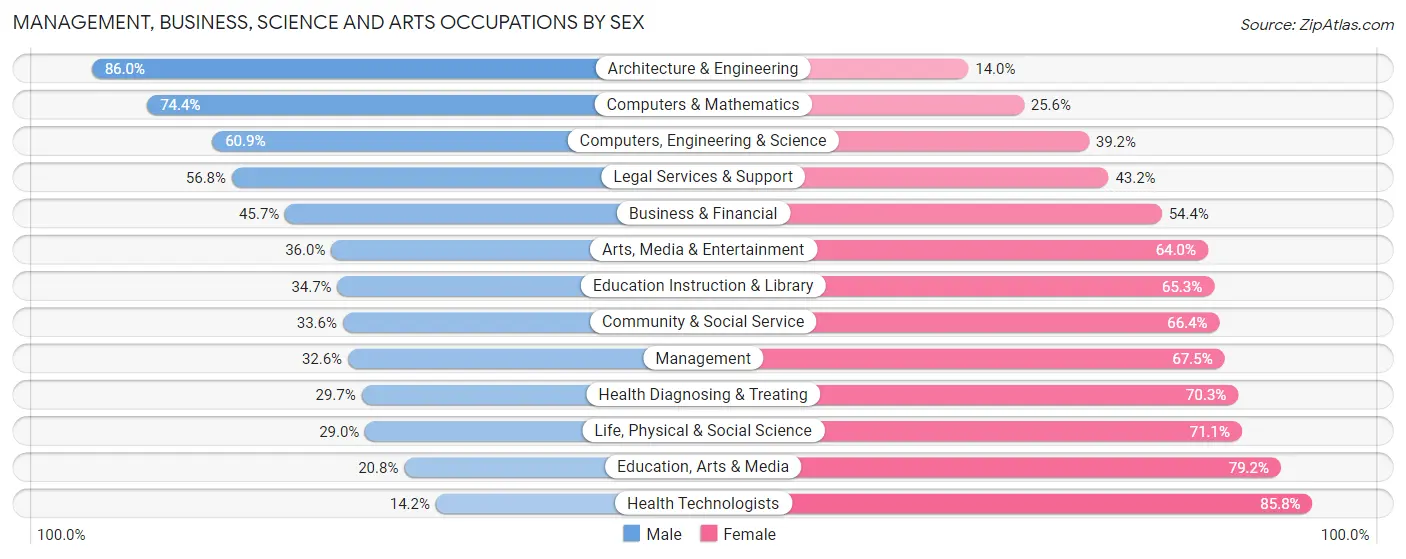
Management, Business, Science and Arts Occupations by Sex
Within the Management, Business, Science and Arts occupations in Macomb, the most male-oriented occupations are Architecture & Engineering (86.0%), Computers & Mathematics (74.4%), and Computers, Engineering & Science (60.9%), while the most female-oriented occupations are Health Technologists (85.8%), Education, Arts & Media (79.2%), and Life, Physical & Social Science (71.1%).
| Occupation | Male | Female |
| Management | 166 (32.6%) | 344 (67.4%) |
| Business & Financial | 84 (45.7%) | 100 (54.3%) |
| Computers, Engineering & Science | 129 (60.9%) | 83 (39.2%) |
| Computers & Mathematics | 64 (74.4%) | 22 (25.6%) |
| Architecture & Engineering | 43 (86.0%) | 7 (14.0%) |
| Life, Physical & Social Science | 22 (28.9%) | 54 (71.1%) |
| Community & Social Service | 426 (33.6%) | 841 (66.4%) |
| Education, Arts & Media | 36 (20.8%) | 137 (79.2%) |
| Legal Services & Support | 21 (56.8%) | 16 (43.2%) |
| Education Instruction & Library | 320 (34.7%) | 601 (65.3%) |
| Arts, Media & Entertainment | 49 (36.0%) | 87 (64.0%) |
| Health Diagnosing & Treating | 104 (29.7%) | 246 (70.3%) |
| Health Technologists | 31 (14.2%) | 187 (85.8%) |
| Total (Category) | 909 (36.0%) | 1,614 (64.0%) |
| Total (Overall) | 3,245 (47.9%) | 3,523 (52.0%) |
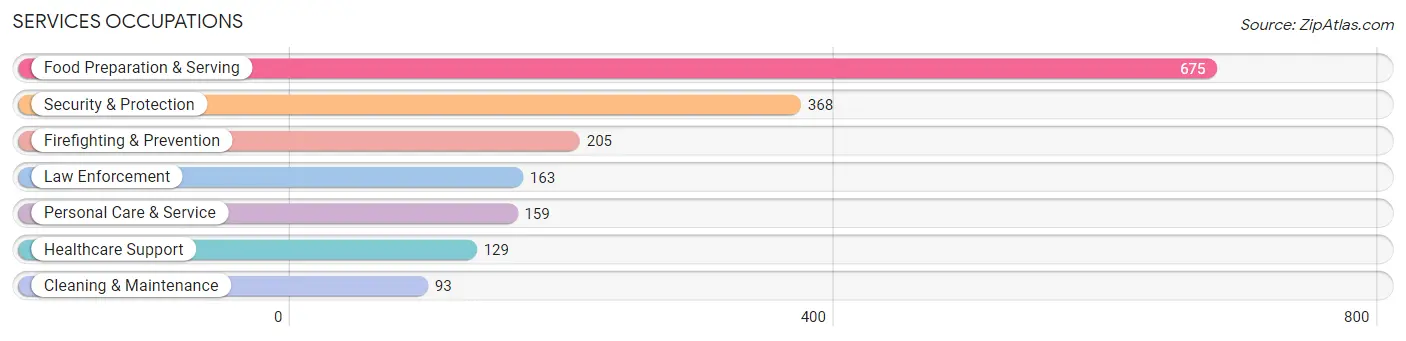
Services Occupations
The most common Services occupations in Macomb are Food Preparation & Serving (675 | 10.0%), Security & Protection (368 | 5.4%), Firefighting & Prevention (205 | 3.0%), Law Enforcement (163 | 2.4%), and Personal Care & Service (159 | 2.4%).
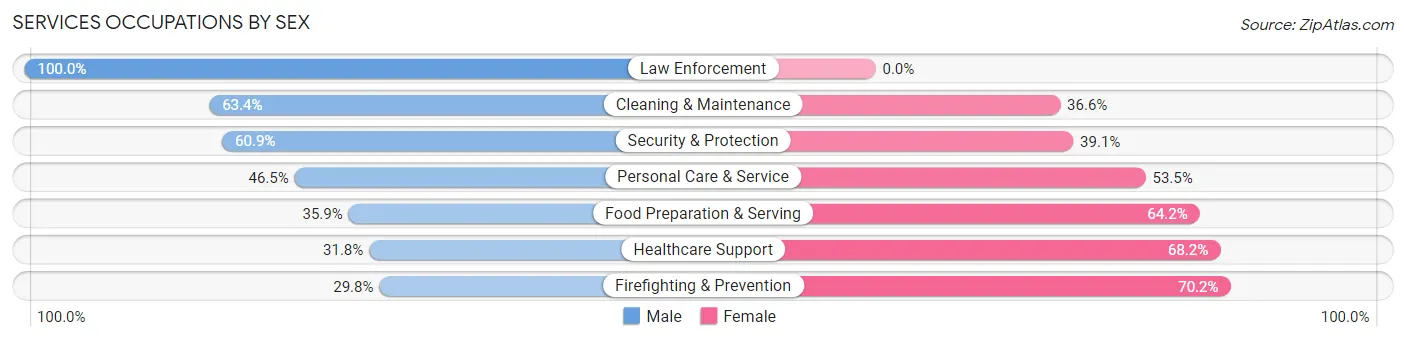
Services Occupations by Sex
Within the Services occupations in Macomb, the most male-oriented occupations are Law Enforcement (100.0%), Cleaning & Maintenance (63.4%), and Security & Protection (60.9%), while the most female-oriented occupations are Firefighting & Prevention (70.2%), Healthcare Support (68.2%), and Food Preparation & Serving (64.1%).
| Occupation | Male | Female |
| Healthcare Support | 41 (31.8%) | 88 (68.2%) |
| Security & Protection | 224 (60.9%) | 144 (39.1%) |
| Firefighting & Prevention | 61 (29.8%) | 144 (70.2%) |
| Law Enforcement | 163 (100.0%) | 0 (0.0%) |
| Food Preparation & Serving | 242 (35.8%) | 433 (64.1%) |
| Cleaning & Maintenance | 59 (63.4%) | 34 (36.6%) |
| Personal Care & Service | 74 (46.5%) | 85 (53.5%) |
| Total (Category) | 640 (44.9%) | 784 (55.1%) |
| Total (Overall) | 3,245 (47.9%) | 3,523 (52.0%) |
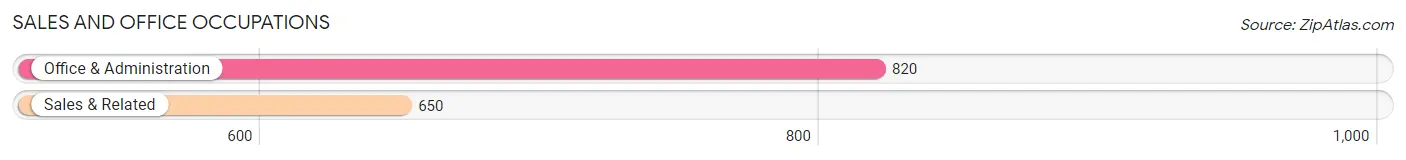
Sales and Office Occupations
The most common Sales and Office occupations in Macomb are Office & Administration (820 | 12.1%), and Sales & Related (650 | 9.6%).
Sales and Office Occupations by Sex
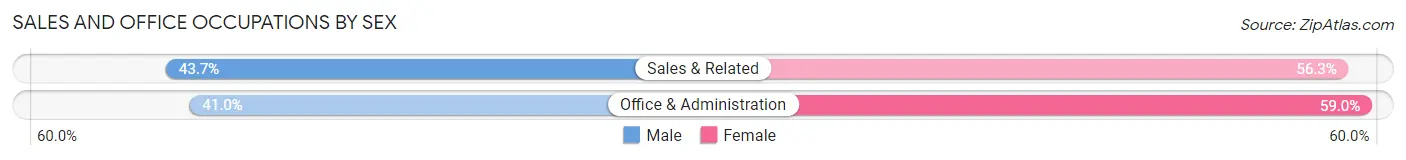
| Occupation | Male | Female |
| Sales & Related | 284 (43.7%) | 366 (56.3%) |
| Office & Administration | 336 (41.0%) | 484 (59.0%) |
| Total (Category) | 620 (42.2%) | 850 (57.8%) |
| Total (Overall) | 3,245 (47.9%) | 3,523 (52.0%) |
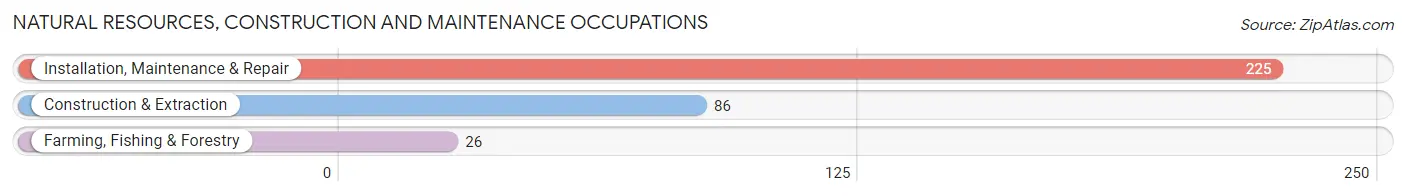
Natural Resources, Construction and Maintenance Occupations
The most common Natural Resources, Construction and Maintenance occupations in Macomb are Installation, Maintenance & Repair (225 | 3.3%), Construction & Extraction (86 | 1.3%), and Farming, Fishing & Forestry (26 | 0.4%).
Natural Resources, Construction and Maintenance Occupations by Sex
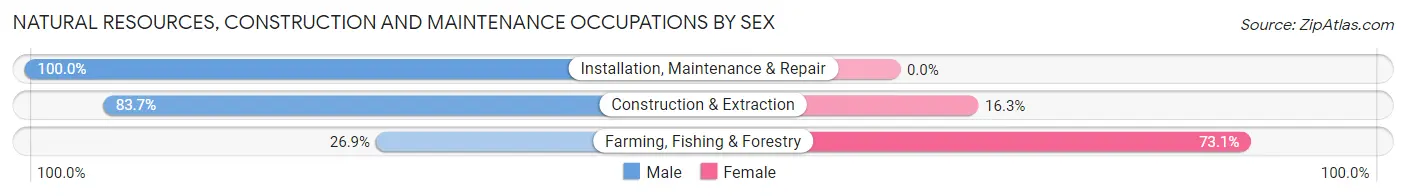
| Occupation | Male | Female |
| Farming, Fishing & Forestry | 7 (26.9%) | 19 (73.1%) |
| Construction & Extraction | 72 (83.7%) | 14 (16.3%) |
| Installation, Maintenance & Repair | 225 (100.0%) | 0 (0.0%) |
| Total (Category) | 304 (90.2%) | 33 (9.8%) |
| Total (Overall) | 3,245 (47.9%) | 3,523 (52.0%) |
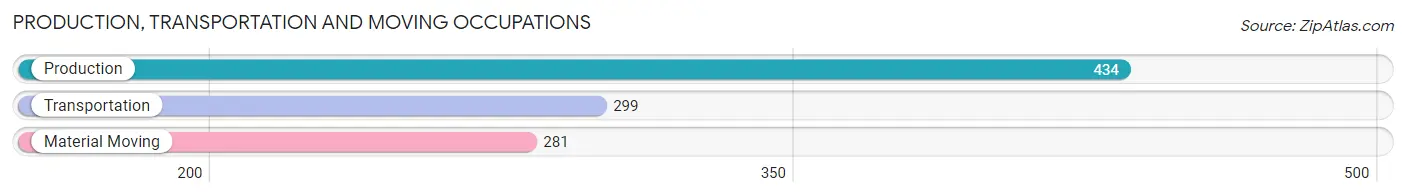
Production, Transportation and Moving Occupations
The most common Production, Transportation and Moving occupations in Macomb are Production (434 | 6.4%), Transportation (299 | 4.4%), and Material Moving (281 | 4.2%).
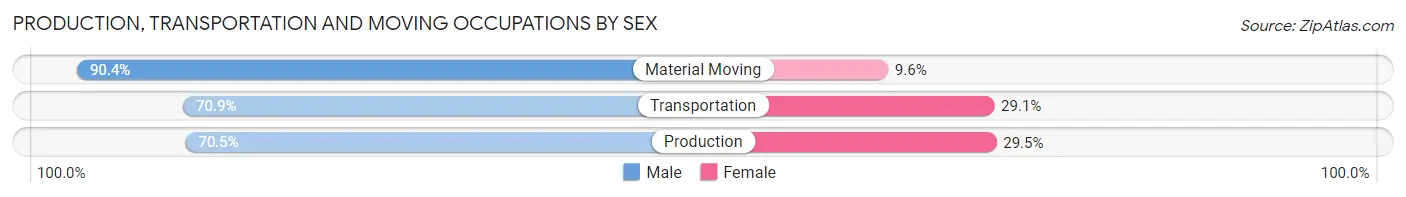
Production, Transportation and Moving Occupations by Sex
| Occupation | Male | Female |
| Production | 306 (70.5%) | 128 (29.5%) |
| Transportation | 212 (70.9%) | 87 (29.1%) |
| Material Moving | 254 (90.4%) | 27 (9.6%) |
| Total (Category) | 772 (76.1%) | 242 (23.9%) |
| Total (Overall) | 3,245 (47.9%) | 3,523 (52.0%) |
Employment Industries by Sex in Macomb
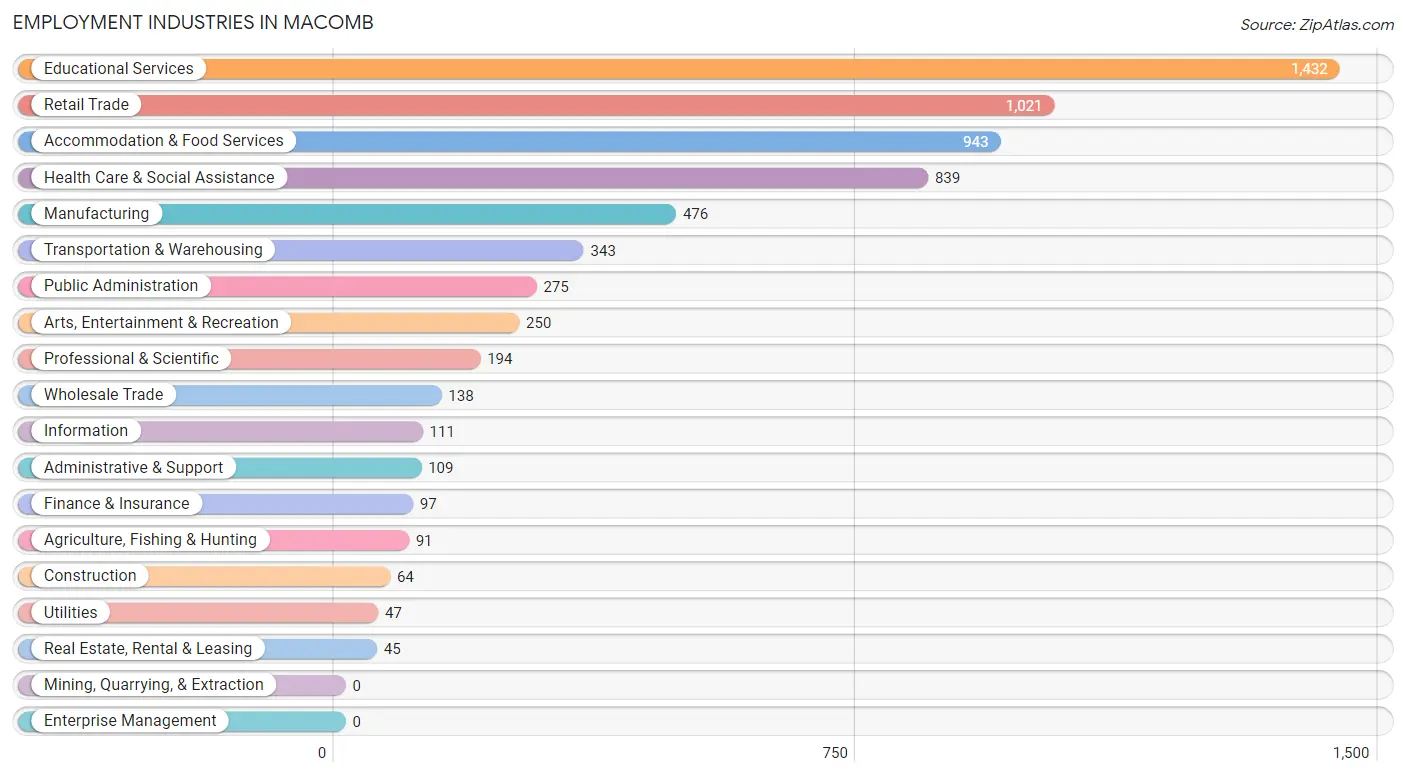
Employment Industries in Macomb
The major employment industries in Macomb include Educational Services (1,432 | 21.2%), Retail Trade (1,021 | 15.1%), Accommodation & Food Services (943 | 13.9%), Health Care & Social Assistance (839 | 12.4%), and Manufacturing (476 | 7.0%).
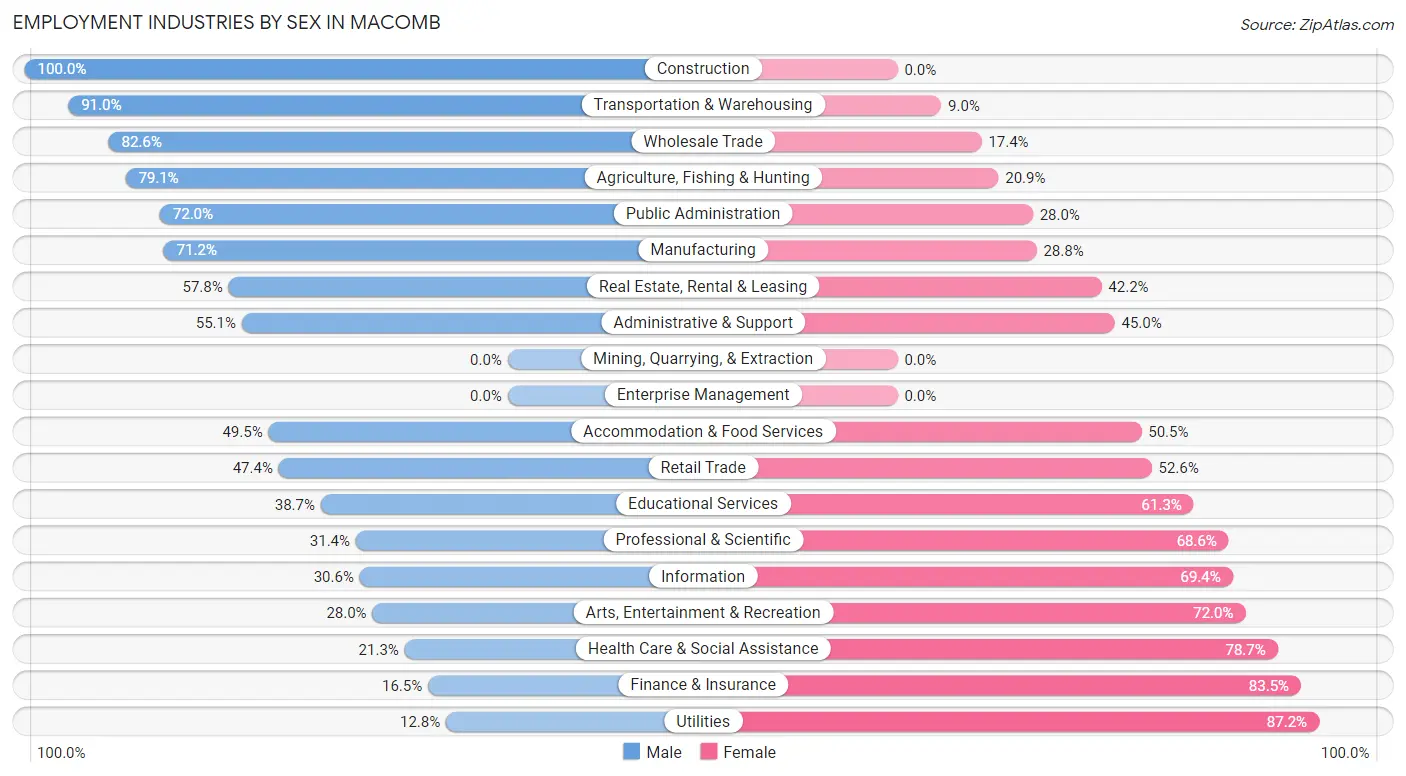
Employment Industries by Sex in Macomb
The Macomb industries that see more men than women are Construction (100.0%), Transportation & Warehousing (91.0%), and Wholesale Trade (82.6%), whereas the industries that tend to have a higher number of women are Utilities (87.2%), Finance & Insurance (83.5%), and Health Care & Social Assistance (78.7%).
| Industry | Male | Female |
| Agriculture, Fishing & Hunting | 72 (79.1%) | 19 (20.9%) |
| Mining, Quarrying, & Extraction | 0 (0.0%) | 0 (0.0%) |
| Construction | 64 (100.0%) | 0 (0.0%) |
| Manufacturing | 339 (71.2%) | 137 (28.8%) |
| Wholesale Trade | 114 (82.6%) | 24 (17.4%) |
| Retail Trade | 484 (47.4%) | 537 (52.6%) |
| Transportation & Warehousing | 312 (91.0%) | 31 (9.0%) |
| Utilities | 6 (12.8%) | 41 (87.2%) |
| Information | 34 (30.6%) | 77 (69.4%) |
| Finance & Insurance | 16 (16.5%) | 81 (83.5%) |
| Real Estate, Rental & Leasing | 26 (57.8%) | 19 (42.2%) |
| Professional & Scientific | 61 (31.4%) | 133 (68.6%) |
| Enterprise Management | 0 (0.0%) | 0 (0.0%) |
| Administrative & Support | 60 (55.0%) | 49 (45.0%) |
| Educational Services | 554 (38.7%) | 878 (61.3%) |
| Health Care & Social Assistance | 179 (21.3%) | 660 (78.7%) |
| Arts, Entertainment & Recreation | 70 (28.0%) | 180 (72.0%) |
| Accommodation & Food Services | 467 (49.5%) | 476 (50.5%) |
| Public Administration | 198 (72.0%) | 77 (28.0%) |
| Total | 3,245 (47.9%) | 3,523 (52.0%) |
Education in Macomb
School Enrollment in Macomb
The most common levels of schooling among the 6,326 students in Macomb are college / undergraduate (3,876 | 61.3%), middle school (713 | 11.3%), and elementary school (594 | 9.4%).
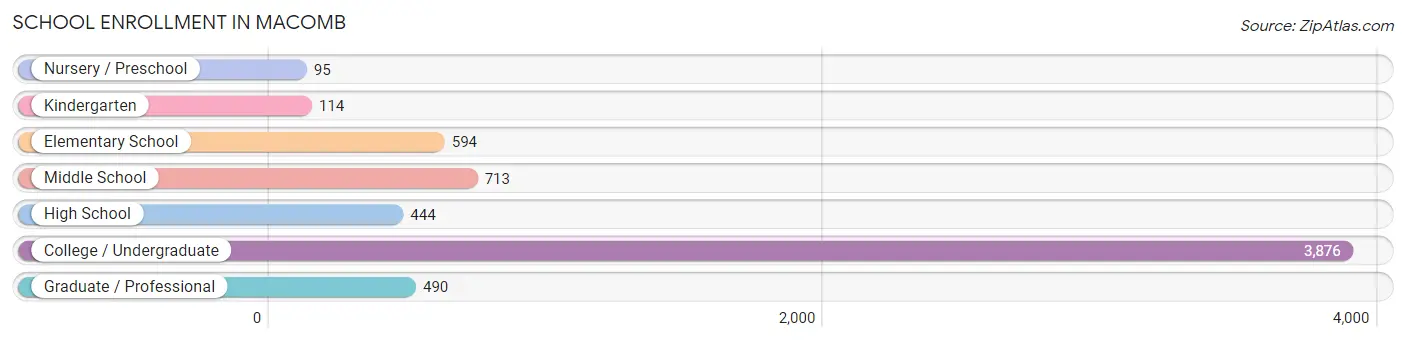
| School Level | # Students | % Students |
| Nursery / Preschool | 95 | 1.5% |
| Kindergarten | 114 | 1.8% |
| Elementary School | 594 | 9.4% |
| Middle School | 713 | 11.3% |
| High School | 444 | 7.0% |
| College / Undergraduate | 3,876 | 61.3% |
| Graduate / Professional | 490 | 7.7% |
| Total | 6,326 | 100.0% |
School Enrollment by Age by Funding Source in Macomb
Out of a total of 6,326 students who are enrolled in schools in Macomb, 487 (7.7%) attend a private institution, while the remaining 5,839 (92.3%) are enrolled in public schools. The age group of 3 to 4 year olds has the highest likelihood of being enrolled in private schools, with 62 (57.9% in the age bracket) enrolled. Conversely, the age group of 15 to 17 year olds has the lowest likelihood of being enrolled in a private school, with 371 (100.0% in the age bracket) attending a public institution.
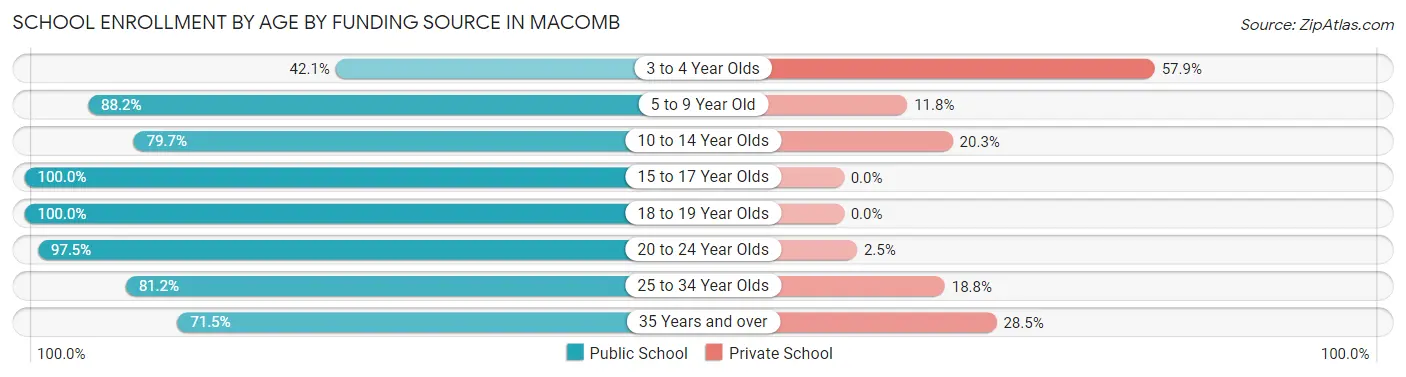
| Age Bracket | Public School | Private School |
| 3 to 4 Year Olds | 45 (42.1%) | 62 (57.9%) |
| 5 to 9 Year Old | 514 (88.2%) | 69 (11.8%) |
| 10 to 14 Year Olds | 691 (79.7%) | 176 (20.3%) |
| 15 to 17 Year Olds | 371 (100.0%) | 0 (0.0%) |
| 18 to 19 Year Olds | 1,468 (100.0%) | 0 (0.0%) |
| 20 to 24 Year Olds | 2,282 (97.5%) | 58 (2.5%) |
| 25 to 34 Year Olds | 379 (81.2%) | 88 (18.8%) |
| 35 Years and over | 88 (71.5%) | 35 (28.5%) |
| Total | 5,839 (92.3%) | 487 (7.7%) |
Educational Attainment by Field of Study in Macomb
Education (754 | 22.8%), business (371 | 11.2%), arts & humanities (359 | 10.8%), social sciences (254 | 7.7%), and psychology (230 | 7.0%) are the most common fields of study among 3,309 individuals in Macomb who have obtained a bachelor's degree or higher.
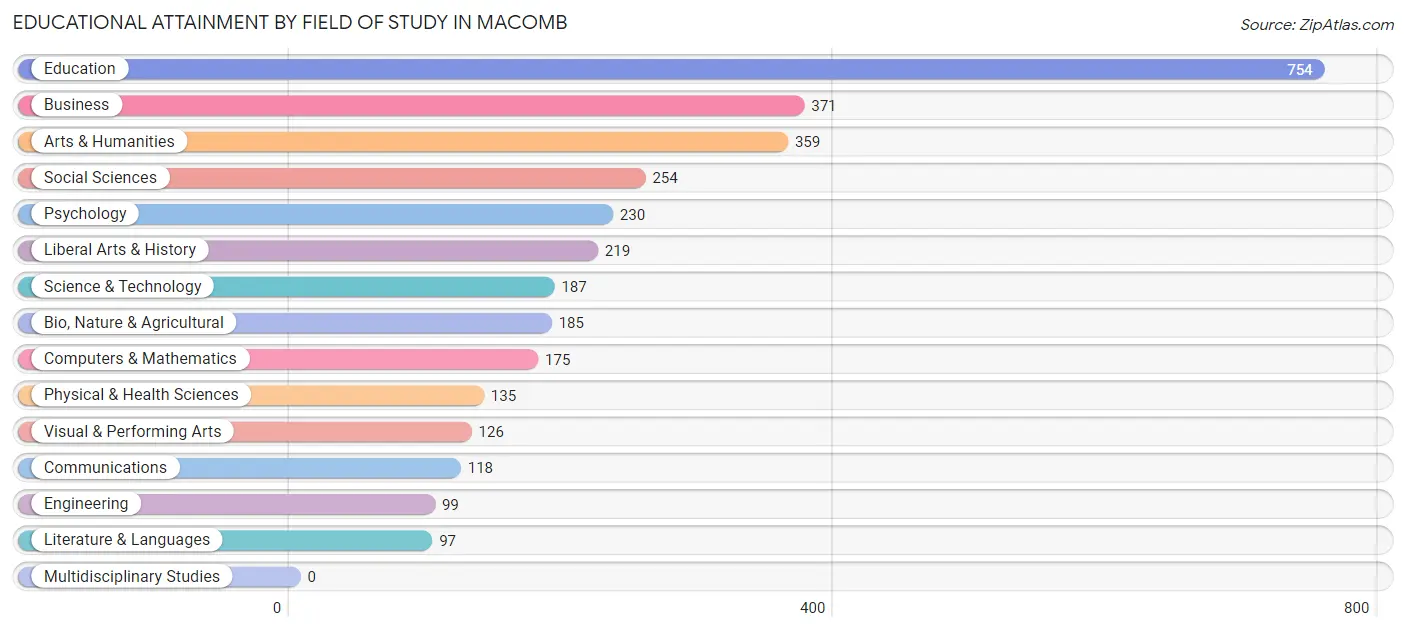
| Field of Study | # Graduates | % Graduates |
| Computers & Mathematics | 175 | 5.3% |
| Bio, Nature & Agricultural | 185 | 5.6% |
| Physical & Health Sciences | 135 | 4.1% |
| Psychology | 230 | 7.0% |
| Social Sciences | 254 | 7.7% |
| Engineering | 99 | 3.0% |
| Multidisciplinary Studies | 0 | 0.0% |
| Science & Technology | 187 | 5.7% |
| Business | 371 | 11.2% |
| Education | 754 | 22.8% |
| Literature & Languages | 97 | 2.9% |
| Liberal Arts & History | 219 | 6.6% |
| Visual & Performing Arts | 126 | 3.8% |
| Communications | 118 | 3.6% |
| Arts & Humanities | 359 | 10.8% |
| Total | 3,309 | 100.0% |
Transportation & Commute in Macomb
Vehicle Availability by Sex in Macomb
The most prevalent vehicle ownership categories in Macomb are males with 2 vehicles (1,112, accounting for 37.5%) and females with 2 vehicles (1,243, making up 36.0%).
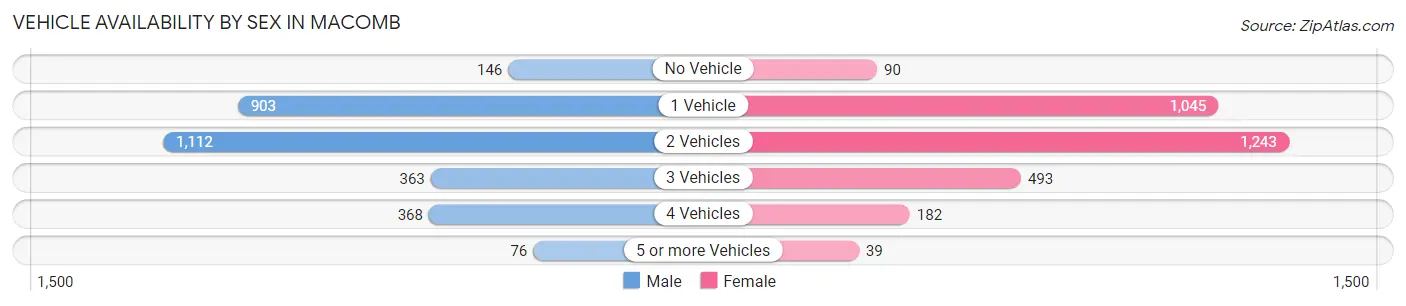
| Vehicles Available | Male | Female |
| No Vehicle | 146 (4.9%) | 90 (2.9%) |
| 1 Vehicle | 903 (30.4%) | 1,045 (33.8%) |
| 2 Vehicles | 1,112 (37.5%) | 1,243 (40.2%) |
| 3 Vehicles | 363 (12.2%) | 493 (15.9%) |
| 4 Vehicles | 368 (12.4%) | 182 (5.9%) |
| 5 or more Vehicles | 76 (2.6%) | 39 (1.3%) |
| Total | 2,968 (100.0%) | 3,092 (100.0%) |
Commute Time in Macomb
The most frequently occuring commute durations in Macomb are 5 to 9 minutes (2,243 commuters, 35.4%), 10 to 14 minutes (1,460 commuters, 23.1%), and less than 5 minutes (921 commuters, 14.5%).
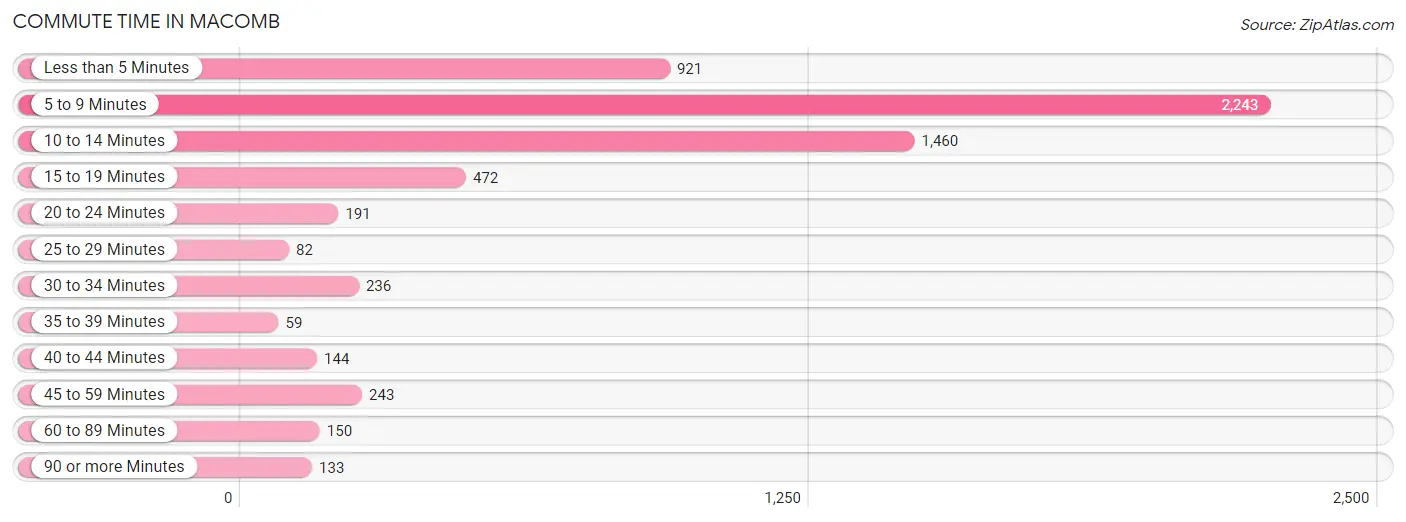
| Commute Time | # Commuters | % Commuters |
| Less than 5 Minutes | 921 | 14.5% |
| 5 to 9 Minutes | 2,243 | 35.4% |
| 10 to 14 Minutes | 1,460 | 23.1% |
| 15 to 19 Minutes | 472 | 7.4% |
| 20 to 24 Minutes | 191 | 3.0% |
| 25 to 29 Minutes | 82 | 1.3% |
| 30 to 34 Minutes | 236 | 3.7% |
| 35 to 39 Minutes | 59 | 0.9% |
| 40 to 44 Minutes | 144 | 2.3% |
| 45 to 59 Minutes | 243 | 3.8% |
| 60 to 89 Minutes | 150 | 2.4% |
| 90 or more Minutes | 133 | 2.1% |
Commute Time by Sex in Macomb
The most common commute times in Macomb are 5 to 9 minutes (1,060 commuters, 33.9%) for males and 5 to 9 minutes (1,183 commuters, 36.9%) for females.
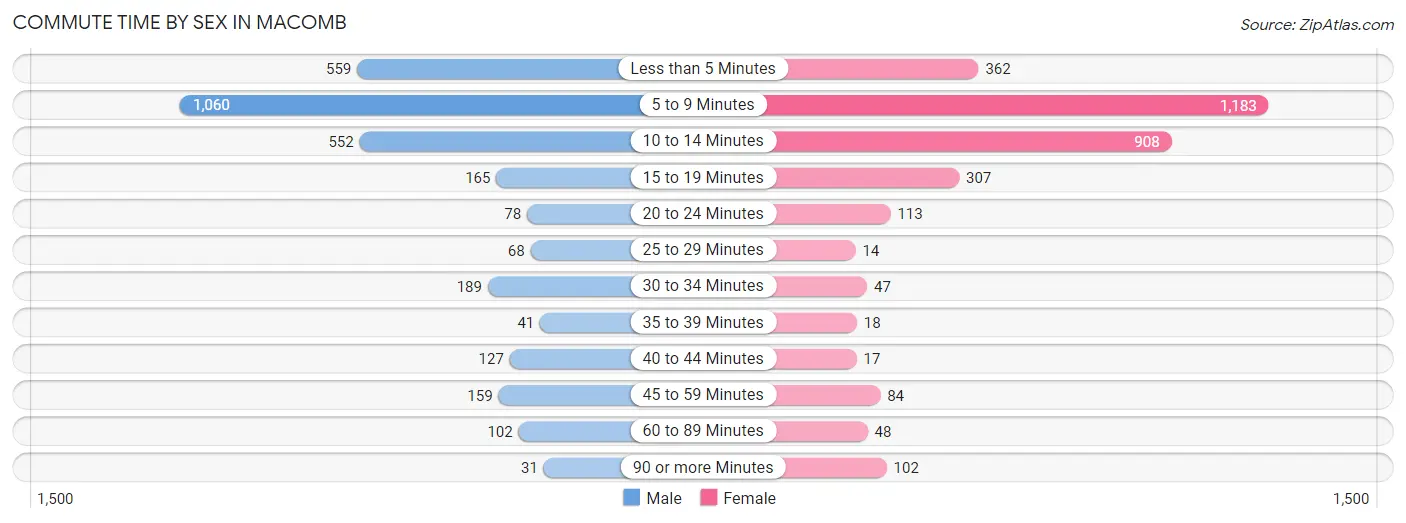
| Commute Time | Male | Female |
| Less than 5 Minutes | 559 (17.8%) | 362 (11.3%) |
| 5 to 9 Minutes | 1,060 (33.9%) | 1,183 (36.9%) |
| 10 to 14 Minutes | 552 (17.6%) | 908 (28.3%) |
| 15 to 19 Minutes | 165 (5.3%) | 307 (9.6%) |
| 20 to 24 Minutes | 78 (2.5%) | 113 (3.5%) |
| 25 to 29 Minutes | 68 (2.2%) | 14 (0.4%) |
| 30 to 34 Minutes | 189 (6.0%) | 47 (1.5%) |
| 35 to 39 Minutes | 41 (1.3%) | 18 (0.6%) |
| 40 to 44 Minutes | 127 (4.1%) | 17 (0.5%) |
| 45 to 59 Minutes | 159 (5.1%) | 84 (2.6%) |
| 60 to 89 Minutes | 102 (3.3%) | 48 (1.5%) |
| 90 or more Minutes | 31 (1.0%) | 102 (3.2%) |
Time of Departure to Work by Sex in Macomb
The most frequent times of departure to work in Macomb are 12:00 PM to 3:59 PM (655, 20.9%) for males and 7:30 AM to 7:59 AM (571, 17.8%) for females.
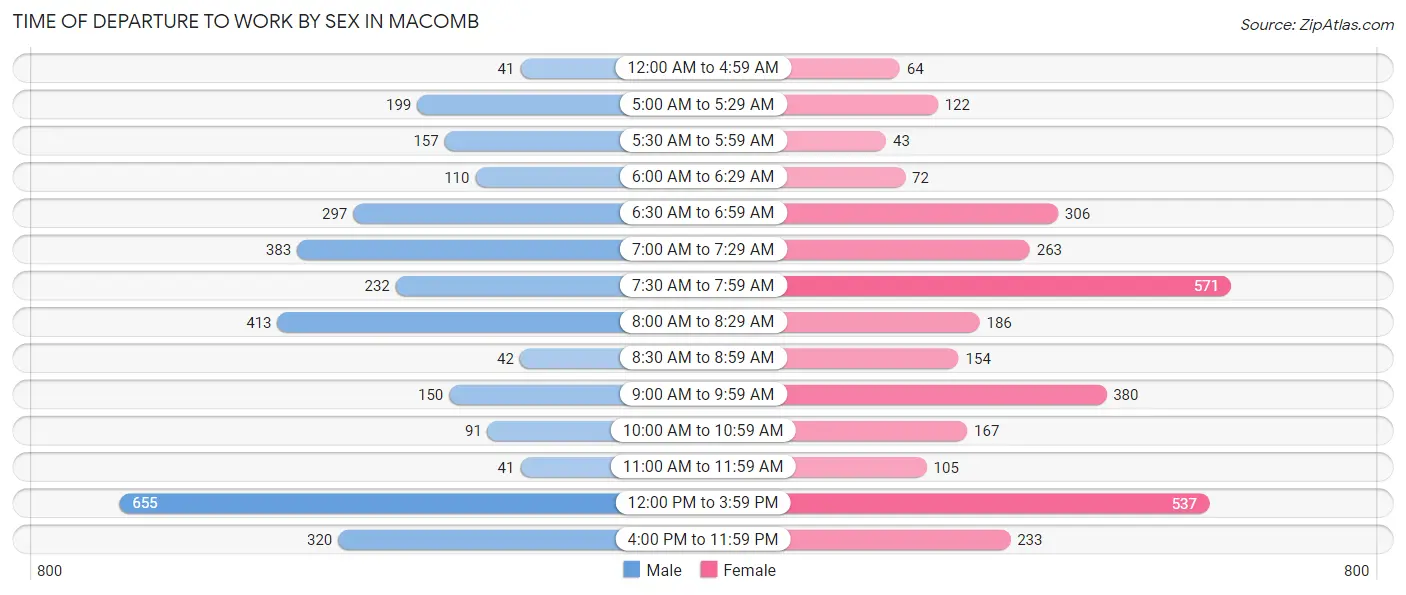
| Time of Departure | Male | Female |
| 12:00 AM to 4:59 AM | 41 (1.3%) | 64 (2.0%) |
| 5:00 AM to 5:29 AM | 199 (6.4%) | 122 (3.8%) |
| 5:30 AM to 5:59 AM | 157 (5.0%) | 43 (1.3%) |
| 6:00 AM to 6:29 AM | 110 (3.5%) | 72 (2.2%) |
| 6:30 AM to 6:59 AM | 297 (9.5%) | 306 (9.6%) |
| 7:00 AM to 7:29 AM | 383 (12.2%) | 263 (8.2%) |
| 7:30 AM to 7:59 AM | 232 (7.4%) | 571 (17.8%) |
| 8:00 AM to 8:29 AM | 413 (13.2%) | 186 (5.8%) |
| 8:30 AM to 8:59 AM | 42 (1.3%) | 154 (4.8%) |
| 9:00 AM to 9:59 AM | 150 (4.8%) | 380 (11.9%) |
| 10:00 AM to 10:59 AM | 91 (2.9%) | 167 (5.2%) |
| 11:00 AM to 11:59 AM | 41 (1.3%) | 105 (3.3%) |
| 12:00 PM to 3:59 PM | 655 (20.9%) | 537 (16.8%) |
| 4:00 PM to 11:59 PM | 320 (10.2%) | 233 (7.3%) |
| Total | 3,131 (100.0%) | 3,203 (100.0%) |
Housing Occupancy in Macomb
Occupancy by Ownership in Macomb
Of the total 6,203 dwellings in Macomb, owner-occupied units account for 2,816 (45.4%), while renter-occupied units make up 3,387 (54.6%).
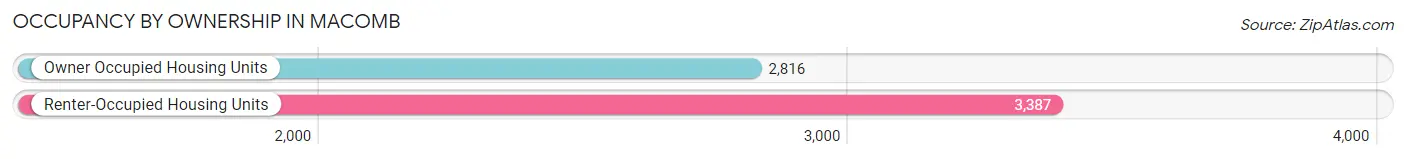
| Occupancy | # Housing Units | % Housing Units |
| Owner Occupied Housing Units | 2,816 | 45.4% |
| Renter-Occupied Housing Units | 3,387 | 54.6% |
| Total Occupied Housing Units | 6,203 | 100.0% |
Occupancy by Household Size in Macomb
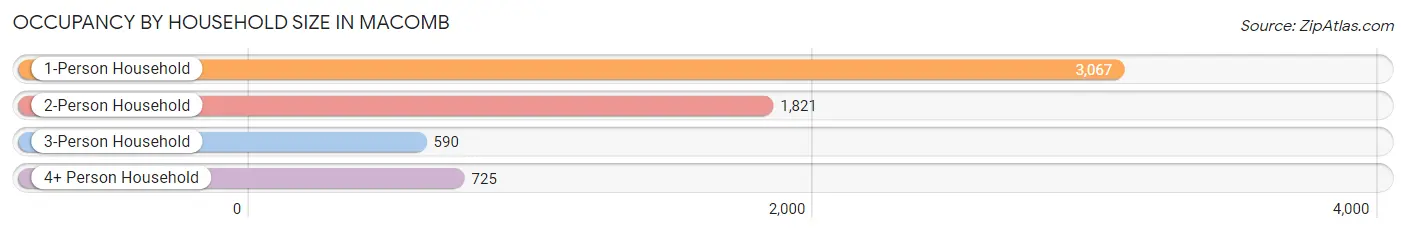
| Household Size | # Housing Units | % Housing Units |
| 1-Person Household | 3,067 | 49.4% |
| 2-Person Household | 1,821 | 29.4% |
| 3-Person Household | 590 | 9.5% |
| 4+ Person Household | 725 | 11.7% |
| Total Housing Units | 6,203 | 100.0% |
Occupancy by Ownership by Household Size in Macomb
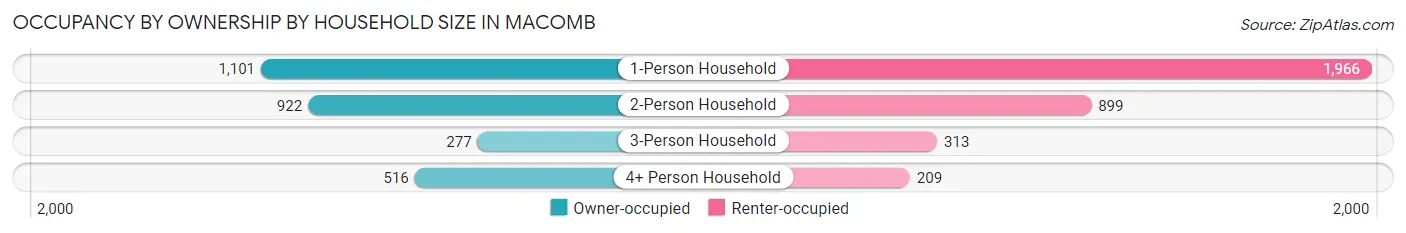
| Household Size | Owner-occupied | Renter-occupied |
| 1-Person Household | 1,101 (35.9%) | 1,966 (64.1%) |
| 2-Person Household | 922 (50.6%) | 899 (49.4%) |
| 3-Person Household | 277 (46.9%) | 313 (53.0%) |
| 4+ Person Household | 516 (71.2%) | 209 (28.8%) |
| Total Housing Units | 2,816 (45.4%) | 3,387 (54.6%) |
Occupancy by Educational Attainment in Macomb
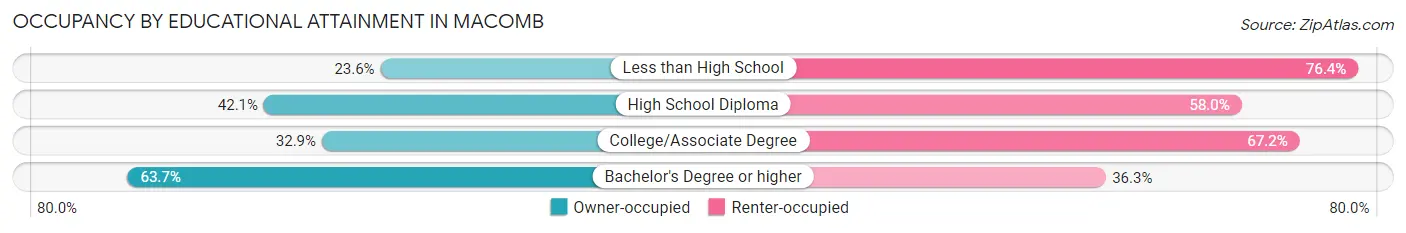
| Household Size | Owner-occupied | Renter-occupied |
| Less than High School | 86 (23.6%) | 279 (76.4%) |
| High School Diploma | 595 (42.0%) | 820 (58.0%) |
| College/Associate Degree | 726 (32.9%) | 1,484 (67.1%) |
| Bachelor's Degree or higher | 1,409 (63.7%) | 804 (36.3%) |
Occupancy by Age of Householder in Macomb
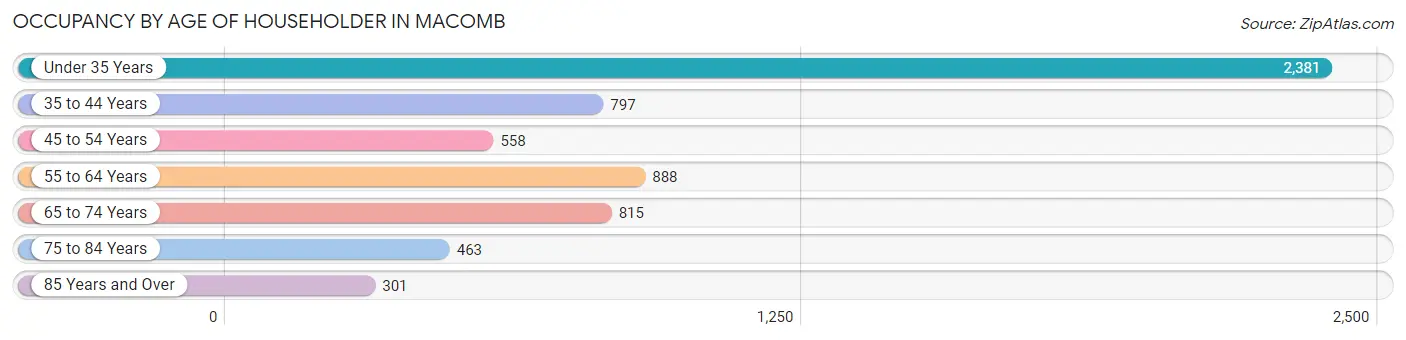
| Age Bracket | # Households | % Households |
| Under 35 Years | 2,381 | 38.4% |
| 35 to 44 Years | 797 | 12.9% |
| 45 to 54 Years | 558 | 9.0% |
| 55 to 64 Years | 888 | 14.3% |
| 65 to 74 Years | 815 | 13.1% |
| 75 to 84 Years | 463 | 7.5% |
| 85 Years and Over | 301 | 4.9% |
| Total | 6,203 | 100.0% |
Housing Finances in Macomb
Median Income by Occupancy in Macomb
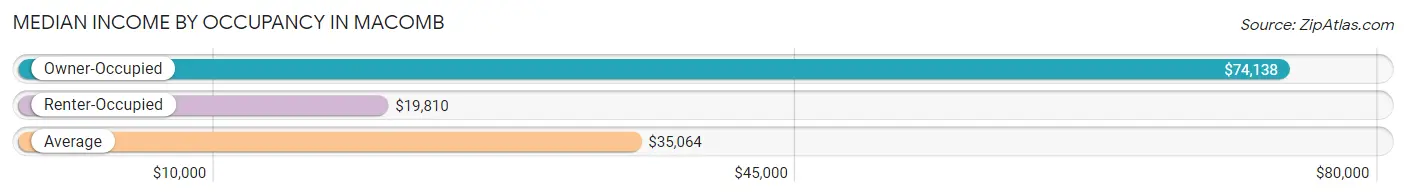
| Occupancy Type | # Households | Median Income |
| Owner-Occupied | 2,816 (45.4%) | $74,138 |
| Renter-Occupied | 3,387 (54.6%) | $19,810 |
| Average | 6,203 (100.0%) | $35,064 |
Occupancy by Householder Income Bracket in Macomb
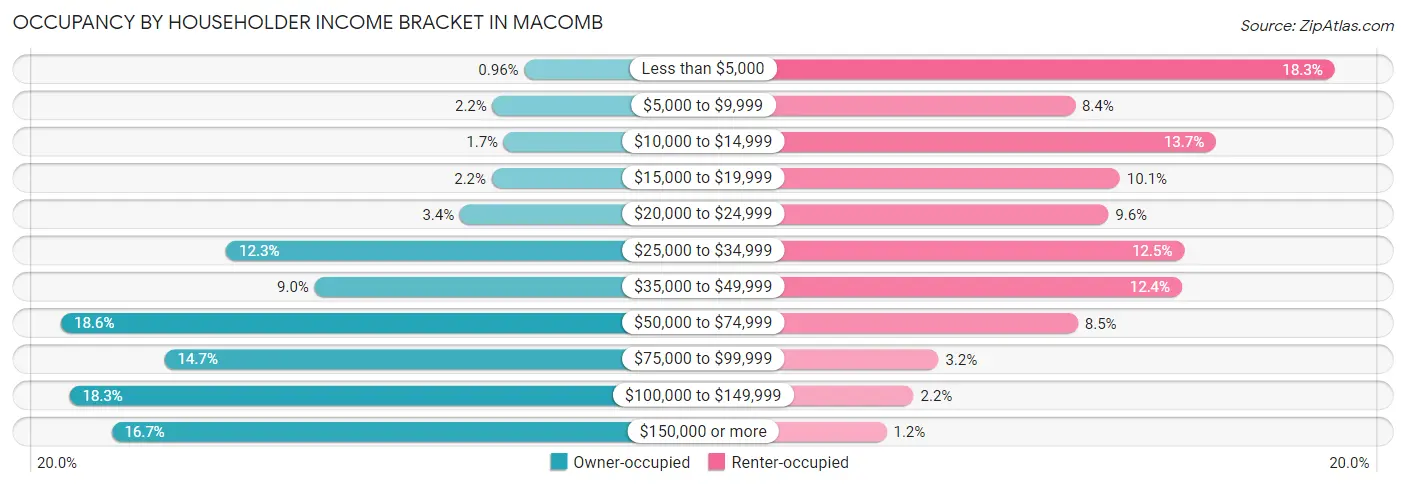
| Income Bracket | Owner-occupied | Renter-occupied |
| Less than $5,000 | 27 (1.0%) | 618 (18.2%) |
| $5,000 to $9,999 | 61 (2.2%) | 283 (8.4%) |
| $10,000 to $14,999 | 49 (1.7%) | 465 (13.7%) |
| $15,000 to $19,999 | 62 (2.2%) | 341 (10.1%) |
| $20,000 to $24,999 | 96 (3.4%) | 326 (9.6%) |
| $25,000 to $34,999 | 347 (12.3%) | 424 (12.5%) |
| $35,000 to $49,999 | 252 (8.9%) | 421 (12.4%) |
| $50,000 to $74,999 | 524 (18.6%) | 287 (8.5%) |
| $75,000 to $99,999 | 413 (14.7%) | 107 (3.2%) |
| $100,000 to $149,999 | 515 (18.3%) | 75 (2.2%) |
| $150,000 or more | 470 (16.7%) | 40 (1.2%) |
| Total | 2,816 (100.0%) | 3,387 (100.0%) |
Monthly Housing Cost Tiers in Macomb
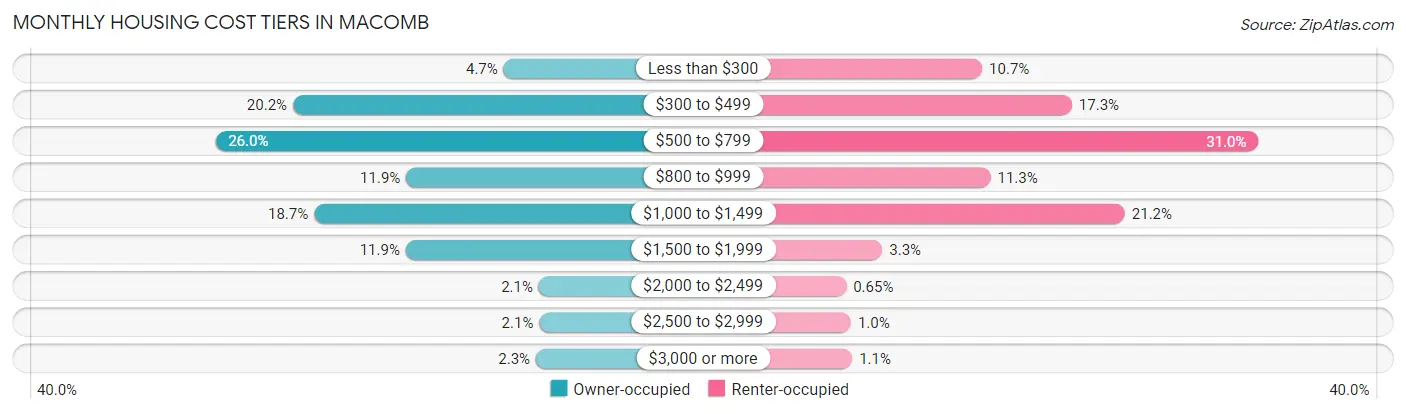
| Monthly Cost | Owner-occupied | Renter-occupied |
| Less than $300 | 133 (4.7%) | 361 (10.7%) |
| $300 to $499 | 570 (20.2%) | 585 (17.3%) |
| $500 to $799 | 731 (26.0%) | 1,050 (31.0%) |
| $800 to $999 | 335 (11.9%) | 382 (11.3%) |
| $1,000 to $1,499 | 526 (18.7%) | 717 (21.2%) |
| $1,500 to $1,999 | 336 (11.9%) | 112 (3.3%) |
| $2,000 to $2,499 | 60 (2.1%) | 22 (0.6%) |
| $2,500 to $2,999 | 59 (2.1%) | 34 (1.0%) |
| $3,000 or more | 66 (2.3%) | 37 (1.1%) |
| Total | 2,816 (100.0%) | 3,387 (100.0%) |
Physical Housing Characteristics in Macomb
Housing Structures in Macomb
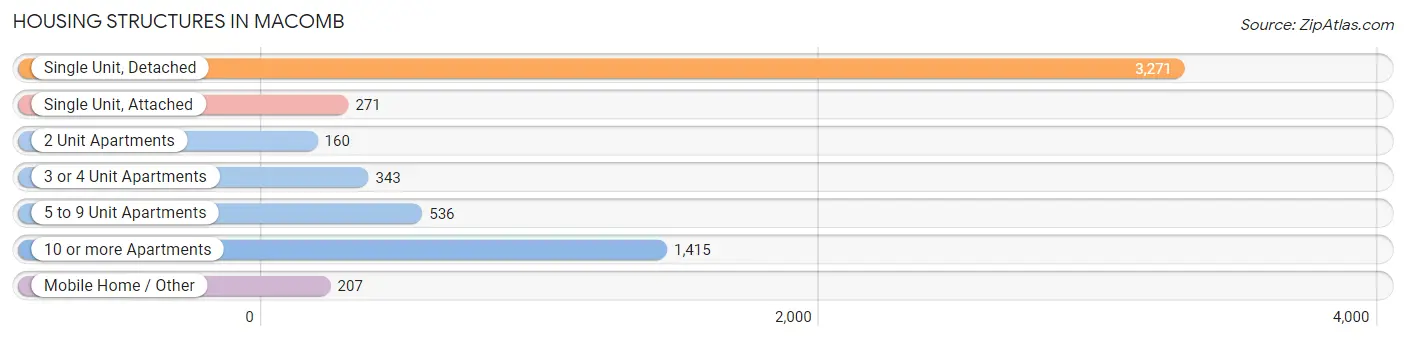
| Structure Type | # Housing Units | % Housing Units |
| Single Unit, Detached | 3,271 | 52.7% |
| Single Unit, Attached | 271 | 4.4% |
| 2 Unit Apartments | 160 | 2.6% |
| 3 or 4 Unit Apartments | 343 | 5.5% |
| 5 to 9 Unit Apartments | 536 | 8.6% |
| 10 or more Apartments | 1,415 | 22.8% |
| Mobile Home / Other | 207 | 3.3% |
| Total | 6,203 | 100.0% |
Housing Structures by Occupancy in Macomb
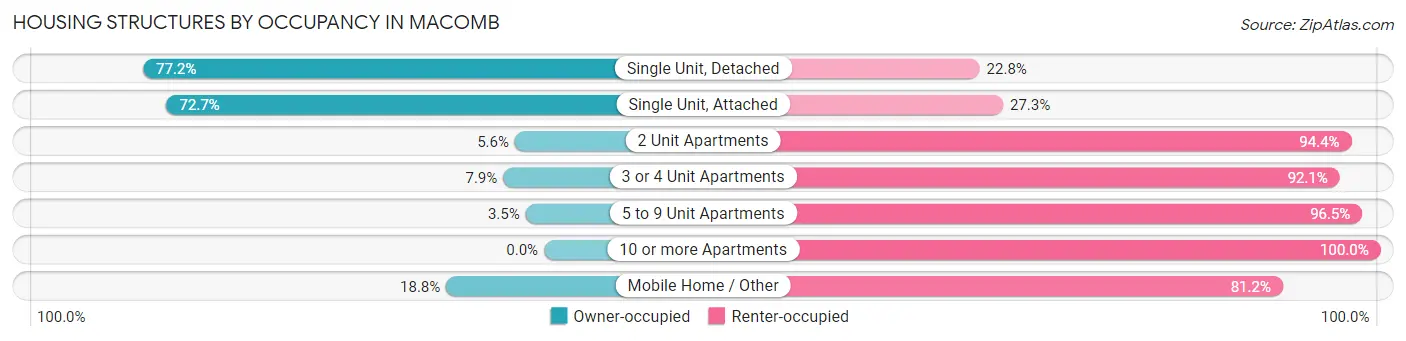
| Structure Type | Owner-occupied | Renter-occupied |
| Single Unit, Detached | 2,525 (77.2%) | 746 (22.8%) |
| Single Unit, Attached | 197 (72.7%) | 74 (27.3%) |
| 2 Unit Apartments | 9 (5.6%) | 151 (94.4%) |
| 3 or 4 Unit Apartments | 27 (7.9%) | 316 (92.1%) |
| 5 to 9 Unit Apartments | 19 (3.5%) | 517 (96.5%) |
| 10 or more Apartments | 0 (0.0%) | 1,415 (100.0%) |
| Mobile Home / Other | 39 (18.8%) | 168 (81.2%) |
| Total | 2,816 (45.4%) | 3,387 (54.6%) |
Housing Structures by Number of Rooms in Macomb
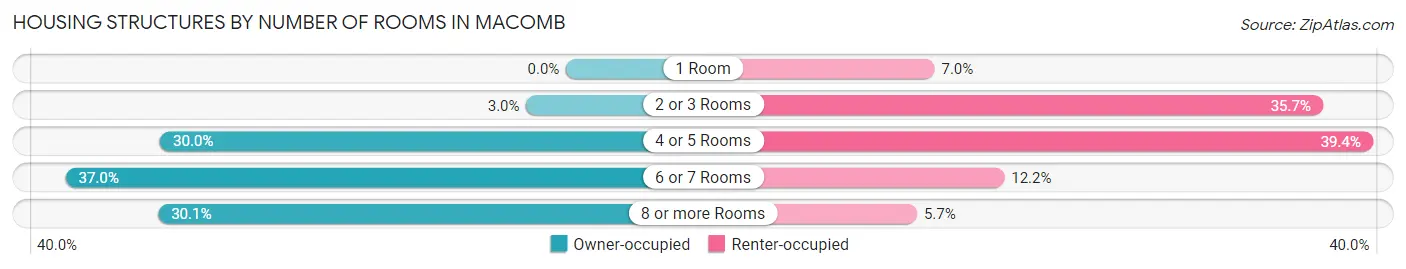
| Number of Rooms | Owner-occupied | Renter-occupied |
| 1 Room | 0 (0.0%) | 237 (7.0%) |
| 2 or 3 Rooms | 83 (2.9%) | 1,210 (35.7%) |
| 4 or 5 Rooms | 844 (30.0%) | 1,335 (39.4%) |
| 6 or 7 Rooms | 1,041 (37.0%) | 412 (12.2%) |
| 8 or more Rooms | 848 (30.1%) | 193 (5.7%) |
| Total | 2,816 (100.0%) | 3,387 (100.0%) |
Housing Structure by Heating Type in Macomb
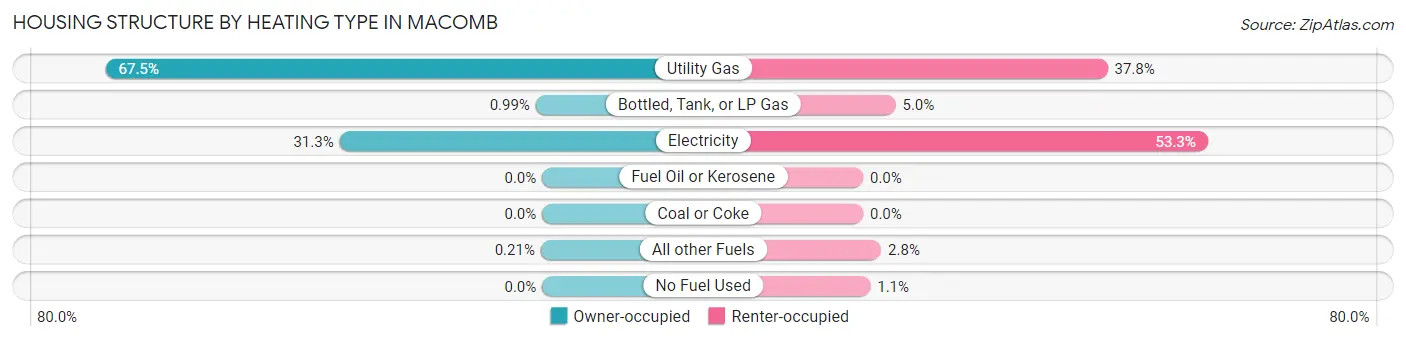
| Heating Type | Owner-occupied | Renter-occupied |
| Utility Gas | 1,900 (67.5%) | 1,280 (37.8%) |
| Bottled, Tank, or LP Gas | 28 (1.0%) | 170 (5.0%) |
| Electricity | 882 (31.3%) | 1,804 (53.3%) |
| Fuel Oil or Kerosene | 0 (0.0%) | 0 (0.0%) |
| Coal or Coke | 0 (0.0%) | 0 (0.0%) |
| All other Fuels | 6 (0.2%) | 95 (2.8%) |
| No Fuel Used | 0 (0.0%) | 38 (1.1%) |
| Total | 2,816 (100.0%) | 3,387 (100.0%) |
Household Vehicle Usage in Macomb
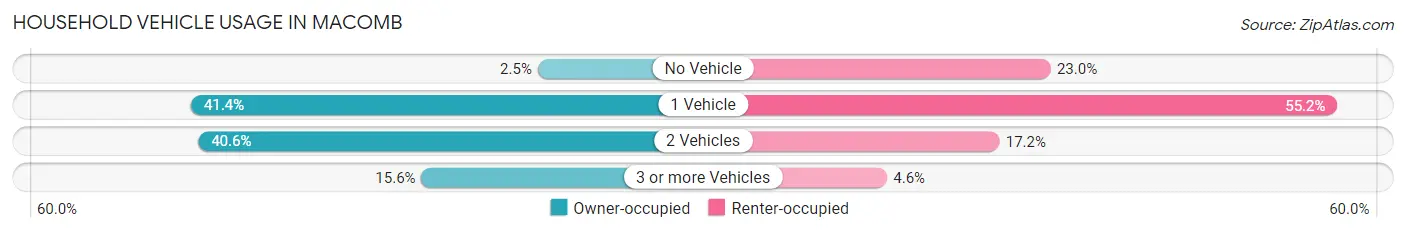
| Vehicles per Household | Owner-occupied | Renter-occupied |
| No Vehicle | 71 (2.5%) | 778 (23.0%) |
| 1 Vehicle | 1,165 (41.4%) | 1,868 (55.1%) |
| 2 Vehicles | 1,142 (40.6%) | 584 (17.2%) |
| 3 or more Vehicles | 438 (15.5%) | 157 (4.6%) |
| Total | 2,816 (100.0%) | 3,387 (100.0%) |
Real Estate & Mortgages in Macomb
Real Estate and Mortgage Overview in Macomb
| Characteristic | Without Mortgage | With Mortgage |
| Housing Units | 1,307 | 1,509 |
| Median Property Value | $99,900 | $108,200 |
| Median Household Income | $64,967 | $324 |
| Monthly Housing Costs | $494 | $66 |
| Real Estate Taxes | $2,774 | $30 |
Property Value by Mortgage Status in Macomb
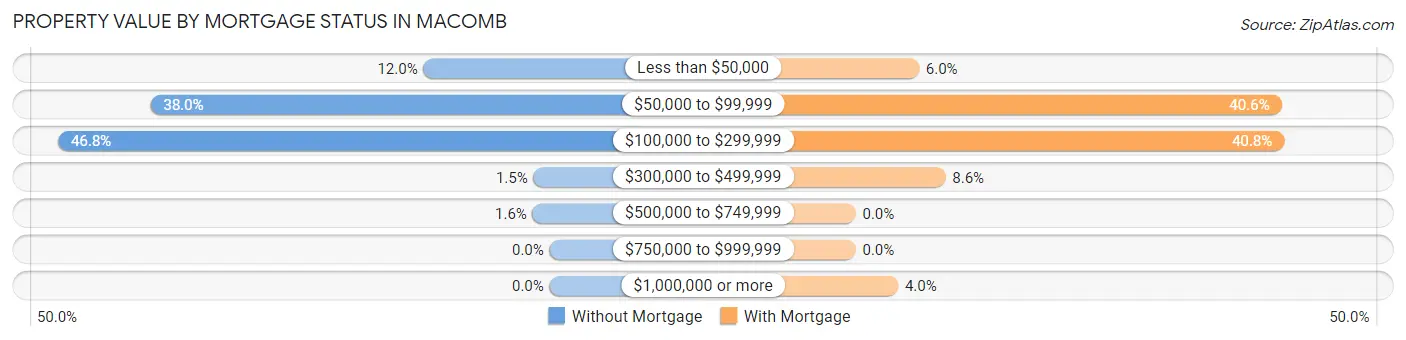
| Property Value | Without Mortgage | With Mortgage |
| Less than $50,000 | 157 (12.0%) | 91 (6.0%) |
| $50,000 to $99,999 | 497 (38.0%) | 612 (40.6%) |
| $100,000 to $299,999 | 612 (46.8%) | 616 (40.8%) |
| $300,000 to $499,999 | 20 (1.5%) | 129 (8.6%) |
| $500,000 to $749,999 | 21 (1.6%) | 0 (0.0%) |
| $750,000 to $999,999 | 0 (0.0%) | 0 (0.0%) |
| $1,000,000 or more | 0 (0.0%) | 61 (4.0%) |
| Total | 1,307 (100.0%) | 1,509 (100.0%) |
Household Income by Mortgage Status in Macomb
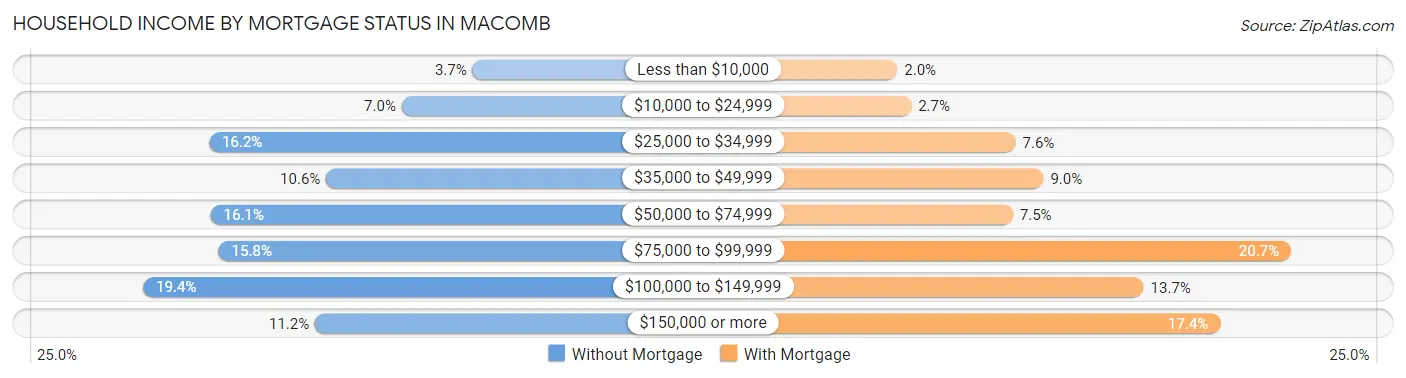
| Household Income | Without Mortgage | With Mortgage |
| Less than $10,000 | 48 (3.7%) | 30 (2.0%) |
| $10,000 to $24,999 | 92 (7.0%) | 40 (2.6%) |
| $25,000 to $34,999 | 212 (16.2%) | 115 (7.6%) |
| $35,000 to $49,999 | 139 (10.6%) | 135 (8.9%) |
| $50,000 to $74,999 | 211 (16.1%) | 113 (7.5%) |
| $75,000 to $99,999 | 206 (15.8%) | 313 (20.7%) |
| $100,000 to $149,999 | 253 (19.4%) | 207 (13.7%) |
| $150,000 or more | 146 (11.2%) | 262 (17.4%) |
| Total | 1,307 (100.0%) | 1,509 (100.0%) |
Property Value to Household Income Ratio in Macomb
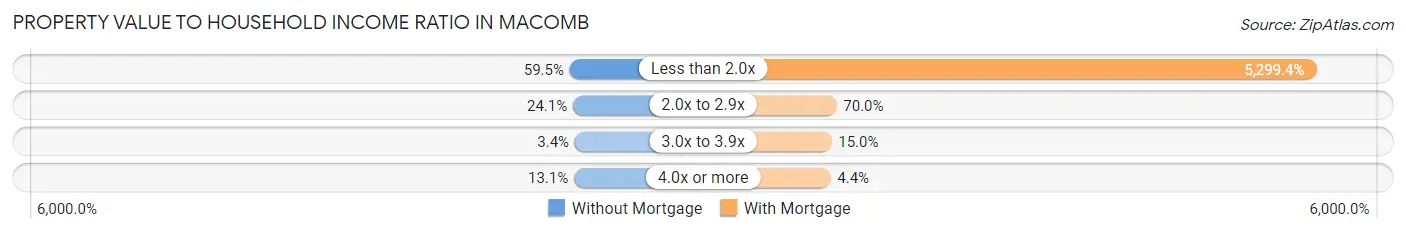
| Value-to-Income Ratio | Without Mortgage | With Mortgage |
| Less than 2.0x | 777 (59.5%) | 79,968 (5,299.4%) |
| 2.0x to 2.9x | 315 (24.1%) | 1,056 (70.0%) |
| 3.0x to 3.9x | 44 (3.4%) | 226 (15.0%) |
| 4.0x or more | 171 (13.1%) | 67 (4.4%) |
| Total | 1,307 (100.0%) | 1,509 (100.0%) |
Real Estate Taxes by Mortgage Status in Macomb
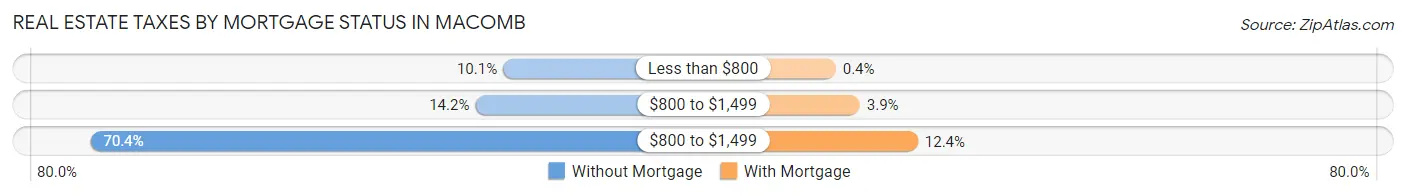
| Property Taxes | Without Mortgage | With Mortgage |
| Less than $800 | 132 (10.1%) | 6 (0.4%) |
| $800 to $1,499 | 185 (14.1%) | 59 (3.9%) |
| $800 to $1,499 | 920 (70.4%) | 187 (12.4%) |
| Total | 1,307 (100.0%) | 1,509 (100.0%) |
Health & Disability in Macomb
Health Insurance Coverage by Age in Macomb
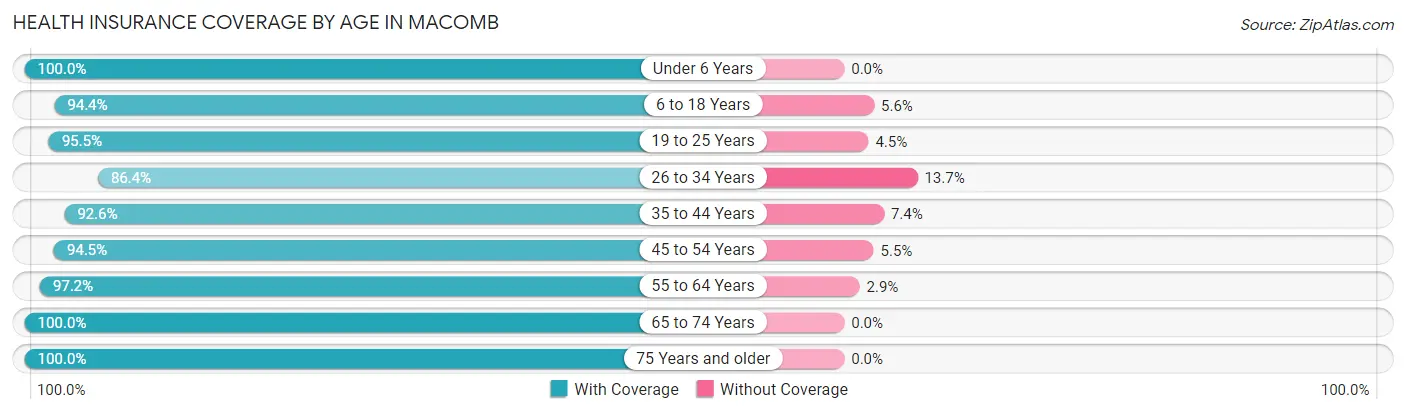
| Age Bracket | With Coverage | Without Coverage |
| Under 6 Years | 546 (100.0%) | 0 (0.0%) |
| 6 to 18 Years | 2,393 (94.4%) | 141 (5.6%) |
| 19 to 25 Years | 3,976 (95.5%) | 188 (4.5%) |
| 26 to 34 Years | 1,341 (86.4%) | 212 (13.7%) |
| 35 to 44 Years | 1,388 (92.6%) | 111 (7.4%) |
| 45 to 54 Years | 987 (94.5%) | 57 (5.5%) |
| 55 to 64 Years | 1,259 (97.2%) | 37 (2.9%) |
| 65 to 74 Years | 1,236 (100.0%) | 0 (0.0%) |
| 75 Years and older | 964 (100.0%) | 0 (0.0%) |
| Total | 14,090 (95.0%) | 746 (5.0%) |
Health Insurance Coverage by Citizenship Status in Macomb
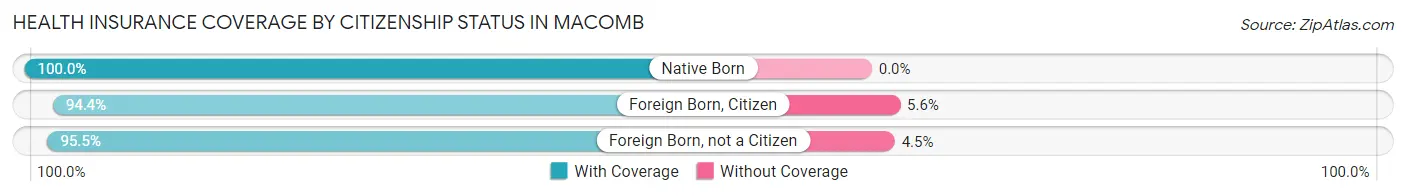
| Citizenship Status | With Coverage | Without Coverage |
| Native Born | 546 (100.0%) | 0 (0.0%) |
| Foreign Born, Citizen | 2,393 (94.4%) | 141 (5.6%) |
| Foreign Born, not a Citizen | 3,976 (95.5%) | 188 (4.5%) |
Health Insurance Coverage by Household Income in Macomb
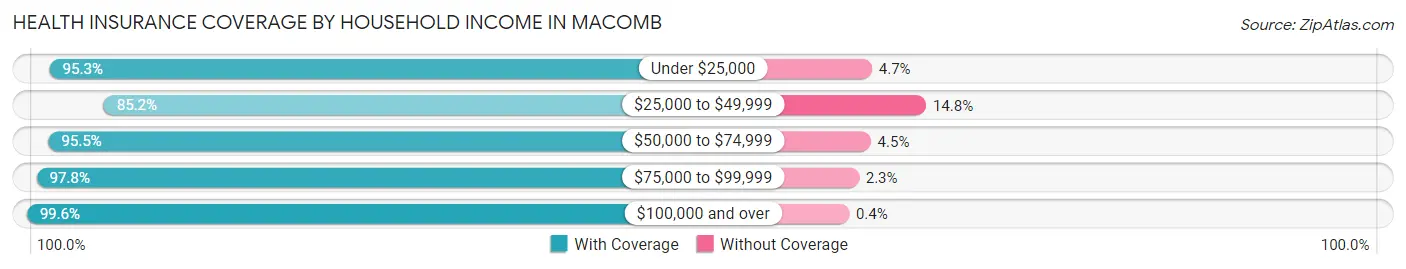
| Household Income | With Coverage | Without Coverage |
| Under $25,000 | 3,444 (95.3%) | 170 (4.7%) |
| $25,000 to $49,999 | 2,157 (85.2%) | 376 (14.8%) |
| $50,000 to $74,999 | 1,602 (95.5%) | 75 (4.5%) |
| $75,000 to $99,999 | 1,174 (97.8%) | 27 (2.2%) |
| $100,000 and over | 3,517 (99.6%) | 14 (0.4%) |
Public vs Private Health Insurance Coverage by Age in Macomb
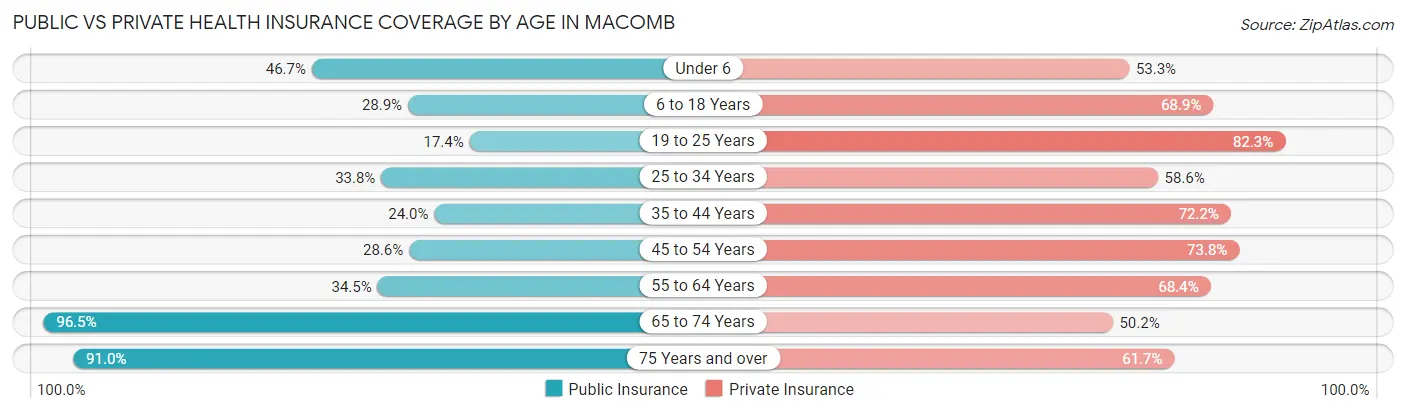
| Age Bracket | Public Insurance | Private Insurance |
| Under 6 | 255 (46.7%) | 291 (53.3%) |
| 6 to 18 Years | 731 (28.8%) | 1,747 (68.9%) |
| 19 to 25 Years | 725 (17.4%) | 3,426 (82.3%) |
| 25 to 34 Years | 525 (33.8%) | 910 (58.6%) |
| 35 to 44 Years | 359 (23.9%) | 1,082 (72.2%) |
| 45 to 54 Years | 299 (28.6%) | 770 (73.8%) |
| 55 to 64 Years | 447 (34.5%) | 887 (68.4%) |
| 65 to 74 Years | 1,193 (96.5%) | 621 (50.2%) |
| 75 Years and over | 877 (91.0%) | 595 (61.7%) |
| Total | 5,411 (36.5%) | 10,329 (69.6%) |
Disability Status by Sex by Age in Macomb
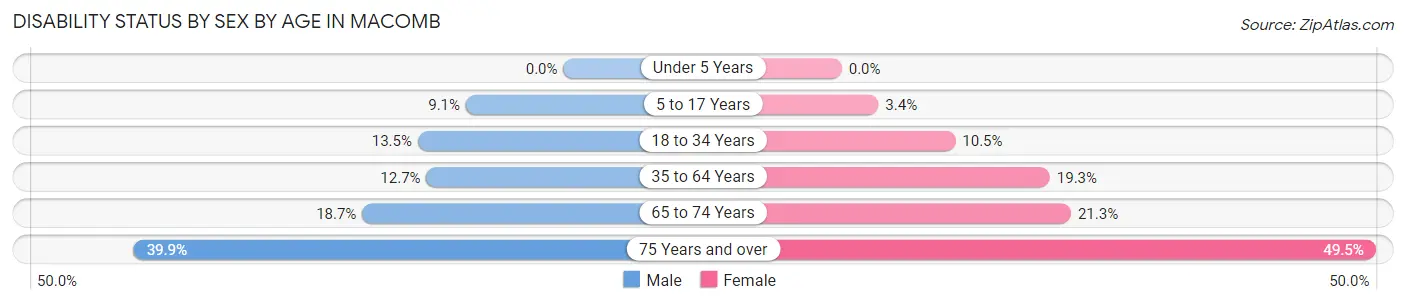
| Age Bracket | Male | Female |
| Under 5 Years | 0 (0.0%) | 0 (0.0%) |
| 5 to 17 Years | 75 (9.0%) | 34 (3.4%) |
| 18 to 34 Years | 417 (13.5%) | 361 (10.5%) |
| 35 to 64 Years | 247 (12.7%) | 366 (19.3%) |
| 65 to 74 Years | 93 (18.7%) | 157 (21.3%) |
| 75 Years and over | 126 (39.9%) | 321 (49.5%) |
Disability Class by Sex by Age in Macomb
Disability Class: Hearing Difficulty
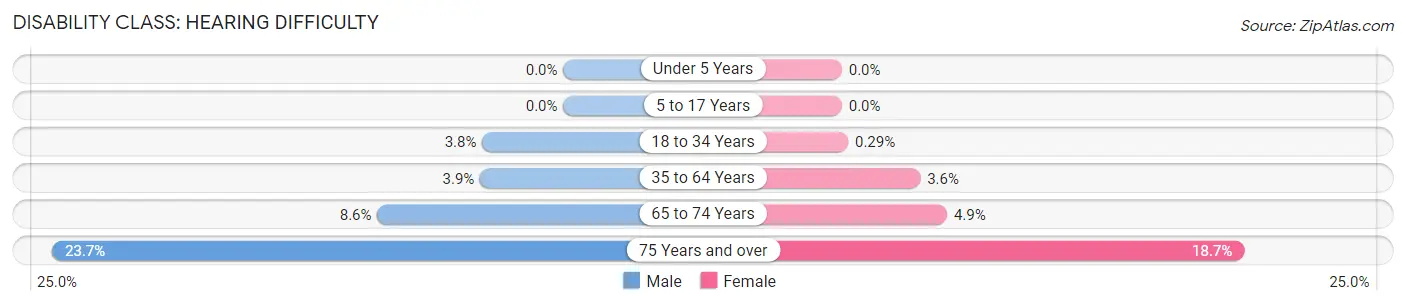
| Age Bracket | Male | Female |
| Under 5 Years | 0 (0.0%) | 0 (0.0%) |
| 5 to 17 Years | 0 (0.0%) | 0 (0.0%) |
| 18 to 34 Years | 116 (3.8%) | 10 (0.3%) |
| 35 to 64 Years | 75 (3.9%) | 69 (3.6%) |
| 65 to 74 Years | 43 (8.6%) | 36 (4.9%) |
| 75 Years and over | 75 (23.7%) | 121 (18.7%) |
Disability Class: Vision Difficulty
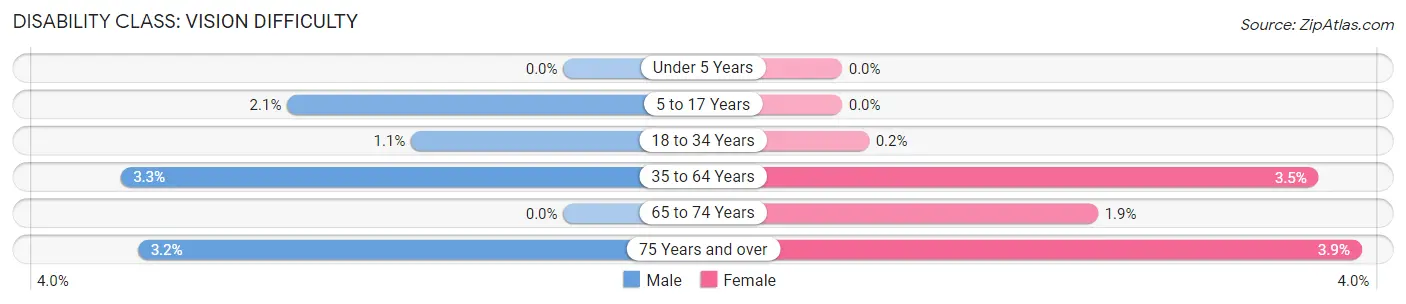
| Age Bracket | Male | Female |
| Under 5 Years | 0 (0.0%) | 0 (0.0%) |
| 5 to 17 Years | 17 (2.1%) | 0 (0.0%) |
| 18 to 34 Years | 35 (1.1%) | 7 (0.2%) |
| 35 to 64 Years | 64 (3.3%) | 67 (3.5%) |
| 65 to 74 Years | 0 (0.0%) | 14 (1.9%) |
| 75 Years and over | 10 (3.2%) | 25 (3.9%) |
Disability Class: Cognitive Difficulty
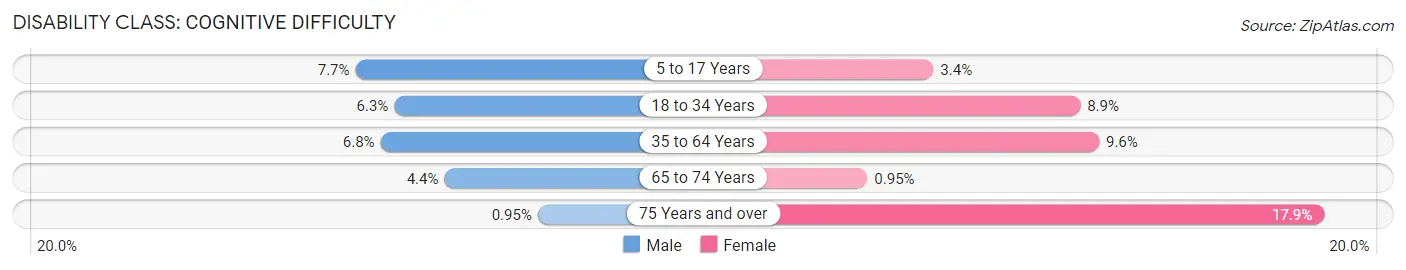
| Age Bracket | Male | Female |
| 5 to 17 Years | 64 (7.7%) | 34 (3.4%) |
| 18 to 34 Years | 194 (6.3%) | 303 (8.8%) |
| 35 to 64 Years | 132 (6.8%) | 181 (9.6%) |
| 65 to 74 Years | 22 (4.4%) | 7 (0.9%) |
| 75 Years and over | 3 (0.9%) | 116 (17.9%) |
Disability Class: Ambulatory Difficulty
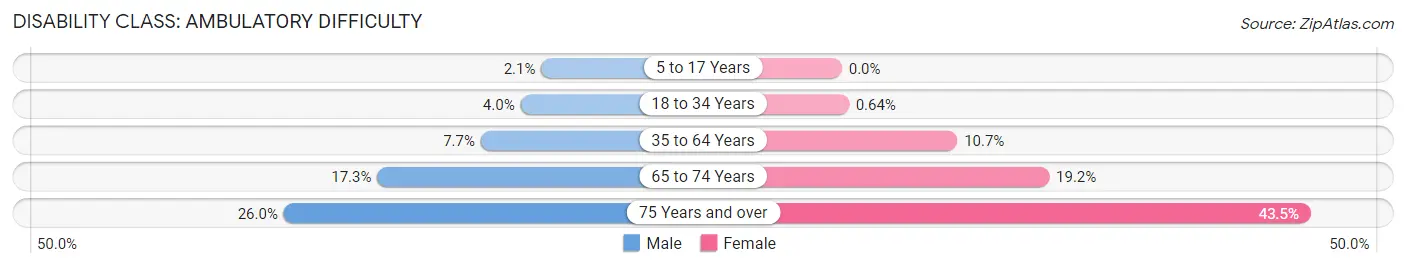
| Age Bracket | Male | Female |
| 5 to 17 Years | 17 (2.1%) | 0 (0.0%) |
| 18 to 34 Years | 123 (4.0%) | 22 (0.6%) |
| 35 to 64 Years | 149 (7.7%) | 203 (10.7%) |
| 65 to 74 Years | 86 (17.3%) | 142 (19.2%) |
| 75 Years and over | 82 (26.0%) | 282 (43.5%) |
Disability Class: Self-Care Difficulty
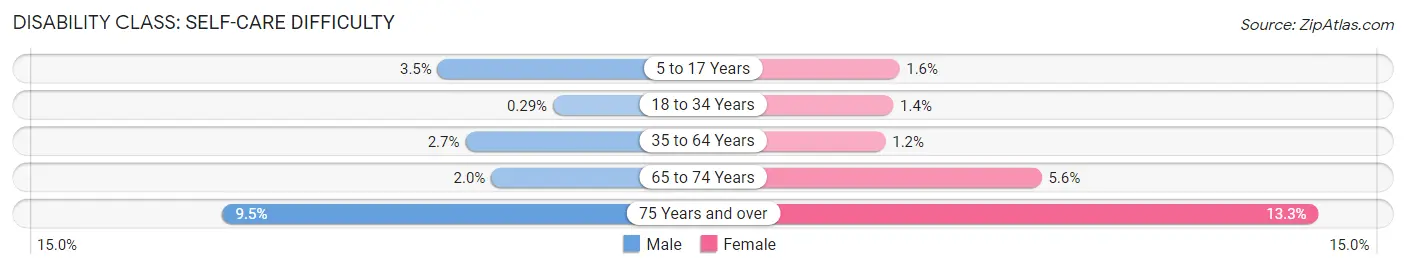
| Age Bracket | Male | Female |
| 5 to 17 Years | 29 (3.5%) | 16 (1.6%) |
| 18 to 34 Years | 9 (0.3%) | 49 (1.4%) |
| 35 to 64 Years | 53 (2.7%) | 23 (1.2%) |
| 65 to 74 Years | 10 (2.0%) | 41 (5.6%) |
| 75 Years and over | 30 (9.5%) | 86 (13.3%) |
Technology Access in Macomb
Computing Device Access in Macomb
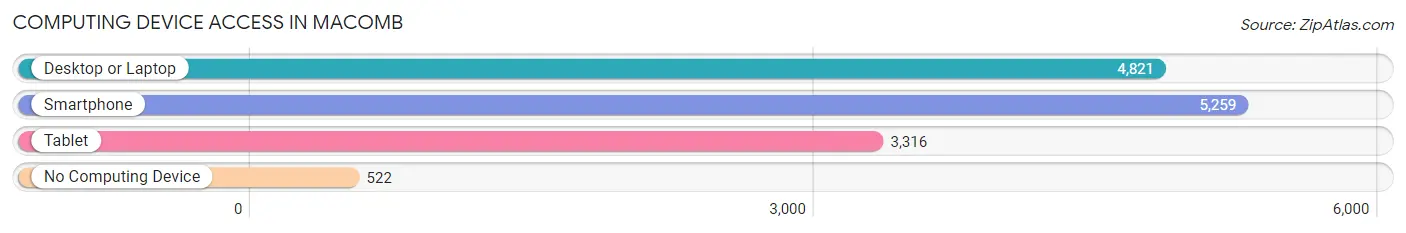
| Device Type | # Households | % Households |
| Desktop or Laptop | 4,821 | 77.7% |
| Smartphone | 5,259 | 84.8% |
| Tablet | 3,316 | 53.5% |
| No Computing Device | 522 | 8.4% |
| Total | 6,203 | 100.0% |
Internet Access in Macomb
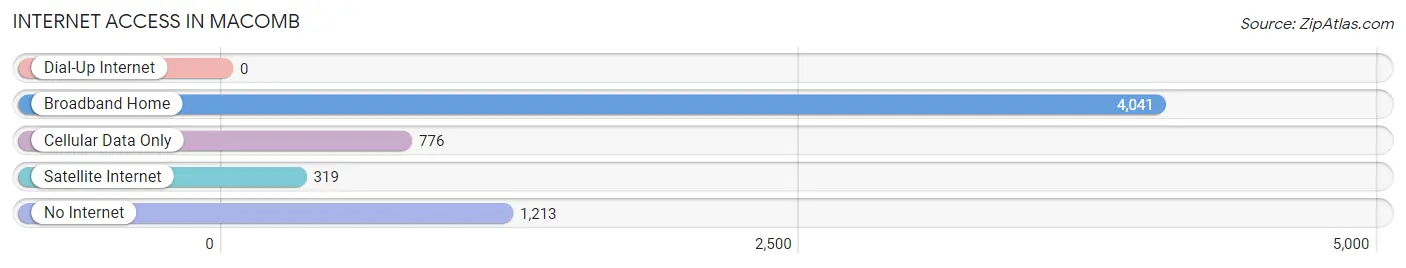
| Internet Type | # Households | % Households |
| Dial-Up Internet | 0 | 0.0% |
| Broadband Home | 4,041 | 65.1% |
| Cellular Data Only | 776 | 12.5% |
| Satellite Internet | 319 | 5.1% |
| No Internet | 1,213 | 19.6% |
| Total | 6,203 | 100.0% |
Macomb Summary
Macomb, Illinois is a city located in McDonough County, Illinois, United States. The city is the county seat of McDonough County and is located in the western part of the state. As of the 2010 census, the city had a population of 19,288.
History
Macomb was founded in 1829 by William Macomb, a Scottish immigrant who had come to the United States in 1818. He purchased land in the area and began to develop it. The city was named after him and was incorporated in 1855.
In the late 19th century, Macomb became a major center for the coal mining industry. The city was also home to a number of manufacturing plants, including a large brick factory.
In the early 20th century, Macomb was a major center for the agricultural industry. The city was home to a number of grain elevators and other agricultural-related businesses.
Geography
Macomb is located in western Illinois, about 75 miles southwest of Peoria. The city is situated in the western part of McDonough County, on the banks of the Spoon River. The city has a total area of 8.3 square miles, all of which is land.
The climate in Macomb is characterized by hot, humid summers and cold, dry winters. The average annual temperature is 54 degrees Fahrenheit, and the average annual precipitation is 37 inches.
Economy
Macomb’s economy is largely based on agriculture and manufacturing. The city is home to a number of agricultural-related businesses, including grain elevators, feed mills, and fertilizer plants. The city is also home to a number of manufacturing plants, including a large brick factory.
The city is also home to Western Illinois University, which is a major employer in the area. The university has an enrollment of over 10,000 students and employs over 1,000 faculty and staff.
Demographics
As of the 2010 census, the population of Macomb was 19,288. The racial makeup of the city was 92.3% White, 4.2% African American, 0.5% Native American, 0.7% Asian, 0.1% Pacific Islander, and 1.2% from other races. Hispanic or Latino of any race were 2.3% of the population.
The median household income in Macomb was $37,945, and the median family income was $48,945. The per capita income in the city was $19,945. About 11.3% of the population was below the poverty line.
Macomb is a small city with a rich history and a diverse economy. The city is home to a number of agricultural-related businesses, manufacturing plants, and Western Illinois University. The city has a population of 19,288, and the median household income is $37,945.
Common Questions
What is Per Capita Income in Macomb?
Per Capita income in Macomb is $26,489.
What is the Median Family Income in Macomb?
Median Family Income in Macomb is $77,656.
What is the Median Household income in Macomb?
Median Household Income in Macomb is $35,064.
What is Income or Wage Gap in Macomb?
Income or Wage Gap in Macomb is 36.9%.
Women in Macomb earn 63.1 cents for every dollar earned by a man.
What is Family Income Deficit in Macomb?
Family Income Deficit in Macomb is $8,592.
Families that are below poverty line in Macomb earn $8,592 less on average than the poverty threshold level.
What is Inequality or Gini Index in Macomb?
Inequality or Gini Index in Macomb is 0.55.
What is the Total Population of Macomb?
Total Population of Macomb is 15,207.
What is the Total Male Population of Macomb?
Total Male Population of Macomb is 7,071.
What is the Total Female Population of Macomb?
Total Female Population of Macomb is 8,136.
What is the Ratio of Males per 100 Females in Macomb?
There are 86.91 Males per 100 Females in Macomb.
What is the Ratio of Females per 100 Males in Macomb?
There are 115.06 Females per 100 Males in Macomb.
What is the Median Population Age in Macomb?
Median Population Age in Macomb is 27.4 Years.
What is the Average Family Size in Macomb
Average Family Size in Macomb is 3.1 People.
What is the Average Household Size in Macomb
Average Household Size in Macomb is 2.0 People.
How Large is the Labor Force in Macomb?
There are 7,637 People in the Labor Forcein in Macomb.
What is the Percentage of People in the Labor Force in Macomb?
57.8% of People are in the Labor Force in Macomb.
What is the Unemployment Rate in Macomb?
Unemployment Rate in Macomb is 11.3%.