Cortland, IL Map & Demographics
Cortland Map
Cortland Overview
$37,032
PER CAPITA INCOME
$106,384
AVG FAMILY INCOME
$76,869
AVG HOUSEHOLD INCOME
46.0%
WAGE / INCOME GAP [ % ]
54.0¢/ $1
WAGE / INCOME GAP [ $ ]
0.34
INEQUALITY / GINI INDEX
4,734
TOTAL POPULATION
2,663
MALE POPULATION
2,071
FEMALE POPULATION
128.59
MALES / 100 FEMALES
77.77
FEMALES / 100 MALES
31.4
MEDIAN AGE
3.2
AVG FAMILY SIZE
2.8
AVG HOUSEHOLD SIZE
2,947
LABOR FORCE [ PEOPLE ]
79.2%
PERCENT IN LABOR FORCE
5.3%
UNEMPLOYMENT RATE
Cortland Zip Codes
Cortland Area Codes
Income in Cortland
Income Overview in Cortland
Per Capita Income in Cortland is $37,032, while median incomes of families and households are $106,384 and $76,869 respectively.
| Characteristic | Number | Measure |
| Per Capita Income | 4,734 | $37,032 |
| Median Family Income | 1,081 | $106,384 |
| Mean Family Income | 1,081 | $115,135 |
| Median Household Income | 1,673 | $76,869 |
| Mean Household Income | 1,673 | $104,712 |
| Income Deficit | 1,081 | $0 |
| Wage / Income Gap (%) | 4,734 | 46.03% |
| Wage / Income Gap ($) | 4,734 | 53.97¢ per $1 |
| Gini / Inequality Index | 4,734 | 0.34 |
Earnings by Sex in Cortland
Average Earnings in Cortland are $38,644, $53,079 for men and $28,646 for women, a difference of 46.0%.
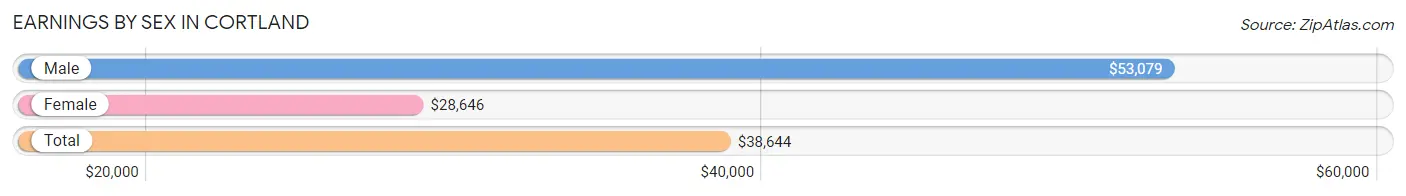
| Sex | Number | Average Earnings |
| Male | 1,727 (55.9%) | $53,079 |
| Female | 1,362 (44.1%) | $28,646 |
| Total | 3,089 (100.0%) | $38,644 |
Earnings by Sex by Income Bracket in Cortland
The most common earnings brackets in Cortland are $55,000 to $64,999 for men (328 | 19.0%) and $25,000 to $29,999 for women (193 | 14.2%).
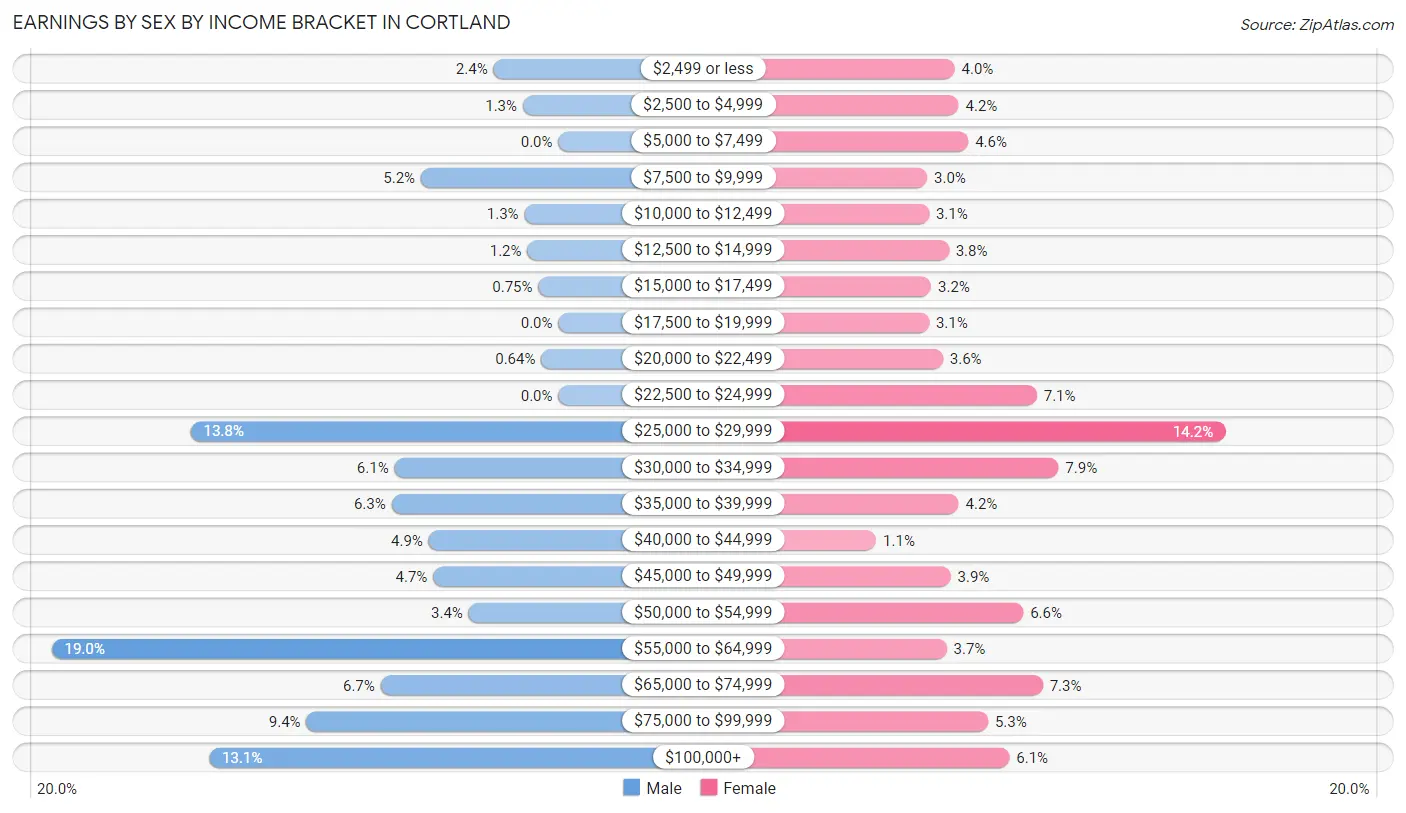
| Income | Male | Female |
| $2,499 or less | 42 (2.4%) | 55 (4.0%) |
| $2,500 to $4,999 | 23 (1.3%) | 57 (4.2%) |
| $5,000 to $7,499 | 0 (0.0%) | 62 (4.5%) |
| $7,500 to $9,999 | 89 (5.1%) | 41 (3.0%) |
| $10,000 to $12,499 | 22 (1.3%) | 42 (3.1%) |
| $12,500 to $14,999 | 20 (1.2%) | 52 (3.8%) |
| $15,000 to $17,499 | 13 (0.7%) | 43 (3.2%) |
| $17,500 to $19,999 | 0 (0.0%) | 42 (3.1%) |
| $20,000 to $22,499 | 11 (0.6%) | 49 (3.6%) |
| $22,500 to $24,999 | 0 (0.0%) | 97 (7.1%) |
| $25,000 to $29,999 | 238 (13.8%) | 193 (14.2%) |
| $30,000 to $34,999 | 106 (6.1%) | 108 (7.9%) |
| $35,000 to $39,999 | 108 (6.2%) | 57 (4.2%) |
| $40,000 to $44,999 | 84 (4.9%) | 15 (1.1%) |
| $45,000 to $49,999 | 81 (4.7%) | 53 (3.9%) |
| $50,000 to $54,999 | 58 (3.4%) | 90 (6.6%) |
| $55,000 to $64,999 | 328 (19.0%) | 51 (3.7%) |
| $65,000 to $74,999 | 115 (6.7%) | 100 (7.3%) |
| $75,000 to $99,999 | 163 (9.4%) | 72 (5.3%) |
| $100,000+ | 226 (13.1%) | 83 (6.1%) |
| Total | 1,727 (100.0%) | 1,362 (100.0%) |
Earnings by Sex by Educational Attainment in Cortland
Average earnings in Cortland are $53,689 for men and $29,987 for women, a difference of 44.2%. Men with an educational attainment of high school diploma enjoy the highest average annual earnings of $57,745, while those with college or associate's degree education earn the least with $41,471. Women with an educational attainment of bachelor's degree earn the most with the average annual earnings of $56,250, while those with high school diploma education have the smallest earnings of $22,917.
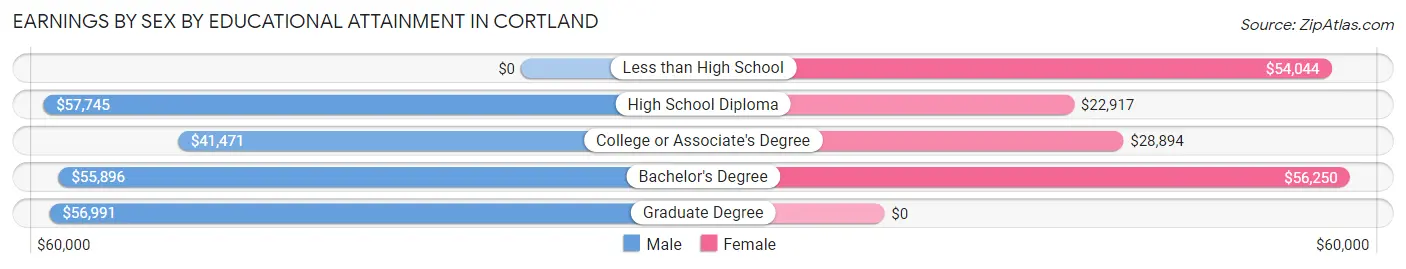
| Educational Attainment | Male Income | Female Income |
| Less than High School | - | - |
| High School Diploma | $57,745 | $22,917 |
| College or Associate's Degree | $41,471 | $28,894 |
| Bachelor's Degree | $55,896 | $56,250 |
| Graduate Degree | $56,991 | $0 |
| Total | $53,689 | $29,987 |
Family Income in Cortland
Family Income Brackets in Cortland
According to the Cortland family income data, there are 315 families falling into the $100,000 to $149,999 income range, which is the most common income bracket and makes up 29.1% of all families.
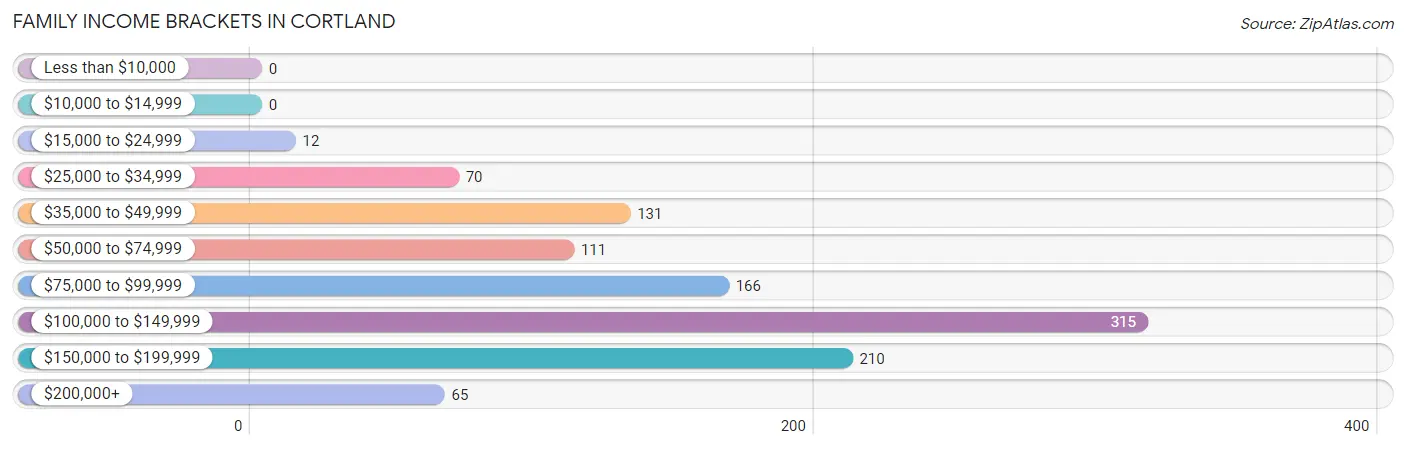
| Income Bracket | # Families | % Families |
| Less than $10,000 | 0 | 0.0% |
| $10,000 to $14,999 | 0 | 0.0% |
| $15,000 to $24,999 | 12 | 1.1% |
| $25,000 to $34,999 | 70 | 6.5% |
| $35,000 to $49,999 | 131 | 12.1% |
| $50,000 to $74,999 | 111 | 10.3% |
| $75,000 to $99,999 | 166 | 15.4% |
| $100,000 to $149,999 | 315 | 29.1% |
| $150,000 to $199,999 | 210 | 19.4% |
| $200,000+ | 65 | 6.0% |
Family Income by Famaliy Size in Cortland
5-person families (101 | 9.3%) account for the highest median family income in Cortland with $139,659 per family, while 2-person families (401 | 37.1%) have the highest median income of $46,958 per family member.
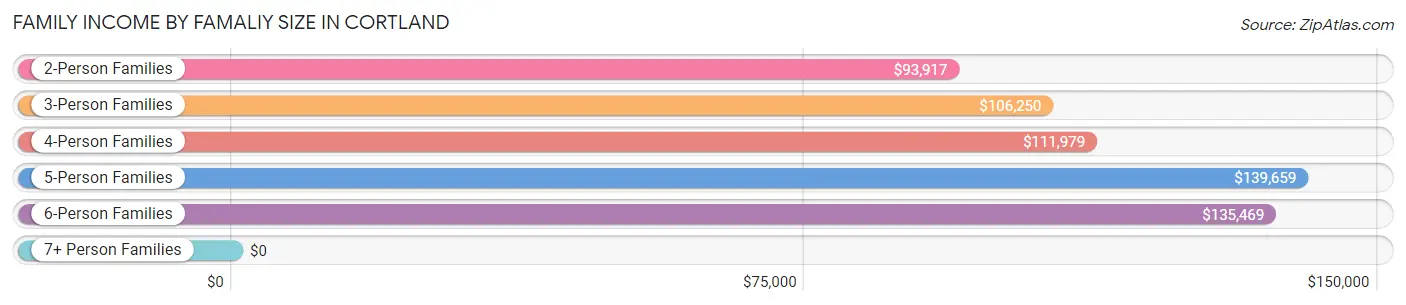
| Income Bracket | # Families | Median Income |
| 2-Person Families | 401 (37.1%) | $93,917 |
| 3-Person Families | 302 (27.9%) | $106,250 |
| 4-Person Families | 157 (14.5%) | $111,979 |
| 5-Person Families | 101 (9.3%) | $139,659 |
| 6-Person Families | 120 (11.1%) | $135,469 |
| 7+ Person Families | 0 (0.0%) | $0 |
| Total | 1,081 (100.0%) | $106,384 |
Family Income by Number of Earners in Cortland
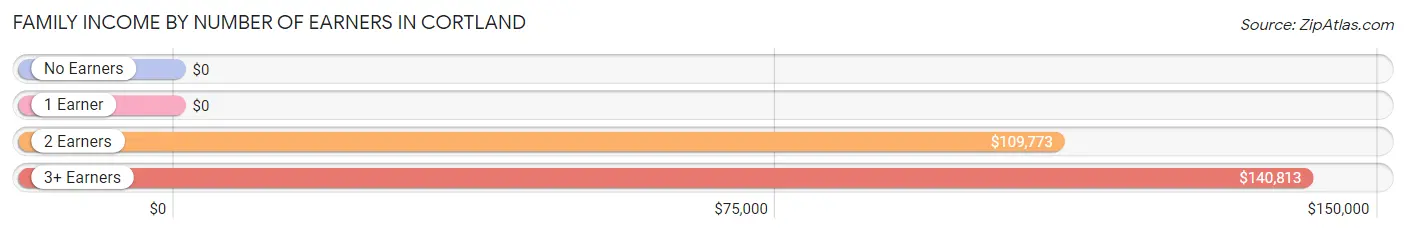
| Number of Earners | # Families | Median Income |
| No Earners | 108 (10.0%) | $0 |
| 1 Earner | 286 (26.5%) | $0 |
| 2 Earners | 412 (38.1%) | $109,773 |
| 3+ Earners | 275 (25.4%) | $140,813 |
| Total | 1,081 (100.0%) | $106,384 |
Household Income in Cortland
Household Income Brackets in Cortland
With 458 households falling in the category, the $50,000 to $74,999 income range is the most frequent in Cortland, accounting for 27.4% of all households. In contrast, only 28 households (1.7%) fall into the $10,000 to $14,999 income bracket, making it the least populous group.
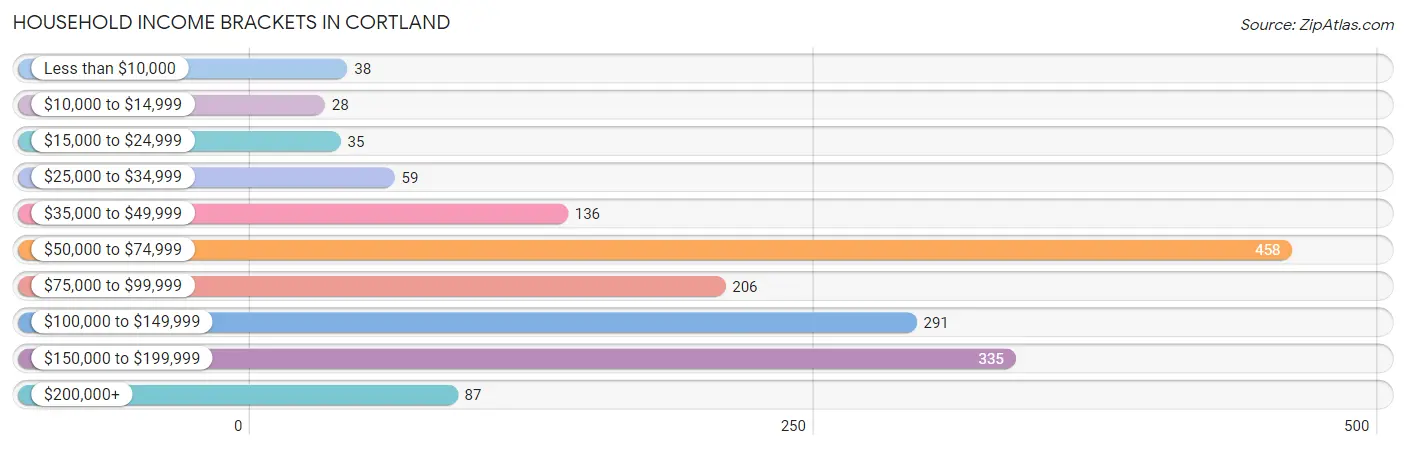
| Income Bracket | # Households | % Households |
| Less than $10,000 | 38 | 2.3% |
| $10,000 to $14,999 | 28 | 1.7% |
| $15,000 to $24,999 | 35 | 2.1% |
| $25,000 to $34,999 | 59 | 3.5% |
| $35,000 to $49,999 | 136 | 8.1% |
| $50,000 to $74,999 | 458 | 27.4% |
| $75,000 to $99,999 | 206 | 12.3% |
| $100,000 to $149,999 | 291 | 17.4% |
| $150,000 to $199,999 | 335 | 20.0% |
| $200,000+ | 87 | 5.2% |
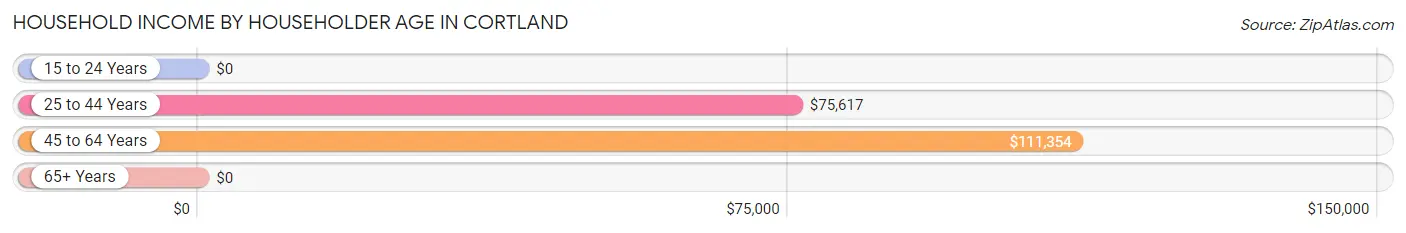
Household Income by Householder Age in Cortland
The median household income in Cortland is $76,869, with the highest median household income of $111,354 found in the 45 to 64 years age bracket for the primary householder. A total of 429 households (25.6%) fall into this category. Meanwhile, the 15 to 24 years age bracket for the primary householder has the lowest median household income of $0, with 134 households (8.0%) in this group.
| Income Bracket | # Households | Median Income |
| 15 to 24 Years | 134 (8.0%) | $0 |
| 25 to 44 Years | 856 (51.2%) | $75,617 |
| 45 to 64 Years | 429 (25.6%) | $111,354 |
| 65+ Years | 254 (15.2%) | $0 |
| Total | 1,673 (100.0%) | $76,869 |
Poverty in Cortland
Income Below Poverty by Sex and Age in Cortland
With 3.9% poverty level for males and 5.1% for females among the residents of Cortland, 18 to 24 year old males and 25 to 34 year old females are the most vulnerable to poverty, with 59 males (27.1%) and 88 females (16.8%) in their respective age groups living below the poverty level.
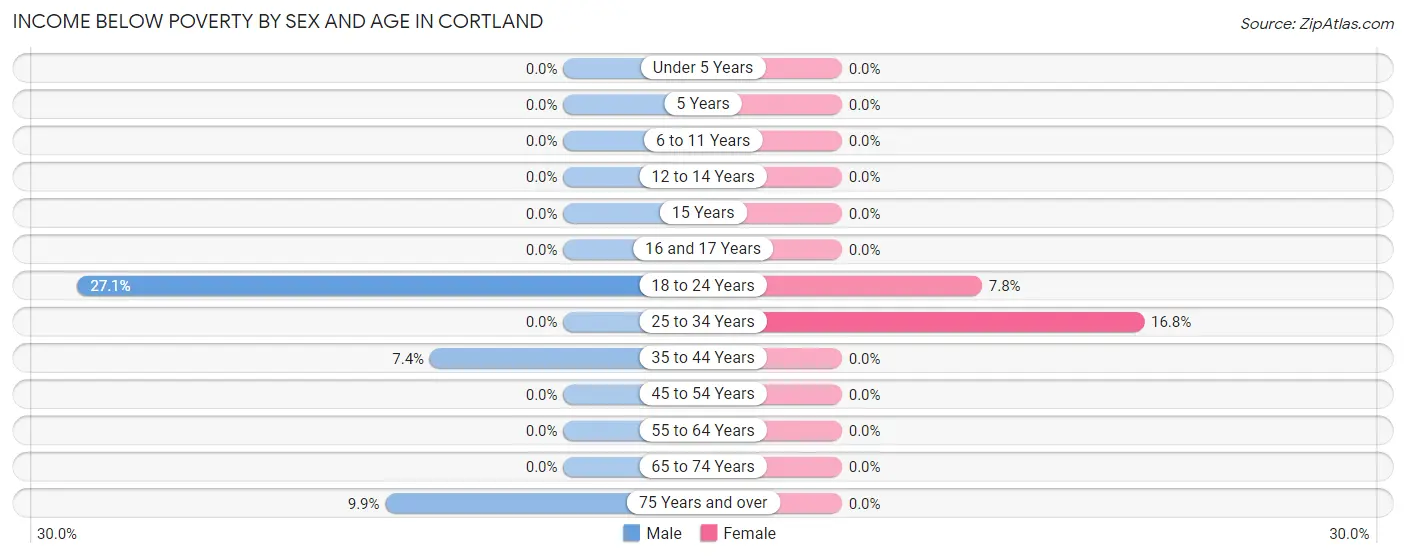
| Age Bracket | Male | Female |
| Under 5 Years | 0 (0.0%) | 0 (0.0%) |
| 5 Years | 0 (0.0%) | 0 (0.0%) |
| 6 to 11 Years | 0 (0.0%) | 0 (0.0%) |
| 12 to 14 Years | 0 (0.0%) | 0 (0.0%) |
| 15 Years | 0 (0.0%) | 0 (0.0%) |
| 16 and 17 Years | 0 (0.0%) | 0 (0.0%) |
| 18 to 24 Years | 59 (27.1%) | 17 (7.8%) |
| 25 to 34 Years | 0 (0.0%) | 88 (16.8%) |
| 35 to 44 Years | 33 (7.4%) | 0 (0.0%) |
| 45 to 54 Years | 0 (0.0%) | 0 (0.0%) |
| 55 to 64 Years | 0 (0.0%) | 0 (0.0%) |
| 65 to 74 Years | 0 (0.0%) | 0 (0.0%) |
| 75 Years and over | 11 (9.9%) | 0 (0.0%) |
| Total | 103 (3.9%) | 105 (5.1%) |
Income Above Poverty by Sex and Age in Cortland
According to the poverty statistics in Cortland, males aged under 5 years and females aged under 5 years are the age groups that are most secure financially, with 100.0% of males and 100.0% of females in these age groups living above the poverty line.
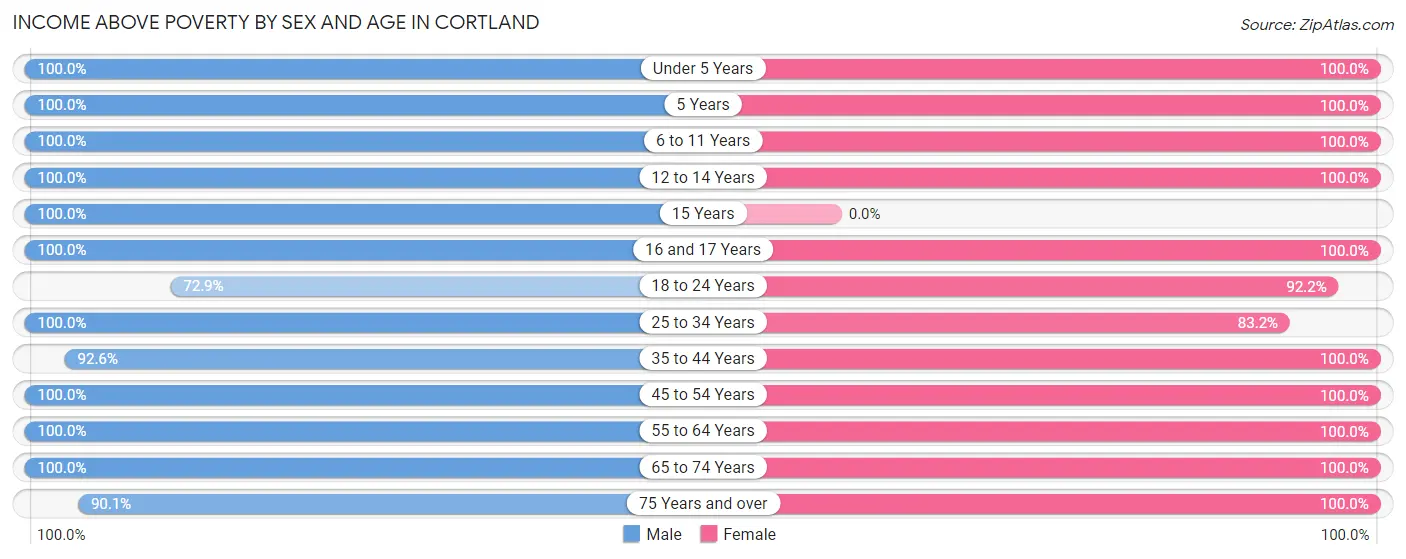
| Age Bracket | Male | Female |
| Under 5 Years | 169 (100.0%) | 128 (100.0%) |
| 5 Years | 16 (100.0%) | 37 (100.0%) |
| 6 to 11 Years | 298 (100.0%) | 97 (100.0%) |
| 12 to 14 Years | 173 (100.0%) | 48 (100.0%) |
| 15 Years | 14 (100.0%) | 0 (0.0%) |
| 16 and 17 Years | 32 (100.0%) | 53 (100.0%) |
| 18 to 24 Years | 159 (72.9%) | 201 (92.2%) |
| 25 to 34 Years | 584 (100.0%) | 435 (83.2%) |
| 35 to 44 Years | 411 (92.6%) | 318 (100.0%) |
| 45 to 54 Years | 202 (100.0%) | 144 (100.0%) |
| 55 to 64 Years | 280 (100.0%) | 273 (100.0%) |
| 65 to 74 Years | 122 (100.0%) | 89 (100.0%) |
| 75 Years and over | 100 (90.1%) | 110 (100.0%) |
| Total | 2,560 (96.1%) | 1,933 (94.9%) |
Income Below Poverty Among Married-Couple Families in Cortland
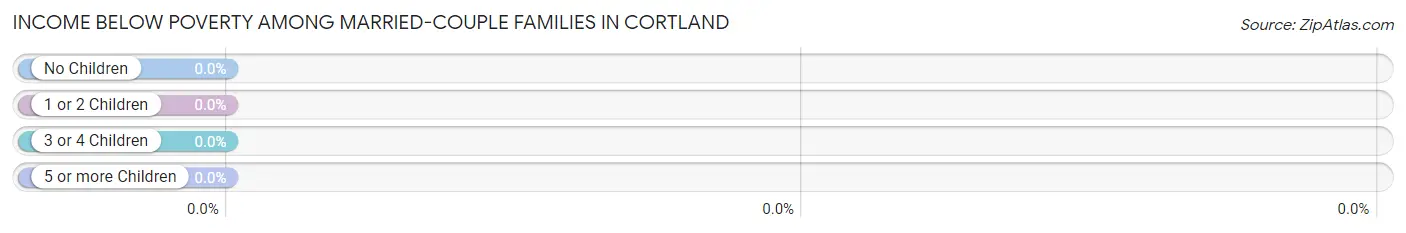
| Children | Above Poverty | Below Poverty |
| No Children | 425 (100.0%) | 0 (0.0%) |
| 1 or 2 Children | 264 (100.0%) | 0 (0.0%) |
| 3 or 4 Children | 119 (100.0%) | 0 (0.0%) |
| 5 or more Children | 0 (0.0%) | 0 (0.0%) |
| Total | 808 (100.0%) | 0 (0.0%) |
Income Below Poverty Among Single-Parent Households in Cortland
| Children | Single Father | Single Mother |
| No Children | 0 (0.0%) | 0 (0.0%) |
| 1 or 2 Children | 0 (0.0%) | 0 (0.0%) |
| 3 or 4 Children | 0 (0.0%) | 0 (0.0%) |
| 5 or more Children | 0 (0.0%) | 0 (0.0%) |
| Total | 0 (0.0%) | 0 (0.0%) |
Income Below Poverty Among Married-Couple vs Single-Parent Households in Cortland
| Children | Married-Couple Families | Single-Parent Households |
| No Children | 0 (0.0%) | 0 (0.0%) |
| 1 or 2 Children | 0 (0.0%) | 0 (0.0%) |
| 3 or 4 Children | 0 (0.0%) | 0 (0.0%) |
| 5 or more Children | 0 (0.0%) | 0 (0.0%) |
| Total | 0 (0.0%) | 0 (0.0%) |
Race in Cortland
The most populous races in Cortland are White / Caucasian (3,771 | 79.7%), Hispanic or Latino (769 | 16.2%), and Black / African American (564 | 11.9%).
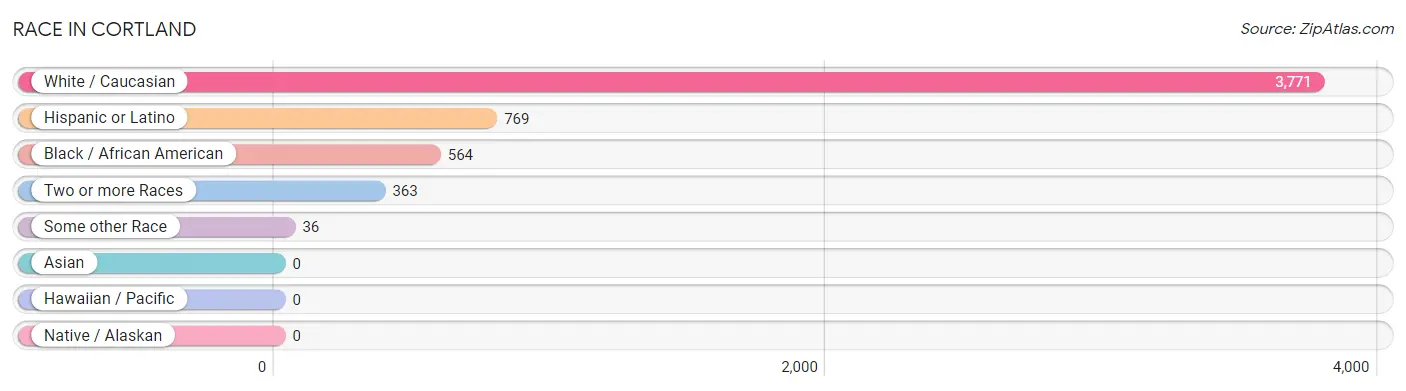
| Race | # Population | % Population |
| Asian | 0 | 0.0% |
| Black / African American | 564 | 11.9% |
| Hawaiian / Pacific | 0 | 0.0% |
| Hispanic or Latino | 769 | 16.2% |
| Native / Alaskan | 0 | 0.0% |
| White / Caucasian | 3,771 | 79.7% |
| Two or more Races | 363 | 7.7% |
| Some other Race | 36 | 0.8% |
| Total | 4,734 | 100.0% |
Ancestry in Cortland
The most populous ancestries reported in Cortland are German (1,240 | 26.2%), Irish (715 | 15.1%), Polish (488 | 10.3%), South American (327 | 6.9%), and Mexican (318 | 6.7%), together accounting for 65.2% of all Cortland residents.
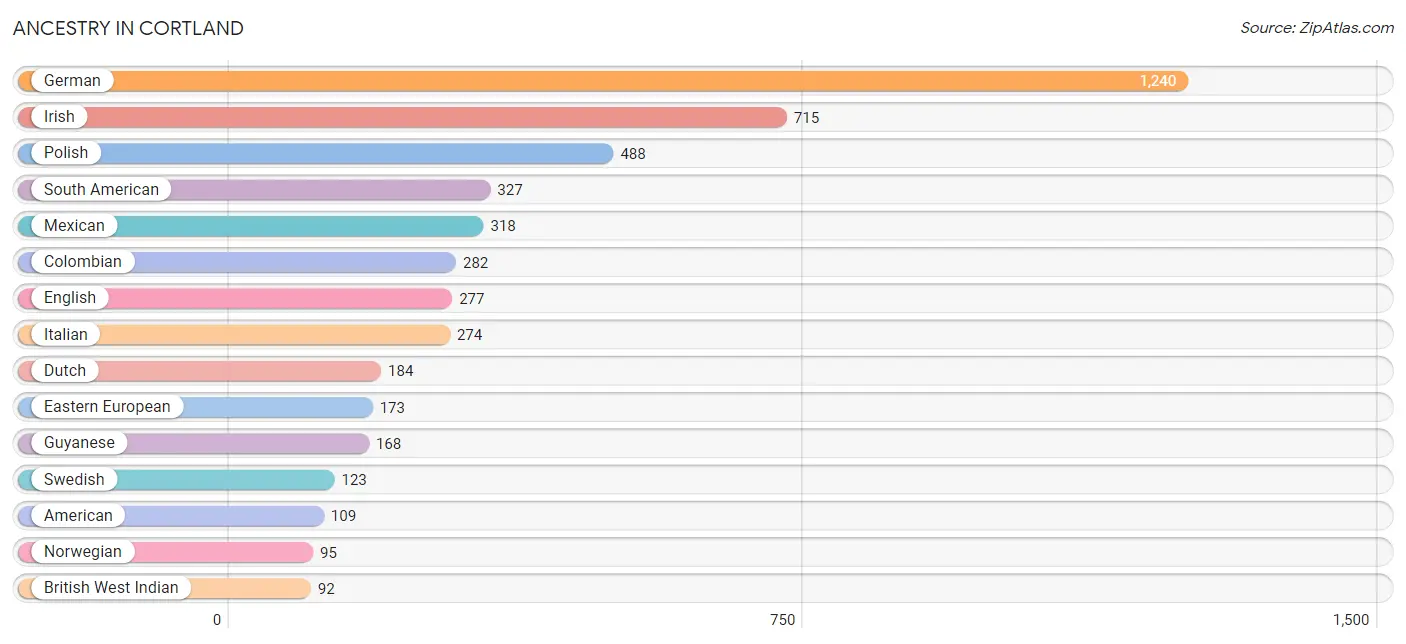
| Ancestry | # Population | % Population |
| American | 109 | 2.3% |
| Armenian | 11 | 0.2% |
| Austrian | 31 | 0.6% |
| Belgian | 22 | 0.5% |
| Bhutanese | 16 | 0.3% |
| British West Indian | 92 | 1.9% |
| Cherokee | 54 | 1.1% |
| Chilean | 24 | 0.5% |
| Colombian | 282 | 6.0% |
| Croatian | 20 | 0.4% |
| Czech | 50 | 1.1% |
| Czechoslovakian | 38 | 0.8% |
| Danish | 32 | 0.7% |
| Dutch | 184 | 3.9% |
| Eastern European | 173 | 3.6% |
| Ecuadorian | 21 | 0.4% |
| English | 277 | 5.9% |
| European | 38 | 0.8% |
| French | 26 | 0.5% |
| German | 1,240 | 26.2% |
| Greek | 21 | 0.4% |
| Guyanese | 168 | 3.5% |
| Hungarian | 11 | 0.2% |
| Irish | 715 | 15.1% |
| Italian | 274 | 5.8% |
| Mexican | 318 | 6.7% |
| Northern European | 9 | 0.2% |
| Norwegian | 95 | 2.0% |
| Polish | 488 | 10.3% |
| Puerto Rican | 90 | 1.9% |
| Romanian | 8 | 0.2% |
| Scandinavian | 8 | 0.2% |
| Scotch-Irish | 13 | 0.3% |
| Scottish | 92 | 1.9% |
| Slavic | 38 | 0.8% |
| Slovak | 33 | 0.7% |
| Slovene | 7 | 0.2% |
| South American | 327 | 6.9% |
| Spaniard | 20 | 0.4% |
| Spanish | 14 | 0.3% |
| Swedish | 123 | 2.6% |
| Welsh | 32 | 0.7% | View All 42 Rows |
Immigrants in Cortland
The most numerous immigrant groups reported in Cortland came from Latin America (199 | 4.2%), Colombia (142 | 3.0%), South America (142 | 3.0%), Central America (57 | 1.2%), and Mexico (57 | 1.2%), together accounting for 12.6% of all Cortland residents.
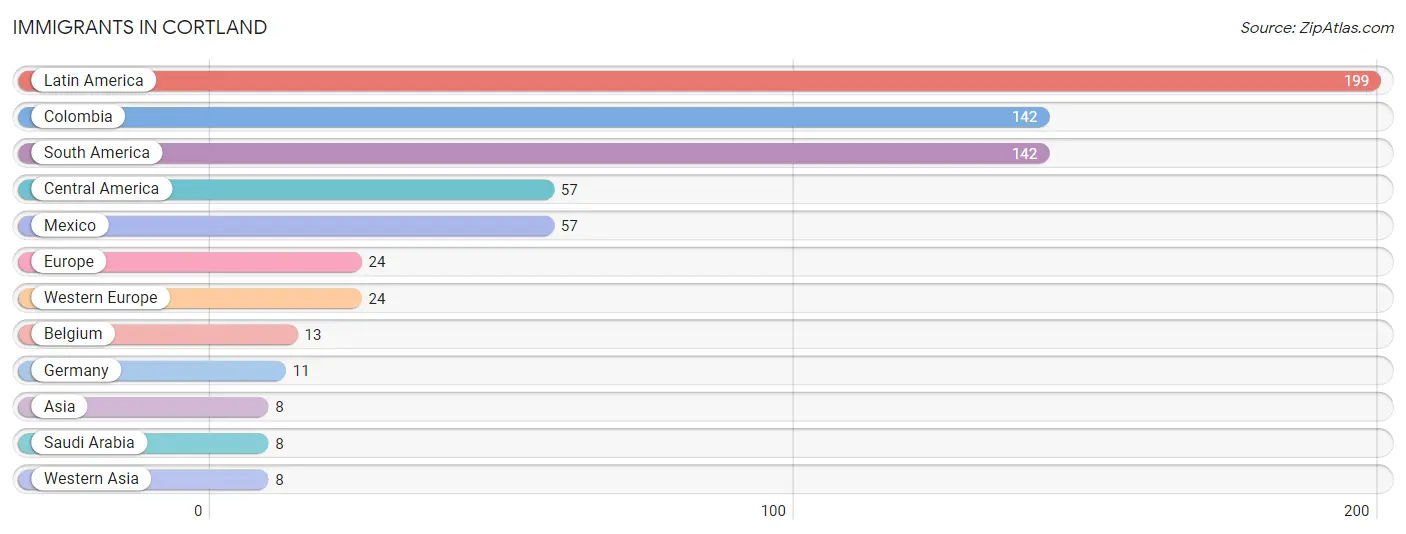
| Immigration Origin | # Population | % Population |
| Asia | 8 | 0.2% |
| Belgium | 13 | 0.3% |
| Central America | 57 | 1.2% |
| Colombia | 142 | 3.0% |
| Europe | 24 | 0.5% |
| Germany | 11 | 0.2% |
| Latin America | 199 | 4.2% |
| Mexico | 57 | 1.2% |
| Saudi Arabia | 8 | 0.2% |
| South America | 142 | 3.0% |
| Western Asia | 8 | 0.2% |
| Western Europe | 24 | 0.5% | View All 12 Rows |
Sex and Age in Cortland
Sex and Age in Cortland
The most populous age groups in Cortland are 10 to 14 Years (303 | 11.4%) for men and 25 to 29 Years (299 | 14.4%) for women.
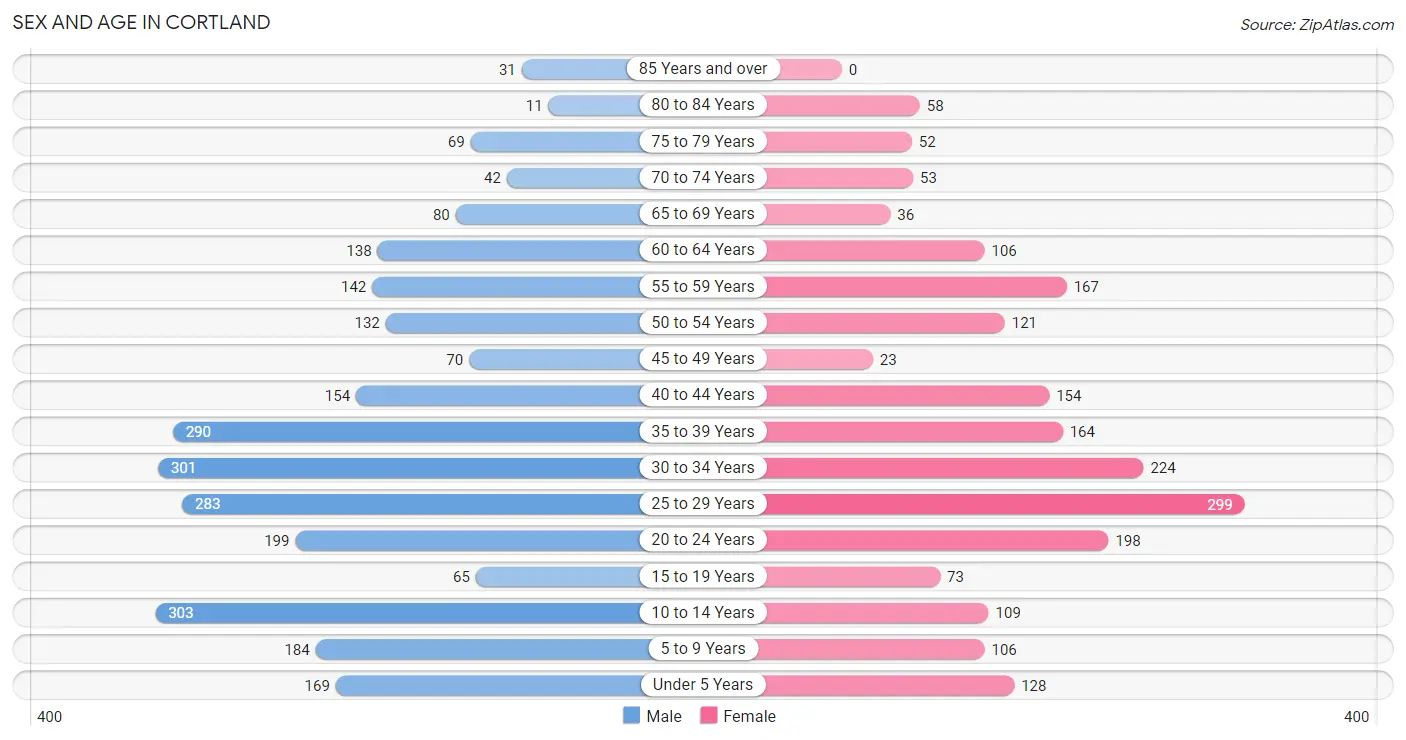
| Age Bracket | Male | Female |
| Under 5 Years | 169 (6.4%) | 128 (6.2%) |
| 5 to 9 Years | 184 (6.9%) | 106 (5.1%) |
| 10 to 14 Years | 303 (11.4%) | 109 (5.3%) |
| 15 to 19 Years | 65 (2.4%) | 73 (3.5%) |
| 20 to 24 Years | 199 (7.5%) | 198 (9.6%) |
| 25 to 29 Years | 283 (10.6%) | 299 (14.4%) |
| 30 to 34 Years | 301 (11.3%) | 224 (10.8%) |
| 35 to 39 Years | 290 (10.9%) | 164 (7.9%) |
| 40 to 44 Years | 154 (5.8%) | 154 (7.4%) |
| 45 to 49 Years | 70 (2.6%) | 23 (1.1%) |
| 50 to 54 Years | 132 (5.0%) | 121 (5.8%) |
| 55 to 59 Years | 142 (5.3%) | 167 (8.1%) |
| 60 to 64 Years | 138 (5.2%) | 106 (5.1%) |
| 65 to 69 Years | 80 (3.0%) | 36 (1.7%) |
| 70 to 74 Years | 42 (1.6%) | 53 (2.6%) |
| 75 to 79 Years | 69 (2.6%) | 52 (2.5%) |
| 80 to 84 Years | 11 (0.4%) | 58 (2.8%) |
| 85 Years and over | 31 (1.2%) | 0 (0.0%) |
| Total | 2,663 (100.0%) | 2,071 (100.0%) |
Families and Households in Cortland
Median Family Size in Cortland
The median family size in Cortland is 3.22 persons per family, with single male/father families (170 | 15.7%) accounting for the largest median family size of 3.33 persons per family. On the other hand, single female/mother families (103 | 9.5%) represent the smallest median family size with 2.68 persons per family.
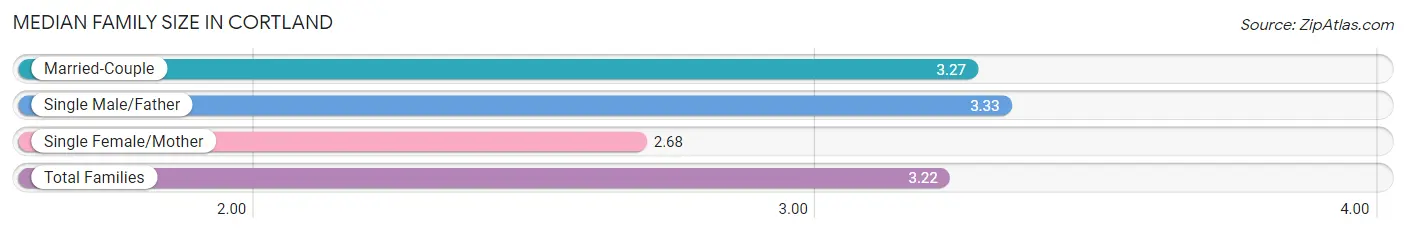
| Family Type | # Families | Family Size |
| Married-Couple | 808 (74.8%) | 3.27 |
| Single Male/Father | 170 (15.7%) | 3.33 |
| Single Female/Mother | 103 (9.5%) | 2.68 |
| Total Families | 1,081 (100.0%) | 3.22 |
Median Household Size in Cortland
The median household size in Cortland is 2.83 persons per household, with single male/father households (170 | 10.2%) accounting for the largest median household size of 4.56 persons per household. non-family households (592 | 35.4%) represent the smallest median household size with 1.48 persons per household.
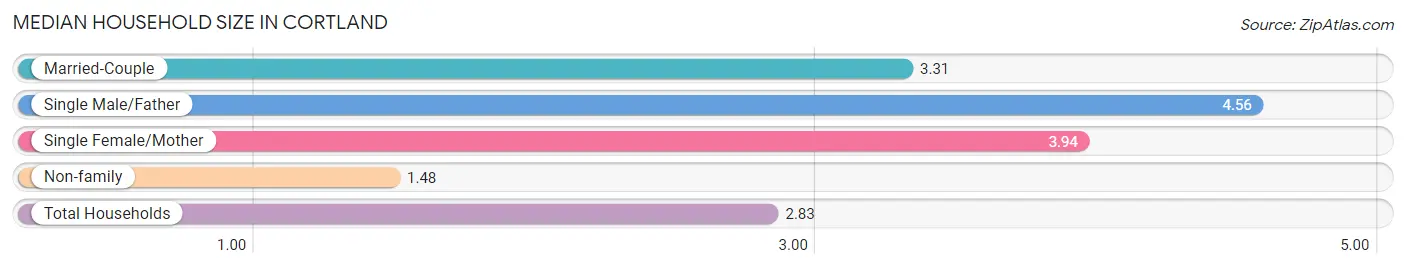
| Household Type | # Households | Household Size |
| Married-Couple | 808 (48.3%) | 3.31 |
| Single Male/Father | 170 (10.2%) | 4.56 |
| Single Female/Mother | 103 (6.2%) | 3.94 |
| Non-family | 592 (35.4%) | 1.48 |
| Total Households | 1,673 (100.0%) | 2.83 |
Household Size by Marriage Status in Cortland
Out of a total of 1,673 households in Cortland, 1,081 (64.6%) are family households, while 592 (35.4%) are nonfamily households. The most numerous type of family households are 3-person households, comprising 314, and the most common type of nonfamily households are 1-person households, comprising 303.
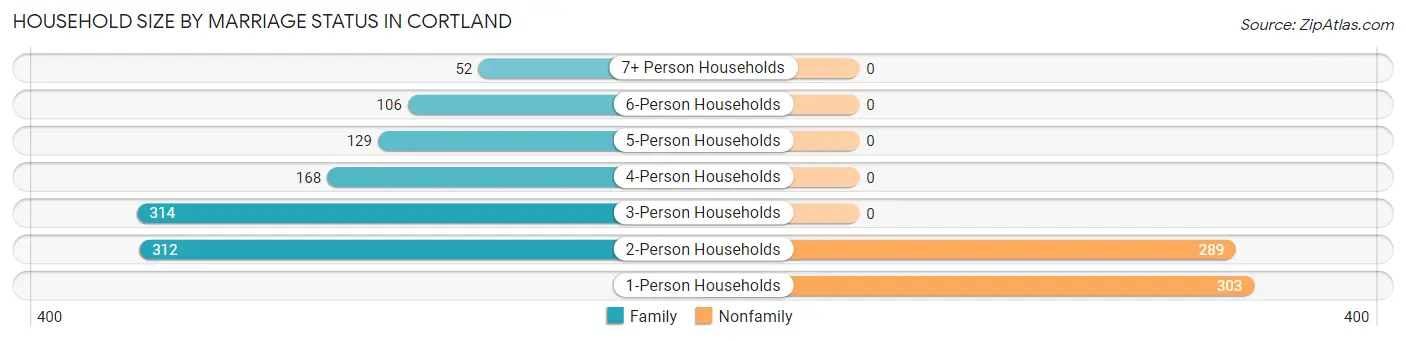
| Household Size | Family Households | Nonfamily Households |
| 1-Person Households | - | 303 (18.1%) |
| 2-Person Households | 312 (18.6%) | 289 (17.3%) |
| 3-Person Households | 314 (18.8%) | 0 (0.0%) |
| 4-Person Households | 168 (10.0%) | 0 (0.0%) |
| 5-Person Households | 129 (7.7%) | 0 (0.0%) |
| 6-Person Households | 106 (6.3%) | 0 (0.0%) |
| 7+ Person Households | 52 (3.1%) | 0 (0.0%) |
| Total | 1,081 (64.6%) | 592 (35.4%) |
Female Fertility in Cortland
Fertility by Age in Cortland
Average fertility rate in Cortland is 46.0 births per 1,000 women. Women in the age bracket of 20 to 34 years have the highest fertility rate with 75.0 births per 1,000 women. Women in the age bracket of 20 to 34 years acount for 100.0% of all women with births.
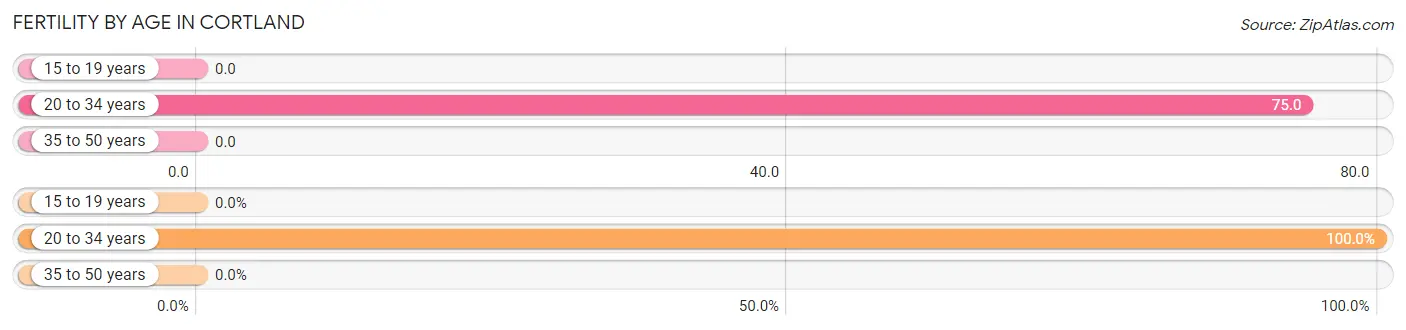
| Age Bracket | Women with Births | Births / 1,000 Women |
| 15 to 19 years | 0 (0.0%) | 0.0 |
| 20 to 34 years | 54 (100.0%) | 75.0 |
| 35 to 50 years | 0 (0.0%) | 0.0 |
| Total | 54 (100.0%) | 46.0 |
Fertility by Age by Marriage Status in Cortland
53.7% of women with births (54) in Cortland are married. The highest percentage of unmarried women with births falls into 20 to 34 years age bracket with 46.3% of them unmarried at the time of birth, while the lowest percentage of unmarried women with births belong to 20 to 34 years age bracket with 46.3% of them unmarried.
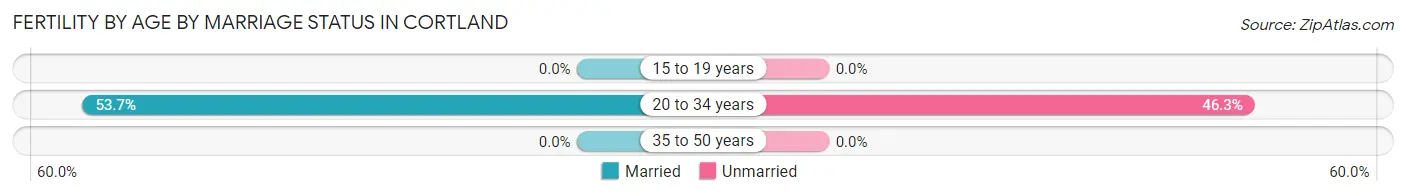
| Age Bracket | Married | Unmarried |
| 15 to 19 years | 0 (0.0%) | 0 (0.0%) |
| 20 to 34 years | 29 (53.7%) | 25 (46.3%) |
| 35 to 50 years | 0 (0.0%) | 0 (0.0%) |
| Total | 29 (53.7%) | 25 (46.3%) |
Fertility by Education in Cortland
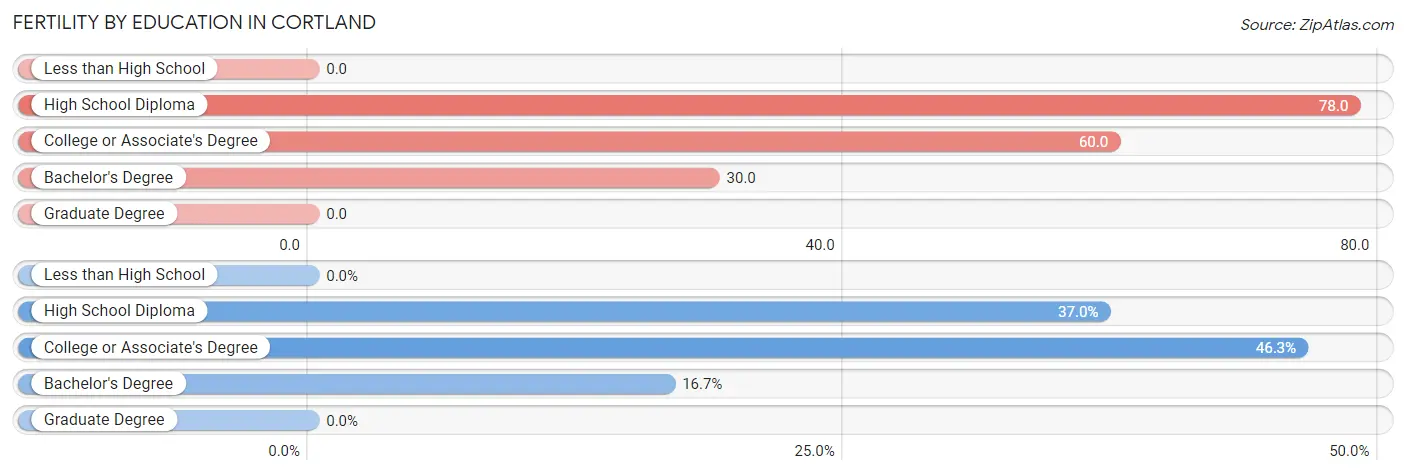
| Educational Attainment | Women with Births | Births / 1,000 Women |
| Less than High School | 0 (0.0%) | 0.0 |
| High School Diploma | 20 (37.0%) | 78.0 |
| College or Associate's Degree | 25 (46.3%) | 60.0 |
| Bachelor's Degree | 9 (16.7%) | 30.0 |
| Graduate Degree | 0 (0.0%) | 0.0 |
| Total | 54 (100.0%) | 46.0 |
Fertility by Education by Marriage Status in Cortland
46.3% of women with births in Cortland are unmarried. Women with the educational attainment of high school diploma are most likely to be married with 100.0% of them married at childbirth, while women with the educational attainment of college or associate's degree are least likely to be married with 100.0% of them unmarried at childbirth.
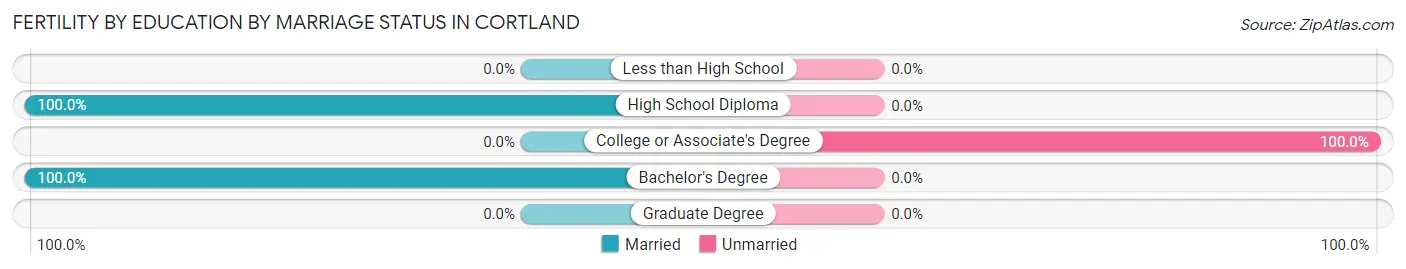
| Educational Attainment | Married | Unmarried |
| Less than High School | 0 (0.0%) | 0 (0.0%) |
| High School Diploma | 20 (100.0%) | 0 (0.0%) |
| College or Associate's Degree | 0 (0.0%) | 25 (100.0%) |
| Bachelor's Degree | 9 (100.0%) | 0 (0.0%) |
| Graduate Degree | 0 (0.0%) | 0 (0.0%) |
| Total | 29 (53.7%) | 25 (46.3%) |
Employment Characteristics in Cortland
Employment by Class of Employer in Cortland
Among the 2,783 employed individuals in Cortland, private company employees (1,802 | 64.7%), not-for-profit organizations (378 | 13.6%), and local government employees (221 | 7.9%) make up the most common classes of employment.
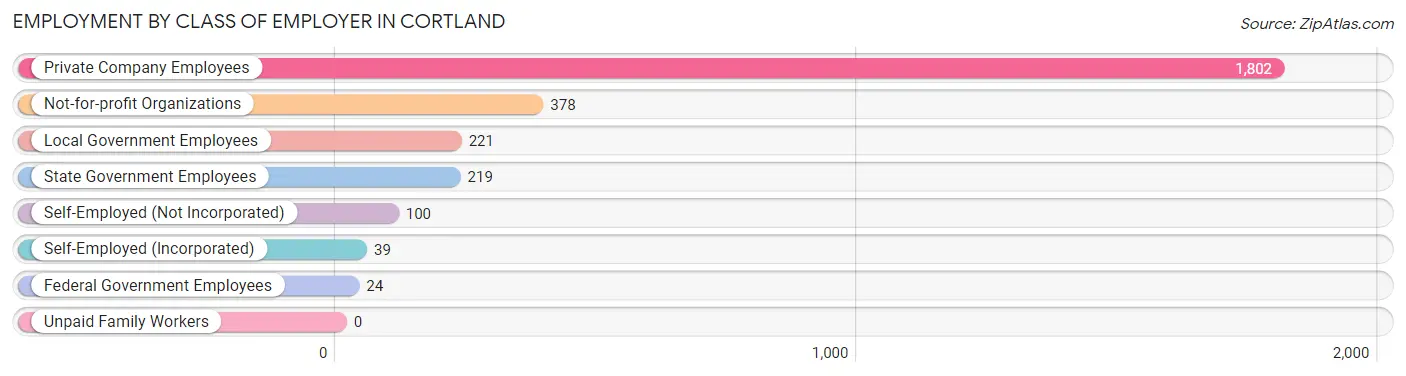
| Employer Class | # Employees | % Employees |
| Private Company Employees | 1,802 | 64.7% |
| Self-Employed (Incorporated) | 39 | 1.4% |
| Self-Employed (Not Incorporated) | 100 | 3.6% |
| Not-for-profit Organizations | 378 | 13.6% |
| Local Government Employees | 221 | 7.9% |
| State Government Employees | 219 | 7.9% |
| Federal Government Employees | 24 | 0.9% |
| Unpaid Family Workers | 0 | 0.0% |
| Total | 2,783 | 100.0% |
Employment Status by Age in Cortland
According to the labor force statistics for Cortland, out of the total population over 16 years of age (3,721), 79.2% or 2,947 individuals are in the labor force, with 5.3% or 156 of them unemployed. The age group with the highest labor force participation rate is 20 to 24 years, with 100.0% or 397 individuals in the labor force. Within the labor force, the 25 to 29 years age range has the highest percentage of unemployed individuals, with 21.3% or 113 of them being unemployed.
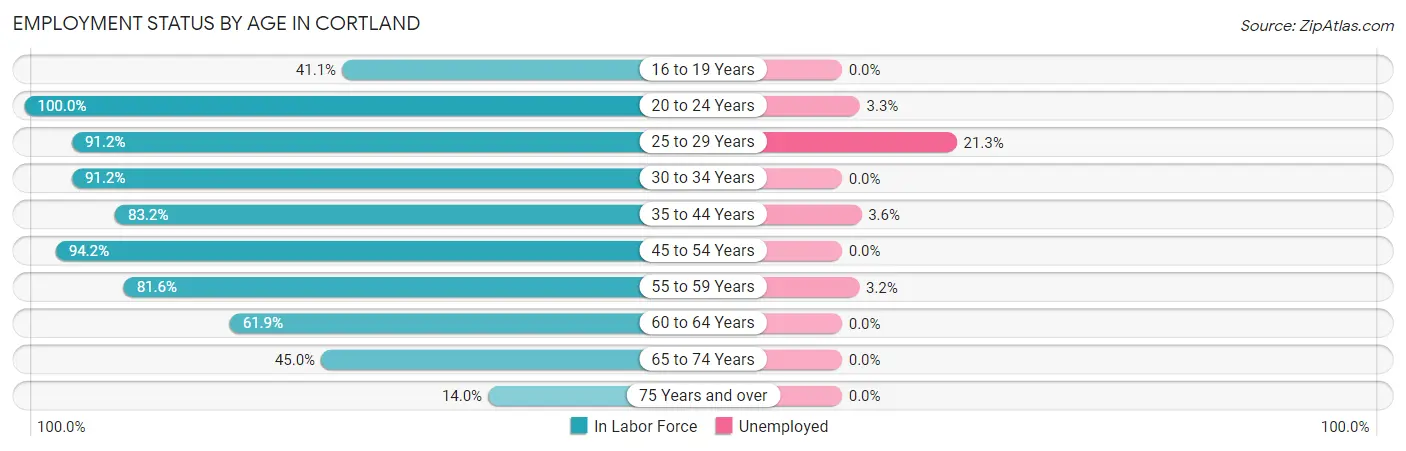
| Age Bracket | In Labor Force | Unemployed |
| 16 to 19 Years | 51 (41.1%) | 0 (0.0%) |
| 20 to 24 Years | 397 (100.0%) | 13 (3.3%) |
| 25 to 29 Years | 531 (91.2%) | 113 (21.3%) |
| 30 to 34 Years | 479 (91.2%) | 0 (0.0%) |
| 35 to 44 Years | 634 (83.2%) | 23 (3.6%) |
| 45 to 54 Years | 326 (94.2%) | 0 (0.0%) |
| 55 to 59 Years | 252 (81.6%) | 8 (3.2%) |
| 60 to 64 Years | 151 (61.9%) | 0 (0.0%) |
| 65 to 74 Years | 95 (45.0%) | 0 (0.0%) |
| 75 Years and over | 31 (14.0%) | 0 (0.0%) |
| Total | 2,947 (79.2%) | 156 (5.3%) |
Employment Status by Educational Attainment in Cortland
According to labor force statistics for Cortland, 85.7% of individuals (2,372) out of the total population between 25 and 64 years of age (2,768) are in the labor force, with 6.1% or 145 of them being unemployed. The group with the highest labor force participation rate are those with the educational attainment of bachelor's degree or higher, with 98.1% or 881 individuals in the labor force. Within the labor force, individuals with less than high school education have the highest percentage of unemployment, with 19.5% or 23 of them being unemployed.
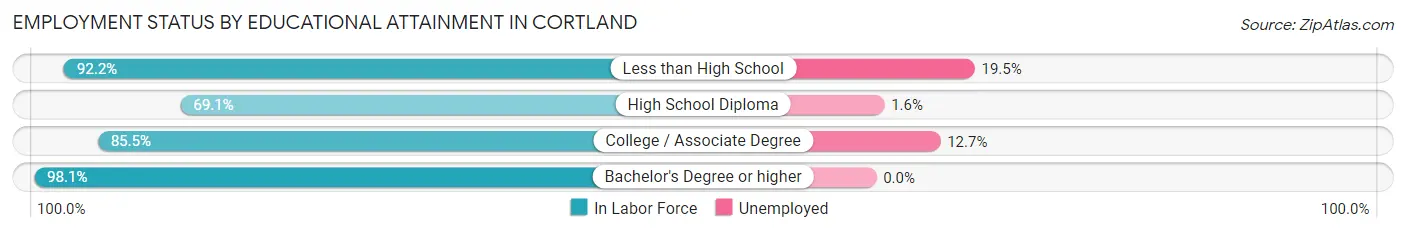
| Educational Attainment | In Labor Force | Unemployed |
| Less than High School | 118 (92.2%) | 25 (19.5%) |
| High School Diploma | 487 (69.1%) | 11 (1.6%) |
| College / Associate Degree | 887 (85.5%) | 132 (12.7%) |
| Bachelor's Degree or higher | 881 (98.1%) | 0 (0.0%) |
| Total | 2,372 (85.7%) | 169 (6.1%) |
Employment Occupations by Sex in Cortland
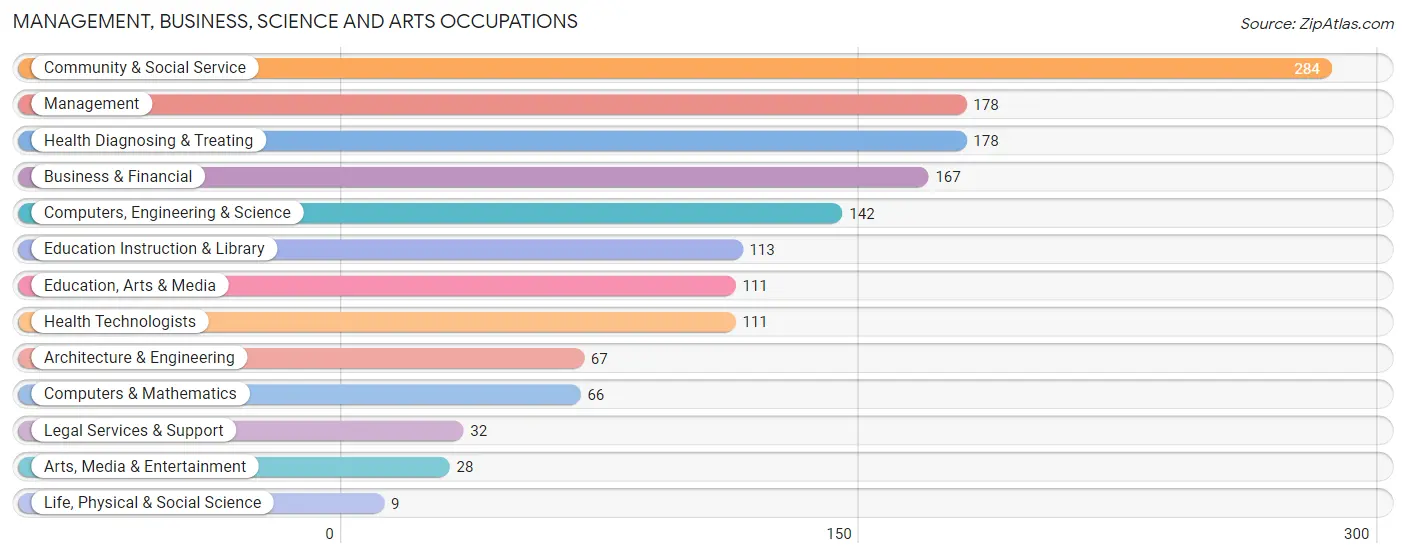
Management, Business, Science and Arts Occupations
The most common Management, Business, Science and Arts occupations in Cortland are Community & Social Service (284 | 10.2%), Management (178 | 6.4%), Health Diagnosing & Treating (178 | 6.4%), Business & Financial (167 | 6.0%), and Computers, Engineering & Science (142 | 5.1%).
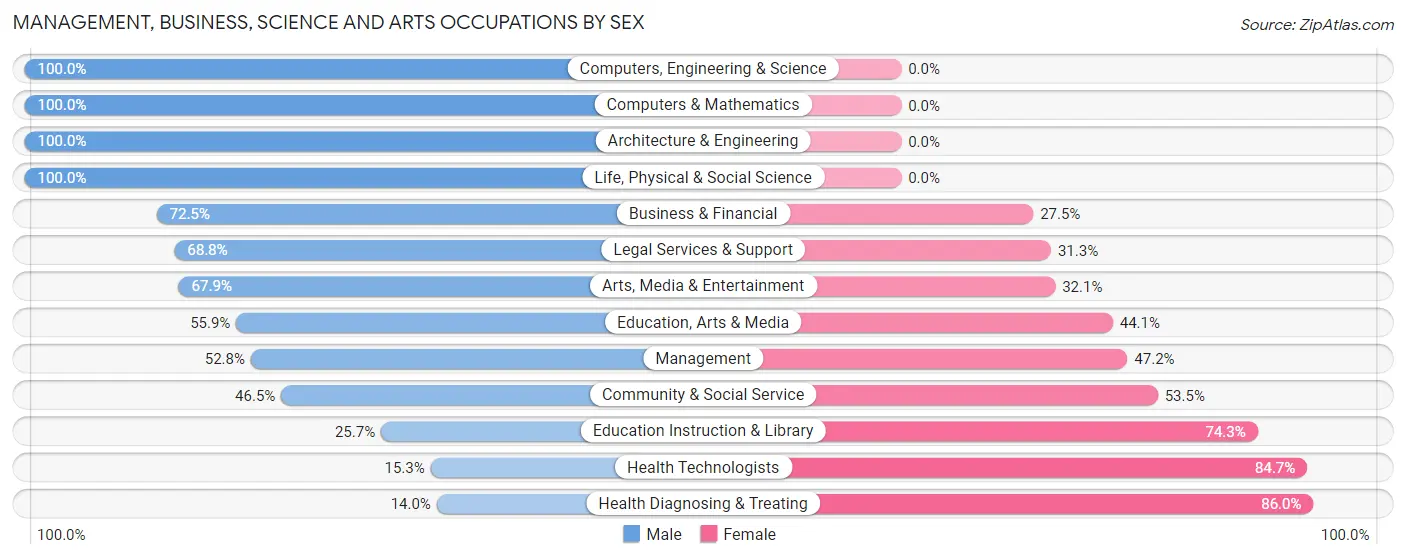
Management, Business, Science and Arts Occupations by Sex
Within the Management, Business, Science and Arts occupations in Cortland, the most male-oriented occupations are Computers, Engineering & Science (100.0%), Computers & Mathematics (100.0%), and Architecture & Engineering (100.0%), while the most female-oriented occupations are Health Diagnosing & Treating (86.0%), Health Technologists (84.7%), and Education Instruction & Library (74.3%).
| Occupation | Male | Female |
| Management | 94 (52.8%) | 84 (47.2%) |
| Business & Financial | 121 (72.5%) | 46 (27.5%) |
| Computers, Engineering & Science | 142 (100.0%) | 0 (0.0%) |
| Computers & Mathematics | 66 (100.0%) | 0 (0.0%) |
| Architecture & Engineering | 67 (100.0%) | 0 (0.0%) |
| Life, Physical & Social Science | 9 (100.0%) | 0 (0.0%) |
| Community & Social Service | 132 (46.5%) | 152 (53.5%) |
| Education, Arts & Media | 62 (55.9%) | 49 (44.1%) |
| Legal Services & Support | 22 (68.8%) | 10 (31.2%) |
| Education Instruction & Library | 29 (25.7%) | 84 (74.3%) |
| Arts, Media & Entertainment | 19 (67.9%) | 9 (32.1%) |
| Health Diagnosing & Treating | 25 (14.0%) | 153 (86.0%) |
| Health Technologists | 17 (15.3%) | 94 (84.7%) |
| Total (Category) | 514 (54.2%) | 435 (45.8%) |
| Total (Overall) | 1,518 (54.4%) | 1,272 (45.6%) |
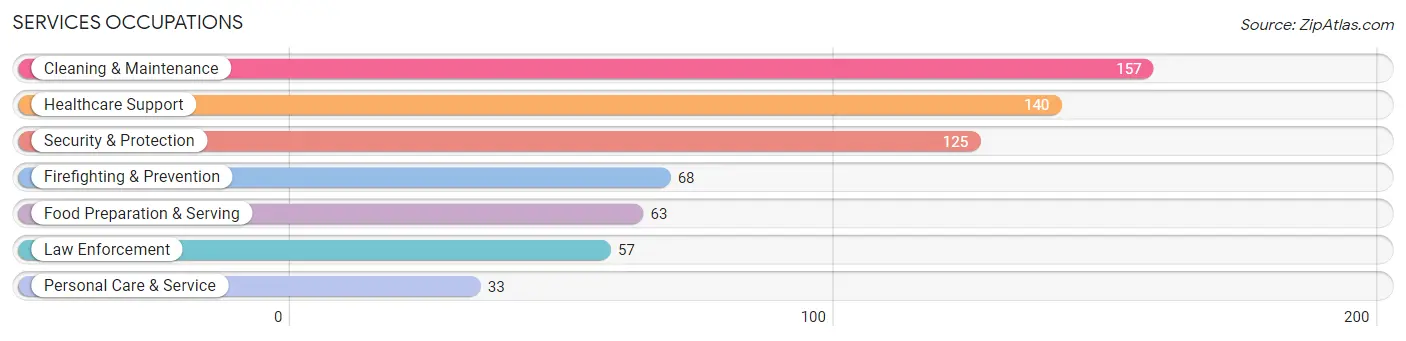
Services Occupations
The most common Services occupations in Cortland are Cleaning & Maintenance (157 | 5.6%), Healthcare Support (140 | 5.0%), Security & Protection (125 | 4.5%), Firefighting & Prevention (68 | 2.4%), and Food Preparation & Serving (63 | 2.3%).
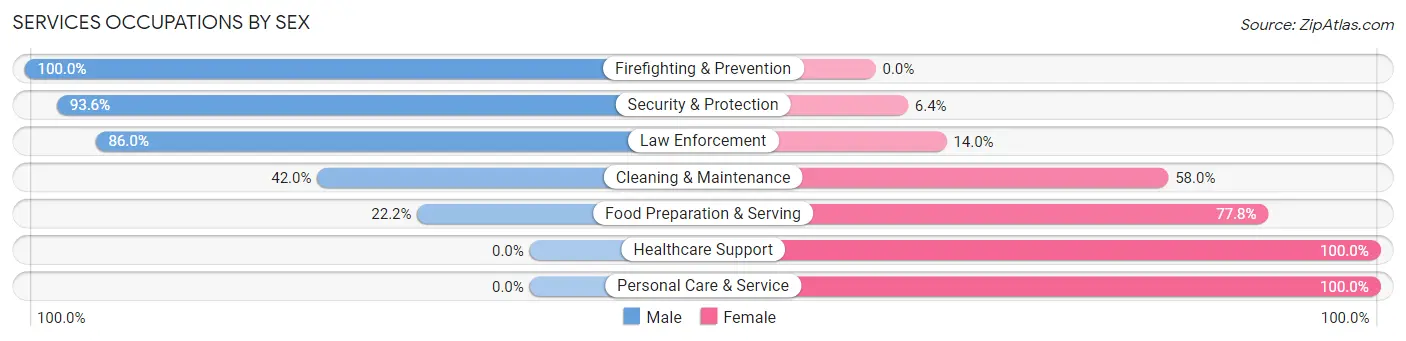
Services Occupations by Sex
Within the Services occupations in Cortland, the most male-oriented occupations are Firefighting & Prevention (100.0%), Security & Protection (93.6%), and Law Enforcement (86.0%), while the most female-oriented occupations are Healthcare Support (100.0%), Personal Care & Service (100.0%), and Food Preparation & Serving (77.8%).
| Occupation | Male | Female |
| Healthcare Support | 0 (0.0%) | 140 (100.0%) |
| Security & Protection | 117 (93.6%) | 8 (6.4%) |
| Firefighting & Prevention | 68 (100.0%) | 0 (0.0%) |
| Law Enforcement | 49 (86.0%) | 8 (14.0%) |
| Food Preparation & Serving | 14 (22.2%) | 49 (77.8%) |
| Cleaning & Maintenance | 66 (42.0%) | 91 (58.0%) |
| Personal Care & Service | 0 (0.0%) | 33 (100.0%) |
| Total (Category) | 197 (38.0%) | 321 (62.0%) |
| Total (Overall) | 1,518 (54.4%) | 1,272 (45.6%) |
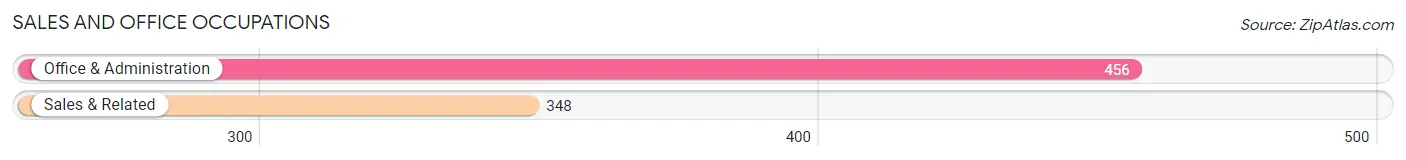
Sales and Office Occupations
The most common Sales and Office occupations in Cortland are Office & Administration (456 | 16.3%), and Sales & Related (348 | 12.5%).
Sales and Office Occupations by Sex
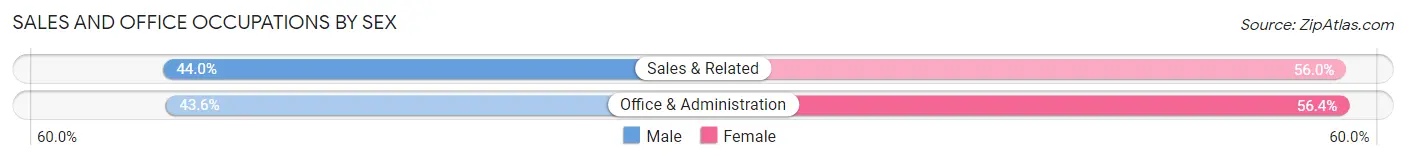
| Occupation | Male | Female |
| Sales & Related | 153 (44.0%) | 195 (56.0%) |
| Office & Administration | 199 (43.6%) | 257 (56.4%) |
| Total (Category) | 352 (43.8%) | 452 (56.2%) |
| Total (Overall) | 1,518 (54.4%) | 1,272 (45.6%) |
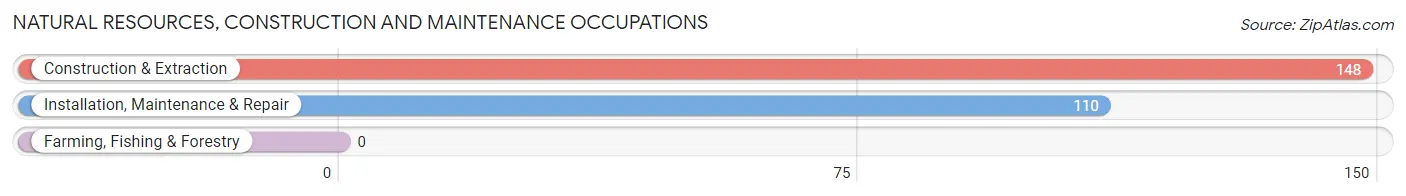
Natural Resources, Construction and Maintenance Occupations
The most common Natural Resources, Construction and Maintenance occupations in Cortland are Construction & Extraction (148 | 5.3%), and Installation, Maintenance & Repair (110 | 3.9%).
Natural Resources, Construction and Maintenance Occupations by Sex
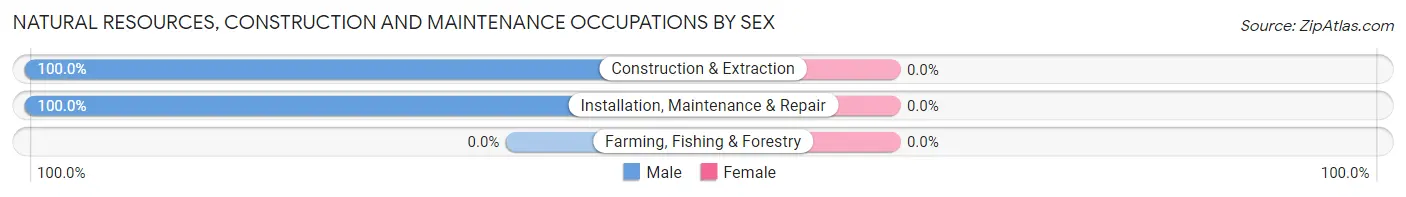
| Occupation | Male | Female |
| Farming, Fishing & Forestry | 0 (0.0%) | 0 (0.0%) |
| Construction & Extraction | 148 (100.0%) | 0 (0.0%) |
| Installation, Maintenance & Repair | 110 (100.0%) | 0 (0.0%) |
| Total (Category) | 258 (100.0%) | 0 (0.0%) |
| Total (Overall) | 1,518 (54.4%) | 1,272 (45.6%) |
Production, Transportation and Moving Occupations
The most common Production, Transportation and Moving occupations in Cortland are Production (124 | 4.4%), Transportation (109 | 3.9%), and Material Moving (28 | 1.0%).
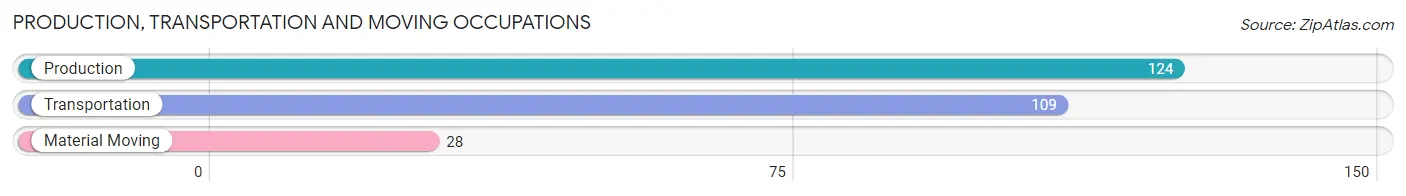
Production, Transportation and Moving Occupations by Sex
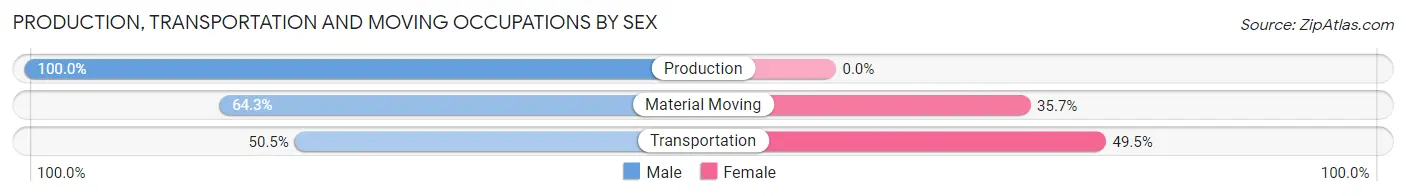
| Occupation | Male | Female |
| Production | 124 (100.0%) | 0 (0.0%) |
| Transportation | 55 (50.5%) | 54 (49.5%) |
| Material Moving | 18 (64.3%) | 10 (35.7%) |
| Total (Category) | 197 (75.5%) | 64 (24.5%) |
| Total (Overall) | 1,518 (54.4%) | 1,272 (45.6%) |
Employment Industries by Sex in Cortland
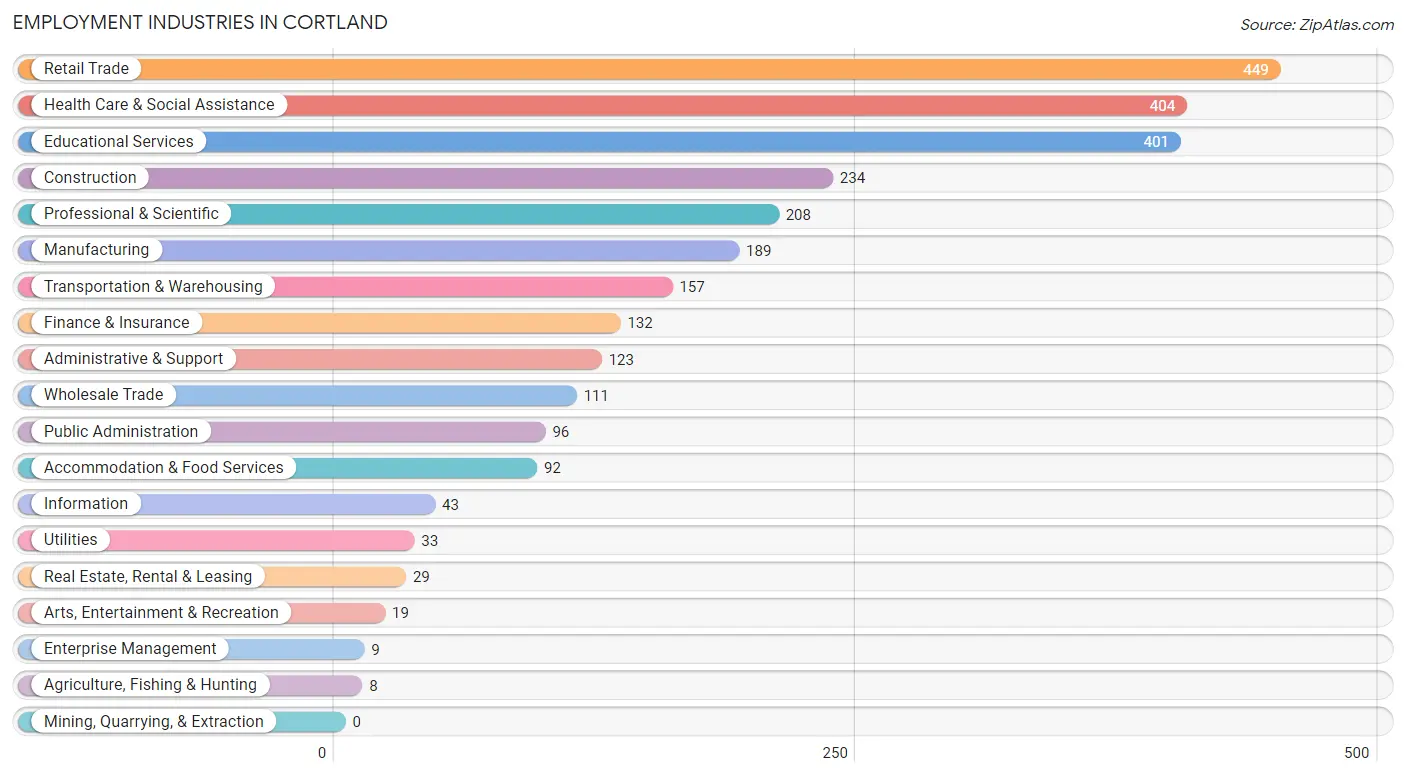
Employment Industries in Cortland
The major employment industries in Cortland include Retail Trade (449 | 16.1%), Health Care & Social Assistance (404 | 14.5%), Educational Services (401 | 14.4%), Construction (234 | 8.4%), and Professional & Scientific (208 | 7.5%).
Employment Industries by Sex in Cortland
The Cortland industries that see more men than women are Utilities (100.0%), Real Estate, Rental & Leasing (100.0%), and Construction (96.6%), whereas the industries that tend to have a higher number of women are Agriculture, Fishing & Hunting (100.0%), Enterprise Management (100.0%), and Health Care & Social Assistance (95.8%).
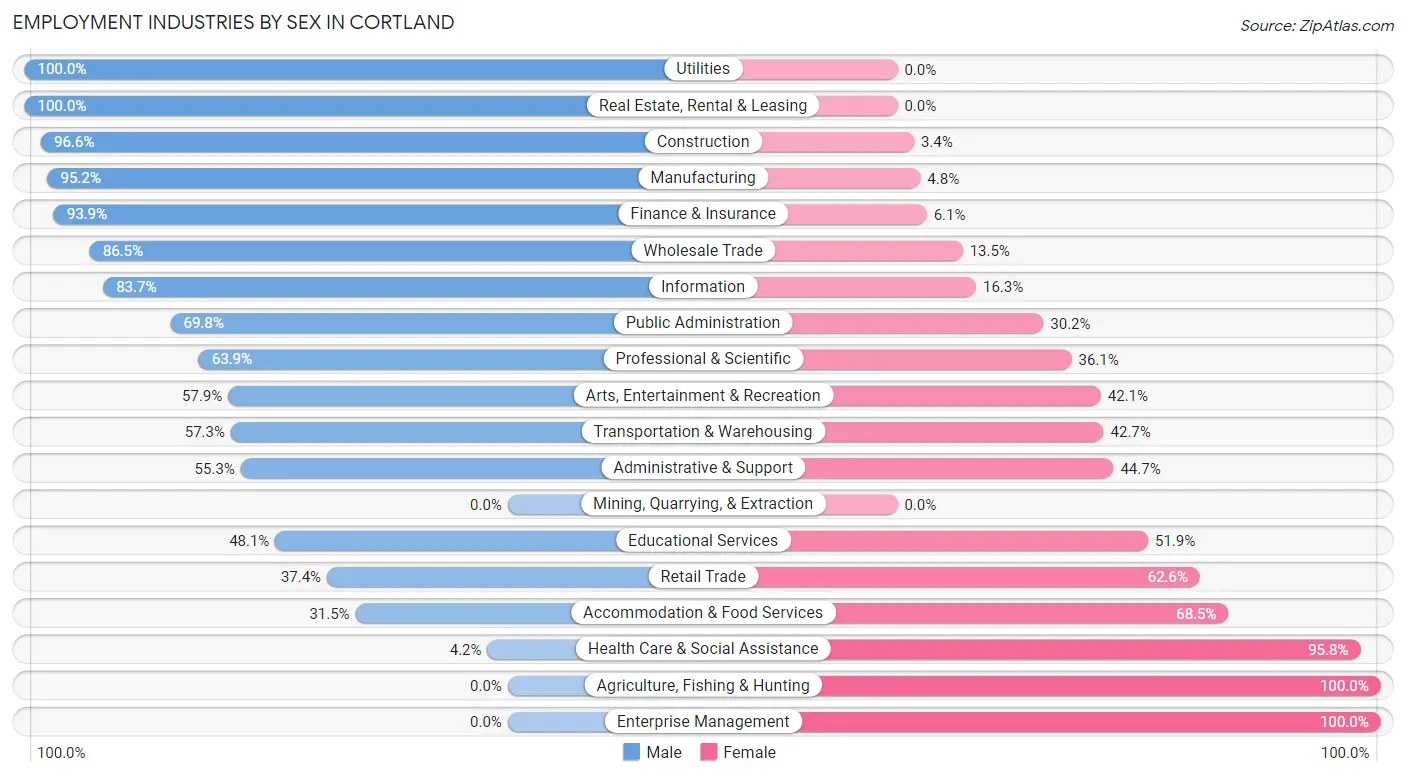
| Industry | Male | Female |
| Agriculture, Fishing & Hunting | 0 (0.0%) | 8 (100.0%) |
| Mining, Quarrying, & Extraction | 0 (0.0%) | 0 (0.0%) |
| Construction | 226 (96.6%) | 8 (3.4%) |
| Manufacturing | 180 (95.2%) | 9 (4.8%) |
| Wholesale Trade | 96 (86.5%) | 15 (13.5%) |
| Retail Trade | 168 (37.4%) | 281 (62.6%) |
| Transportation & Warehousing | 90 (57.3%) | 67 (42.7%) |
| Utilities | 33 (100.0%) | 0 (0.0%) |
| Information | 36 (83.7%) | 7 (16.3%) |
| Finance & Insurance | 124 (93.9%) | 8 (6.1%) |
| Real Estate, Rental & Leasing | 29 (100.0%) | 0 (0.0%) |
| Professional & Scientific | 133 (63.9%) | 75 (36.1%) |
| Enterprise Management | 0 (0.0%) | 9 (100.0%) |
| Administrative & Support | 68 (55.3%) | 55 (44.7%) |
| Educational Services | 193 (48.1%) | 208 (51.9%) |
| Health Care & Social Assistance | 17 (4.2%) | 387 (95.8%) |
| Arts, Entertainment & Recreation | 11 (57.9%) | 8 (42.1%) |
| Accommodation & Food Services | 29 (31.5%) | 63 (68.5%) |
| Public Administration | 67 (69.8%) | 29 (30.2%) |
| Total | 1,518 (54.4%) | 1,272 (45.6%) |
Education in Cortland
School Enrollment in Cortland
The most common levels of schooling among the 1,252 students in Cortland are middle school (323 | 25.8%), college / undergraduate (201 | 16.1%), and high school (197 | 15.7%).
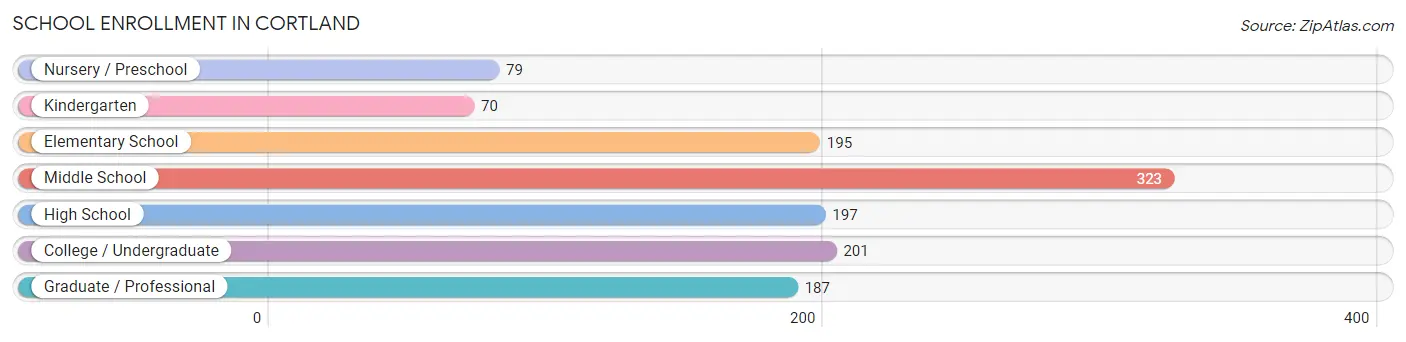
| School Level | # Students | % Students |
| Nursery / Preschool | 79 | 6.3% |
| Kindergarten | 70 | 5.6% |
| Elementary School | 195 | 15.6% |
| Middle School | 323 | 25.8% |
| High School | 197 | 15.7% |
| College / Undergraduate | 201 | 16.1% |
| Graduate / Professional | 187 | 14.9% |
| Total | 1,252 | 100.0% |
School Enrollment by Age by Funding Source in Cortland
Out of a total of 1,252 students who are enrolled in schools in Cortland, 192 (15.3%) attend a private institution, while the remaining 1,060 (84.7%) are enrolled in public schools. The age group of 15 to 17 year olds has the highest likelihood of being enrolled in private schools, with 36 (36.4% in the age bracket) enrolled. Conversely, the age group of 18 to 19 year olds has the lowest likelihood of being enrolled in a private school, with 20 (100.0% in the age bracket) attending a public institution.
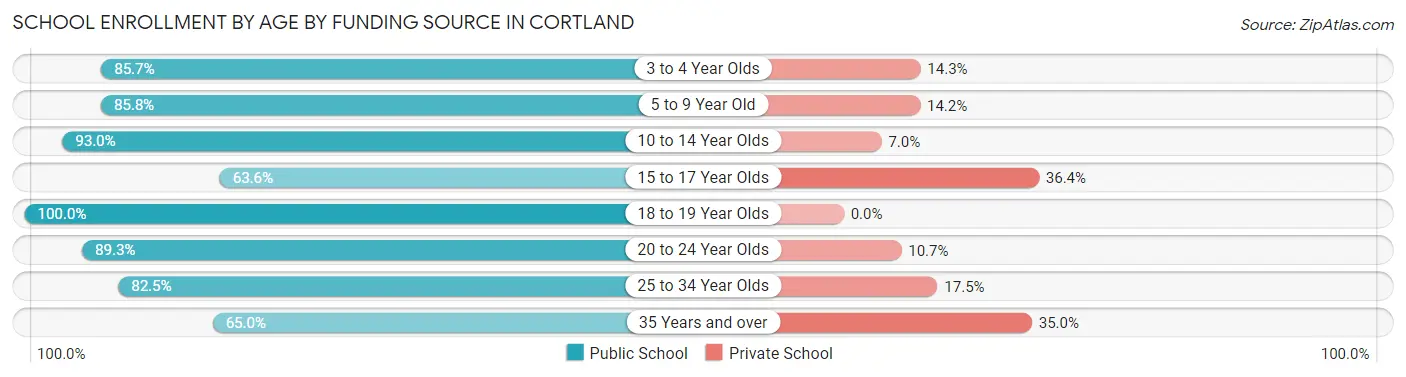
| Age Bracket | Public School | Private School |
| 3 to 4 Year Olds | 54 (85.7%) | 9 (14.3%) |
| 5 to 9 Year Old | 241 (85.8%) | 40 (14.2%) |
| 10 to 14 Year Olds | 383 (93.0%) | 29 (7.0%) |
| 15 to 17 Year Olds | 63 (63.6%) | 36 (36.4%) |
| 18 to 19 Year Olds | 20 (100.0%) | 0 (0.0%) |
| 20 to 24 Year Olds | 158 (89.3%) | 19 (10.7%) |
| 25 to 34 Year Olds | 52 (82.5%) | 11 (17.5%) |
| 35 Years and over | 89 (65.0%) | 48 (35.0%) |
| Total | 1,060 (84.7%) | 192 (15.3%) |
Educational Attainment by Field of Study in Cortland
Science & technology (249 | 22.7%), business (192 | 17.5%), education (156 | 14.2%), social sciences (141 | 12.9%), and communications (72 | 6.6%) are the most common fields of study among 1,096 individuals in Cortland who have obtained a bachelor's degree or higher.
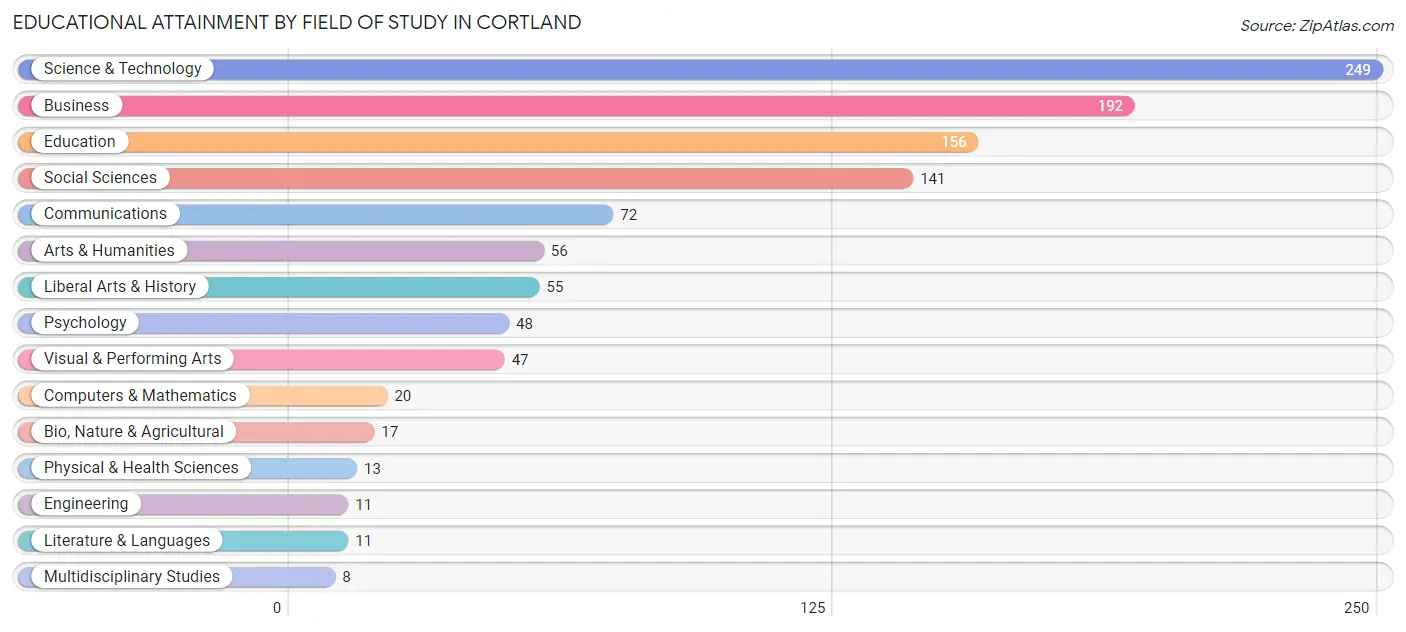
| Field of Study | # Graduates | % Graduates |
| Computers & Mathematics | 20 | 1.8% |
| Bio, Nature & Agricultural | 17 | 1.5% |
| Physical & Health Sciences | 13 | 1.2% |
| Psychology | 48 | 4.4% |
| Social Sciences | 141 | 12.9% |
| Engineering | 11 | 1.0% |
| Multidisciplinary Studies | 8 | 0.7% |
| Science & Technology | 249 | 22.7% |
| Business | 192 | 17.5% |
| Education | 156 | 14.2% |
| Literature & Languages | 11 | 1.0% |
| Liberal Arts & History | 55 | 5.0% |
| Visual & Performing Arts | 47 | 4.3% |
| Communications | 72 | 6.6% |
| Arts & Humanities | 56 | 5.1% |
| Total | 1,096 | 100.0% |
Transportation & Commute in Cortland
Vehicle Availability by Sex in Cortland
The most prevalent vehicle ownership categories in Cortland are males with 2 vehicles (624, accounting for 41.1%) and females with 2 vehicles (442, making up 49.3%).
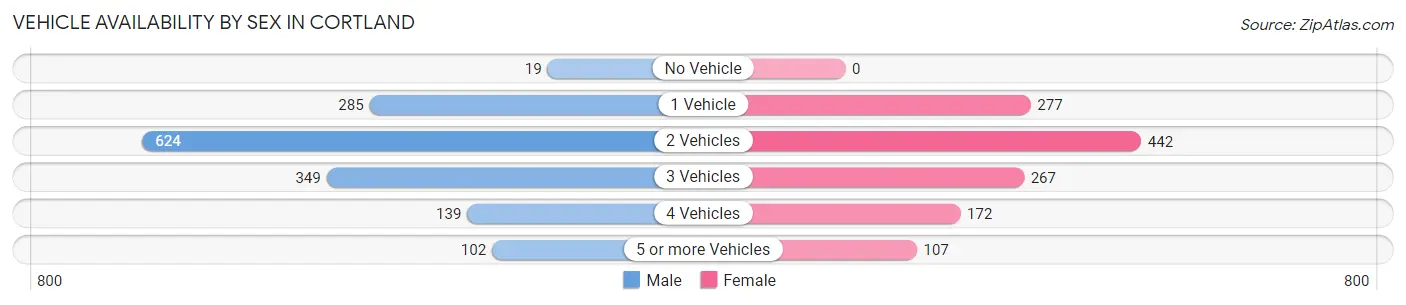
| Vehicles Available | Male | Female |
| No Vehicle | 19 (1.3%) | 0 (0.0%) |
| 1 Vehicle | 285 (18.8%) | 277 (21.9%) |
| 2 Vehicles | 624 (41.1%) | 442 (34.9%) |
| 3 Vehicles | 349 (23.0%) | 267 (21.1%) |
| 4 Vehicles | 139 (9.2%) | 172 (13.6%) |
| 5 or more Vehicles | 102 (6.7%) | 107 (8.5%) |
| Total | 1,518 (100.0%) | 1,265 (100.0%) |
Commute Time in Cortland
The most frequently occuring commute durations in Cortland are 10 to 14 minutes (599 commuters, 22.5%), 15 to 19 minutes (422 commuters, 15.9%), and 40 to 44 minutes (401 commuters, 15.1%).
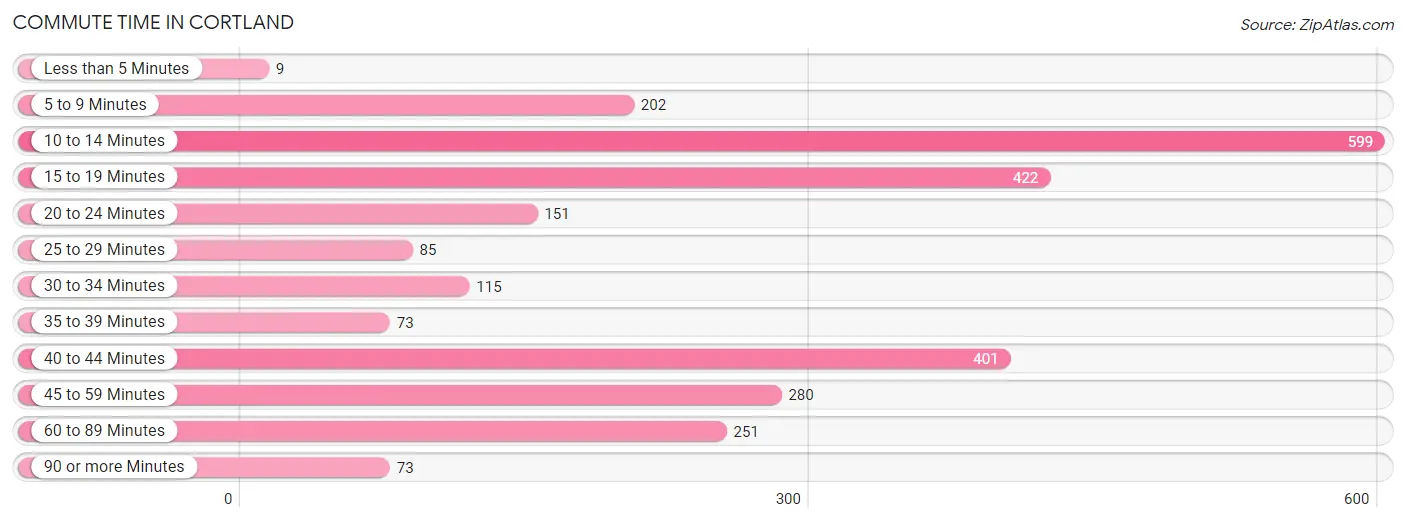
| Commute Time | # Commuters | % Commuters |
| Less than 5 Minutes | 9 | 0.3% |
| 5 to 9 Minutes | 202 | 7.6% |
| 10 to 14 Minutes | 599 | 22.5% |
| 15 to 19 Minutes | 422 | 15.9% |
| 20 to 24 Minutes | 151 | 5.7% |
| 25 to 29 Minutes | 85 | 3.2% |
| 30 to 34 Minutes | 115 | 4.3% |
| 35 to 39 Minutes | 73 | 2.7% |
| 40 to 44 Minutes | 401 | 15.1% |
| 45 to 59 Minutes | 280 | 10.5% |
| 60 to 89 Minutes | 251 | 9.4% |
| 90 or more Minutes | 73 | 2.7% |
Commute Time by Sex in Cortland
The most common commute times in Cortland are 10 to 14 minutes (260 commuters, 17.9%) for males and 10 to 14 minutes (339 commuters, 28.0%) for females.
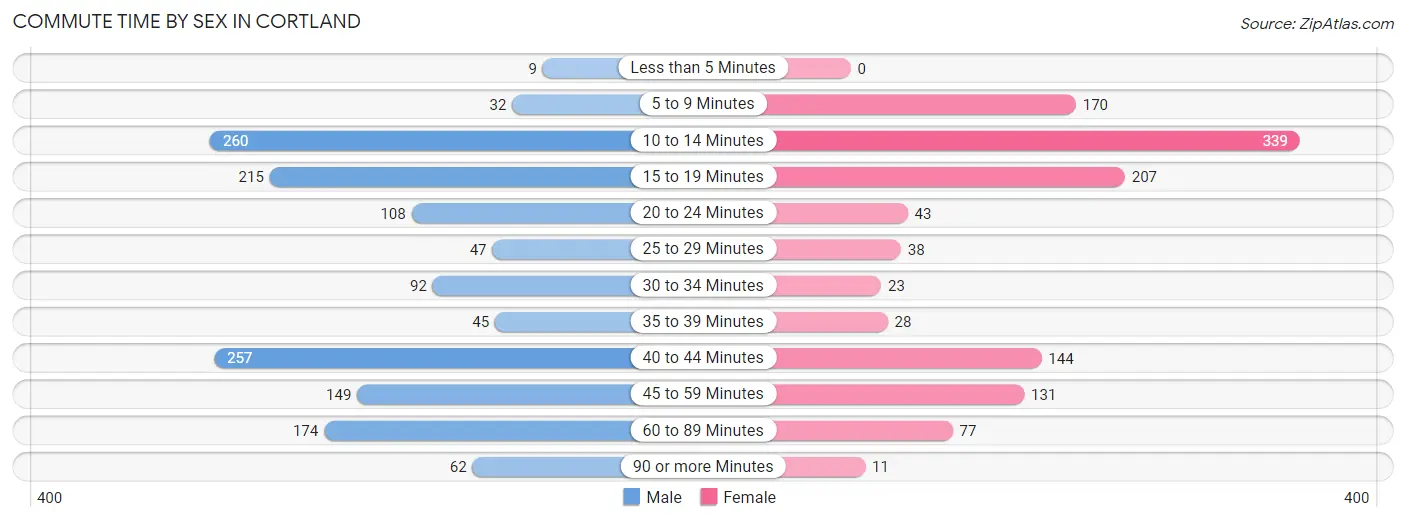
| Commute Time | Male | Female |
| Less than 5 Minutes | 9 (0.6%) | 0 (0.0%) |
| 5 to 9 Minutes | 32 (2.2%) | 170 (14.0%) |
| 10 to 14 Minutes | 260 (17.9%) | 339 (28.0%) |
| 15 to 19 Minutes | 215 (14.8%) | 207 (17.1%) |
| 20 to 24 Minutes | 108 (7.4%) | 43 (3.5%) |
| 25 to 29 Minutes | 47 (3.2%) | 38 (3.1%) |
| 30 to 34 Minutes | 92 (6.3%) | 23 (1.9%) |
| 35 to 39 Minutes | 45 (3.1%) | 28 (2.3%) |
| 40 to 44 Minutes | 257 (17.7%) | 144 (11.9%) |
| 45 to 59 Minutes | 149 (10.3%) | 131 (10.8%) |
| 60 to 89 Minutes | 174 (12.0%) | 77 (6.4%) |
| 90 or more Minutes | 62 (4.3%) | 11 (0.9%) |
Time of Departure to Work by Sex in Cortland
The most frequent times of departure to work in Cortland are 7:00 AM to 7:29 AM (227, 15.7%) for males and 5:30 AM to 5:59 AM (196, 16.2%) for females.
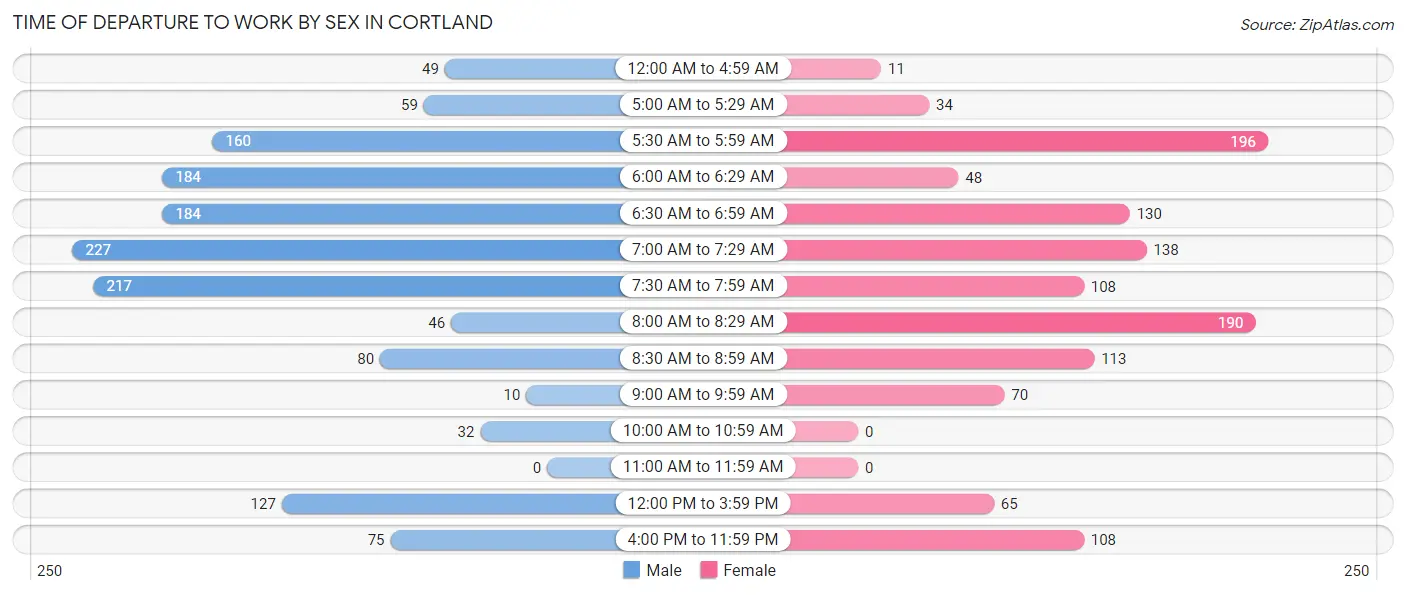
| Time of Departure | Male | Female |
| 12:00 AM to 4:59 AM | 49 (3.4%) | 11 (0.9%) |
| 5:00 AM to 5:29 AM | 59 (4.1%) | 34 (2.8%) |
| 5:30 AM to 5:59 AM | 160 (11.0%) | 196 (16.2%) |
| 6:00 AM to 6:29 AM | 184 (12.7%) | 48 (4.0%) |
| 6:30 AM to 6:59 AM | 184 (12.7%) | 130 (10.7%) |
| 7:00 AM to 7:29 AM | 227 (15.7%) | 138 (11.4%) |
| 7:30 AM to 7:59 AM | 217 (15.0%) | 108 (8.9%) |
| 8:00 AM to 8:29 AM | 46 (3.2%) | 190 (15.7%) |
| 8:30 AM to 8:59 AM | 80 (5.5%) | 113 (9.3%) |
| 9:00 AM to 9:59 AM | 10 (0.7%) | 70 (5.8%) |
| 10:00 AM to 10:59 AM | 32 (2.2%) | 0 (0.0%) |
| 11:00 AM to 11:59 AM | 0 (0.0%) | 0 (0.0%) |
| 12:00 PM to 3:59 PM | 127 (8.8%) | 65 (5.4%) |
| 4:00 PM to 11:59 PM | 75 (5.2%) | 108 (8.9%) |
| Total | 1,450 (100.0%) | 1,211 (100.0%) |
Housing Occupancy in Cortland
Occupancy by Ownership in Cortland
Of the total 1,673 dwellings in Cortland, owner-occupied units account for 1,219 (72.9%), while renter-occupied units make up 454 (27.1%).
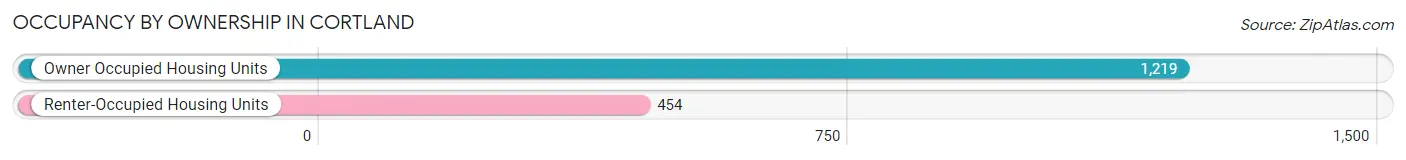
| Occupancy | # Housing Units | % Housing Units |
| Owner Occupied Housing Units | 1,219 | 72.9% |
| Renter-Occupied Housing Units | 454 | 27.1% |
| Total Occupied Housing Units | 1,673 | 100.0% |
Occupancy by Household Size in Cortland
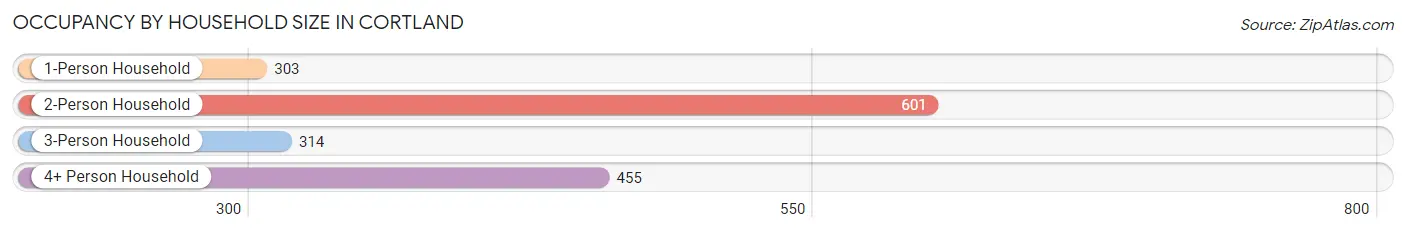
| Household Size | # Housing Units | % Housing Units |
| 1-Person Household | 303 | 18.1% |
| 2-Person Household | 601 | 35.9% |
| 3-Person Household | 314 | 18.8% |
| 4+ Person Household | 455 | 27.2% |
| Total Housing Units | 1,673 | 100.0% |
Occupancy by Ownership by Household Size in Cortland
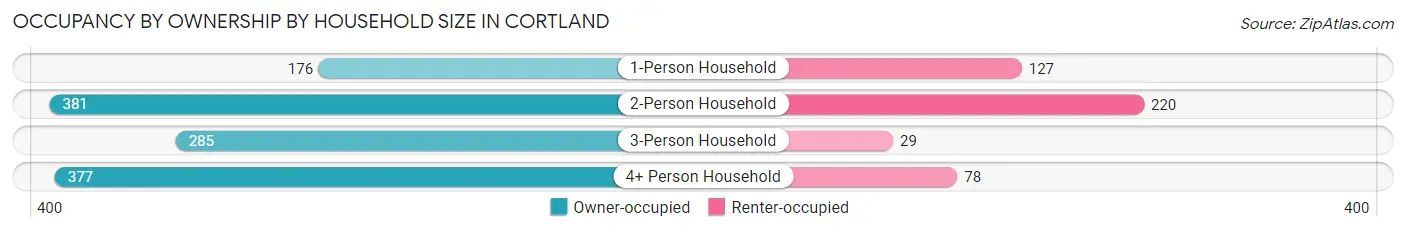
| Household Size | Owner-occupied | Renter-occupied |
| 1-Person Household | 176 (58.1%) | 127 (41.9%) |
| 2-Person Household | 381 (63.4%) | 220 (36.6%) |
| 3-Person Household | 285 (90.8%) | 29 (9.2%) |
| 4+ Person Household | 377 (82.9%) | 78 (17.1%) |
| Total Housing Units | 1,219 (72.9%) | 454 (27.1%) |
Occupancy by Educational Attainment in Cortland
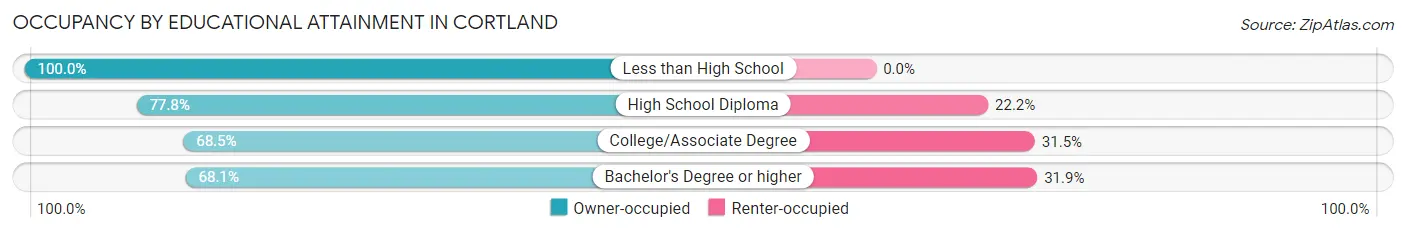
| Household Size | Owner-occupied | Renter-occupied |
| Less than High School | 151 (100.0%) | 0 (0.0%) |
| High School Diploma | 235 (77.8%) | 67 (22.2%) |
| College/Associate Degree | 381 (68.5%) | 175 (31.5%) |
| Bachelor's Degree or higher | 452 (68.1%) | 212 (31.9%) |
Occupancy by Age of Householder in Cortland
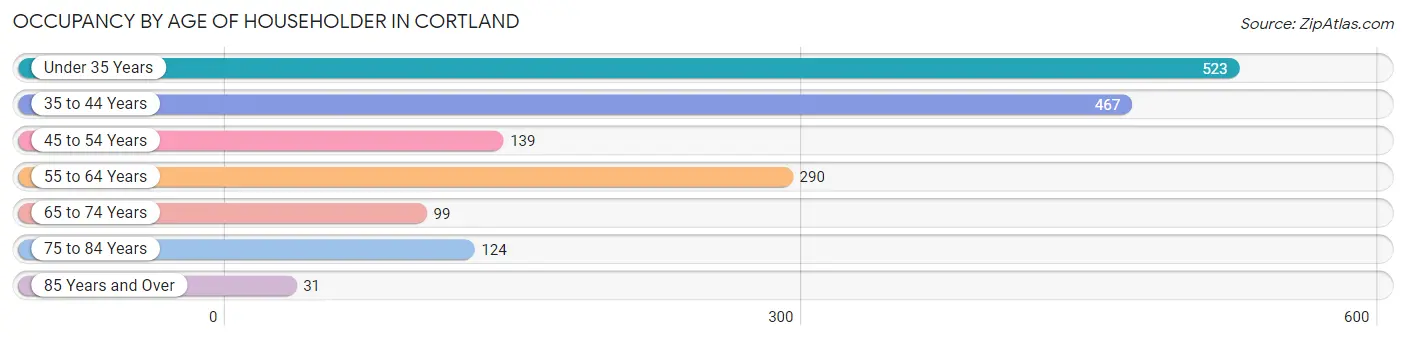
| Age Bracket | # Households | % Households |
| Under 35 Years | 523 | 31.3% |
| 35 to 44 Years | 467 | 27.9% |
| 45 to 54 Years | 139 | 8.3% |
| 55 to 64 Years | 290 | 17.3% |
| 65 to 74 Years | 99 | 5.9% |
| 75 to 84 Years | 124 | 7.4% |
| 85 Years and Over | 31 | 1.8% |
| Total | 1,673 | 100.0% |
Housing Finances in Cortland
Median Income by Occupancy in Cortland
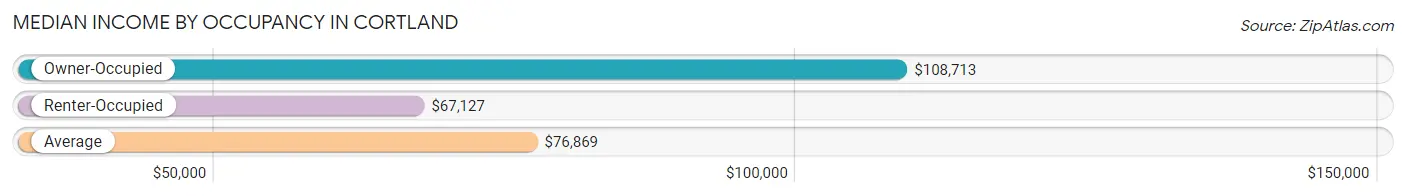
| Occupancy Type | # Households | Median Income |
| Owner-Occupied | 1,219 (72.9%) | $108,713 |
| Renter-Occupied | 454 (27.1%) | $67,127 |
| Average | 1,673 (100.0%) | $76,869 |
Occupancy by Householder Income Bracket in Cortland
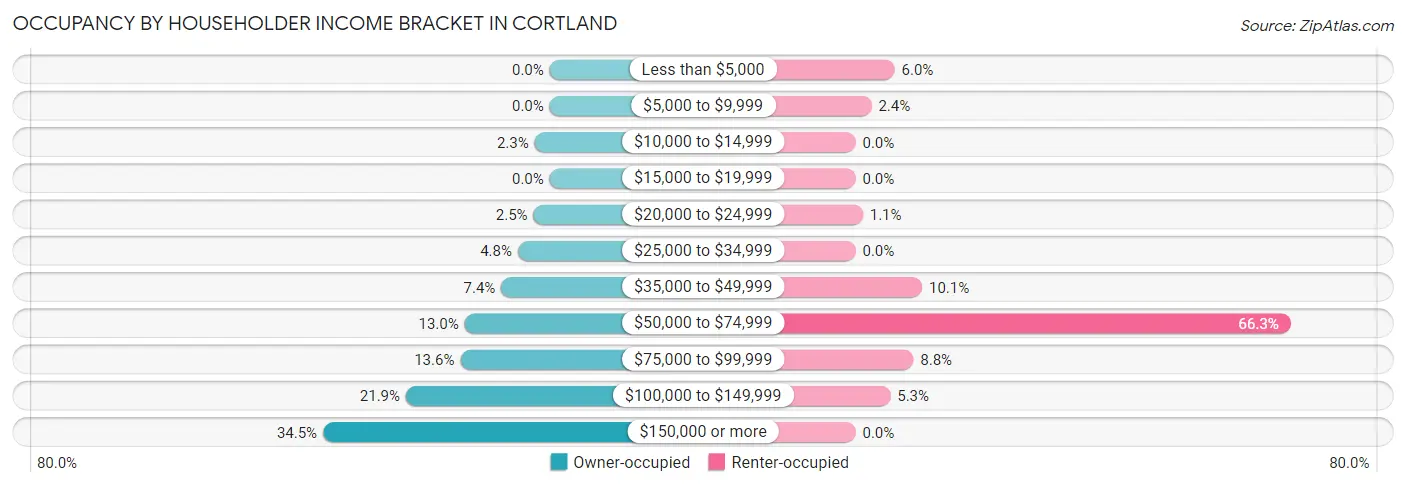
| Income Bracket | Owner-occupied | Renter-occupied |
| Less than $5,000 | 0 (0.0%) | 27 (5.9%) |
| $5,000 to $9,999 | 0 (0.0%) | 11 (2.4%) |
| $10,000 to $14,999 | 28 (2.3%) | 0 (0.0%) |
| $15,000 to $19,999 | 0 (0.0%) | 0 (0.0%) |
| $20,000 to $24,999 | 30 (2.5%) | 5 (1.1%) |
| $25,000 to $34,999 | 59 (4.8%) | 0 (0.0%) |
| $35,000 to $49,999 | 90 (7.4%) | 46 (10.1%) |
| $50,000 to $74,999 | 158 (13.0%) | 301 (66.3%) |
| $75,000 to $99,999 | 166 (13.6%) | 40 (8.8%) |
| $100,000 to $149,999 | 267 (21.9%) | 24 (5.3%) |
| $150,000 or more | 421 (34.5%) | 0 (0.0%) |
| Total | 1,219 (100.0%) | 454 (100.0%) |
Monthly Housing Cost Tiers in Cortland
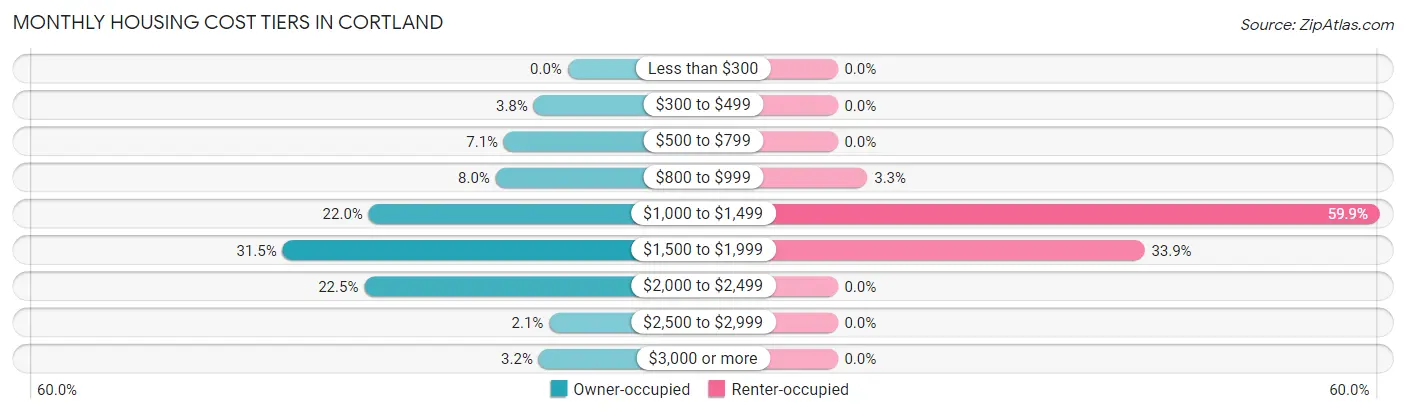
| Monthly Cost | Owner-occupied | Renter-occupied |
| Less than $300 | 0 (0.0%) | 0 (0.0%) |
| $300 to $499 | 46 (3.8%) | 0 (0.0%) |
| $500 to $799 | 86 (7.0%) | 0 (0.0%) |
| $800 to $999 | 97 (8.0%) | 15 (3.3%) |
| $1,000 to $1,499 | 268 (22.0%) | 272 (59.9%) |
| $1,500 to $1,999 | 384 (31.5%) | 154 (33.9%) |
| $2,000 to $2,499 | 274 (22.5%) | 0 (0.0%) |
| $2,500 to $2,999 | 25 (2.1%) | 0 (0.0%) |
| $3,000 or more | 39 (3.2%) | 0 (0.0%) |
| Total | 1,219 (100.0%) | 454 (100.0%) |
Physical Housing Characteristics in Cortland
Housing Structures in Cortland
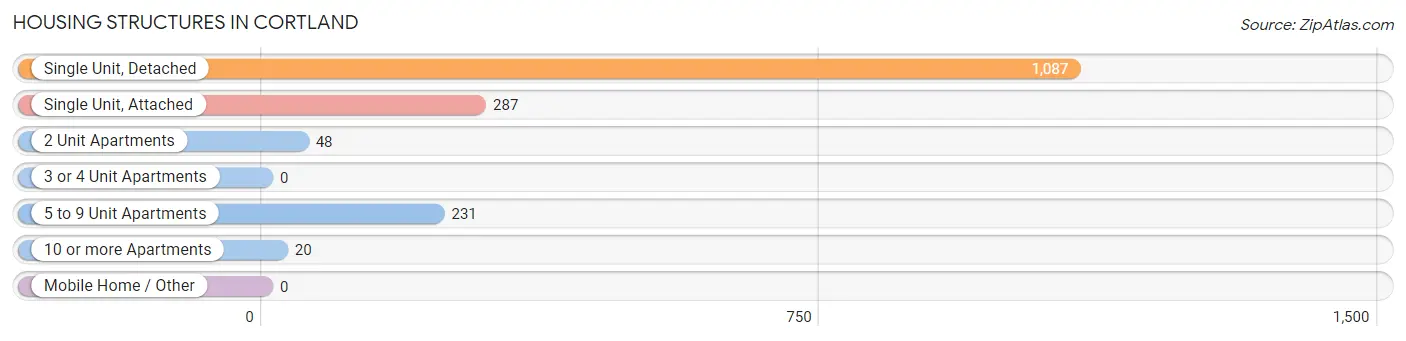
| Structure Type | # Housing Units | % Housing Units |
| Single Unit, Detached | 1,087 | 65.0% |
| Single Unit, Attached | 287 | 17.2% |
| 2 Unit Apartments | 48 | 2.9% |
| 3 or 4 Unit Apartments | 0 | 0.0% |
| 5 to 9 Unit Apartments | 231 | 13.8% |
| 10 or more Apartments | 20 | 1.2% |
| Mobile Home / Other | 0 | 0.0% |
| Total | 1,673 | 100.0% |
Housing Structures by Occupancy in Cortland
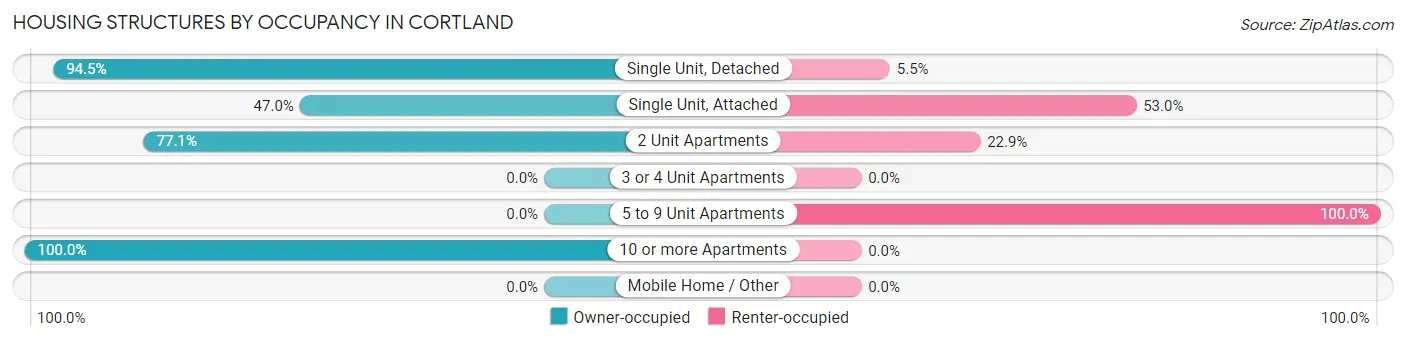
| Structure Type | Owner-occupied | Renter-occupied |
| Single Unit, Detached | 1,027 (94.5%) | 60 (5.5%) |
| Single Unit, Attached | 135 (47.0%) | 152 (53.0%) |
| 2 Unit Apartments | 37 (77.1%) | 11 (22.9%) |
| 3 or 4 Unit Apartments | 0 (0.0%) | 0 (0.0%) |
| 5 to 9 Unit Apartments | 0 (0.0%) | 231 (100.0%) |
| 10 or more Apartments | 20 (100.0%) | 0 (0.0%) |
| Mobile Home / Other | 0 (0.0%) | 0 (0.0%) |
| Total | 1,219 (72.9%) | 454 (27.1%) |
Housing Structures by Number of Rooms in Cortland
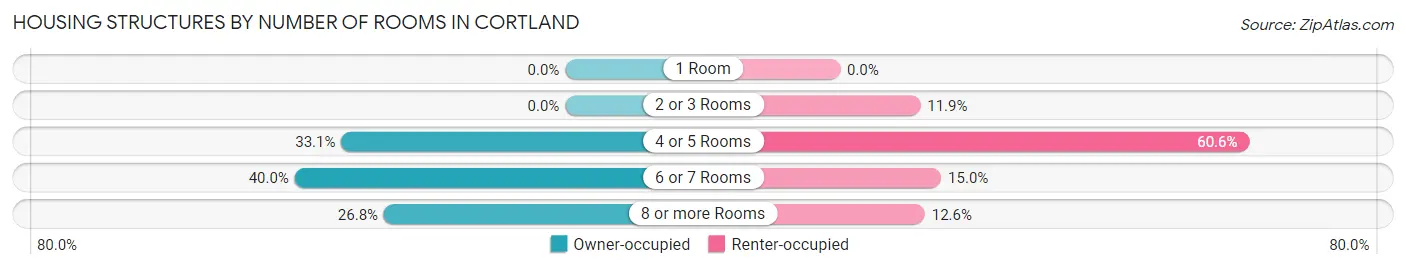
| Number of Rooms | Owner-occupied | Renter-occupied |
| 1 Room | 0 (0.0%) | 0 (0.0%) |
| 2 or 3 Rooms | 0 (0.0%) | 54 (11.9%) |
| 4 or 5 Rooms | 404 (33.1%) | 275 (60.6%) |
| 6 or 7 Rooms | 488 (40.0%) | 68 (15.0%) |
| 8 or more Rooms | 327 (26.8%) | 57 (12.6%) |
| Total | 1,219 (100.0%) | 454 (100.0%) |
Housing Structure by Heating Type in Cortland
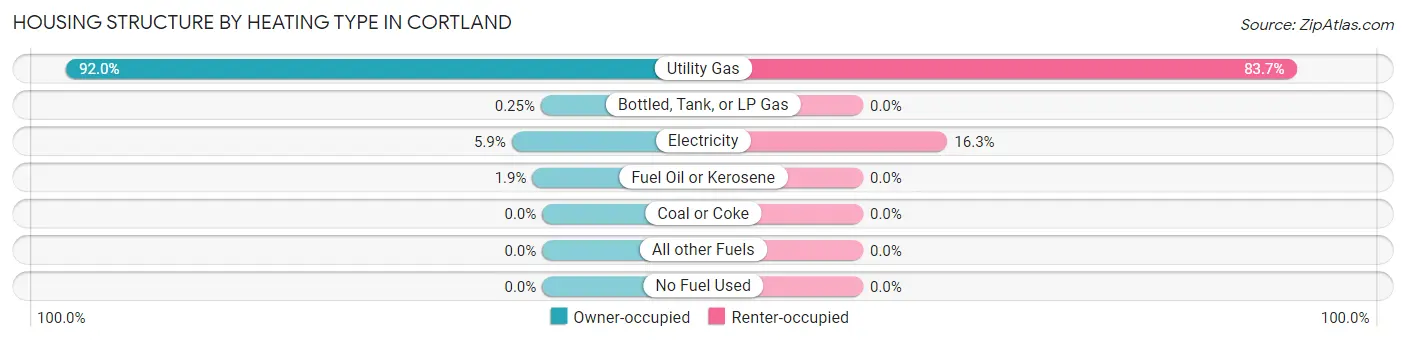
| Heating Type | Owner-occupied | Renter-occupied |
| Utility Gas | 1,121 (92.0%) | 380 (83.7%) |
| Bottled, Tank, or LP Gas | 3 (0.3%) | 0 (0.0%) |
| Electricity | 72 (5.9%) | 74 (16.3%) |
| Fuel Oil or Kerosene | 23 (1.9%) | 0 (0.0%) |
| Coal or Coke | 0 (0.0%) | 0 (0.0%) |
| All other Fuels | 0 (0.0%) | 0 (0.0%) |
| No Fuel Used | 0 (0.0%) | 0 (0.0%) |
| Total | 1,219 (100.0%) | 454 (100.0%) |
Household Vehicle Usage in Cortland
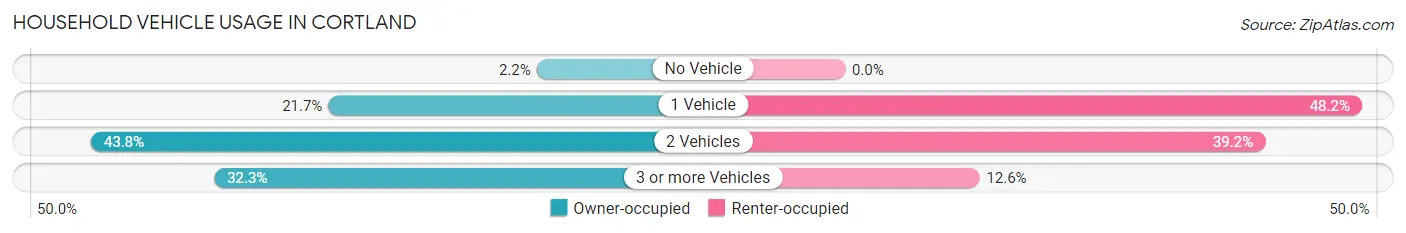
| Vehicles per Household | Owner-occupied | Renter-occupied |
| No Vehicle | 27 (2.2%) | 0 (0.0%) |
| 1 Vehicle | 264 (21.7%) | 219 (48.2%) |
| 2 Vehicles | 534 (43.8%) | 178 (39.2%) |
| 3 or more Vehicles | 394 (32.3%) | 57 (12.6%) |
| Total | 1,219 (100.0%) | 454 (100.0%) |
Real Estate & Mortgages in Cortland
Real Estate and Mortgage Overview in Cortland
| Characteristic | Without Mortgage | With Mortgage |
| Housing Units | 226 | 993 |
| Median Property Value | $195,500 | $196,500 |
| Median Household Income | $75,313 | $389 |
| Monthly Housing Costs | $816 | $39 |
| Real Estate Taxes | $5,916 | $37 |
Property Value by Mortgage Status in Cortland
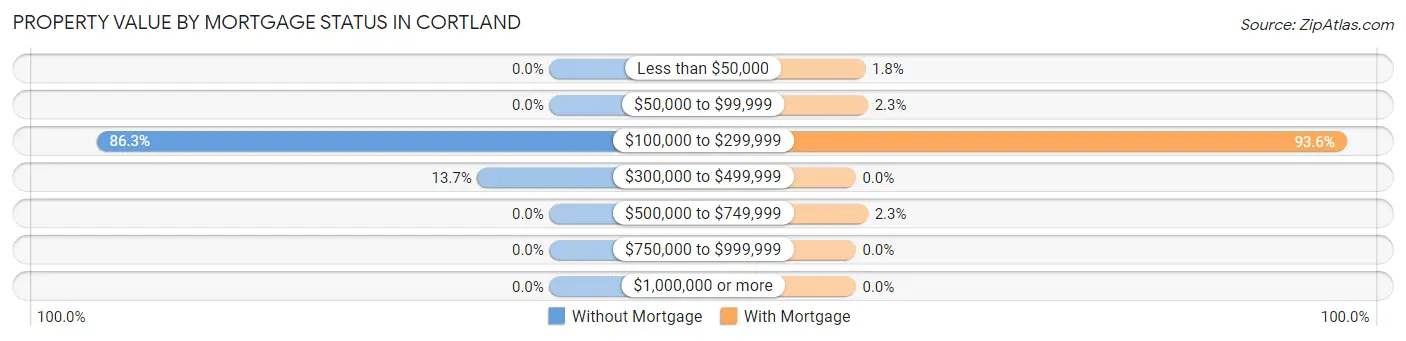
| Property Value | Without Mortgage | With Mortgage |
| Less than $50,000 | 0 (0.0%) | 18 (1.8%) |
| $50,000 to $99,999 | 0 (0.0%) | 23 (2.3%) |
| $100,000 to $299,999 | 195 (86.3%) | 929 (93.5%) |
| $300,000 to $499,999 | 31 (13.7%) | 0 (0.0%) |
| $500,000 to $749,999 | 0 (0.0%) | 23 (2.3%) |
| $750,000 to $999,999 | 0 (0.0%) | 0 (0.0%) |
| $1,000,000 or more | 0 (0.0%) | 0 (0.0%) |
| Total | 226 (100.0%) | 993 (100.0%) |
Household Income by Mortgage Status in Cortland
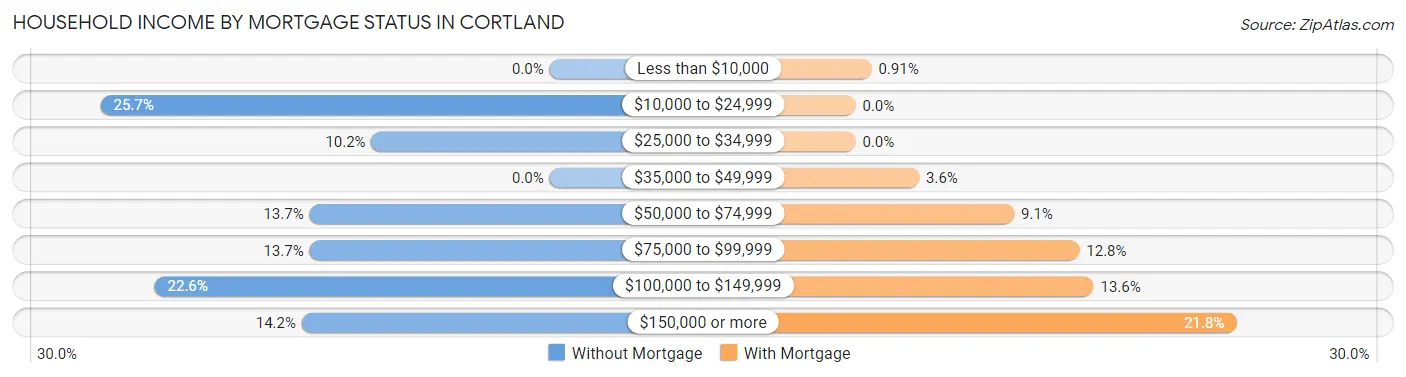
| Household Income | Without Mortgage | With Mortgage |
| Less than $10,000 | 0 (0.0%) | 9 (0.9%) |
| $10,000 to $24,999 | 58 (25.7%) | 0 (0.0%) |
| $25,000 to $34,999 | 23 (10.2%) | 0 (0.0%) |
| $35,000 to $49,999 | 0 (0.0%) | 36 (3.6%) |
| $50,000 to $74,999 | 31 (13.7%) | 90 (9.1%) |
| $75,000 to $99,999 | 31 (13.7%) | 127 (12.8%) |
| $100,000 to $149,999 | 51 (22.6%) | 135 (13.6%) |
| $150,000 or more | 32 (14.2%) | 216 (21.7%) |
| Total | 226 (100.0%) | 993 (100.0%) |
Property Value to Household Income Ratio in Cortland
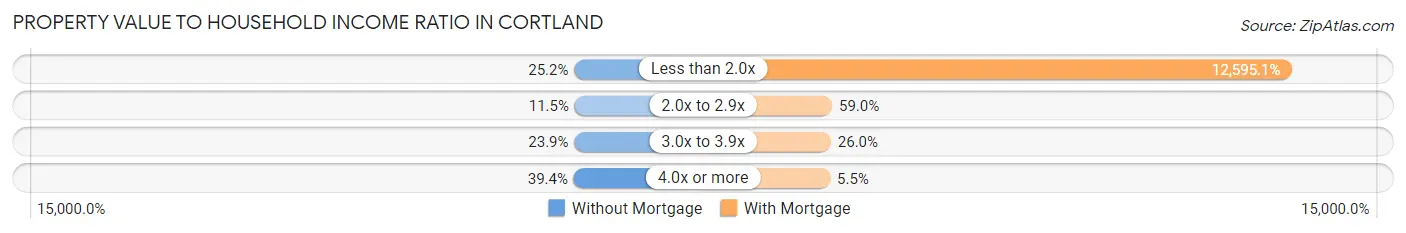
| Value-to-Income Ratio | Without Mortgage | With Mortgage |
| Less than 2.0x | 57 (25.2%) | 125,069 (12,595.1%) |
| 2.0x to 2.9x | 26 (11.5%) | 586 (59.0%) |
| 3.0x to 3.9x | 54 (23.9%) | 258 (26.0%) |
| 4.0x or more | 89 (39.4%) | 55 (5.5%) |
| Total | 226 (100.0%) | 993 (100.0%) |
Real Estate Taxes by Mortgage Status in Cortland
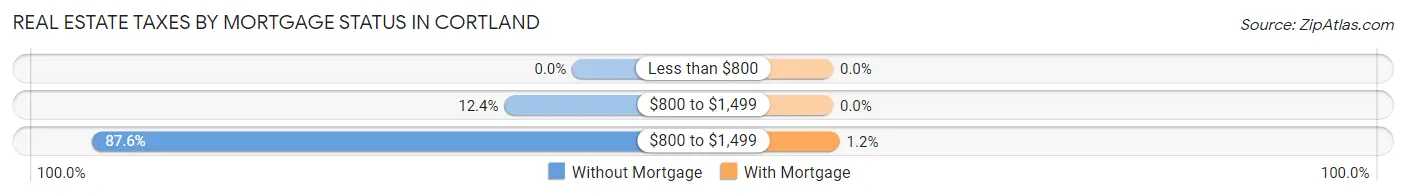
| Property Taxes | Without Mortgage | With Mortgage |
| Less than $800 | 0 (0.0%) | 0 (0.0%) |
| $800 to $1,499 | 28 (12.4%) | 0 (0.0%) |
| $800 to $1,499 | 198 (87.6%) | 12 (1.2%) |
| Total | 226 (100.0%) | 993 (100.0%) |
Health & Disability in Cortland
Health Insurance Coverage by Age in Cortland
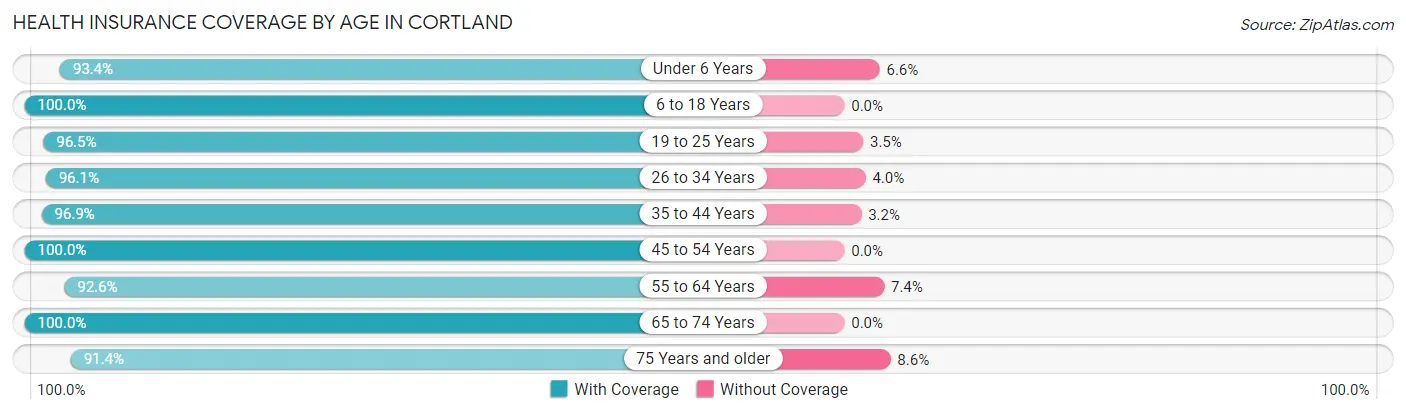
| Age Bracket | With Coverage | Without Coverage |
| Under 6 Years | 327 (93.4%) | 23 (6.6%) |
| 6 to 18 Years | 768 (100.0%) | 0 (0.0%) |
| 19 to 25 Years | 443 (96.5%) | 16 (3.5%) |
| 26 to 34 Years | 1,022 (96.1%) | 42 (4.0%) |
| 35 to 44 Years | 738 (96.9%) | 24 (3.2%) |
| 45 to 54 Years | 346 (100.0%) | 0 (0.0%) |
| 55 to 64 Years | 512 (92.6%) | 41 (7.4%) |
| 65 to 74 Years | 211 (100.0%) | 0 (0.0%) |
| 75 Years and older | 202 (91.4%) | 19 (8.6%) |
| Total | 4,569 (96.5%) | 165 (3.5%) |
Health Insurance Coverage by Citizenship Status in Cortland
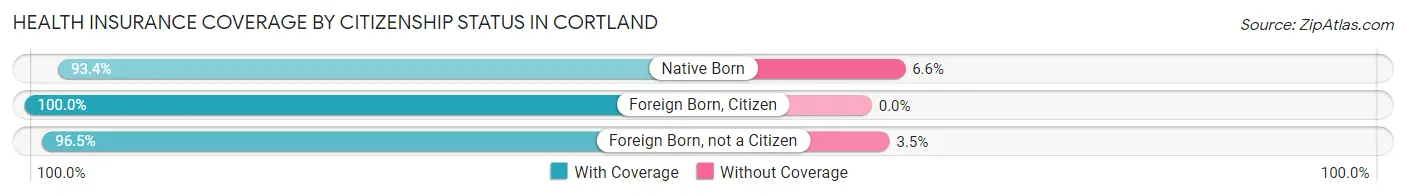
| Citizenship Status | With Coverage | Without Coverage |
| Native Born | 327 (93.4%) | 23 (6.6%) |
| Foreign Born, Citizen | 768 (100.0%) | 0 (0.0%) |
| Foreign Born, not a Citizen | 443 (96.5%) | 16 (3.5%) |
Health Insurance Coverage by Household Income in Cortland
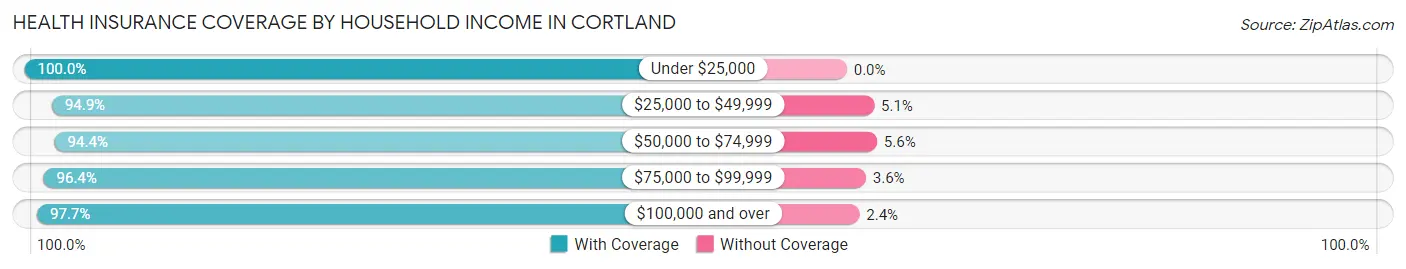
| Household Income | With Coverage | Without Coverage |
| Under $25,000 | 101 (100.0%) | 0 (0.0%) |
| $25,000 to $49,999 | 389 (94.9%) | 21 (5.1%) |
| $50,000 to $74,999 | 1,021 (94.4%) | 61 (5.6%) |
| $75,000 to $99,999 | 730 (96.4%) | 27 (3.6%) |
| $100,000 and over | 2,328 (97.7%) | 56 (2.4%) |
Public vs Private Health Insurance Coverage by Age in Cortland
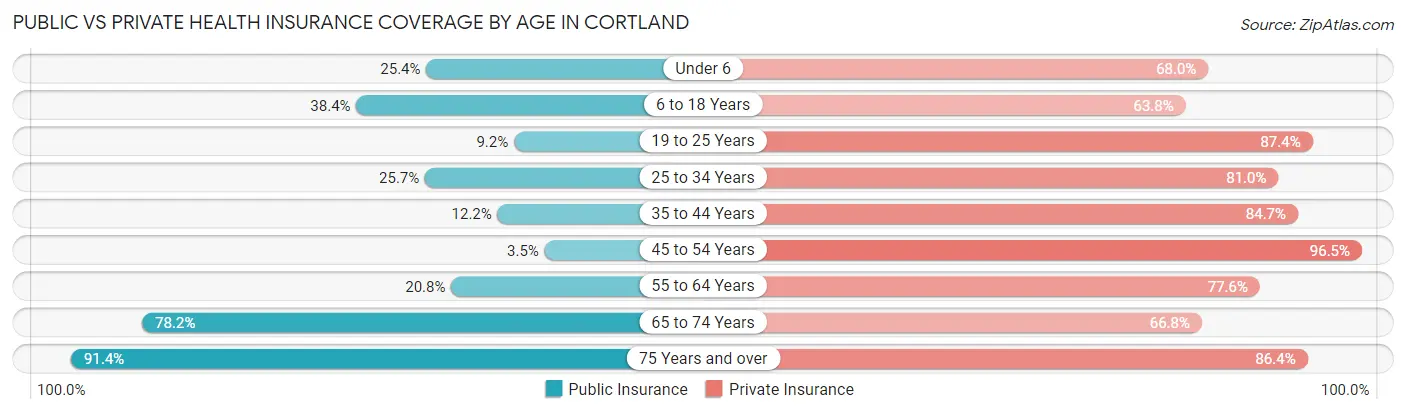
| Age Bracket | Public Insurance | Private Insurance |
| Under 6 | 89 (25.4%) | 238 (68.0%) |
| 6 to 18 Years | 295 (38.4%) | 490 (63.8%) |
| 19 to 25 Years | 42 (9.1%) | 401 (87.4%) |
| 25 to 34 Years | 273 (25.7%) | 862 (81.0%) |
| 35 to 44 Years | 93 (12.2%) | 645 (84.7%) |
| 45 to 54 Years | 12 (3.5%) | 334 (96.5%) |
| 55 to 64 Years | 115 (20.8%) | 429 (77.6%) |
| 65 to 74 Years | 165 (78.2%) | 141 (66.8%) |
| 75 Years and over | 202 (91.4%) | 191 (86.4%) |
| Total | 1,286 (27.2%) | 3,731 (78.8%) |
Disability Status by Sex by Age in Cortland
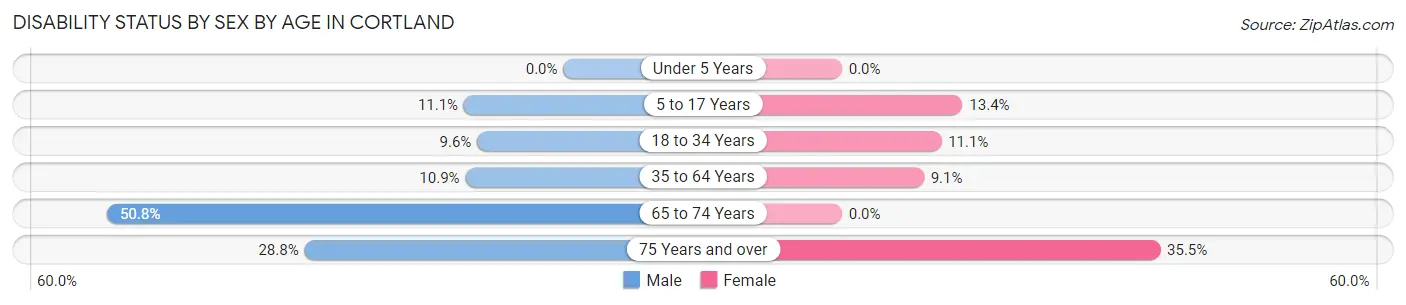
| Age Bracket | Male | Female |
| Under 5 Years | 0 (0.0%) | 0 (0.0%) |
| 5 to 17 Years | 59 (11.1%) | 36 (13.4%) |
| 18 to 34 Years | 77 (9.6%) | 82 (11.1%) |
| 35 to 64 Years | 101 (10.9%) | 67 (9.1%) |
| 65 to 74 Years | 62 (50.8%) | 0 (0.0%) |
| 75 Years and over | 32 (28.8%) | 39 (35.4%) |
Disability Class by Sex by Age in Cortland
Disability Class: Hearing Difficulty
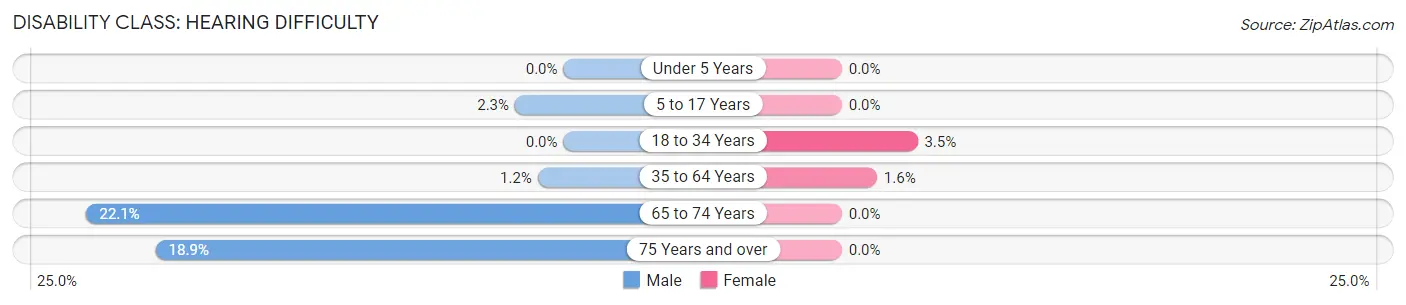
| Age Bracket | Male | Female |
| Under 5 Years | 0 (0.0%) | 0 (0.0%) |
| 5 to 17 Years | 12 (2.2%) | 0 (0.0%) |
| 18 to 34 Years | 0 (0.0%) | 26 (3.5%) |
| 35 to 64 Years | 11 (1.2%) | 12 (1.6%) |
| 65 to 74 Years | 27 (22.1%) | 0 (0.0%) |
| 75 Years and over | 21 (18.9%) | 0 (0.0%) |
Disability Class: Vision Difficulty
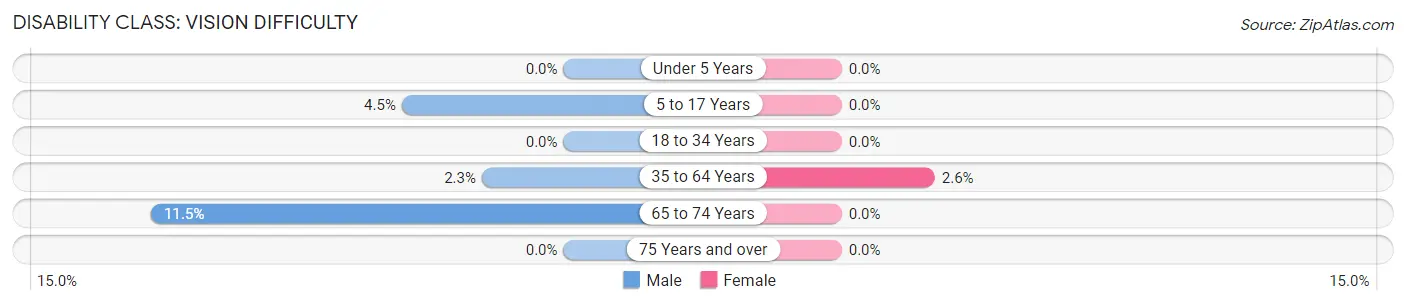
| Age Bracket | Male | Female |
| Under 5 Years | 0 (0.0%) | 0 (0.0%) |
| 5 to 17 Years | 24 (4.5%) | 0 (0.0%) |
| 18 to 34 Years | 0 (0.0%) | 0 (0.0%) |
| 35 to 64 Years | 21 (2.3%) | 19 (2.6%) |
| 65 to 74 Years | 14 (11.5%) | 0 (0.0%) |
| 75 Years and over | 0 (0.0%) | 0 (0.0%) |
Disability Class: Cognitive Difficulty
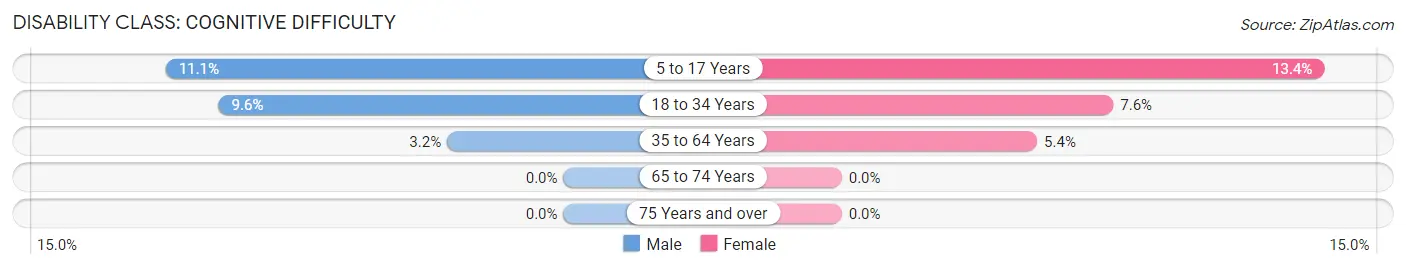
| Age Bracket | Male | Female |
| 5 to 17 Years | 59 (11.1%) | 36 (13.4%) |
| 18 to 34 Years | 77 (9.6%) | 56 (7.6%) |
| 35 to 64 Years | 30 (3.2%) | 40 (5.4%) |
| 65 to 74 Years | 0 (0.0%) | 0 (0.0%) |
| 75 Years and over | 0 (0.0%) | 0 (0.0%) |
Disability Class: Ambulatory Difficulty
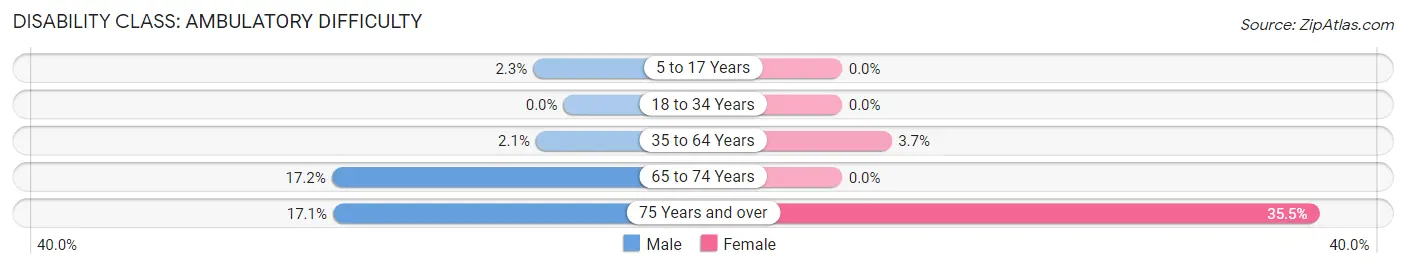
| Age Bracket | Male | Female |
| 5 to 17 Years | 12 (2.2%) | 0 (0.0%) |
| 18 to 34 Years | 0 (0.0%) | 0 (0.0%) |
| 35 to 64 Years | 19 (2.1%) | 27 (3.7%) |
| 65 to 74 Years | 21 (17.2%) | 0 (0.0%) |
| 75 Years and over | 19 (17.1%) | 39 (35.4%) |
Disability Class: Self-Care Difficulty
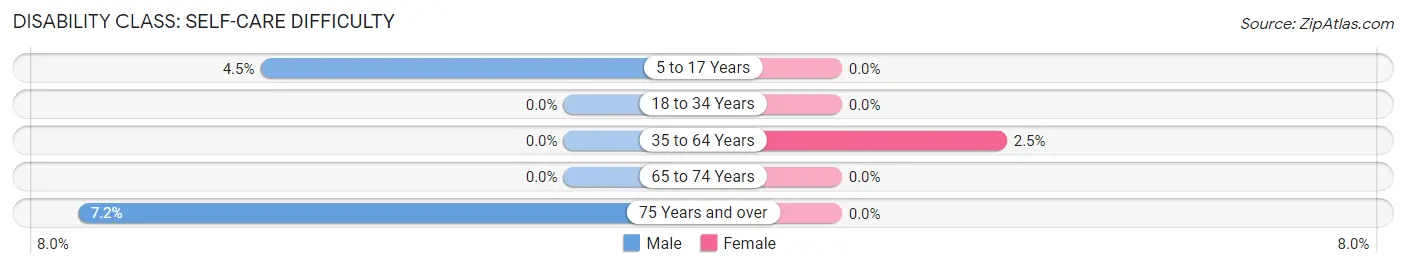
| Age Bracket | Male | Female |
| 5 to 17 Years | 24 (4.5%) | 0 (0.0%) |
| 18 to 34 Years | 0 (0.0%) | 0 (0.0%) |
| 35 to 64 Years | 0 (0.0%) | 18 (2.5%) |
| 65 to 74 Years | 0 (0.0%) | 0 (0.0%) |
| 75 Years and over | 8 (7.2%) | 0 (0.0%) |
Technology Access in Cortland
Computing Device Access in Cortland
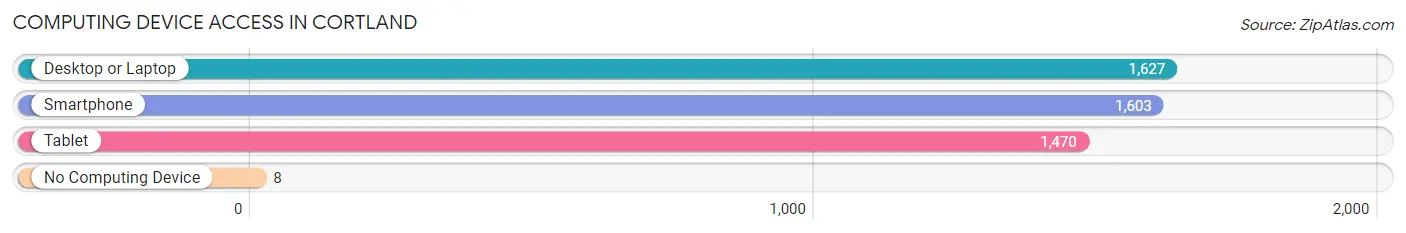
| Device Type | # Households | % Households |
| Desktop or Laptop | 1,627 | 97.3% |
| Smartphone | 1,603 | 95.8% |
| Tablet | 1,470 | 87.9% |
| No Computing Device | 8 | 0.5% |
| Total | 1,673 | 100.0% |
Internet Access in Cortland
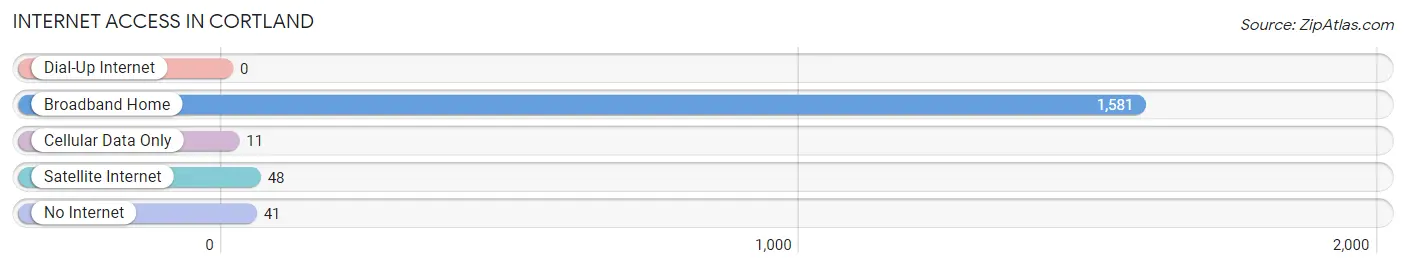
| Internet Type | # Households | % Households |
| Dial-Up Internet | 0 | 0.0% |
| Broadband Home | 1,581 | 94.5% |
| Cellular Data Only | 11 | 0.7% |
| Satellite Internet | 48 | 2.9% |
| No Internet | 41 | 2.5% |
| Total | 1,673 | 100.0% |
Cortland Summary
Cortland, Illinois is a small village located in DeKalb County, Illinois. It is situated about 40 miles west of Chicago and is part of the Chicago metropolitan area. The village has a population of approximately 3,000 people and is known for its rural charm and small-town atmosphere.
History
Cortland was founded in 1856 by a group of settlers from New York. The village was named after Cortland County, New York, where many of the settlers had come from. The village was incorporated in 1867 and has remained relatively unchanged since then.
The village was originally a farming community, but in the late 19th century, it began to develop into a small industrial center. The village was home to several factories, including a brickyard, a canning factory, and a furniture factory. These factories provided employment for many of the village’s residents.
In the early 20th century, Cortland began to experience a population decline as many of its residents moved away to larger cities in search of better job opportunities. This trend continued until the 1950s, when the village began to experience a population resurgence. This was due in part to the development of the nearby city of DeKalb, which provided employment opportunities for many of Cortland’s residents.
Geography
Cortland is located in the northern part of DeKalb County, Illinois. It is situated about 40 miles west of Chicago and is part of the Chicago metropolitan area. The village is located on the banks of the Kishwaukee River and is surrounded by rolling hills and farmland.
The village has a total area of 1.2 square miles, all of which is land. The village is located at an elevation of 745 feet above sea level.
Economy
Cortland’s economy is largely based on agriculture and manufacturing. The village is home to several small businesses, including a grocery store, a hardware store, and a few restaurants. The village also has a few small industrial parks, which provide employment for many of the village’s residents.
The village is also home to several large employers, including a manufacturing plant and a distribution center. These employers provide employment for many of the village’s residents.
Demographics
As of the 2010 census, the village had a population of 3,037 people. The racial makeup of the village was 94.3% White, 1.2% African American, 0.3% Native American, 0.7% Asian, 0.1% Pacific Islander, 1.7% from other races, and 1.9% from two or more races. Hispanic or Latino of any race were 4.2% of the population.
The median income for a household in the village was $50,972, and the median income for a family was $60,972. The per capita income for the village was $22,972. About 4.2% of families and 5.3% of the population were below the poverty line, including 6.2% of those under age 18 and 4.2% of those age 65 or over.
Cortland is a small village with a rich history and a unique atmosphere. It is a great place to live and work, and it offers its residents a variety of employment opportunities. The village is also home to a diverse population, which adds to its charm and appeal.
Common Questions
What is Per Capita Income in Cortland?
Per Capita income in Cortland is $37,032.
What is the Median Family Income in Cortland?
Median Family Income in Cortland is $106,384.
What is the Median Household income in Cortland?
Median Household Income in Cortland is $76,869.
What is Income or Wage Gap in Cortland?
Income or Wage Gap in Cortland is 46.0%.
Women in Cortland earn 54.0 cents for every dollar earned by a man.
What is Inequality or Gini Index in Cortland?
Inequality or Gini Index in Cortland is 0.34.
What is the Total Population of Cortland?
Total Population of Cortland is 4,734.
What is the Total Male Population of Cortland?
Total Male Population of Cortland is 2,663.
What is the Total Female Population of Cortland?
Total Female Population of Cortland is 2,071.
What is the Ratio of Males per 100 Females in Cortland?
There are 128.59 Males per 100 Females in Cortland.
What is the Ratio of Females per 100 Males in Cortland?
There are 77.77 Females per 100 Males in Cortland.
What is the Median Population Age in Cortland?
Median Population Age in Cortland is 31.4 Years.
What is the Average Family Size in Cortland
Average Family Size in Cortland is 3.2 People.
What is the Average Household Size in Cortland
Average Household Size in Cortland is 2.8 People.
How Large is the Labor Force in Cortland?
There are 2,947 People in the Labor Forcein in Cortland.
What is the Percentage of People in the Labor Force in Cortland?
79.2% of People are in the Labor Force in Cortland.
What is the Unemployment Rate in Cortland?
Unemployment Rate in Cortland is 5.3%.