East St Louis, IL Map & Demographics
East St Louis Map
East St Louis Overview
$20,877
PER CAPITA INCOME
$44,215
AVG FAMILY INCOME
$28,519
AVG HOUSEHOLD INCOME
8.9%
WAGE / INCOME GAP [ % ]
91.1¢/ $1
WAGE / INCOME GAP [ $ ]
$13,212
FAMILY INCOME DEFICIT
0.52
INEQUALITY / GINI INDEX
18,796
TOTAL POPULATION
8,179
MALE POPULATION
10,617
FEMALE POPULATION
77.04
MALES / 100 FEMALES
129.81
FEMALES / 100 MALES
43.3
MEDIAN AGE
3.8
AVG FAMILY SIZE
2.4
AVG HOUSEHOLD SIZE
8,169
LABOR FORCE [ PEOPLE ]
51.8%
PERCENT IN LABOR FORCE
13.1%
UNEMPLOYMENT RATE
Income in East St Louis
Income Overview in East St Louis
Per Capita Income in East St Louis is $20,877, while median incomes of families and households are $44,215 and $28,519 respectively.
| Characteristic | Number | Measure |
| Per Capita Income | 18,796 | $20,877 |
| Median Family Income | 3,603 | $44,215 |
| Mean Family Income | 3,603 | $57,131 |
| Median Household Income | 7,676 | $28,519 |
| Mean Household Income | 7,676 | $43,921 |
| Income Deficit | 3,603 | $13,212 |
| Wage / Income Gap (%) | 18,796 | 8.90% |
| Wage / Income Gap ($) | 18,796 | 91.10¢ per $1 |
| Gini / Inequality Index | 18,796 | 0.52 |
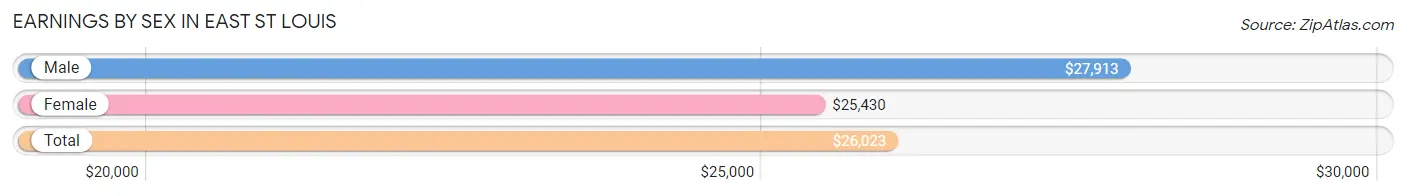
Earnings by Sex in East St Louis
Average Earnings in East St Louis are $26,023, $27,913 for men and $25,430 for women, a difference of 8.9%.
| Sex | Number | Average Earnings |
| Male | 2,939 (37.7%) | $27,913 |
| Female | 4,853 (62.3%) | $25,430 |
| Total | 7,792 (100.0%) | $26,023 |
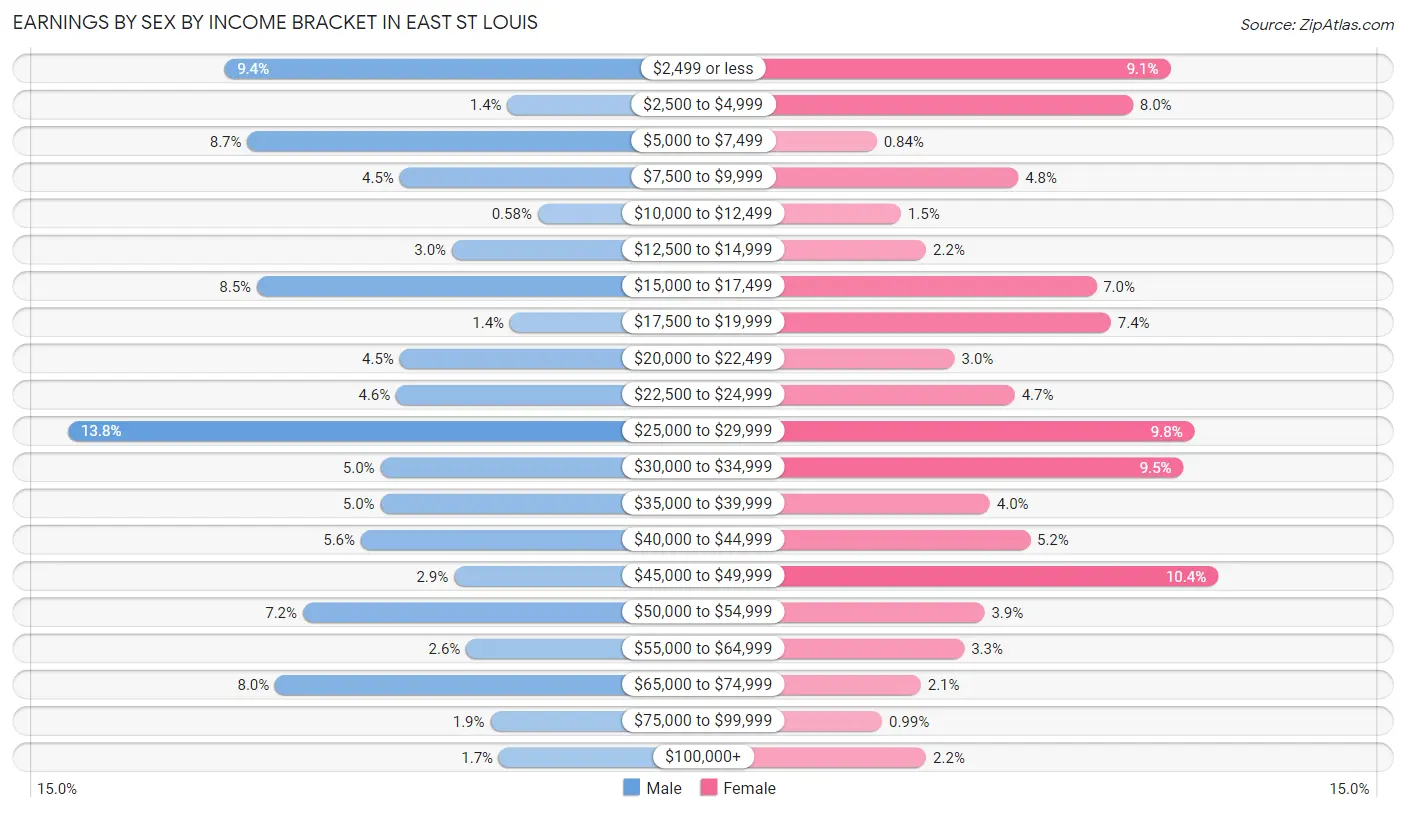
Earnings by Sex by Income Bracket in East St Louis
The most common earnings brackets in East St Louis are $25,000 to $29,999 for men (405 | 13.8%) and $45,000 to $49,999 for women (506 | 10.4%).
| Income | Male | Female |
| $2,499 or less | 276 (9.4%) | 441 (9.1%) |
| $2,500 to $4,999 | 42 (1.4%) | 390 (8.0%) |
| $5,000 to $7,499 | 257 (8.7%) | 41 (0.8%) |
| $7,500 to $9,999 | 131 (4.5%) | 234 (4.8%) |
| $10,000 to $12,499 | 17 (0.6%) | 74 (1.5%) |
| $12,500 to $14,999 | 88 (3.0%) | 108 (2.2%) |
| $15,000 to $17,499 | 249 (8.5%) | 340 (7.0%) |
| $17,500 to $19,999 | 40 (1.4%) | 360 (7.4%) |
| $20,000 to $22,499 | 131 (4.5%) | 147 (3.0%) |
| $22,500 to $24,999 | 134 (4.6%) | 229 (4.7%) |
| $25,000 to $29,999 | 405 (13.8%) | 474 (9.8%) |
| $30,000 to $34,999 | 147 (5.0%) | 459 (9.5%) |
| $35,000 to $39,999 | 147 (5.0%) | 195 (4.0%) |
| $40,000 to $44,999 | 163 (5.6%) | 250 (5.1%) |
| $45,000 to $49,999 | 86 (2.9%) | 506 (10.4%) |
| $50,000 to $54,999 | 211 (7.2%) | 188 (3.9%) |
| $55,000 to $64,999 | 76 (2.6%) | 160 (3.3%) |
| $65,000 to $74,999 | 234 (8.0%) | 101 (2.1%) |
| $75,000 to $99,999 | 56 (1.9%) | 48 (1.0%) |
| $100,000+ | 49 (1.7%) | 108 (2.2%) |
| Total | 2,939 (100.0%) | 4,853 (100.0%) |
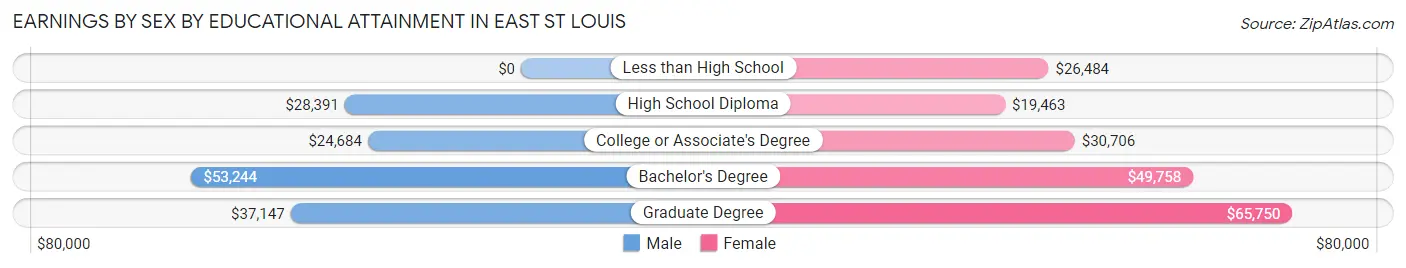
Earnings by Sex by Educational Attainment in East St Louis
Average earnings in East St Louis are $28,931 for men and $30,661 for women, a difference of 5.6%. Men with an educational attainment of bachelor's degree enjoy the highest average annual earnings of $53,244, while those with college or associate's degree education earn the least with $24,684. Women with an educational attainment of graduate degree earn the most with the average annual earnings of $65,750, while those with high school diploma education have the smallest earnings of $19,463.
| Educational Attainment | Male Income | Female Income |
| Less than High School | - | - |
| High School Diploma | $28,391 | $19,463 |
| College or Associate's Degree | $24,684 | $30,706 |
| Bachelor's Degree | $53,244 | $49,758 |
| Graduate Degree | $37,147 | $65,750 |
| Total | $28,931 | $30,661 |
Family Income in East St Louis
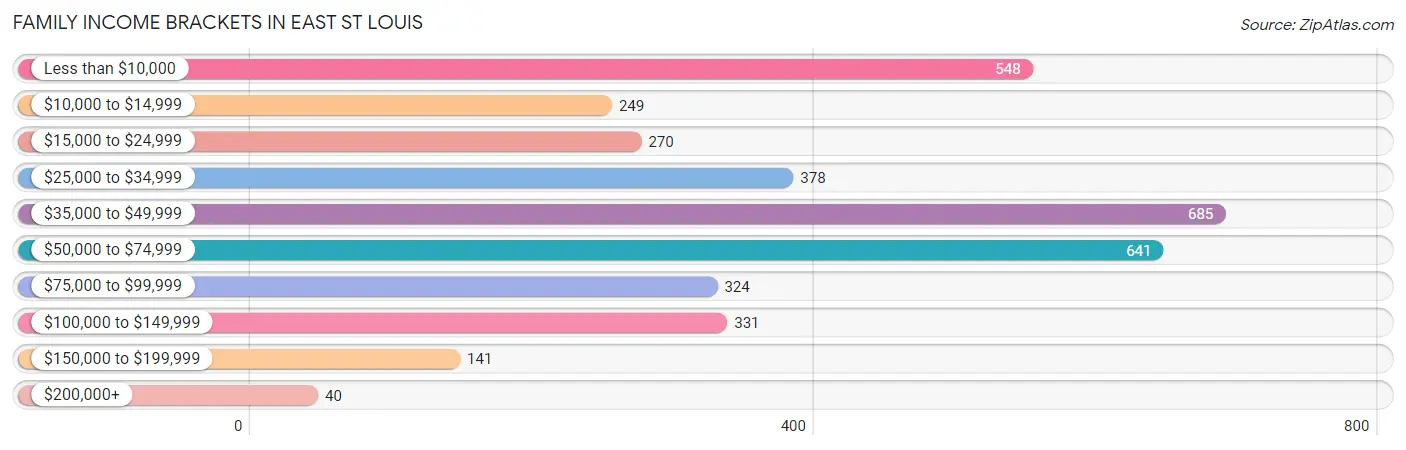
Family Income Brackets in East St Louis
According to the East St Louis family income data, there are 685 families falling into the $35,000 to $49,999 income range, which is the most common income bracket and makes up 19.0% of all families. Conversely, the $200,000+ income bracket is the least frequent group with only 40 families (1.1%) belonging to this category.
| Income Bracket | # Families | % Families |
| Less than $10,000 | 548 | 15.2% |
| $10,000 to $14,999 | 249 | 6.9% |
| $15,000 to $24,999 | 270 | 7.5% |
| $25,000 to $34,999 | 378 | 10.5% |
| $35,000 to $49,999 | 685 | 19.0% |
| $50,000 to $74,999 | 641 | 17.8% |
| $75,000 to $99,999 | 324 | 9.0% |
| $100,000 to $149,999 | 331 | 9.2% |
| $150,000 to $199,999 | 141 | 3.9% |
| $200,000+ | 40 | 1.1% |
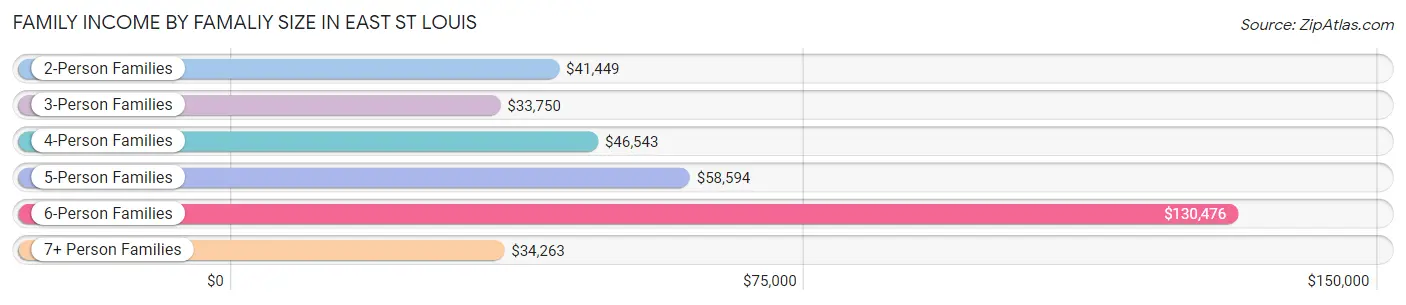
Family Income by Famaliy Size in East St Louis
6-person families (34 | 0.9%) account for the highest median family income in East St Louis with $130,476 per family, while 6-person families (34 | 0.9%) have the highest median income of $21,746 per family member.
| Income Bracket | # Families | Median Income |
| 2-Person Families | 1,679 (46.6%) | $41,449 |
| 3-Person Families | 978 (27.1%) | $33,750 |
| 4-Person Families | 546 (15.1%) | $46,543 |
| 5-Person Families | 249 (6.9%) | $58,594 |
| 6-Person Families | 34 (0.9%) | $130,476 |
| 7+ Person Families | 117 (3.3%) | $34,263 |
| Total | 3,603 (100.0%) | $44,215 |
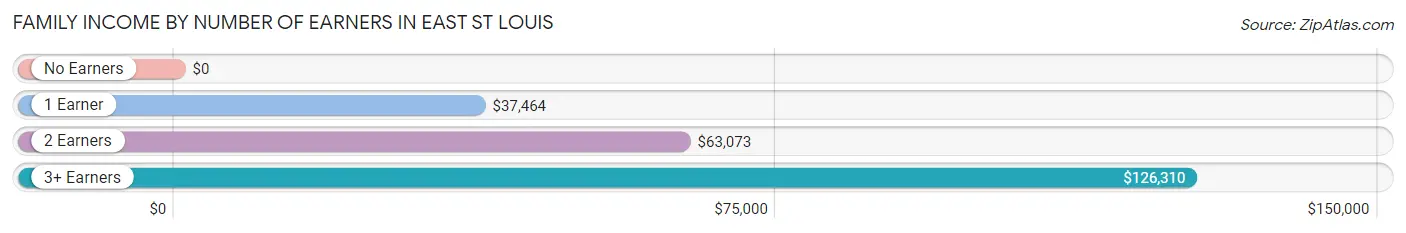
Family Income by Number of Earners in East St Louis
| Number of Earners | # Families | Median Income |
| No Earners | 683 (19.0%) | $0 |
| 1 Earner | 1,689 (46.9%) | $37,464 |
| 2 Earners | 967 (26.8%) | $63,073 |
| 3+ Earners | 264 (7.3%) | $126,310 |
| Total | 3,603 (100.0%) | $44,215 |
Household Income in East St Louis
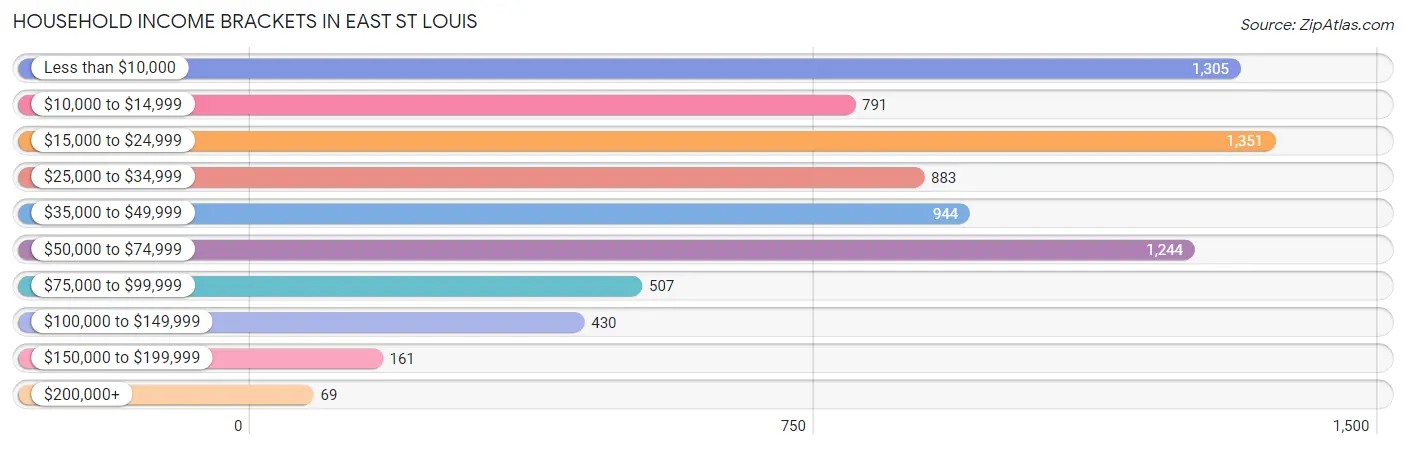
Household Income Brackets in East St Louis
With 1,351 households falling in the category, the $15,000 to $24,999 income range is the most frequent in East St Louis, accounting for 17.6% of all households. In contrast, only 69 households (0.9%) fall into the $200,000+ income bracket, making it the least populous group.
| Income Bracket | # Households | % Households |
| Less than $10,000 | 1,305 | 17.0% |
| $10,000 to $14,999 | 791 | 10.3% |
| $15,000 to $24,999 | 1,351 | 17.6% |
| $25,000 to $34,999 | 883 | 11.5% |
| $35,000 to $49,999 | 944 | 12.3% |
| $50,000 to $74,999 | 1,244 | 16.2% |
| $75,000 to $99,999 | 507 | 6.6% |
| $100,000 to $149,999 | 430 | 5.6% |
| $150,000 to $199,999 | 161 | 2.1% |
| $200,000+ | 69 | 0.9% |
Household Income by Householder Age in East St Louis
The median household income in East St Louis is $28,519, with the highest median household income of $32,585 found in the 25 to 44 years age bracket for the primary householder. A total of 1,617 households (21.1%) fall into this category. Meanwhile, the 15 to 24 years age bracket for the primary householder has the lowest median household income of $0, with 189 households (2.5%) in this group.
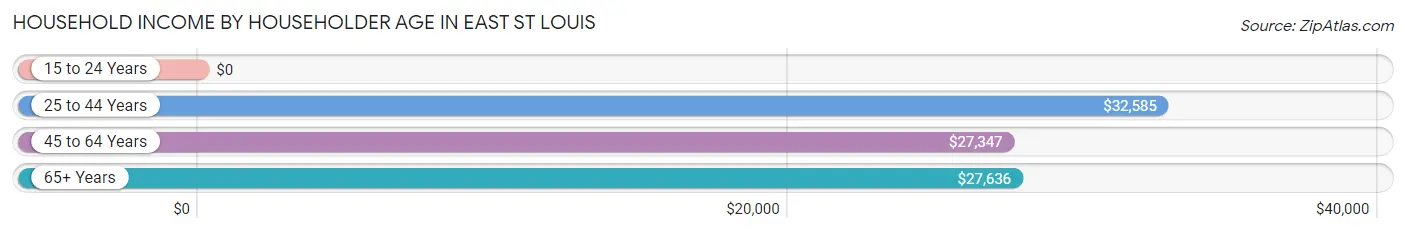
| Income Bracket | # Households | Median Income |
| 15 to 24 Years | 189 (2.5%) | $0 |
| 25 to 44 Years | 1,617 (21.1%) | $32,585 |
| 45 to 64 Years | 2,833 (36.9%) | $27,347 |
| 65+ Years | 3,037 (39.6%) | $27,636 |
| Total | 7,676 (100.0%) | $28,519 |
Poverty in East St Louis
Income Below Poverty by Sex and Age in East St Louis
With 33.1% poverty level for males and 30.4% for females among the residents of East St Louis, 5 year old males and 16 and 17 year old females are the most vulnerable to poverty, with 40 males (100.0%) and 66 females (61.7%) in their respective age groups living below the poverty level.
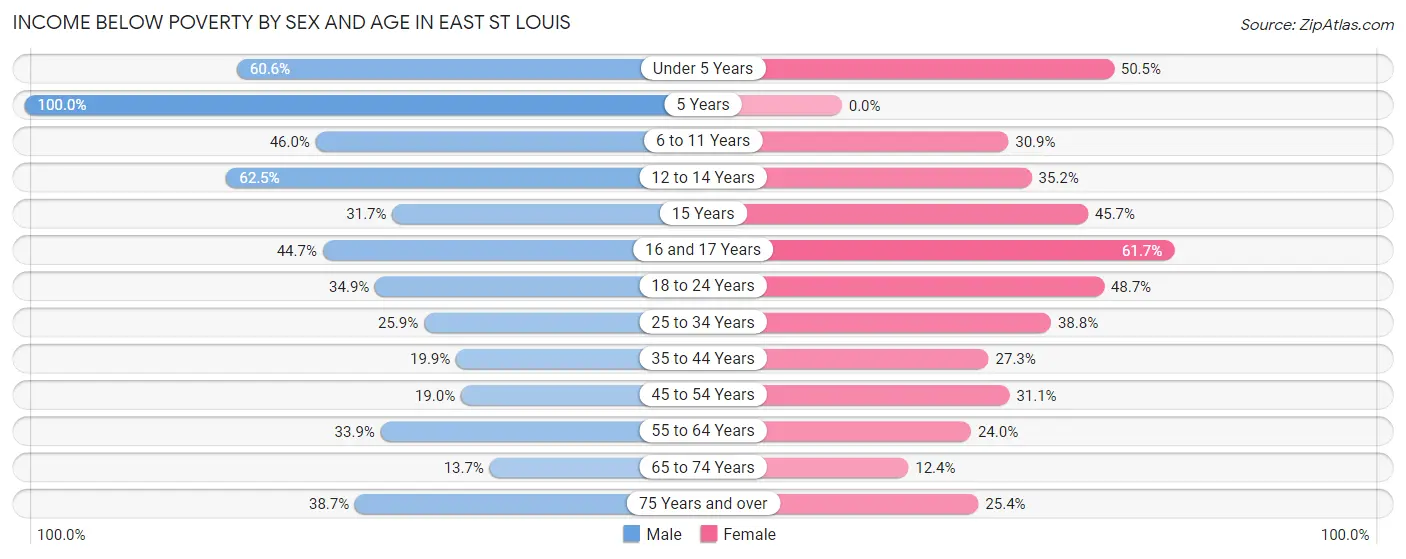
| Age Bracket | Male | Female |
| Under 5 Years | 412 (60.6%) | 155 (50.5%) |
| 5 Years | 40 (100.0%) | 0 (0.0%) |
| 6 to 11 Years | 251 (46.0%) | 132 (30.9%) |
| 12 to 14 Years | 217 (62.5%) | 130 (35.2%) |
| 15 Years | 53 (31.7%) | 58 (45.7%) |
| 16 and 17 Years | 92 (44.7%) | 66 (61.7%) |
| 18 to 24 Years | 190 (34.9%) | 577 (48.6%) |
| 25 to 34 Years | 395 (25.9%) | 499 (38.8%) |
| 35 to 44 Years | 114 (19.9%) | 318 (27.3%) |
| 45 to 54 Years | 137 (19.0%) | 459 (31.1%) |
| 55 to 64 Years | 434 (33.9%) | 363 (24.0%) |
| 65 to 74 Years | 123 (13.7%) | 188 (12.3%) |
| 75 Years and over | 244 (38.7%) | 279 (25.4%) |
| Total | 2,702 (33.1%) | 3,224 (30.4%) |
Income Above Poverty by Sex and Age in East St Louis
According to the poverty statistics in East St Louis, males aged 65 to 74 years and females aged 5 years are the age groups that are most secure financially, with 86.3% of males and 100.0% of females in these age groups living above the poverty line.
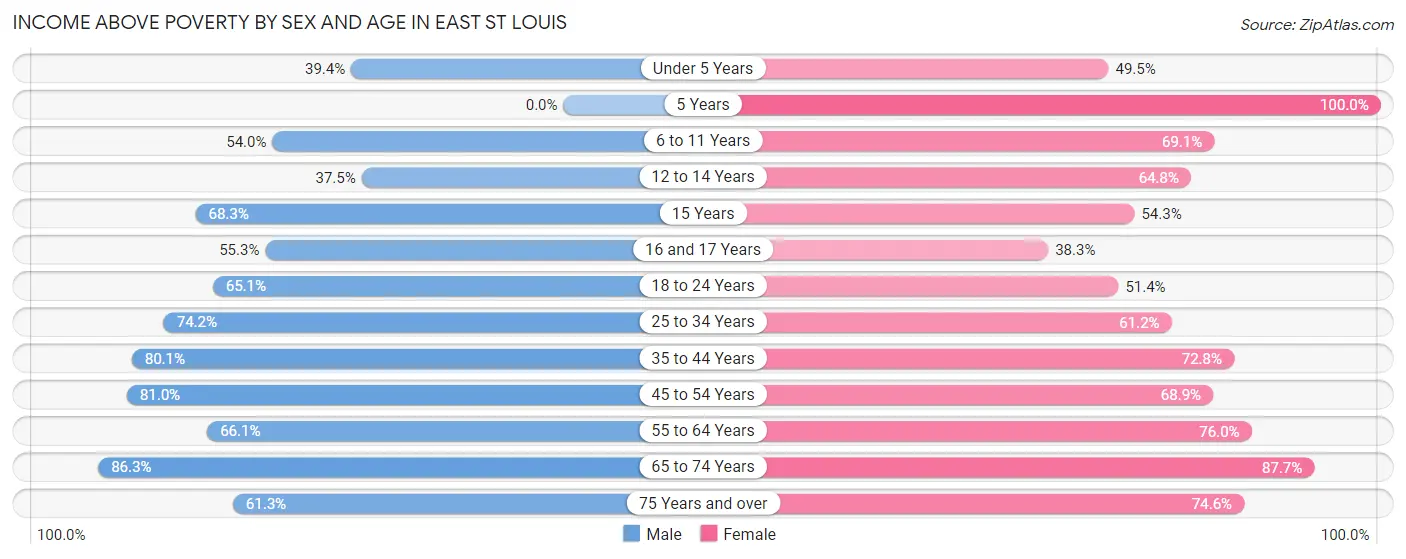
| Age Bracket | Male | Female |
| Under 5 Years | 268 (39.4%) | 152 (49.5%) |
| 5 Years | 0 (0.0%) | 15 (100.0%) |
| 6 to 11 Years | 295 (54.0%) | 295 (69.1%) |
| 12 to 14 Years | 130 (37.5%) | 239 (64.8%) |
| 15 Years | 114 (68.3%) | 69 (54.3%) |
| 16 and 17 Years | 114 (55.3%) | 41 (38.3%) |
| 18 to 24 Years | 354 (65.1%) | 609 (51.3%) |
| 25 to 34 Years | 1,133 (74.2%) | 786 (61.2%) |
| 35 to 44 Years | 459 (80.1%) | 849 (72.8%) |
| 45 to 54 Years | 584 (81.0%) | 1,016 (68.9%) |
| 55 to 64 Years | 846 (66.1%) | 1,151 (76.0%) |
| 65 to 74 Years | 777 (86.3%) | 1,334 (87.6%) |
| 75 Years and over | 387 (61.3%) | 821 (74.6%) |
| Total | 5,461 (66.9%) | 7,377 (69.6%) |
Income Below Poverty Among Married-Couple Families in East St Louis
The poverty statistics for married-couple families in East St Louis show that 7.9% or 77 of the total 976 families live below the poverty line. Families with 1 or 2 children have the highest poverty rate of 21.8%, comprising of 24 families. On the other hand, families with 3 or 4 children have the lowest poverty rate of 0.0%, which includes 0 families.
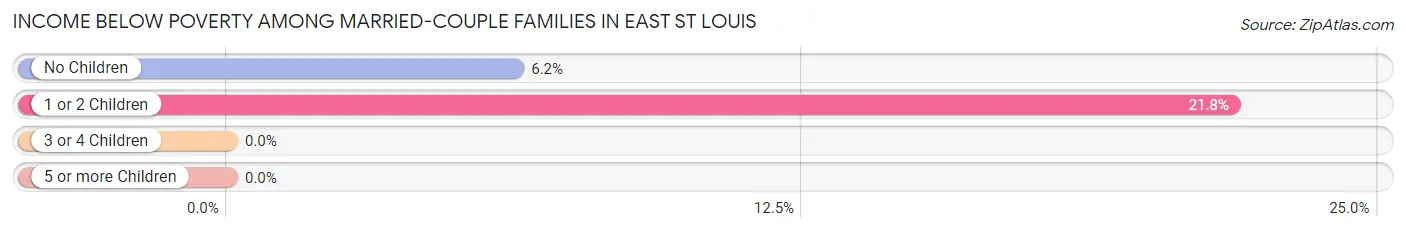
| Children | Above Poverty | Below Poverty |
| No Children | 798 (93.8%) | 53 (6.2%) |
| 1 or 2 Children | 86 (78.2%) | 24 (21.8%) |
| 3 or 4 Children | 6 (100.0%) | 0 (0.0%) |
| 5 or more Children | 9 (100.0%) | 0 (0.0%) |
| Total | 899 (92.1%) | 77 (7.9%) |
Income Below Poverty Among Single-Parent Households in East St Louis
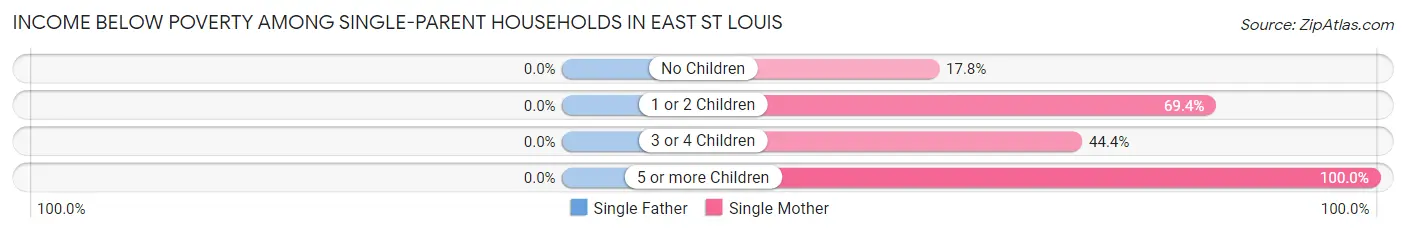
| Children | Single Father | Single Mother |
| No Children | 0 (0.0%) | 146 (17.8%) |
| 1 or 2 Children | 0 (0.0%) | 702 (69.4%) |
| 3 or 4 Children | 0 (0.0%) | 147 (44.4%) |
| 5 or more Children | 0 (0.0%) | 18 (100.0%) |
| Total | 0 (0.0%) | 1,013 (46.4%) |
Income Below Poverty Among Married-Couple vs Single-Parent Households in East St Louis
The poverty data for East St Louis shows that 77 of the married-couple family households (7.9%) and 1,013 of the single-parent households (38.6%) are living below the poverty level. Within the married-couple family households, those with 1 or 2 children have the highest poverty rate, with 24 households (21.8%) falling below the poverty line. Among the single-parent households, those with 5 or more children have the highest poverty rate, with 18 household (100.0%) living below poverty.
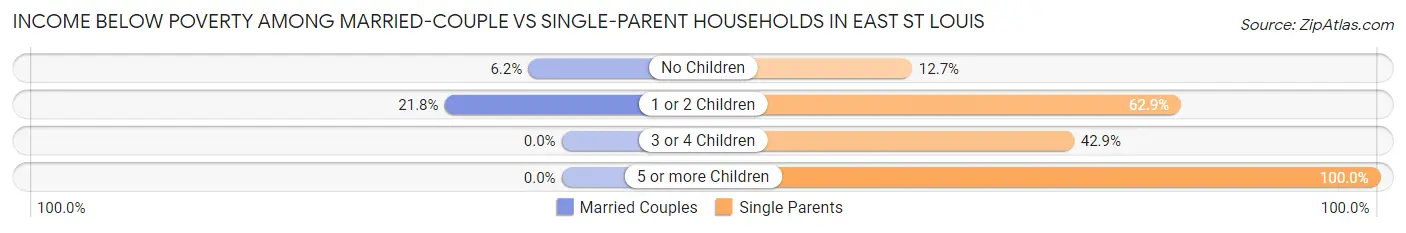
| Children | Married-Couple Families | Single-Parent Households |
| No Children | 53 (6.2%) | 146 (12.7%) |
| 1 or 2 Children | 24 (21.8%) | 702 (62.8%) |
| 3 or 4 Children | 0 (0.0%) | 147 (42.9%) |
| 5 or more Children | 0 (0.0%) | 18 (100.0%) |
| Total | 77 (7.9%) | 1,013 (38.6%) |
Race in East St Louis
The most populous races in East St Louis are Black / African American (17,773 | 94.6%), White / Caucasian (344 | 1.8%), and Two or more Races (338 | 1.8%).
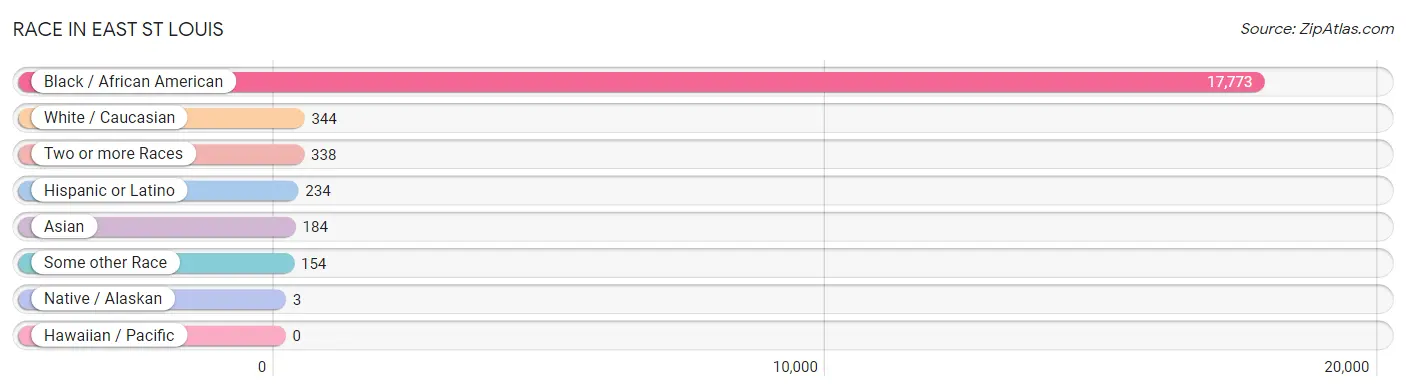
| Race | # Population | % Population |
| Asian | 184 | 1.0% |
| Black / African American | 17,773 | 94.6% |
| Hawaiian / Pacific | 0 | 0.0% |
| Hispanic or Latino | 234 | 1.2% |
| Native / Alaskan | 3 | 0.0% |
| White / Caucasian | 344 | 1.8% |
| Two or more Races | 338 | 1.8% |
| Some other Race | 154 | 0.8% |
| Total | 18,796 | 100.0% |
Ancestry in East St Louis
The most populous ancestries reported in East St Louis are African (210 | 1.1%), Subsaharan African (210 | 1.1%), American (171 | 0.9%), German (61 | 0.3%), and Mexican (34 | 0.2%), together accounting for 3.7% of all East St Louis residents.
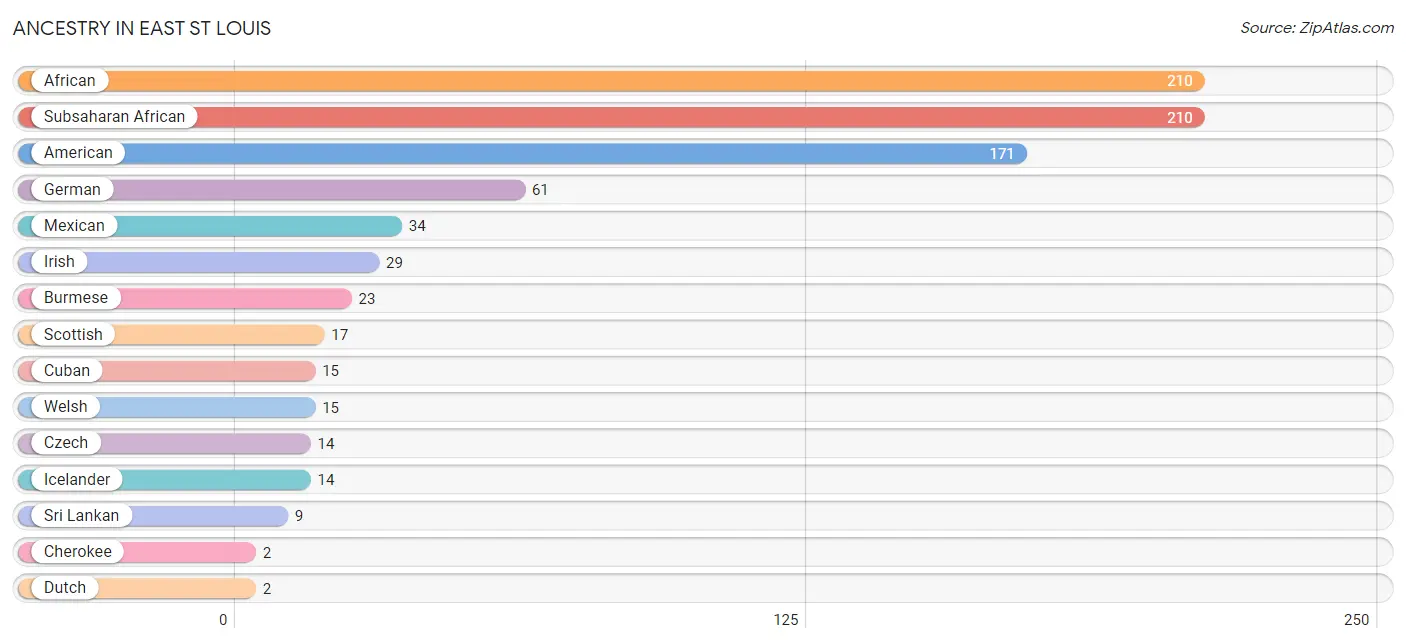
| Ancestry | # Population | % Population |
| African | 210 | 1.1% |
| American | 171 | 0.9% |
| Burmese | 23 | 0.1% |
| Central American Indian | 1 | 0.0% |
| Cherokee | 2 | 0.0% |
| Cuban | 15 | 0.1% |
| Czech | 14 | 0.1% |
| Dutch | 2 | 0.0% |
| German | 61 | 0.3% |
| Icelander | 14 | 0.1% |
| Irish | 29 | 0.2% |
| Mexican | 34 | 0.2% |
| Polish | 2 | 0.0% |
| Scottish | 17 | 0.1% |
| Sri Lankan | 9 | 0.1% |
| Subsaharan African | 210 | 1.1% |
| Swiss | 1 | 0.0% |
| Welsh | 15 | 0.1% | View All 18 Rows |
Immigrants in East St Louis
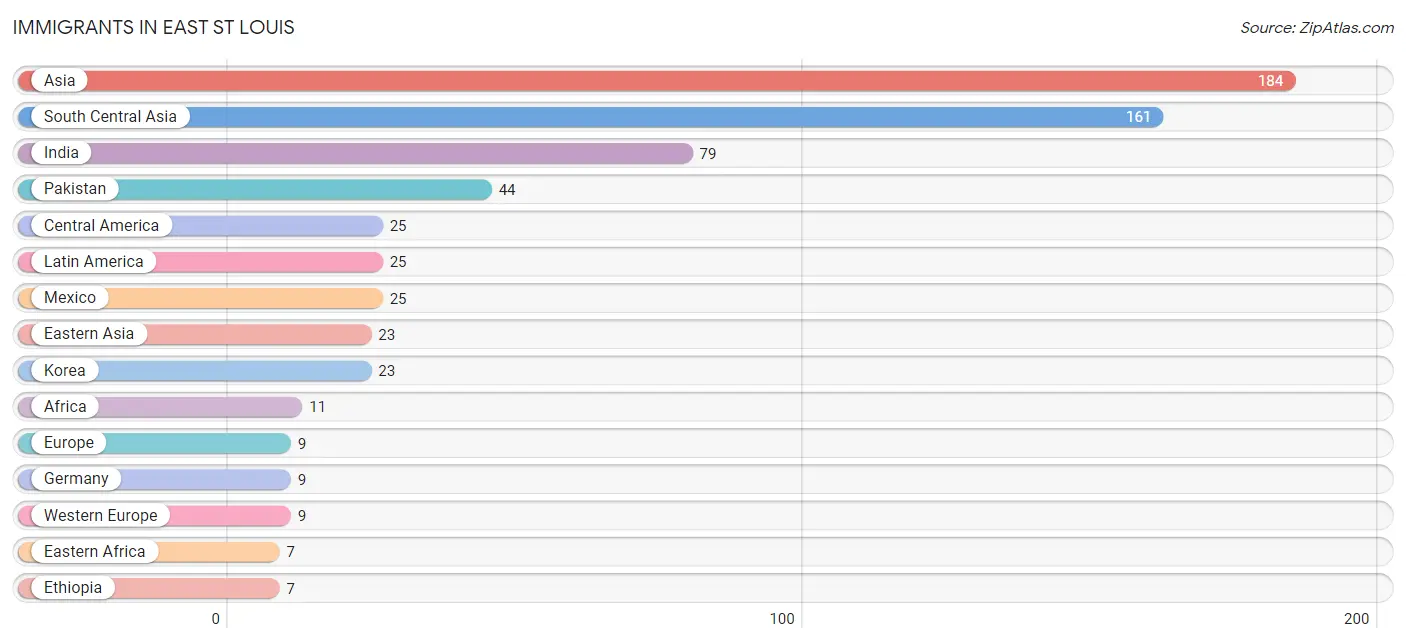
The most numerous immigrant groups reported in East St Louis came from Asia (184 | 1.0%), South Central Asia (161 | 0.9%), India (79 | 0.4%), Pakistan (44 | 0.2%), and Central America (25 | 0.1%), together accounting for 2.6% of all East St Louis residents.
| Immigration Origin | # Population | % Population |
| Africa | 11 | 0.1% |
| Asia | 184 | 1.0% |
| Central America | 25 | 0.1% |
| Eastern Africa | 7 | 0.0% |
| Eastern Asia | 23 | 0.1% |
| Ethiopia | 7 | 0.0% |
| Europe | 9 | 0.1% |
| Germany | 9 | 0.1% |
| Ghana | 4 | 0.0% |
| India | 79 | 0.4% |
| Korea | 23 | 0.1% |
| Latin America | 25 | 0.1% |
| Mexico | 25 | 0.1% |
| Pakistan | 44 | 0.2% |
| South Central Asia | 161 | 0.9% |
| Western Africa | 4 | 0.0% |
| Western Europe | 9 | 0.1% | View All 17 Rows |
Sex and Age in East St Louis
Sex and Age in East St Louis
The most populous age groups in East St Louis are 60 to 64 Years (877 | 10.7%) for men and 60 to 64 Years (949 | 8.9%) for women.
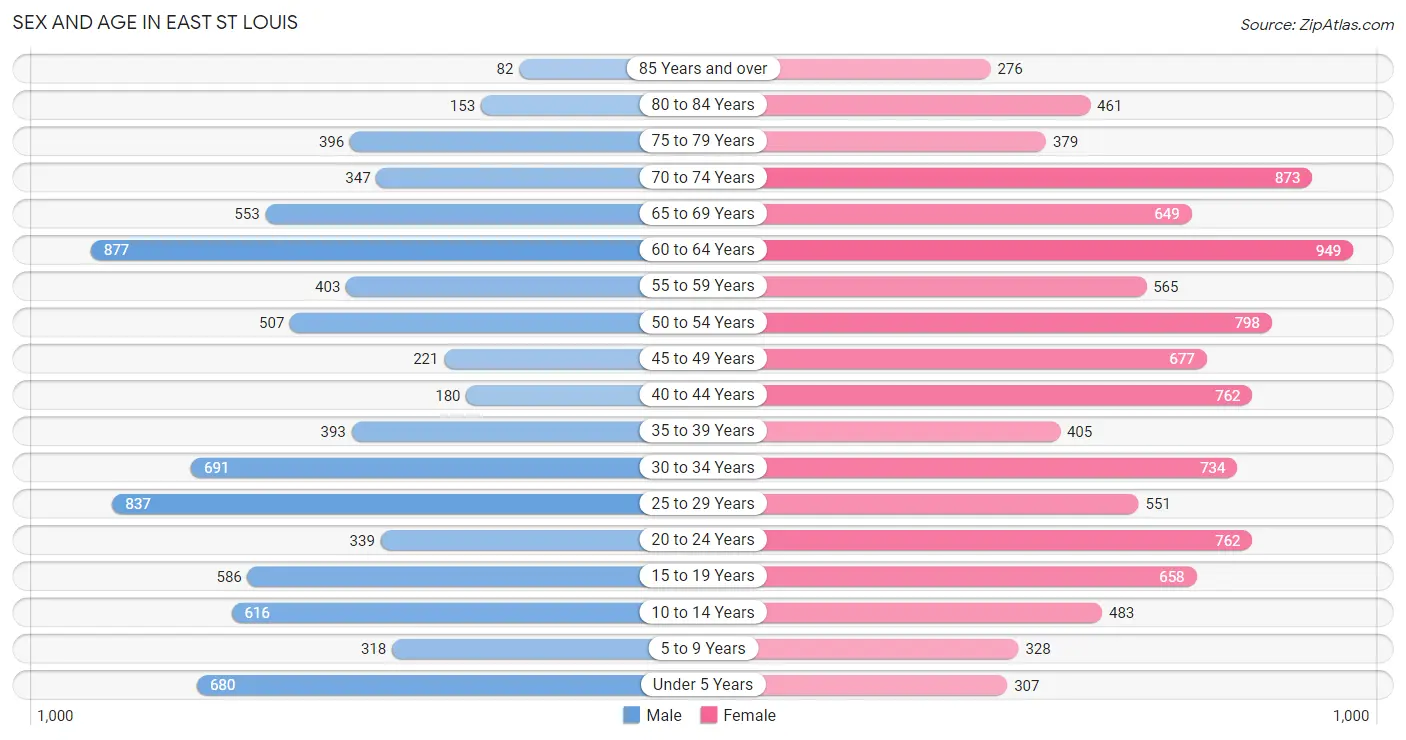
| Age Bracket | Male | Female |
| Under 5 Years | 680 (8.3%) | 307 (2.9%) |
| 5 to 9 Years | 318 (3.9%) | 328 (3.1%) |
| 10 to 14 Years | 616 (7.5%) | 483 (4.5%) |
| 15 to 19 Years | 586 (7.2%) | 658 (6.2%) |
| 20 to 24 Years | 339 (4.1%) | 762 (7.2%) |
| 25 to 29 Years | 837 (10.2%) | 551 (5.2%) |
| 30 to 34 Years | 691 (8.5%) | 734 (6.9%) |
| 35 to 39 Years | 393 (4.8%) | 405 (3.8%) |
| 40 to 44 Years | 180 (2.2%) | 762 (7.2%) |
| 45 to 49 Years | 221 (2.7%) | 677 (6.4%) |
| 50 to 54 Years | 507 (6.2%) | 798 (7.5%) |
| 55 to 59 Years | 403 (4.9%) | 565 (5.3%) |
| 60 to 64 Years | 877 (10.7%) | 949 (8.9%) |
| 65 to 69 Years | 553 (6.8%) | 649 (6.1%) |
| 70 to 74 Years | 347 (4.2%) | 873 (8.2%) |
| 75 to 79 Years | 396 (4.8%) | 379 (3.6%) |
| 80 to 84 Years | 153 (1.9%) | 461 (4.3%) |
| 85 Years and over | 82 (1.0%) | 276 (2.6%) |
| Total | 8,179 (100.0%) | 10,617 (100.0%) |
Families and Households in East St Louis
Median Family Size in East St Louis
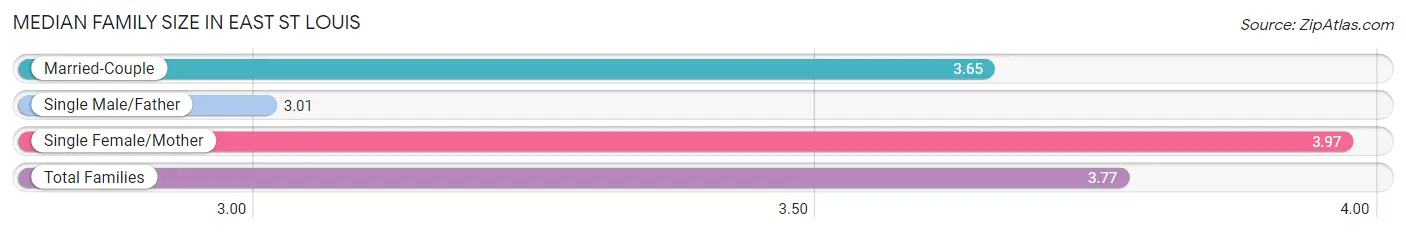
The median family size in East St Louis is 3.77 persons per family, with single female/mother families (2,182 | 60.6%) accounting for the largest median family size of 3.97 persons per family. On the other hand, single male/father families (445 | 12.3%) represent the smallest median family size with 3.01 persons per family.
| Family Type | # Families | Family Size |
| Married-Couple | 976 (27.1%) | 3.65 |
| Single Male/Father | 445 (12.3%) | 3.01 |
| Single Female/Mother | 2,182 (60.6%) | 3.97 |
| Total Families | 3,603 (100.0%) | 3.77 |
Median Household Size in East St Louis
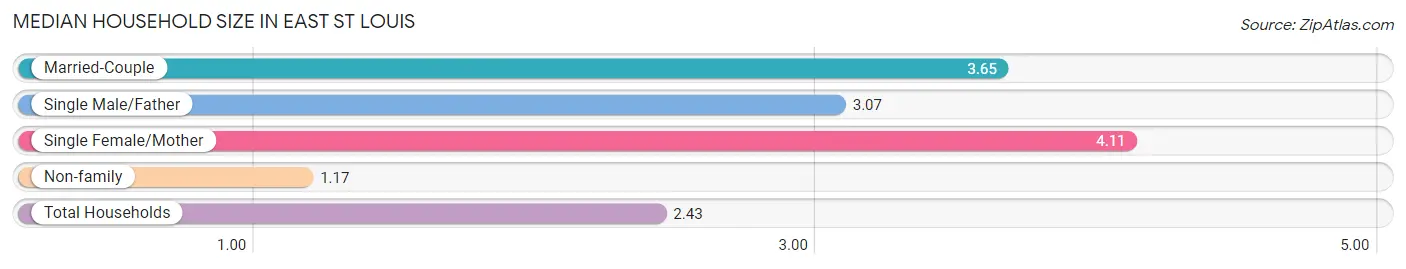
The median household size in East St Louis is 2.43 persons per household, with single female/mother households (2,182 | 28.4%) accounting for the largest median household size of 4.11 persons per household. non-family households (4,073 | 53.1%) represent the smallest median household size with 1.17 persons per household.
| Household Type | # Households | Household Size |
| Married-Couple | 976 (12.7%) | 3.65 |
| Single Male/Father | 445 (5.8%) | 3.07 |
| Single Female/Mother | 2,182 (28.4%) | 4.11 |
| Non-family | 4,073 (53.1%) | 1.17 |
| Total Households | 7,676 (100.0%) | 2.43 |
Household Size by Marriage Status in East St Louis
Out of a total of 7,676 households in East St Louis, 3,603 (46.9%) are family households, while 4,073 (53.1%) are nonfamily households. The most numerous type of family households are 2-person households, comprising 1,563, and the most common type of nonfamily households are 1-person households, comprising 3,763.
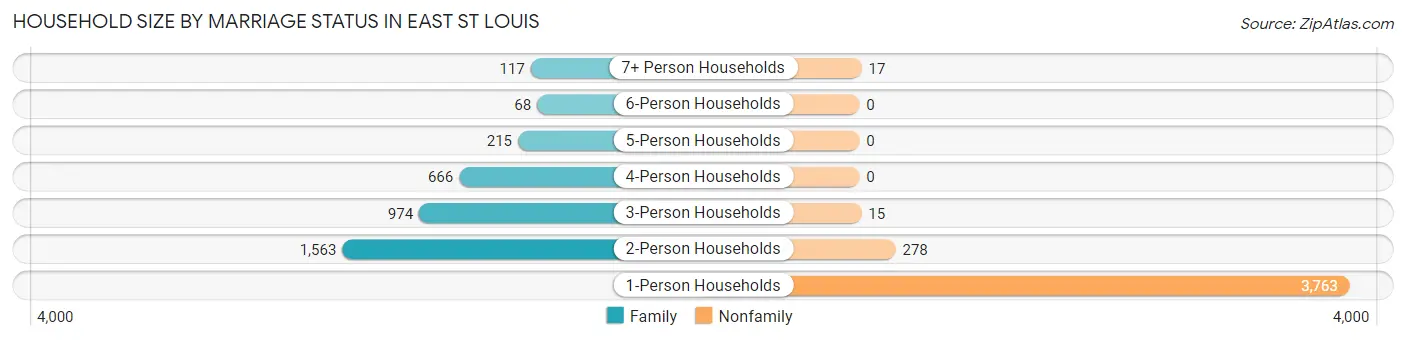
| Household Size | Family Households | Nonfamily Households |
| 1-Person Households | - | 3,763 (49.0%) |
| 2-Person Households | 1,563 (20.4%) | 278 (3.6%) |
| 3-Person Households | 974 (12.7%) | 15 (0.2%) |
| 4-Person Households | 666 (8.7%) | 0 (0.0%) |
| 5-Person Households | 215 (2.8%) | 0 (0.0%) |
| 6-Person Households | 68 (0.9%) | 0 (0.0%) |
| 7+ Person Households | 117 (1.5%) | 17 (0.2%) |
| Total | 3,603 (46.9%) | 4,073 (53.1%) |
Female Fertility in East St Louis
Fertility by Age in East St Louis
Average fertility rate in East St Louis is 63.0 births per 1,000 women. Women in the age bracket of 20 to 34 years have the highest fertility rate with 101.0 births per 1,000 women. Women in the age bracket of 20 to 34 years acount for 71.4% of all women with births.
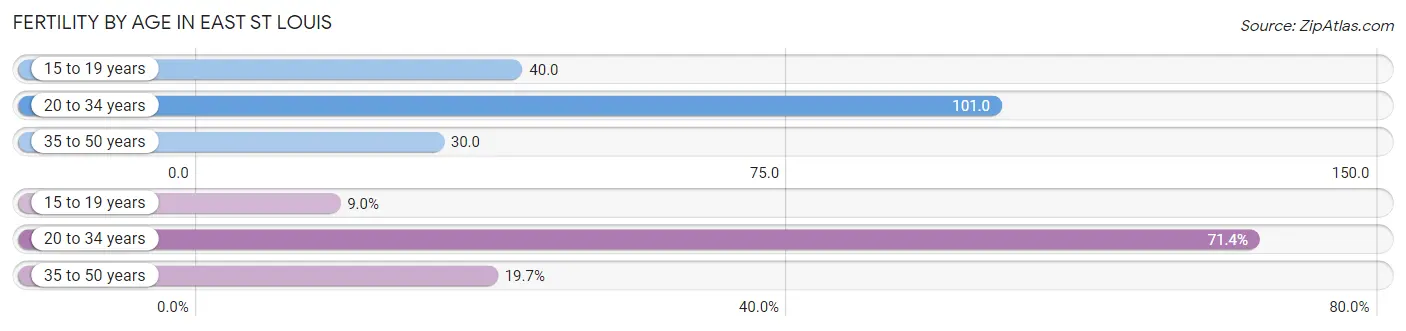
| Age Bracket | Women with Births | Births / 1,000 Women |
| 15 to 19 years | 26 (9.0%) | 40.0 |
| 20 to 34 years | 207 (71.4%) | 101.0 |
| 35 to 50 years | 57 (19.7%) | 30.0 |
| Total | 290 (100.0%) | 63.0 |
Fertility by Age by Marriage Status in East St Louis
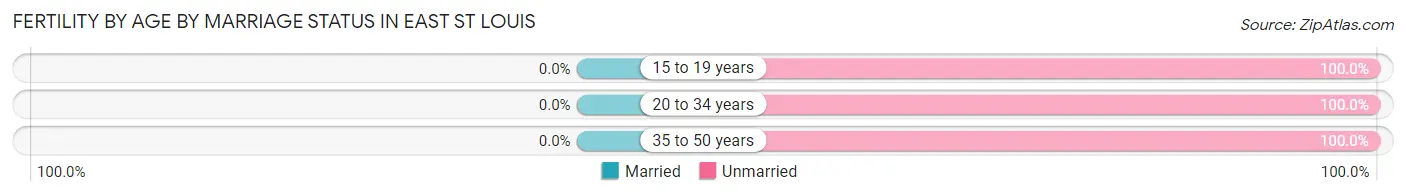
| Age Bracket | Married | Unmarried |
| 15 to 19 years | 0 (0.0%) | 26 (100.0%) |
| 20 to 34 years | 0 (0.0%) | 207 (100.0%) |
| 35 to 50 years | 0 (0.0%) | 57 (100.0%) |
| Total | 0 (0.0%) | 290 (100.0%) |
Fertility by Education in East St Louis
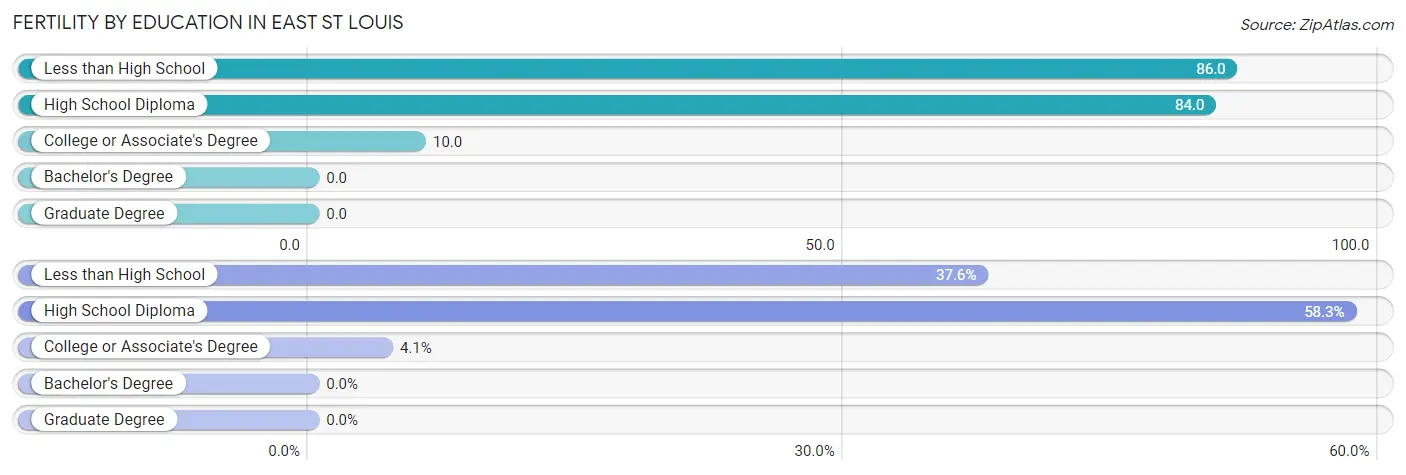
| Educational Attainment | Women with Births | Births / 1,000 Women |
| Less than High School | 109 (37.6%) | 86.0 |
| High School Diploma | 169 (58.3%) | 84.0 |
| College or Associate's Degree | 12 (4.1%) | 10.0 |
| Bachelor's Degree | 0 (0.0%) | 0.0 |
| Graduate Degree | 0 (0.0%) | 0.0 |
| Total | 290 (100.0%) | 63.0 |
Fertility by Education by Marriage Status in East St Louis
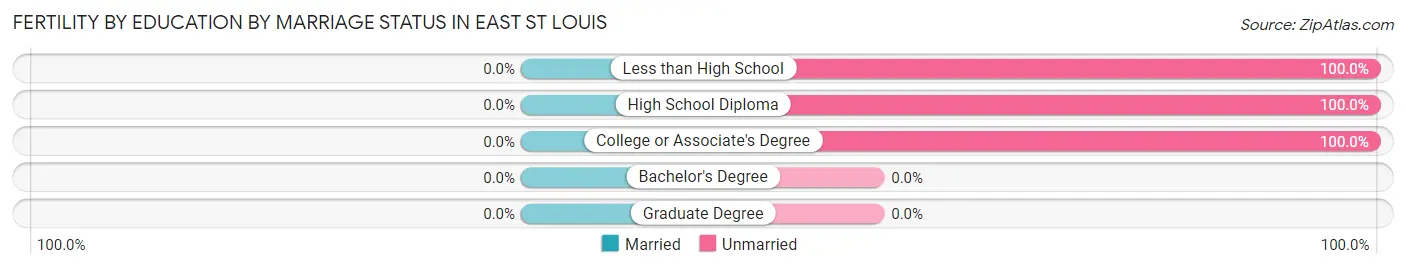
| Educational Attainment | Married | Unmarried |
| Less than High School | 0 (0.0%) | 109 (100.0%) |
| High School Diploma | 0 (0.0%) | 169 (100.0%) |
| College or Associate's Degree | 0 (0.0%) | 12 (100.0%) |
| Bachelor's Degree | 0 (0.0%) | 0 (0.0%) |
| Graduate Degree | 0 (0.0%) | 0 (0.0%) |
| Total | 0 (0.0%) | 290 (100.0%) |
Employment Characteristics in East St Louis
Employment by Class of Employer in East St Louis
Among the 6,953 employed individuals in East St Louis, private company employees (5,042 | 72.5%), not-for-profit organizations (499 | 7.2%), and local government employees (404 | 5.8%) make up the most common classes of employment.
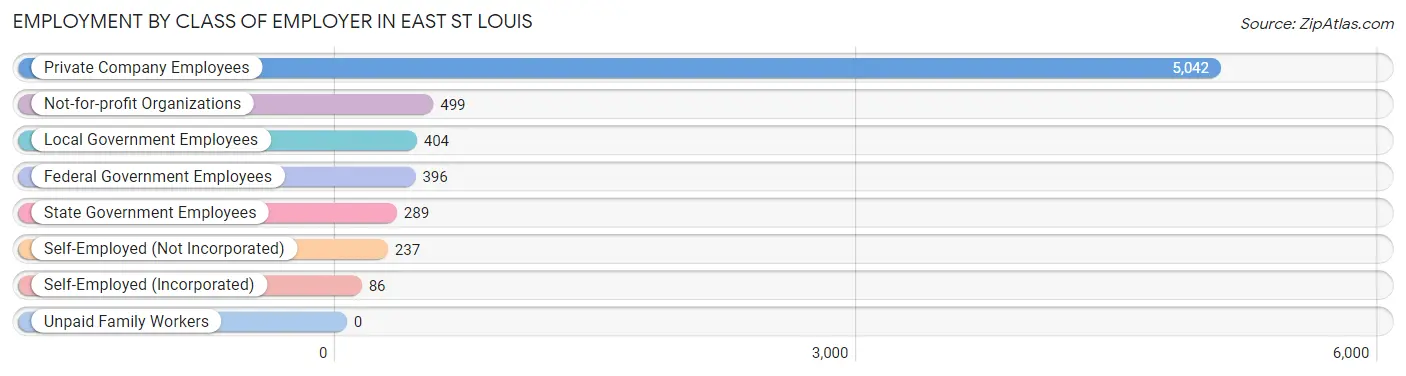
| Employer Class | # Employees | % Employees |
| Private Company Employees | 5,042 | 72.5% |
| Self-Employed (Incorporated) | 86 | 1.2% |
| Self-Employed (Not Incorporated) | 237 | 3.4% |
| Not-for-profit Organizations | 499 | 7.2% |
| Local Government Employees | 404 | 5.8% |
| State Government Employees | 289 | 4.2% |
| Federal Government Employees | 396 | 5.7% |
| Unpaid Family Workers | 0 | 0.0% |
| Total | 6,953 | 100.0% |
Employment Status by Age in East St Louis
According to the labor force statistics for East St Louis, out of the total population over 16 years of age (15,770), 51.8% or 8,169 individuals are in the labor force, with 13.1% or 1,070 of them unemployed. The age group with the highest labor force participation rate is 20 to 24 years, with 78.4% or 863 individuals in the labor force. Within the labor force, the 16 to 19 years age range has the highest percentage of unemployed individuals, with 24.2% or 127 of them being unemployed.
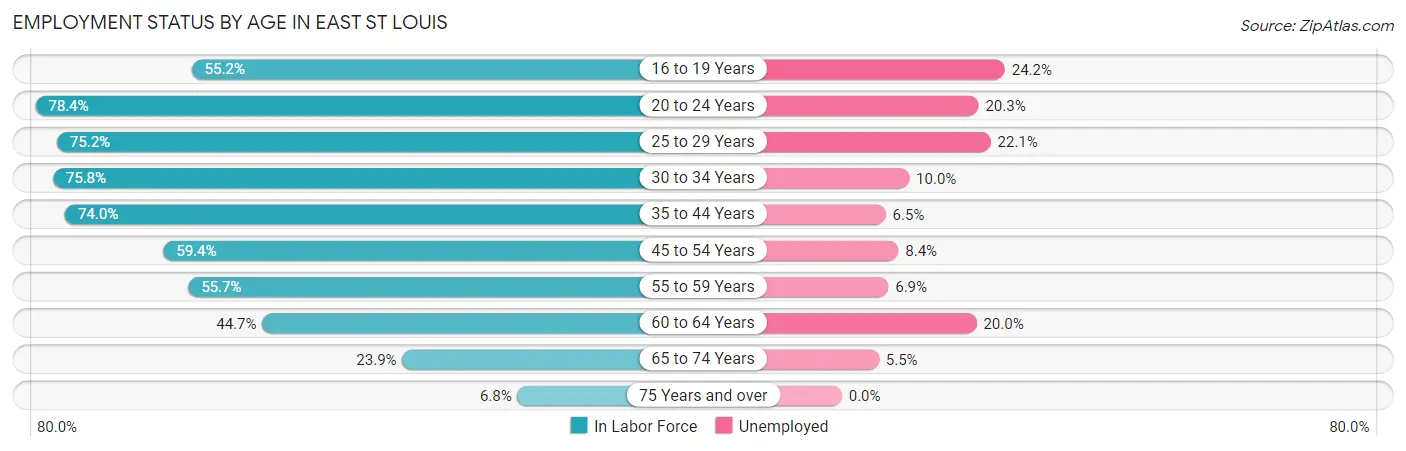
| Age Bracket | In Labor Force | Unemployed |
| 16 to 19 Years | 524 (55.2%) | 127 (24.2%) |
| 20 to 24 Years | 863 (78.4%) | 175 (20.3%) |
| 25 to 29 Years | 1,044 (75.2%) | 231 (22.1%) |
| 30 to 34 Years | 1,080 (75.8%) | 108 (10.0%) |
| 35 to 44 Years | 1,288 (74.0%) | 84 (6.5%) |
| 45 to 54 Years | 1,309 (59.4%) | 110 (8.4%) |
| 55 to 59 Years | 539 (55.7%) | 37 (6.9%) |
| 60 to 64 Years | 816 (44.7%) | 163 (20.0%) |
| 65 to 74 Years | 579 (23.9%) | 32 (5.5%) |
| 75 Years and over | 119 (6.8%) | 0 (0.0%) |
| Total | 8,169 (51.8%) | 1,070 (13.1%) |
Employment Status by Educational Attainment in East St Louis
According to labor force statistics for East St Louis, 63.6% of individuals (6,074) out of the total population between 25 and 64 years of age (9,550) are in the labor force, with 12.1% or 735 of them being unemployed. The group with the highest labor force participation rate are those with the educational attainment of college / associate degree, with 74.0% or 2,298 individuals in the labor force. Within the labor force, individuals with high school diploma education have the highest percentage of unemployment, with 18.2% or 396 of them being unemployed.
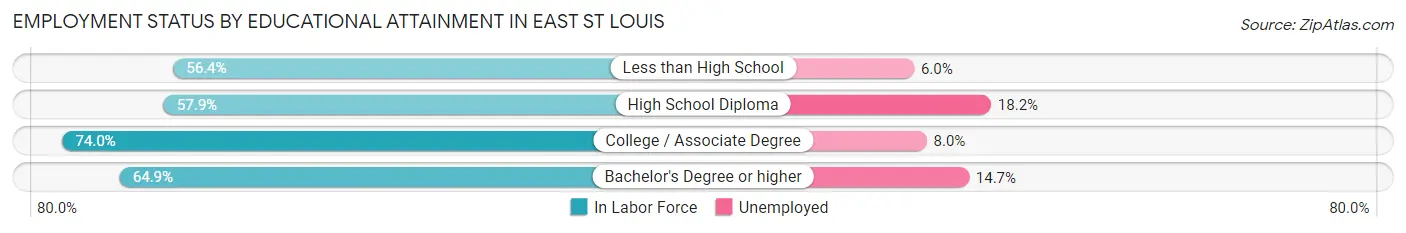
| Educational Attainment | In Labor Force | Unemployed |
| Less than High School | 924 (56.4%) | 98 (6.0%) |
| High School Diploma | 2,176 (57.9%) | 684 (18.2%) |
| College / Associate Degree | 2,298 (74.0%) | 248 (8.0%) |
| Bachelor's Degree or higher | 680 (64.9%) | 154 (14.7%) |
| Total | 6,074 (63.6%) | 1,156 (12.1%) |
Employment Occupations by Sex in East St Louis
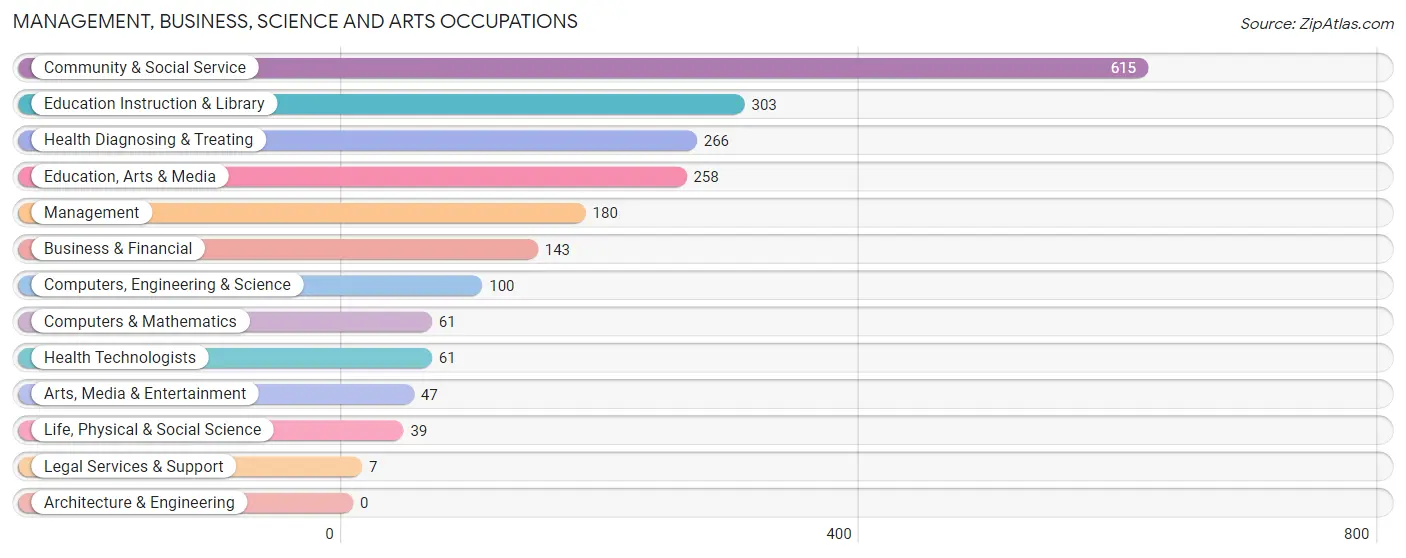
Management, Business, Science and Arts Occupations
The most common Management, Business, Science and Arts occupations in East St Louis are Community & Social Service (615 | 8.7%), Education Instruction & Library (303 | 4.3%), Health Diagnosing & Treating (266 | 3.8%), Education, Arts & Media (258 | 3.6%), and Management (180 | 2.5%).
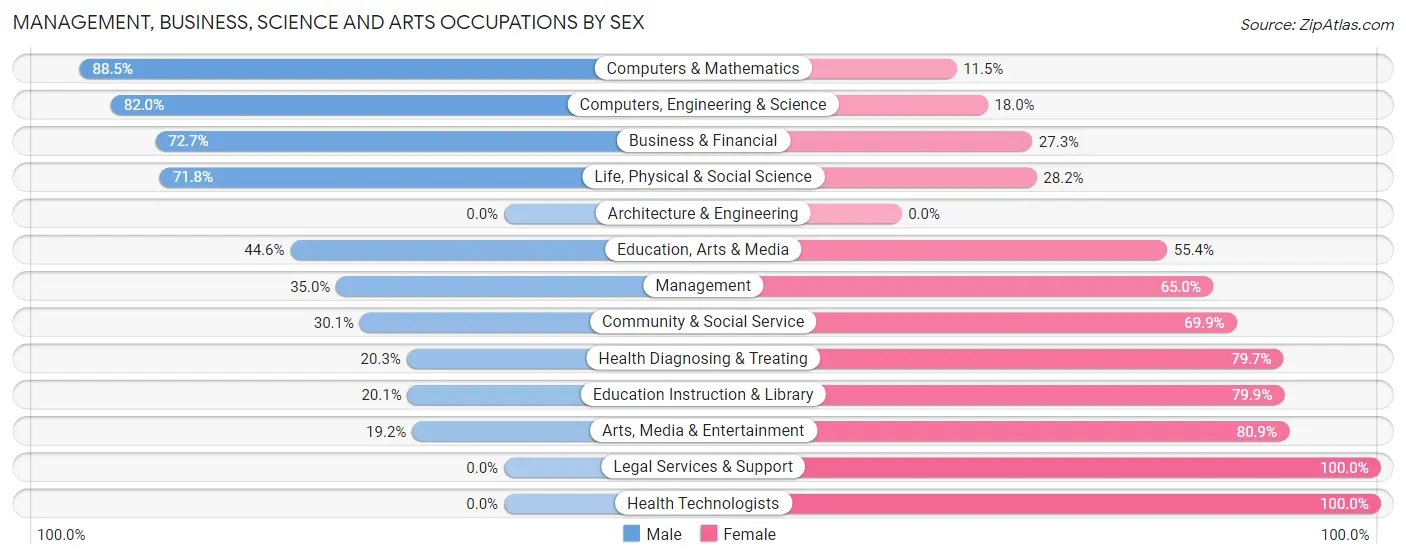
Management, Business, Science and Arts Occupations by Sex
Within the Management, Business, Science and Arts occupations in East St Louis, the most male-oriented occupations are Computers & Mathematics (88.5%), Computers, Engineering & Science (82.0%), and Business & Financial (72.7%), while the most female-oriented occupations are Legal Services & Support (100.0%), Health Technologists (100.0%), and Arts, Media & Entertainment (80.8%).
| Occupation | Male | Female |
| Management | 63 (35.0%) | 117 (65.0%) |
| Business & Financial | 104 (72.7%) | 39 (27.3%) |
| Computers, Engineering & Science | 82 (82.0%) | 18 (18.0%) |
| Computers & Mathematics | 54 (88.5%) | 7 (11.5%) |
| Architecture & Engineering | 0 (0.0%) | 0 (0.0%) |
| Life, Physical & Social Science | 28 (71.8%) | 11 (28.2%) |
| Community & Social Service | 185 (30.1%) | 430 (69.9%) |
| Education, Arts & Media | 115 (44.6%) | 143 (55.4%) |
| Legal Services & Support | 0 (0.0%) | 7 (100.0%) |
| Education Instruction & Library | 61 (20.1%) | 242 (79.9%) |
| Arts, Media & Entertainment | 9 (19.2%) | 38 (80.8%) |
| Health Diagnosing & Treating | 54 (20.3%) | 212 (79.7%) |
| Health Technologists | 0 (0.0%) | 61 (100.0%) |
| Total (Category) | 488 (37.4%) | 816 (62.6%) |
| Total (Overall) | 2,598 (36.7%) | 4,485 (63.3%) |
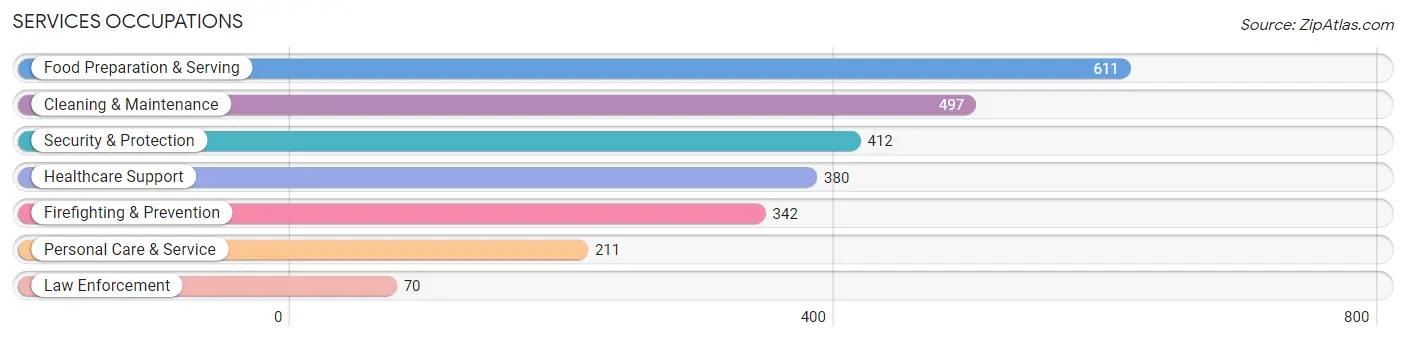
Services Occupations
The most common Services occupations in East St Louis are Food Preparation & Serving (611 | 8.6%), Cleaning & Maintenance (497 | 7.0%), Security & Protection (412 | 5.8%), Healthcare Support (380 | 5.4%), and Firefighting & Prevention (342 | 4.8%).
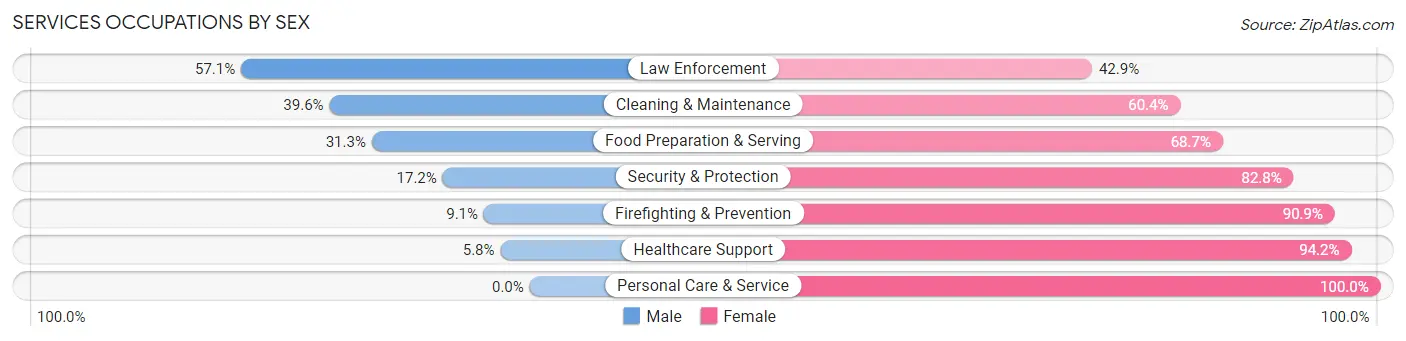
Services Occupations by Sex
Within the Services occupations in East St Louis, the most male-oriented occupations are Law Enforcement (57.1%), Cleaning & Maintenance (39.6%), and Food Preparation & Serving (31.3%), while the most female-oriented occupations are Personal Care & Service (100.0%), Healthcare Support (94.2%), and Firefighting & Prevention (90.9%).
| Occupation | Male | Female |
| Healthcare Support | 22 (5.8%) | 358 (94.2%) |
| Security & Protection | 71 (17.2%) | 341 (82.8%) |
| Firefighting & Prevention | 31 (9.1%) | 311 (90.9%) |
| Law Enforcement | 40 (57.1%) | 30 (42.9%) |
| Food Preparation & Serving | 191 (31.3%) | 420 (68.7%) |
| Cleaning & Maintenance | 197 (39.6%) | 300 (60.4%) |
| Personal Care & Service | 0 (0.0%) | 211 (100.0%) |
| Total (Category) | 481 (22.8%) | 1,630 (77.2%) |
| Total (Overall) | 2,598 (36.7%) | 4,485 (63.3%) |
Sales and Office Occupations
The most common Sales and Office occupations in East St Louis are Office & Administration (1,030 | 14.5%), and Sales & Related (834 | 11.8%).

Sales and Office Occupations by Sex
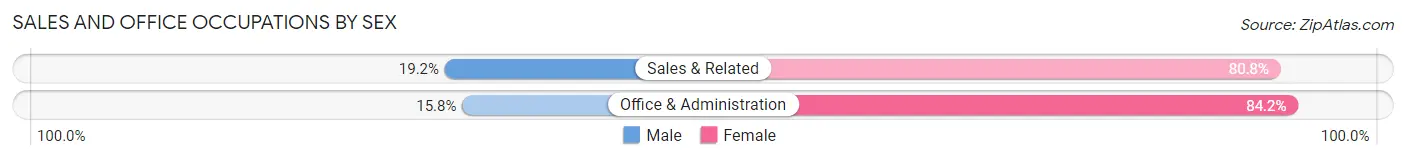
| Occupation | Male | Female |
| Sales & Related | 160 (19.2%) | 674 (80.8%) |
| Office & Administration | 163 (15.8%) | 867 (84.2%) |
| Total (Category) | 323 (17.3%) | 1,541 (82.7%) |
| Total (Overall) | 2,598 (36.7%) | 4,485 (63.3%) |
Natural Resources, Construction and Maintenance Occupations
The most common Natural Resources, Construction and Maintenance occupations in East St Louis are Installation, Maintenance & Repair (121 | 1.7%), and Construction & Extraction (47 | 0.7%).

Natural Resources, Construction and Maintenance Occupations by Sex

| Occupation | Male | Female |
| Farming, Fishing & Forestry | 0 (0.0%) | 0 (0.0%) |
| Construction & Extraction | 47 (100.0%) | 0 (0.0%) |
| Installation, Maintenance & Repair | 121 (100.0%) | 0 (0.0%) |
| Total (Category) | 168 (100.0%) | 0 (0.0%) |
| Total (Overall) | 2,598 (36.7%) | 4,485 (63.3%) |
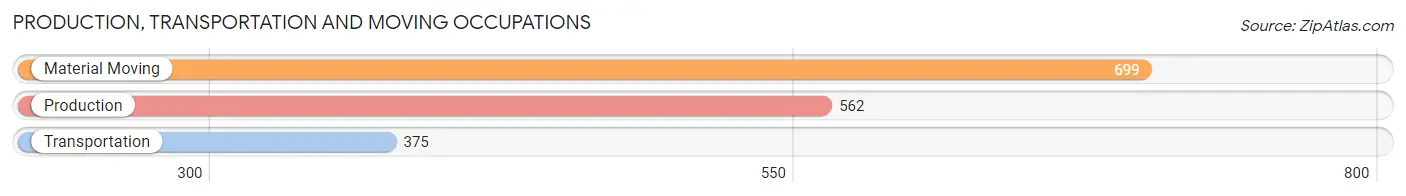
Production, Transportation and Moving Occupations
The most common Production, Transportation and Moving occupations in East St Louis are Material Moving (699 | 9.9%), Production (562 | 7.9%), and Transportation (375 | 5.3%).
Production, Transportation and Moving Occupations by Sex
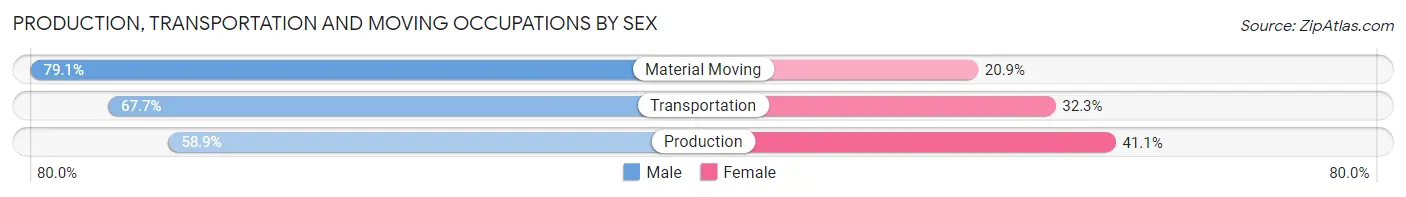
| Occupation | Male | Female |
| Production | 331 (58.9%) | 231 (41.1%) |
| Transportation | 254 (67.7%) | 121 (32.3%) |
| Material Moving | 553 (79.1%) | 146 (20.9%) |
| Total (Category) | 1,138 (69.6%) | 498 (30.4%) |
| Total (Overall) | 2,598 (36.7%) | 4,485 (63.3%) |
Employment Industries by Sex in East St Louis
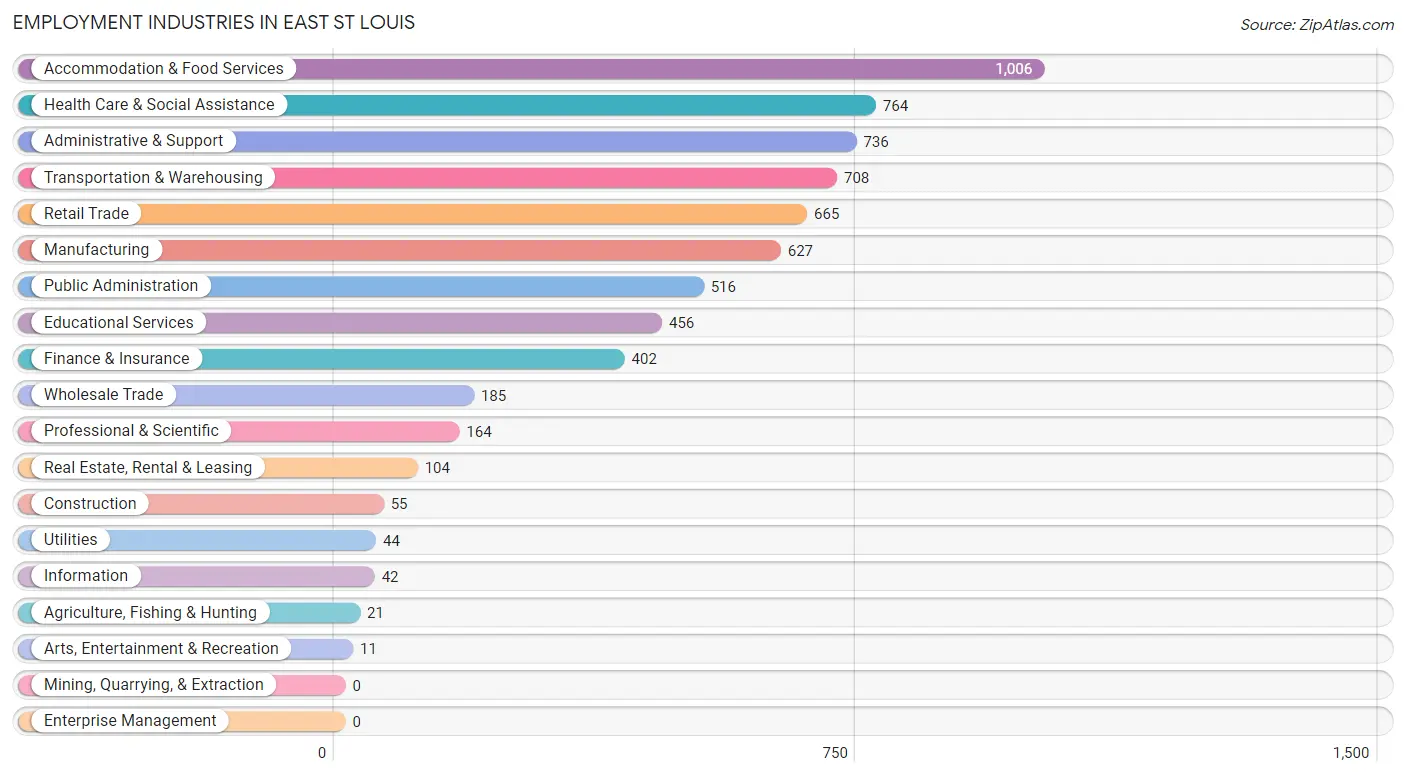
Employment Industries in East St Louis
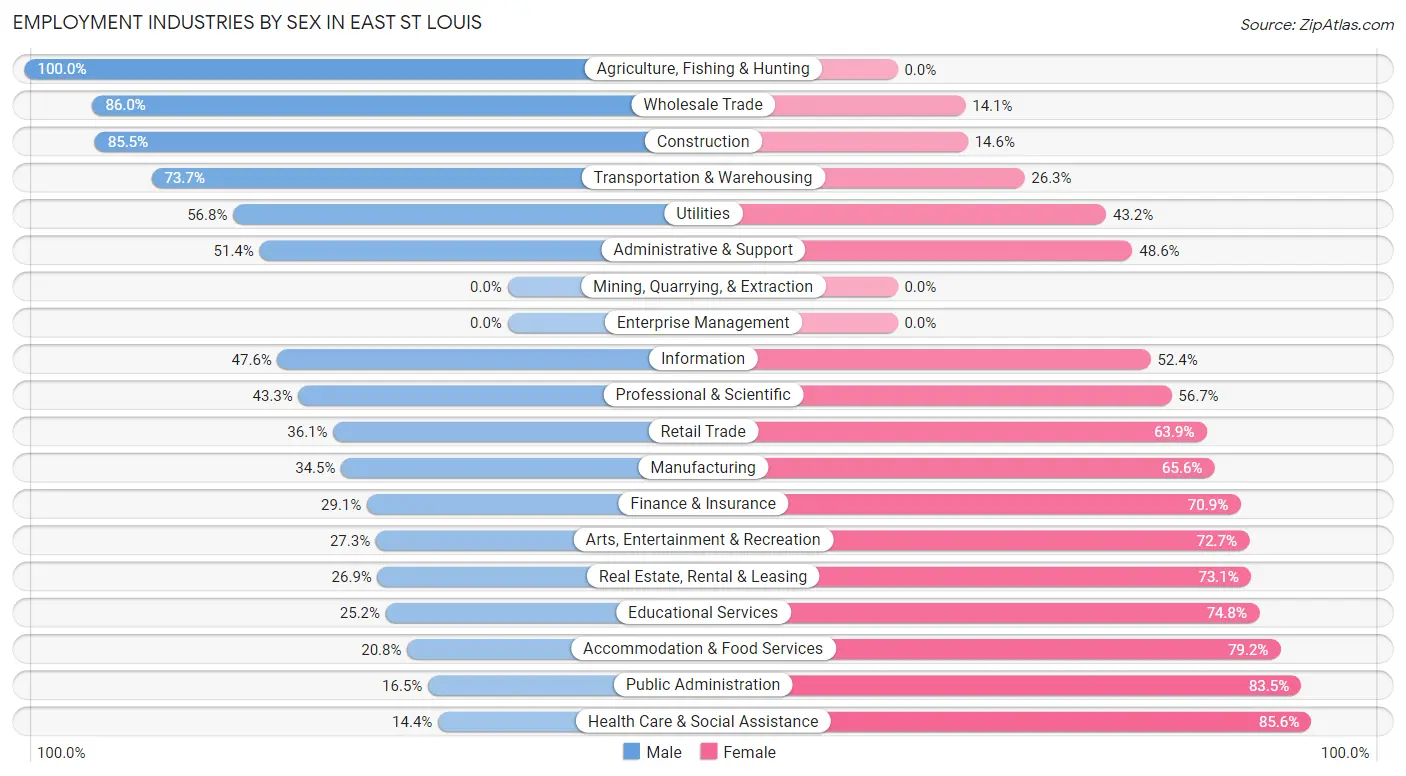
The major employment industries in East St Louis include Accommodation & Food Services (1,006 | 14.2%), Health Care & Social Assistance (764 | 10.8%), Administrative & Support (736 | 10.4%), Transportation & Warehousing (708 | 10.0%), and Retail Trade (665 | 9.4%).
Employment Industries by Sex in East St Louis
The East St Louis industries that see more men than women are Agriculture, Fishing & Hunting (100.0%), Wholesale Trade (86.0%), and Construction (85.5%), whereas the industries that tend to have a higher number of women are Health Care & Social Assistance (85.6%), Public Administration (83.5%), and Accommodation & Food Services (79.2%).
| Industry | Male | Female |
| Agriculture, Fishing & Hunting | 21 (100.0%) | 0 (0.0%) |
| Mining, Quarrying, & Extraction | 0 (0.0%) | 0 (0.0%) |
| Construction | 47 (85.5%) | 8 (14.5%) |
| Manufacturing | 216 (34.4%) | 411 (65.5%) |
| Wholesale Trade | 159 (86.0%) | 26 (14.1%) |
| Retail Trade | 240 (36.1%) | 425 (63.9%) |
| Transportation & Warehousing | 522 (73.7%) | 186 (26.3%) |
| Utilities | 25 (56.8%) | 19 (43.2%) |
| Information | 20 (47.6%) | 22 (52.4%) |
| Finance & Insurance | 117 (29.1%) | 285 (70.9%) |
| Real Estate, Rental & Leasing | 28 (26.9%) | 76 (73.1%) |
| Professional & Scientific | 71 (43.3%) | 93 (56.7%) |
| Enterprise Management | 0 (0.0%) | 0 (0.0%) |
| Administrative & Support | 378 (51.4%) | 358 (48.6%) |
| Educational Services | 115 (25.2%) | 341 (74.8%) |
| Health Care & Social Assistance | 110 (14.4%) | 654 (85.6%) |
| Arts, Entertainment & Recreation | 3 (27.3%) | 8 (72.7%) |
| Accommodation & Food Services | 209 (20.8%) | 797 (79.2%) |
| Public Administration | 85 (16.5%) | 431 (83.5%) |
| Total | 2,598 (36.7%) | 4,485 (63.3%) |
Education in East St Louis
School Enrollment in East St Louis
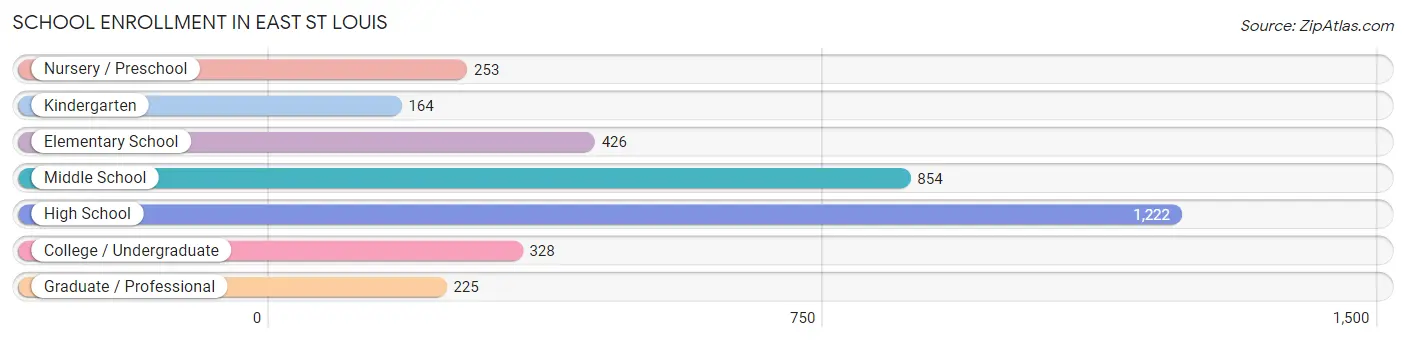
The most common levels of schooling among the 3,472 students in East St Louis are high school (1,222 | 35.2%), middle school (854 | 24.6%), and elementary school (426 | 12.3%).
| School Level | # Students | % Students |
| Nursery / Preschool | 253 | 7.3% |
| Kindergarten | 164 | 4.7% |
| Elementary School | 426 | 12.3% |
| Middle School | 854 | 24.6% |
| High School | 1,222 | 35.2% |
| College / Undergraduate | 328 | 9.5% |
| Graduate / Professional | 225 | 6.5% |
| Total | 3,472 | 100.0% |
School Enrollment by Age by Funding Source in East St Louis
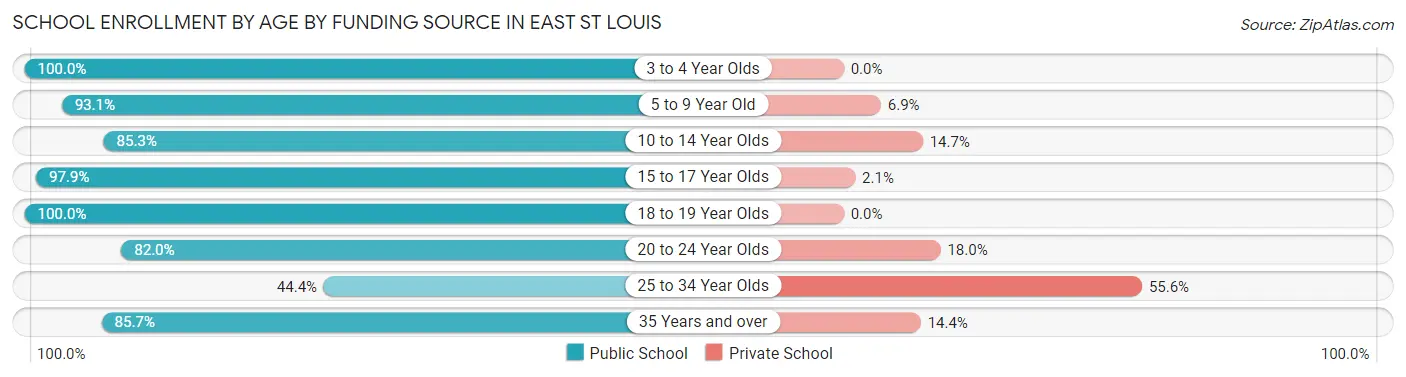
Out of a total of 3,472 students who are enrolled in schools in East St Louis, 392 (11.3%) attend a private institution, while the remaining 3,080 (88.7%) are enrolled in public schools. The age group of 25 to 34 year olds has the highest likelihood of being enrolled in private schools, with 125 (55.6% in the age bracket) enrolled. Conversely, the age group of 3 to 4 year olds has the lowest likelihood of being enrolled in a private school, with 199 (100.0% in the age bracket) attending a public institution.
| Age Bracket | Public School | Private School |
| 3 to 4 Year Olds | 199 (100.0%) | 0 (0.0%) |
| 5 to 9 Year Old | 538 (93.1%) | 40 (6.9%) |
| 10 to 14 Year Olds | 933 (85.3%) | 161 (14.7%) |
| 15 to 17 Year Olds | 594 (97.9%) | 13 (2.1%) |
| 18 to 19 Year Olds | 417 (100.0%) | 0 (0.0%) |
| 20 to 24 Year Olds | 100 (82.0%) | 22 (18.0%) |
| 25 to 34 Year Olds | 100 (44.4%) | 125 (55.6%) |
| 35 Years and over | 197 (85.7%) | 33 (14.3%) |
| Total | 3,080 (88.7%) | 392 (11.3%) |
Educational Attainment by Field of Study in East St Louis
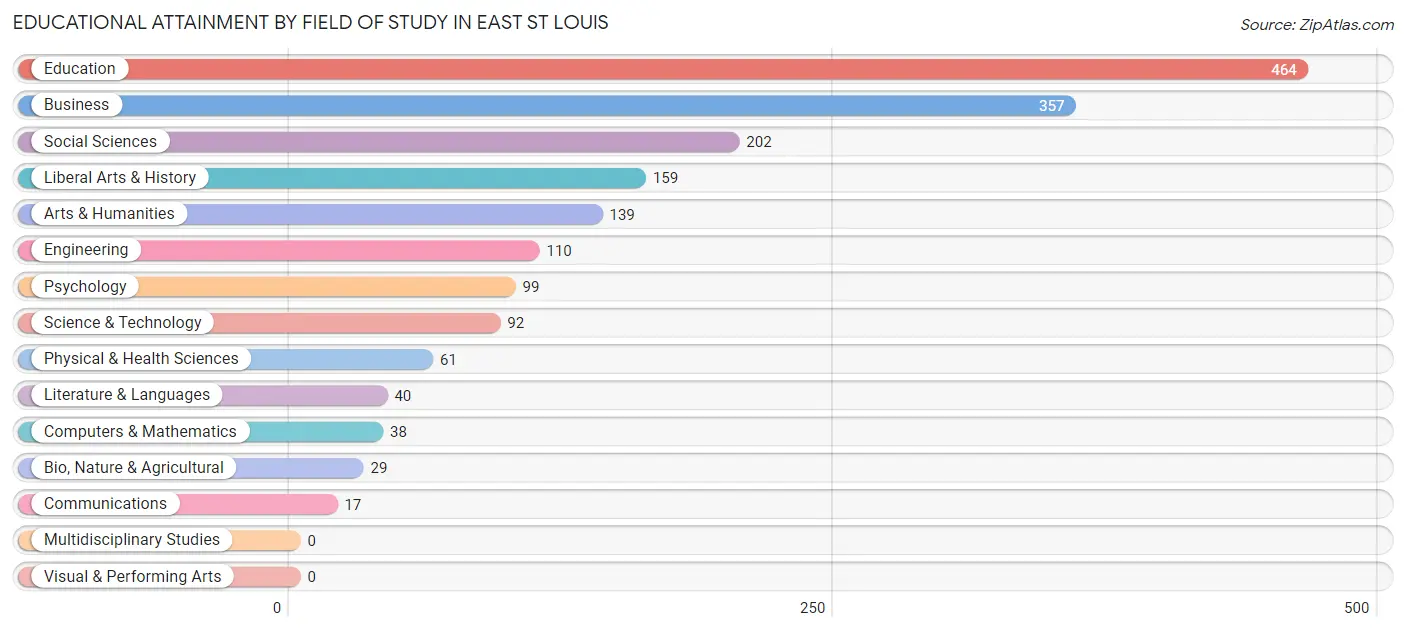
Education (464 | 25.7%), business (357 | 19.8%), social sciences (202 | 11.2%), liberal arts & history (159 | 8.8%), and arts & humanities (139 | 7.7%) are the most common fields of study among 1,807 individuals in East St Louis who have obtained a bachelor's degree or higher.
| Field of Study | # Graduates | % Graduates |
| Computers & Mathematics | 38 | 2.1% |
| Bio, Nature & Agricultural | 29 | 1.6% |
| Physical & Health Sciences | 61 | 3.4% |
| Psychology | 99 | 5.5% |
| Social Sciences | 202 | 11.2% |
| Engineering | 110 | 6.1% |
| Multidisciplinary Studies | 0 | 0.0% |
| Science & Technology | 92 | 5.1% |
| Business | 357 | 19.8% |
| Education | 464 | 25.7% |
| Literature & Languages | 40 | 2.2% |
| Liberal Arts & History | 159 | 8.8% |
| Visual & Performing Arts | 0 | 0.0% |
| Communications | 17 | 0.9% |
| Arts & Humanities | 139 | 7.7% |
| Total | 1,807 | 100.0% |
Transportation & Commute in East St Louis
Vehicle Availability by Sex in East St Louis
The most prevalent vehicle ownership categories in East St Louis are males with 1 vehicle (847, accounting for 33.0%) and females with 1 vehicle (2,141, making up 19.4%).
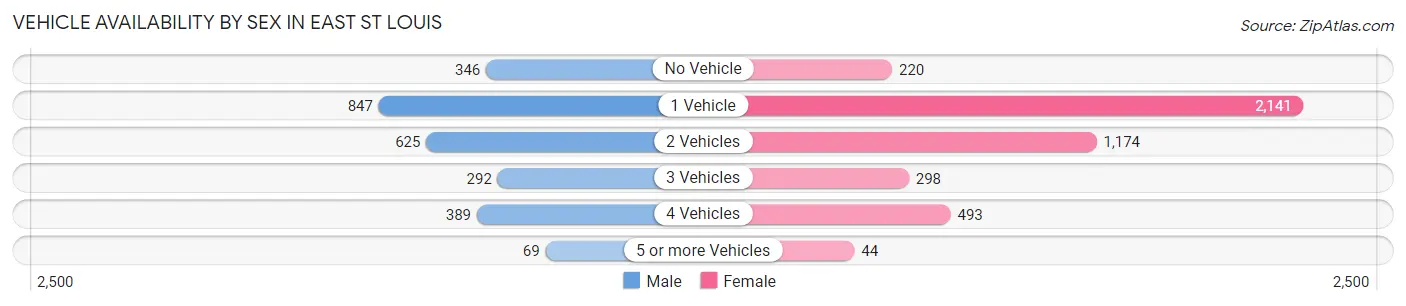
| Vehicles Available | Male | Female |
| No Vehicle | 346 (13.5%) | 220 (5.0%) |
| 1 Vehicle | 847 (33.0%) | 2,141 (49.0%) |
| 2 Vehicles | 625 (24.3%) | 1,174 (26.9%) |
| 3 Vehicles | 292 (11.4%) | 298 (6.8%) |
| 4 Vehicles | 389 (15.1%) | 493 (11.3%) |
| 5 or more Vehicles | 69 (2.7%) | 44 (1.0%) |
| Total | 2,568 (100.0%) | 4,370 (100.0%) |
Commute Time in East St Louis
The most frequently occuring commute durations in East St Louis are 15 to 19 minutes (1,773 commuters, 27.1%), 20 to 24 minutes (1,322 commuters, 20.2%), and 30 to 34 minutes (1,121 commuters, 17.1%).
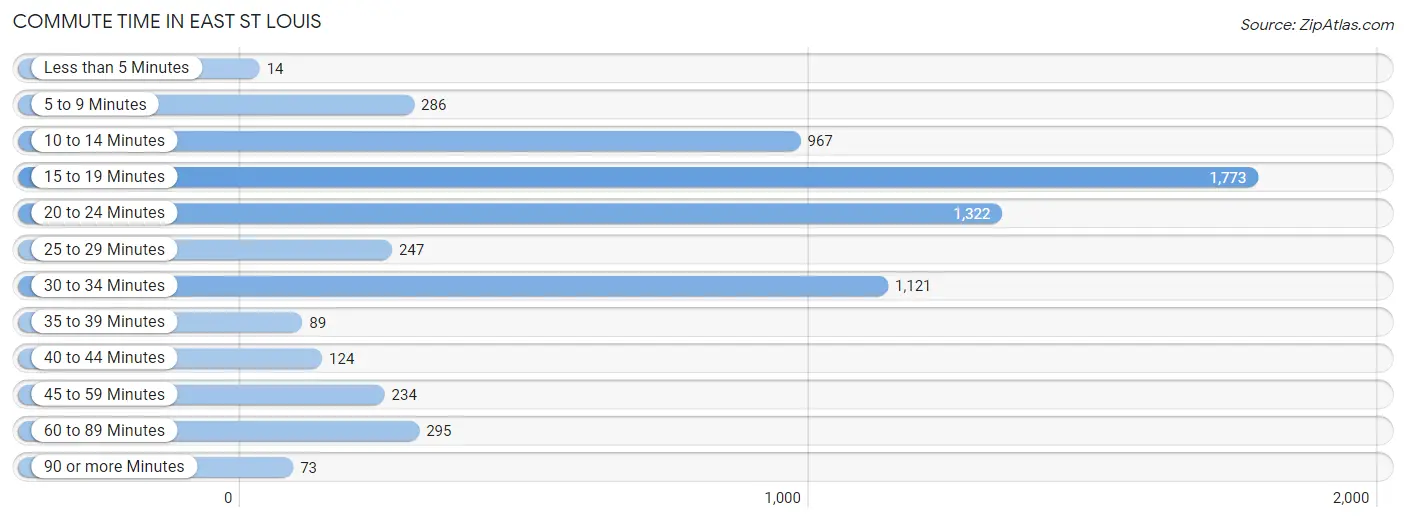
| Commute Time | # Commuters | % Commuters |
| Less than 5 Minutes | 14 | 0.2% |
| 5 to 9 Minutes | 286 | 4.4% |
| 10 to 14 Minutes | 967 | 14.8% |
| 15 to 19 Minutes | 1,773 | 27.1% |
| 20 to 24 Minutes | 1,322 | 20.2% |
| 25 to 29 Minutes | 247 | 3.8% |
| 30 to 34 Minutes | 1,121 | 17.1% |
| 35 to 39 Minutes | 89 | 1.4% |
| 40 to 44 Minutes | 124 | 1.9% |
| 45 to 59 Minutes | 234 | 3.6% |
| 60 to 89 Minutes | 295 | 4.5% |
| 90 or more Minutes | 73 | 1.1% |
Commute Time by Sex in East St Louis
The most common commute times in East St Louis are 15 to 19 minutes (505 commuters, 20.9%) for males and 15 to 19 minutes (1,268 commuters, 30.7%) for females.
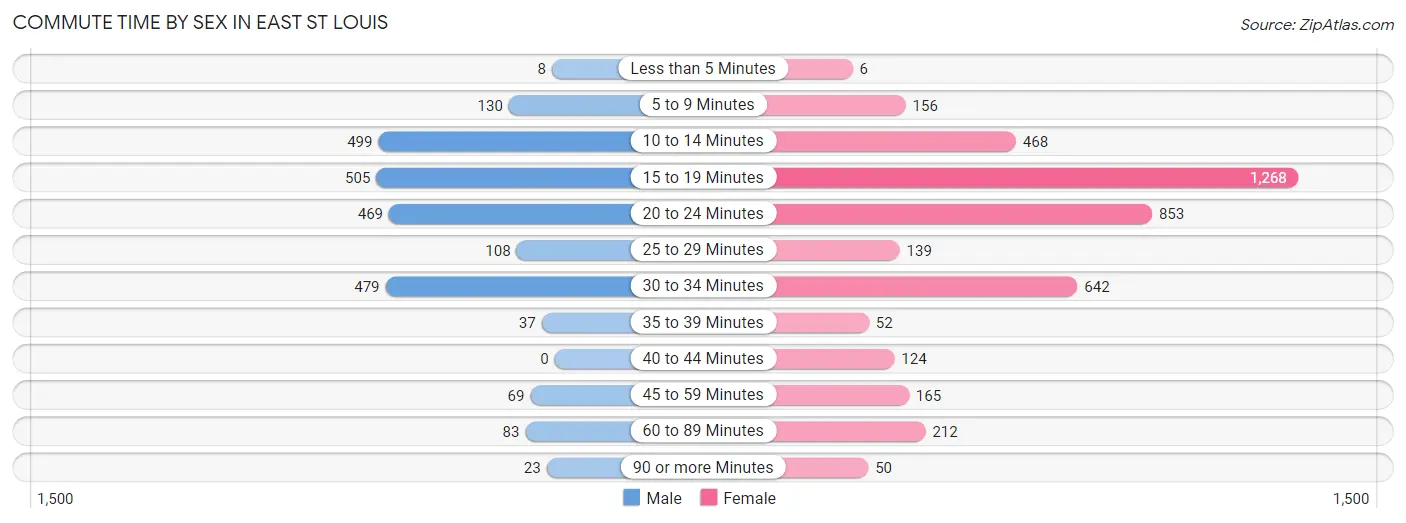
| Commute Time | Male | Female |
| Less than 5 Minutes | 8 (0.3%) | 6 (0.2%) |
| 5 to 9 Minutes | 130 (5.4%) | 156 (3.8%) |
| 10 to 14 Minutes | 499 (20.7%) | 468 (11.3%) |
| 15 to 19 Minutes | 505 (20.9%) | 1,268 (30.7%) |
| 20 to 24 Minutes | 469 (19.5%) | 853 (20.6%) |
| 25 to 29 Minutes | 108 (4.5%) | 139 (3.4%) |
| 30 to 34 Minutes | 479 (19.9%) | 642 (15.5%) |
| 35 to 39 Minutes | 37 (1.5%) | 52 (1.3%) |
| 40 to 44 Minutes | 0 (0.0%) | 124 (3.0%) |
| 45 to 59 Minutes | 69 (2.9%) | 165 (4.0%) |
| 60 to 89 Minutes | 83 (3.4%) | 212 (5.1%) |
| 90 or more Minutes | 23 (0.9%) | 50 (1.2%) |
Time of Departure to Work by Sex in East St Louis
The most frequent times of departure to work in East St Louis are 6:00 AM to 6:29 AM (383, 15.9%) for males and 6:00 AM to 6:29 AM (804, 19.4%) for females.
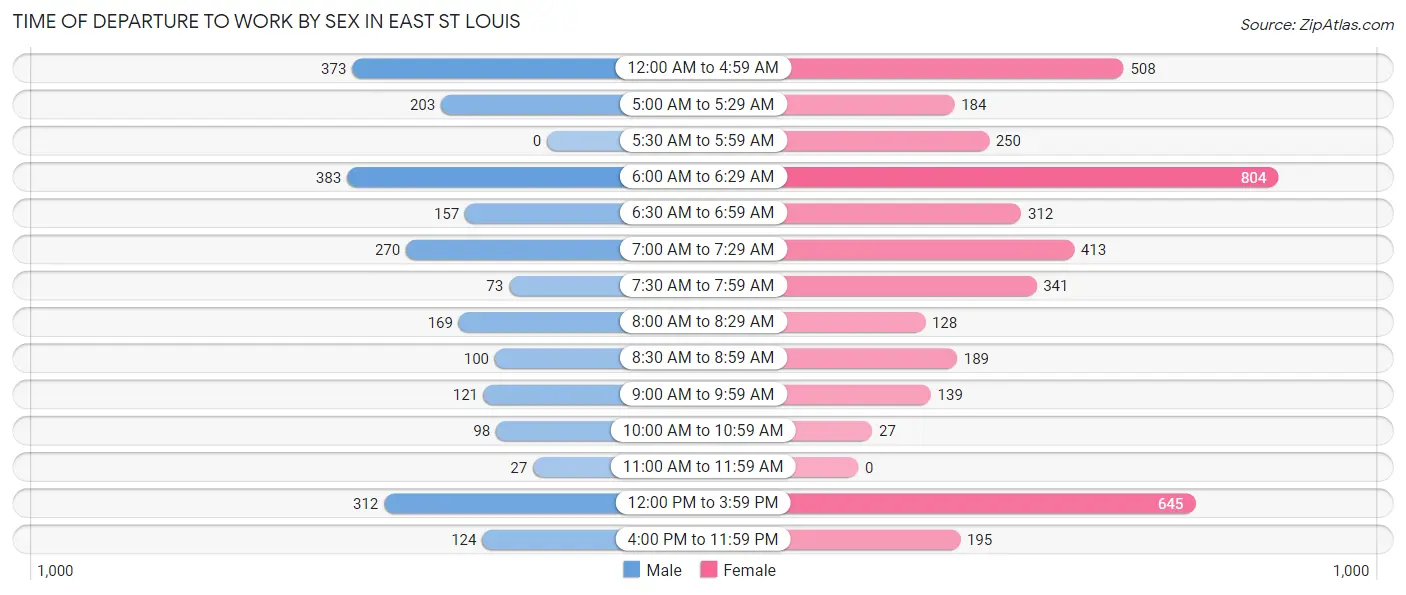
| Time of Departure | Male | Female |
| 12:00 AM to 4:59 AM | 373 (15.5%) | 508 (12.3%) |
| 5:00 AM to 5:29 AM | 203 (8.4%) | 184 (4.4%) |
| 5:30 AM to 5:59 AM | 0 (0.0%) | 250 (6.0%) |
| 6:00 AM to 6:29 AM | 383 (15.9%) | 804 (19.4%) |
| 6:30 AM to 6:59 AM | 157 (6.5%) | 312 (7.5%) |
| 7:00 AM to 7:29 AM | 270 (11.2%) | 413 (10.0%) |
| 7:30 AM to 7:59 AM | 73 (3.0%) | 341 (8.3%) |
| 8:00 AM to 8:29 AM | 169 (7.0%) | 128 (3.1%) |
| 8:30 AM to 8:59 AM | 100 (4.2%) | 189 (4.6%) |
| 9:00 AM to 9:59 AM | 121 (5.0%) | 139 (3.4%) |
| 10:00 AM to 10:59 AM | 98 (4.1%) | 27 (0.6%) |
| 11:00 AM to 11:59 AM | 27 (1.1%) | 0 (0.0%) |
| 12:00 PM to 3:59 PM | 312 (13.0%) | 645 (15.6%) |
| 4:00 PM to 11:59 PM | 124 (5.1%) | 195 (4.7%) |
| Total | 2,410 (100.0%) | 4,135 (100.0%) |
Housing Occupancy in East St Louis
Occupancy by Ownership in East St Louis
Of the total 7,676 dwellings in East St Louis, owner-occupied units account for 4,019 (52.4%), while renter-occupied units make up 3,657 (47.6%).
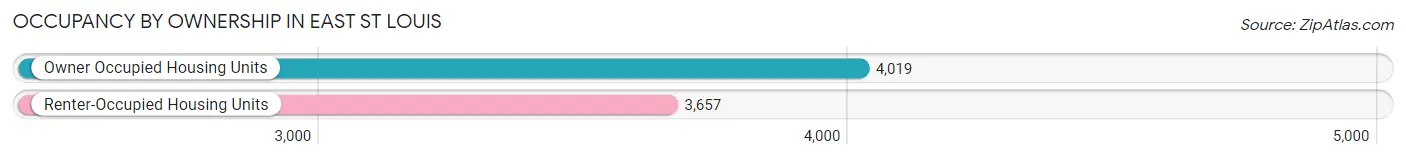
| Occupancy | # Housing Units | % Housing Units |
| Owner Occupied Housing Units | 4,019 | 52.4% |
| Renter-Occupied Housing Units | 3,657 | 47.6% |
| Total Occupied Housing Units | 7,676 | 100.0% |
Occupancy by Household Size in East St Louis
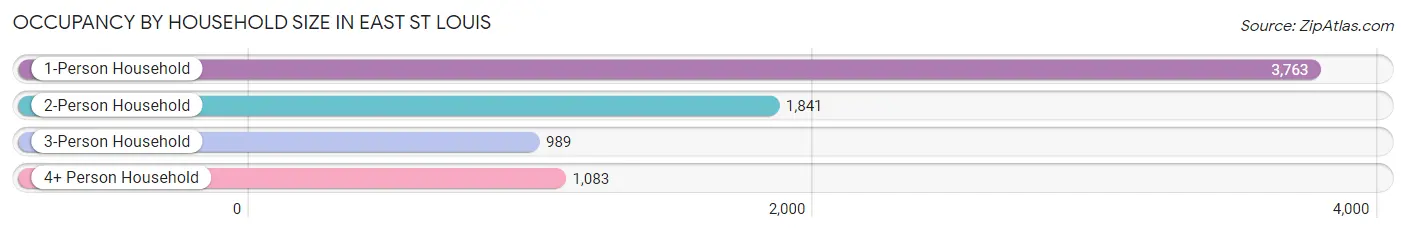
| Household Size | # Housing Units | % Housing Units |
| 1-Person Household | 3,763 | 49.0% |
| 2-Person Household | 1,841 | 24.0% |
| 3-Person Household | 989 | 12.9% |
| 4+ Person Household | 1,083 | 14.1% |
| Total Housing Units | 7,676 | 100.0% |
Occupancy by Ownership by Household Size in East St Louis
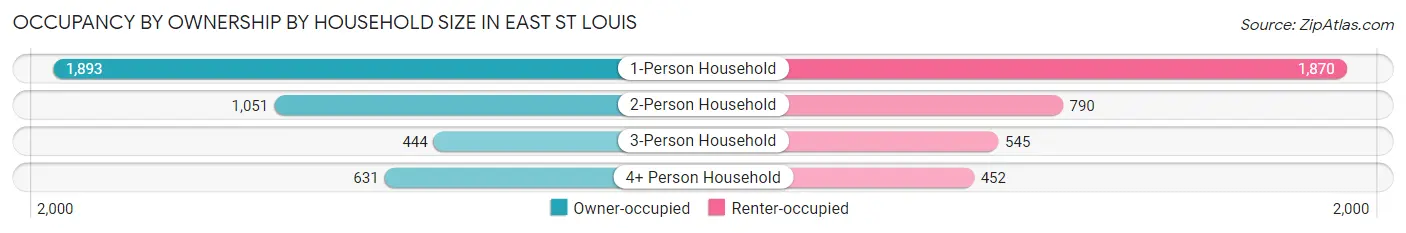
| Household Size | Owner-occupied | Renter-occupied |
| 1-Person Household | 1,893 (50.3%) | 1,870 (49.7%) |
| 2-Person Household | 1,051 (57.1%) | 790 (42.9%) |
| 3-Person Household | 444 (44.9%) | 545 (55.1%) |
| 4+ Person Household | 631 (58.3%) | 452 (41.7%) |
| Total Housing Units | 4,019 (52.4%) | 3,657 (47.6%) |
Occupancy by Educational Attainment in East St Louis
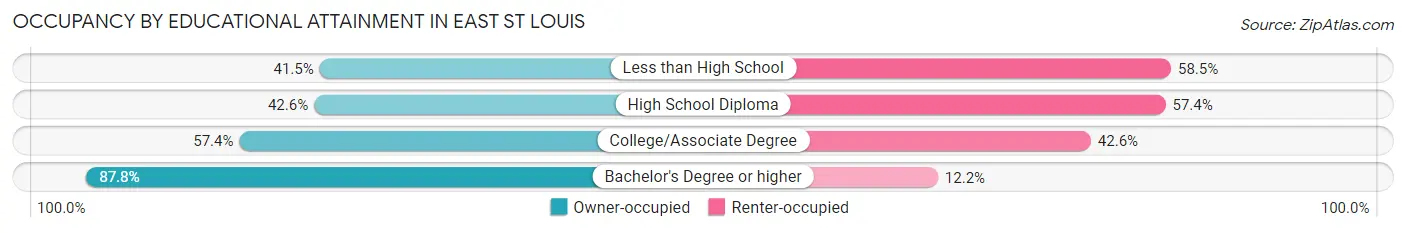
| Household Size | Owner-occupied | Renter-occupied |
| Less than High School | 645 (41.5%) | 908 (58.5%) |
| High School Diploma | 1,123 (42.6%) | 1,512 (57.4%) |
| College/Associate Degree | 1,534 (57.4%) | 1,137 (42.6%) |
| Bachelor's Degree or higher | 717 (87.8%) | 100 (12.2%) |
Occupancy by Age of Householder in East St Louis
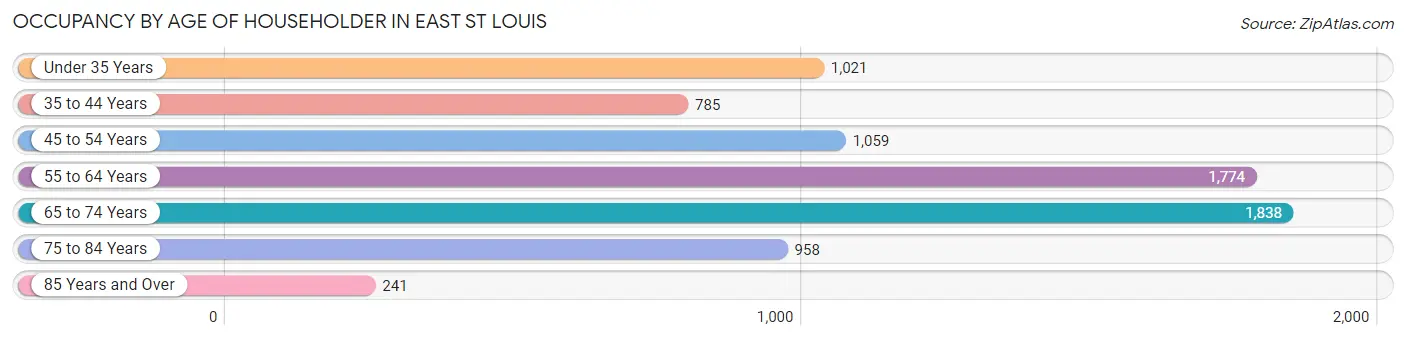
| Age Bracket | # Households | % Households |
| Under 35 Years | 1,021 | 13.3% |
| 35 to 44 Years | 785 | 10.2% |
| 45 to 54 Years | 1,059 | 13.8% |
| 55 to 64 Years | 1,774 | 23.1% |
| 65 to 74 Years | 1,838 | 23.9% |
| 75 to 84 Years | 958 | 12.5% |
| 85 Years and Over | 241 | 3.1% |
| Total | 7,676 | 100.0% |
Housing Finances in East St Louis
Median Income by Occupancy in East St Louis
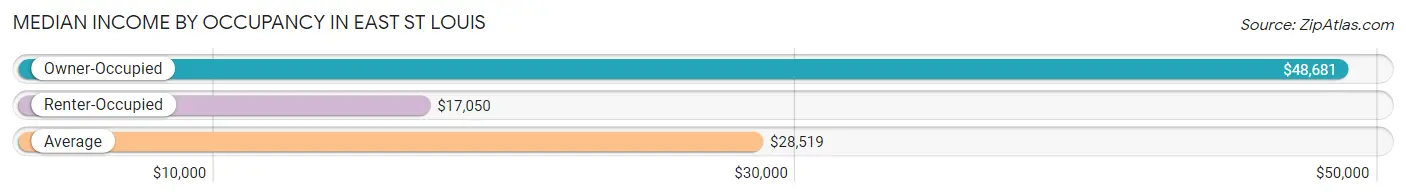
| Occupancy Type | # Households | Median Income |
| Owner-Occupied | 4,019 (52.4%) | $48,681 |
| Renter-Occupied | 3,657 (47.6%) | $17,050 |
| Average | 7,676 (100.0%) | $28,519 |
Occupancy by Householder Income Bracket in East St Louis
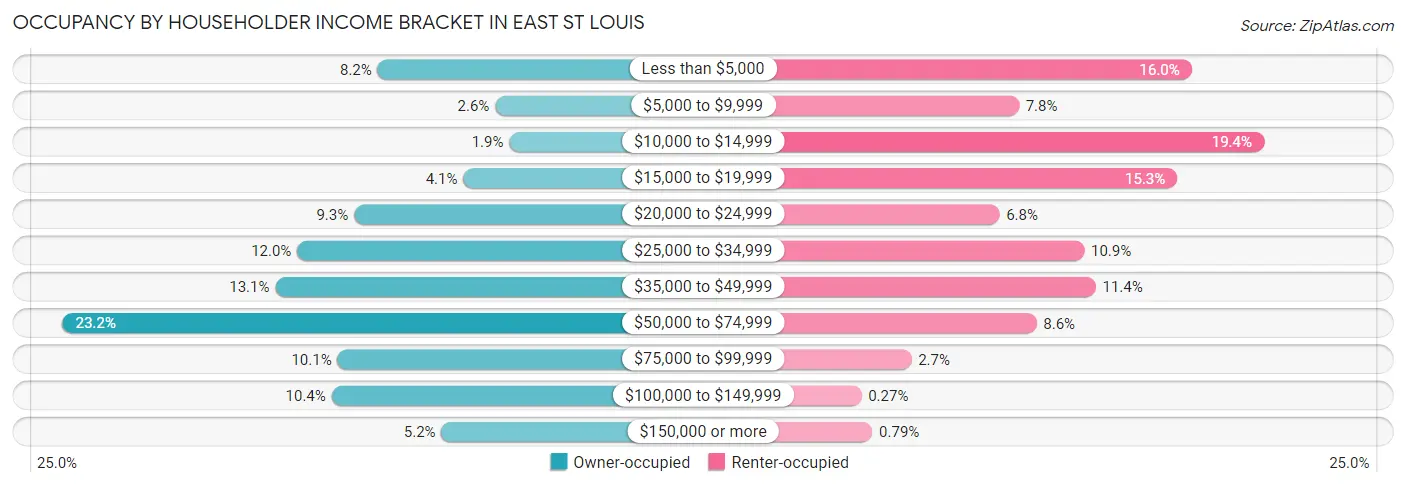
| Income Bracket | Owner-occupied | Renter-occupied |
| Less than $5,000 | 329 (8.2%) | 585 (16.0%) |
| $5,000 to $9,999 | 104 (2.6%) | 284 (7.8%) |
| $10,000 to $14,999 | 77 (1.9%) | 711 (19.4%) |
| $15,000 to $19,999 | 165 (4.1%) | 560 (15.3%) |
| $20,000 to $24,999 | 374 (9.3%) | 250 (6.8%) |
| $25,000 to $34,999 | 483 (12.0%) | 398 (10.9%) |
| $35,000 to $49,999 | 525 (13.1%) | 418 (11.4%) |
| $50,000 to $74,999 | 932 (23.2%) | 315 (8.6%) |
| $75,000 to $99,999 | 406 (10.1%) | 97 (2.6%) |
| $100,000 to $149,999 | 417 (10.4%) | 10 (0.3%) |
| $150,000 or more | 207 (5.1%) | 29 (0.8%) |
| Total | 4,019 (100.0%) | 3,657 (100.0%) |
Monthly Housing Cost Tiers in East St Louis
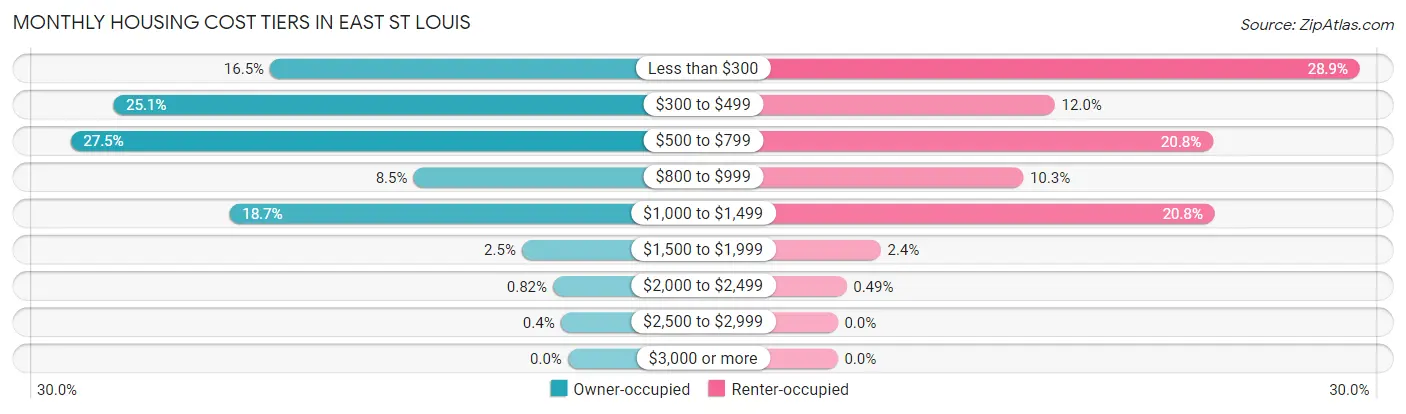
| Monthly Cost | Owner-occupied | Renter-occupied |
| Less than $300 | 661 (16.5%) | 1,055 (28.8%) |
| $300 to $499 | 1,009 (25.1%) | 439 (12.0%) |
| $500 to $799 | 1,104 (27.5%) | 759 (20.7%) |
| $800 to $999 | 343 (8.5%) | 375 (10.2%) |
| $1,000 to $1,499 | 751 (18.7%) | 762 (20.8%) |
| $1,500 to $1,999 | 102 (2.5%) | 87 (2.4%) |
| $2,000 to $2,499 | 33 (0.8%) | 18 (0.5%) |
| $2,500 to $2,999 | 16 (0.4%) | 0 (0.0%) |
| $3,000 or more | 0 (0.0%) | 0 (0.0%) |
| Total | 4,019 (100.0%) | 3,657 (100.0%) |
Physical Housing Characteristics in East St Louis
Housing Structures in East St Louis
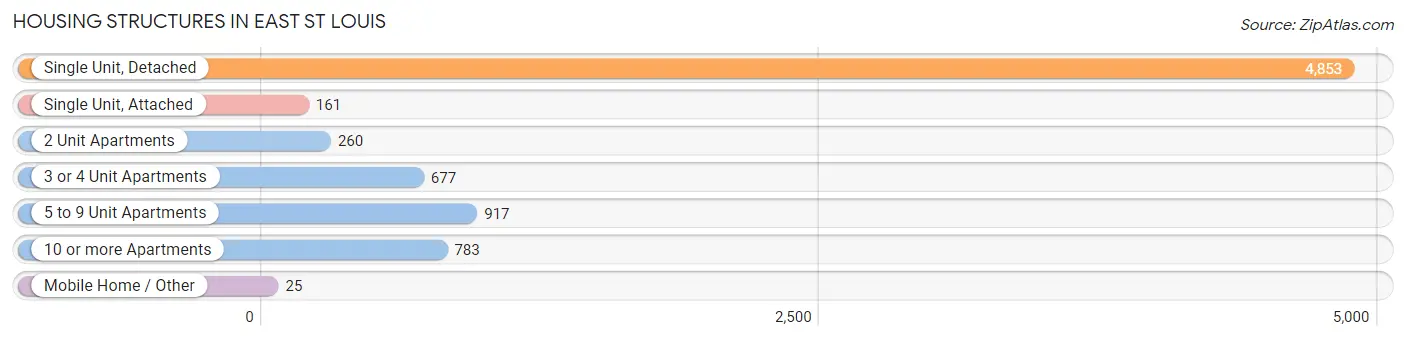
| Structure Type | # Housing Units | % Housing Units |
| Single Unit, Detached | 4,853 | 63.2% |
| Single Unit, Attached | 161 | 2.1% |
| 2 Unit Apartments | 260 | 3.4% |
| 3 or 4 Unit Apartments | 677 | 8.8% |
| 5 to 9 Unit Apartments | 917 | 11.9% |
| 10 or more Apartments | 783 | 10.2% |
| Mobile Home / Other | 25 | 0.3% |
| Total | 7,676 | 100.0% |
Housing Structures by Occupancy in East St Louis
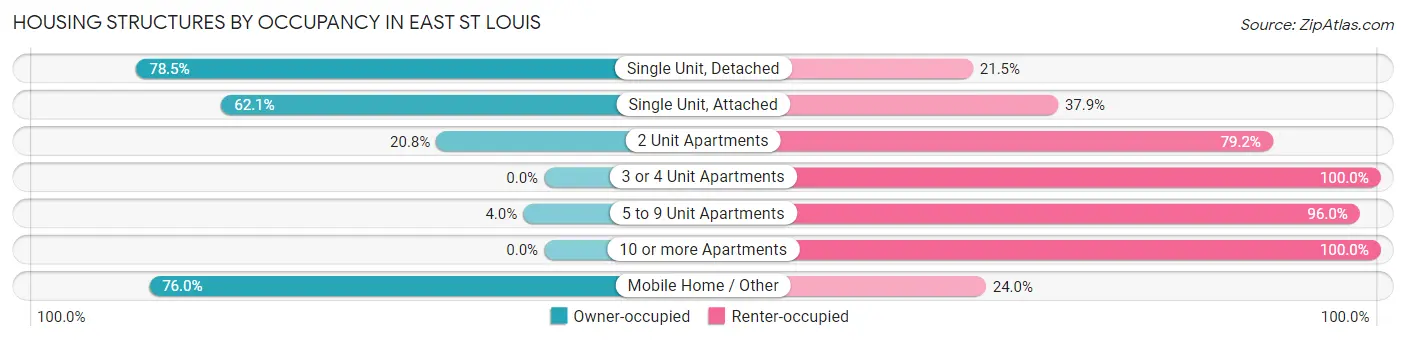
| Structure Type | Owner-occupied | Renter-occupied |
| Single Unit, Detached | 3,809 (78.5%) | 1,044 (21.5%) |
| Single Unit, Attached | 100 (62.1%) | 61 (37.9%) |
| 2 Unit Apartments | 54 (20.8%) | 206 (79.2%) |
| 3 or 4 Unit Apartments | 0 (0.0%) | 677 (100.0%) |
| 5 to 9 Unit Apartments | 37 (4.0%) | 880 (96.0%) |
| 10 or more Apartments | 0 (0.0%) | 783 (100.0%) |
| Mobile Home / Other | 19 (76.0%) | 6 (24.0%) |
| Total | 4,019 (52.4%) | 3,657 (47.6%) |
Housing Structures by Number of Rooms in East St Louis
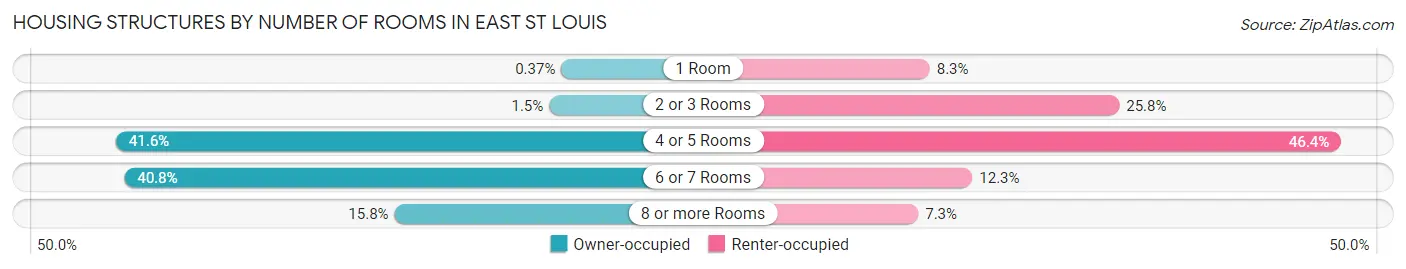
| Number of Rooms | Owner-occupied | Renter-occupied |
| 1 Room | 15 (0.4%) | 304 (8.3%) |
| 2 or 3 Rooms | 60 (1.5%) | 945 (25.8%) |
| 4 or 5 Rooms | 1,670 (41.5%) | 1,695 (46.4%) |
| 6 or 7 Rooms | 1,639 (40.8%) | 448 (12.2%) |
| 8 or more Rooms | 635 (15.8%) | 265 (7.2%) |
| Total | 4,019 (100.0%) | 3,657 (100.0%) |
Housing Structure by Heating Type in East St Louis
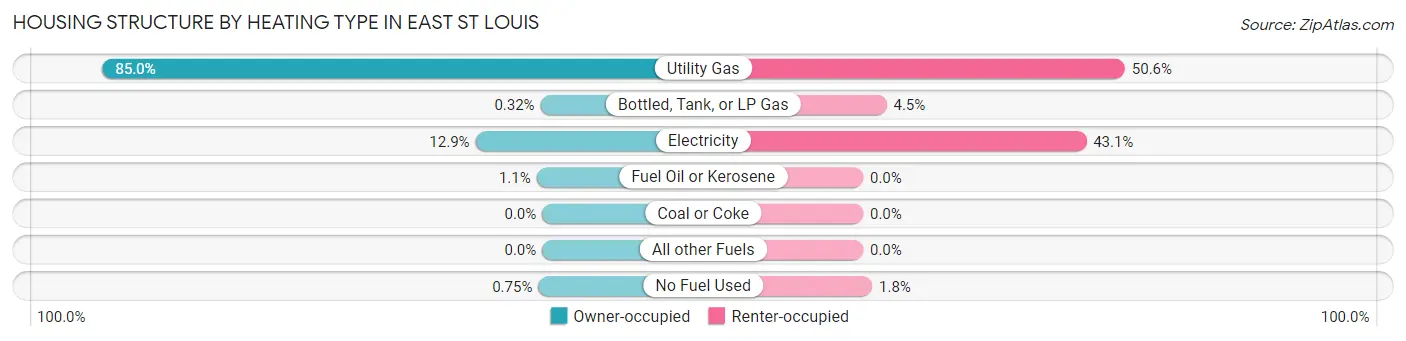
| Heating Type | Owner-occupied | Renter-occupied |
| Utility Gas | 3,415 (85.0%) | 1,850 (50.6%) |
| Bottled, Tank, or LP Gas | 13 (0.3%) | 166 (4.5%) |
| Electricity | 518 (12.9%) | 1,577 (43.1%) |
| Fuel Oil or Kerosene | 43 (1.1%) | 0 (0.0%) |
| Coal or Coke | 0 (0.0%) | 0 (0.0%) |
| All other Fuels | 0 (0.0%) | 0 (0.0%) |
| No Fuel Used | 30 (0.7%) | 64 (1.8%) |
| Total | 4,019 (100.0%) | 3,657 (100.0%) |
Household Vehicle Usage in East St Louis
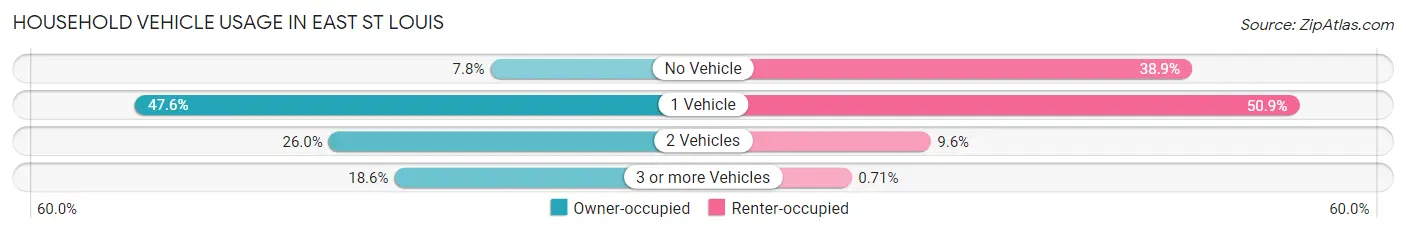
| Vehicles per Household | Owner-occupied | Renter-occupied |
| No Vehicle | 315 (7.8%) | 1,421 (38.9%) |
| 1 Vehicle | 1,914 (47.6%) | 1,860 (50.9%) |
| 2 Vehicles | 1,043 (26.0%) | 350 (9.6%) |
| 3 or more Vehicles | 747 (18.6%) | 26 (0.7%) |
| Total | 4,019 (100.0%) | 3,657 (100.0%) |
Real Estate & Mortgages in East St Louis
Real Estate and Mortgage Overview in East St Louis
| Characteristic | Without Mortgage | With Mortgage |
| Housing Units | 2,839 | 1,180 |
| Median Property Value | $55,300 | $54,200 |
| Median Household Income | $51,213 | $124 |
| Monthly Housing Costs | $451 | $0 |
| Real Estate Taxes | $1,165 | $241 |
Property Value by Mortgage Status in East St Louis
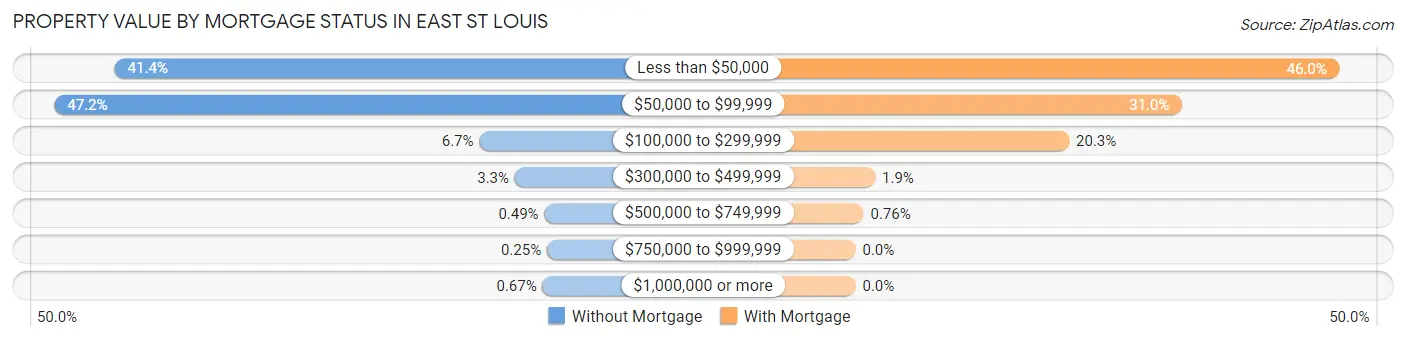
| Property Value | Without Mortgage | With Mortgage |
| Less than $50,000 | 1,176 (41.4%) | 543 (46.0%) |
| $50,000 to $99,999 | 1,339 (47.2%) | 366 (31.0%) |
| $100,000 to $299,999 | 190 (6.7%) | 240 (20.3%) |
| $300,000 to $499,999 | 94 (3.3%) | 22 (1.9%) |
| $500,000 to $749,999 | 14 (0.5%) | 9 (0.8%) |
| $750,000 to $999,999 | 7 (0.3%) | 0 (0.0%) |
| $1,000,000 or more | 19 (0.7%) | 0 (0.0%) |
| Total | 2,839 (100.0%) | 1,180 (100.0%) |
Household Income by Mortgage Status in East St Louis
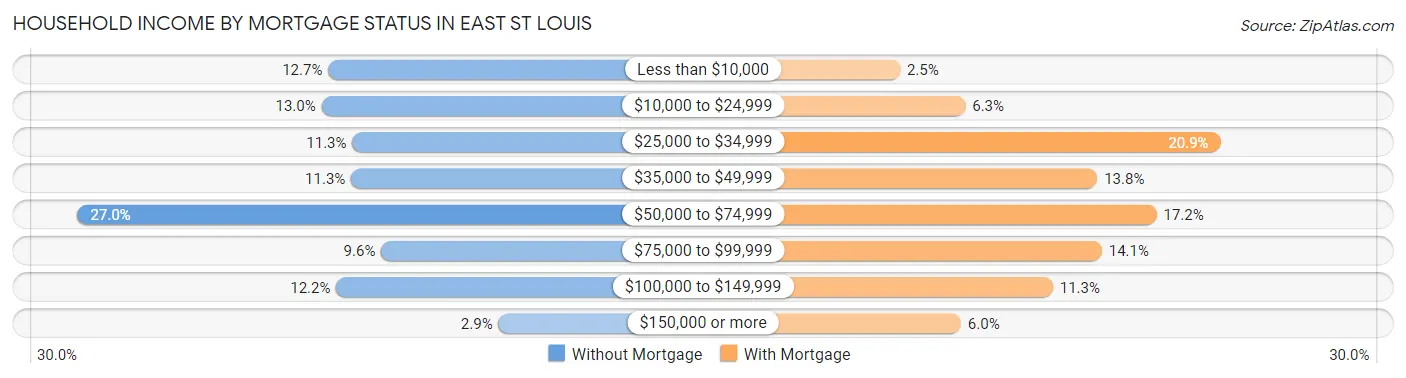
| Household Income | Without Mortgage | With Mortgage |
| Less than $10,000 | 359 (12.7%) | 30 (2.5%) |
| $10,000 to $24,999 | 370 (13.0%) | 74 (6.3%) |
| $25,000 to $34,999 | 320 (11.3%) | 246 (20.8%) |
| $35,000 to $49,999 | 322 (11.3%) | 163 (13.8%) |
| $50,000 to $74,999 | 766 (27.0%) | 203 (17.2%) |
| $75,000 to $99,999 | 273 (9.6%) | 166 (14.1%) |
| $100,000 to $149,999 | 346 (12.2%) | 133 (11.3%) |
| $150,000 or more | 83 (2.9%) | 71 (6.0%) |
| Total | 2,839 (100.0%) | 1,180 (100.0%) |
Property Value to Household Income Ratio in East St Louis
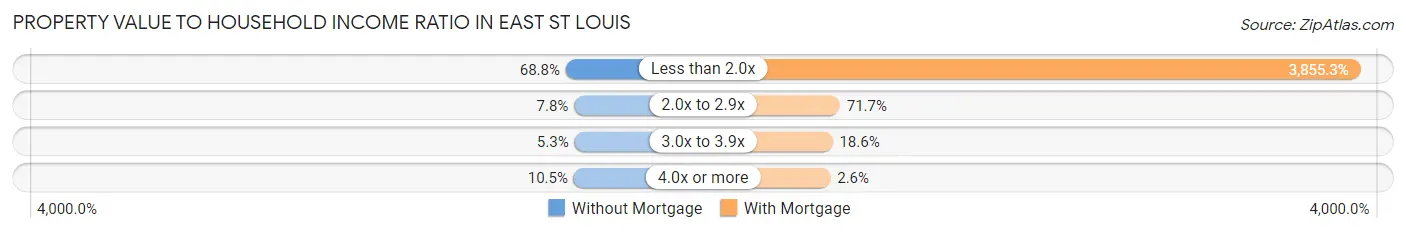
| Value-to-Income Ratio | Without Mortgage | With Mortgage |
| Less than 2.0x | 1,953 (68.8%) | 45,492 (3,855.3%) |
| 2.0x to 2.9x | 221 (7.8%) | 846 (71.7%) |
| 3.0x to 3.9x | 151 (5.3%) | 220 (18.6%) |
| 4.0x or more | 298 (10.5%) | 31 (2.6%) |
| Total | 2,839 (100.0%) | 1,180 (100.0%) |
Real Estate Taxes by Mortgage Status in East St Louis
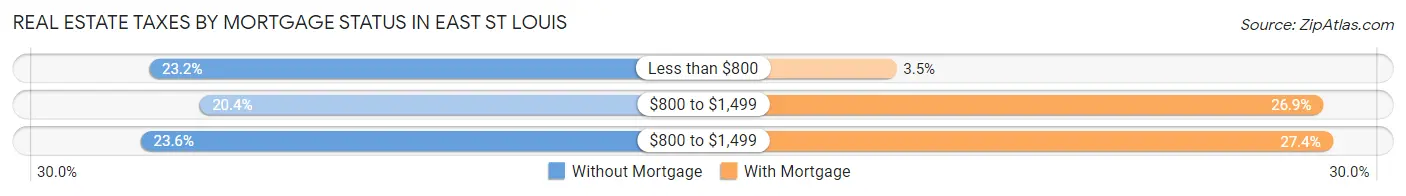
| Property Taxes | Without Mortgage | With Mortgage |
| Less than $800 | 658 (23.2%) | 41 (3.5%) |
| $800 to $1,499 | 580 (20.4%) | 317 (26.9%) |
| $800 to $1,499 | 671 (23.6%) | 323 (27.4%) |
| Total | 2,839 (100.0%) | 1,180 (100.0%) |
Health & Disability in East St Louis
Health Insurance Coverage by Age in East St Louis
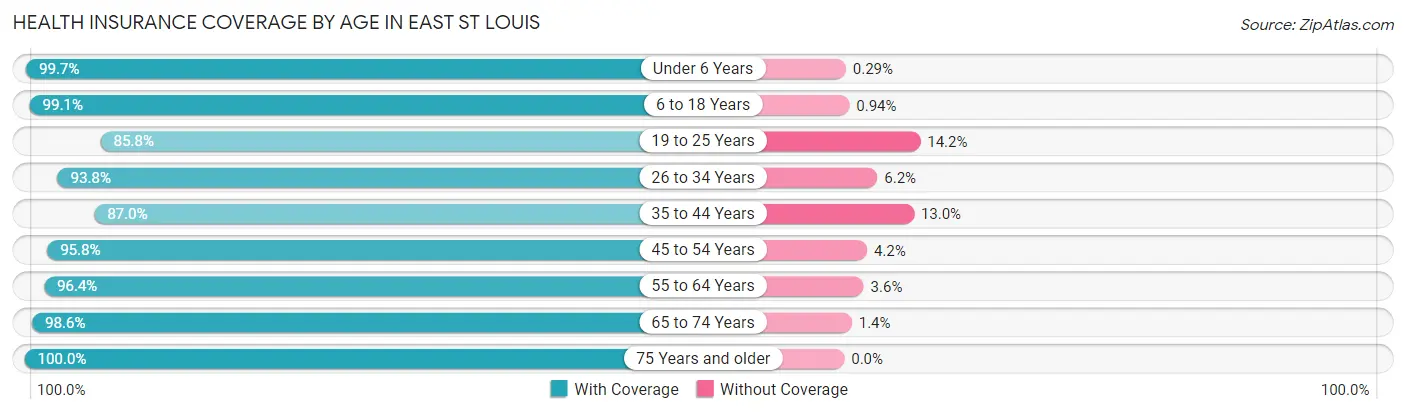
| Age Bracket | With Coverage | Without Coverage |
| Under 6 Years | 1,039 (99.7%) | 3 (0.3%) |
| 6 to 18 Years | 2,731 (99.1%) | 26 (0.9%) |
| 19 to 25 Years | 1,290 (85.8%) | 213 (14.2%) |
| 26 to 34 Years | 2,408 (93.8%) | 158 (6.2%) |
| 35 to 44 Years | 1,514 (87.0%) | 226 (13.0%) |
| 45 to 54 Years | 2,103 (95.8%) | 93 (4.2%) |
| 55 to 64 Years | 2,693 (96.4%) | 101 (3.6%) |
| 65 to 74 Years | 2,388 (98.6%) | 34 (1.4%) |
| 75 Years and older | 1,731 (100.0%) | 0 (0.0%) |
| Total | 17,897 (95.5%) | 854 (4.5%) |
Health Insurance Coverage by Citizenship Status in East St Louis
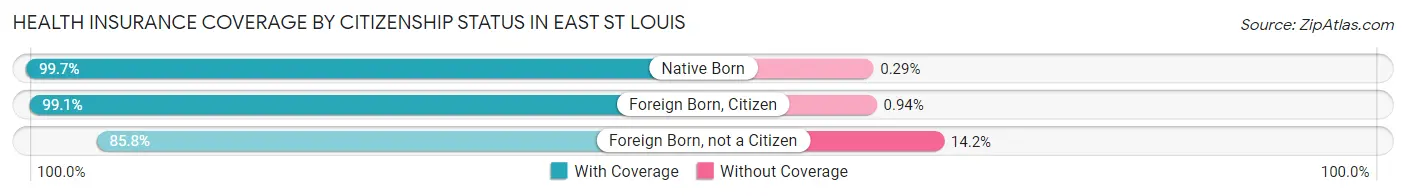
| Citizenship Status | With Coverage | Without Coverage |
| Native Born | 1,039 (99.7%) | 3 (0.3%) |
| Foreign Born, Citizen | 2,731 (99.1%) | 26 (0.9%) |
| Foreign Born, not a Citizen | 1,290 (85.8%) | 213 (14.2%) |
Health Insurance Coverage by Household Income in East St Louis
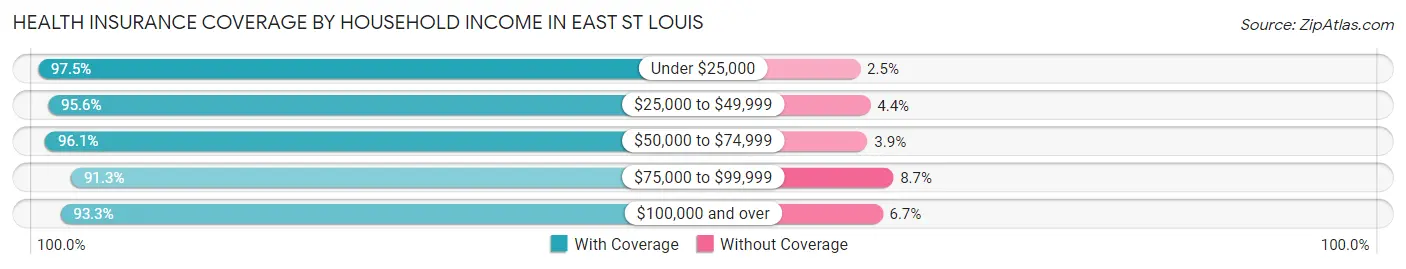
| Household Income | With Coverage | Without Coverage |
| Under $25,000 | 5,919 (97.5%) | 152 (2.5%) |
| $25,000 to $49,999 | 4,331 (95.6%) | 200 (4.4%) |
| $50,000 to $74,999 | 3,035 (96.1%) | 122 (3.9%) |
| $75,000 to $99,999 | 1,984 (91.3%) | 189 (8.7%) |
| $100,000 and over | 2,533 (93.3%) | 182 (6.7%) |
Public vs Private Health Insurance Coverage by Age in East St Louis
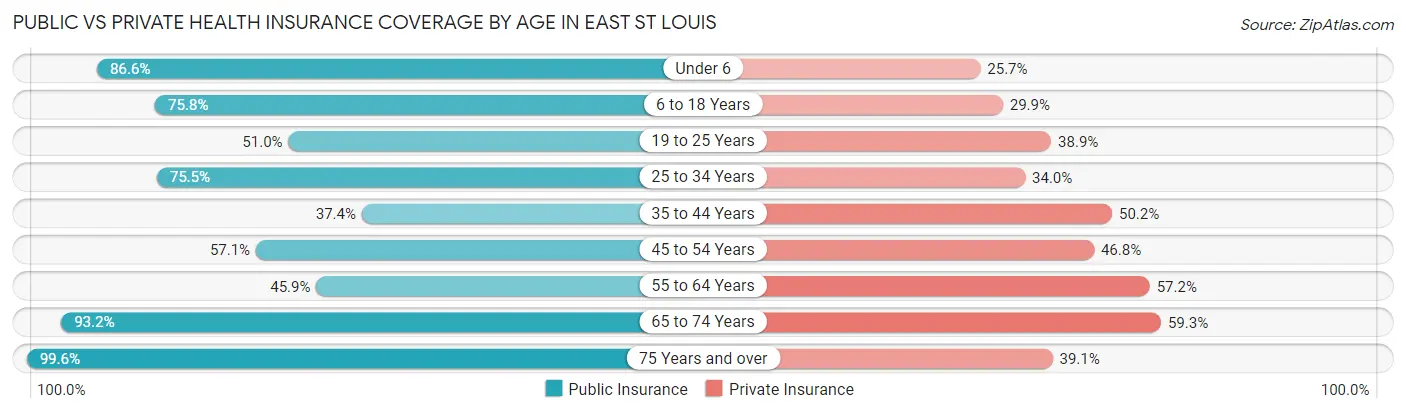
| Age Bracket | Public Insurance | Private Insurance |
| Under 6 | 902 (86.6%) | 268 (25.7%) |
| 6 to 18 Years | 2,089 (75.8%) | 824 (29.9%) |
| 19 to 25 Years | 767 (51.0%) | 584 (38.9%) |
| 25 to 34 Years | 1,936 (75.4%) | 873 (34.0%) |
| 35 to 44 Years | 651 (37.4%) | 873 (50.2%) |
| 45 to 54 Years | 1,253 (57.1%) | 1,028 (46.8%) |
| 55 to 64 Years | 1,281 (45.9%) | 1,597 (57.2%) |
| 65 to 74 Years | 2,257 (93.2%) | 1,435 (59.3%) |
| 75 Years and over | 1,724 (99.6%) | 677 (39.1%) |
| Total | 12,860 (68.6%) | 8,159 (43.5%) |
Disability Status by Sex by Age in East St Louis
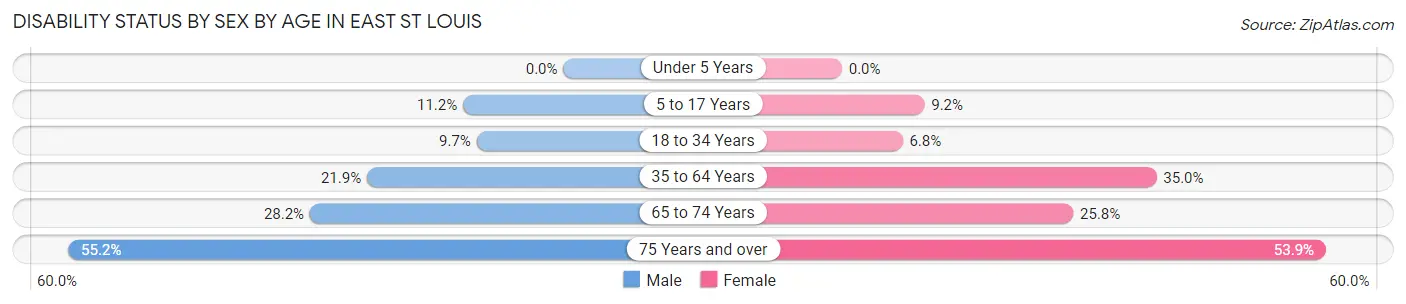
| Age Bracket | Male | Female |
| Under 5 Years | 0 (0.0%) | 0 (0.0%) |
| 5 to 17 Years | 146 (11.2%) | 96 (9.2%) |
| 18 to 34 Years | 200 (9.7%) | 166 (6.8%) |
| 35 to 64 Years | 563 (21.9%) | 1,456 (35.0%) |
| 65 to 74 Years | 254 (28.2%) | 392 (25.8%) |
| 75 Years and over | 348 (55.1%) | 593 (53.9%) |
Disability Class by Sex by Age in East St Louis
Disability Class: Hearing Difficulty
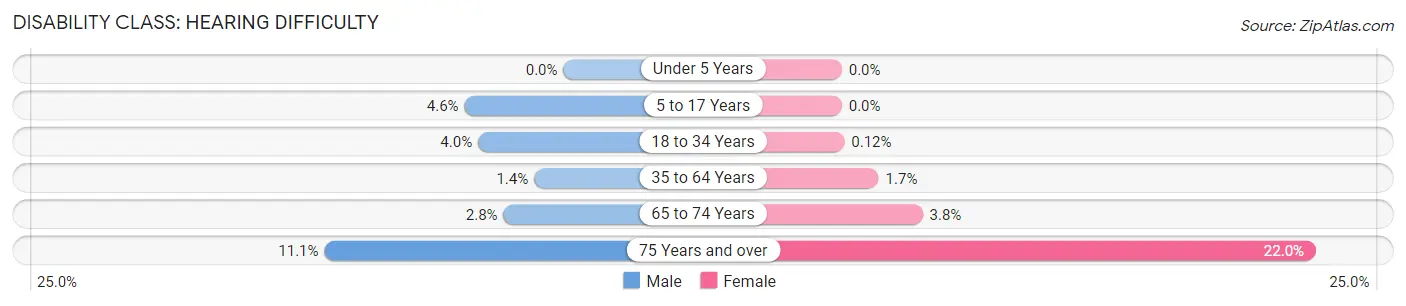
| Age Bracket | Male | Female |
| Under 5 Years | 0 (0.0%) | 0 (0.0%) |
| 5 to 17 Years | 60 (4.6%) | 0 (0.0%) |
| 18 to 34 Years | 82 (4.0%) | 3 (0.1%) |
| 35 to 64 Years | 35 (1.4%) | 71 (1.7%) |
| 65 to 74 Years | 25 (2.8%) | 57 (3.7%) |
| 75 Years and over | 70 (11.1%) | 242 (22.0%) |
Disability Class: Vision Difficulty
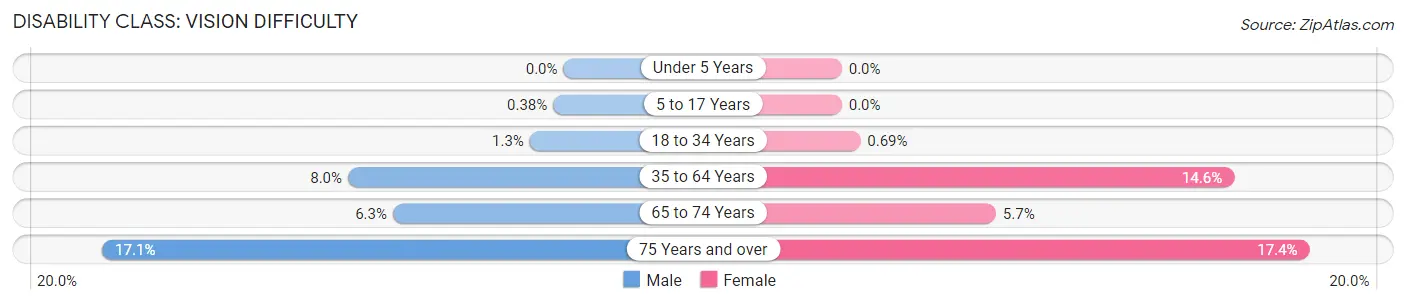
| Age Bracket | Male | Female |
| Under 5 Years | 0 (0.0%) | 0 (0.0%) |
| 5 to 17 Years | 5 (0.4%) | 0 (0.0%) |
| 18 to 34 Years | 26 (1.3%) | 17 (0.7%) |
| 35 to 64 Years | 206 (8.0%) | 605 (14.6%) |
| 65 to 74 Years | 57 (6.3%) | 87 (5.7%) |
| 75 Years and over | 108 (17.1%) | 191 (17.4%) |
Disability Class: Cognitive Difficulty
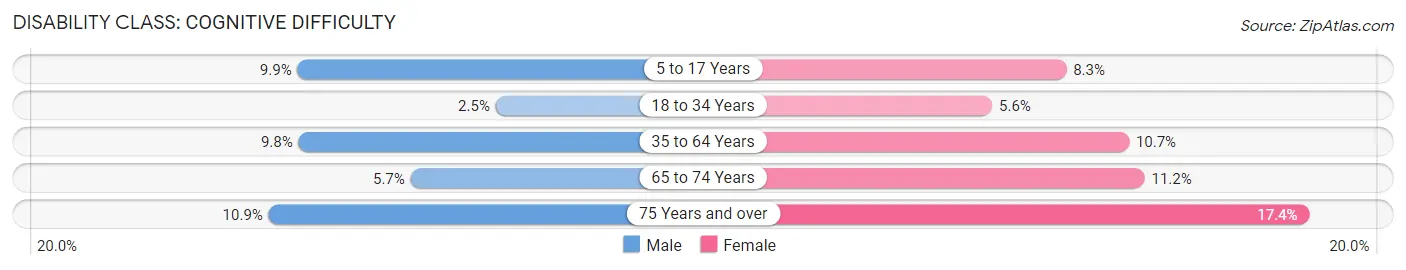
| Age Bracket | Male | Female |
| 5 to 17 Years | 129 (9.9%) | 87 (8.3%) |
| 18 to 34 Years | 52 (2.5%) | 137 (5.6%) |
| 35 to 64 Years | 253 (9.8%) | 443 (10.7%) |
| 65 to 74 Years | 51 (5.7%) | 171 (11.2%) |
| 75 Years and over | 69 (10.9%) | 191 (17.4%) |
Disability Class: Ambulatory Difficulty
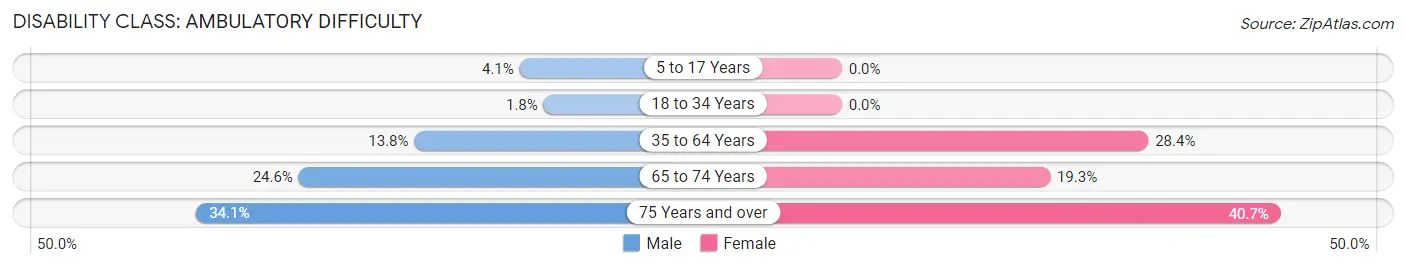
| Age Bracket | Male | Female |
| 5 to 17 Years | 53 (4.1%) | 0 (0.0%) |
| 18 to 34 Years | 38 (1.8%) | 0 (0.0%) |
| 35 to 64 Years | 356 (13.8%) | 1,182 (28.4%) |
| 65 to 74 Years | 221 (24.6%) | 294 (19.3%) |
| 75 Years and over | 215 (34.1%) | 448 (40.7%) |
Disability Class: Self-Care Difficulty
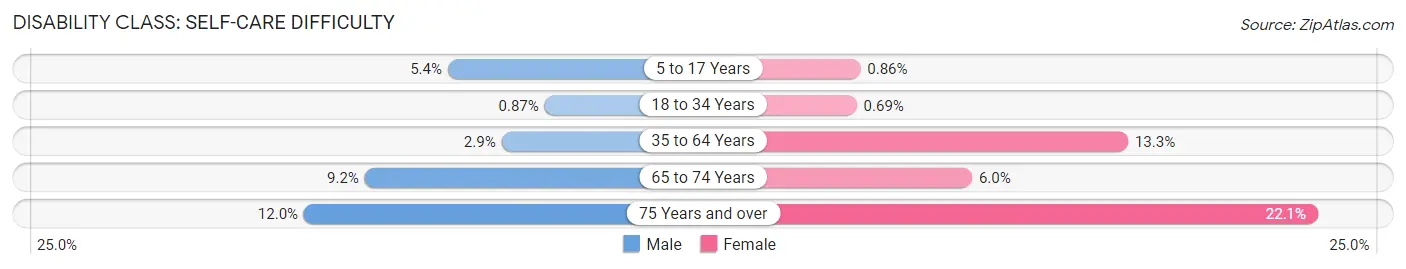
| Age Bracket | Male | Female |
| 5 to 17 Years | 70 (5.4%) | 9 (0.9%) |
| 18 to 34 Years | 18 (0.9%) | 17 (0.7%) |
| 35 to 64 Years | 74 (2.9%) | 552 (13.3%) |
| 65 to 74 Years | 83 (9.2%) | 92 (6.0%) |
| 75 Years and over | 76 (12.0%) | 243 (22.1%) |
Technology Access in East St Louis
Computing Device Access in East St Louis
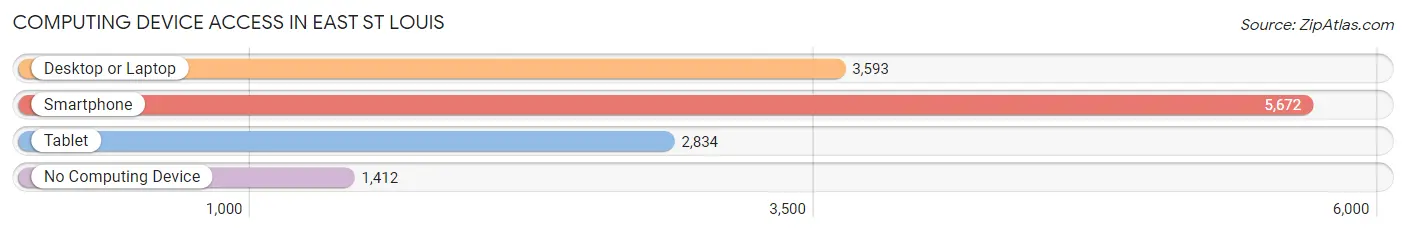
| Device Type | # Households | % Households |
| Desktop or Laptop | 3,593 | 46.8% |
| Smartphone | 5,672 | 73.9% |
| Tablet | 2,834 | 36.9% |
| No Computing Device | 1,412 | 18.4% |
| Total | 7,676 | 100.0% |
Internet Access in East St Louis
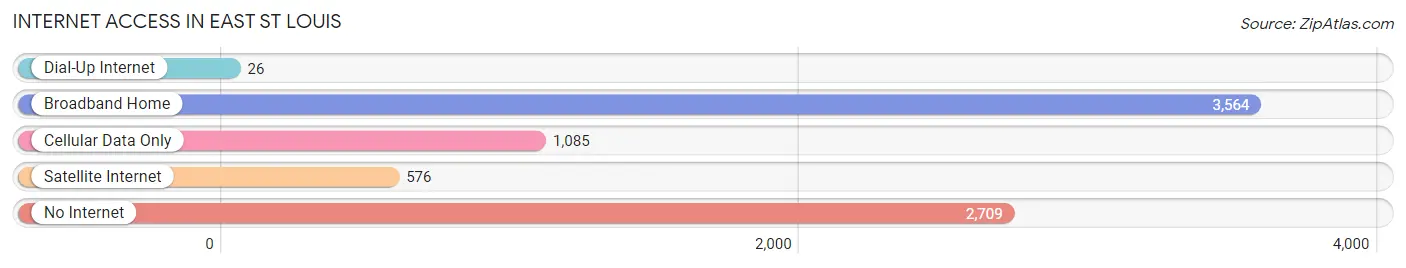
| Internet Type | # Households | % Households |
| Dial-Up Internet | 26 | 0.3% |
| Broadband Home | 3,564 | 46.4% |
| Cellular Data Only | 1,085 | 14.1% |
| Satellite Internet | 576 | 7.5% |
| No Internet | 2,709 | 35.3% |
| Total | 7,676 | 100.0% |
East St Louis Summary
East St. Louis is a city located in St. Clair County, Illinois, United States, across the Mississippi River from St. Louis, Missouri, in the Metro-East region of Southern Illinois. As of the 2010 census, the city had a total population of 27,006, making it the third-largest city in the state of Illinois.
History
East St. Louis was founded in 1797 by Captain James Piggott, a Revolutionary War veteran. The city was originally named Illinoistown, but was later changed to East St. Louis in 1819. The city was incorporated in 1865 and became a major industrial center in the late 19th and early 20th centuries.
East St. Louis was the site of the 1917 East St. Louis Race Riot, one of the worst race riots in American history. The riot began on July 2, 1917, when a white mob attacked African-American residents of the city. The violence lasted for three days and resulted in the deaths of at least 40 people, mostly African-American.
Geography
East St. Louis is located at 38°37′N 90°10′W (38.619, -90.167). According to the 2010 census, the city has a total area of 8.3 square miles (21.5 km2), of which 8.2 square miles (21.3 km2) is land and 0.1 square miles (0.2 km2) is water.
East St. Louis is located on the Mississippi River, directly across from St. Louis, Missouri. The city is bordered by the cities of Centreville, Washington Park, and Alorton to the north, and by the cities of Cahokia and Sauget to the south.
Economy
East St. Louis is a major industrial center. The city is home to several large companies, including Monsanto, Anheuser-Busch, and Emerson Electric. The city is also home to several smaller businesses, including a number of auto repair shops, restaurants, and retail stores.
East St. Louis is also home to several casinos, including the Casino Queen, the Argosy Casino, and the Hollywood Casino. The casinos are a major source of employment and revenue for the city.
Demographics
As of the 2010 census, there were 27,006 people, 10,845 households, and 6,717 families residing in the city. The population density was 3,269.3 people per square mile (1,261.2/km2). There were 12,845 housing units at an average density of 1,564.2 per square mile (604.3/km2). The racial makeup of the city was 57.2% African American, 37.3% White, 0.4% Native American, 0.7% Asian, 0.1% Pacific Islander, 1.7% from other races, and 2.6% from two or more races. Hispanic or Latino of any race were 4.2% of the population.
The median income for a household in the city was $25,945, and the median income for a family was $31,945. Males had a median income of $30,945 versus $22,945 for females. The per capita income for the city was $14,945. About 24.2% of families and 28.2% of the population were below the poverty line, including 41.2% of those under age 18 and 20.2% of those age 65 or over.
Common Questions
What is Per Capita Income in East St Louis?
Per Capita income in East St Louis is $20,877.
What is the Median Family Income in East St Louis?
Median Family Income in East St Louis is $44,215.
What is the Median Household income in East St Louis?
Median Household Income in East St Louis is $28,519.
What is Income or Wage Gap in East St Louis?
Income or Wage Gap in East St Louis is 8.9%.
Women in East St Louis earn 91.1 cents for every dollar earned by a man.
What is Family Income Deficit in East St Louis?
Family Income Deficit in East St Louis is $13,212.
Families that are below poverty line in East St Louis earn $13,212 less on average than the poverty threshold level.
What is Inequality or Gini Index in East St Louis?
Inequality or Gini Index in East St Louis is 0.52.
What is the Total Population of East St Louis?
Total Population of East St Louis is 18,796.
What is the Total Male Population of East St Louis?
Total Male Population of East St Louis is 8,179.
What is the Total Female Population of East St Louis?
Total Female Population of East St Louis is 10,617.
What is the Ratio of Males per 100 Females in East St Louis?
There are 77.04 Males per 100 Females in East St Louis.
What is the Ratio of Females per 100 Males in East St Louis?
There are 129.81 Females per 100 Males in East St Louis.
What is the Median Population Age in East St Louis?
Median Population Age in East St Louis is 43.3 Years.
What is the Average Family Size in East St Louis
Average Family Size in East St Louis is 3.8 People.
What is the Average Household Size in East St Louis
Average Household Size in East St Louis is 2.4 People.
How Large is the Labor Force in East St Louis?
There are 8,169 People in the Labor Forcein in East St Louis.
What is the Percentage of People in the Labor Force in East St Louis?
51.8% of People are in the Labor Force in East St Louis.
What is the Unemployment Rate in East St Louis?
Unemployment Rate in East St Louis is 13.1%.