Zip Codes with the Highest Percentage of Households Without a Vehicle in Philadelphia, PA
RELATED REPORTS & OPTIONS
Households without a Cars
Philadelphia
Compare Zip Codes
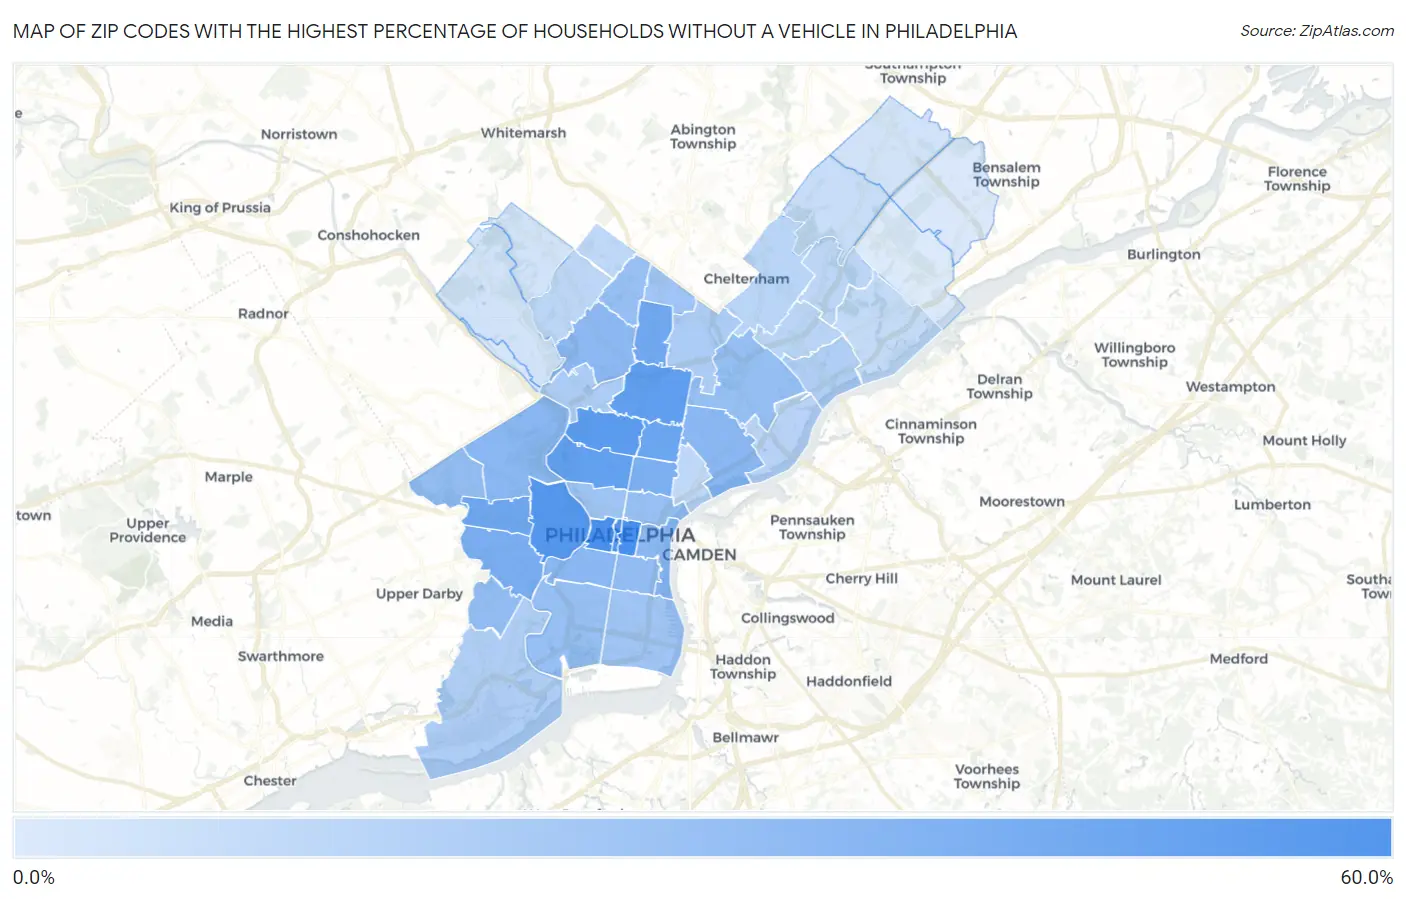
Map of Zip Codes with the Highest Percentage of Households Without a Vehicle in Philadelphia
6.6%
56.7%
Zip Codes with the Highest Percentage of Households Without a Vehicle in Philadelphia, PA
| Zip Code | Housholds Without a Car | vs State | vs National | |
| 1. | 19107 | 56.7% | 10.6%(+46.1)#11 | 8.3%(+48.4)#294 |
| 2. | 19103 | 55.9% | 10.6%(+45.3)#13 | 8.3%(+47.6)#302 |
| 3. | 19102 | 52.8% | 10.6%(+42.2)#14 | 8.3%(+44.5)#323 |
| 4. | 19104 | 51.2% | 10.6%(+40.6)#15 | 8.3%(+42.9)#335 |
| 5. | 19132 | 48.8% | 10.6%(+38.2)#17 | 8.3%(+40.5)#358 |
| 6. | 19140 | 46.6% | 10.6%(+36.0)#22 | 8.3%(+38.3)#384 |
| 7. | 19121 | 45.7% | 10.6%(+35.1)#23 | 8.3%(+37.4)#394 |
| 8. | 19133 | 42.6% | 10.6%(+32.0)#28 | 8.3%(+34.3)#464 |
| 9. | 19139 | 41.9% | 10.6%(+31.3)#30 | 8.3%(+33.6)#476 |
| 10. | 19141 | 40.8% | 10.6%(+30.2)#32 | 8.3%(+32.5)#497 |
| 11. | 19108 | 39.7% | 10.6%(+29.1)#33 | 8.3%(+31.4)#519 |
| 12. | 19143 | 37.8% | 10.6%(+27.2)#37 | 8.3%(+29.5)#564 |
| 13. | 19122 | 36.6% | 10.6%(+26.0)#43 | 8.3%(+28.3)#602 |
| 14. | 19134 | 32.3% | 10.6%(+21.7)#48 | 8.3%(+24.0)#717 |
| 15. | 19146 | 32.2% | 10.6%(+21.6)#50 | 8.3%(+23.9)#721 |
| 16. | 19131 | 31.7% | 10.6%(+21.1)#51 | 8.3%(+23.4)#734 |
| 17. | 19106 | 31.3% | 10.6%(+20.7)#54 | 8.3%(+23.0)#753 |
| 18. | 19144 | 31.1% | 10.6%(+20.5)#56 | 8.3%(+22.8)#761 |
| 19. | 19151 | 28.9% | 10.6%(+18.3)#60 | 8.3%(+20.6)#849 |
| 20. | 19147 | 28.7% | 10.6%(+18.1)#61 | 8.3%(+20.4)#858 |
| 21. | 19142 | 28.5% | 10.6%(+17.9)#64 | 8.3%(+20.2)#871 |
| 22. | 19124 | 28.4% | 10.6%(+17.8)#66 | 8.3%(+20.1)#875 |
| 23. | 19145 | 27.7% | 10.6%(+17.1)#71 | 8.3%(+19.4)#902 |
| 24. | 19123 | 27.4% | 10.6%(+16.8)#73 | 8.3%(+19.1)#918 |
| 25. | 19138 | 27.3% | 10.6%(+16.7)#74 | 8.3%(+19.0)#920 |
| 26. | 19130 | 25.4% | 10.6%(+14.8)#86 | 8.3%(+17.1)#1,043 |
| 27. | 19148 | 24.4% | 10.6%(+13.8)#95 | 8.3%(+16.1)#1,102 |
| 28. | 19126 | 24.4% | 10.6%(+13.8)#96 | 8.3%(+16.1)#1,104 |
| 29. | 19129 | 21.0% | 10.6%(+10.4)#120 | 8.3%(+12.7)#1,395 |
| 30. | 19120 | 20.6% | 10.6%(+10.0)#126 | 8.3%(+12.3)#1,426 |
| 31. | 19153 | 19.8% | 10.6%(+9.20)#136 | 8.3%(+11.5)#1,526 |
| 32. | 19135 | 19.5% | 10.6%(+8.90)#138 | 8.3%(+11.2)#1,565 |
| 33. | 19137 | 17.4% | 10.6%(+6.80)#159 | 8.3%(+9.10)#1,877 |
| 34. | 19149 | 16.4% | 10.6%(+5.80)#172 | 8.3%(+8.10)#2,073 |
| 35. | 19111 | 16.3% | 10.6%(+5.70)#176 | 8.3%(+8.00)#2,087 |
| 36. | 19152 | 16.0% | 10.6%(+5.40)#182 | 8.3%(+7.70)#2,144 |
| 37. | 19119 | 15.9% | 10.6%(+5.30)#185 | 8.3%(+7.60)#2,174 |
| 38. | 19150 | 15.3% | 10.6%(+4.70)#198 | 8.3%(+7.00)#2,299 |
| 39. | 19125 | 15.2% | 10.6%(+4.60)#202 | 8.3%(+6.90)#2,327 |
| 40. | 19136 | 13.6% | 10.6%(+3.00)#235 | 8.3%(+5.30)#2,842 |
| 41. | 19115 | 12.3% | 10.6%(+1.70)#274 | 8.3%(+4.00)#3,409 |
| 42. | 19116 | 10.0% | 10.6%(-0.600)#382 | 8.3%(+1.70)#4,850 |
| 43. | 19128 | 9.6% | 10.6%(-1.000)#400 | 8.3%(+1.30)#5,183 |
| 44. | 19118 | 9.6% | 10.6%(-1.000)#403 | 8.3%(+1.30)#5,211 |
| 45. | 19127 | 7.8% | 10.6%(-2.80)#534 | 8.3%(-0.500)#7,277 |
| 46. | 19154 | 7.3% | 10.6%(-3.30)#585 | 8.3%(-1.00)#8,025 |
| 47. | 19114 | 6.6% | 10.6%(-4.00)#659 | 8.3%(-1.70)#9,192 |
1
Common Questions
What are the Top 10 Zip Codes with the Highest Percentage of Households Without a Vehicle in Philadelphia, PA?
Top 10 Zip Codes with the Highest Percentage of Households Without a Vehicle in Philadelphia, PA are:
What zip code has the Highest Percentage of Households Without a Vehicle in Philadelphia, PA?
19107 has the Highest Percentage of Households Without a Vehicle in Philadelphia, PA with 56.7%.
What is the Percentage of Households Without a Vehicle in Philadelphia, PA?
Percentage of Households Without a Vehicle in Philadelphia is 28.2%.
What is the Percentage of Households Without a Vehicle in Pennsylvania?
Percentage of Households Without a Vehicle in Pennsylvania is 10.6%.
What is the Percentage of Households Without a Vehicle in the United States?
Percentage of Households Without a Vehicle in the United States is 8.3%.