Minersville borough, PA Map & Demographics
Minersville borough Overview
$23,410
PER CAPITA INCOME
$46,042
AVG FAMILY INCOME
$49,555
AVG HOUSEHOLD INCOME
8.5%
WAGE / INCOME GAP [ % ]
91.5¢/ $1
WAGE / INCOME GAP [ $ ]
0.40
INEQUALITY / GINI INDEX
4,377
TOTAL POPULATION
2,134
MALE POPULATION
2,243
FEMALE POPULATION
95.14
MALES / 100 FEMALES
105.11
FEMALES / 100 MALES
43.7
MEDIAN AGE
2.9
AVG FAMILY SIZE
2.5
AVG HOUSEHOLD SIZE
2,167
LABOR FORCE [ PEOPLE ]
58.4%
PERCENT IN LABOR FORCE
2.7%
UNEMPLOYMENT RATE
Income in Minersville borough
Income Overview in Minersville borough
Per Capita Income in Minersville borough is $23,410, while median incomes of families and households are $46,042 and $49,555 respectively.
| Characteristic | Number | Measure |
| Per Capita Income | 4,377 | $23,410 |
| Median Family Income | 1,124 | $46,042 |
| Mean Family Income | 1,124 | $56,764 |
| Median Household Income | 1,784 | $49,555 |
| Mean Household Income | 1,784 | $55,631 |
| Income Deficit | 1,124 | $0 |
| Wage / Income Gap (%) | 4,377 | 8.47% |
| Wage / Income Gap ($) | 4,377 | 91.53¢ per $1 |
| Gini / Inequality Index | 4,377 | 0.40 |
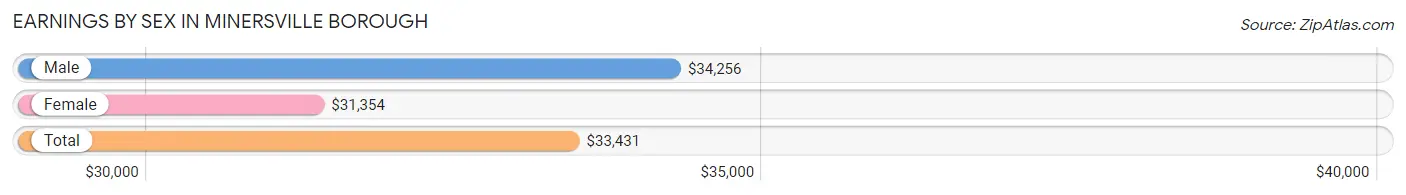
Earnings by Sex in Minersville borough
Average Earnings in Minersville borough are $33,431, $34,256 for men and $31,354 for women, a difference of 8.5%.
| Sex | Number | Average Earnings |
| Male | 1,197 (53.0%) | $34,256 |
| Female | 1,062 (47.0%) | $31,354 |
| Total | 2,259 (100.0%) | $33,431 |
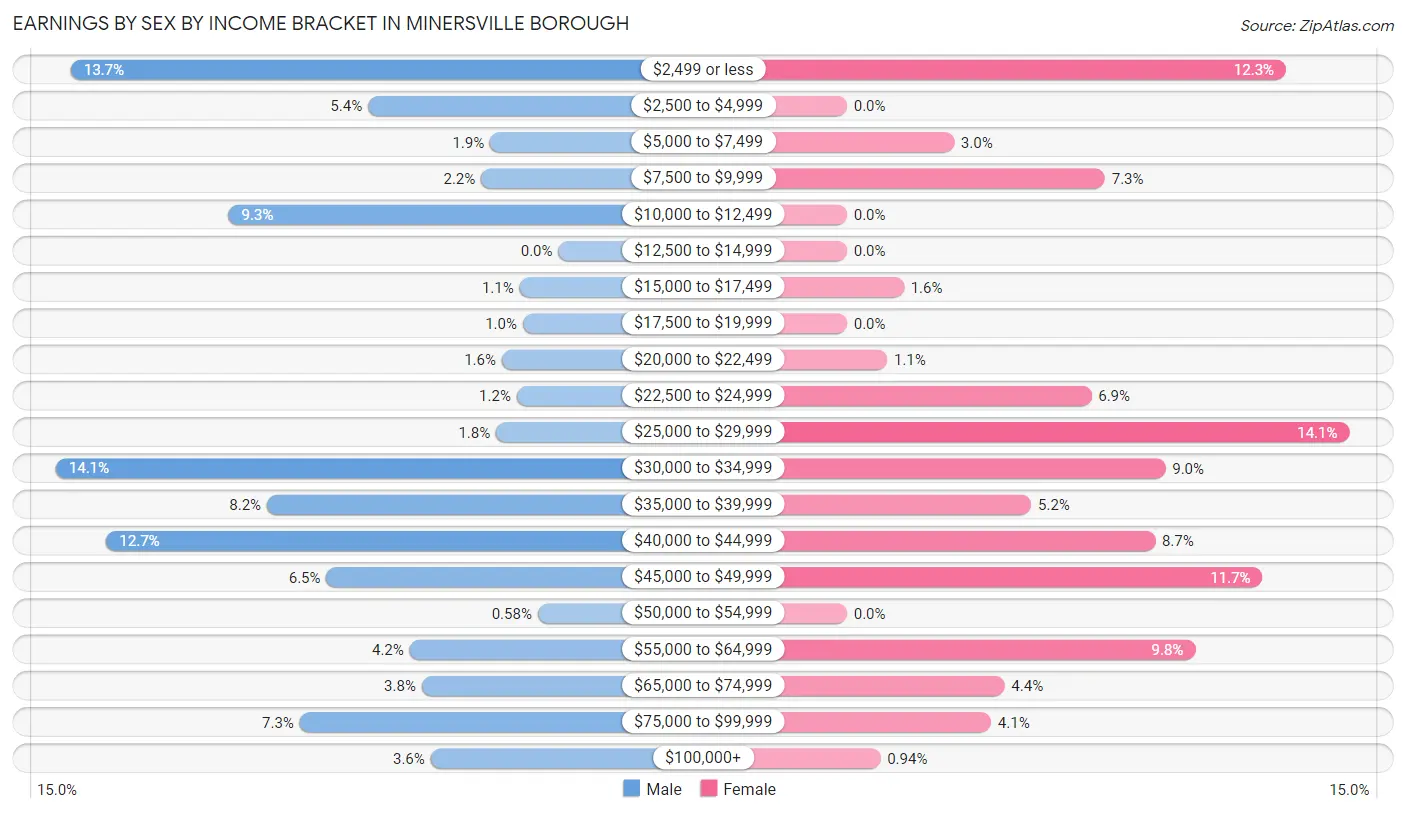
Earnings by Sex by Income Bracket in Minersville borough
The most common earnings brackets in Minersville borough are $30,000 to $34,999 for men (169 | 14.1%) and $25,000 to $29,999 for women (150 | 14.1%).
| Income | Male | Female |
| $2,499 or less | 164 (13.7%) | 131 (12.3%) |
| $2,500 to $4,999 | 64 (5.3%) | 0 (0.0%) |
| $5,000 to $7,499 | 23 (1.9%) | 32 (3.0%) |
| $7,500 to $9,999 | 26 (2.2%) | 77 (7.2%) |
| $10,000 to $12,499 | 111 (9.3%) | 0 (0.0%) |
| $12,500 to $14,999 | 0 (0.0%) | 0 (0.0%) |
| $15,000 to $17,499 | 13 (1.1%) | 17 (1.6%) |
| $17,500 to $19,999 | 12 (1.0%) | 0 (0.0%) |
| $20,000 to $22,499 | 19 (1.6%) | 12 (1.1%) |
| $22,500 to $24,999 | 14 (1.2%) | 73 (6.9%) |
| $25,000 to $29,999 | 21 (1.8%) | 150 (14.1%) |
| $30,000 to $34,999 | 169 (14.1%) | 95 (8.9%) |
| $35,000 to $39,999 | 98 (8.2%) | 55 (5.2%) |
| $40,000 to $44,999 | 152 (12.7%) | 92 (8.7%) |
| $45,000 to $49,999 | 78 (6.5%) | 124 (11.7%) |
| $50,000 to $54,999 | 7 (0.6%) | 0 (0.0%) |
| $55,000 to $64,999 | 50 (4.2%) | 104 (9.8%) |
| $65,000 to $74,999 | 46 (3.8%) | 47 (4.4%) |
| $75,000 to $99,999 | 87 (7.3%) | 43 (4.1%) |
| $100,000+ | 43 (3.6%) | 10 (0.9%) |
| Total | 1,197 (100.0%) | 1,062 (100.0%) |
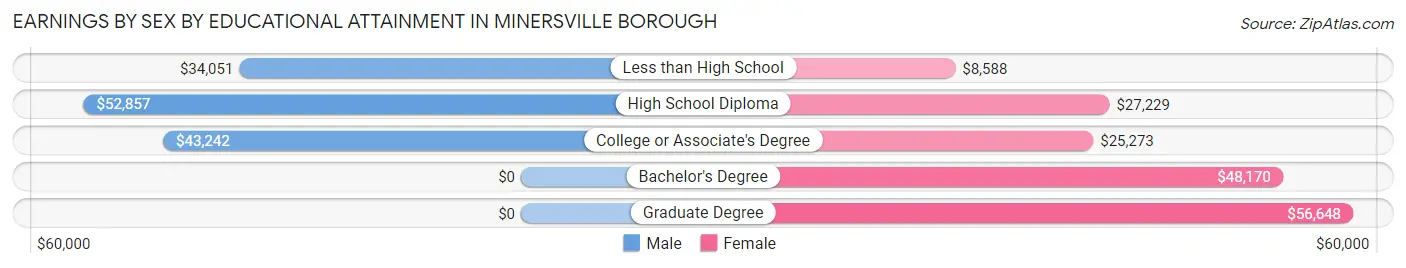
Earnings by Sex by Educational Attainment in Minersville borough
Average earnings in Minersville borough are $43,388 for men and $31,146 for women, a difference of 28.2%. Men with an educational attainment of high school diploma enjoy the highest average annual earnings of $52,857, while those with less than high school education earn the least with $34,051. Women with an educational attainment of graduate degree earn the most with the average annual earnings of $56,648, while those with less than high school education have the smallest earnings of $8,588.
| Educational Attainment | Male Income | Female Income |
| Less than High School | $34,051 | $8,588 |
| High School Diploma | $52,857 | $27,229 |
| College or Associate's Degree | $43,242 | $25,273 |
| Bachelor's Degree | - | - |
| Graduate Degree | - | - |
| Total | $43,388 | $31,146 |
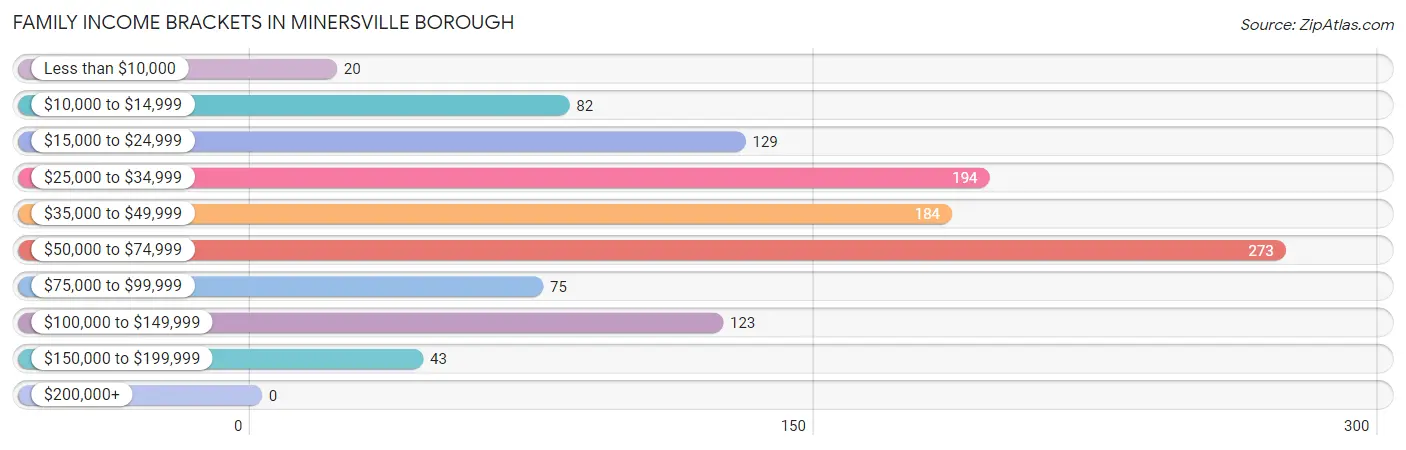
Family Income in Minersville borough
Family Income Brackets in Minersville borough
According to the Minersville borough family income data, there are 273 families falling into the $50,000 to $74,999 income range, which is the most common income bracket and makes up 24.3% of all families.
| Income Bracket | # Families | % Families |
| Less than $10,000 | 20 | 1.8% |
| $10,000 to $14,999 | 82 | 7.3% |
| $15,000 to $24,999 | 129 | 11.5% |
| $25,000 to $34,999 | 194 | 17.3% |
| $35,000 to $49,999 | 184 | 16.4% |
| $50,000 to $74,999 | 273 | 24.3% |
| $75,000 to $99,999 | 75 | 6.7% |
| $100,000 to $149,999 | 123 | 10.9% |
| $150,000 to $199,999 | 43 | 3.8% |
| $200,000+ | 0 | 0.0% |
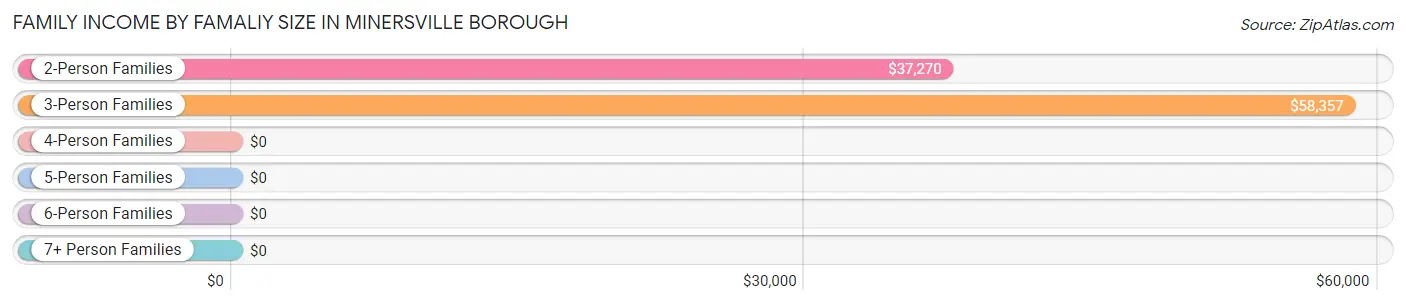
Family Income by Famaliy Size in Minersville borough
3-person families (360 | 32.0%) account for the highest median family income in Minersville borough with $58,357 per family, while 3-person families (360 | 32.0%) have the highest median income of $19,452 per family member.
| Income Bracket | # Families | Median Income |
| 2-Person Families | 596 (53.0%) | $37,270 |
| 3-Person Families | 360 (32.0%) | $58,357 |
| 4-Person Families | 123 (10.9%) | $0 |
| 5-Person Families | 45 (4.0%) | $0 |
| 6-Person Families | 0 (0.0%) | $0 |
| 7+ Person Families | 0 (0.0%) | $0 |
| Total | 1,124 (100.0%) | $46,042 |
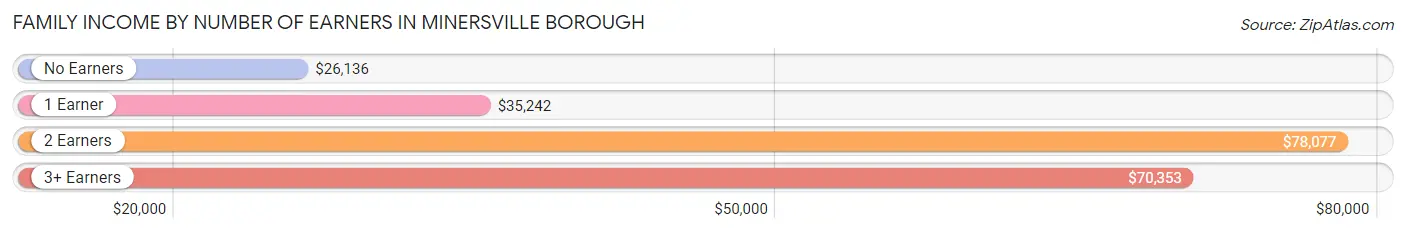
Family Income by Number of Earners in Minersville borough
The median family income in Minersville borough is $46,042, with families comprising 2 earners (294) having the highest median family income of $78,077, while families with no earners (248) have the lowest median family income of $26,136, accounting for 26.2% and 22.1% of families, respectively.
| Number of Earners | # Families | Median Income |
| No Earners | 248 (22.1%) | $26,136 |
| 1 Earner | 429 (38.2%) | $35,242 |
| 2 Earners | 294 (26.2%) | $78,077 |
| 3+ Earners | 153 (13.6%) | $70,353 |
| Total | 1,124 (100.0%) | $46,042 |
Household Income in Minersville borough
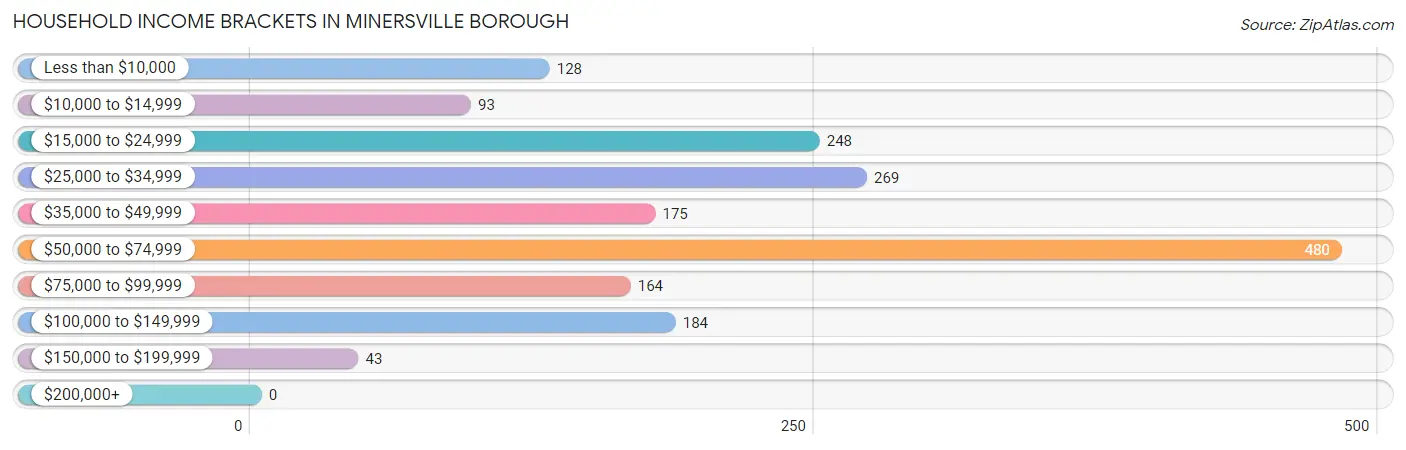
Household Income Brackets in Minersville borough
With 480 households falling in the category, the $50,000 to $74,999 income range is the most frequent in Minersville borough, accounting for 26.9% of all households.
| Income Bracket | # Households | % Households |
| Less than $10,000 | 128 | 7.2% |
| $10,000 to $14,999 | 93 | 5.2% |
| $15,000 to $24,999 | 248 | 13.9% |
| $25,000 to $34,999 | 269 | 15.1% |
| $35,000 to $49,999 | 175 | 9.8% |
| $50,000 to $74,999 | 480 | 26.9% |
| $75,000 to $99,999 | 164 | 9.2% |
| $100,000 to $149,999 | 184 | 10.3% |
| $150,000 to $199,999 | 43 | 2.4% |
| $200,000+ | 0 | 0.0% |
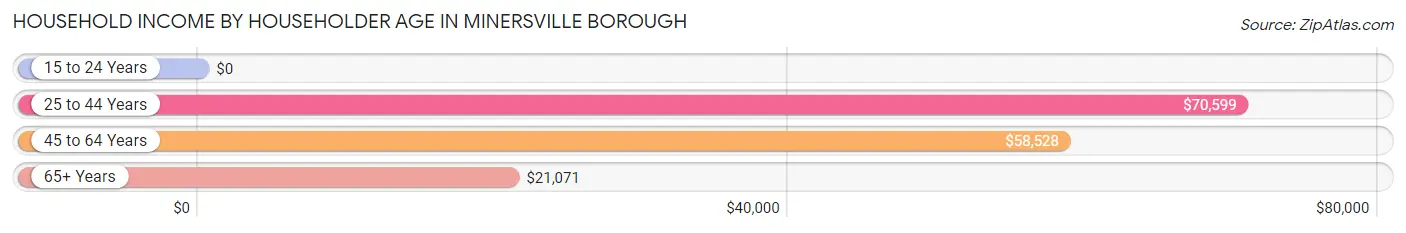
Household Income by Householder Age in Minersville borough
The median household income in Minersville borough is $49,555, with the highest median household income of $70,599 found in the 25 to 44 years age bracket for the primary householder. A total of 377 households (21.1%) fall into this category. Meanwhile, the 15 to 24 years age bracket for the primary householder has the lowest median household income of $0, with 42 households (2.4%) in this group.
| Income Bracket | # Households | Median Income |
| 15 to 24 Years | 42 (2.4%) | $0 |
| 25 to 44 Years | 377 (21.1%) | $70,599 |
| 45 to 64 Years | 901 (50.5%) | $58,528 |
| 65+ Years | 464 (26.0%) | $21,071 |
| Total | 1,784 (100.0%) | $49,555 |
Poverty in Minersville borough
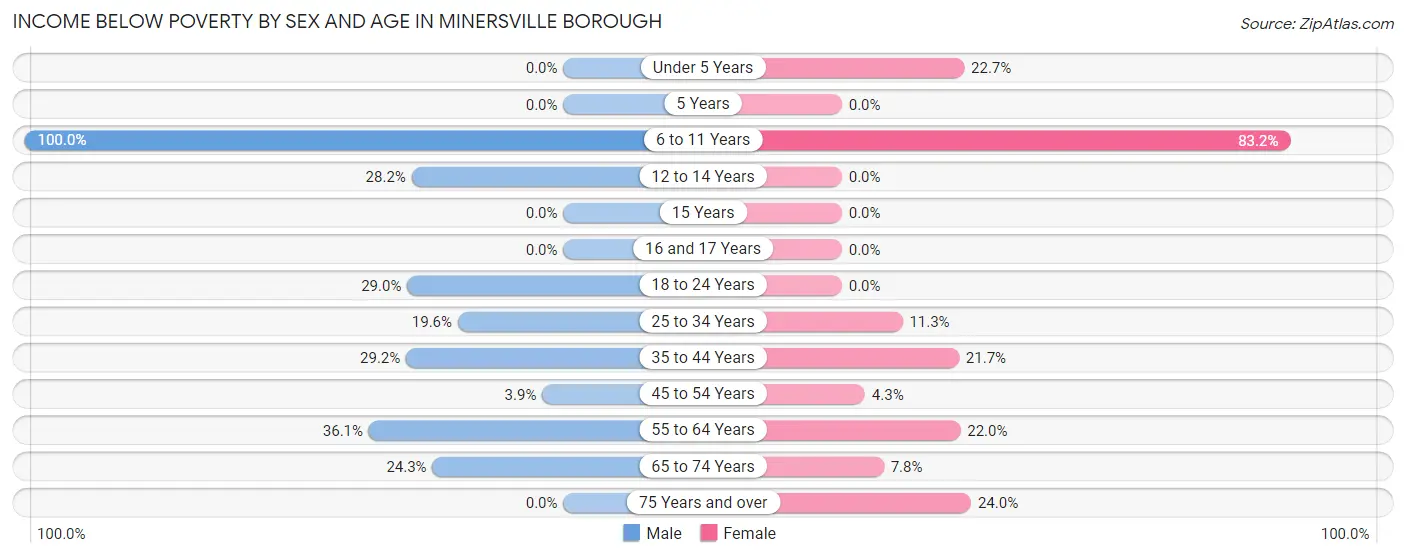
Income Below Poverty by Sex and Age in Minersville borough
With 25.2% poverty level for males and 18.0% for females among the residents of Minersville borough, 6 to 11 year old males and 6 to 11 year old females are the most vulnerable to poverty, with 77 males (100.0%) and 129 females (83.2%) in their respective age groups living below the poverty level.
| Age Bracket | Male | Female |
| Under 5 Years | 0 (0.0%) | 37 (22.7%) |
| 5 Years | 0 (0.0%) | 0 (0.0%) |
| 6 to 11 Years | 77 (100.0%) | 129 (83.2%) |
| 12 to 14 Years | 29 (28.2%) | 0 (0.0%) |
| 15 Years | 0 (0.0%) | 0 (0.0%) |
| 16 and 17 Years | 0 (0.0%) | 0 (0.0%) |
| 18 to 24 Years | 122 (29.0%) | 0 (0.0%) |
| 25 to 34 Years | 28 (19.6%) | 33 (11.3%) |
| 35 to 44 Years | 96 (29.2%) | 30 (21.7%) |
| 45 to 54 Years | 12 (3.9%) | 18 (4.3%) |
| 55 to 64 Years | 148 (36.1%) | 95 (22.0%) |
| 65 to 74 Years | 26 (24.3%) | 14 (7.8%) |
| 75 Years and over | 0 (0.0%) | 47 (24.0%) |
| Total | 538 (25.2%) | 403 (18.0%) |
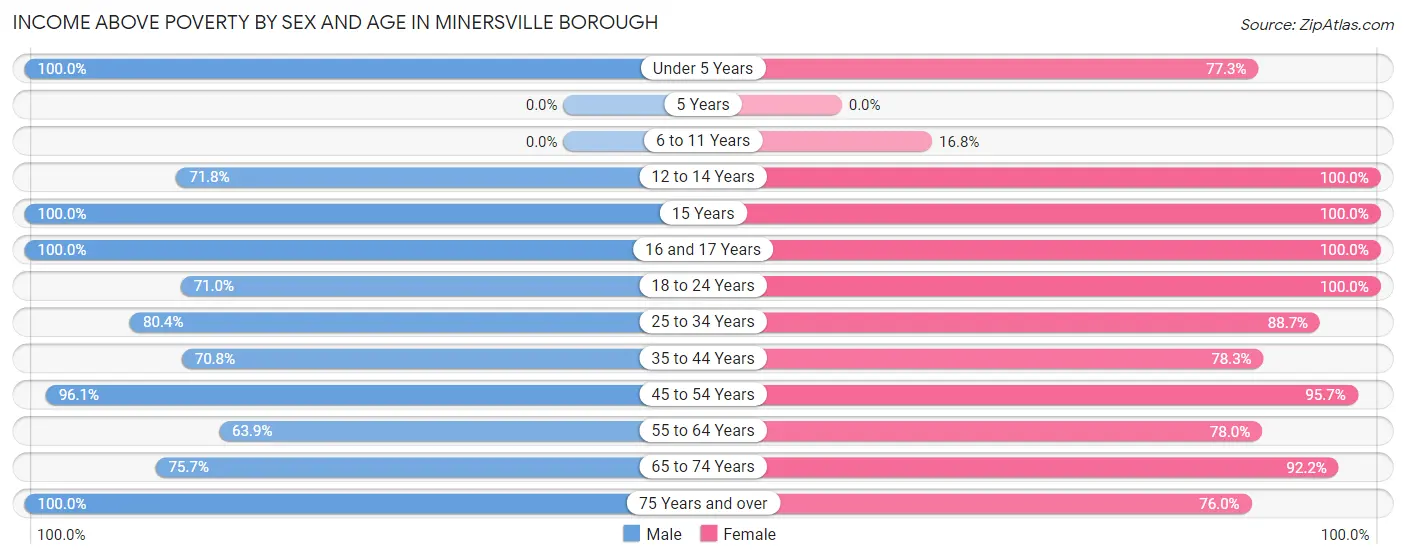
Income Above Poverty by Sex and Age in Minersville borough
According to the poverty statistics in Minersville borough, males aged under 5 years and females aged 12 to 14 years are the age groups that are most secure financially, with 100.0% of males and 100.0% of females in these age groups living above the poverty line.
| Age Bracket | Male | Female |
| Under 5 Years | 16 (100.0%) | 126 (77.3%) |
| 5 Years | 0 (0.0%) | 0 (0.0%) |
| 6 to 11 Years | 0 (0.0%) | 26 (16.8%) |
| 12 to 14 Years | 74 (71.8%) | 132 (100.0%) |
| 15 Years | 11 (100.0%) | 9 (100.0%) |
| 16 and 17 Years | 111 (100.0%) | 11 (100.0%) |
| 18 to 24 Years | 299 (71.0%) | 113 (100.0%) |
| 25 to 34 Years | 115 (80.4%) | 260 (88.7%) |
| 35 to 44 Years | 233 (70.8%) | 108 (78.3%) |
| 45 to 54 Years | 294 (96.1%) | 402 (95.7%) |
| 55 to 64 Years | 262 (63.9%) | 337 (78.0%) |
| 65 to 74 Years | 81 (75.7%) | 166 (92.2%) |
| 75 Years and over | 100 (100.0%) | 149 (76.0%) |
| Total | 1,596 (74.8%) | 1,839 (82.0%) |
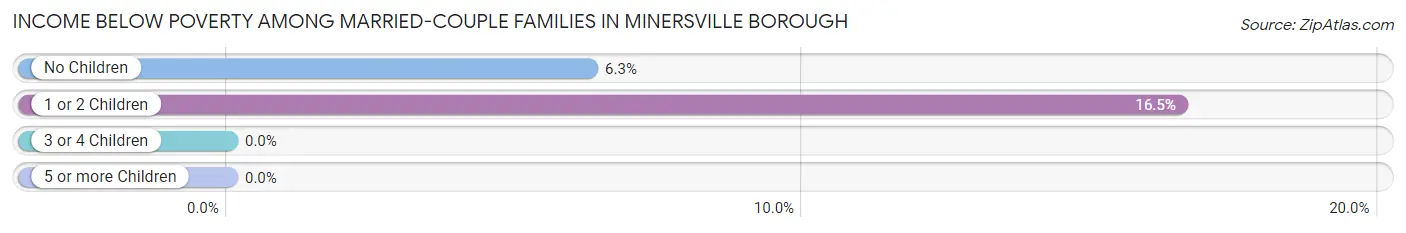
Income Below Poverty Among Married-Couple Families in Minersville borough
The poverty statistics for married-couple families in Minersville borough show that 8.6% or 43 of the total 500 families live below the poverty line. Families with 1 or 2 children have the highest poverty rate of 16.5%, comprising of 20 families. On the other hand, families with 3 or 4 children have the lowest poverty rate of 0.0%, which includes 0 families.
| Children | Above Poverty | Below Poverty |
| No Children | 344 (93.7%) | 23 (6.3%) |
| 1 or 2 Children | 101 (83.5%) | 20 (16.5%) |
| 3 or 4 Children | 12 (100.0%) | 0 (0.0%) |
| 5 or more Children | 0 (0.0%) | 0 (0.0%) |
| Total | 457 (91.4%) | 43 (8.6%) |
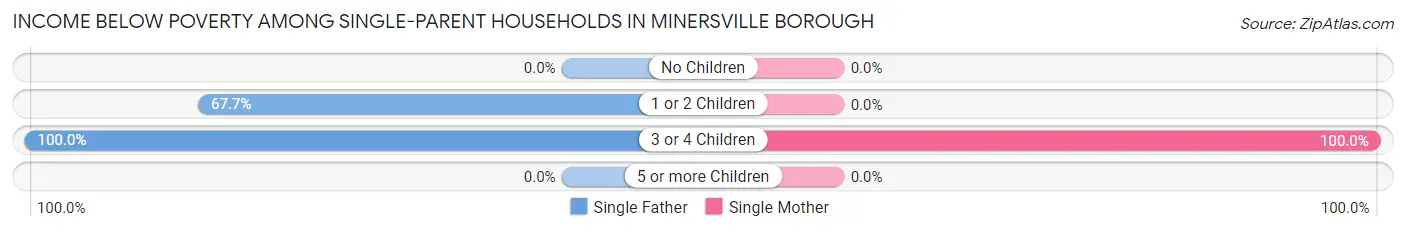
Income Below Poverty Among Single-Parent Households in Minersville borough
According to the poverty data in Minersville borough, 45.9% or 100 single-father households and 3.7% or 15 single-mother households are living below the poverty line. Among single-father households, those with 3 or 4 children have the highest poverty rate, with 56 households (100.0%) experiencing poverty. Likewise, among single-mother households, those with 3 or 4 children have the highest poverty rate, with 15 households (100.0%) falling below the poverty line.
| Children | Single Father | Single Mother |
| No Children | 0 (0.0%) | 0 (0.0%) |
| 1 or 2 Children | 44 (67.7%) | 0 (0.0%) |
| 3 or 4 Children | 56 (100.0%) | 15 (100.0%) |
| 5 or more Children | 0 (0.0%) | 0 (0.0%) |
| Total | 100 (45.9%) | 15 (3.7%) |
Income Below Poverty Among Married-Couple vs Single-Parent Households in Minersville borough
The poverty data for Minersville borough shows that 43 of the married-couple family households (8.6%) and 115 of the single-parent households (18.4%) are living below the poverty level. Within the married-couple family households, those with 1 or 2 children have the highest poverty rate, with 20 households (16.5%) falling below the poverty line. Among the single-parent households, those with 3 or 4 children have the highest poverty rate, with 71 household (100.0%) living below poverty.
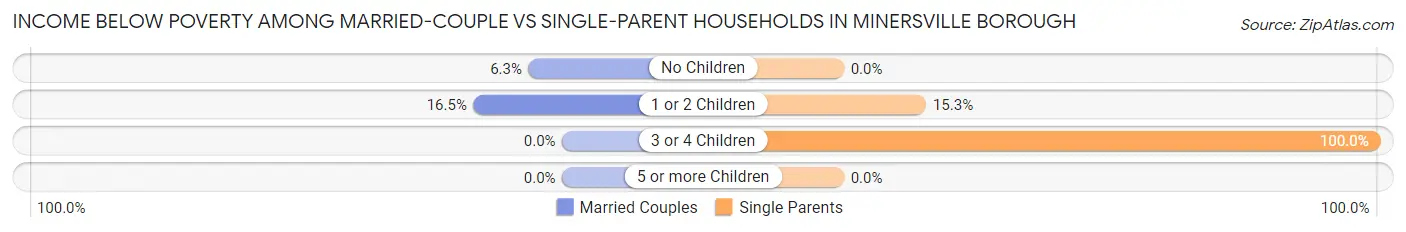
| Children | Married-Couple Families | Single-Parent Households |
| No Children | 23 (6.3%) | 0 (0.0%) |
| 1 or 2 Children | 20 (16.5%) | 44 (15.3%) |
| 3 or 4 Children | 0 (0.0%) | 71 (100.0%) |
| 5 or more Children | 0 (0.0%) | 0 (0.0%) |
| Total | 43 (8.6%) | 115 (18.4%) |
Race in Minersville borough
The most populous races in Minersville borough are White / Caucasian (3,746 | 85.6%), Two or more Races (578 | 13.2%), and Hispanic or Latino (457 | 10.4%).
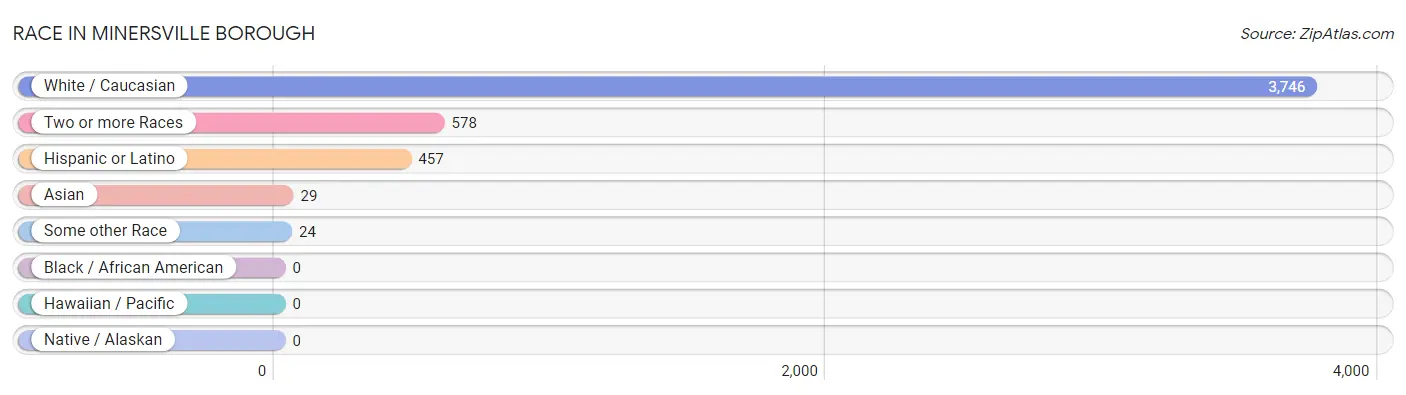
| Race | # Population | % Population |
| Asian | 29 | 0.7% |
| Black / African American | 0 | 0.0% |
| Hawaiian / Pacific | 0 | 0.0% |
| Hispanic or Latino | 457 | 10.4% |
| Native / Alaskan | 0 | 0.0% |
| White / Caucasian | 3,746 | 85.6% |
| Two or more Races | 578 | 13.2% |
| Some other Race | 24 | 0.5% |
| Total | 4,377 | 100.0% |
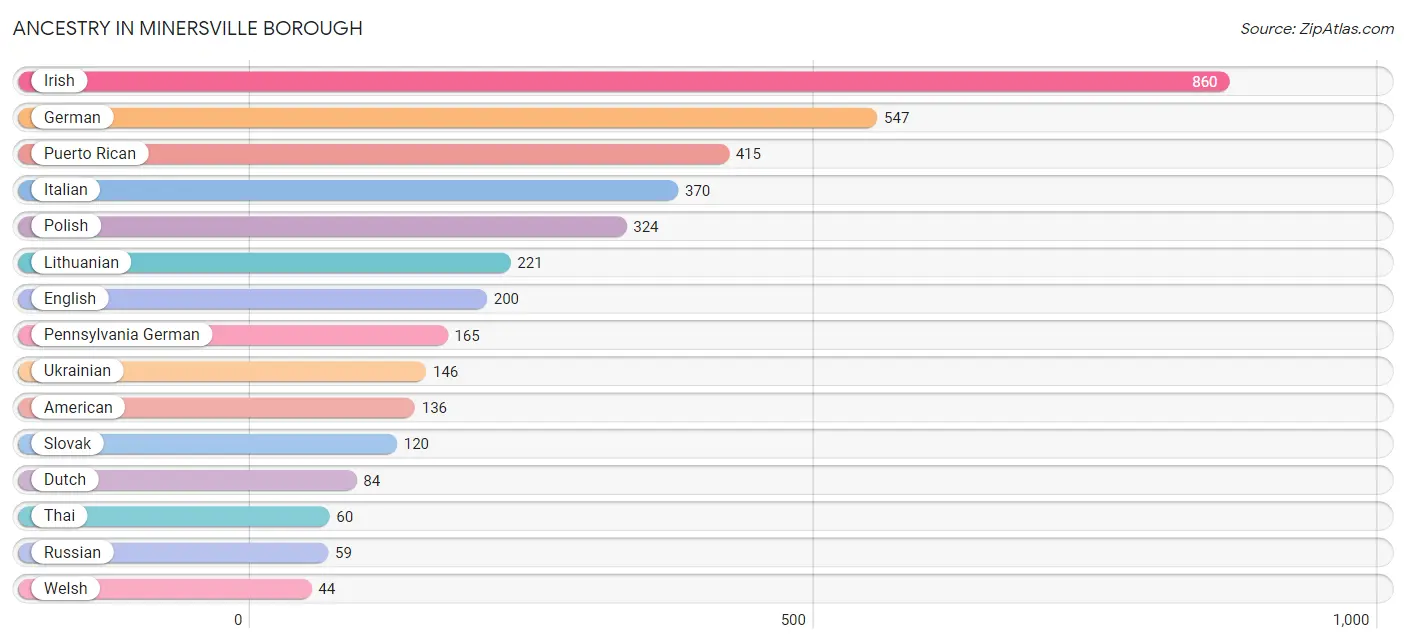
Ancestry in Minersville borough
The most populous ancestries reported in Minersville borough are Irish (860 | 19.7%), German (547 | 12.5%), Puerto Rican (415 | 9.5%), Italian (370 | 8.5%), and Polish (324 | 7.4%), together accounting for 57.5% of all Minersville borough residents.
| Ancestry | # Population | % Population |
| American | 136 | 3.1% |
| Austrian | 27 | 0.6% |
| Croatian | 14 | 0.3% |
| Czech | 1 | 0.0% |
| Czechoslovakian | 15 | 0.3% |
| Dominican | 18 | 0.4% |
| Dutch | 84 | 1.9% |
| Eastern European | 33 | 0.7% |
| English | 200 | 4.6% |
| European | 14 | 0.3% |
| French | 10 | 0.2% |
| German | 547 | 12.5% |
| Greek | 11 | 0.3% |
| Indian (Asian) | 17 | 0.4% |
| Irish | 860 | 19.7% |
| Italian | 370 | 8.5% |
| Lithuanian | 221 | 5.1% |
| Pennsylvania German | 165 | 3.8% |
| Polish | 324 | 7.4% |
| Puerto Rican | 415 | 9.5% |
| Russian | 59 | 1.3% |
| Slovak | 120 | 2.7% |
| Spanish | 24 | 0.5% |
| Thai | 60 | 1.4% |
| Ukrainian | 146 | 3.3% |
| Welsh | 44 | 1.0% | View All 26 Rows |
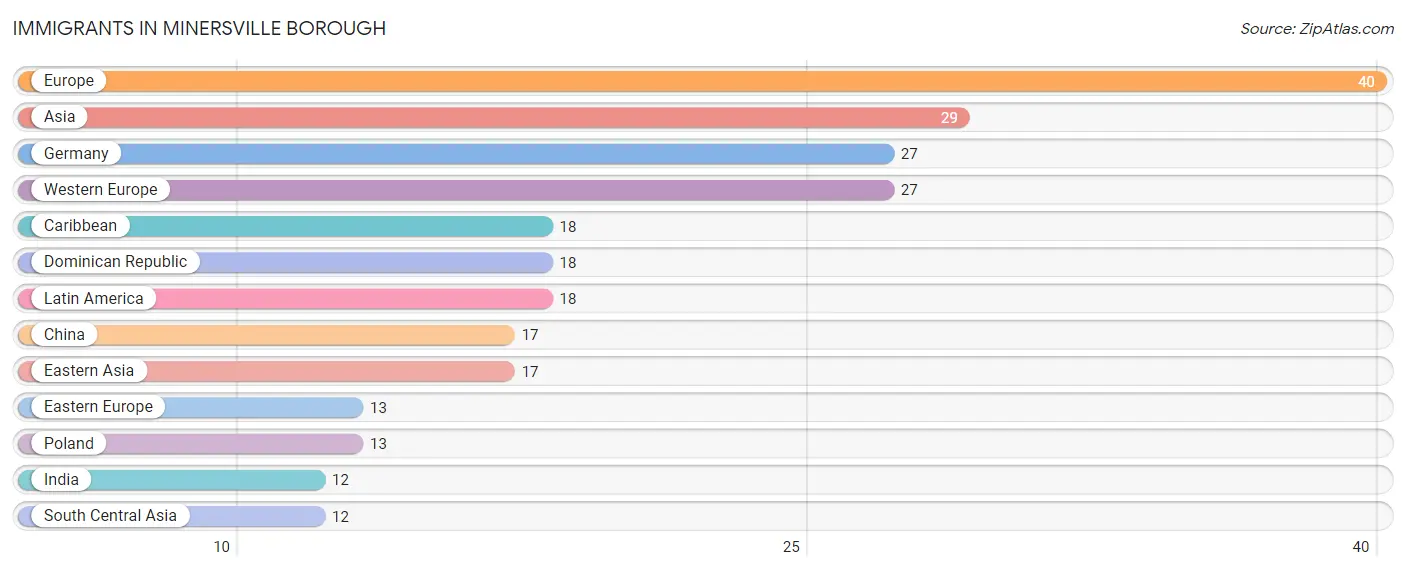
Immigrants in Minersville borough
The most numerous immigrant groups reported in Minersville borough came from Europe (40 | 0.9%), Asia (29 | 0.7%), Germany (27 | 0.6%), Western Europe (27 | 0.6%), and Caribbean (18 | 0.4%), together accounting for 3.2% of all Minersville borough residents.
| Immigration Origin | # Population | % Population |
| Asia | 29 | 0.7% |
| Caribbean | 18 | 0.4% |
| China | 17 | 0.4% |
| Dominican Republic | 18 | 0.4% |
| Eastern Asia | 17 | 0.4% |
| Eastern Europe | 13 | 0.3% |
| Europe | 40 | 0.9% |
| Germany | 27 | 0.6% |
| India | 12 | 0.3% |
| Latin America | 18 | 0.4% |
| Poland | 13 | 0.3% |
| South Central Asia | 12 | 0.3% |
| Western Europe | 27 | 0.6% | View All 13 Rows |
Sex and Age in Minersville borough
Sex and Age in Minersville borough
The most populous age groups in Minersville borough are 20 to 24 Years (339 | 15.9%) for men and 60 to 64 Years (296 | 13.2%) for women.
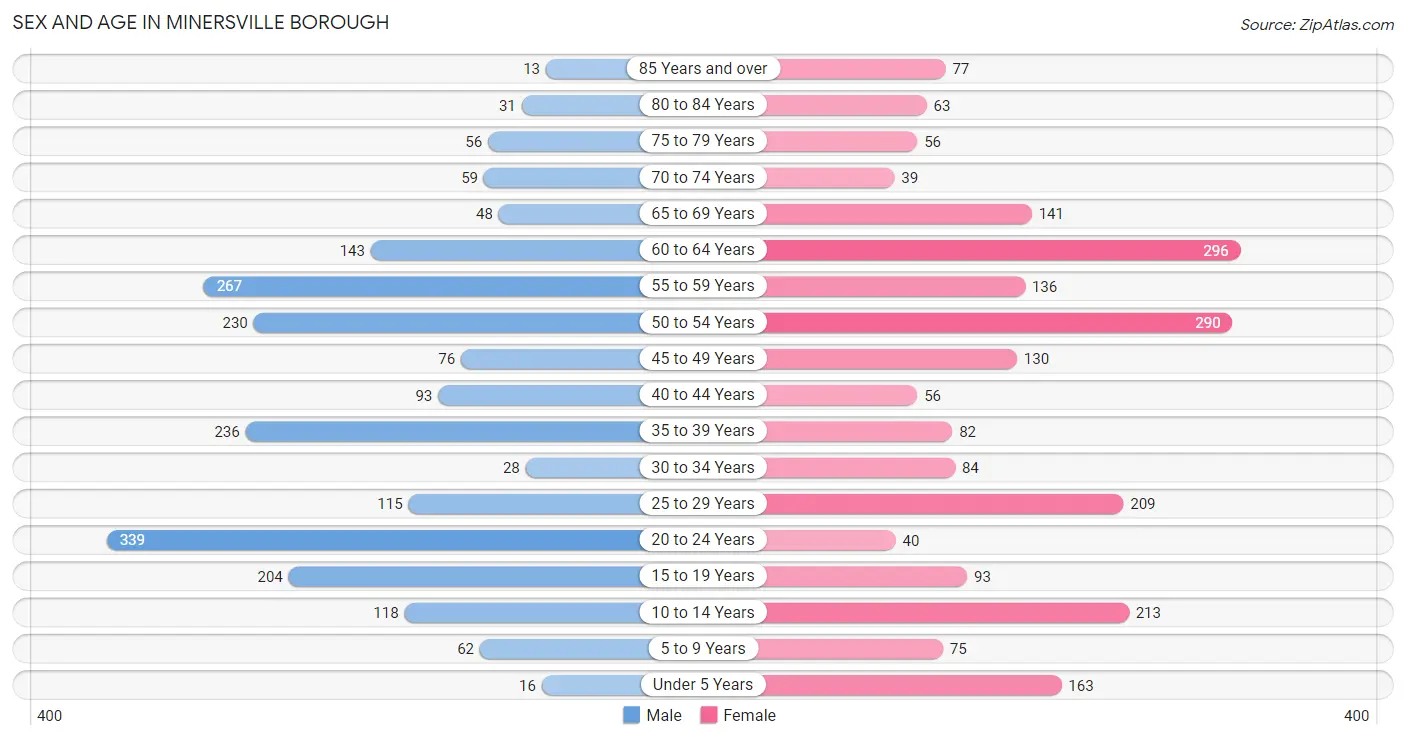
| Age Bracket | Male | Female |
| Under 5 Years | 16 (0.7%) | 163 (7.3%) |
| 5 to 9 Years | 62 (2.9%) | 75 (3.3%) |
| 10 to 14 Years | 118 (5.5%) | 213 (9.5%) |
| 15 to 19 Years | 204 (9.6%) | 93 (4.2%) |
| 20 to 24 Years | 339 (15.9%) | 40 (1.8%) |
| 25 to 29 Years | 115 (5.4%) | 209 (9.3%) |
| 30 to 34 Years | 28 (1.3%) | 84 (3.7%) |
| 35 to 39 Years | 236 (11.1%) | 82 (3.7%) |
| 40 to 44 Years | 93 (4.4%) | 56 (2.5%) |
| 45 to 49 Years | 76 (3.6%) | 130 (5.8%) |
| 50 to 54 Years | 230 (10.8%) | 290 (12.9%) |
| 55 to 59 Years | 267 (12.5%) | 136 (6.1%) |
| 60 to 64 Years | 143 (6.7%) | 296 (13.2%) |
| 65 to 69 Years | 48 (2.2%) | 141 (6.3%) |
| 70 to 74 Years | 59 (2.8%) | 39 (1.7%) |
| 75 to 79 Years | 56 (2.6%) | 56 (2.5%) |
| 80 to 84 Years | 31 (1.5%) | 63 (2.8%) |
| 85 Years and over | 13 (0.6%) | 77 (3.4%) |
| Total | 2,134 (100.0%) | 2,243 (100.0%) |
Families and Households in Minersville borough
Median Family Size in Minersville borough
The median family size in Minersville borough is 2.85 persons per family, with single male/father families (218 | 19.4%) accounting for the largest median family size of 3.05 persons per family. On the other hand, single female/mother families (406 | 36.1%) represent the smallest median family size with 2.76 persons per family.
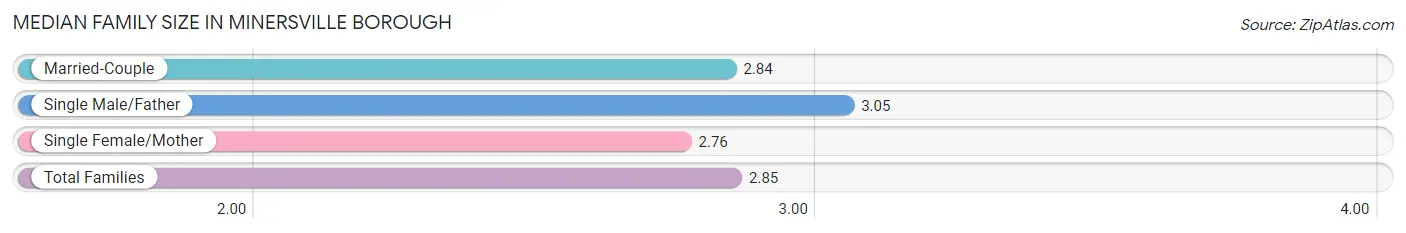
| Family Type | # Families | Family Size |
| Married-Couple | 500 (44.5%) | 2.84 |
| Single Male/Father | 218 (19.4%) | 3.05 |
| Single Female/Mother | 406 (36.1%) | 2.76 |
| Total Families | 1,124 (100.0%) | 2.85 |
Median Household Size in Minersville borough
The median household size in Minersville borough is 2.45 persons per household, with single male/father households (218 | 12.2%) accounting for the largest median household size of 3.63 persons per household. non-family households (660 | 37.0%) represent the smallest median household size with 1.09 persons per household.
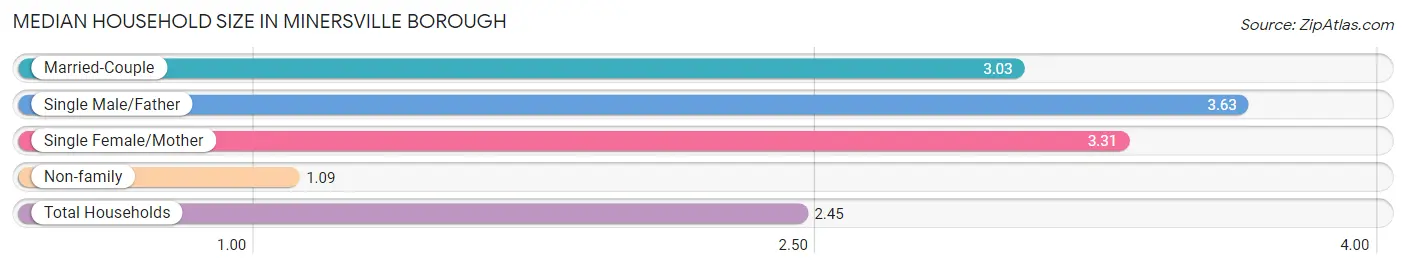
| Household Type | # Households | Household Size |
| Married-Couple | 500 (28.0%) | 3.03 |
| Single Male/Father | 218 (12.2%) | 3.63 |
| Single Female/Mother | 406 (22.8%) | 3.31 |
| Non-family | 660 (37.0%) | 1.09 |
| Total Households | 1,784 (100.0%) | 2.45 |
Household Size by Marriage Status in Minersville borough
Out of a total of 1,784 households in Minersville borough, 1,124 (63.0%) are family households, while 660 (37.0%) are nonfamily households. The most numerous type of family households are 2-person households, comprising 432, and the most common type of nonfamily households are 1-person households, comprising 601.
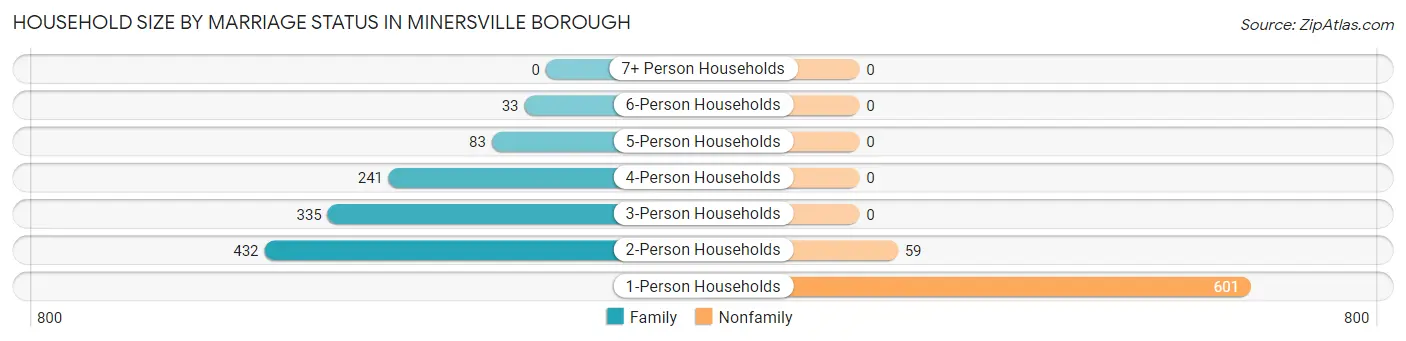
| Household Size | Family Households | Nonfamily Households |
| 1-Person Households | - | 601 (33.7%) |
| 2-Person Households | 432 (24.2%) | 59 (3.3%) |
| 3-Person Households | 335 (18.8%) | 0 (0.0%) |
| 4-Person Households | 241 (13.5%) | 0 (0.0%) |
| 5-Person Households | 83 (4.6%) | 0 (0.0%) |
| 6-Person Households | 33 (1.8%) | 0 (0.0%) |
| 7+ Person Households | 0 (0.0%) | 0 (0.0%) |
| Total | 1,124 (63.0%) | 660 (37.0%) |
Female Fertility in Minersville borough
Fertility by Age in Minersville borough
Average fertility rate in Minersville borough is 25.0 births per 1,000 women. Women in the age bracket of 20 to 34 years have the highest fertility rate with 54.0 births per 1,000 women. Women in the age bracket of 20 to 34 years acount for 100.0% of all women with births.
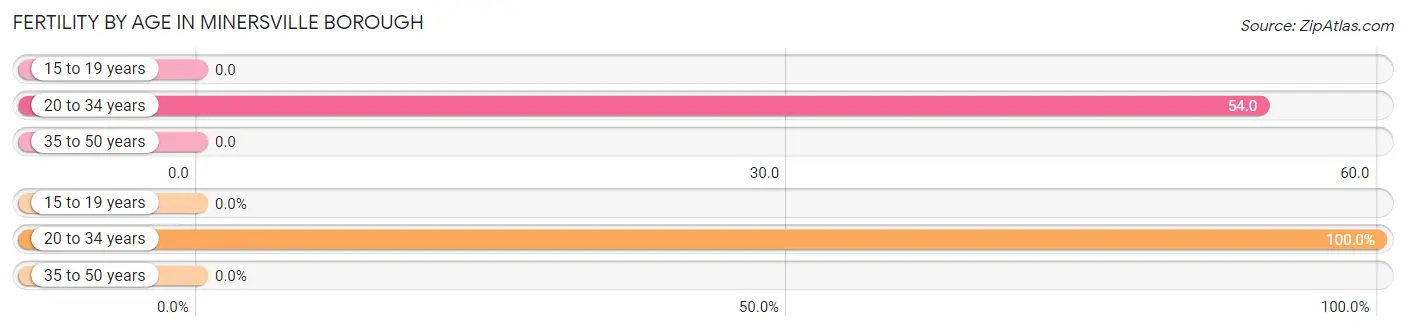
| Age Bracket | Women with Births | Births / 1,000 Women |
| 15 to 19 years | 0 (0.0%) | 0.0 |
| 20 to 34 years | 18 (100.0%) | 54.0 |
| 35 to 50 years | 0 (0.0%) | 0.0 |
| Total | 18 (100.0%) | 25.0 |
Fertility by Age by Marriage Status in Minersville borough
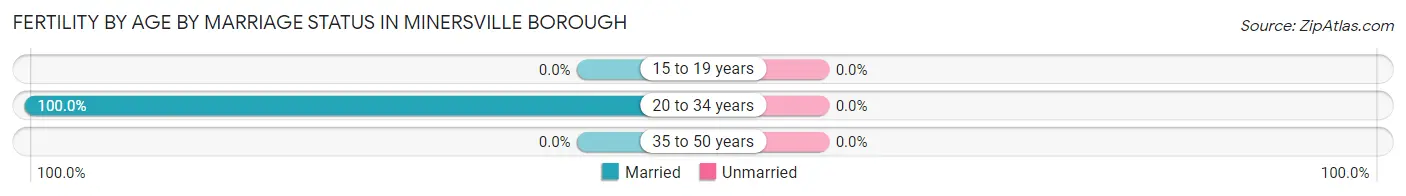
| Age Bracket | Married | Unmarried |
| 15 to 19 years | 0 (0.0%) | 0 (0.0%) |
| 20 to 34 years | 18 (100.0%) | 0 (0.0%) |
| 35 to 50 years | 0 (0.0%) | 0 (0.0%) |
| Total | 18 (100.0%) | 0 (0.0%) |
Fertility by Education in Minersville borough
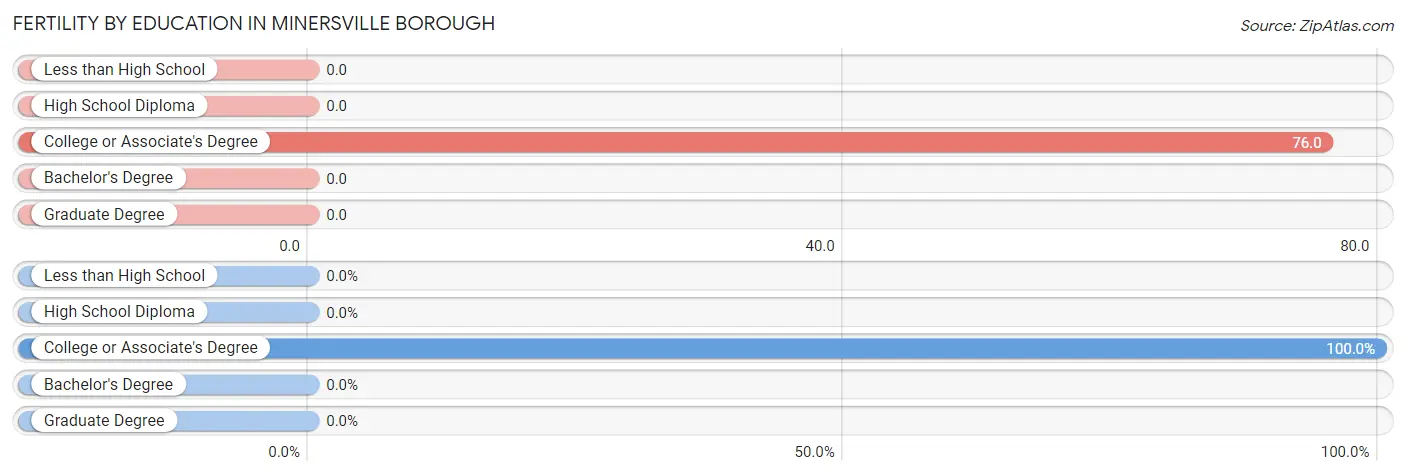
| Educational Attainment | Women with Births | Births / 1,000 Women |
| Less than High School | 0 (0.0%) | 0.0 |
| High School Diploma | 0 (0.0%) | 0.0 |
| College or Associate's Degree | 18 (100.0%) | 76.0 |
| Bachelor's Degree | 0 (0.0%) | 0.0 |
| Graduate Degree | 0 (0.0%) | 0.0 |
| Total | 18 (100.0%) | 25.0 |
Fertility by Education by Marriage Status in Minersville borough
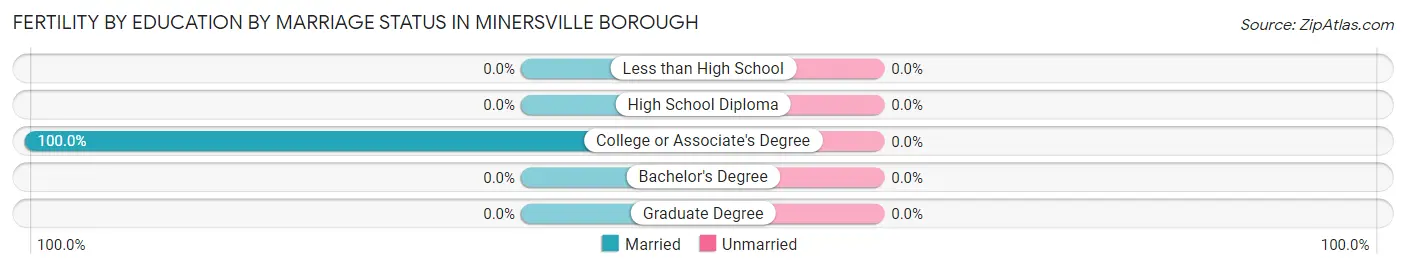
| Educational Attainment | Married | Unmarried |
| Less than High School | 0 (0.0%) | 0 (0.0%) |
| High School Diploma | 0 (0.0%) | 0 (0.0%) |
| College or Associate's Degree | 18 (100.0%) | 0 (0.0%) |
| Bachelor's Degree | 0 (0.0%) | 0 (0.0%) |
| Graduate Degree | 0 (0.0%) | 0 (0.0%) |
| Total | 18 (100.0%) | 0 (0.0%) |
Employment Characteristics in Minersville borough
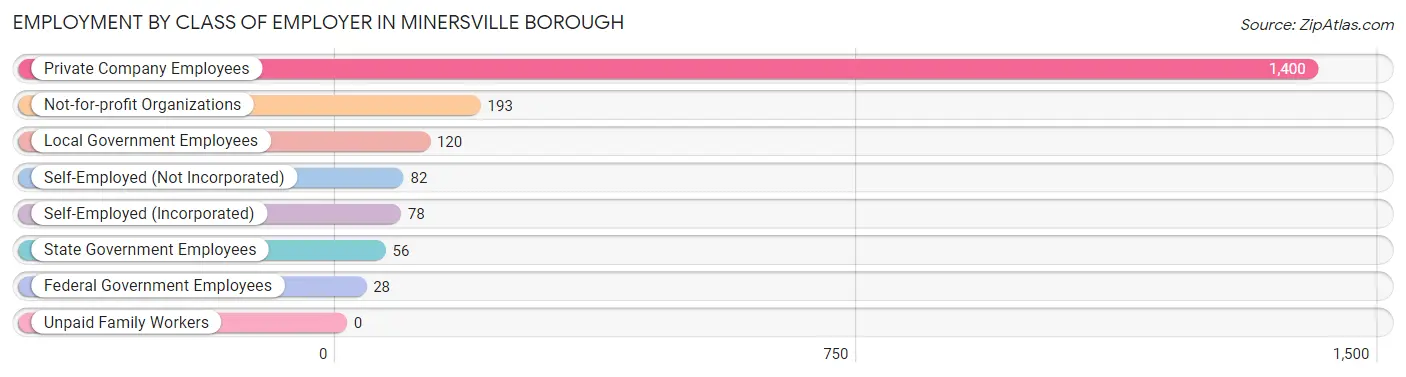
Employment by Class of Employer in Minersville borough
Among the 1,957 employed individuals in Minersville borough, private company employees (1,400 | 71.5%), not-for-profit organizations (193 | 9.9%), and local government employees (120 | 6.1%) make up the most common classes of employment.
| Employer Class | # Employees | % Employees |
| Private Company Employees | 1,400 | 71.5% |
| Self-Employed (Incorporated) | 78 | 4.0% |
| Self-Employed (Not Incorporated) | 82 | 4.2% |
| Not-for-profit Organizations | 193 | 9.9% |
| Local Government Employees | 120 | 6.1% |
| State Government Employees | 56 | 2.9% |
| Federal Government Employees | 28 | 1.4% |
| Unpaid Family Workers | 0 | 0.0% |
| Total | 1,957 | 100.0% |
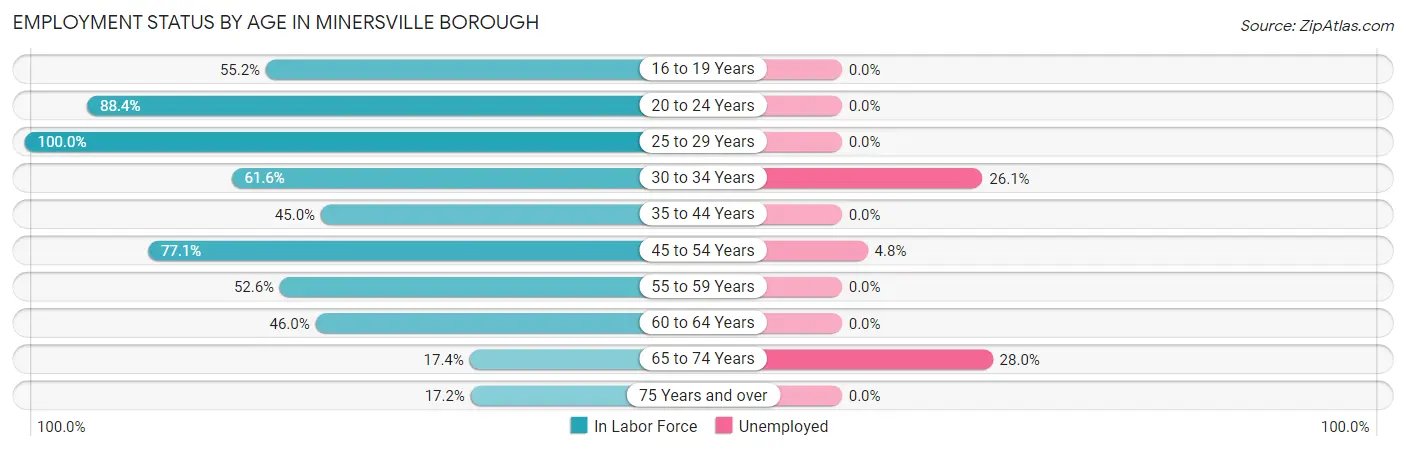
Employment Status by Age in Minersville borough
According to the labor force statistics for Minersville borough, out of the total population over 16 years of age (3,710), 58.4% or 2,167 individuals are in the labor force, with 2.7% or 59 of them unemployed. The age group with the highest labor force participation rate is 25 to 29 years, with 100.0% or 324 individuals in the labor force. Within the labor force, the 65 to 74 years age range has the highest percentage of unemployed individuals, with 28.0% or 14 of them being unemployed.
| Age Bracket | In Labor Force | Unemployed |
| 16 to 19 Years | 153 (55.2%) | 0 (0.0%) |
| 20 to 24 Years | 335 (88.4%) | 0 (0.0%) |
| 25 to 29 Years | 324 (100.0%) | 0 (0.0%) |
| 30 to 34 Years | 69 (61.6%) | 18 (26.1%) |
| 35 to 44 Years | 210 (45.0%) | 0 (0.0%) |
| 45 to 54 Years | 560 (77.1%) | 27 (4.8%) |
| 55 to 59 Years | 212 (52.6%) | 0 (0.0%) |
| 60 to 64 Years | 202 (46.0%) | 0 (0.0%) |
| 65 to 74 Years | 50 (17.4%) | 14 (28.0%) |
| 75 Years and over | 51 (17.2%) | 0 (0.0%) |
| Total | 2,167 (58.4%) | 59 (2.7%) |
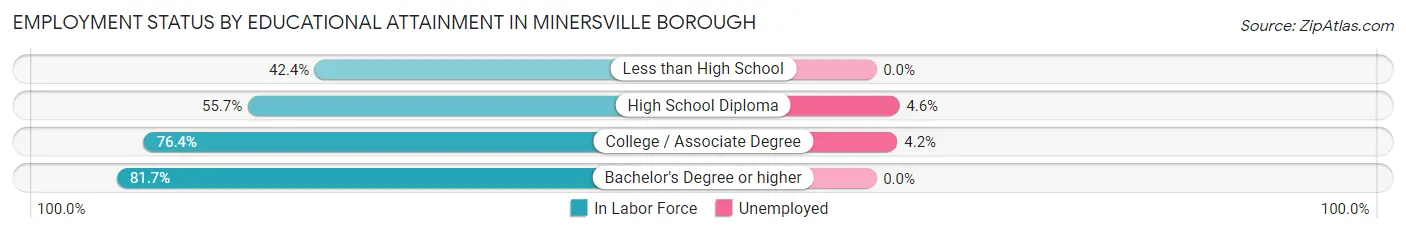
Employment Status by Educational Attainment in Minersville borough
According to labor force statistics for Minersville borough, 63.8% of individuals (1,576) out of the total population between 25 and 64 years of age (2,471) are in the labor force, with 2.9% or 46 of them being unemployed. The group with the highest labor force participation rate are those with the educational attainment of bachelor's degree or higher, with 81.7% or 348 individuals in the labor force. Within the labor force, individuals with high school diploma education have the highest percentage of unemployment, with 4.6% or 21 of them being unemployed.
| Educational Attainment | In Labor Force | Unemployed |
| Less than High School | 204 (42.4%) | 0 (0.0%) |
| High School Diploma | 458 (55.7%) | 38 (4.6%) |
| College / Associate Degree | 567 (76.4%) | 31 (4.2%) |
| Bachelor's Degree or higher | 348 (81.7%) | 0 (0.0%) |
| Total | 1,576 (63.8%) | 72 (2.9%) |
Employment Occupations by Sex in Minersville borough
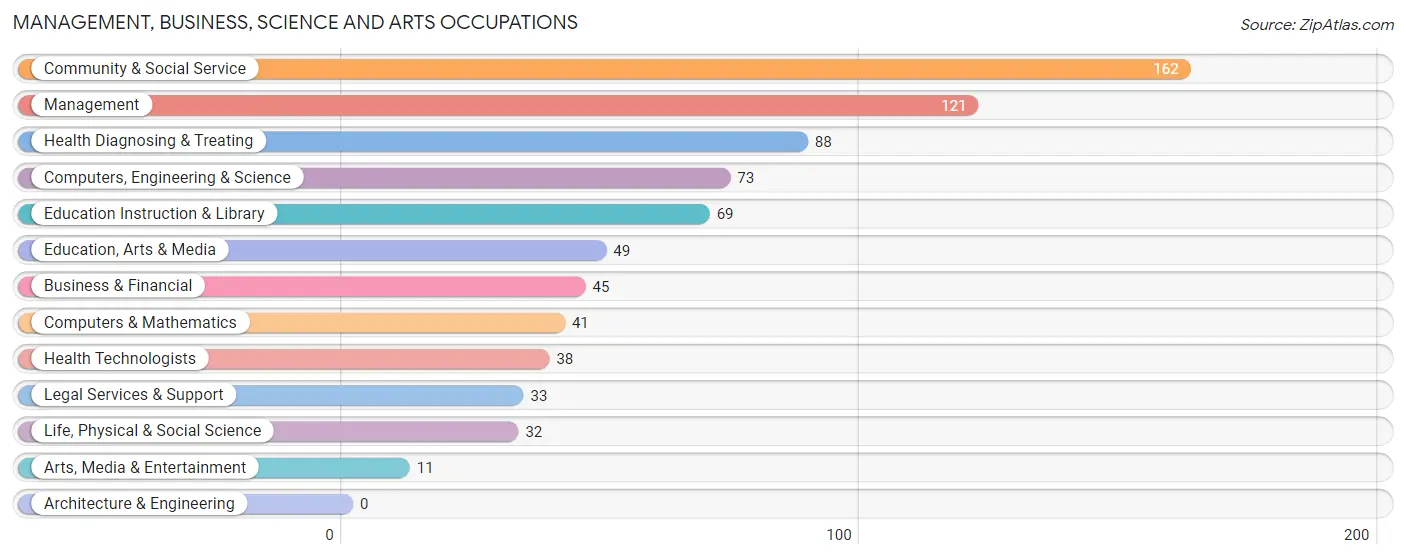
Management, Business, Science and Arts Occupations
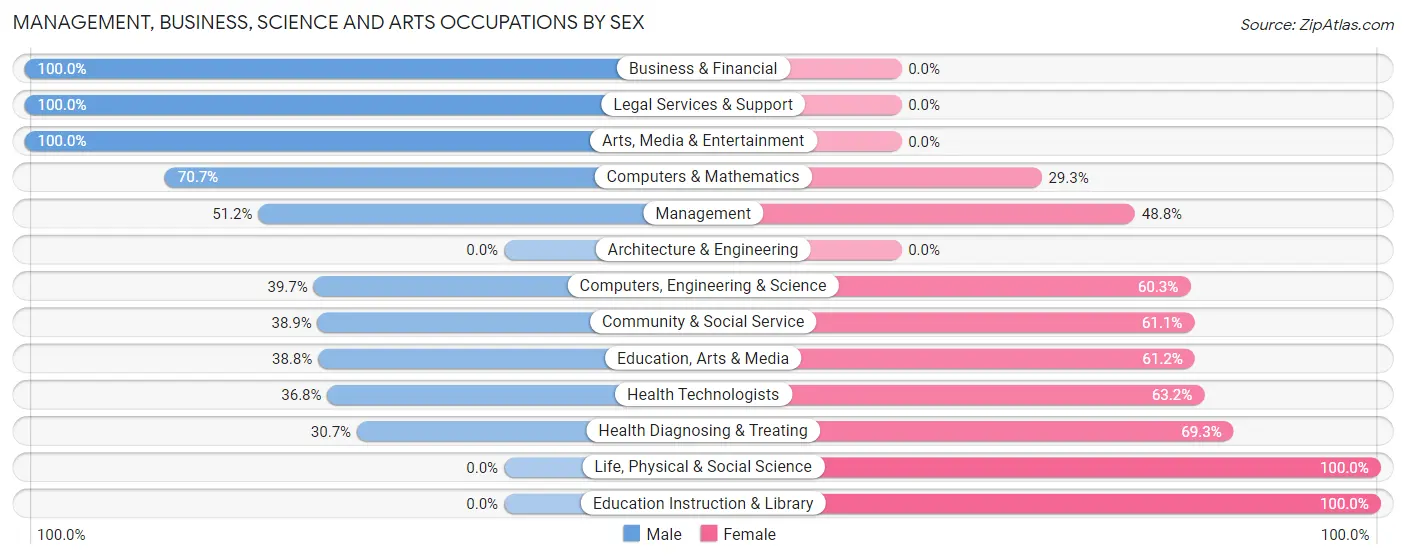
The most common Management, Business, Science and Arts occupations in Minersville borough are Community & Social Service (162 | 7.7%), Management (121 | 5.7%), Health Diagnosing & Treating (88 | 4.2%), Computers, Engineering & Science (73 | 3.5%), and Education Instruction & Library (69 | 3.3%).
Management, Business, Science and Arts Occupations by Sex
Within the Management, Business, Science and Arts occupations in Minersville borough, the most male-oriented occupations are Business & Financial (100.0%), Legal Services & Support (100.0%), and Arts, Media & Entertainment (100.0%), while the most female-oriented occupations are Life, Physical & Social Science (100.0%), Education Instruction & Library (100.0%), and Health Diagnosing & Treating (69.3%).
| Occupation | Male | Female |
| Management | 62 (51.2%) | 59 (48.8%) |
| Business & Financial | 45 (100.0%) | 0 (0.0%) |
| Computers, Engineering & Science | 29 (39.7%) | 44 (60.3%) |
| Computers & Mathematics | 29 (70.7%) | 12 (29.3%) |
| Architecture & Engineering | 0 (0.0%) | 0 (0.0%) |
| Life, Physical & Social Science | 0 (0.0%) | 32 (100.0%) |
| Community & Social Service | 63 (38.9%) | 99 (61.1%) |
| Education, Arts & Media | 19 (38.8%) | 30 (61.2%) |
| Legal Services & Support | 33 (100.0%) | 0 (0.0%) |
| Education Instruction & Library | 0 (0.0%) | 69 (100.0%) |
| Arts, Media & Entertainment | 11 (100.0%) | 0 (0.0%) |
| Health Diagnosing & Treating | 27 (30.7%) | 61 (69.3%) |
| Health Technologists | 14 (36.8%) | 24 (63.2%) |
| Total (Category) | 226 (46.2%) | 263 (53.8%) |
| Total (Overall) | 1,183 (56.1%) | 924 (43.9%) |
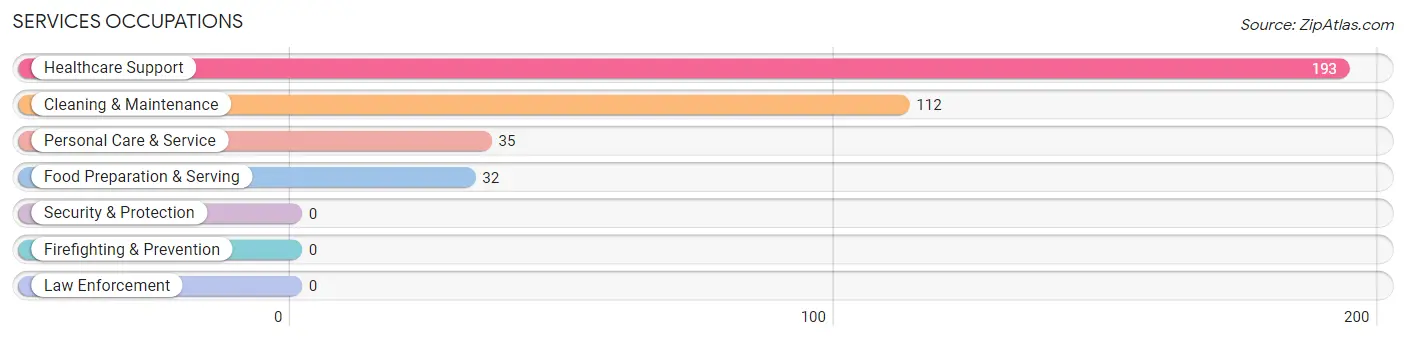
Services Occupations
The most common Services occupations in Minersville borough are Healthcare Support (193 | 9.2%), Cleaning & Maintenance (112 | 5.3%), Personal Care & Service (35 | 1.7%), and Food Preparation & Serving (32 | 1.5%).
Services Occupations by Sex
Within the Services occupations in Minersville borough, the most male-oriented occupations are Food Preparation & Serving (53.1%), Cleaning & Maintenance (38.4%), and Personal Care & Service (34.3%), while the most female-oriented occupations are Healthcare Support (89.1%), Personal Care & Service (65.7%), and Cleaning & Maintenance (61.6%).
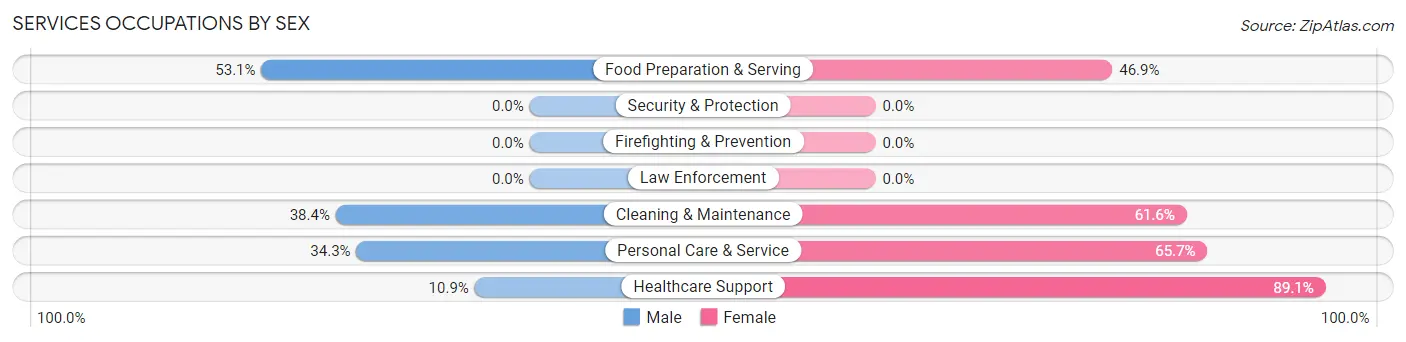
| Occupation | Male | Female |
| Healthcare Support | 21 (10.9%) | 172 (89.1%) |
| Security & Protection | 0 (0.0%) | 0 (0.0%) |
| Firefighting & Prevention | 0 (0.0%) | 0 (0.0%) |
| Law Enforcement | 0 (0.0%) | 0 (0.0%) |
| Food Preparation & Serving | 17 (53.1%) | 15 (46.9%) |
| Cleaning & Maintenance | 43 (38.4%) | 69 (61.6%) |
| Personal Care & Service | 12 (34.3%) | 23 (65.7%) |
| Total (Category) | 93 (25.0%) | 279 (75.0%) |
| Total (Overall) | 1,183 (56.1%) | 924 (43.9%) |
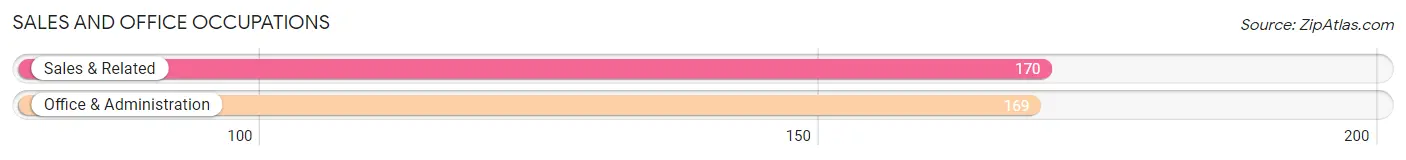
Sales and Office Occupations
The most common Sales and Office occupations in Minersville borough are Sales & Related (170 | 8.1%), and Office & Administration (169 | 8.0%).
Sales and Office Occupations by Sex

| Occupation | Male | Female |
| Sales & Related | 102 (60.0%) | 68 (40.0%) |
| Office & Administration | 0 (0.0%) | 169 (100.0%) |
| Total (Category) | 102 (30.1%) | 237 (69.9%) |
| Total (Overall) | 1,183 (56.1%) | 924 (43.9%) |
Natural Resources, Construction and Maintenance Occupations
The most common Natural Resources, Construction and Maintenance occupations in Minersville borough are Construction & Extraction (185 | 8.8%), and Installation, Maintenance & Repair (55 | 2.6%).
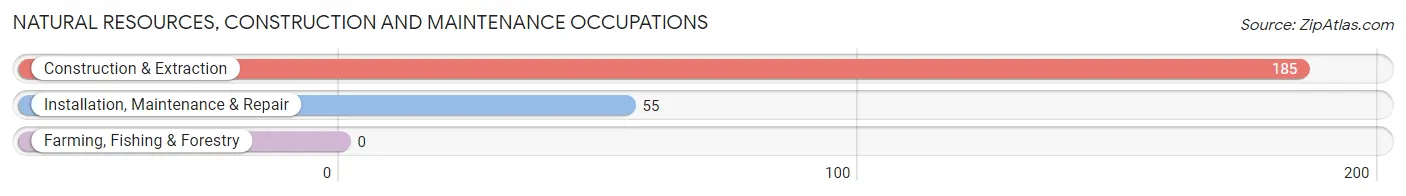
Natural Resources, Construction and Maintenance Occupations by Sex

| Occupation | Male | Female |
| Farming, Fishing & Forestry | 0 (0.0%) | 0 (0.0%) |
| Construction & Extraction | 185 (100.0%) | 0 (0.0%) |
| Installation, Maintenance & Repair | 55 (100.0%) | 0 (0.0%) |
| Total (Category) | 240 (100.0%) | 0 (0.0%) |
| Total (Overall) | 1,183 (56.1%) | 924 (43.9%) |
Production, Transportation and Moving Occupations
The most common Production, Transportation and Moving occupations in Minersville borough are Production (329 | 15.6%), Material Moving (303 | 14.4%), and Transportation (35 | 1.7%).
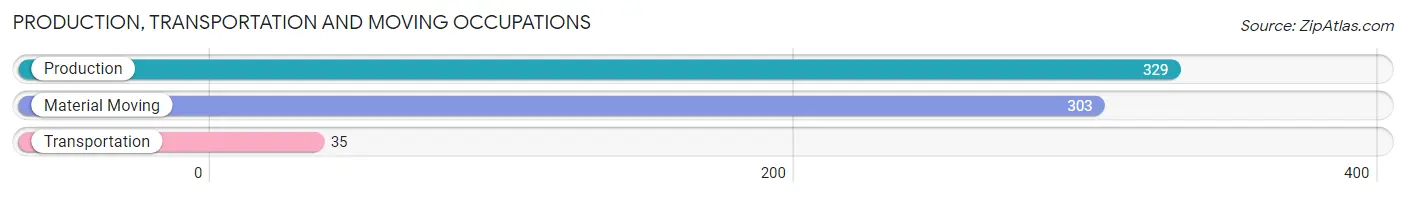
Production, Transportation and Moving Occupations by Sex
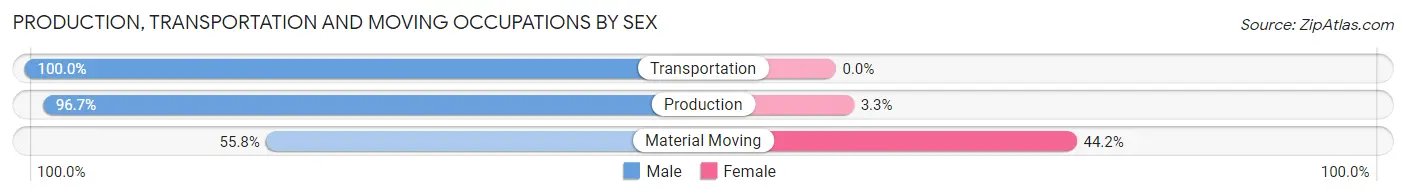
| Occupation | Male | Female |
| Production | 318 (96.7%) | 11 (3.3%) |
| Transportation | 35 (100.0%) | 0 (0.0%) |
| Material Moving | 169 (55.8%) | 134 (44.2%) |
| Total (Category) | 522 (78.3%) | 145 (21.7%) |
| Total (Overall) | 1,183 (56.1%) | 924 (43.9%) |
Employment Industries by Sex in Minersville borough
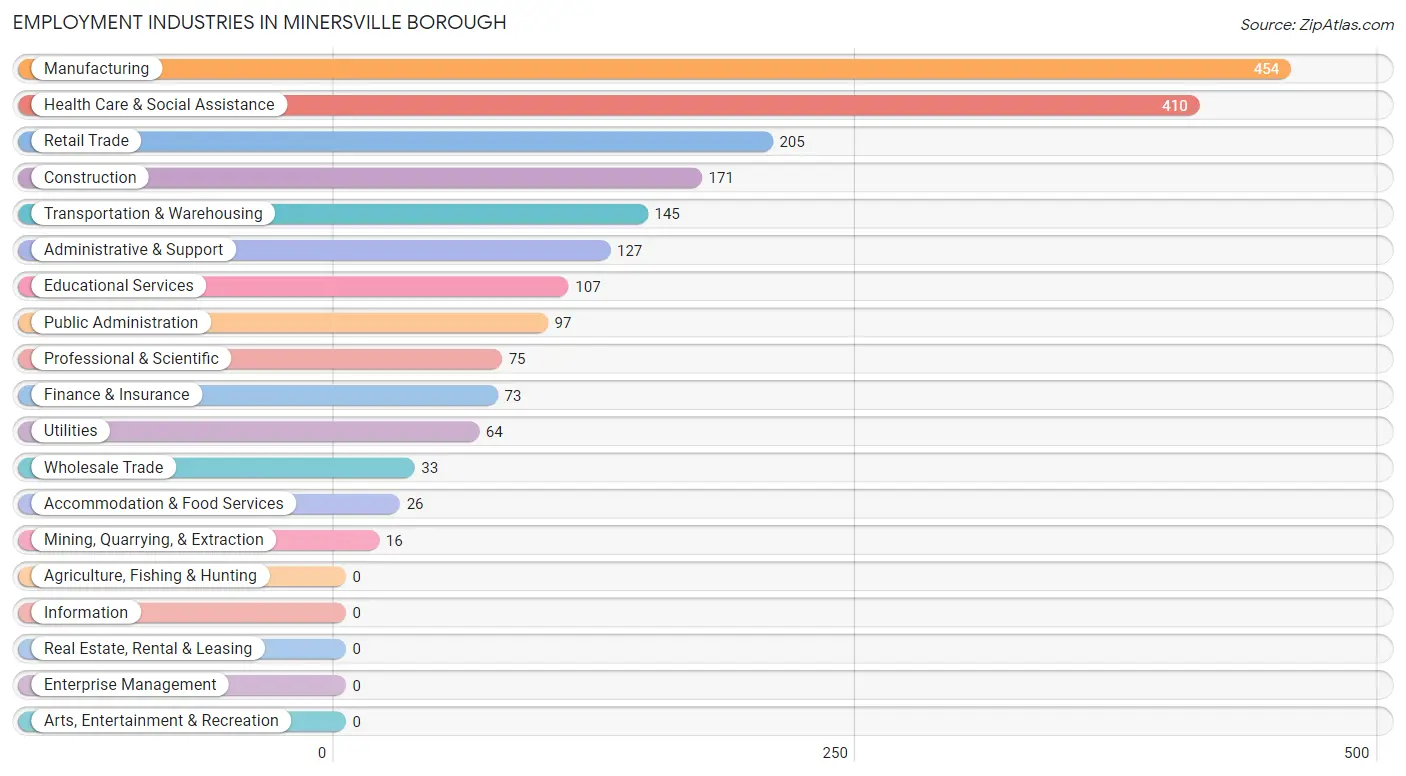
Employment Industries in Minersville borough
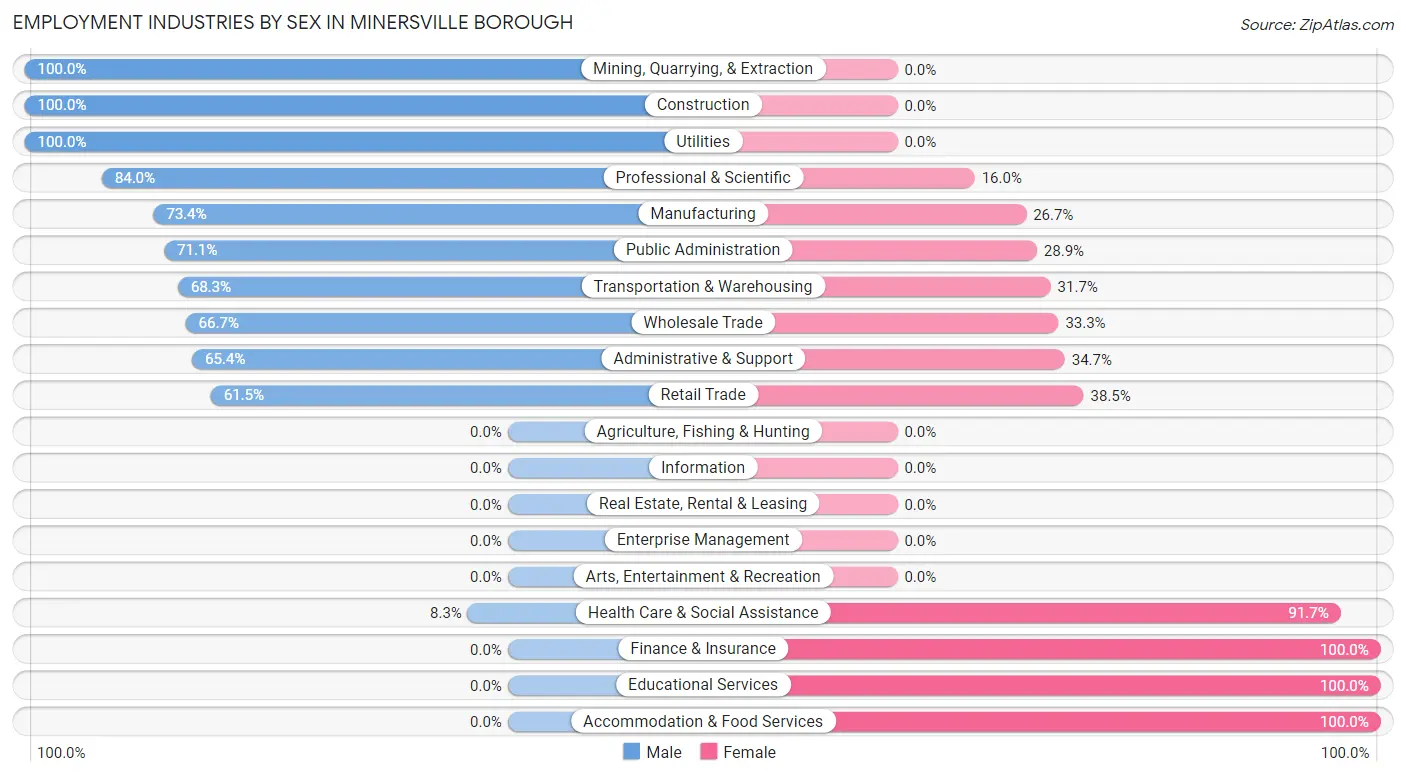
The major employment industries in Minersville borough include Manufacturing (454 | 21.5%), Health Care & Social Assistance (410 | 19.5%), Retail Trade (205 | 9.7%), Construction (171 | 8.1%), and Transportation & Warehousing (145 | 6.9%).
Employment Industries by Sex in Minersville borough
The Minersville borough industries that see more men than women are Mining, Quarrying, & Extraction (100.0%), Construction (100.0%), and Utilities (100.0%), whereas the industries that tend to have a higher number of women are Finance & Insurance (100.0%), Educational Services (100.0%), and Accommodation & Food Services (100.0%).
| Industry | Male | Female |
| Agriculture, Fishing & Hunting | 0 (0.0%) | 0 (0.0%) |
| Mining, Quarrying, & Extraction | 16 (100.0%) | 0 (0.0%) |
| Construction | 171 (100.0%) | 0 (0.0%) |
| Manufacturing | 333 (73.4%) | 121 (26.7%) |
| Wholesale Trade | 22 (66.7%) | 11 (33.3%) |
| Retail Trade | 126 (61.5%) | 79 (38.5%) |
| Transportation & Warehousing | 99 (68.3%) | 46 (31.7%) |
| Utilities | 64 (100.0%) | 0 (0.0%) |
| Information | 0 (0.0%) | 0 (0.0%) |
| Finance & Insurance | 0 (0.0%) | 73 (100.0%) |
| Real Estate, Rental & Leasing | 0 (0.0%) | 0 (0.0%) |
| Professional & Scientific | 63 (84.0%) | 12 (16.0%) |
| Enterprise Management | 0 (0.0%) | 0 (0.0%) |
| Administrative & Support | 83 (65.3%) | 44 (34.6%) |
| Educational Services | 0 (0.0%) | 107 (100.0%) |
| Health Care & Social Assistance | 34 (8.3%) | 376 (91.7%) |
| Arts, Entertainment & Recreation | 0 (0.0%) | 0 (0.0%) |
| Accommodation & Food Services | 0 (0.0%) | 26 (100.0%) |
| Public Administration | 69 (71.1%) | 28 (28.9%) |
| Total | 1,183 (56.1%) | 924 (43.9%) |
Education in Minersville borough
School Enrollment in Minersville borough
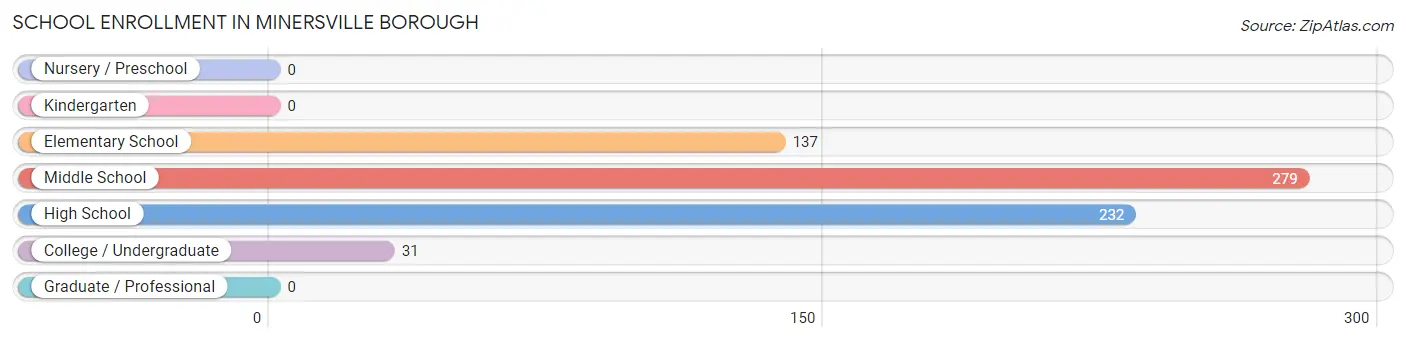
The most common levels of schooling among the 679 students in Minersville borough are middle school (279 | 41.1%), high school (232 | 34.2%), and elementary school (137 | 20.2%).
| School Level | # Students | % Students |
| Nursery / Preschool | 0 | 0.0% |
| Kindergarten | 0 | 0.0% |
| Elementary School | 137 | 20.2% |
| Middle School | 279 | 41.1% |
| High School | 232 | 34.2% |
| College / Undergraduate | 31 | 4.6% |
| Graduate / Professional | 0 | 0.0% |
| Total | 679 | 100.0% |
School Enrollment by Age by Funding Source in Minersville borough
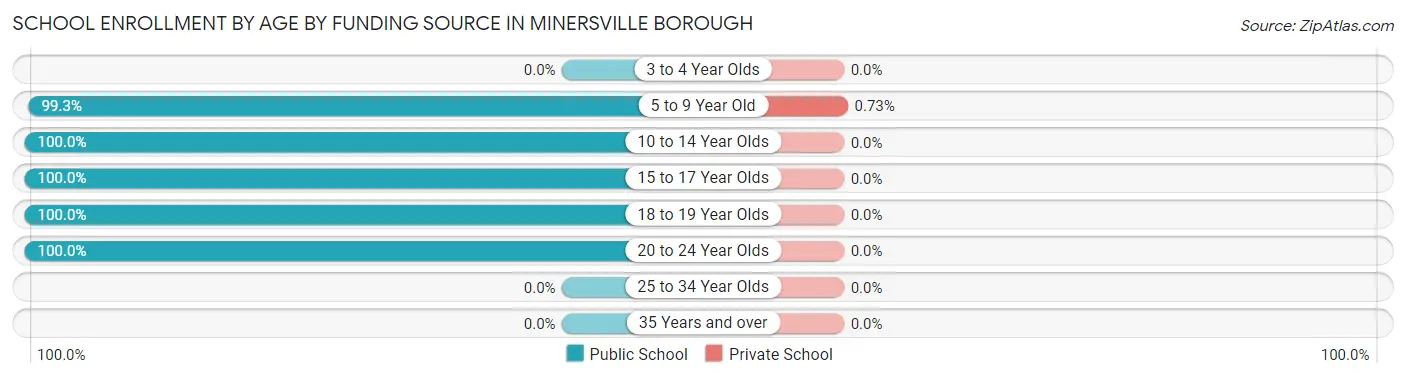
Out of a total of 679 students who are enrolled in schools in Minersville borough, 1 (0.1%) attend a private institution, while the remaining 678 (99.9%) are enrolled in public schools. The age group of 5 to 9 year old has the highest likelihood of being enrolled in private schools, with 1 (0.7% in the age bracket) enrolled. Conversely, the age group of 10 to 14 year olds has the lowest likelihood of being enrolled in a private school, with 331 (100.0% in the age bracket) attending a public institution.
| Age Bracket | Public School | Private School |
| 3 to 4 Year Olds | 0 (0.0%) | 0 (0.0%) |
| 5 to 9 Year Old | 136 (99.3%) | 1 (0.7%) |
| 10 to 14 Year Olds | 331 (100.0%) | 0 (0.0%) |
| 15 to 17 Year Olds | 142 (100.0%) | 0 (0.0%) |
| 18 to 19 Year Olds | 38 (100.0%) | 0 (0.0%) |
| 20 to 24 Year Olds | 31 (100.0%) | 0 (0.0%) |
| 25 to 34 Year Olds | 0 (0.0%) | 0 (0.0%) |
| 35 Years and over | 0 (0.0%) | 0 (0.0%) |
| Total | 678 (99.9%) | 1 (0.1%) |
Educational Attainment by Field of Study in Minersville borough
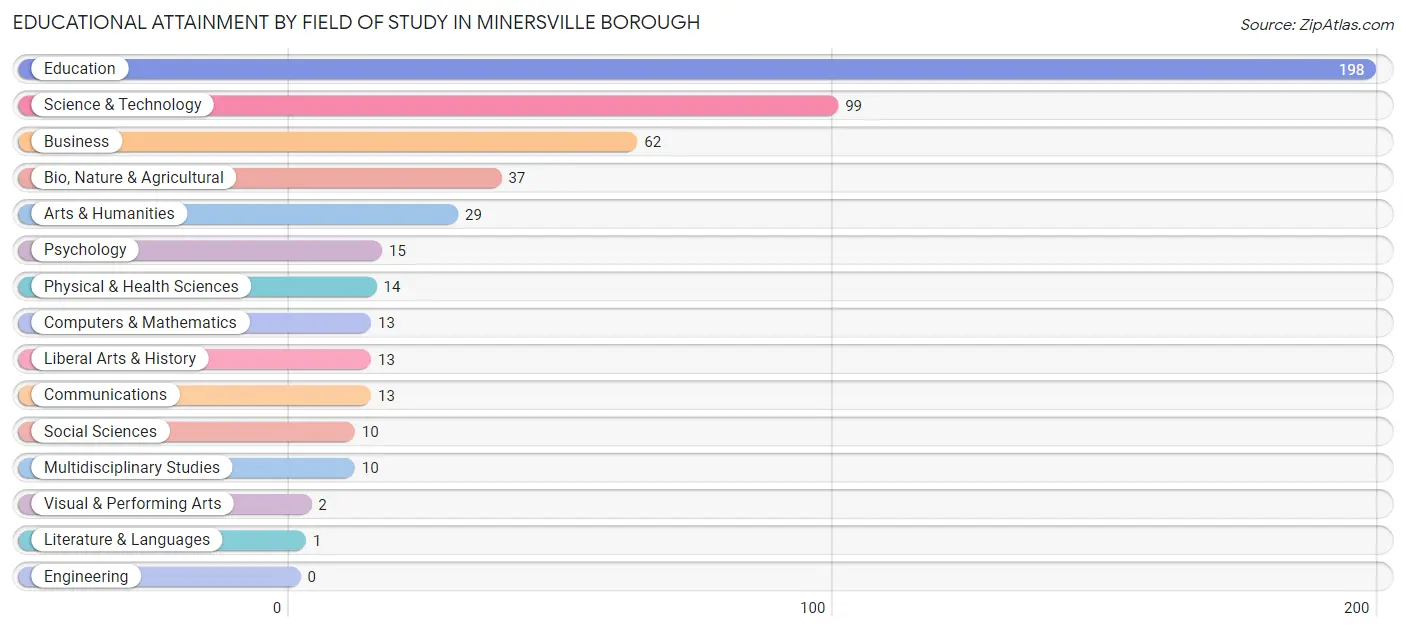
Education (198 | 38.4%), science & technology (99 | 19.2%), business (62 | 12.0%), bio, nature & agricultural (37 | 7.2%), and arts & humanities (29 | 5.6%) are the most common fields of study among 516 individuals in Minersville borough who have obtained a bachelor's degree or higher.
| Field of Study | # Graduates | % Graduates |
| Computers & Mathematics | 13 | 2.5% |
| Bio, Nature & Agricultural | 37 | 7.2% |
| Physical & Health Sciences | 14 | 2.7% |
| Psychology | 15 | 2.9% |
| Social Sciences | 10 | 1.9% |
| Engineering | 0 | 0.0% |
| Multidisciplinary Studies | 10 | 1.9% |
| Science & Technology | 99 | 19.2% |
| Business | 62 | 12.0% |
| Education | 198 | 38.4% |
| Literature & Languages | 1 | 0.2% |
| Liberal Arts & History | 13 | 2.5% |
| Visual & Performing Arts | 2 | 0.4% |
| Communications | 13 | 2.5% |
| Arts & Humanities | 29 | 5.6% |
| Total | 516 | 100.0% |
Transportation & Commute in Minersville borough
Vehicle Availability by Sex in Minersville borough
The most prevalent vehicle ownership categories in Minersville borough are males with 2 vehicles (596, accounting for 50.4%) and females with 2 vehicles (264, making up 77.2%).
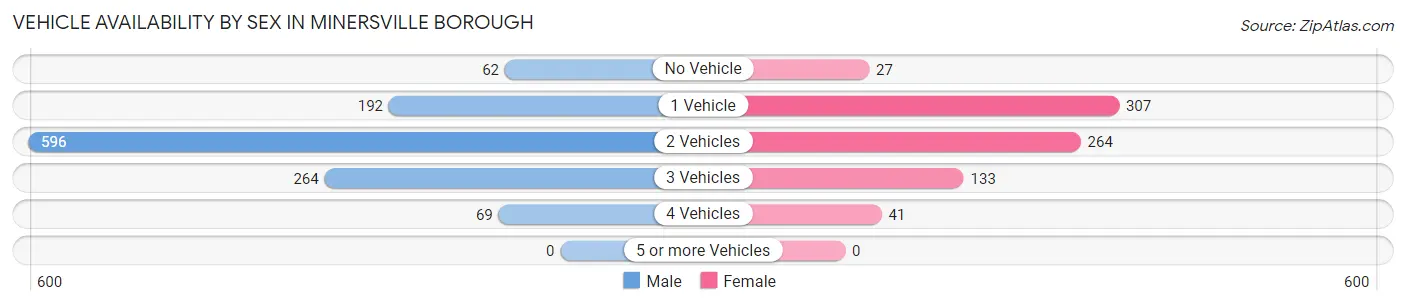
| Vehicles Available | Male | Female |
| No Vehicle | 62 (5.2%) | 27 (3.5%) |
| 1 Vehicle | 192 (16.2%) | 307 (39.8%) |
| 2 Vehicles | 596 (50.4%) | 264 (34.2%) |
| 3 Vehicles | 264 (22.3%) | 133 (17.2%) |
| 4 Vehicles | 69 (5.8%) | 41 (5.3%) |
| 5 or more Vehicles | 0 (0.0%) | 0 (0.0%) |
| Total | 1,183 (100.0%) | 772 (100.0%) |
Commute Time in Minersville borough
The most frequently occuring commute durations in Minersville borough are 15 to 19 minutes (791 commuters, 40.9%), 20 to 24 minutes (269 commuters, 13.9%), and 10 to 14 minutes (234 commuters, 12.1%).
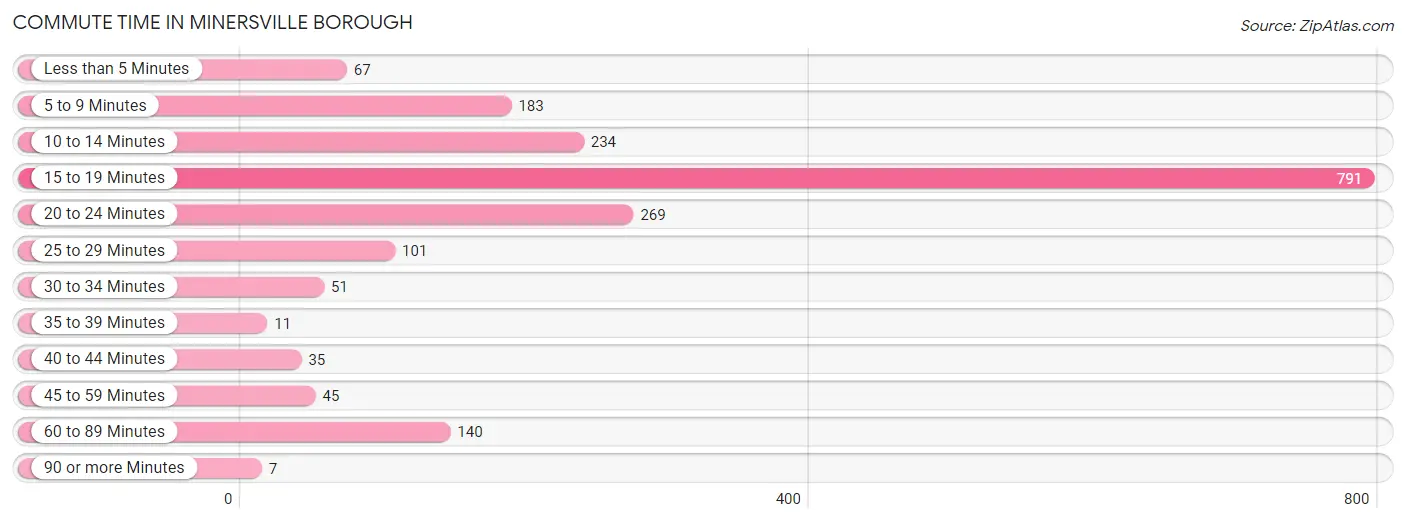
| Commute Time | # Commuters | % Commuters |
| Less than 5 Minutes | 67 | 3.5% |
| 5 to 9 Minutes | 183 | 9.5% |
| 10 to 14 Minutes | 234 | 12.1% |
| 15 to 19 Minutes | 791 | 40.9% |
| 20 to 24 Minutes | 269 | 13.9% |
| 25 to 29 Minutes | 101 | 5.2% |
| 30 to 34 Minutes | 51 | 2.6% |
| 35 to 39 Minutes | 11 | 0.6% |
| 40 to 44 Minutes | 35 | 1.8% |
| 45 to 59 Minutes | 45 | 2.3% |
| 60 to 89 Minutes | 140 | 7.2% |
| 90 or more Minutes | 7 | 0.4% |
Commute Time by Sex in Minersville borough
The most common commute times in Minersville borough are 15 to 19 minutes (477 commuters, 41.1%) for males and 15 to 19 minutes (314 commuters, 40.6%) for females.
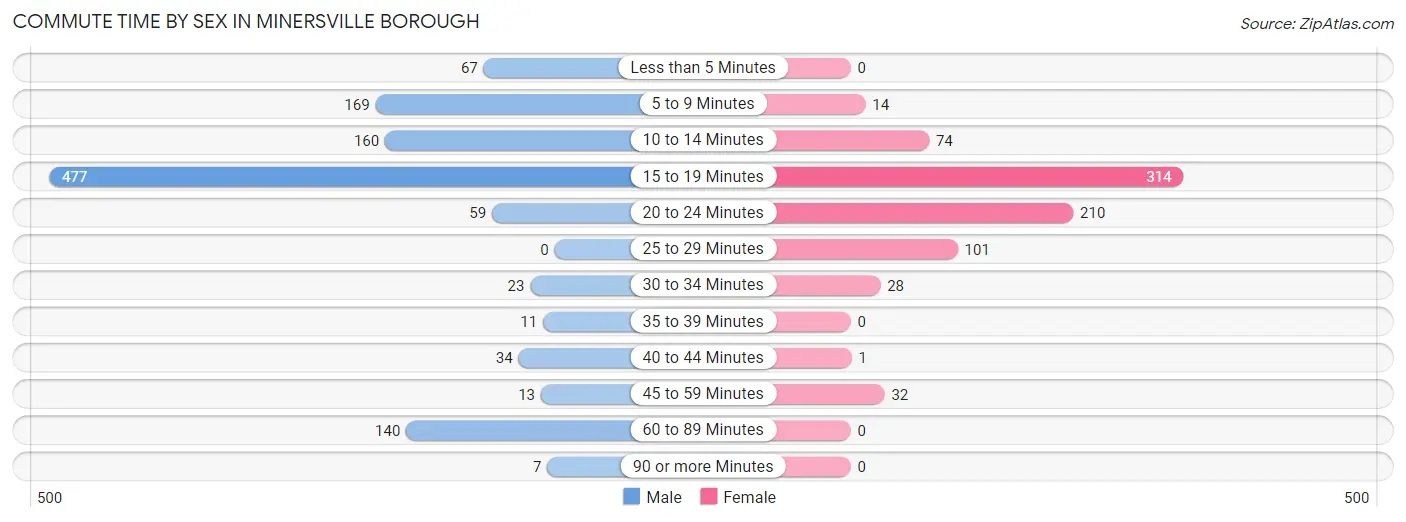
| Commute Time | Male | Female |
| Less than 5 Minutes | 67 (5.8%) | 0 (0.0%) |
| 5 to 9 Minutes | 169 (14.6%) | 14 (1.8%) |
| 10 to 14 Minutes | 160 (13.8%) | 74 (9.6%) |
| 15 to 19 Minutes | 477 (41.1%) | 314 (40.6%) |
| 20 to 24 Minutes | 59 (5.1%) | 210 (27.1%) |
| 25 to 29 Minutes | 0 (0.0%) | 101 (13.1%) |
| 30 to 34 Minutes | 23 (2.0%) | 28 (3.6%) |
| 35 to 39 Minutes | 11 (0.9%) | 0 (0.0%) |
| 40 to 44 Minutes | 34 (2.9%) | 1 (0.1%) |
| 45 to 59 Minutes | 13 (1.1%) | 32 (4.1%) |
| 60 to 89 Minutes | 140 (12.1%) | 0 (0.0%) |
| 90 or more Minutes | 7 (0.6%) | 0 (0.0%) |
Time of Departure to Work by Sex in Minersville borough
The most frequent times of departure to work in Minersville borough are 5:30 AM to 5:59 AM (405, 34.9%) for males and 8:00 AM to 8:29 AM (222, 28.7%) for females.
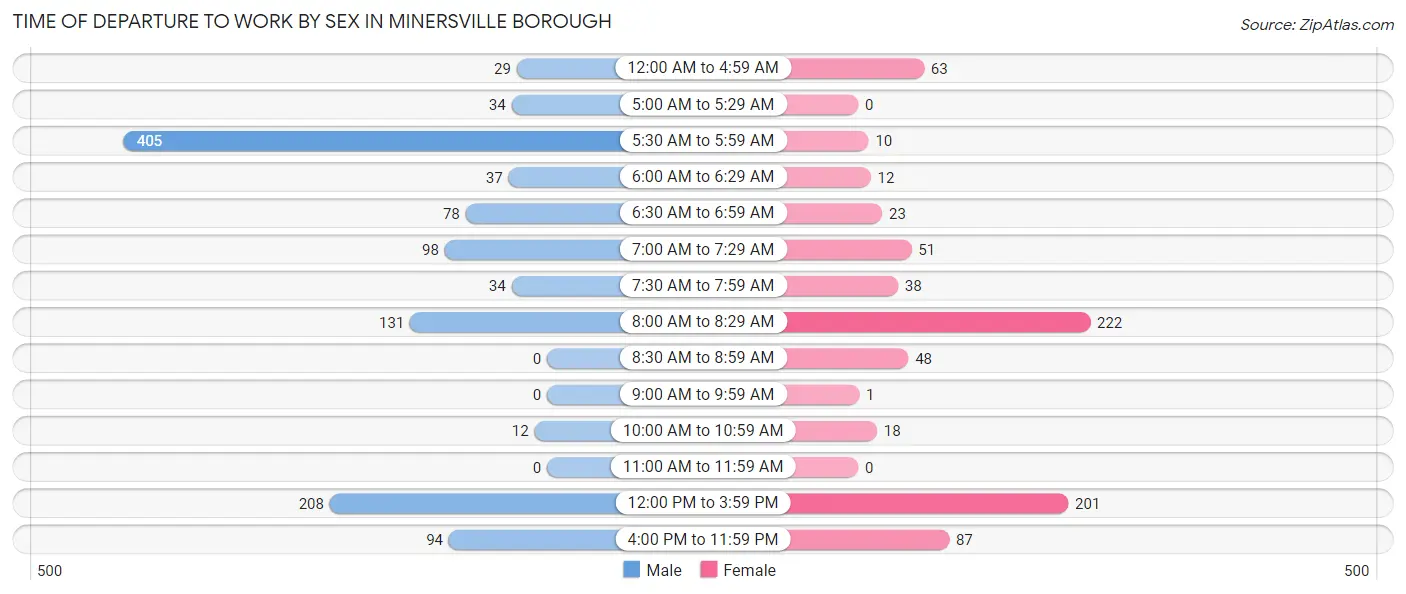
| Time of Departure | Male | Female |
| 12:00 AM to 4:59 AM | 29 (2.5%) | 63 (8.1%) |
| 5:00 AM to 5:29 AM | 34 (2.9%) | 0 (0.0%) |
| 5:30 AM to 5:59 AM | 405 (34.9%) | 10 (1.3%) |
| 6:00 AM to 6:29 AM | 37 (3.2%) | 12 (1.5%) |
| 6:30 AM to 6:59 AM | 78 (6.7%) | 23 (3.0%) |
| 7:00 AM to 7:29 AM | 98 (8.5%) | 51 (6.6%) |
| 7:30 AM to 7:59 AM | 34 (2.9%) | 38 (4.9%) |
| 8:00 AM to 8:29 AM | 131 (11.3%) | 222 (28.7%) |
| 8:30 AM to 8:59 AM | 0 (0.0%) | 48 (6.2%) |
| 9:00 AM to 9:59 AM | 0 (0.0%) | 1 (0.1%) |
| 10:00 AM to 10:59 AM | 12 (1.0%) | 18 (2.3%) |
| 11:00 AM to 11:59 AM | 0 (0.0%) | 0 (0.0%) |
| 12:00 PM to 3:59 PM | 208 (17.9%) | 201 (26.0%) |
| 4:00 PM to 11:59 PM | 94 (8.1%) | 87 (11.2%) |
| Total | 1,160 (100.0%) | 774 (100.0%) |
Housing Occupancy in Minersville borough
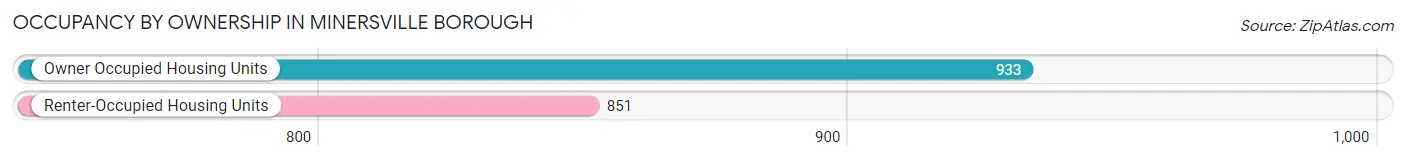
Occupancy by Ownership in Minersville borough
Of the total 1,784 dwellings in Minersville borough, owner-occupied units account for 933 (52.3%), while renter-occupied units make up 851 (47.7%).
| Occupancy | # Housing Units | % Housing Units |
| Owner Occupied Housing Units | 933 | 52.3% |
| Renter-Occupied Housing Units | 851 | 47.7% |
| Total Occupied Housing Units | 1,784 | 100.0% |
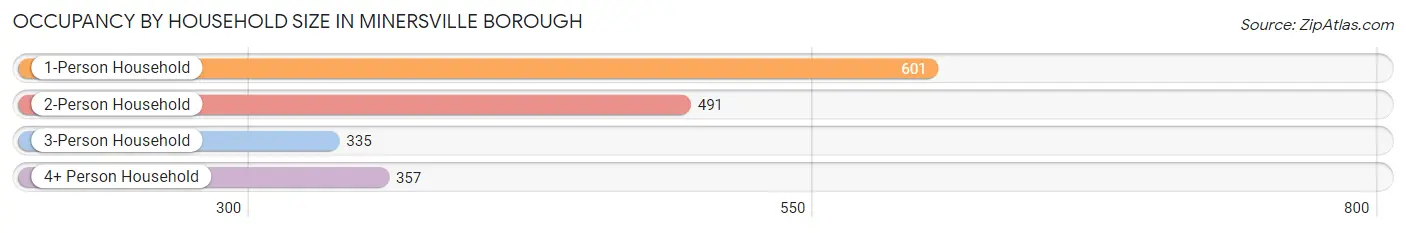
Occupancy by Household Size in Minersville borough
| Household Size | # Housing Units | % Housing Units |
| 1-Person Household | 601 | 33.7% |
| 2-Person Household | 491 | 27.5% |
| 3-Person Household | 335 | 18.8% |
| 4+ Person Household | 357 | 20.0% |
| Total Housing Units | 1,784 | 100.0% |
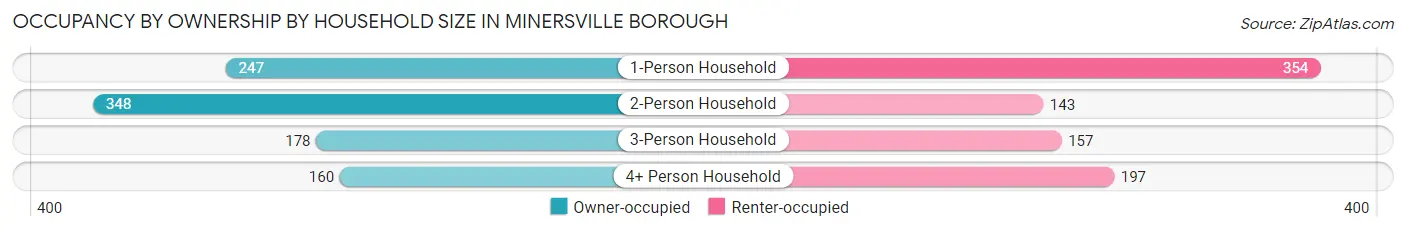
Occupancy by Ownership by Household Size in Minersville borough
| Household Size | Owner-occupied | Renter-occupied |
| 1-Person Household | 247 (41.1%) | 354 (58.9%) |
| 2-Person Household | 348 (70.9%) | 143 (29.1%) |
| 3-Person Household | 178 (53.1%) | 157 (46.9%) |
| 4+ Person Household | 160 (44.8%) | 197 (55.2%) |
| Total Housing Units | 933 (52.3%) | 851 (47.7%) |
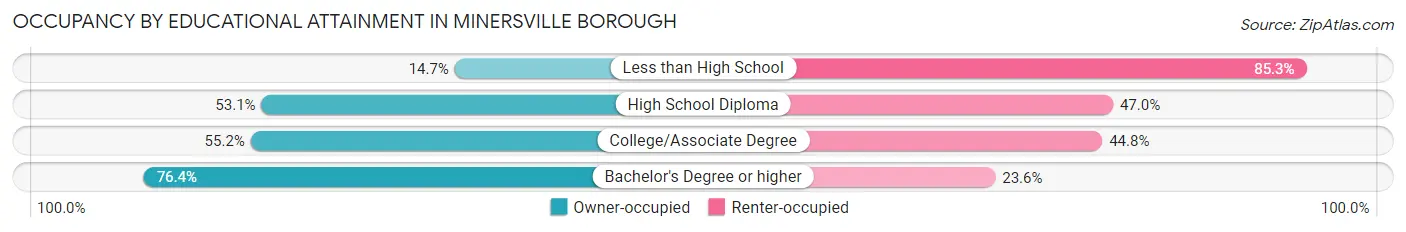
Occupancy by Educational Attainment in Minersville borough
| Household Size | Owner-occupied | Renter-occupied |
| Less than High School | 33 (14.7%) | 191 (85.3%) |
| High School Diploma | 365 (53.0%) | 323 (46.9%) |
| College/Associate Degree | 341 (55.2%) | 277 (44.8%) |
| Bachelor's Degree or higher | 194 (76.4%) | 60 (23.6%) |
Occupancy by Age of Householder in Minersville borough
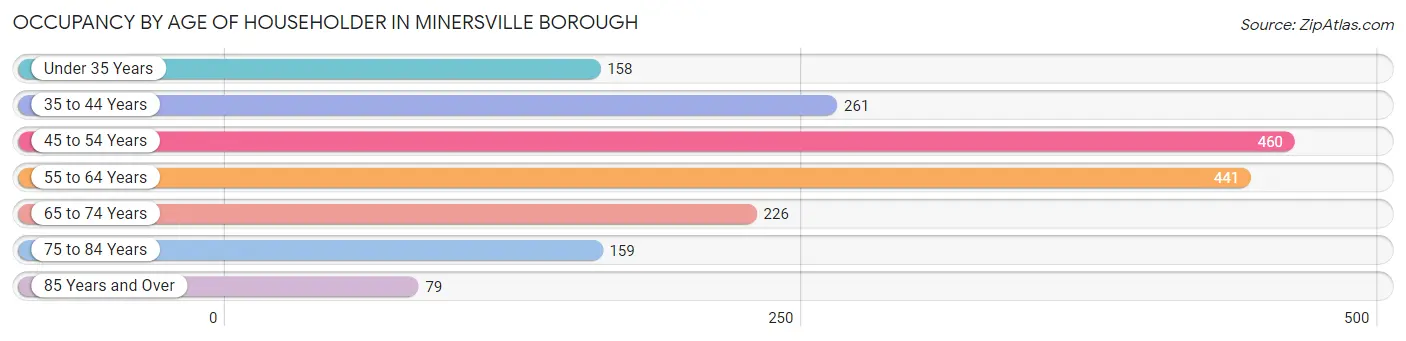
| Age Bracket | # Households | % Households |
| Under 35 Years | 158 | 8.9% |
| 35 to 44 Years | 261 | 14.6% |
| 45 to 54 Years | 460 | 25.8% |
| 55 to 64 Years | 441 | 24.7% |
| 65 to 74 Years | 226 | 12.7% |
| 75 to 84 Years | 159 | 8.9% |
| 85 Years and Over | 79 | 4.4% |
| Total | 1,784 | 100.0% |
Housing Finances in Minersville borough
Median Income by Occupancy in Minersville borough
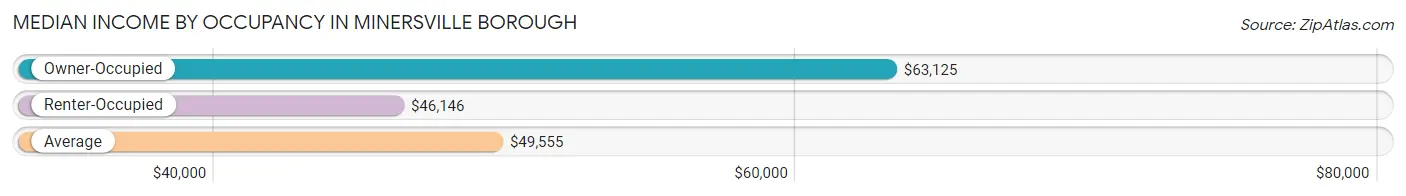
| Occupancy Type | # Households | Median Income |
| Owner-Occupied | 933 (52.3%) | $63,125 |
| Renter-Occupied | 851 (47.7%) | $46,146 |
| Average | 1,784 (100.0%) | $49,555 |
Occupancy by Householder Income Bracket in Minersville borough
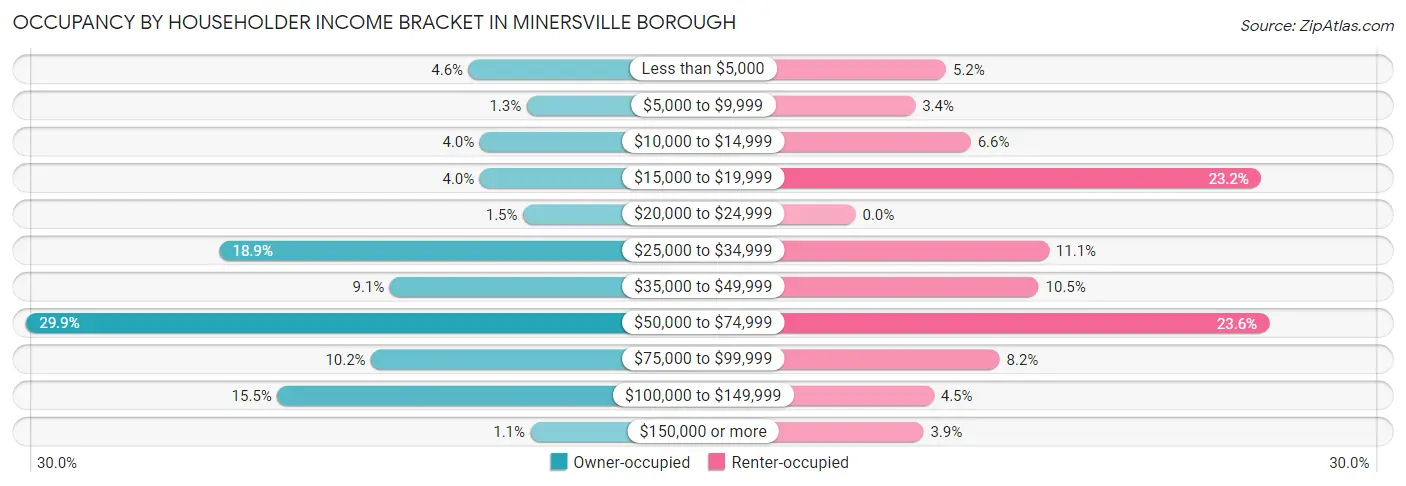
| Income Bracket | Owner-occupied | Renter-occupied |
| Less than $5,000 | 43 (4.6%) | 44 (5.2%) |
| $5,000 to $9,999 | 12 (1.3%) | 29 (3.4%) |
| $10,000 to $14,999 | 37 (4.0%) | 56 (6.6%) |
| $15,000 to $19,999 | 37 (4.0%) | 197 (23.2%) |
| $20,000 to $24,999 | 14 (1.5%) | 0 (0.0%) |
| $25,000 to $34,999 | 176 (18.9%) | 94 (11.1%) |
| $35,000 to $49,999 | 85 (9.1%) | 89 (10.5%) |
| $50,000 to $74,999 | 279 (29.9%) | 201 (23.6%) |
| $75,000 to $99,999 | 95 (10.2%) | 70 (8.2%) |
| $100,000 to $149,999 | 145 (15.5%) | 38 (4.5%) |
| $150,000 or more | 10 (1.1%) | 33 (3.9%) |
| Total | 933 (100.0%) | 851 (100.0%) |
Monthly Housing Cost Tiers in Minersville borough
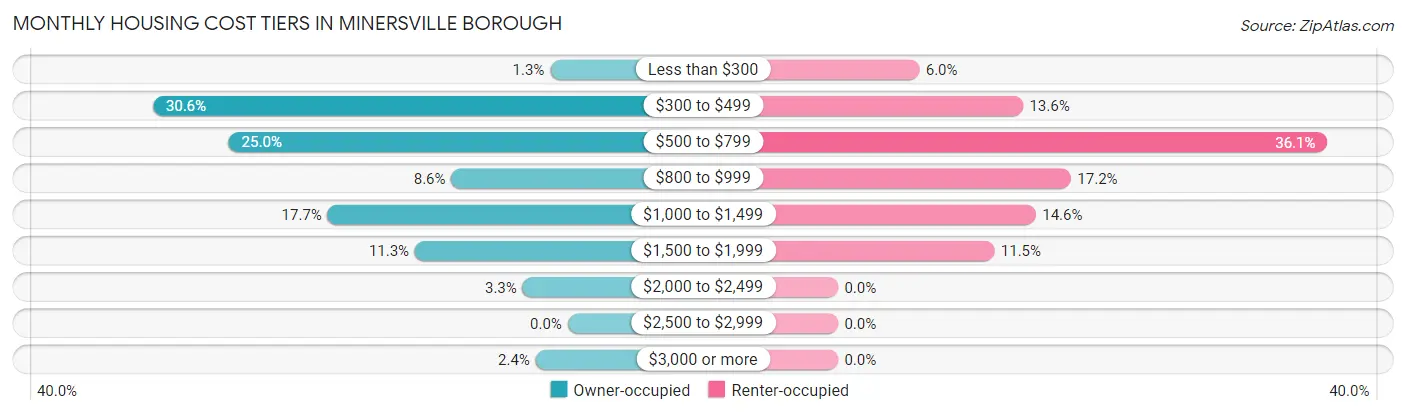
| Monthly Cost | Owner-occupied | Renter-occupied |
| Less than $300 | 12 (1.3%) | 51 (6.0%) |
| $300 to $499 | 285 (30.5%) | 116 (13.6%) |
| $500 to $799 | 233 (25.0%) | 307 (36.1%) |
| $800 to $999 | 80 (8.6%) | 146 (17.2%) |
| $1,000 to $1,499 | 165 (17.7%) | 124 (14.6%) |
| $1,500 to $1,999 | 105 (11.3%) | 98 (11.5%) |
| $2,000 to $2,499 | 31 (3.3%) | 0 (0.0%) |
| $2,500 to $2,999 | 0 (0.0%) | 0 (0.0%) |
| $3,000 or more | 22 (2.4%) | 0 (0.0%) |
| Total | 933 (100.0%) | 851 (100.0%) |
Physical Housing Characteristics in Minersville borough
Housing Structures in Minersville borough
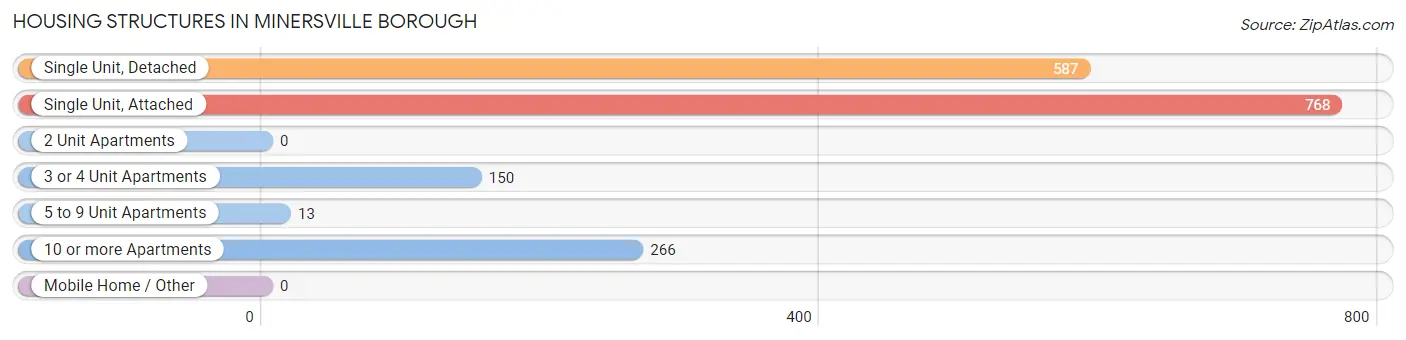
| Structure Type | # Housing Units | % Housing Units |
| Single Unit, Detached | 587 | 32.9% |
| Single Unit, Attached | 768 | 43.0% |
| 2 Unit Apartments | 0 | 0.0% |
| 3 or 4 Unit Apartments | 150 | 8.4% |
| 5 to 9 Unit Apartments | 13 | 0.7% |
| 10 or more Apartments | 266 | 14.9% |
| Mobile Home / Other | 0 | 0.0% |
| Total | 1,784 | 100.0% |
Housing Structures by Occupancy in Minersville borough
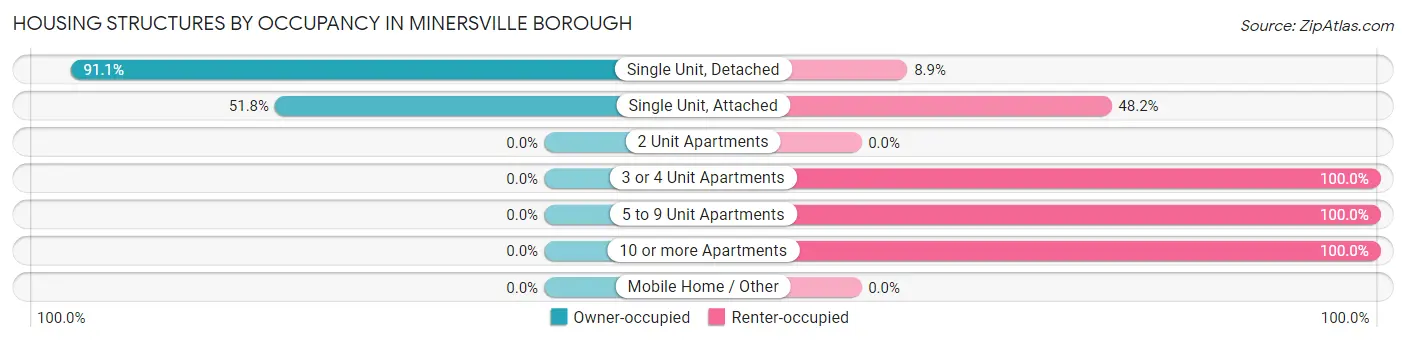
| Structure Type | Owner-occupied | Renter-occupied |
| Single Unit, Detached | 535 (91.1%) | 52 (8.9%) |
| Single Unit, Attached | 398 (51.8%) | 370 (48.2%) |
| 2 Unit Apartments | 0 (0.0%) | 0 (0.0%) |
| 3 or 4 Unit Apartments | 0 (0.0%) | 150 (100.0%) |
| 5 to 9 Unit Apartments | 0 (0.0%) | 13 (100.0%) |
| 10 or more Apartments | 0 (0.0%) | 266 (100.0%) |
| Mobile Home / Other | 0 (0.0%) | 0 (0.0%) |
| Total | 933 (52.3%) | 851 (47.7%) |
Housing Structures by Number of Rooms in Minersville borough
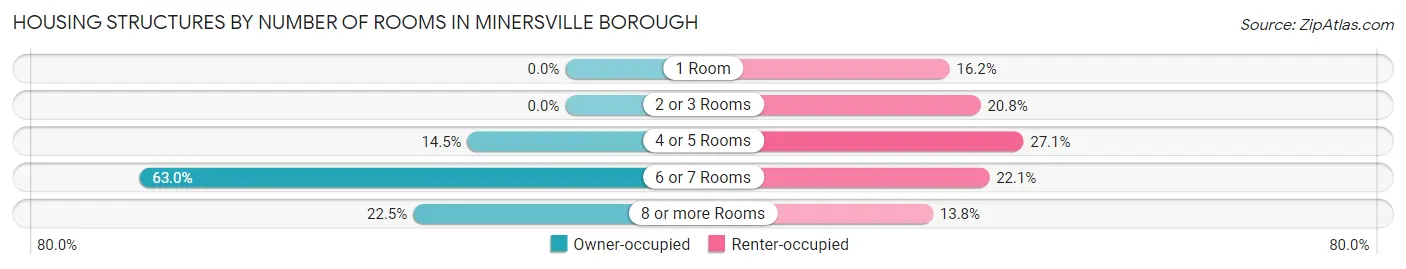
| Number of Rooms | Owner-occupied | Renter-occupied |
| 1 Room | 0 (0.0%) | 138 (16.2%) |
| 2 or 3 Rooms | 0 (0.0%) | 177 (20.8%) |
| 4 or 5 Rooms | 135 (14.5%) | 231 (27.1%) |
| 6 or 7 Rooms | 588 (63.0%) | 188 (22.1%) |
| 8 or more Rooms | 210 (22.5%) | 117 (13.8%) |
| Total | 933 (100.0%) | 851 (100.0%) |
Housing Structure by Heating Type in Minersville borough
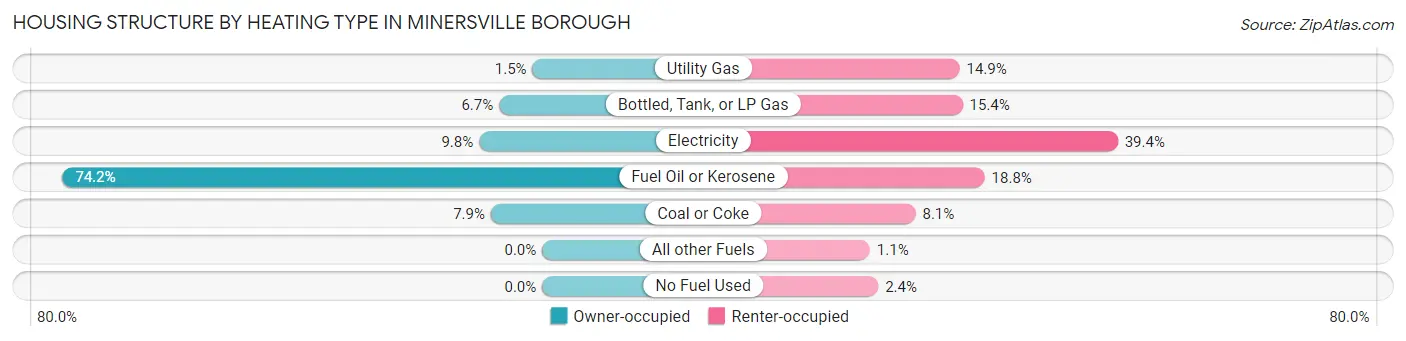
| Heating Type | Owner-occupied | Renter-occupied |
| Utility Gas | 14 (1.5%) | 127 (14.9%) |
| Bottled, Tank, or LP Gas | 62 (6.7%) | 131 (15.4%) |
| Electricity | 91 (9.8%) | 335 (39.4%) |
| Fuel Oil or Kerosene | 692 (74.2%) | 160 (18.8%) |
| Coal or Coke | 74 (7.9%) | 69 (8.1%) |
| All other Fuels | 0 (0.0%) | 9 (1.1%) |
| No Fuel Used | 0 (0.0%) | 20 (2.4%) |
| Total | 933 (100.0%) | 851 (100.0%) |
Household Vehicle Usage in Minersville borough
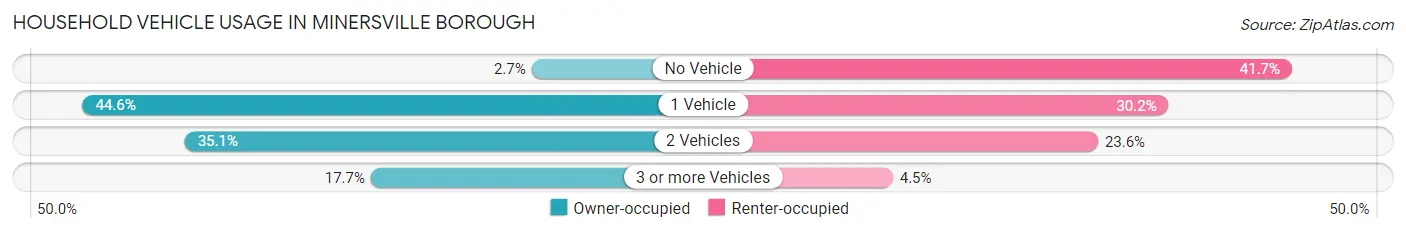
| Vehicles per Household | Owner-occupied | Renter-occupied |
| No Vehicle | 25 (2.7%) | 355 (41.7%) |
| 1 Vehicle | 416 (44.6%) | 257 (30.2%) |
| 2 Vehicles | 327 (35.0%) | 201 (23.6%) |
| 3 or more Vehicles | 165 (17.7%) | 38 (4.5%) |
| Total | 933 (100.0%) | 851 (100.0%) |
Real Estate & Mortgages in Minersville borough
Real Estate and Mortgage Overview in Minersville borough
| Characteristic | Without Mortgage | With Mortgage |
| Housing Units | 459 | 474 |
| Median Property Value | $65,300 | $159,300 |
| Median Household Income | $32,005 | $10 |
| Monthly Housing Costs | $504 | $22 |
| Real Estate Taxes | $1,332 | $0 |
Property Value by Mortgage Status in Minersville borough
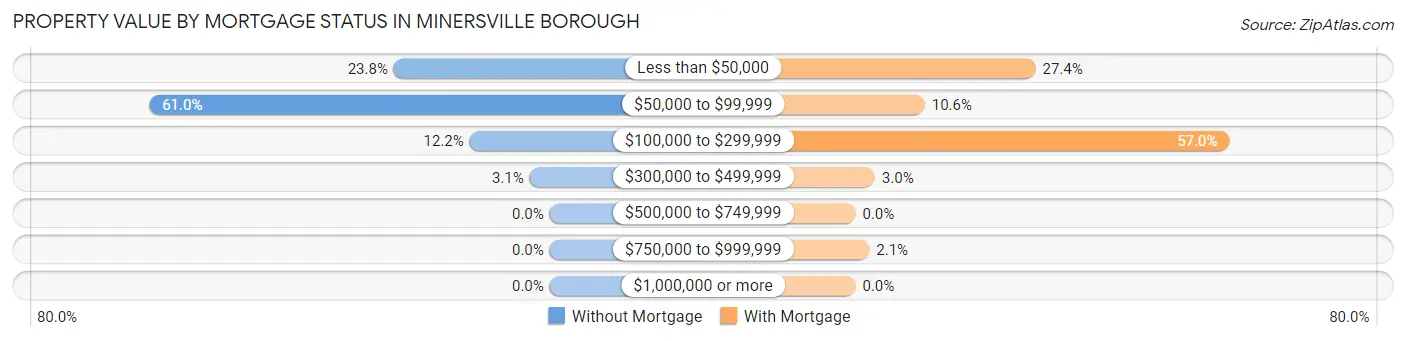
| Property Value | Without Mortgage | With Mortgage |
| Less than $50,000 | 109 (23.7%) | 130 (27.4%) |
| $50,000 to $99,999 | 280 (61.0%) | 50 (10.5%) |
| $100,000 to $299,999 | 56 (12.2%) | 270 (57.0%) |
| $300,000 to $499,999 | 14 (3.0%) | 14 (2.9%) |
| $500,000 to $749,999 | 0 (0.0%) | 0 (0.0%) |
| $750,000 to $999,999 | 0 (0.0%) | 10 (2.1%) |
| $1,000,000 or more | 0 (0.0%) | 0 (0.0%) |
| Total | 459 (100.0%) | 474 (100.0%) |
Household Income by Mortgage Status in Minersville borough
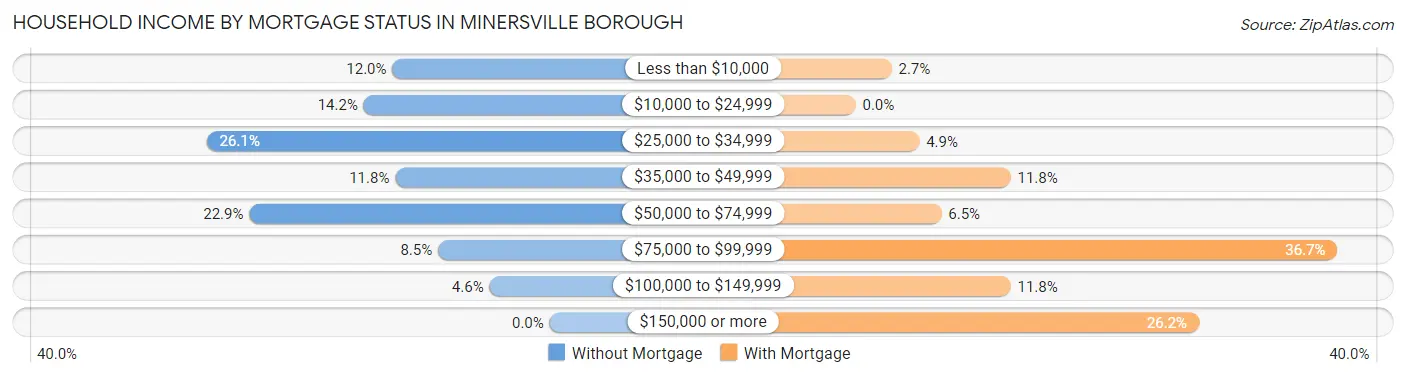
| Household Income | Without Mortgage | With Mortgage |
| Less than $10,000 | 55 (12.0%) | 13 (2.7%) |
| $10,000 to $24,999 | 65 (14.2%) | 0 (0.0%) |
| $25,000 to $34,999 | 120 (26.1%) | 23 (4.9%) |
| $35,000 to $49,999 | 54 (11.8%) | 56 (11.8%) |
| $50,000 to $74,999 | 105 (22.9%) | 31 (6.5%) |
| $75,000 to $99,999 | 39 (8.5%) | 174 (36.7%) |
| $100,000 to $149,999 | 21 (4.6%) | 56 (11.8%) |
| $150,000 or more | 0 (0.0%) | 124 (26.2%) |
| Total | 459 (100.0%) | 474 (100.0%) |
Property Value to Household Income Ratio in Minersville borough
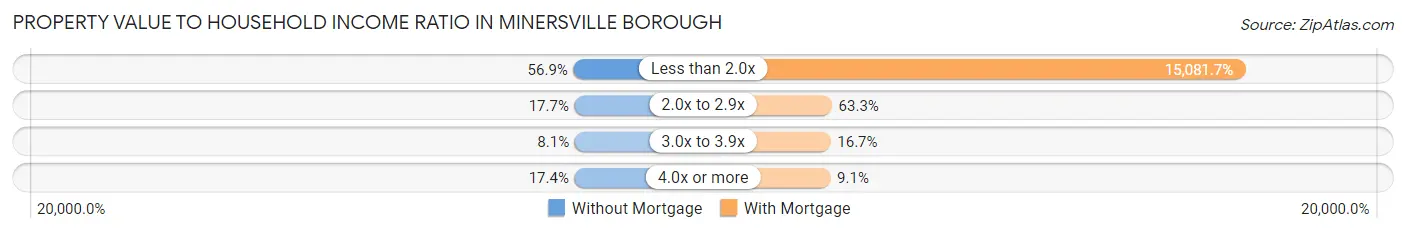
| Value-to-Income Ratio | Without Mortgage | With Mortgage |
| Less than 2.0x | 261 (56.9%) | 71,487 (15,081.6%) |
| 2.0x to 2.9x | 81 (17.6%) | 300 (63.3%) |
| 3.0x to 3.9x | 37 (8.1%) | 79 (16.7%) |
| 4.0x or more | 80 (17.4%) | 43 (9.1%) |
| Total | 459 (100.0%) | 474 (100.0%) |
Real Estate Taxes by Mortgage Status in Minersville borough
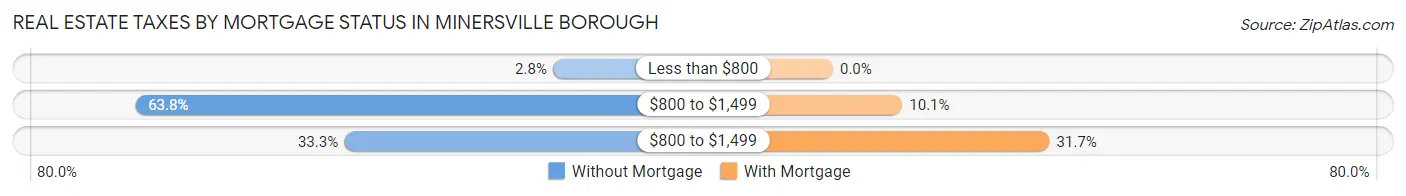
| Property Taxes | Without Mortgage | With Mortgage |
| Less than $800 | 13 (2.8%) | 0 (0.0%) |
| $800 to $1,499 | 293 (63.8%) | 48 (10.1%) |
| $800 to $1,499 | 153 (33.3%) | 150 (31.7%) |
| Total | 459 (100.0%) | 474 (100.0%) |
Health & Disability in Minersville borough
Health Insurance Coverage by Age in Minersville borough
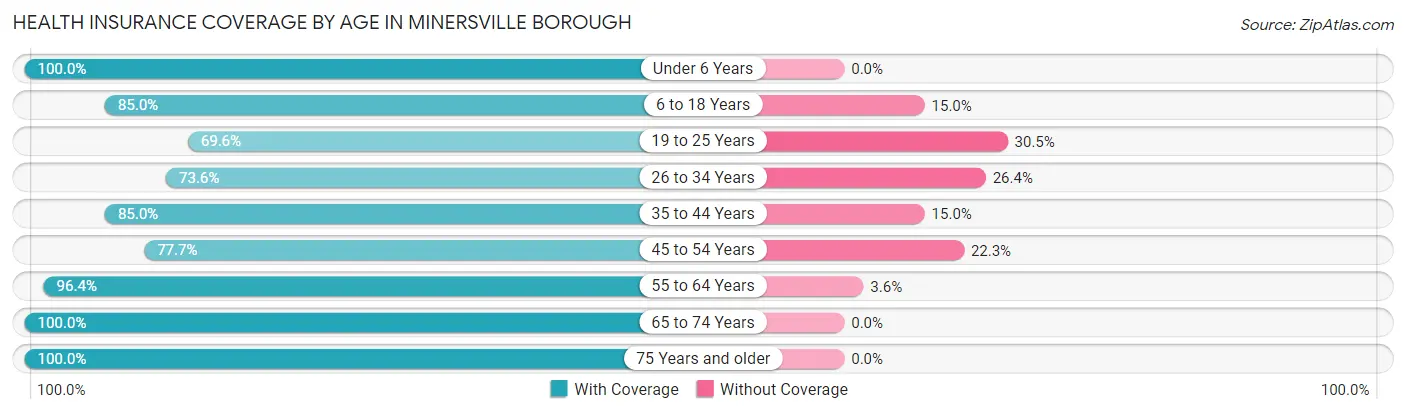
| Age Bracket | With Coverage | Without Coverage |
| Under 6 Years | 179 (100.0%) | 0 (0.0%) |
| 6 to 18 Years | 579 (85.0%) | 102 (15.0%) |
| 19 to 25 Years | 322 (69.6%) | 141 (30.4%) |
| 26 to 34 Years | 321 (73.6%) | 115 (26.4%) |
| 35 to 44 Years | 397 (85.0%) | 70 (15.0%) |
| 45 to 54 Years | 564 (77.7%) | 162 (22.3%) |
| 55 to 64 Years | 812 (96.4%) | 30 (3.6%) |
| 65 to 74 Years | 287 (100.0%) | 0 (0.0%) |
| 75 Years and older | 296 (100.0%) | 0 (0.0%) |
| Total | 3,757 (85.8%) | 620 (14.2%) |
Health Insurance Coverage by Citizenship Status in Minersville borough
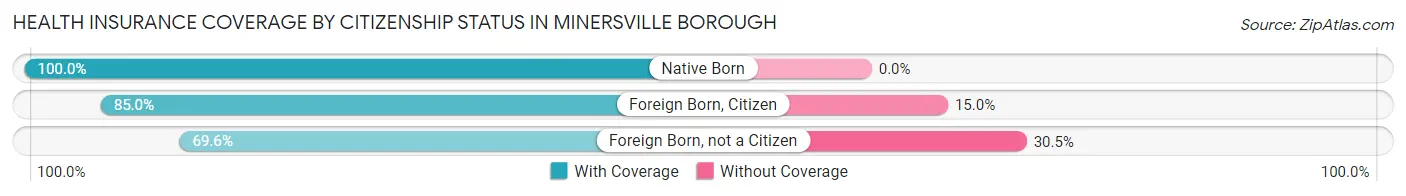
| Citizenship Status | With Coverage | Without Coverage |
| Native Born | 179 (100.0%) | 0 (0.0%) |
| Foreign Born, Citizen | 579 (85.0%) | 102 (15.0%) |
| Foreign Born, not a Citizen | 322 (69.6%) | 141 (30.4%) |
Health Insurance Coverage by Household Income in Minersville borough
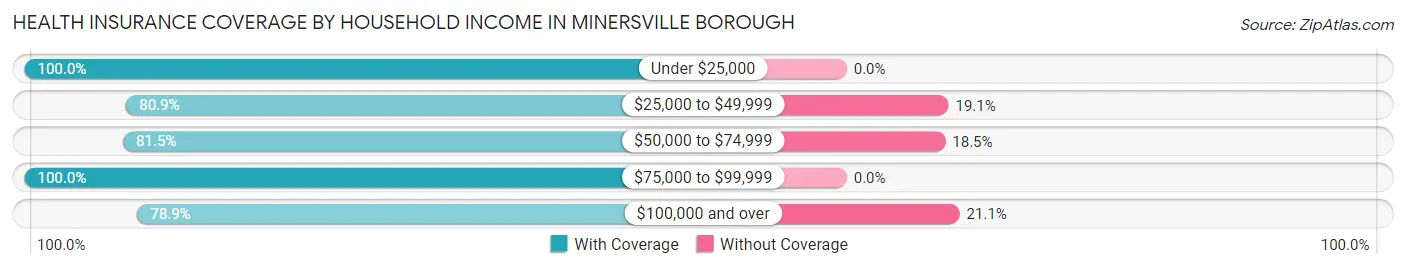
| Household Income | With Coverage | Without Coverage |
| Under $25,000 | 617 (100.0%) | 0 (0.0%) |
| $25,000 to $49,999 | 807 (80.9%) | 190 (19.1%) |
| $50,000 to $74,999 | 1,148 (81.5%) | 260 (18.5%) |
| $75,000 to $99,999 | 545 (100.0%) | 0 (0.0%) |
| $100,000 and over | 634 (78.9%) | 170 (21.1%) |
Public vs Private Health Insurance Coverage by Age in Minersville borough
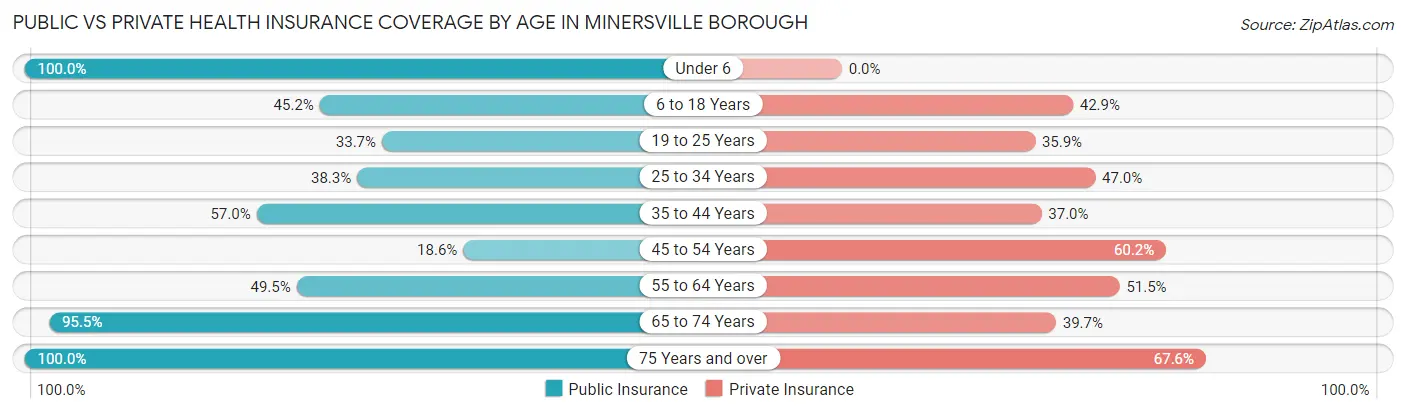
| Age Bracket | Public Insurance | Private Insurance |
| Under 6 | 179 (100.0%) | 0 (0.0%) |
| 6 to 18 Years | 308 (45.2%) | 292 (42.9%) |
| 19 to 25 Years | 156 (33.7%) | 166 (35.8%) |
| 25 to 34 Years | 167 (38.3%) | 205 (47.0%) |
| 35 to 44 Years | 266 (57.0%) | 173 (37.0%) |
| 45 to 54 Years | 135 (18.6%) | 437 (60.2%) |
| 55 to 64 Years | 417 (49.5%) | 434 (51.5%) |
| 65 to 74 Years | 274 (95.5%) | 114 (39.7%) |
| 75 Years and over | 296 (100.0%) | 200 (67.6%) |
| Total | 2,198 (50.2%) | 2,021 (46.2%) |
Disability Status by Sex by Age in Minersville borough
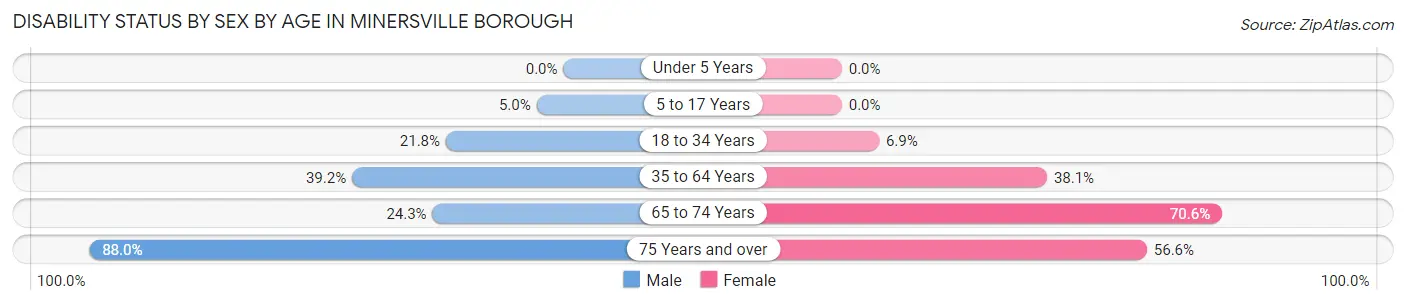
| Age Bracket | Male | Female |
| Under 5 Years | 0 (0.0%) | 0 (0.0%) |
| 5 to 17 Years | 15 (5.0%) | 0 (0.0%) |
| 18 to 34 Years | 123 (21.8%) | 28 (6.9%) |
| 35 to 64 Years | 410 (39.2%) | 377 (38.1%) |
| 65 to 74 Years | 26 (24.3%) | 127 (70.6%) |
| 75 Years and over | 88 (88.0%) | 111 (56.6%) |
Disability Class by Sex by Age in Minersville borough
Disability Class: Hearing Difficulty
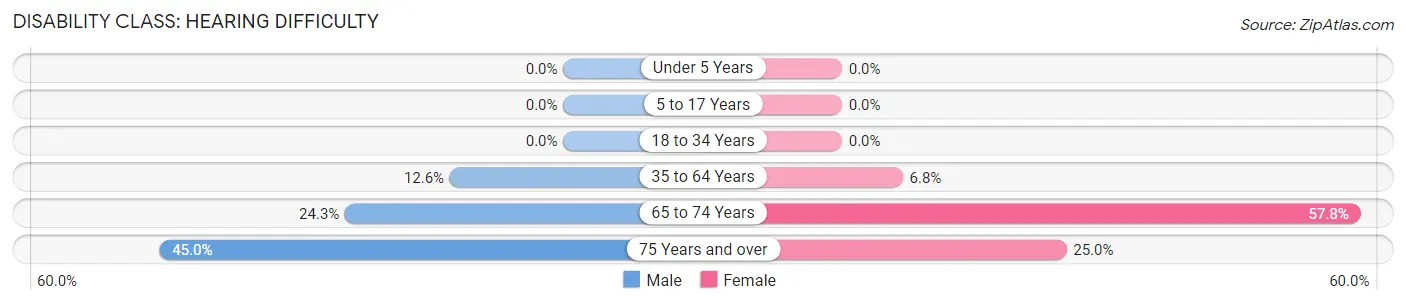
| Age Bracket | Male | Female |
| Under 5 Years | 0 (0.0%) | 0 (0.0%) |
| 5 to 17 Years | 0 (0.0%) | 0 (0.0%) |
| 18 to 34 Years | 0 (0.0%) | 0 (0.0%) |
| 35 to 64 Years | 132 (12.6%) | 67 (6.8%) |
| 65 to 74 Years | 26 (24.3%) | 104 (57.8%) |
| 75 Years and over | 45 (45.0%) | 49 (25.0%) |
Disability Class: Vision Difficulty
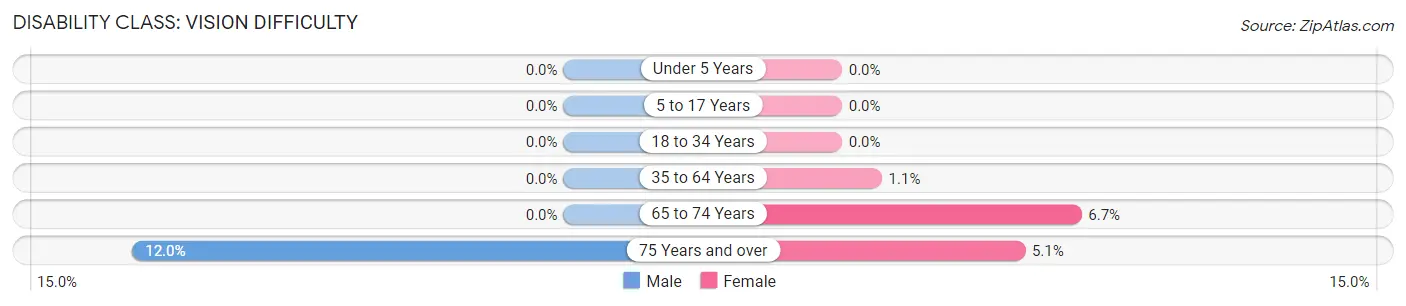
| Age Bracket | Male | Female |
| Under 5 Years | 0 (0.0%) | 0 (0.0%) |
| 5 to 17 Years | 0 (0.0%) | 0 (0.0%) |
| 18 to 34 Years | 0 (0.0%) | 0 (0.0%) |
| 35 to 64 Years | 0 (0.0%) | 11 (1.1%) |
| 65 to 74 Years | 0 (0.0%) | 12 (6.7%) |
| 75 Years and over | 12 (12.0%) | 10 (5.1%) |
Disability Class: Cognitive Difficulty
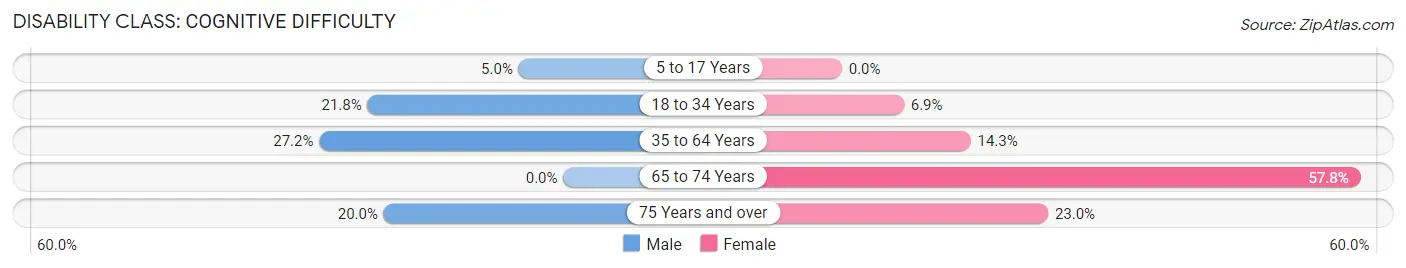
| Age Bracket | Male | Female |
| 5 to 17 Years | 15 (5.0%) | 0 (0.0%) |
| 18 to 34 Years | 123 (21.8%) | 28 (6.9%) |
| 35 to 64 Years | 284 (27.2%) | 142 (14.3%) |
| 65 to 74 Years | 0 (0.0%) | 104 (57.8%) |
| 75 Years and over | 20 (20.0%) | 45 (23.0%) |
Disability Class: Ambulatory Difficulty
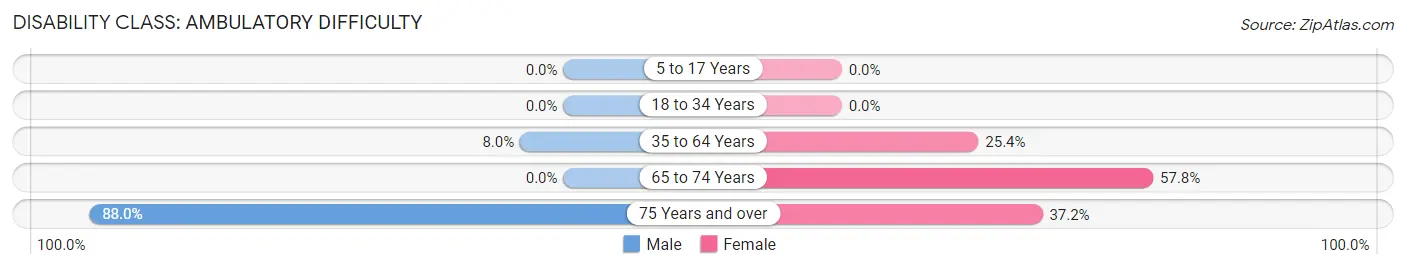
| Age Bracket | Male | Female |
| 5 to 17 Years | 0 (0.0%) | 0 (0.0%) |
| 18 to 34 Years | 0 (0.0%) | 0 (0.0%) |
| 35 to 64 Years | 84 (8.0%) | 251 (25.4%) |
| 65 to 74 Years | 0 (0.0%) | 104 (57.8%) |
| 75 Years and over | 88 (88.0%) | 73 (37.2%) |
Disability Class: Self-Care Difficulty
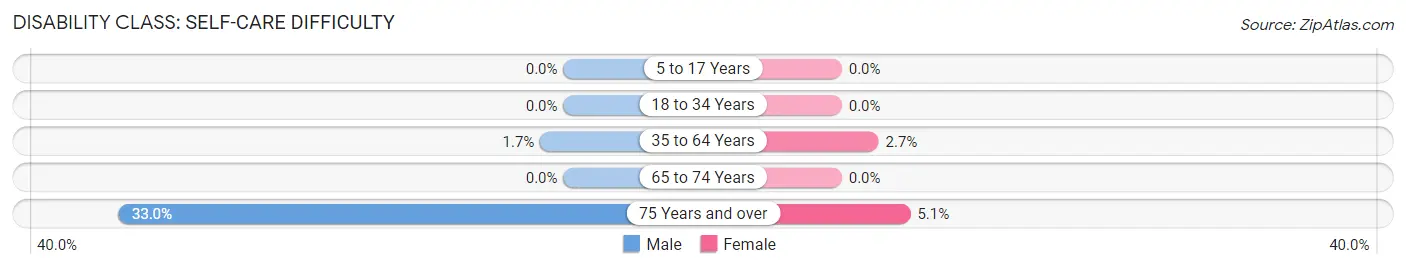
| Age Bracket | Male | Female |
| 5 to 17 Years | 0 (0.0%) | 0 (0.0%) |
| 18 to 34 Years | 0 (0.0%) | 0 (0.0%) |
| 35 to 64 Years | 18 (1.7%) | 27 (2.7%) |
| 65 to 74 Years | 0 (0.0%) | 0 (0.0%) |
| 75 Years and over | 33 (33.0%) | 10 (5.1%) |
Technology Access in Minersville borough
Computing Device Access in Minersville borough
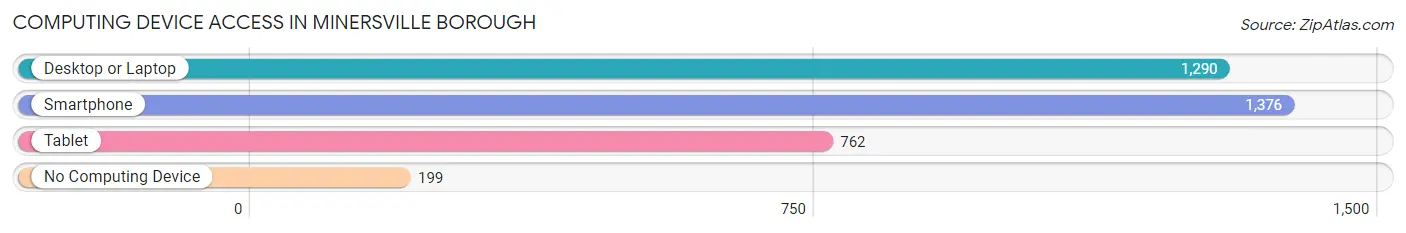
| Device Type | # Households | % Households |
| Desktop or Laptop | 1,290 | 72.3% |
| Smartphone | 1,376 | 77.1% |
| Tablet | 762 | 42.7% |
| No Computing Device | 199 | 11.2% |
| Total | 1,784 | 100.0% |
Internet Access in Minersville borough
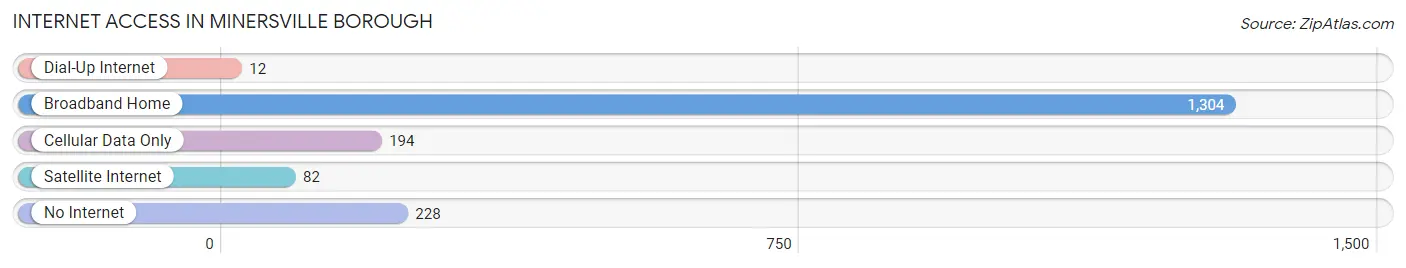
| Internet Type | # Households | % Households |
| Dial-Up Internet | 12 | 0.7% |
| Broadband Home | 1,304 | 73.1% |
| Cellular Data Only | 194 | 10.9% |
| Satellite Internet | 82 | 4.6% |
| No Internet | 228 | 12.8% |
| Total | 1,784 | 100.0% |
Minersville borough Summary
Minersville Borough is a small borough located in Schuylkill County, Pennsylvania. It is situated in the southern part of the county, approximately five miles south of Pottsville. The borough is surrounded by the townships of Branch, West Brunswick, and Schuylkill. The population of Minersville Borough was 3,719 at the 2010 census.
History
Minersville Borough was founded in 1831 by a group of miners who had come to the area to work in the coal mines. The town was originally known as “Minersville” and was incorporated as a borough in 1851. The town was named after the miners who had settled there.
The town grew rapidly in the late 19th century due to the coal mining industry. The town was home to several coal mines, including the Minersville Coal Company, the Minersville and Schuylkill Coal Company, and the Minersville and Pottsville Coal Company. The town also had several other industries, including a brickyard, a tannery, and a brewery.
The town was also home to several churches, including the First Presbyterian Church, the First Methodist Church, and the St. John’s Lutheran Church. The town also had several schools, including the Minersville High School, which was established in 1891.
Geography
Minersville Borough is located at 40°45'17" North, 76°14'45" West (40.754722, -76.245833). According to the United States Census Bureau, the borough has a total area of 0.7 square miles (1.8 km2), all of it land.
The borough is located in the southern part of Schuylkill County, approximately five miles south of Pottsville. The borough is surrounded by the townships of Branch, West Brunswick, and Schuylkill.
Economy
The economy of Minersville Borough is largely based on the coal mining industry. The town was home to several coal mines, including the Minersville Coal Company, the Minersville and Schuylkill Coal Company, and the Minersville and Pottsville Coal Company. The town also had several other industries, including a brickyard, a tannery, and a brewery.
The town is also home to several small businesses, including restaurants, retail stores, and service providers. The town also has several small manufacturing companies.
Demographics
As of the 2010 census, there were 3,719 people, 1,541 households, and 990 families residing in the borough. The population density was 5,093.3 people per square mile (1,967.2/km2). There were 1,717 housing units at an average density of 2,382.3 per square mile (917.7/km2). The racial makeup of the borough was 97.2% White, 0.7% African American, 0.2% Native American, 0.3% Asian, 0.2% from other races, and 1.4% from two or more races. Hispanic or Latino of any race were 1.2% of the population.
There were 1,541 households, out of which 28.2% had children under the age of 18 living with them, 44.2% were married couples living together, 14.2% had a female householder with no husband present, and 36.2% were non-families. 32.2% of all households were made up of individuals, and 16.2% had someone living alone who was 65 years of age or older. The average household size was 2.41 and the average family size was 3.03.
In the borough, the population was spread out, with 24.2% under the age of 18, 8.2% from 18 to 24, 27.2% from 25 to 44, 22.2% from 45 to 64, and 18.2% who were 65 years of age or older. The median age was 38 years. For every 100 females, there were 87.2 males. For every 100 females age 18 and over, there were 83.2 males.
The median income for a household in the borough was $30,938, and the median income for a family was $37,917. Males had a median income of $30,938 versus $21,250 for females. The per capita income for the borough was $15,945. About 10.2% of families and 12.2% of the population were below the poverty line, including 16.2% of those under age 18 and 8.2% of those age 65 or over.
Common Questions
What is Per Capita Income in Minersville borough?
Per Capita income in Minersville borough is $23,410.
What is the Median Family Income in Minersville borough?
Median Family Income in Minersville borough is $46,042.
What is the Median Household income in Minersville borough?
Median Household Income in Minersville borough is $49,555.
What is Income or Wage Gap in Minersville borough?
Income or Wage Gap in Minersville borough is 8.5%.
Women in Minersville borough earn 91.5 cents for every dollar earned by a man.
What is Inequality or Gini Index in Minersville borough?
Inequality or Gini Index in Minersville borough is 0.40.
What is the Total Population of Minersville borough?
Total Population of Minersville borough is 4,377.
What is the Total Male Population of Minersville borough?
Total Male Population of Minersville borough is 2,134.
What is the Total Female Population of Minersville borough?
Total Female Population of Minersville borough is 2,243.
What is the Ratio of Males per 100 Females in Minersville borough?
There are 95.14 Males per 100 Females in Minersville borough.
What is the Ratio of Females per 100 Males in Minersville borough?
There are 105.11 Females per 100 Males in Minersville borough.
What is the Median Population Age in Minersville borough?
Median Population Age in Minersville borough is 43.7 Years.
What is the Average Family Size in Minersville borough
Average Family Size in Minersville borough is 2.9 People.
What is the Average Household Size in Minersville borough
Average Household Size in Minersville borough is 2.5 People.
How Large is the Labor Force in Minersville borough?
There are 2,167 People in the Labor Forcein in Minersville borough.
What is the Percentage of People in the Labor Force in Minersville borough?
58.4% of People are in the Labor Force in Minersville borough.
What is the Unemployment Rate in Minersville borough?
Unemployment Rate in Minersville borough is 2.7%.