Sharpsburg borough, PA Map & Demographics
Sharpsburg borough Overview
$31,623
PER CAPITA INCOME
$66,667
AVG FAMILY INCOME
$44,571
AVG HOUSEHOLD INCOME
28.9%
WAGE / INCOME GAP [ % ]
71.1¢/ $1
WAGE / INCOME GAP [ $ ]
0.44
INEQUALITY / GINI INDEX
3,189
TOTAL POPULATION
1,566
MALE POPULATION
1,623
FEMALE POPULATION
96.49
MALES / 100 FEMALES
103.64
FEMALES / 100 MALES
36.3
MEDIAN AGE
3.0
AVG FAMILY SIZE
2.0
AVG HOUSEHOLD SIZE
1,556
LABOR FORCE [ PEOPLE ]
56.6%
PERCENT IN LABOR FORCE
10.8%
UNEMPLOYMENT RATE
Income in Sharpsburg borough
Income Overview in Sharpsburg borough
Per Capita Income in Sharpsburg borough is $31,623, while median incomes of families and households are $66,667 and $44,571 respectively.
| Characteristic | Number | Measure |
| Per Capita Income | 3,189 | $31,623 |
| Median Family Income | 692 | $66,667 |
| Mean Family Income | 692 | $82,474 |
| Median Household Income | 1,597 | $44,571 |
| Mean Household Income | 1,597 | $61,647 |
| Income Deficit | 692 | $0 |
| Wage / Income Gap (%) | 3,189 | 28.93% |
| Wage / Income Gap ($) | 3,189 | 71.07¢ per $1 |
| Gini / Inequality Index | 3,189 | 0.44 |
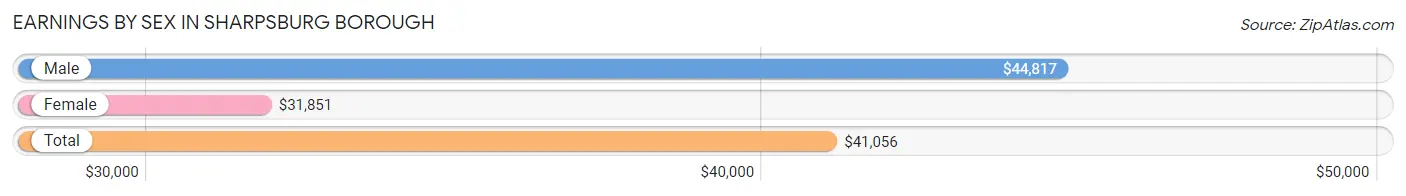
Earnings by Sex in Sharpsburg borough
Average Earnings in Sharpsburg borough are $41,056, $44,817 for men and $31,851 for women, a difference of 28.9%.
| Sex | Number | Average Earnings |
| Male | 803 (49.0%) | $44,817 |
| Female | 837 (51.0%) | $31,851 |
| Total | 1,640 (100.0%) | $41,056 |
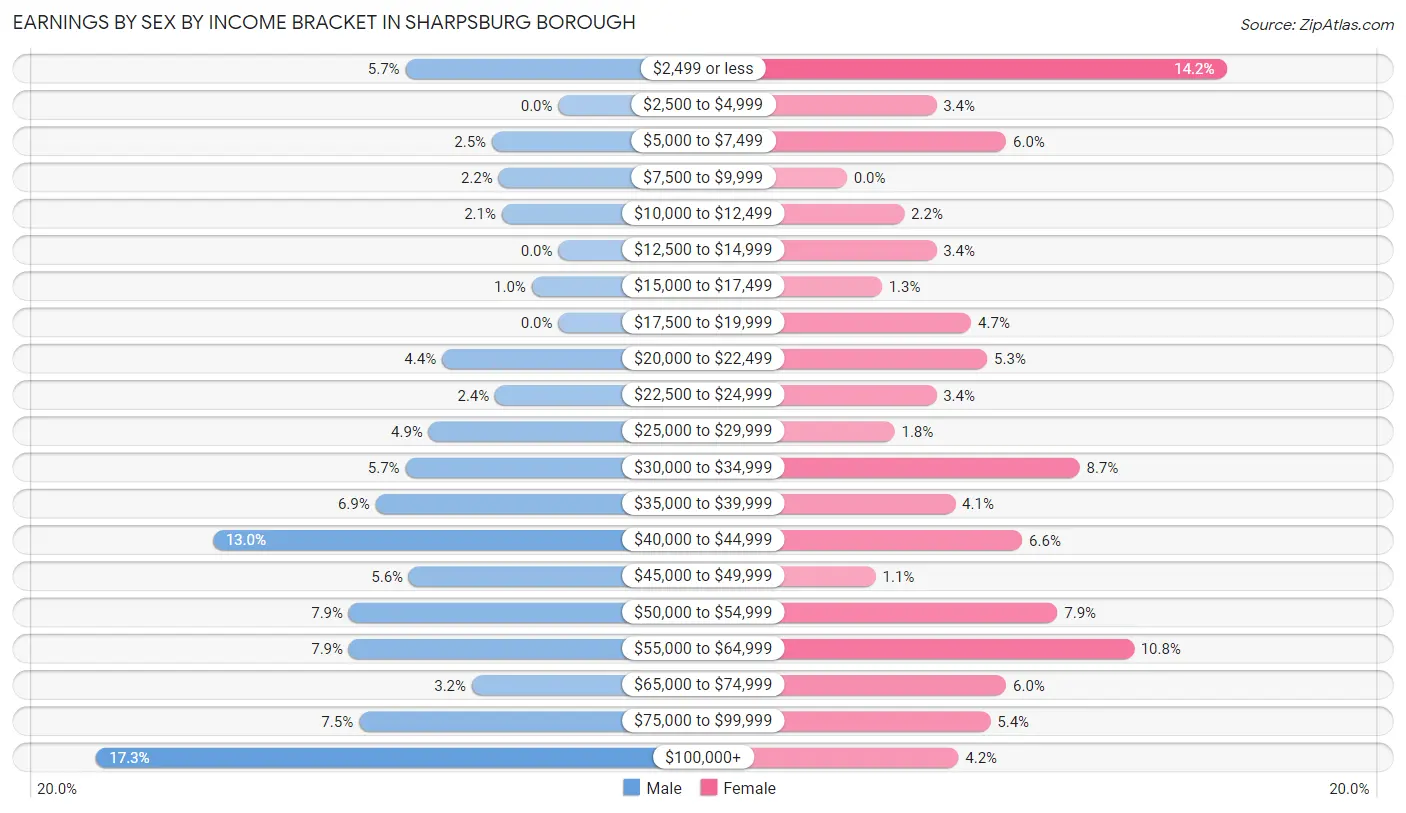
Earnings by Sex by Income Bracket in Sharpsburg borough
The most common earnings brackets in Sharpsburg borough are $100,000+ for men (139 | 17.3%) and $2,499 or less for women (119 | 14.2%).
| Income | Male | Female |
| $2,499 or less | 46 (5.7%) | 119 (14.2%) |
| $2,500 to $4,999 | 0 (0.0%) | 28 (3.4%) |
| $5,000 to $7,499 | 20 (2.5%) | 50 (6.0%) |
| $7,500 to $9,999 | 18 (2.2%) | 0 (0.0%) |
| $10,000 to $12,499 | 17 (2.1%) | 18 (2.1%) |
| $12,500 to $14,999 | 0 (0.0%) | 28 (3.4%) |
| $15,000 to $17,499 | 8 (1.0%) | 11 (1.3%) |
| $17,500 to $19,999 | 0 (0.0%) | 39 (4.7%) |
| $20,000 to $22,499 | 35 (4.4%) | 44 (5.3%) |
| $22,500 to $24,999 | 19 (2.4%) | 28 (3.4%) |
| $25,000 to $29,999 | 39 (4.9%) | 15 (1.8%) |
| $30,000 to $34,999 | 46 (5.7%) | 73 (8.7%) |
| $35,000 to $39,999 | 55 (6.9%) | 34 (4.1%) |
| $40,000 to $44,999 | 104 (13.0%) | 55 (6.6%) |
| $45,000 to $49,999 | 45 (5.6%) | 9 (1.1%) |
| $50,000 to $54,999 | 63 (7.9%) | 66 (7.9%) |
| $55,000 to $64,999 | 63 (7.9%) | 90 (10.7%) |
| $65,000 to $74,999 | 26 (3.2%) | 50 (6.0%) |
| $75,000 to $99,999 | 60 (7.5%) | 45 (5.4%) |
| $100,000+ | 139 (17.3%) | 35 (4.2%) |
| Total | 803 (100.0%) | 837 (100.0%) |
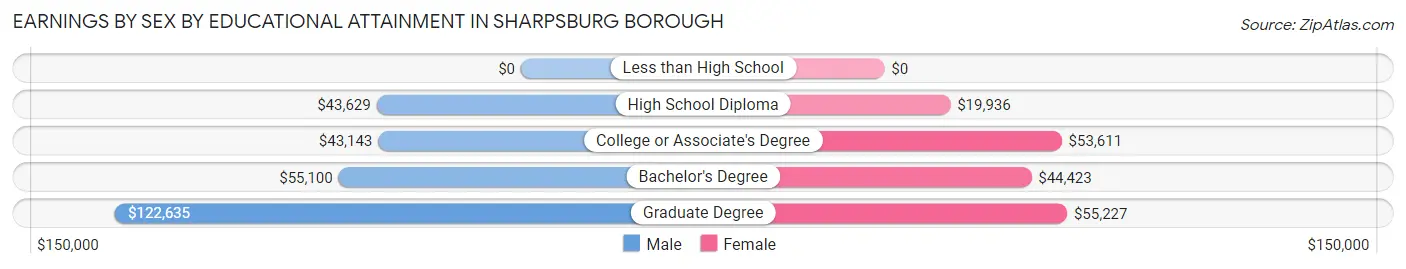
Earnings by Sex by Educational Attainment in Sharpsburg borough
Average earnings in Sharpsburg borough are $48,813 for men and $37,000 for women, a difference of 24.2%. Men with an educational attainment of graduate degree enjoy the highest average annual earnings of $122,635, while those with college or associate's degree education earn the least with $43,143. Women with an educational attainment of graduate degree earn the most with the average annual earnings of $55,227, while those with high school diploma education have the smallest earnings of $19,936.
| Educational Attainment | Male Income | Female Income |
| Less than High School | - | - |
| High School Diploma | $43,629 | $19,936 |
| College or Associate's Degree | $43,143 | $53,611 |
| Bachelor's Degree | $55,100 | $44,423 |
| Graduate Degree | $122,635 | $55,227 |
| Total | $48,813 | $37,000 |
Family Income in Sharpsburg borough
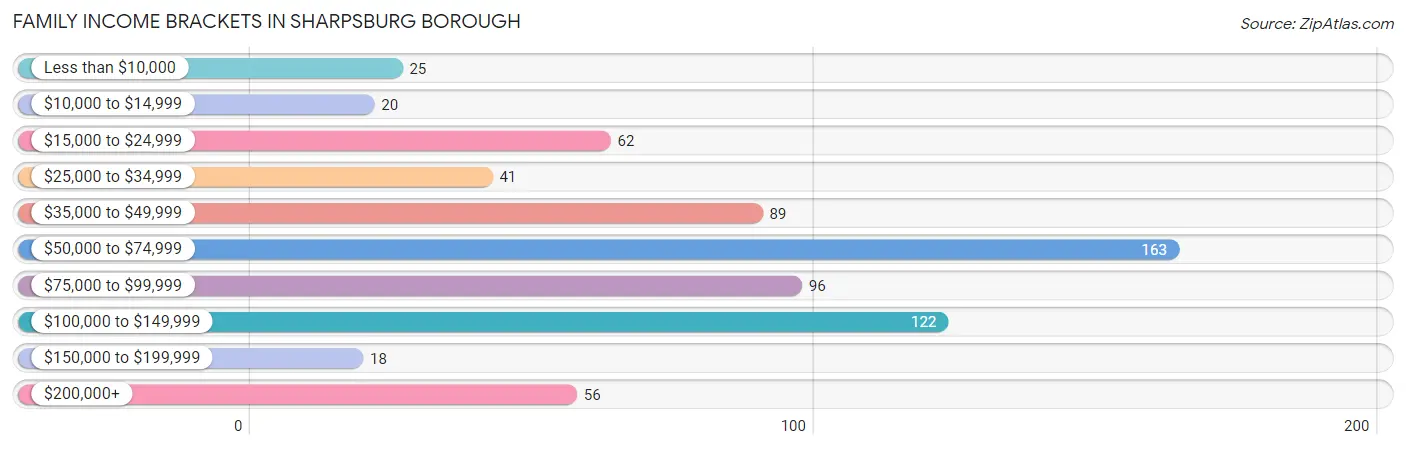
Family Income Brackets in Sharpsburg borough
According to the Sharpsburg borough family income data, there are 163 families falling into the $50,000 to $74,999 income range, which is the most common income bracket and makes up 23.5% of all families. Conversely, the $150,000 to $199,999 income bracket is the least frequent group with only 18 families (2.6%) belonging to this category.
| Income Bracket | # Families | % Families |
| Less than $10,000 | 25 | 3.6% |
| $10,000 to $14,999 | 20 | 2.9% |
| $15,000 to $24,999 | 62 | 9.0% |
| $25,000 to $34,999 | 41 | 5.9% |
| $35,000 to $49,999 | 89 | 12.9% |
| $50,000 to $74,999 | 163 | 23.6% |
| $75,000 to $99,999 | 96 | 13.9% |
| $100,000 to $149,999 | 122 | 17.6% |
| $150,000 to $199,999 | 18 | 2.6% |
| $200,000+ | 56 | 8.1% |
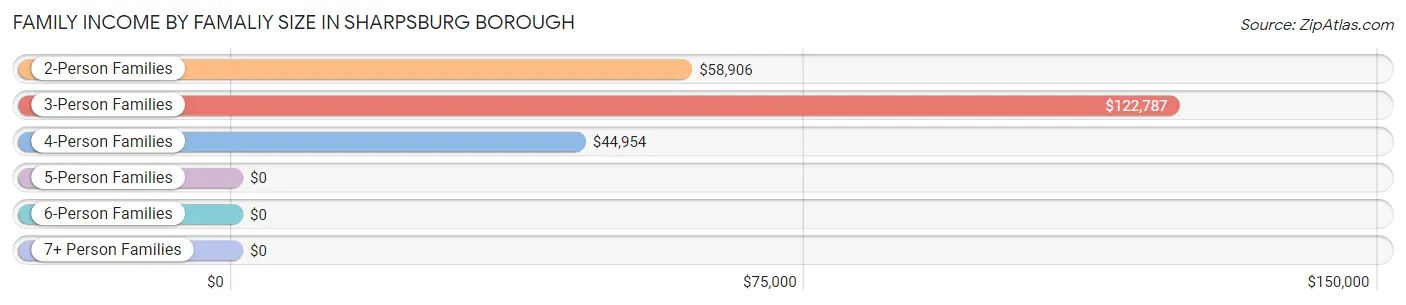
Family Income by Famaliy Size in Sharpsburg borough
3-person families (185 | 26.7%) account for the highest median family income in Sharpsburg borough with $122,787 per family, while 3-person families (185 | 26.7%) have the highest median income of $40,929 per family member.
| Income Bracket | # Families | Median Income |
| 2-Person Families | 366 (52.9%) | $58,906 |
| 3-Person Families | 185 (26.7%) | $122,787 |
| 4-Person Families | 83 (12.0%) | $44,954 |
| 5-Person Families | 22 (3.2%) | $0 |
| 6-Person Families | 0 (0.0%) | $0 |
| 7+ Person Families | 36 (5.2%) | $0 |
| Total | 692 (100.0%) | $66,667 |
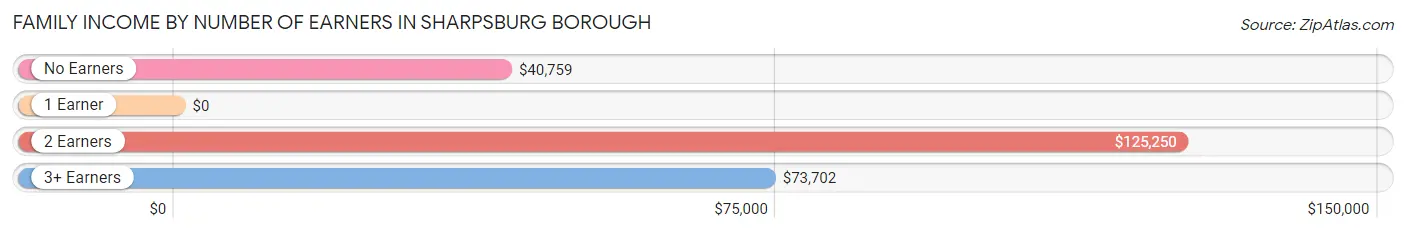
Family Income by Number of Earners in Sharpsburg borough
| Number of Earners | # Families | Median Income |
| No Earners | 127 (18.3%) | $40,759 |
| 1 Earner | 285 (41.2%) | $0 |
| 2 Earners | 211 (30.5%) | $125,250 |
| 3+ Earners | 69 (10.0%) | $73,702 |
| Total | 692 (100.0%) | $66,667 |
Household Income in Sharpsburg borough
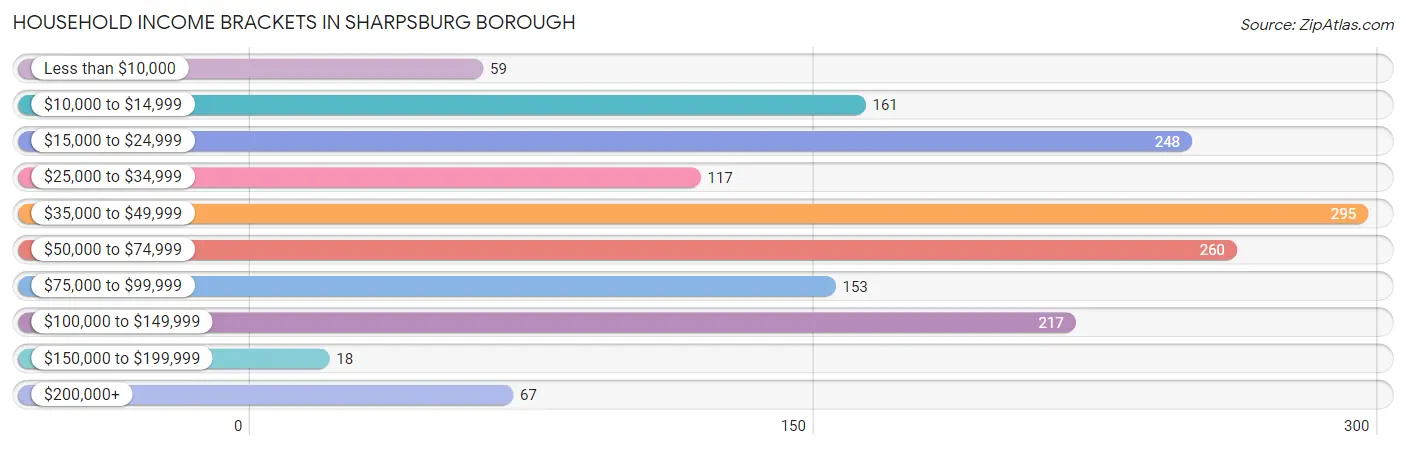
Household Income Brackets in Sharpsburg borough
With 295 households falling in the category, the $35,000 to $49,999 income range is the most frequent in Sharpsburg borough, accounting for 18.5% of all households. In contrast, only 18 households (1.1%) fall into the $150,000 to $199,999 income bracket, making it the least populous group.
| Income Bracket | # Households | % Households |
| Less than $10,000 | 59 | 3.7% |
| $10,000 to $14,999 | 161 | 10.1% |
| $15,000 to $24,999 | 248 | 15.5% |
| $25,000 to $34,999 | 117 | 7.3% |
| $35,000 to $49,999 | 295 | 18.5% |
| $50,000 to $74,999 | 260 | 16.3% |
| $75,000 to $99,999 | 153 | 9.6% |
| $100,000 to $149,999 | 217 | 13.6% |
| $150,000 to $199,999 | 18 | 1.1% |
| $200,000+ | 67 | 4.2% |
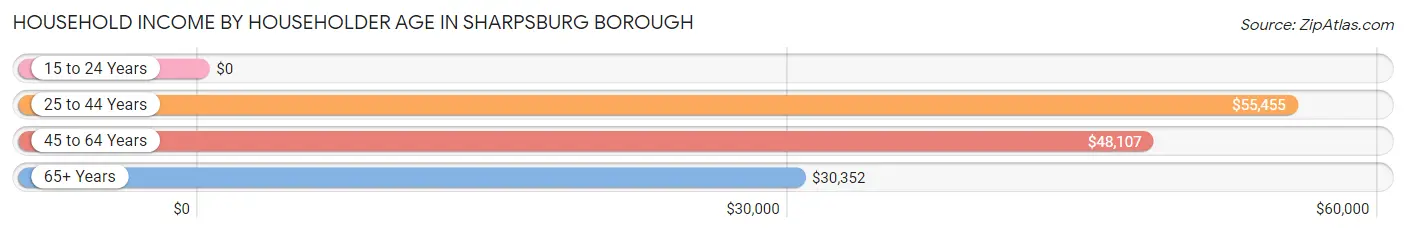
Household Income by Householder Age in Sharpsburg borough
The median household income in Sharpsburg borough is $44,571, with the highest median household income of $55,455 found in the 25 to 44 years age bracket for the primary householder. A total of 534 households (33.4%) fall into this category. Meanwhile, the 15 to 24 years age bracket for the primary householder has the lowest median household income of $0, with 61 households (3.8%) in this group.
| Income Bracket | # Households | Median Income |
| 15 to 24 Years | 61 (3.8%) | $0 |
| 25 to 44 Years | 534 (33.4%) | $55,455 |
| 45 to 64 Years | 589 (36.9%) | $48,107 |
| 65+ Years | 413 (25.9%) | $30,352 |
| Total | 1,597 (100.0%) | $44,571 |
Poverty in Sharpsburg borough
Income Below Poverty by Sex and Age in Sharpsburg borough
With 11.3% poverty level for males and 21.6% for females among the residents of Sharpsburg borough, 35 to 44 year old males and under 5 year old females are the most vulnerable to poverty, with 60 males (30.3%) and 26 females (55.3%) in their respective age groups living below the poverty level.
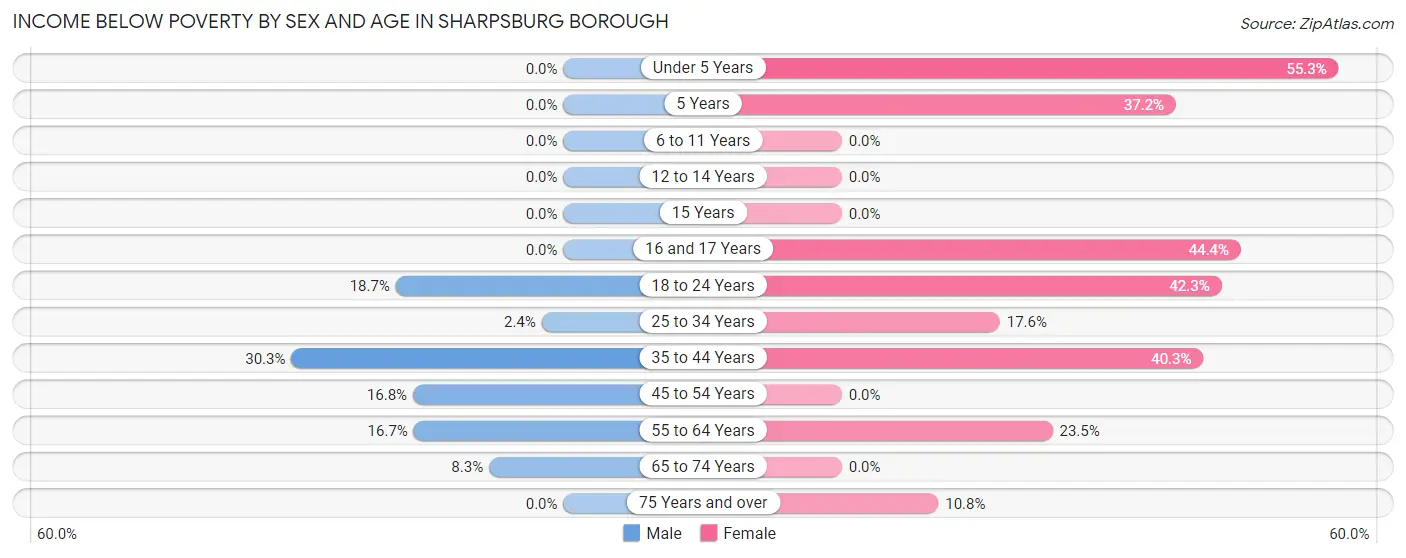
| Age Bracket | Male | Female |
| Under 5 Years | 0 (0.0%) | 26 (55.3%) |
| 5 Years | 0 (0.0%) | 16 (37.2%) |
| 6 to 11 Years | 0 (0.0%) | 0 (0.0%) |
| 12 to 14 Years | 0 (0.0%) | 0 (0.0%) |
| 15 Years | 0 (0.0%) | 0 (0.0%) |
| 16 and 17 Years | 0 (0.0%) | 52 (44.4%) |
| 18 to 24 Years | 14 (18.7%) | 63 (42.3%) |
| 25 to 34 Years | 7 (2.4%) | 60 (17.6%) |
| 35 to 44 Years | 60 (30.3%) | 62 (40.3%) |
| 45 to 54 Years | 32 (16.8%) | 0 (0.0%) |
| 55 to 64 Years | 50 (16.7%) | 50 (23.5%) |
| 65 to 74 Years | 14 (8.3%) | 0 (0.0%) |
| 75 Years and over | 0 (0.0%) | 20 (10.7%) |
| Total | 177 (11.3%) | 349 (21.6%) |
Income Above Poverty by Sex and Age in Sharpsburg borough
According to the poverty statistics in Sharpsburg borough, males aged under 5 years and females aged 6 to 11 years are the age groups that are most secure financially, with 100.0% of males and 100.0% of females in these age groups living above the poverty line.
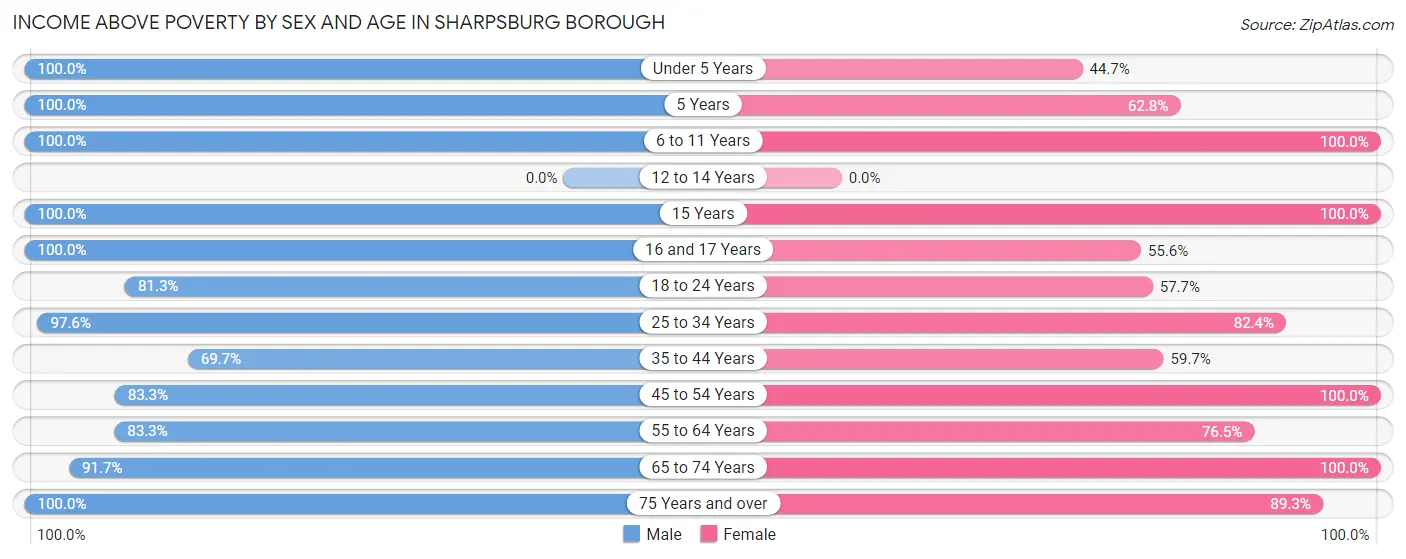
| Age Bracket | Male | Female |
| Under 5 Years | 34 (100.0%) | 21 (44.7%) |
| 5 Years | 8 (100.0%) | 27 (62.8%) |
| 6 to 11 Years | 87 (100.0%) | 78 (100.0%) |
| 12 to 14 Years | 0 (0.0%) | 0 (0.0%) |
| 15 Years | 96 (100.0%) | 36 (100.0%) |
| 16 and 17 Years | 90 (100.0%) | 65 (55.6%) |
| 18 to 24 Years | 61 (81.3%) | 86 (57.7%) |
| 25 to 34 Years | 282 (97.6%) | 281 (82.4%) |
| 35 to 44 Years | 138 (69.7%) | 92 (59.7%) |
| 45 to 54 Years | 159 (83.3%) | 126 (100.0%) |
| 55 to 64 Years | 250 (83.3%) | 163 (76.5%) |
| 65 to 74 Years | 155 (91.7%) | 122 (100.0%) |
| 75 Years and over | 29 (100.0%) | 166 (89.2%) |
| Total | 1,389 (88.7%) | 1,263 (78.3%) |
Income Below Poverty Among Married-Couple Families in Sharpsburg borough
The poverty statistics for married-couple families in Sharpsburg borough show that 10.8% or 40 of the total 370 families live below the poverty line. Families with 1 or 2 children have the highest poverty rate of 40.8%, comprising of 40 families. On the other hand, families with no children have the lowest poverty rate of 0.0%, which includes 0 families.
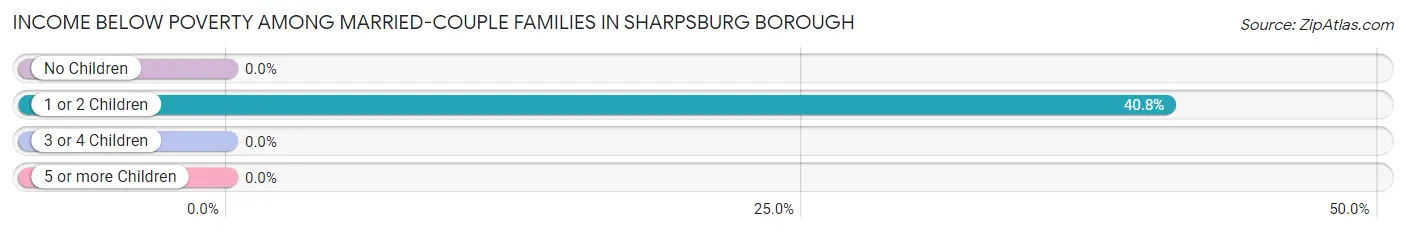
| Children | Above Poverty | Below Poverty |
| No Children | 224 (100.0%) | 0 (0.0%) |
| 1 or 2 Children | 58 (59.2%) | 40 (40.8%) |
| 3 or 4 Children | 48 (100.0%) | 0 (0.0%) |
| 5 or more Children | 0 (0.0%) | 0 (0.0%) |
| Total | 330 (89.2%) | 40 (10.8%) |
Income Below Poverty Among Single-Parent Households in Sharpsburg borough
According to the poverty data in Sharpsburg borough, 10.4% or 16 single-father households and 26.2% or 44 single-mother households are living below the poverty line. Among single-father households, those with no children have the highest poverty rate, with 16 households (23.2%) experiencing poverty. Likewise, among single-mother households, those with 1 or 2 children have the highest poverty rate, with 33 households (29.2%) falling below the poverty line.
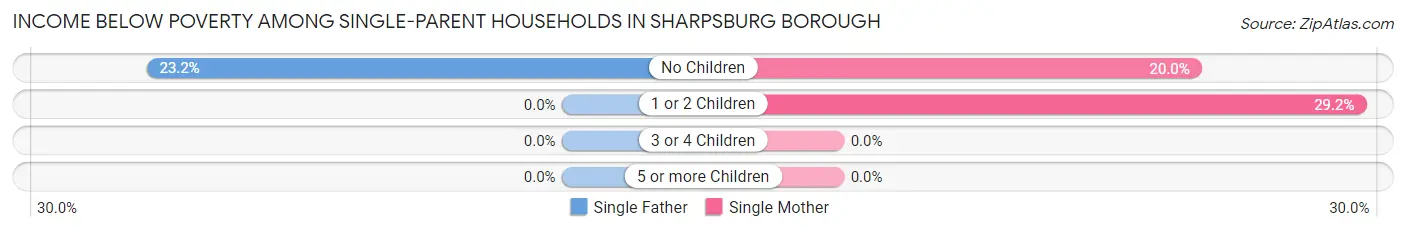
| Children | Single Father | Single Mother |
| No Children | 16 (23.2%) | 11 (20.0%) |
| 1 or 2 Children | 0 (0.0%) | 33 (29.2%) |
| 3 or 4 Children | 0 (0.0%) | 0 (0.0%) |
| 5 or more Children | 0 (0.0%) | 0 (0.0%) |
| Total | 16 (10.4%) | 44 (26.2%) |
Income Below Poverty Among Married-Couple vs Single-Parent Households in Sharpsburg borough
The poverty data for Sharpsburg borough shows that 40 of the married-couple family households (10.8%) and 60 of the single-parent households (18.6%) are living below the poverty level. Within the married-couple family households, those with 1 or 2 children have the highest poverty rate, with 40 households (40.8%) falling below the poverty line. Among the single-parent households, those with no children have the highest poverty rate, with 27 household (21.8%) living below poverty.
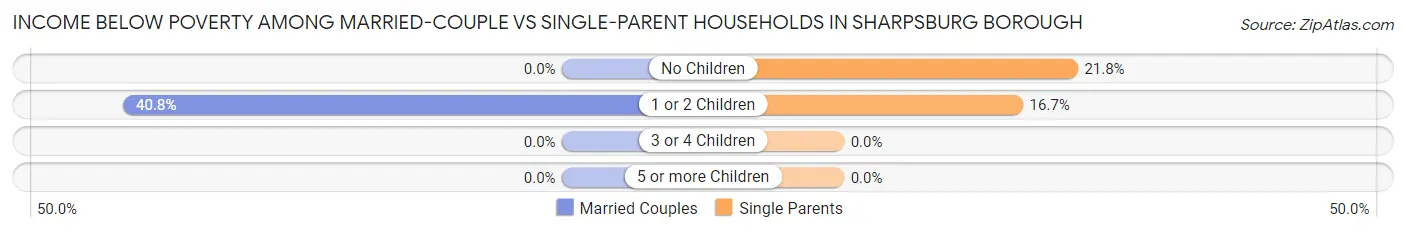
| Children | Married-Couple Families | Single-Parent Households |
| No Children | 0 (0.0%) | 27 (21.8%) |
| 1 or 2 Children | 40 (40.8%) | 33 (16.7%) |
| 3 or 4 Children | 0 (0.0%) | 0 (0.0%) |
| 5 or more Children | 0 (0.0%) | 0 (0.0%) |
| Total | 40 (10.8%) | 60 (18.6%) |
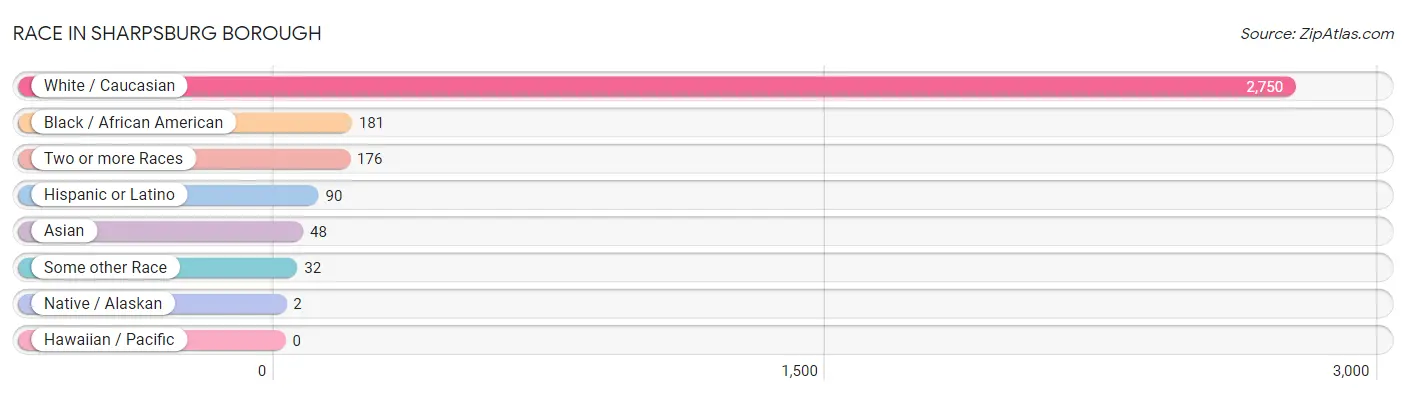
Race in Sharpsburg borough
The most populous races in Sharpsburg borough are White / Caucasian (2,750 | 86.2%), Black / African American (181 | 5.7%), and Two or more Races (176 | 5.5%).
| Race | # Population | % Population |
| Asian | 48 | 1.5% |
| Black / African American | 181 | 5.7% |
| Hawaiian / Pacific | 0 | 0.0% |
| Hispanic or Latino | 90 | 2.8% |
| Native / Alaskan | 2 | 0.1% |
| White / Caucasian | 2,750 | 86.2% |
| Two or more Races | 176 | 5.5% |
| Some other Race | 32 | 1.0% |
| Total | 3,189 | 100.0% |
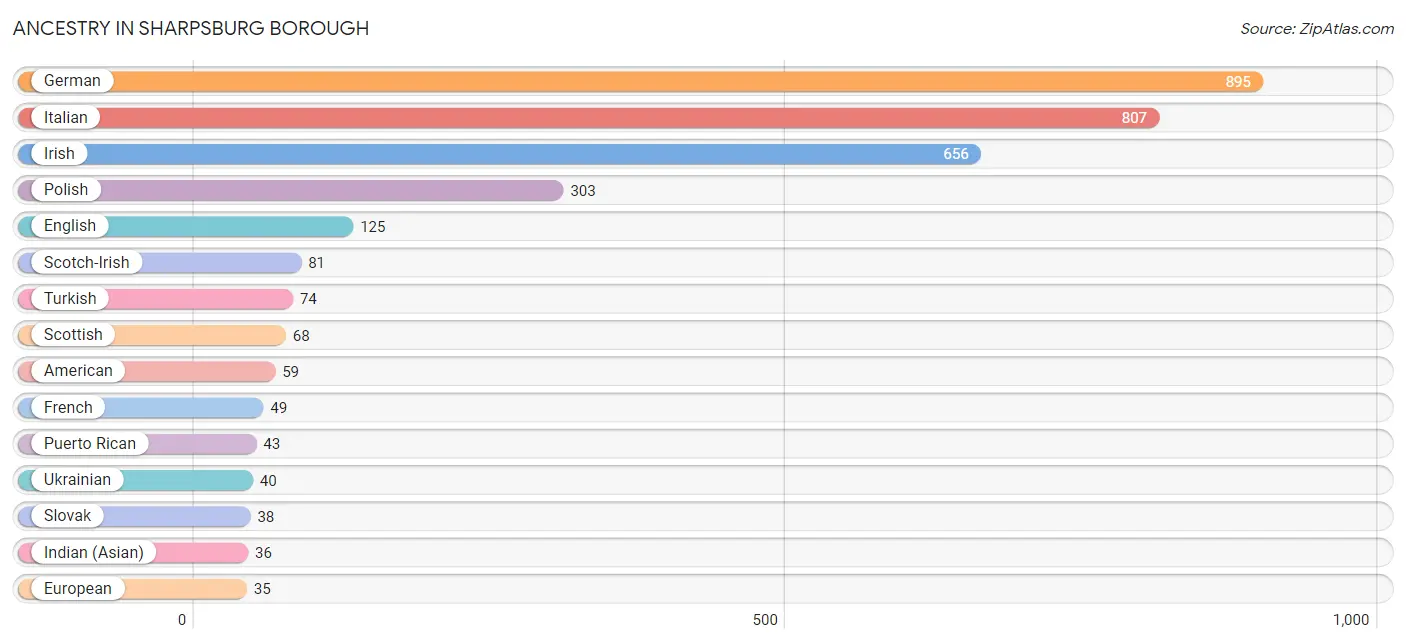
Ancestry in Sharpsburg borough
The most populous ancestries reported in Sharpsburg borough are German (895 | 28.1%), Italian (807 | 25.3%), Irish (656 | 20.6%), Polish (303 | 9.5%), and English (125 | 3.9%), together accounting for 87.4% of all Sharpsburg borough residents.
| Ancestry | # Population | % Population |
| African | 1 | 0.0% |
| American | 59 | 1.8% |
| Blackfeet | 4 | 0.1% |
| British | 8 | 0.3% |
| Burmese | 6 | 0.2% |
| Central American | 8 | 0.3% |
| Cherokee | 4 | 0.1% |
| Croatian | 21 | 0.7% |
| Czech | 4 | 0.1% |
| Czechoslovakian | 11 | 0.3% |
| Danish | 9 | 0.3% |
| Dutch | 9 | 0.3% |
| English | 125 | 3.9% |
| European | 35 | 1.1% |
| French | 49 | 1.5% |
| French Canadian | 9 | 0.3% |
| German | 895 | 28.1% |
| Guatemalan | 8 | 0.3% |
| Hungarian | 29 | 0.9% |
| Indian (Asian) | 36 | 1.1% |
| Irish | 656 | 20.6% |
| Iroquois | 23 | 0.7% |
| Italian | 807 | 25.3% |
| Lumbee | 2 | 0.1% |
| Pennsylvania German | 4 | 0.1% |
| Polish | 303 | 9.5% |
| Puerto Rican | 43 | 1.3% |
| Scandinavian | 35 | 1.1% |
| Scotch-Irish | 81 | 2.5% |
| Scottish | 68 | 2.1% |
| Serbian | 16 | 0.5% |
| Slovak | 38 | 1.2% |
| Slovene | 26 | 0.8% |
| South American | 21 | 0.7% |
| Spaniard | 18 | 0.6% |
| Sri Lankan | 6 | 0.2% |
| Subsaharan African | 1 | 0.0% |
| Trinidadian and Tobagonian | 27 | 0.9% |
| Turkish | 74 | 2.3% |
| Ukrainian | 40 | 1.3% |
| Venezuelan | 21 | 0.7% |
| Welsh | 13 | 0.4% | View All 42 Rows |
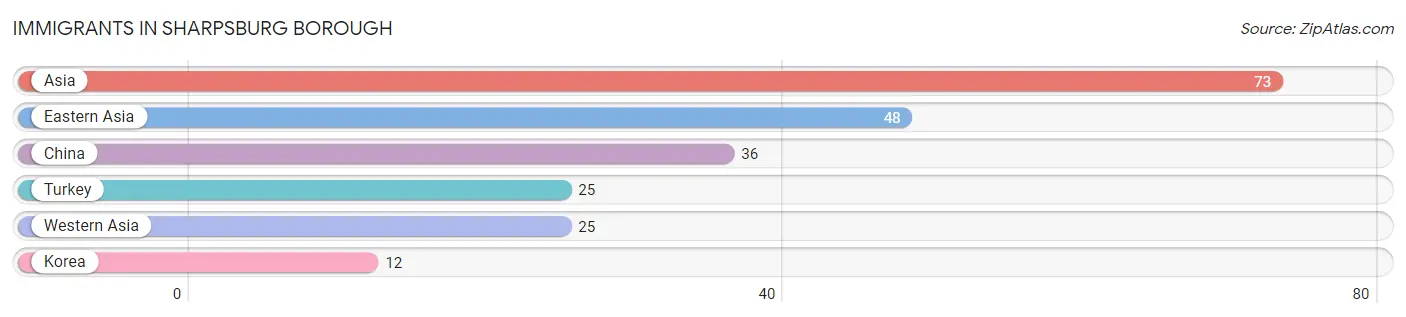
Immigrants in Sharpsburg borough
The most numerous immigrant groups reported in Sharpsburg borough came from Asia (73 | 2.3%), Eastern Asia (48 | 1.5%), China (36 | 1.1%), Turkey (25 | 0.8%), and Western Asia (25 | 0.8%), together accounting for 6.5% of all Sharpsburg borough residents.
| Immigration Origin | # Population | % Population |
| Asia | 73 | 2.3% |
| China | 36 | 1.1% |
| Eastern Asia | 48 | 1.5% |
| Korea | 12 | 0.4% |
| Turkey | 25 | 0.8% |
| Western Asia | 25 | 0.8% | View All 6 Rows |
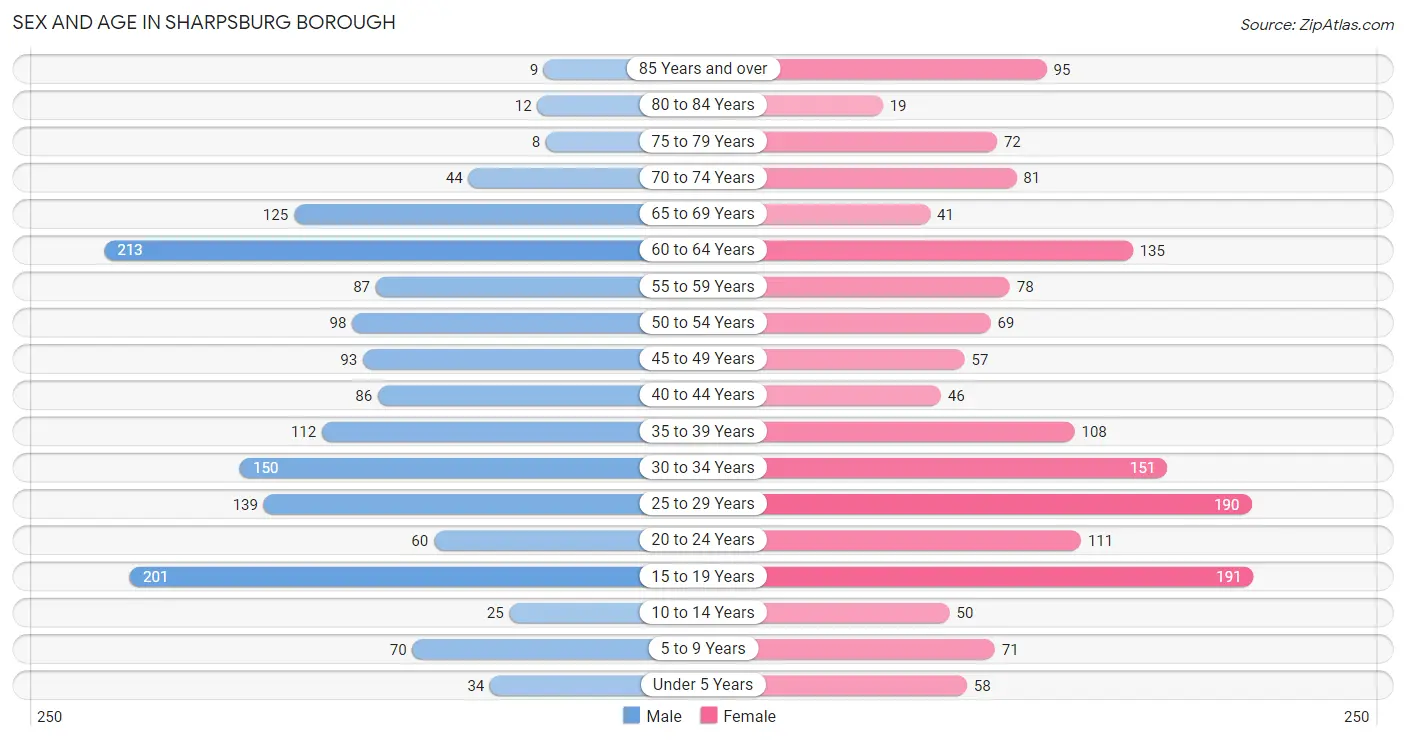
Sex and Age in Sharpsburg borough
Sex and Age in Sharpsburg borough
The most populous age groups in Sharpsburg borough are 60 to 64 Years (213 | 13.6%) for men and 15 to 19 Years (191 | 11.8%) for women.
| Age Bracket | Male | Female |
| Under 5 Years | 34 (2.2%) | 58 (3.6%) |
| 5 to 9 Years | 70 (4.5%) | 71 (4.4%) |
| 10 to 14 Years | 25 (1.6%) | 50 (3.1%) |
| 15 to 19 Years | 201 (12.8%) | 191 (11.8%) |
| 20 to 24 Years | 60 (3.8%) | 111 (6.8%) |
| 25 to 29 Years | 139 (8.9%) | 190 (11.7%) |
| 30 to 34 Years | 150 (9.6%) | 151 (9.3%) |
| 35 to 39 Years | 112 (7.1%) | 108 (6.7%) |
| 40 to 44 Years | 86 (5.5%) | 46 (2.8%) |
| 45 to 49 Years | 93 (5.9%) | 57 (3.5%) |
| 50 to 54 Years | 98 (6.3%) | 69 (4.3%) |
| 55 to 59 Years | 87 (5.6%) | 78 (4.8%) |
| 60 to 64 Years | 213 (13.6%) | 135 (8.3%) |
| 65 to 69 Years | 125 (8.0%) | 41 (2.5%) |
| 70 to 74 Years | 44 (2.8%) | 81 (5.0%) |
| 75 to 79 Years | 8 (0.5%) | 72 (4.4%) |
| 80 to 84 Years | 12 (0.8%) | 19 (1.2%) |
| 85 Years and over | 9 (0.6%) | 95 (5.9%) |
| Total | 1,566 (100.0%) | 1,623 (100.0%) |
Families and Households in Sharpsburg borough
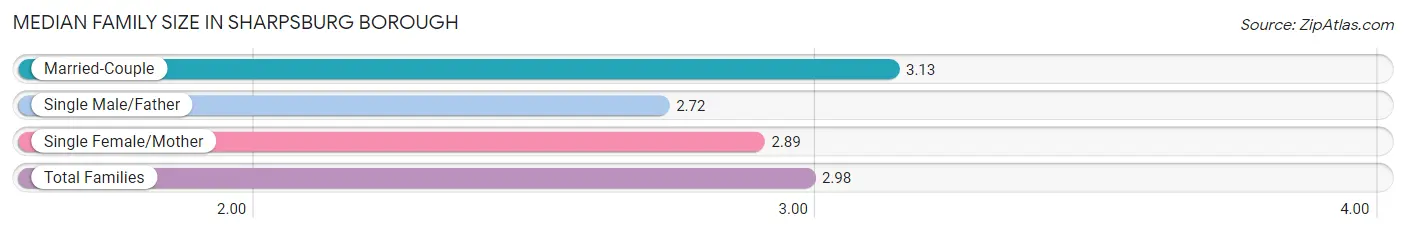
Median Family Size in Sharpsburg borough
The median family size in Sharpsburg borough is 2.98 persons per family, with married-couple families (370 | 53.5%) accounting for the largest median family size of 3.13 persons per family. On the other hand, single male/father families (154 | 22.3%) represent the smallest median family size with 2.72 persons per family.
| Family Type | # Families | Family Size |
| Married-Couple | 370 (53.5%) | 3.13 |
| Single Male/Father | 154 (22.3%) | 2.72 |
| Single Female/Mother | 168 (24.3%) | 2.89 |
| Total Families | 692 (100.0%) | 2.98 |
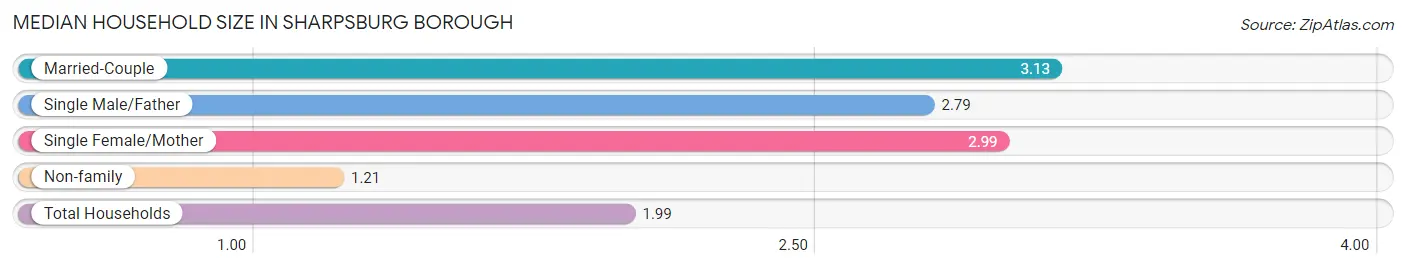
Median Household Size in Sharpsburg borough
The median household size in Sharpsburg borough is 1.99 persons per household, with married-couple households (370 | 23.2%) accounting for the largest median household size of 3.13 persons per household. non-family households (905 | 56.7%) represent the smallest median household size with 1.21 persons per household.
| Household Type | # Households | Household Size |
| Married-Couple | 370 (23.2%) | 3.13 |
| Single Male/Father | 154 (9.6%) | 2.79 |
| Single Female/Mother | 168 (10.5%) | 2.99 |
| Non-family | 905 (56.7%) | 1.21 |
| Total Households | 1,597 (100.0%) | 1.99 |
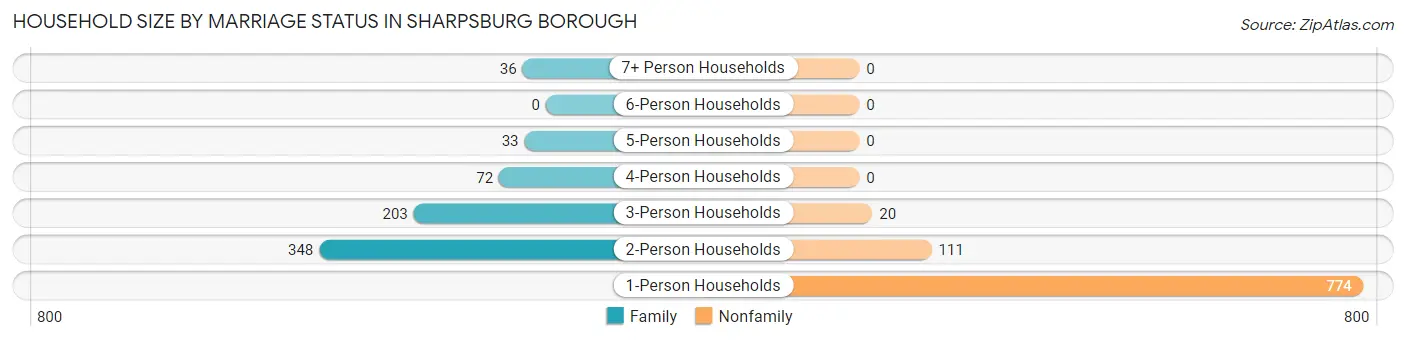
Household Size by Marriage Status in Sharpsburg borough
Out of a total of 1,597 households in Sharpsburg borough, 692 (43.3%) are family households, while 905 (56.7%) are nonfamily households. The most numerous type of family households are 2-person households, comprising 348, and the most common type of nonfamily households are 1-person households, comprising 774.
| Household Size | Family Households | Nonfamily Households |
| 1-Person Households | - | 774 (48.5%) |
| 2-Person Households | 348 (21.8%) | 111 (7.0%) |
| 3-Person Households | 203 (12.7%) | 20 (1.3%) |
| 4-Person Households | 72 (4.5%) | 0 (0.0%) |
| 5-Person Households | 33 (2.1%) | 0 (0.0%) |
| 6-Person Households | 0 (0.0%) | 0 (0.0%) |
| 7+ Person Households | 36 (2.2%) | 0 (0.0%) |
| Total | 692 (43.3%) | 905 (56.7%) |
Female Fertility in Sharpsburg borough
Fertility by Age in Sharpsburg borough
Average fertility rate in Sharpsburg borough is 84.0 births per 1,000 women. Women in the age bracket of 20 to 34 years have the highest fertility rate with 162.0 births per 1,000 women. Women in the age bracket of 20 to 34 years acount for 100.0% of all women with births.
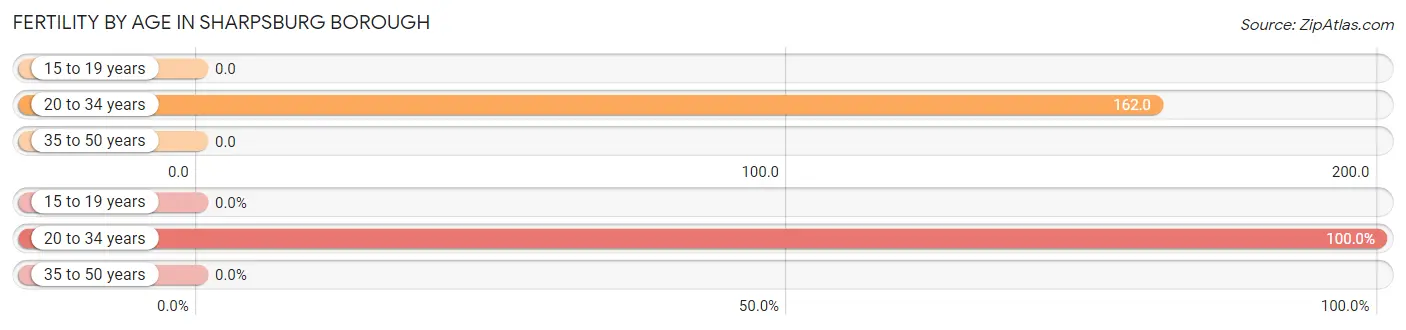
| Age Bracket | Women with Births | Births / 1,000 Women |
| 15 to 19 years | 0 (0.0%) | 0.0 |
| 20 to 34 years | 73 (100.0%) | 162.0 |
| 35 to 50 years | 0 (0.0%) | 0.0 |
| Total | 73 (100.0%) | 84.0 |
Fertility by Age by Marriage Status in Sharpsburg borough
53.4% of women with births (73) in Sharpsburg borough are married. The highest percentage of unmarried women with births falls into 20 to 34 years age bracket with 46.6% of them unmarried at the time of birth, while the lowest percentage of unmarried women with births belong to 20 to 34 years age bracket with 46.6% of them unmarried.
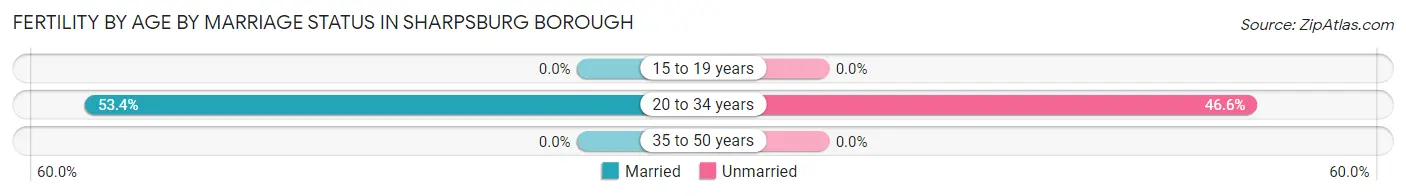
| Age Bracket | Married | Unmarried |
| 15 to 19 years | 0 (0.0%) | 0 (0.0%) |
| 20 to 34 years | 39 (53.4%) | 34 (46.6%) |
| 35 to 50 years | 0 (0.0%) | 0 (0.0%) |
| Total | 39 (53.4%) | 34 (46.6%) |
Fertility by Education in Sharpsburg borough
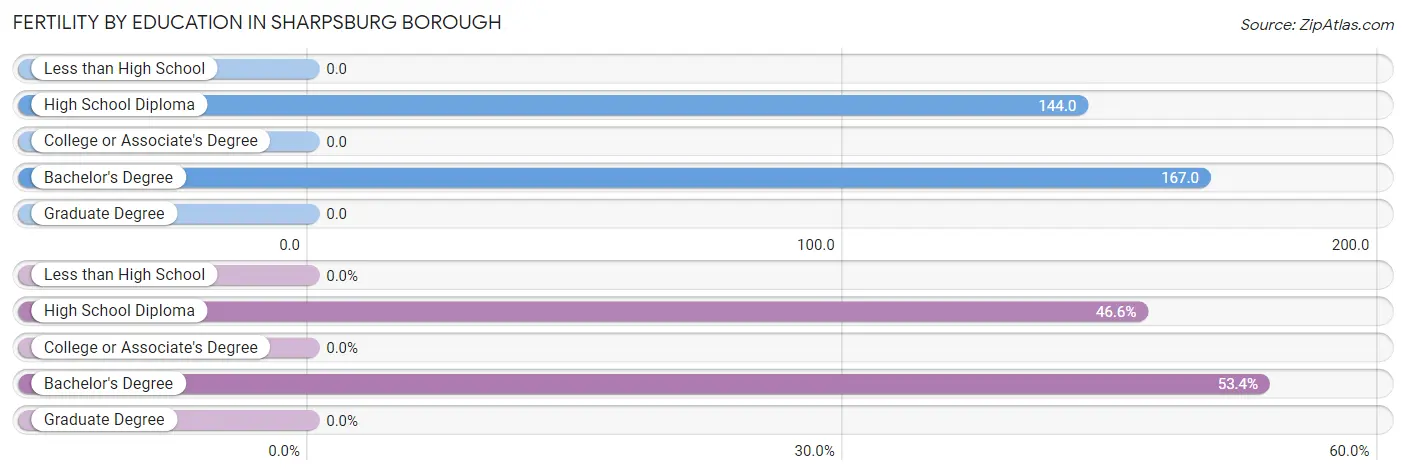
| Educational Attainment | Women with Births | Births / 1,000 Women |
| Less than High School | 0 (0.0%) | 0.0 |
| High School Diploma | 34 (46.6%) | 144.0 |
| College or Associate's Degree | 0 (0.0%) | 0.0 |
| Bachelor's Degree | 39 (53.4%) | 167.0 |
| Graduate Degree | 0 (0.0%) | 0.0 |
| Total | 73 (100.0%) | 84.0 |
Fertility by Education by Marriage Status in Sharpsburg borough
46.6% of women with births in Sharpsburg borough are unmarried. Women with the educational attainment of bachelor's degree are most likely to be married with 100.0% of them married at childbirth, while women with the educational attainment of high school diploma are least likely to be married with 100.0% of them unmarried at childbirth.
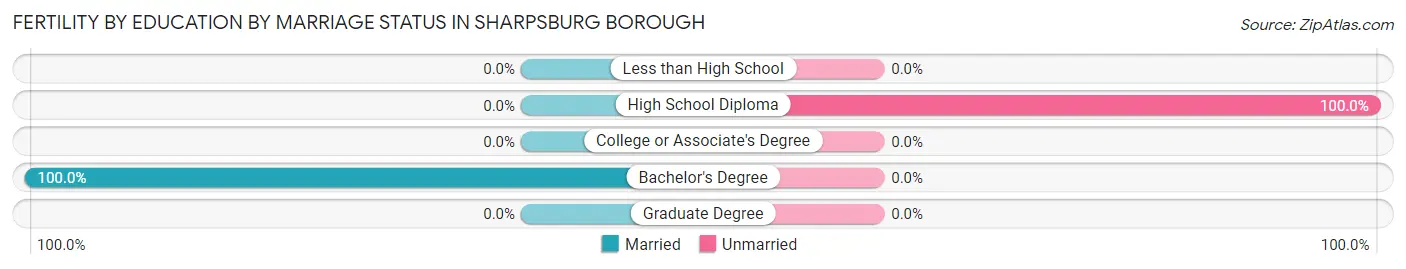
| Educational Attainment | Married | Unmarried |
| Less than High School | 0 (0.0%) | 0 (0.0%) |
| High School Diploma | 0 (0.0%) | 34 (100.0%) |
| College or Associate's Degree | 0 (0.0%) | 0 (0.0%) |
| Bachelor's Degree | 39 (100.0%) | 0 (0.0%) |
| Graduate Degree | 0 (0.0%) | 0 (0.0%) |
| Total | 39 (53.4%) | 34 (46.6%) |
Employment Characteristics in Sharpsburg borough
Employment by Class of Employer in Sharpsburg borough
Among the 1,346 employed individuals in Sharpsburg borough, private company employees (817 | 60.7%), not-for-profit organizations (328 | 24.4%), and state government employees (114 | 8.5%) make up the most common classes of employment.
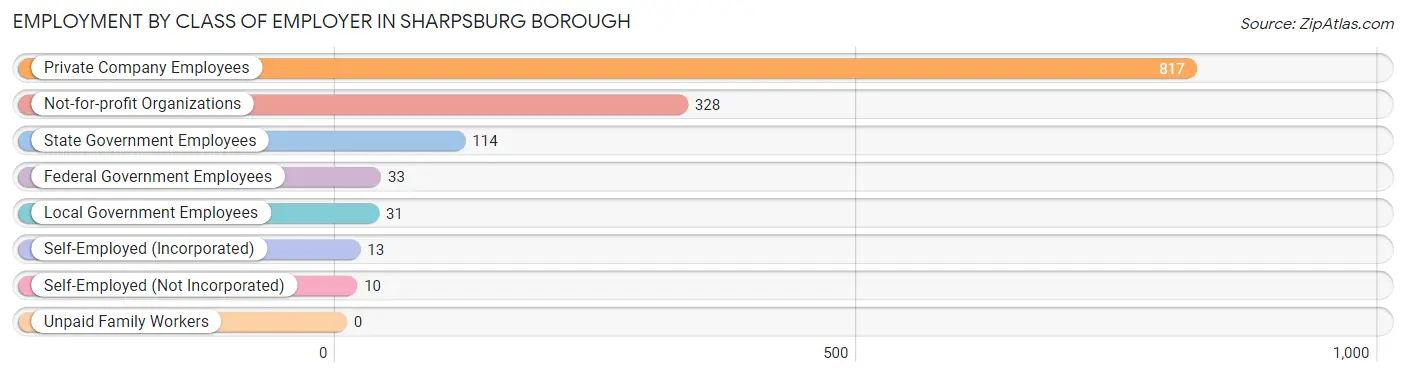
| Employer Class | # Employees | % Employees |
| Private Company Employees | 817 | 60.7% |
| Self-Employed (Incorporated) | 13 | 1.0% |
| Self-Employed (Not Incorporated) | 10 | 0.7% |
| Not-for-profit Organizations | 328 | 24.4% |
| Local Government Employees | 31 | 2.3% |
| State Government Employees | 114 | 8.5% |
| Federal Government Employees | 33 | 2.5% |
| Unpaid Family Workers | 0 | 0.0% |
| Total | 1,346 | 100.0% |
Employment Status by Age in Sharpsburg borough
According to the labor force statistics for Sharpsburg borough, out of the total population over 16 years of age (2,749), 56.6% or 1,556 individuals are in the labor force, with 10.8% or 168 of them unemployed. The age group with the highest labor force participation rate is 30 to 34 years, with 89.0% or 268 individuals in the labor force. Within the labor force, the 16 to 19 years age range has the highest percentage of unemployed individuals, with 51.3% or 41 of them being unemployed.
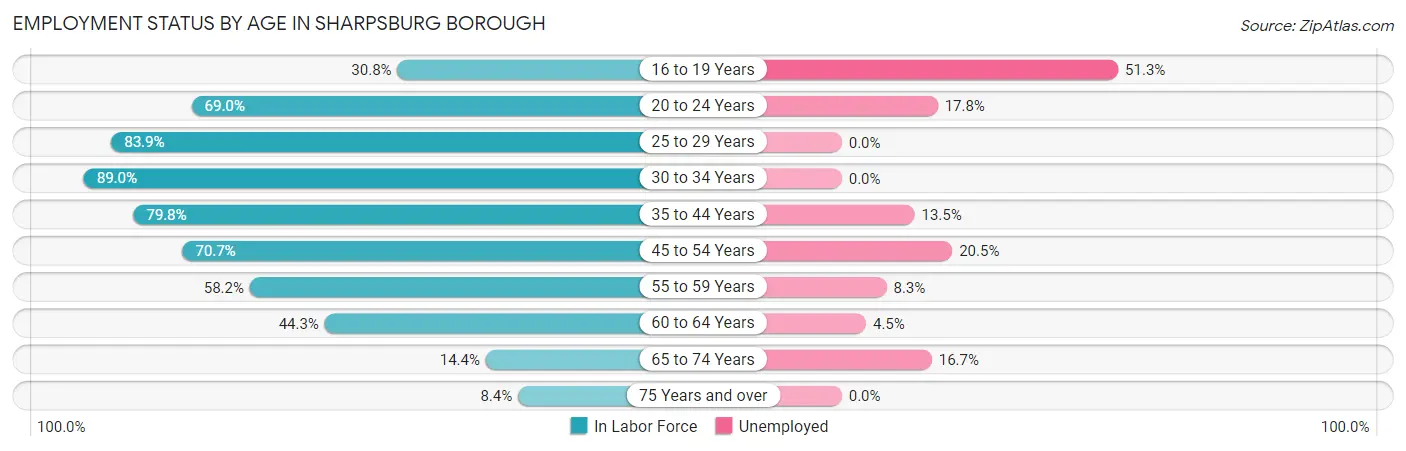
| Age Bracket | In Labor Force | Unemployed |
| 16 to 19 Years | 80 (30.8%) | 41 (51.3%) |
| 20 to 24 Years | 118 (69.0%) | 21 (17.8%) |
| 25 to 29 Years | 276 (83.9%) | 0 (0.0%) |
| 30 to 34 Years | 268 (89.0%) | 0 (0.0%) |
| 35 to 44 Years | 281 (79.8%) | 38 (13.5%) |
| 45 to 54 Years | 224 (70.7%) | 46 (20.5%) |
| 55 to 59 Years | 96 (58.2%) | 8 (8.3%) |
| 60 to 64 Years | 154 (44.3%) | 7 (4.5%) |
| 65 to 74 Years | 42 (14.4%) | 7 (16.7%) |
| 75 Years and over | 18 (8.4%) | 0 (0.0%) |
| Total | 1,556 (56.6%) | 168 (10.8%) |
Employment Status by Educational Attainment in Sharpsburg borough
According to labor force statistics for Sharpsburg borough, 71.7% of individuals (1,299) out of the total population between 25 and 64 years of age (1,812) are in the labor force, with 7.6% or 99 of them being unemployed. The group with the highest labor force participation rate are those with the educational attainment of bachelor's degree or higher, with 90.0% or 594 individuals in the labor force. Within the labor force, individuals with college / associate degree education have the highest percentage of unemployment, with 13.9% or 49 of them being unemployed.
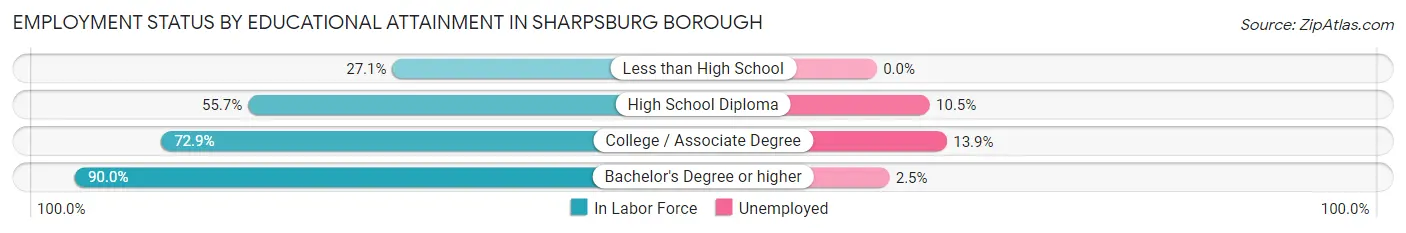
| Educational Attainment | In Labor Force | Unemployed |
| Less than High School | 19 (27.1%) | 0 (0.0%) |
| High School Diploma | 333 (55.7%) | 63 (10.5%) |
| College / Associate Degree | 353 (72.9%) | 67 (13.9%) |
| Bachelor's Degree or higher | 594 (90.0%) | 16 (2.5%) |
| Total | 1,299 (71.7%) | 138 (7.6%) |
Employment Occupations by Sex in Sharpsburg borough
Management, Business, Science and Arts Occupations
The most common Management, Business, Science and Arts occupations in Sharpsburg borough are Community & Social Service (203 | 14.6%), Business & Financial (125 | 9.0%), Management (118 | 8.5%), Education Instruction & Library (93 | 6.7%), and Computers, Engineering & Science (65 | 4.7%).
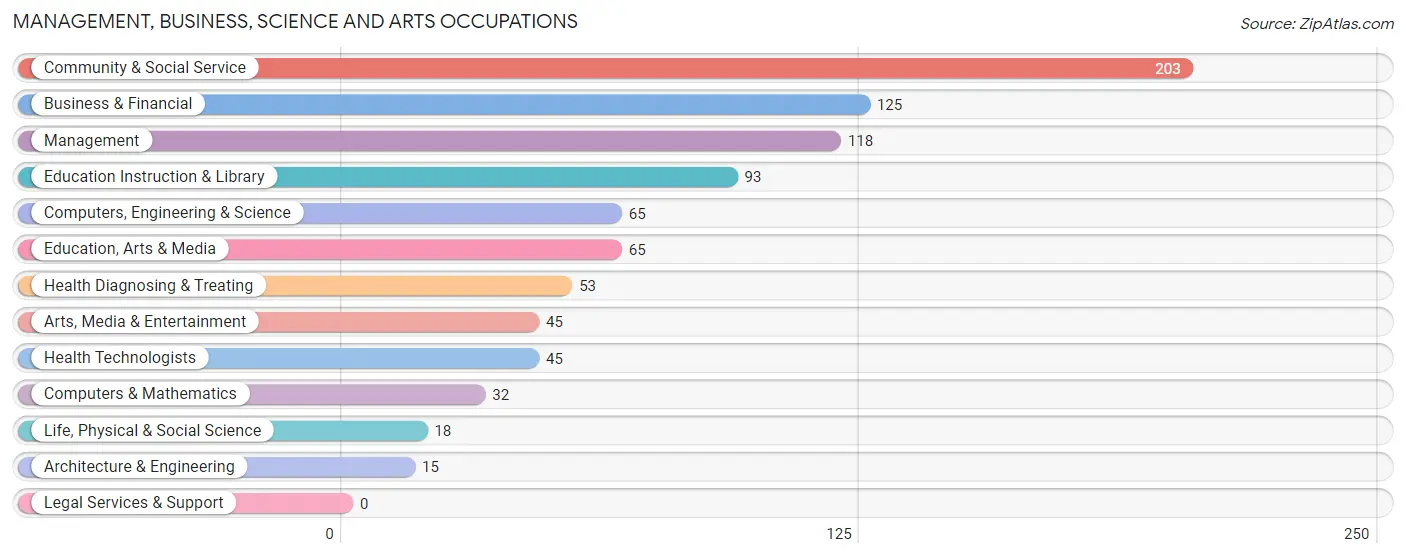
Management, Business, Science and Arts Occupations by Sex
Within the Management, Business, Science and Arts occupations in Sharpsburg borough, the most male-oriented occupations are Architecture & Engineering (100.0%), Life, Physical & Social Science (100.0%), and Computers, Engineering & Science (66.1%), while the most female-oriented occupations are Education, Arts & Media (100.0%), Community & Social Service (88.2%), and Arts, Media & Entertainment (84.4%).
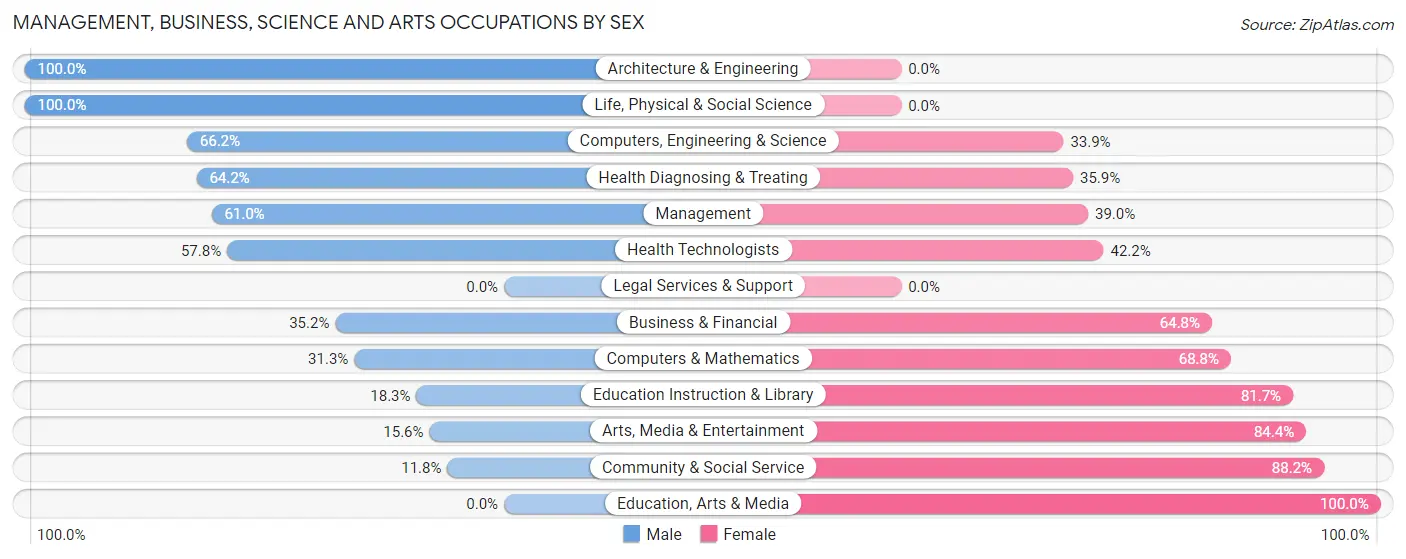
| Occupation | Male | Female |
| Management | 72 (61.0%) | 46 (39.0%) |
| Business & Financial | 44 (35.2%) | 81 (64.8%) |
| Computers, Engineering & Science | 43 (66.1%) | 22 (33.9%) |
| Computers & Mathematics | 10 (31.2%) | 22 (68.8%) |
| Architecture & Engineering | 15 (100.0%) | 0 (0.0%) |
| Life, Physical & Social Science | 18 (100.0%) | 0 (0.0%) |
| Community & Social Service | 24 (11.8%) | 179 (88.2%) |
| Education, Arts & Media | 0 (0.0%) | 65 (100.0%) |
| Legal Services & Support | 0 (0.0%) | 0 (0.0%) |
| Education Instruction & Library | 17 (18.3%) | 76 (81.7%) |
| Arts, Media & Entertainment | 7 (15.6%) | 38 (84.4%) |
| Health Diagnosing & Treating | 34 (64.1%) | 19 (35.8%) |
| Health Technologists | 26 (57.8%) | 19 (42.2%) |
| Total (Category) | 217 (38.5%) | 347 (61.5%) |
| Total (Overall) | 682 (49.1%) | 707 (50.9%) |
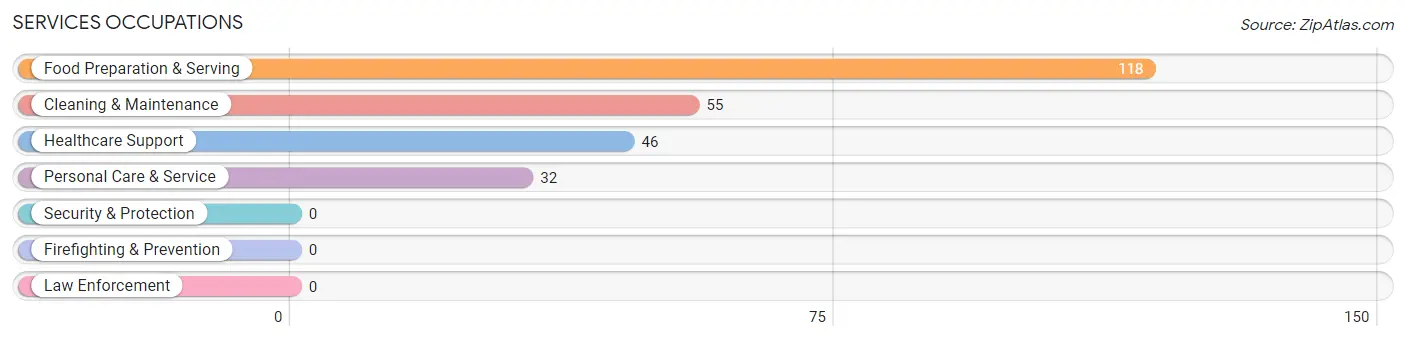
Services Occupations
The most common Services occupations in Sharpsburg borough are Food Preparation & Serving (118 | 8.5%), Cleaning & Maintenance (55 | 4.0%), Healthcare Support (46 | 3.3%), and Personal Care & Service (32 | 2.3%).
Services Occupations by Sex
Within the Services occupations in Sharpsburg borough, the most male-oriented occupations are Cleaning & Maintenance (100.0%), Food Preparation & Serving (56.8%), and Healthcare Support (43.5%), while the most female-oriented occupations are Personal Care & Service (100.0%), Healthcare Support (56.5%), and Food Preparation & Serving (43.2%).
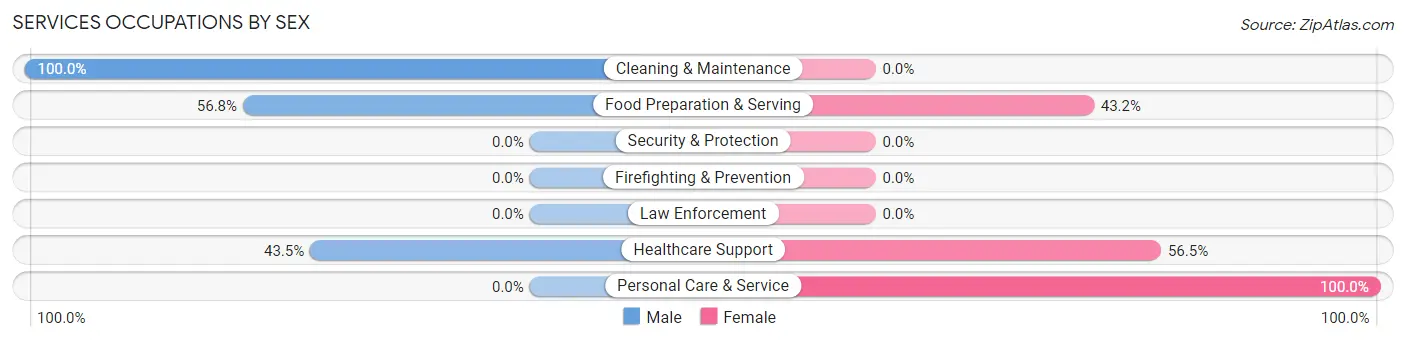
| Occupation | Male | Female |
| Healthcare Support | 20 (43.5%) | 26 (56.5%) |
| Security & Protection | 0 (0.0%) | 0 (0.0%) |
| Firefighting & Prevention | 0 (0.0%) | 0 (0.0%) |
| Law Enforcement | 0 (0.0%) | 0 (0.0%) |
| Food Preparation & Serving | 67 (56.8%) | 51 (43.2%) |
| Cleaning & Maintenance | 55 (100.0%) | 0 (0.0%) |
| Personal Care & Service | 0 (0.0%) | 32 (100.0%) |
| Total (Category) | 142 (56.6%) | 109 (43.4%) |
| Total (Overall) | 682 (49.1%) | 707 (50.9%) |
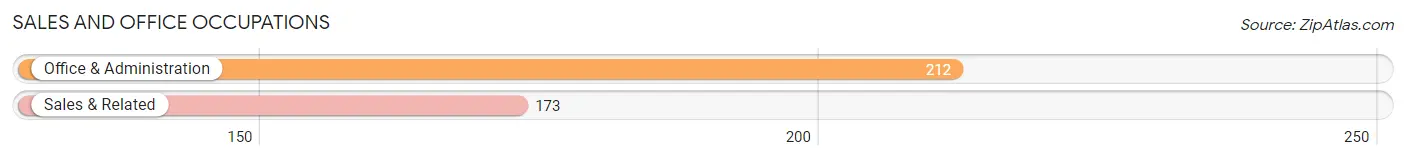
Sales and Office Occupations
The most common Sales and Office occupations in Sharpsburg borough are Office & Administration (212 | 15.3%), and Sales & Related (173 | 12.5%).
Sales and Office Occupations by Sex
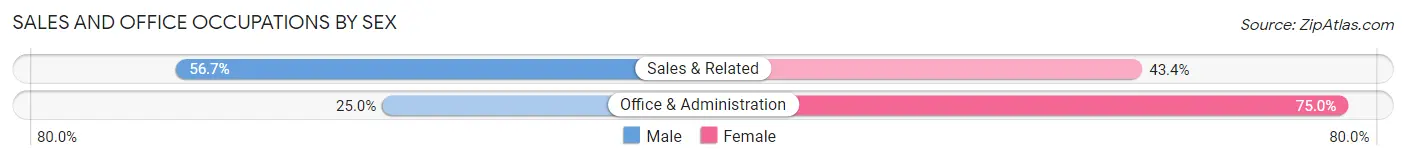
| Occupation | Male | Female |
| Sales & Related | 98 (56.7%) | 75 (43.3%) |
| Office & Administration | 53 (25.0%) | 159 (75.0%) |
| Total (Category) | 151 (39.2%) | 234 (60.8%) |
| Total (Overall) | 682 (49.1%) | 707 (50.9%) |
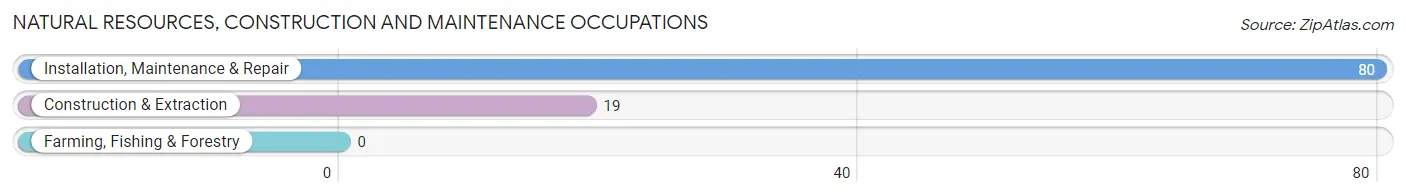
Natural Resources, Construction and Maintenance Occupations
The most common Natural Resources, Construction and Maintenance occupations in Sharpsburg borough are Installation, Maintenance & Repair (80 | 5.8%), and Construction & Extraction (19 | 1.4%).
Natural Resources, Construction and Maintenance Occupations by Sex
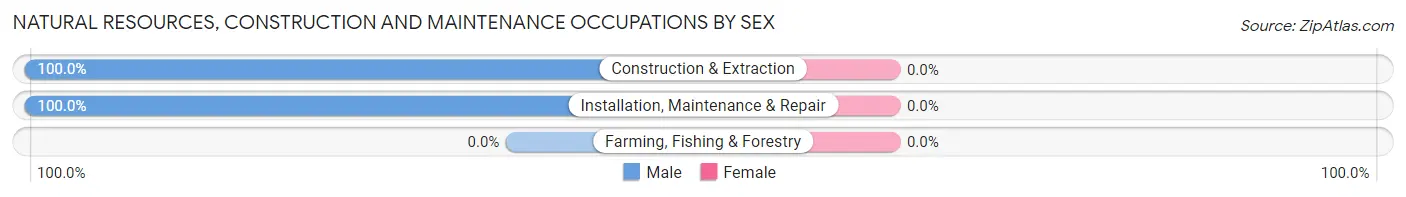
| Occupation | Male | Female |
| Farming, Fishing & Forestry | 0 (0.0%) | 0 (0.0%) |
| Construction & Extraction | 19 (100.0%) | 0 (0.0%) |
| Installation, Maintenance & Repair | 80 (100.0%) | 0 (0.0%) |
| Total (Category) | 99 (100.0%) | 0 (0.0%) |
| Total (Overall) | 682 (49.1%) | 707 (50.9%) |
Production, Transportation and Moving Occupations
The most common Production, Transportation and Moving occupations in Sharpsburg borough are Production (40 | 2.9%), Material Moving (32 | 2.3%), and Transportation (18 | 1.3%).
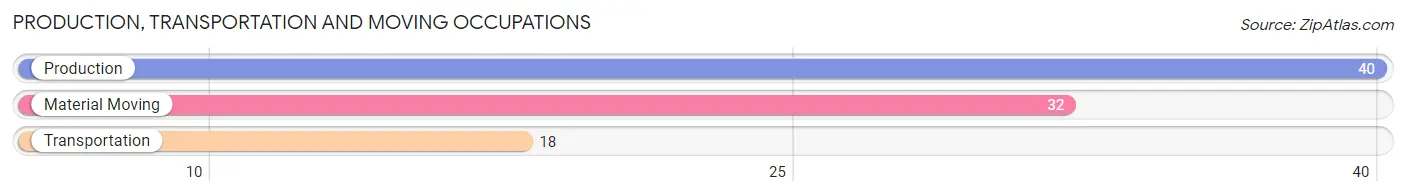
Production, Transportation and Moving Occupations by Sex
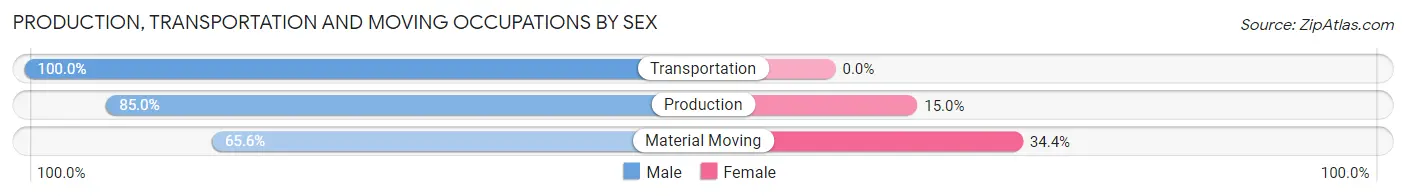
| Occupation | Male | Female |
| Production | 34 (85.0%) | 6 (15.0%) |
| Transportation | 18 (100.0%) | 0 (0.0%) |
| Material Moving | 21 (65.6%) | 11 (34.4%) |
| Total (Category) | 73 (81.1%) | 17 (18.9%) |
| Total (Overall) | 682 (49.1%) | 707 (50.9%) |
Employment Industries by Sex in Sharpsburg borough
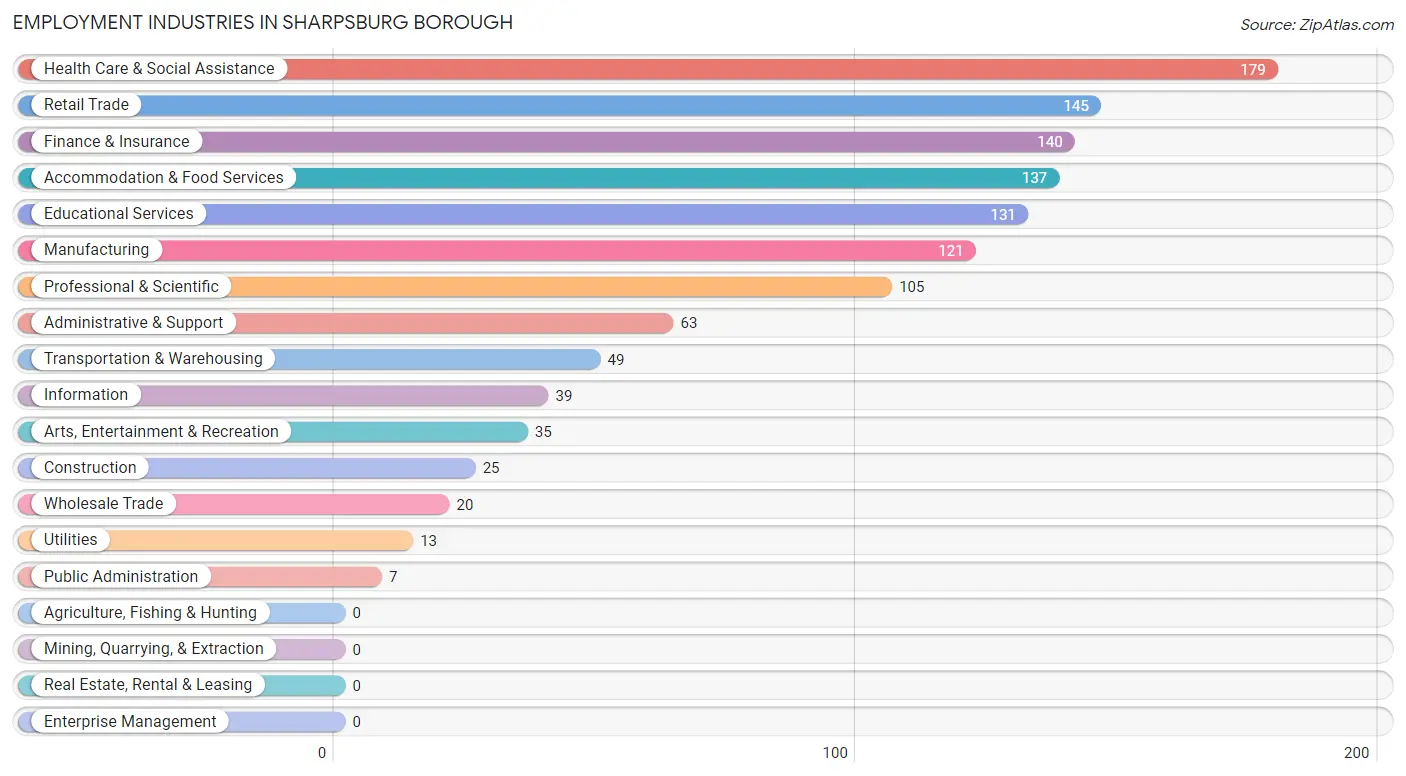
Employment Industries in Sharpsburg borough
The major employment industries in Sharpsburg borough include Health Care & Social Assistance (179 | 12.9%), Retail Trade (145 | 10.4%), Finance & Insurance (140 | 10.1%), Accommodation & Food Services (137 | 9.9%), and Educational Services (131 | 9.4%).
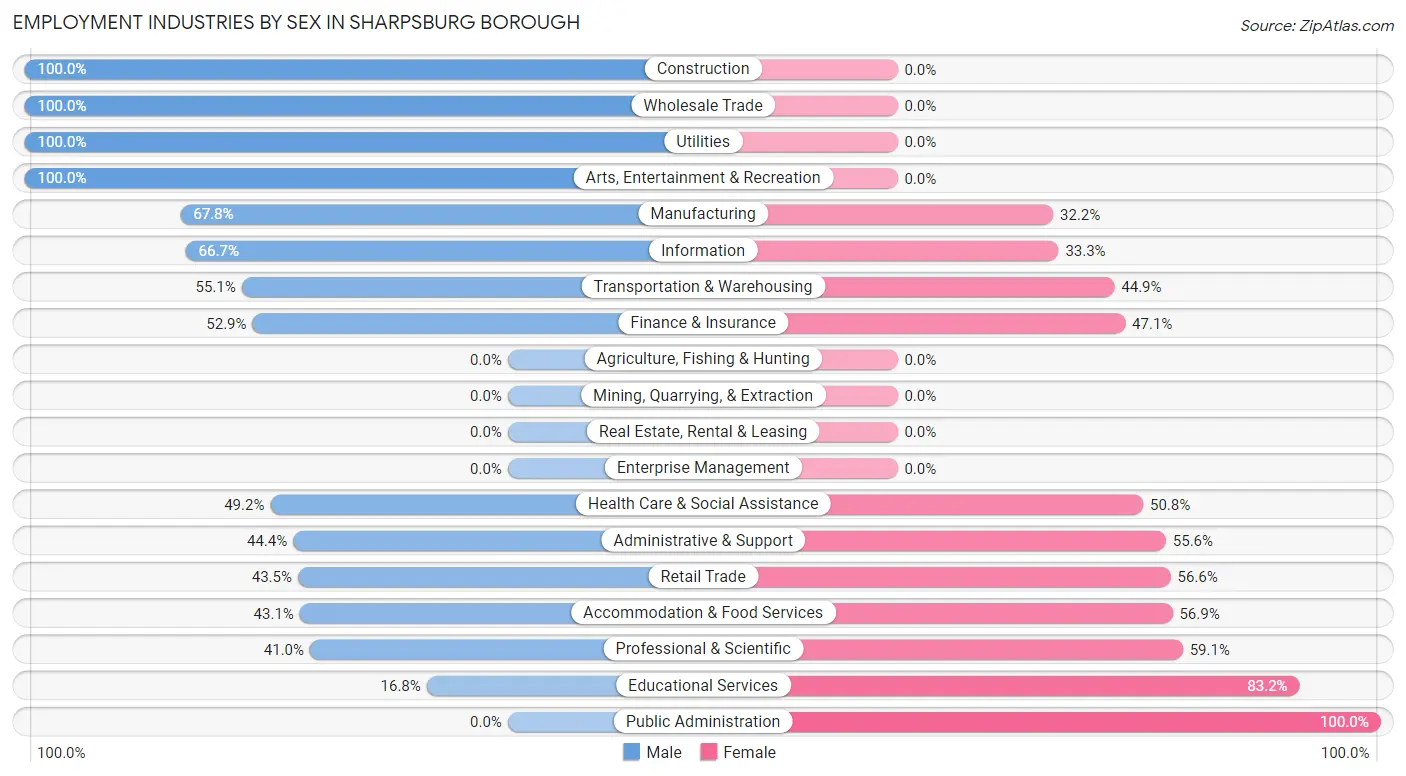
Employment Industries by Sex in Sharpsburg borough
The Sharpsburg borough industries that see more men than women are Construction (100.0%), Wholesale Trade (100.0%), and Utilities (100.0%), whereas the industries that tend to have a higher number of women are Public Administration (100.0%), Educational Services (83.2%), and Professional & Scientific (59.1%).
| Industry | Male | Female |
| Agriculture, Fishing & Hunting | 0 (0.0%) | 0 (0.0%) |
| Mining, Quarrying, & Extraction | 0 (0.0%) | 0 (0.0%) |
| Construction | 25 (100.0%) | 0 (0.0%) |
| Manufacturing | 82 (67.8%) | 39 (32.2%) |
| Wholesale Trade | 20 (100.0%) | 0 (0.0%) |
| Retail Trade | 63 (43.4%) | 82 (56.6%) |
| Transportation & Warehousing | 27 (55.1%) | 22 (44.9%) |
| Utilities | 13 (100.0%) | 0 (0.0%) |
| Information | 26 (66.7%) | 13 (33.3%) |
| Finance & Insurance | 74 (52.9%) | 66 (47.1%) |
| Real Estate, Rental & Leasing | 0 (0.0%) | 0 (0.0%) |
| Professional & Scientific | 43 (40.9%) | 62 (59.1%) |
| Enterprise Management | 0 (0.0%) | 0 (0.0%) |
| Administrative & Support | 28 (44.4%) | 35 (55.6%) |
| Educational Services | 22 (16.8%) | 109 (83.2%) |
| Health Care & Social Assistance | 88 (49.2%) | 91 (50.8%) |
| Arts, Entertainment & Recreation | 35 (100.0%) | 0 (0.0%) |
| Accommodation & Food Services | 59 (43.1%) | 78 (56.9%) |
| Public Administration | 0 (0.0%) | 7 (100.0%) |
| Total | 682 (49.1%) | 707 (50.9%) |
Education in Sharpsburg borough
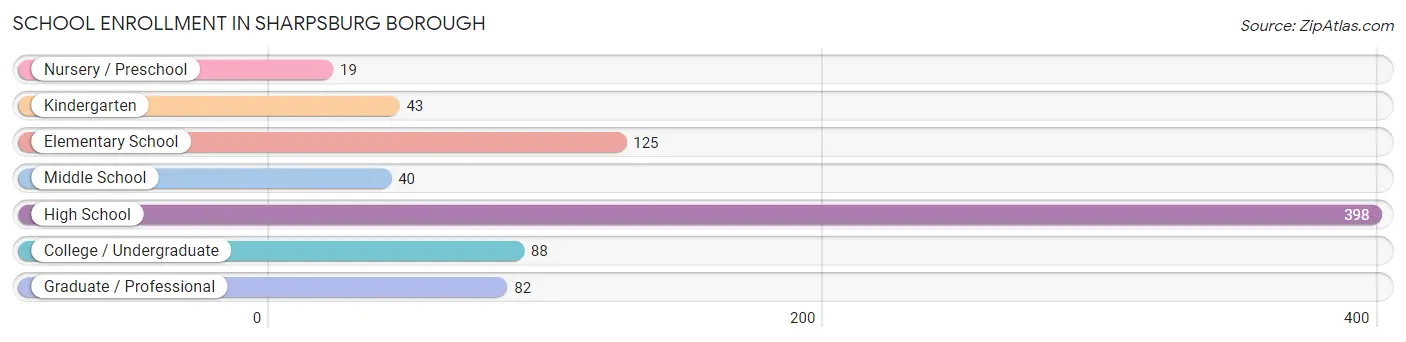
School Enrollment in Sharpsburg borough
The most common levels of schooling among the 795 students in Sharpsburg borough are high school (398 | 50.1%), elementary school (125 | 15.7%), and college / undergraduate (88 | 11.1%).
| School Level | # Students | % Students |
| Nursery / Preschool | 19 | 2.4% |
| Kindergarten | 43 | 5.4% |
| Elementary School | 125 | 15.7% |
| Middle School | 40 | 5.0% |
| High School | 398 | 50.1% |
| College / Undergraduate | 88 | 11.1% |
| Graduate / Professional | 82 | 10.3% |
| Total | 795 | 100.0% |
School Enrollment by Age by Funding Source in Sharpsburg borough
Out of a total of 795 students who are enrolled in schools in Sharpsburg borough, 50 (6.3%) attend a private institution, while the remaining 745 (93.7%) are enrolled in public schools. The age group of 25 to 34 year olds has the highest likelihood of being enrolled in private schools, with 27 (40.9% in the age bracket) enrolled. Conversely, the age group of 3 to 4 year olds has the lowest likelihood of being enrolled in a private school, with 11 (100.0% in the age bracket) attending a public institution.
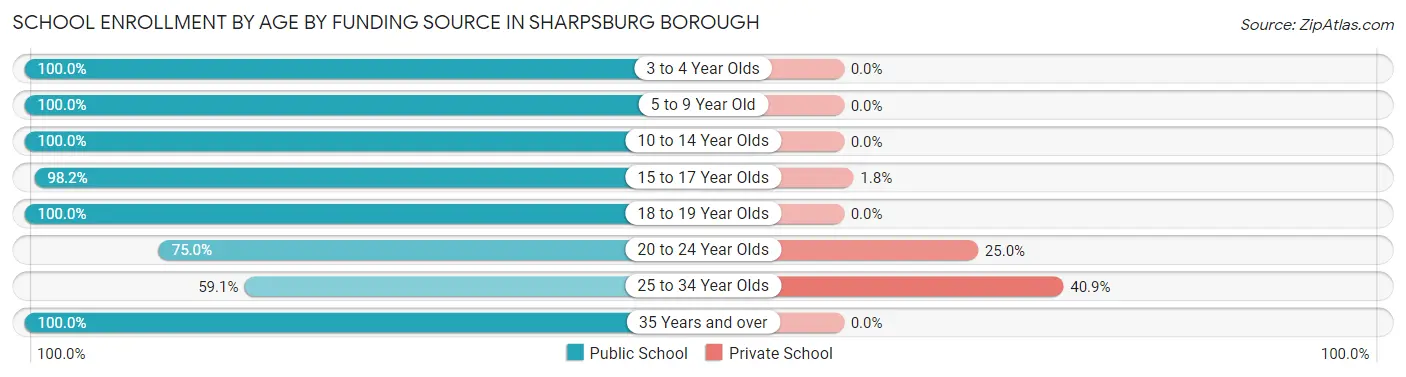
| Age Bracket | Public School | Private School |
| 3 to 4 Year Olds | 11 (100.0%) | 0 (0.0%) |
| 5 to 9 Year Old | 141 (100.0%) | 0 (0.0%) |
| 10 to 14 Year Olds | 75 (100.0%) | 0 (0.0%) |
| 15 to 17 Year Olds | 326 (98.2%) | 6 (1.8%) |
| 18 to 19 Year Olds | 53 (100.0%) | 0 (0.0%) |
| 20 to 24 Year Olds | 51 (75.0%) | 17 (25.0%) |
| 25 to 34 Year Olds | 39 (59.1%) | 27 (40.9%) |
| 35 Years and over | 49 (100.0%) | 0 (0.0%) |
| Total | 745 (93.7%) | 50 (6.3%) |
Educational Attainment by Field of Study in Sharpsburg borough
Business (160 | 19.2%), literature & languages (116 | 13.9%), arts & humanities (70 | 8.4%), education (68 | 8.2%), and bio, nature & agricultural (66 | 7.9%) are the most common fields of study among 832 individuals in Sharpsburg borough who have obtained a bachelor's degree or higher.
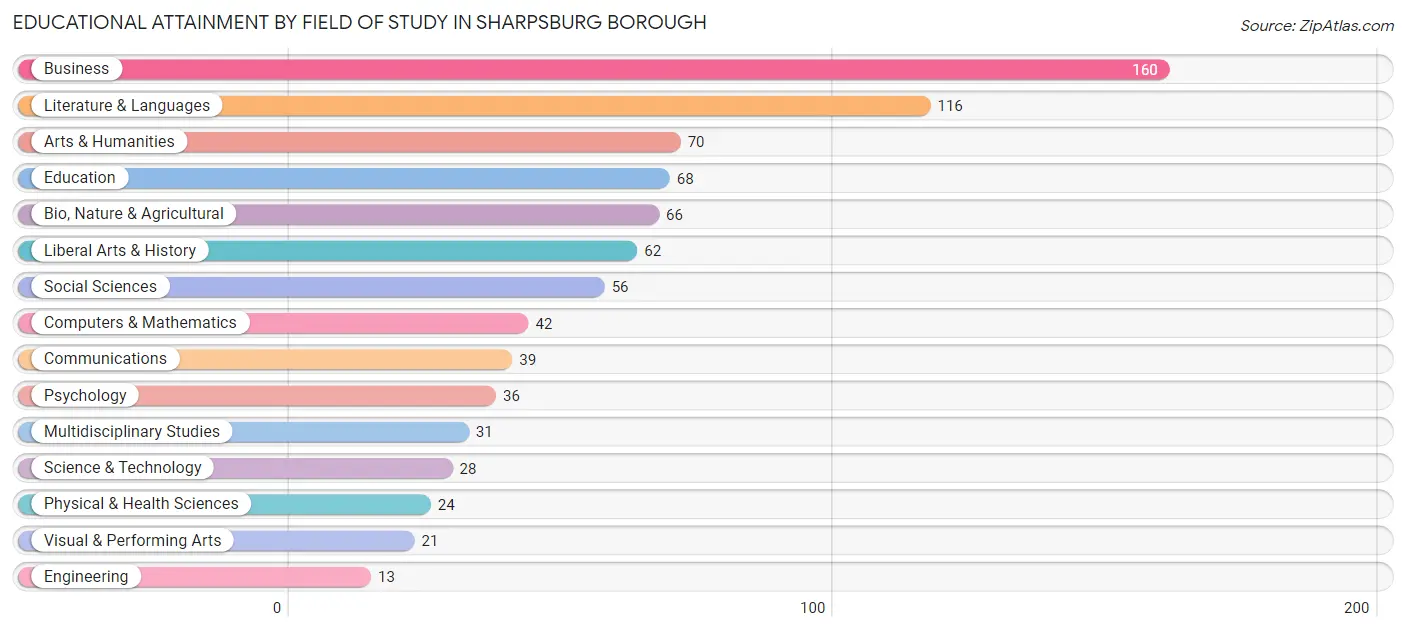
| Field of Study | # Graduates | % Graduates |
| Computers & Mathematics | 42 | 5.1% |
| Bio, Nature & Agricultural | 66 | 7.9% |
| Physical & Health Sciences | 24 | 2.9% |
| Psychology | 36 | 4.3% |
| Social Sciences | 56 | 6.7% |
| Engineering | 13 | 1.6% |
| Multidisciplinary Studies | 31 | 3.7% |
| Science & Technology | 28 | 3.4% |
| Business | 160 | 19.2% |
| Education | 68 | 8.2% |
| Literature & Languages | 116 | 13.9% |
| Liberal Arts & History | 62 | 7.4% |
| Visual & Performing Arts | 21 | 2.5% |
| Communications | 39 | 4.7% |
| Arts & Humanities | 70 | 8.4% |
| Total | 832 | 100.0% |
Transportation & Commute in Sharpsburg borough
Vehicle Availability by Sex in Sharpsburg borough
The most prevalent vehicle ownership categories in Sharpsburg borough are males with 1 vehicle (391, accounting for 59.7%) and females with 1 vehicle (345, making up 56.6%).
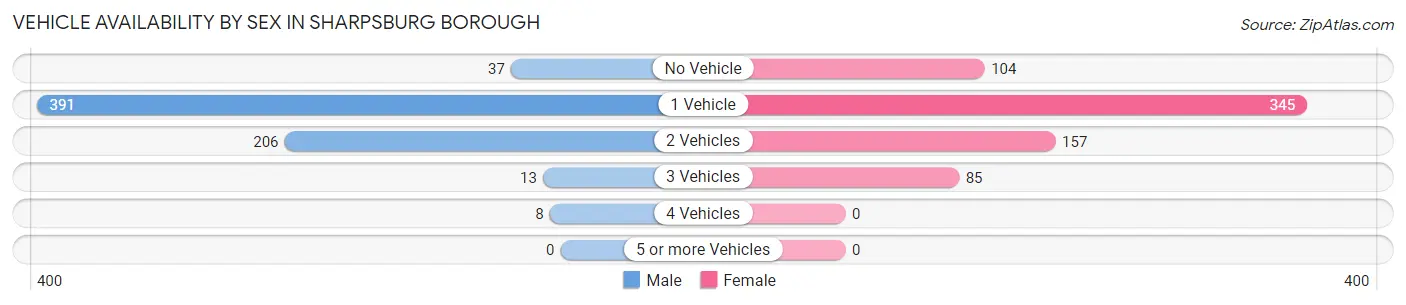
| Vehicles Available | Male | Female |
| No Vehicle | 37 (5.7%) | 104 (15.0%) |
| 1 Vehicle | 391 (59.7%) | 345 (49.9%) |
| 2 Vehicles | 206 (31.5%) | 157 (22.7%) |
| 3 Vehicles | 13 (2.0%) | 85 (12.3%) |
| 4 Vehicles | 8 (1.2%) | 0 (0.0%) |
| 5 or more Vehicles | 0 (0.0%) | 0 (0.0%) |
| Total | 655 (100.0%) | 691 (100.0%) |
Commute Time in Sharpsburg borough
The most frequently occuring commute durations in Sharpsburg borough are 30 to 34 minutes (239 commuters, 21.0%), 10 to 14 minutes (197 commuters, 17.3%), and 20 to 24 minutes (157 commuters, 13.8%).
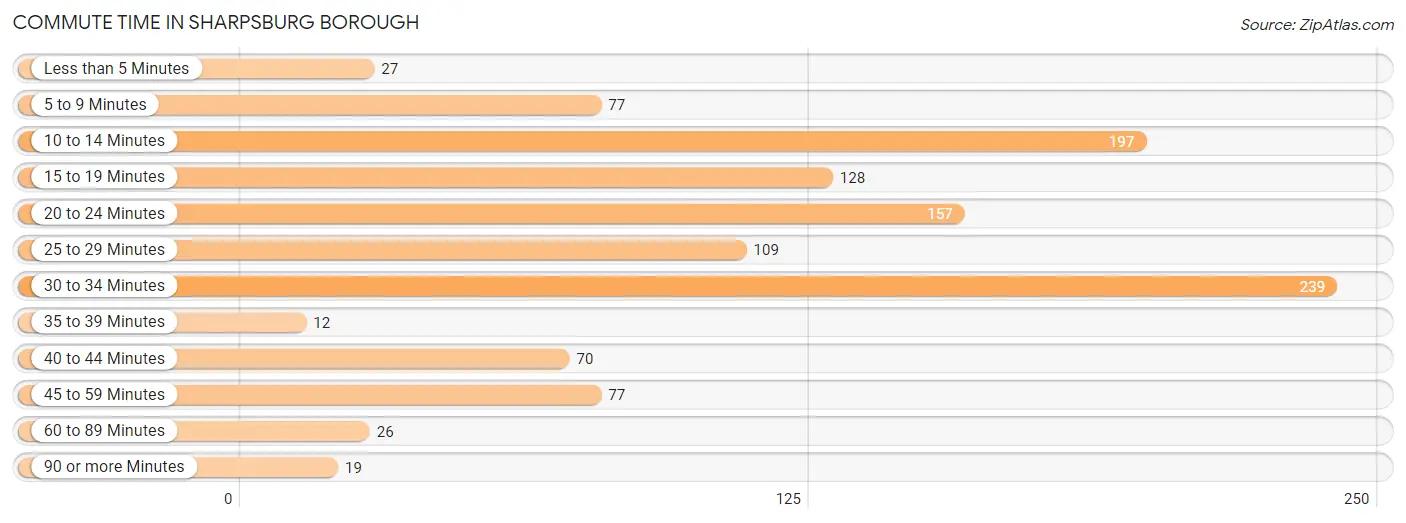
| Commute Time | # Commuters | % Commuters |
| Less than 5 Minutes | 27 | 2.4% |
| 5 to 9 Minutes | 77 | 6.8% |
| 10 to 14 Minutes | 197 | 17.3% |
| 15 to 19 Minutes | 128 | 11.3% |
| 20 to 24 Minutes | 157 | 13.8% |
| 25 to 29 Minutes | 109 | 9.6% |
| 30 to 34 Minutes | 239 | 21.0% |
| 35 to 39 Minutes | 12 | 1.1% |
| 40 to 44 Minutes | 70 | 6.1% |
| 45 to 59 Minutes | 77 | 6.8% |
| 60 to 89 Minutes | 26 | 2.3% |
| 90 or more Minutes | 19 | 1.7% |
Commute Time by Sex in Sharpsburg borough
The most common commute times in Sharpsburg borough are 10 to 14 minutes (155 commuters, 25.3%) for males and 30 to 34 minutes (105 commuters, 20.0%) for females.
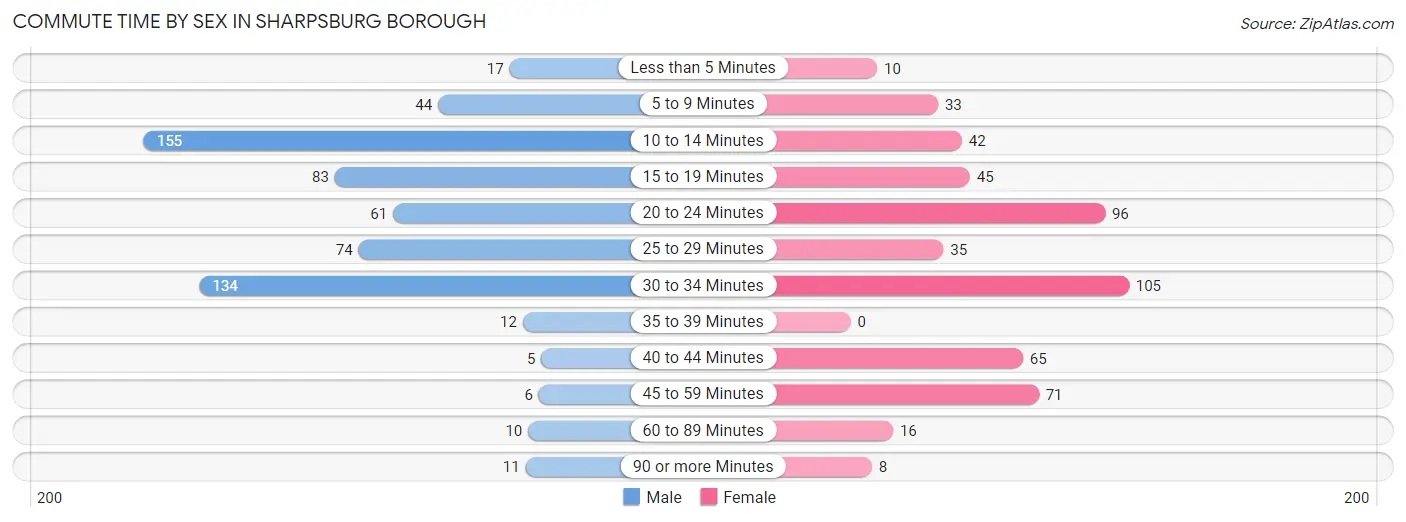
| Commute Time | Male | Female |
| Less than 5 Minutes | 17 (2.8%) | 10 (1.9%) |
| 5 to 9 Minutes | 44 (7.2%) | 33 (6.3%) |
| 10 to 14 Minutes | 155 (25.3%) | 42 (8.0%) |
| 15 to 19 Minutes | 83 (13.6%) | 45 (8.6%) |
| 20 to 24 Minutes | 61 (10.0%) | 96 (18.2%) |
| 25 to 29 Minutes | 74 (12.1%) | 35 (6.7%) |
| 30 to 34 Minutes | 134 (21.9%) | 105 (20.0%) |
| 35 to 39 Minutes | 12 (2.0%) | 0 (0.0%) |
| 40 to 44 Minutes | 5 (0.8%) | 65 (12.4%) |
| 45 to 59 Minutes | 6 (1.0%) | 71 (13.5%) |
| 60 to 89 Minutes | 10 (1.6%) | 16 (3.0%) |
| 90 or more Minutes | 11 (1.8%) | 8 (1.5%) |
Time of Departure to Work by Sex in Sharpsburg borough
The most frequent times of departure to work in Sharpsburg borough are 6:30 AM to 6:59 AM (176, 28.8%) for males and 7:00 AM to 7:29 AM (134, 25.5%) for females.
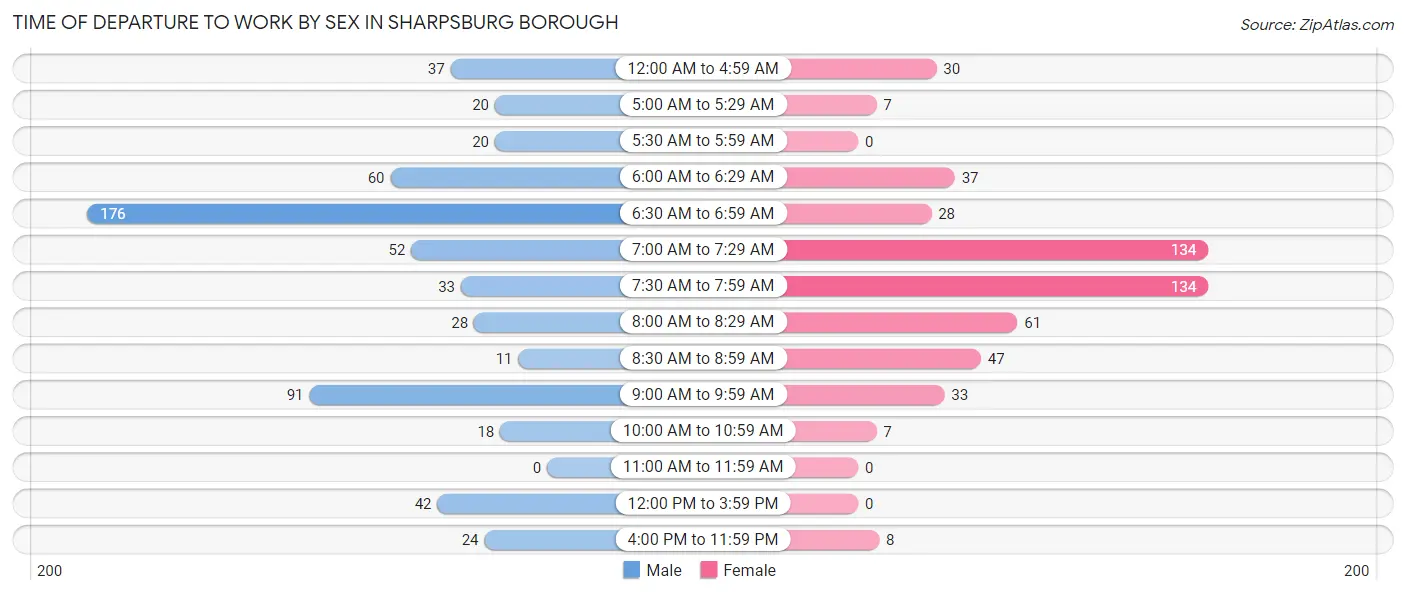
| Time of Departure | Male | Female |
| 12:00 AM to 4:59 AM | 37 (6.0%) | 30 (5.7%) |
| 5:00 AM to 5:29 AM | 20 (3.3%) | 7 (1.3%) |
| 5:30 AM to 5:59 AM | 20 (3.3%) | 0 (0.0%) |
| 6:00 AM to 6:29 AM | 60 (9.8%) | 37 (7.0%) |
| 6:30 AM to 6:59 AM | 176 (28.8%) | 28 (5.3%) |
| 7:00 AM to 7:29 AM | 52 (8.5%) | 134 (25.5%) |
| 7:30 AM to 7:59 AM | 33 (5.4%) | 134 (25.5%) |
| 8:00 AM to 8:29 AM | 28 (4.6%) | 61 (11.6%) |
| 8:30 AM to 8:59 AM | 11 (1.8%) | 47 (8.9%) |
| 9:00 AM to 9:59 AM | 91 (14.9%) | 33 (6.3%) |
| 10:00 AM to 10:59 AM | 18 (2.9%) | 7 (1.3%) |
| 11:00 AM to 11:59 AM | 0 (0.0%) | 0 (0.0%) |
| 12:00 PM to 3:59 PM | 42 (6.9%) | 0 (0.0%) |
| 4:00 PM to 11:59 PM | 24 (3.9%) | 8 (1.5%) |
| Total | 612 (100.0%) | 526 (100.0%) |
Housing Occupancy in Sharpsburg borough
Occupancy by Ownership in Sharpsburg borough
Of the total 1,597 dwellings in Sharpsburg borough, owner-occupied units account for 754 (47.2%), while renter-occupied units make up 843 (52.8%).
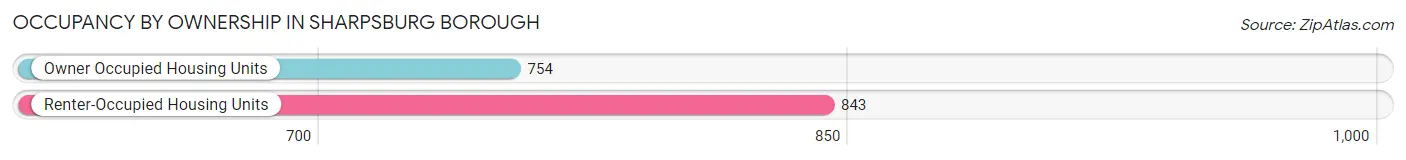
| Occupancy | # Housing Units | % Housing Units |
| Owner Occupied Housing Units | 754 | 47.2% |
| Renter-Occupied Housing Units | 843 | 52.8% |
| Total Occupied Housing Units | 1,597 | 100.0% |
Occupancy by Household Size in Sharpsburg borough
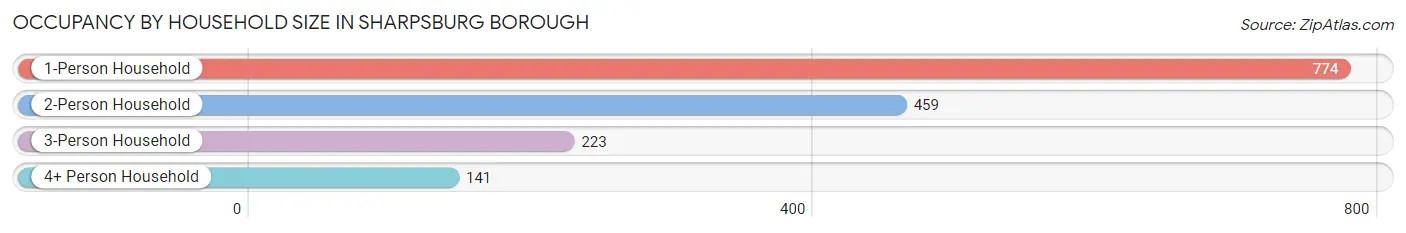
| Household Size | # Housing Units | % Housing Units |
| 1-Person Household | 774 | 48.5% |
| 2-Person Household | 459 | 28.7% |
| 3-Person Household | 223 | 14.0% |
| 4+ Person Household | 141 | 8.8% |
| Total Housing Units | 1,597 | 100.0% |
Occupancy by Ownership by Household Size in Sharpsburg borough
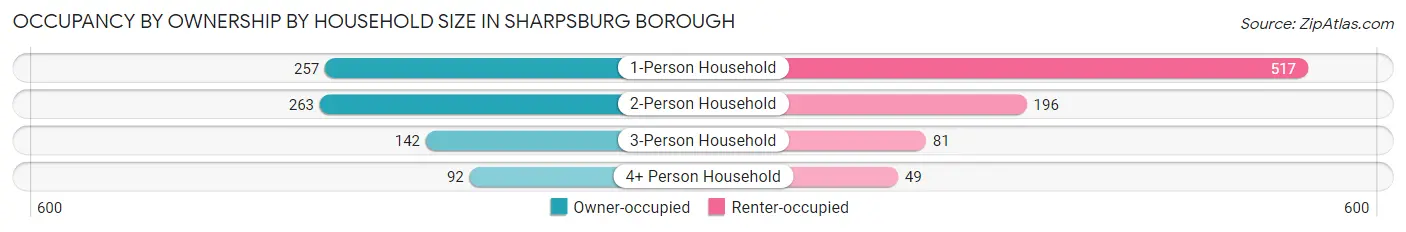
| Household Size | Owner-occupied | Renter-occupied |
| 1-Person Household | 257 (33.2%) | 517 (66.8%) |
| 2-Person Household | 263 (57.3%) | 196 (42.7%) |
| 3-Person Household | 142 (63.7%) | 81 (36.3%) |
| 4+ Person Household | 92 (65.2%) | 49 (34.7%) |
| Total Housing Units | 754 (47.2%) | 843 (52.8%) |
Occupancy by Educational Attainment in Sharpsburg borough
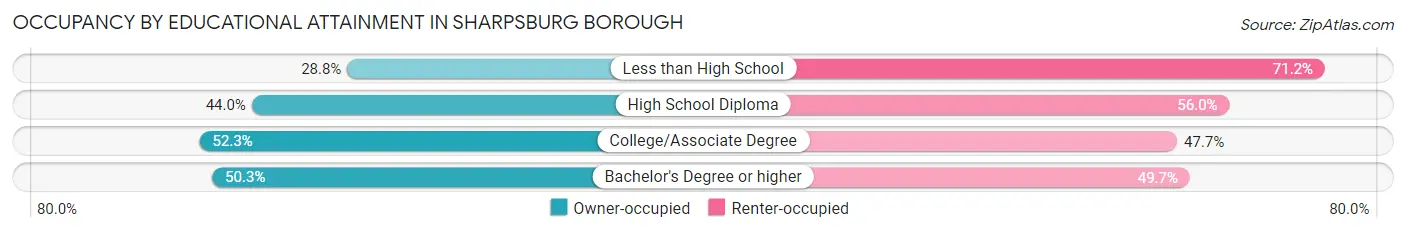
| Household Size | Owner-occupied | Renter-occupied |
| Less than High School | 32 (28.8%) | 79 (71.2%) |
| High School Diploma | 230 (44.0%) | 293 (56.0%) |
| College/Associate Degree | 207 (52.3%) | 189 (47.7%) |
| Bachelor's Degree or higher | 285 (50.3%) | 282 (49.7%) |
Occupancy by Age of Householder in Sharpsburg borough
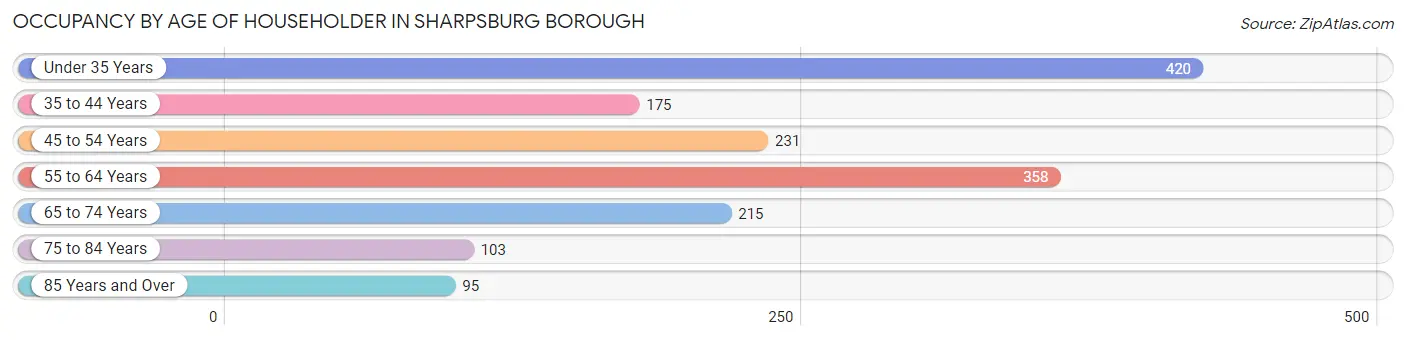
| Age Bracket | # Households | % Households |
| Under 35 Years | 420 | 26.3% |
| 35 to 44 Years | 175 | 11.0% |
| 45 to 54 Years | 231 | 14.5% |
| 55 to 64 Years | 358 | 22.4% |
| 65 to 74 Years | 215 | 13.5% |
| 75 to 84 Years | 103 | 6.5% |
| 85 Years and Over | 95 | 5.9% |
| Total | 1,597 | 100.0% |
Housing Finances in Sharpsburg borough
Median Income by Occupancy in Sharpsburg borough
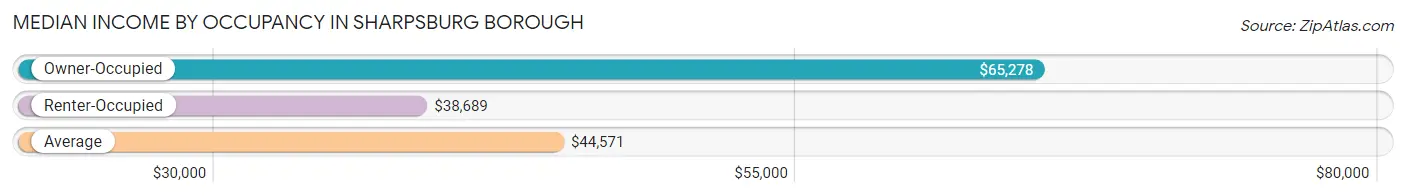
| Occupancy Type | # Households | Median Income |
| Owner-Occupied | 754 (47.2%) | $65,278 |
| Renter-Occupied | 843 (52.8%) | $38,689 |
| Average | 1,597 (100.0%) | $44,571 |
Occupancy by Householder Income Bracket in Sharpsburg borough
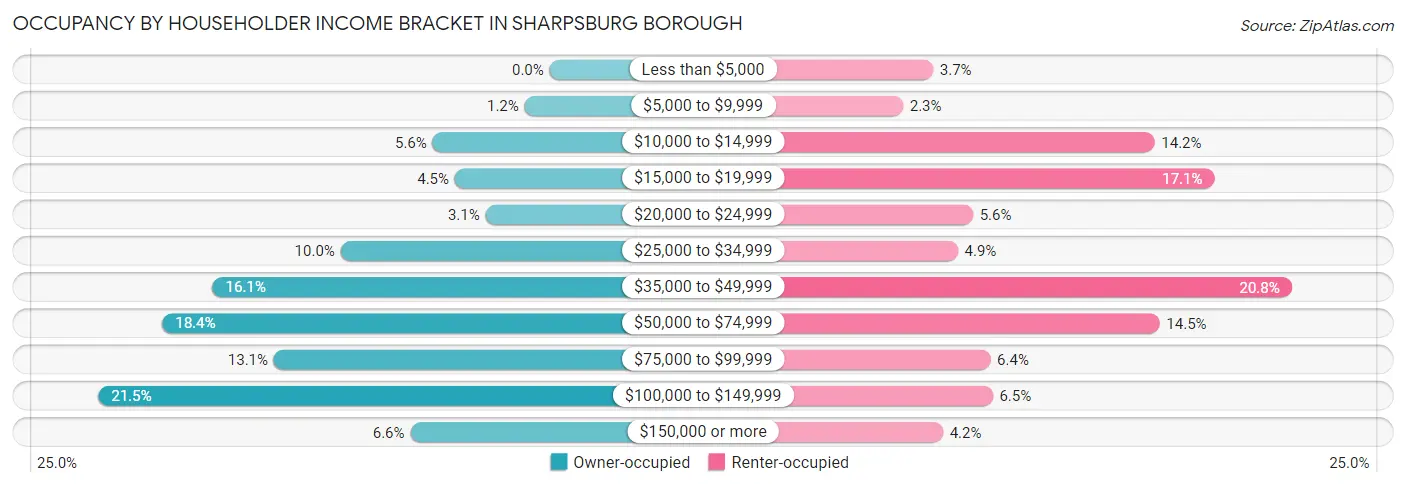
| Income Bracket | Owner-occupied | Renter-occupied |
| Less than $5,000 | 0 (0.0%) | 31 (3.7%) |
| $5,000 to $9,999 | 9 (1.2%) | 19 (2.2%) |
| $10,000 to $14,999 | 42 (5.6%) | 120 (14.2%) |
| $15,000 to $19,999 | 34 (4.5%) | 144 (17.1%) |
| $20,000 to $24,999 | 23 (3.0%) | 47 (5.6%) |
| $25,000 to $34,999 | 75 (10.0%) | 41 (4.9%) |
| $35,000 to $49,999 | 121 (16.1%) | 175 (20.8%) |
| $50,000 to $74,999 | 139 (18.4%) | 122 (14.5%) |
| $75,000 to $99,999 | 99 (13.1%) | 54 (6.4%) |
| $100,000 to $149,999 | 162 (21.5%) | 55 (6.5%) |
| $150,000 or more | 50 (6.6%) | 35 (4.2%) |
| Total | 754 (100.0%) | 843 (100.0%) |
Monthly Housing Cost Tiers in Sharpsburg borough
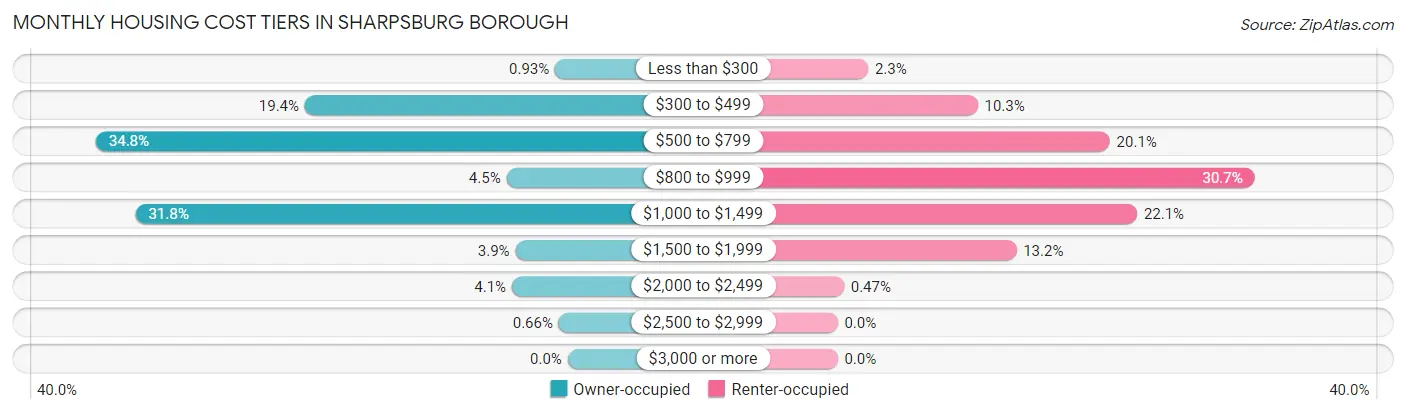
| Monthly Cost | Owner-occupied | Renter-occupied |
| Less than $300 | 7 (0.9%) | 19 (2.2%) |
| $300 to $499 | 146 (19.4%) | 87 (10.3%) |
| $500 to $799 | 262 (34.7%) | 169 (20.1%) |
| $800 to $999 | 34 (4.5%) | 259 (30.7%) |
| $1,000 to $1,499 | 240 (31.8%) | 186 (22.1%) |
| $1,500 to $1,999 | 29 (3.8%) | 111 (13.2%) |
| $2,000 to $2,499 | 31 (4.1%) | 4 (0.5%) |
| $2,500 to $2,999 | 5 (0.7%) | 0 (0.0%) |
| $3,000 or more | 0 (0.0%) | 0 (0.0%) |
| Total | 754 (100.0%) | 843 (100.0%) |
Physical Housing Characteristics in Sharpsburg borough
Housing Structures in Sharpsburg borough
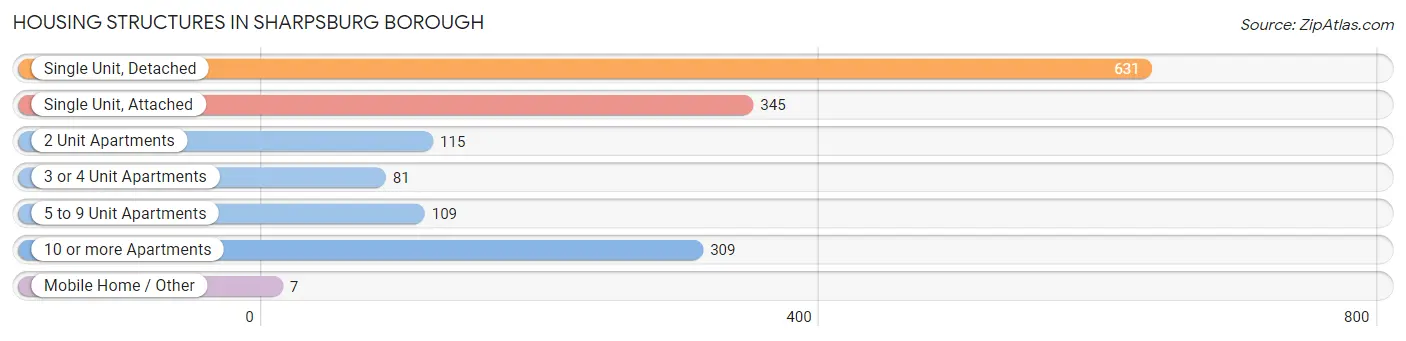
| Structure Type | # Housing Units | % Housing Units |
| Single Unit, Detached | 631 | 39.5% |
| Single Unit, Attached | 345 | 21.6% |
| 2 Unit Apartments | 115 | 7.2% |
| 3 or 4 Unit Apartments | 81 | 5.1% |
| 5 to 9 Unit Apartments | 109 | 6.8% |
| 10 or more Apartments | 309 | 19.4% |
| Mobile Home / Other | 7 | 0.4% |
| Total | 1,597 | 100.0% |
Housing Structures by Occupancy in Sharpsburg borough
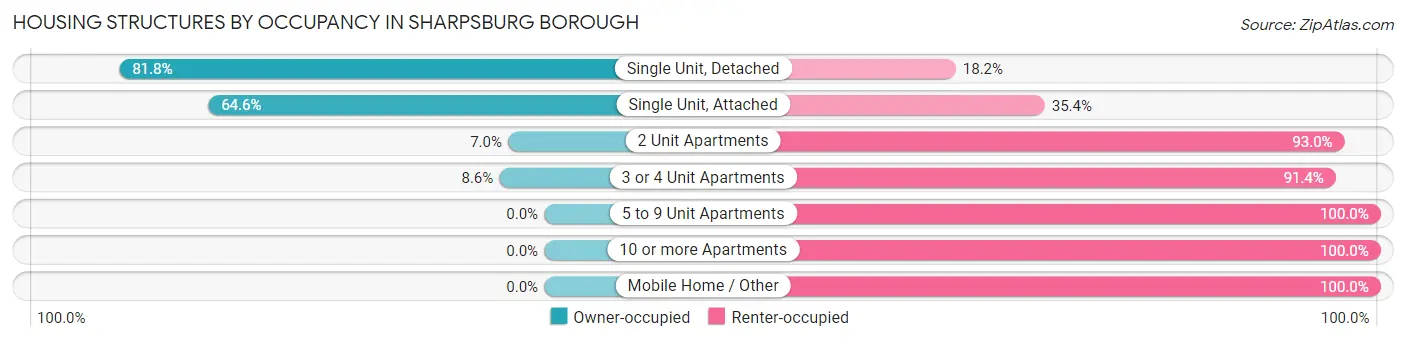
| Structure Type | Owner-occupied | Renter-occupied |
| Single Unit, Detached | 516 (81.8%) | 115 (18.2%) |
| Single Unit, Attached | 223 (64.6%) | 122 (35.4%) |
| 2 Unit Apartments | 8 (7.0%) | 107 (93.0%) |
| 3 or 4 Unit Apartments | 7 (8.6%) | 74 (91.4%) |
| 5 to 9 Unit Apartments | 0 (0.0%) | 109 (100.0%) |
| 10 or more Apartments | 0 (0.0%) | 309 (100.0%) |
| Mobile Home / Other | 0 (0.0%) | 7 (100.0%) |
| Total | 754 (47.2%) | 843 (52.8%) |
Housing Structures by Number of Rooms in Sharpsburg borough
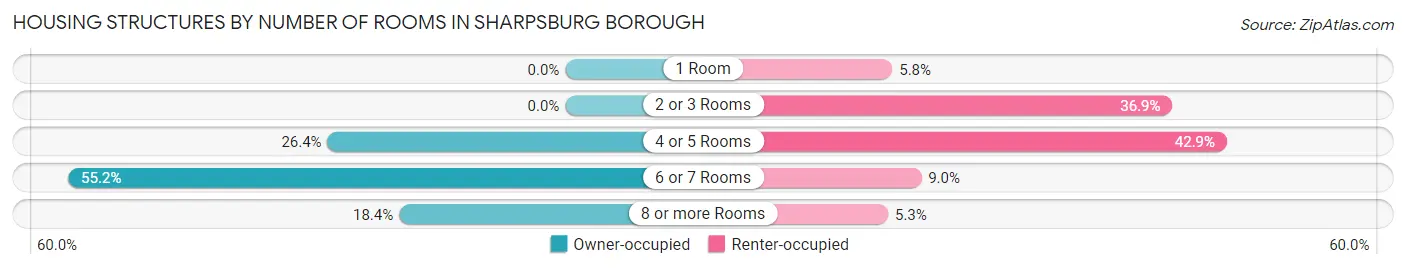
| Number of Rooms | Owner-occupied | Renter-occupied |
| 1 Room | 0 (0.0%) | 49 (5.8%) |
| 2 or 3 Rooms | 0 (0.0%) | 311 (36.9%) |
| 4 or 5 Rooms | 199 (26.4%) | 362 (42.9%) |
| 6 or 7 Rooms | 416 (55.2%) | 76 (9.0%) |
| 8 or more Rooms | 139 (18.4%) | 45 (5.3%) |
| Total | 754 (100.0%) | 843 (100.0%) |
Housing Structure by Heating Type in Sharpsburg borough
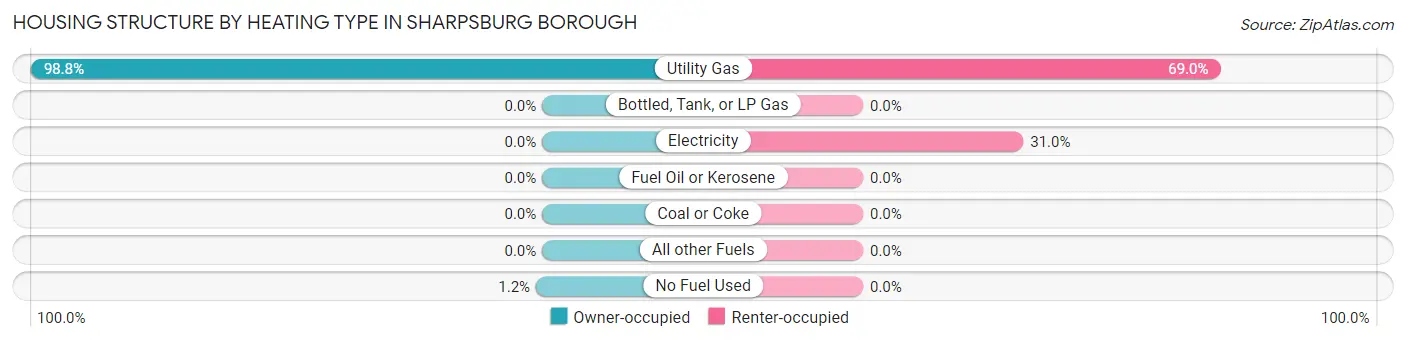
| Heating Type | Owner-occupied | Renter-occupied |
| Utility Gas | 745 (98.8%) | 582 (69.0%) |
| Bottled, Tank, or LP Gas | 0 (0.0%) | 0 (0.0%) |
| Electricity | 0 (0.0%) | 261 (31.0%) |
| Fuel Oil or Kerosene | 0 (0.0%) | 0 (0.0%) |
| Coal or Coke | 0 (0.0%) | 0 (0.0%) |
| All other Fuels | 0 (0.0%) | 0 (0.0%) |
| No Fuel Used | 9 (1.2%) | 0 (0.0%) |
| Total | 754 (100.0%) | 843 (100.0%) |
Household Vehicle Usage in Sharpsburg borough
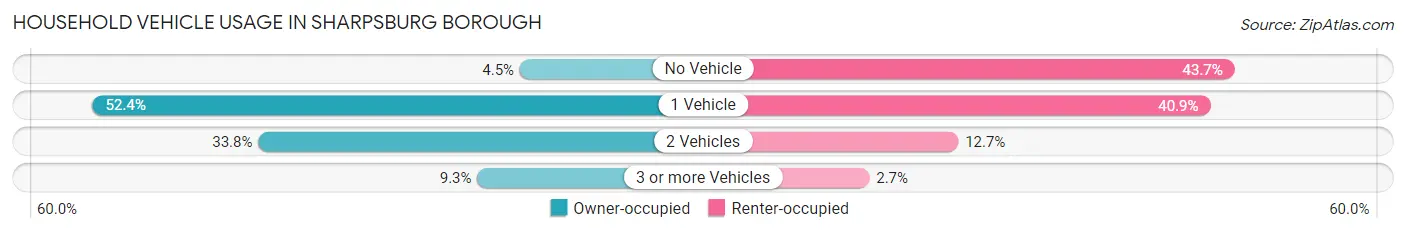
| Vehicles per Household | Owner-occupied | Renter-occupied |
| No Vehicle | 34 (4.5%) | 368 (43.6%) |
| 1 Vehicle | 395 (52.4%) | 345 (40.9%) |
| 2 Vehicles | 255 (33.8%) | 107 (12.7%) |
| 3 or more Vehicles | 70 (9.3%) | 23 (2.7%) |
| Total | 754 (100.0%) | 843 (100.0%) |
Real Estate & Mortgages in Sharpsburg borough
Real Estate and Mortgage Overview in Sharpsburg borough
| Characteristic | Without Mortgage | With Mortgage |
| Housing Units | 404 | 350 |
| Median Property Value | $72,600 | $180,700 |
| Median Household Income | $54,615 | $29 |
| Monthly Housing Costs | $547 | $0 |
| Real Estate Taxes | $1,673 | $0 |
Property Value by Mortgage Status in Sharpsburg borough
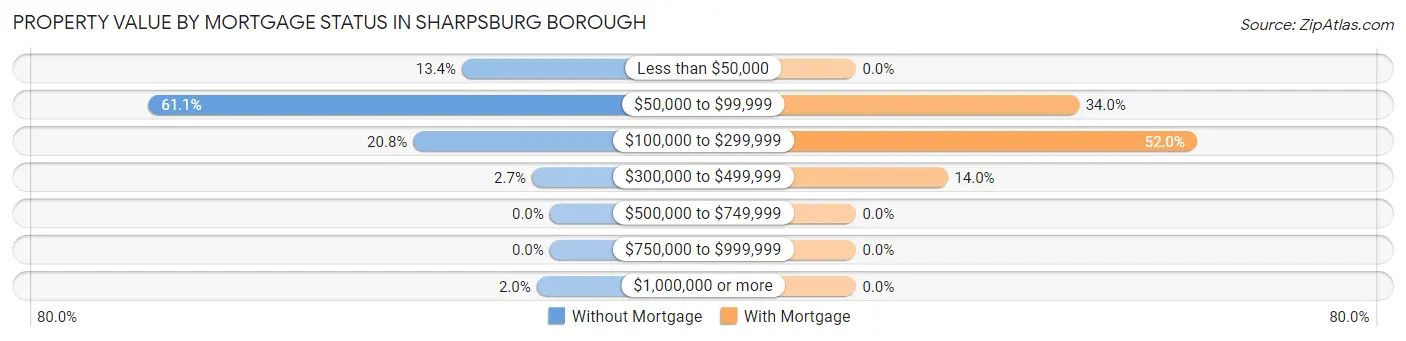
| Property Value | Without Mortgage | With Mortgage |
| Less than $50,000 | 54 (13.4%) | 0 (0.0%) |
| $50,000 to $99,999 | 247 (61.1%) | 119 (34.0%) |
| $100,000 to $299,999 | 84 (20.8%) | 182 (52.0%) |
| $300,000 to $499,999 | 11 (2.7%) | 49 (14.0%) |
| $500,000 to $749,999 | 0 (0.0%) | 0 (0.0%) |
| $750,000 to $999,999 | 0 (0.0%) | 0 (0.0%) |
| $1,000,000 or more | 8 (2.0%) | 0 (0.0%) |
| Total | 404 (100.0%) | 350 (100.0%) |
Household Income by Mortgage Status in Sharpsburg borough
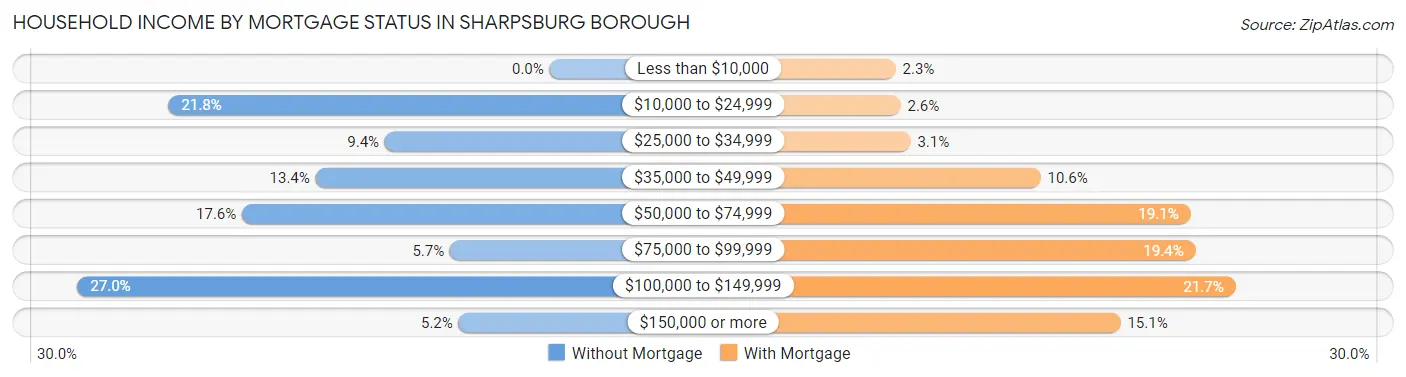
| Household Income | Without Mortgage | With Mortgage |
| Less than $10,000 | 0 (0.0%) | 8 (2.3%) |
| $10,000 to $24,999 | 88 (21.8%) | 9 (2.6%) |
| $25,000 to $34,999 | 38 (9.4%) | 11 (3.1%) |
| $35,000 to $49,999 | 54 (13.4%) | 37 (10.6%) |
| $50,000 to $74,999 | 71 (17.6%) | 67 (19.1%) |
| $75,000 to $99,999 | 23 (5.7%) | 68 (19.4%) |
| $100,000 to $149,999 | 109 (27.0%) | 76 (21.7%) |
| $150,000 or more | 21 (5.2%) | 53 (15.1%) |
| Total | 404 (100.0%) | 350 (100.0%) |
Property Value to Household Income Ratio in Sharpsburg borough
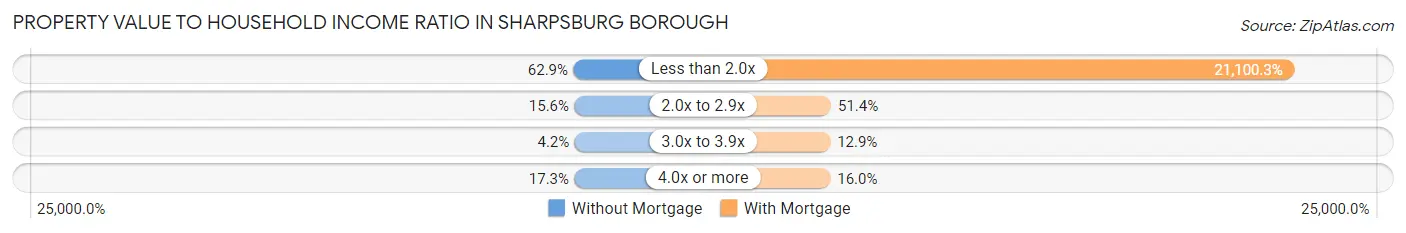
| Value-to-Income Ratio | Without Mortgage | With Mortgage |
| Less than 2.0x | 254 (62.9%) | 73,851 (21,100.3%) |
| 2.0x to 2.9x | 63 (15.6%) | 180 (51.4%) |
| 3.0x to 3.9x | 17 (4.2%) | 45 (12.9%) |
| 4.0x or more | 70 (17.3%) | 56 (16.0%) |
| Total | 404 (100.0%) | 350 (100.0%) |
Real Estate Taxes by Mortgage Status in Sharpsburg borough
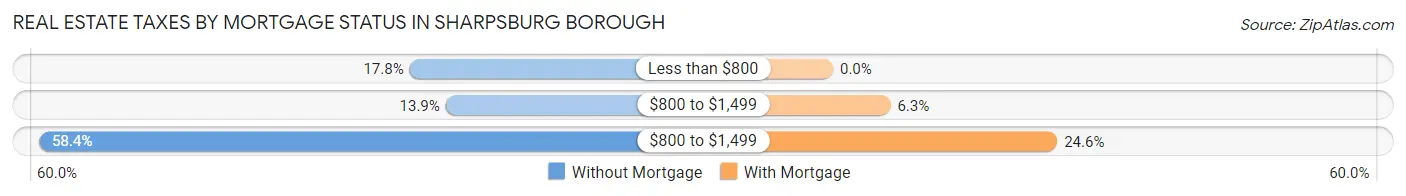
| Property Taxes | Without Mortgage | With Mortgage |
| Less than $800 | 72 (17.8%) | 0 (0.0%) |
| $800 to $1,499 | 56 (13.9%) | 22 (6.3%) |
| $800 to $1,499 | 236 (58.4%) | 86 (24.6%) |
| Total | 404 (100.0%) | 350 (100.0%) |
Health & Disability in Sharpsburg borough
Health Insurance Coverage by Age in Sharpsburg borough
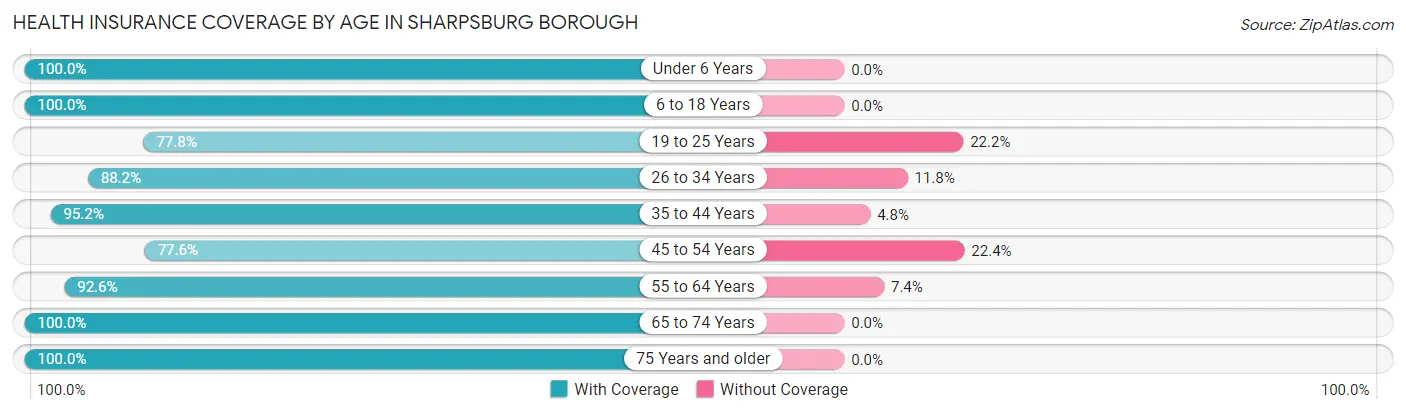
| Age Bracket | With Coverage | Without Coverage |
| Under 6 Years | 143 (100.0%) | 0 (0.0%) |
| 6 to 18 Years | 531 (100.0%) | 0 (0.0%) |
| 19 to 25 Years | 221 (77.8%) | 63 (22.2%) |
| 26 to 34 Years | 479 (88.2%) | 64 (11.8%) |
| 35 to 44 Years | 335 (95.2%) | 17 (4.8%) |
| 45 to 54 Years | 246 (77.6%) | 71 (22.4%) |
| 55 to 64 Years | 475 (92.6%) | 38 (7.4%) |
| 65 to 74 Years | 291 (100.0%) | 0 (0.0%) |
| 75 Years and older | 215 (100.0%) | 0 (0.0%) |
| Total | 2,936 (92.1%) | 253 (7.9%) |
Health Insurance Coverage by Citizenship Status in Sharpsburg borough
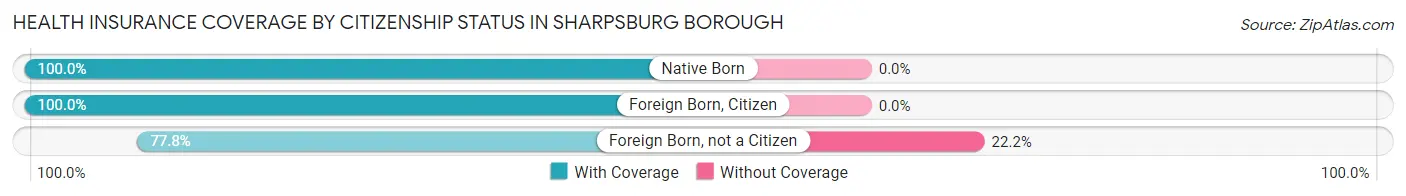
| Citizenship Status | With Coverage | Without Coverage |
| Native Born | 143 (100.0%) | 0 (0.0%) |
| Foreign Born, Citizen | 531 (100.0%) | 0 (0.0%) |
| Foreign Born, not a Citizen | 221 (77.8%) | 63 (22.2%) |
Health Insurance Coverage by Household Income in Sharpsburg borough
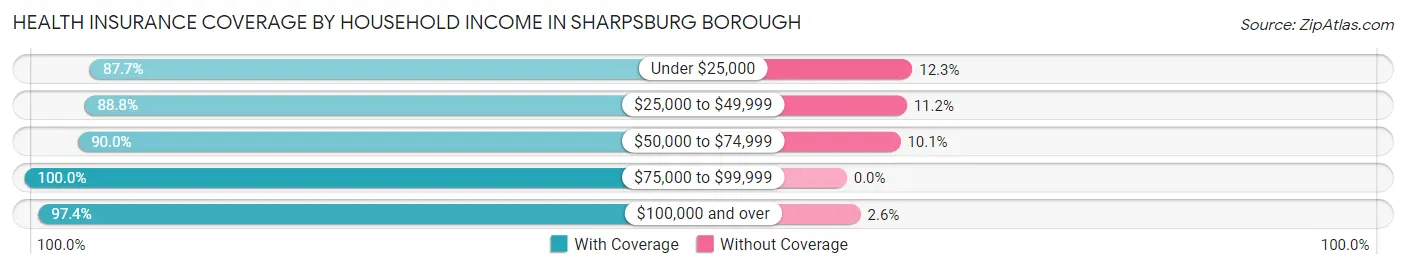
| Household Income | With Coverage | Without Coverage |
| Under $25,000 | 593 (87.7%) | 83 (12.3%) |
| $25,000 to $49,999 | 593 (88.8%) | 75 (11.2%) |
| $50,000 to $74,999 | 671 (89.9%) | 75 (10.1%) |
| $75,000 to $99,999 | 320 (100.0%) | 0 (0.0%) |
| $100,000 and over | 756 (97.4%) | 20 (2.6%) |
Public vs Private Health Insurance Coverage by Age in Sharpsburg borough
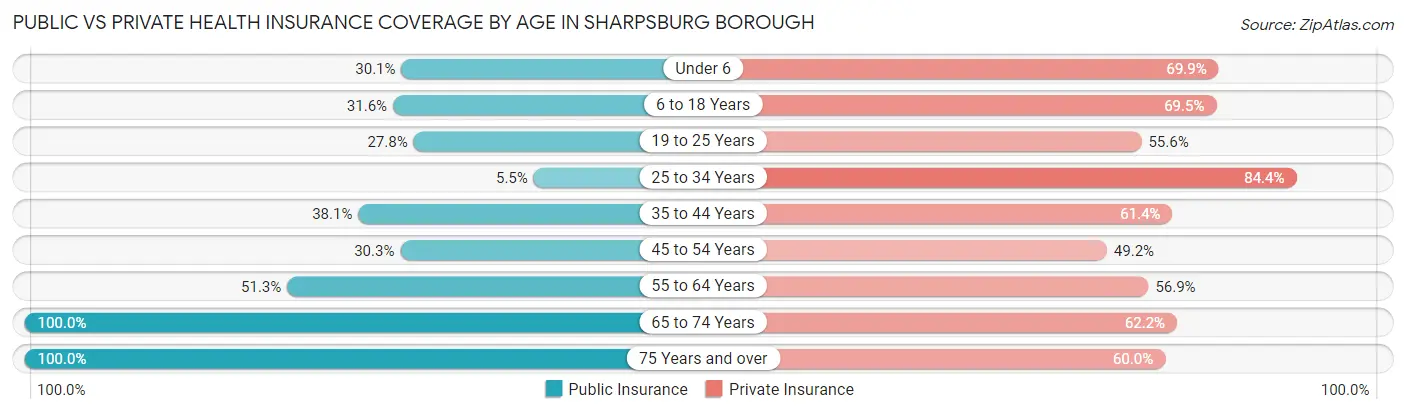
| Age Bracket | Public Insurance | Private Insurance |
| Under 6 | 43 (30.1%) | 100 (69.9%) |
| 6 to 18 Years | 168 (31.6%) | 369 (69.5%) |
| 19 to 25 Years | 79 (27.8%) | 158 (55.6%) |
| 25 to 34 Years | 30 (5.5%) | 458 (84.4%) |
| 35 to 44 Years | 134 (38.1%) | 216 (61.4%) |
| 45 to 54 Years | 96 (30.3%) | 156 (49.2%) |
| 55 to 64 Years | 263 (51.3%) | 292 (56.9%) |
| 65 to 74 Years | 291 (100.0%) | 181 (62.2%) |
| 75 Years and over | 215 (100.0%) | 129 (60.0%) |
| Total | 1,319 (41.4%) | 2,059 (64.6%) |
Disability Status by Sex by Age in Sharpsburg borough
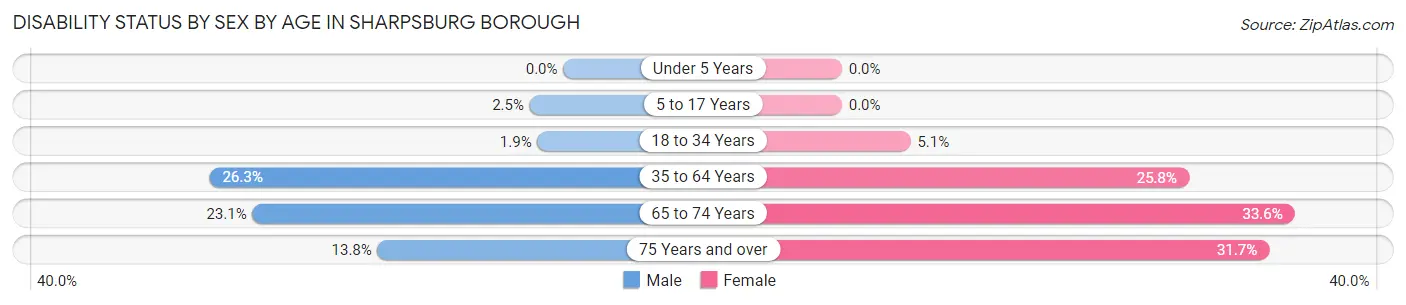
| Age Bracket | Male | Female |
| Under 5 Years | 0 (0.0%) | 0 (0.0%) |
| 5 to 17 Years | 7 (2.5%) | 0 (0.0%) |
| 18 to 34 Years | 7 (1.9%) | 25 (5.1%) |
| 35 to 64 Years | 181 (26.3%) | 127 (25.8%) |
| 65 to 74 Years | 39 (23.1%) | 41 (33.6%) |
| 75 Years and over | 4 (13.8%) | 59 (31.7%) |
Disability Class by Sex by Age in Sharpsburg borough
Disability Class: Hearing Difficulty
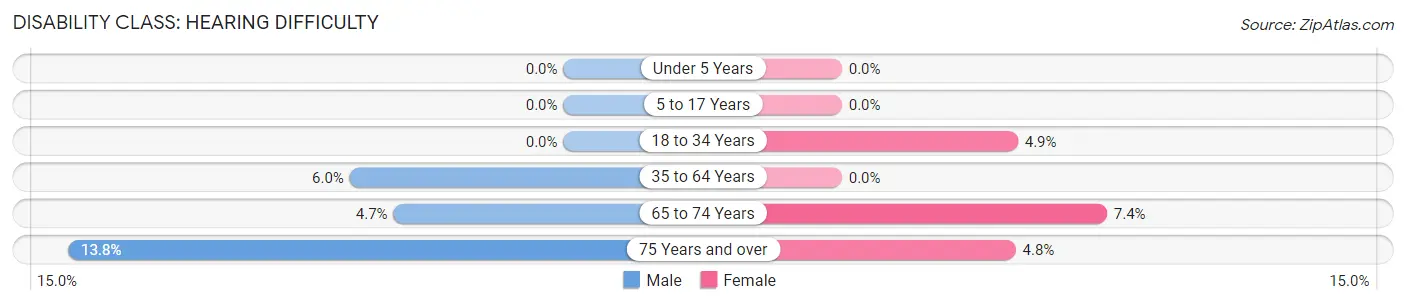
| Age Bracket | Male | Female |
| Under 5 Years | 0 (0.0%) | 0 (0.0%) |
| 5 to 17 Years | 0 (0.0%) | 0 (0.0%) |
| 18 to 34 Years | 0 (0.0%) | 24 (4.9%) |
| 35 to 64 Years | 41 (5.9%) | 0 (0.0%) |
| 65 to 74 Years | 8 (4.7%) | 9 (7.4%) |
| 75 Years and over | 4 (13.8%) | 9 (4.8%) |
Disability Class: Vision Difficulty
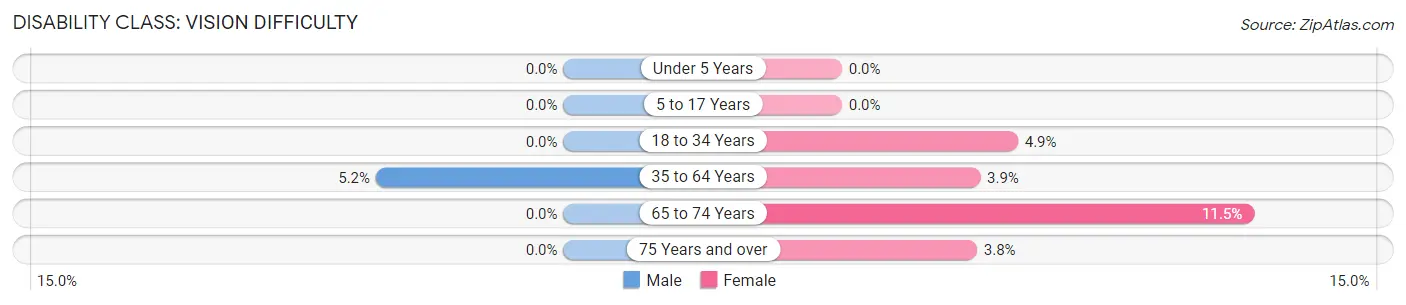
| Age Bracket | Male | Female |
| Under 5 Years | 0 (0.0%) | 0 (0.0%) |
| 5 to 17 Years | 0 (0.0%) | 0 (0.0%) |
| 18 to 34 Years | 0 (0.0%) | 24 (4.9%) |
| 35 to 64 Years | 36 (5.2%) | 19 (3.8%) |
| 65 to 74 Years | 0 (0.0%) | 14 (11.5%) |
| 75 Years and over | 0 (0.0%) | 7 (3.8%) |
Disability Class: Cognitive Difficulty
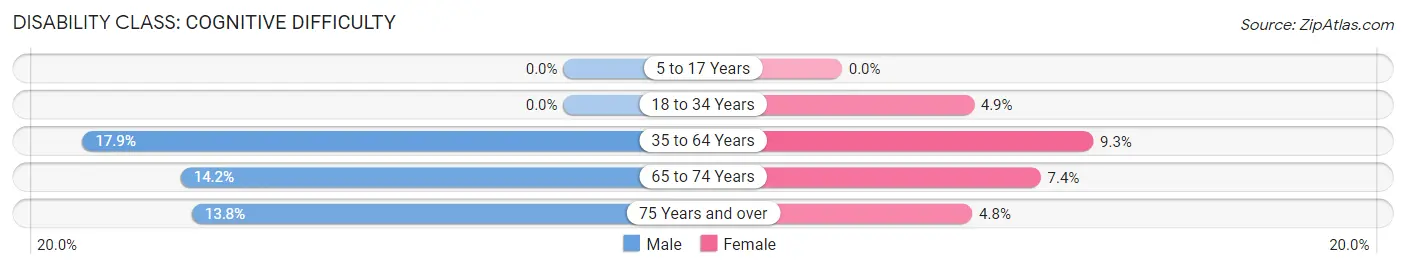
| Age Bracket | Male | Female |
| 5 to 17 Years | 0 (0.0%) | 0 (0.0%) |
| 18 to 34 Years | 0 (0.0%) | 24 (4.9%) |
| 35 to 64 Years | 123 (17.8%) | 46 (9.3%) |
| 65 to 74 Years | 24 (14.2%) | 9 (7.4%) |
| 75 Years and over | 4 (13.8%) | 9 (4.8%) |
Disability Class: Ambulatory Difficulty
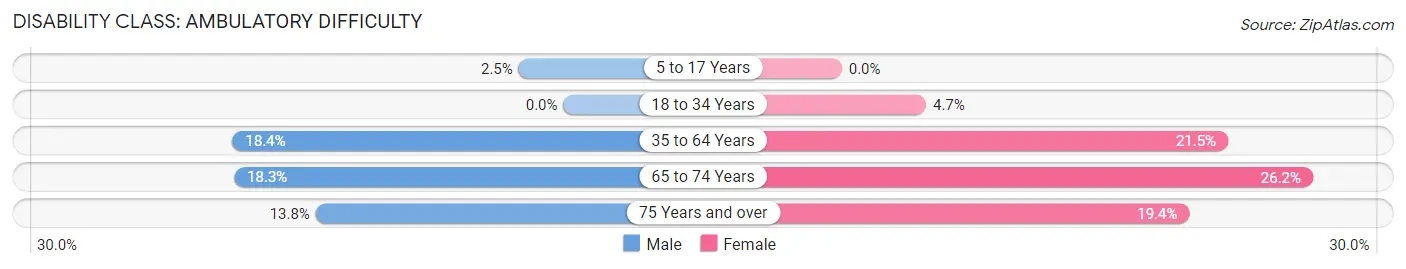
| Age Bracket | Male | Female |
| 5 to 17 Years | 7 (2.5%) | 0 (0.0%) |
| 18 to 34 Years | 0 (0.0%) | 23 (4.7%) |
| 35 to 64 Years | 127 (18.4%) | 106 (21.5%) |
| 65 to 74 Years | 31 (18.3%) | 32 (26.2%) |
| 75 Years and over | 4 (13.8%) | 36 (19.4%) |
Disability Class: Self-Care Difficulty
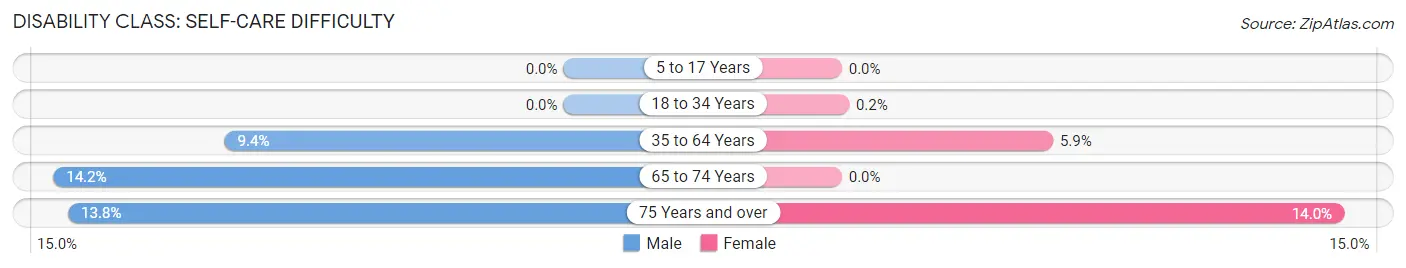
| Age Bracket | Male | Female |
| 5 to 17 Years | 0 (0.0%) | 0 (0.0%) |
| 18 to 34 Years | 0 (0.0%) | 1 (0.2%) |
| 35 to 64 Years | 65 (9.4%) | 29 (5.9%) |
| 65 to 74 Years | 24 (14.2%) | 0 (0.0%) |
| 75 Years and over | 4 (13.8%) | 26 (14.0%) |
Technology Access in Sharpsburg borough
Computing Device Access in Sharpsburg borough
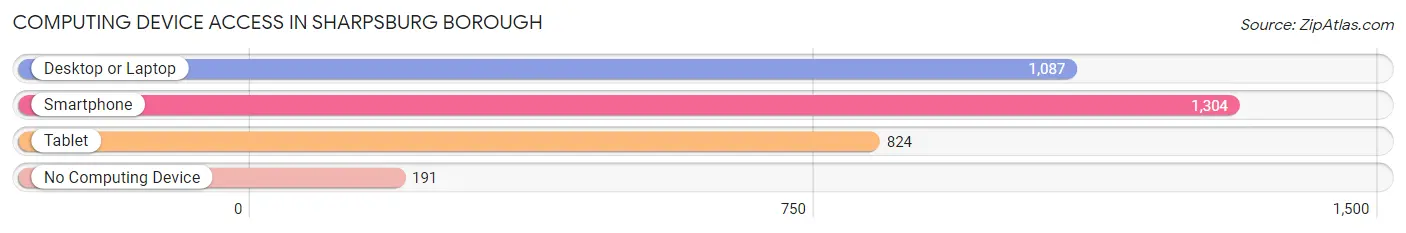
| Device Type | # Households | % Households |
| Desktop or Laptop | 1,087 | 68.1% |
| Smartphone | 1,304 | 81.7% |
| Tablet | 824 | 51.6% |
| No Computing Device | 191 | 12.0% |
| Total | 1,597 | 100.0% |
Internet Access in Sharpsburg borough
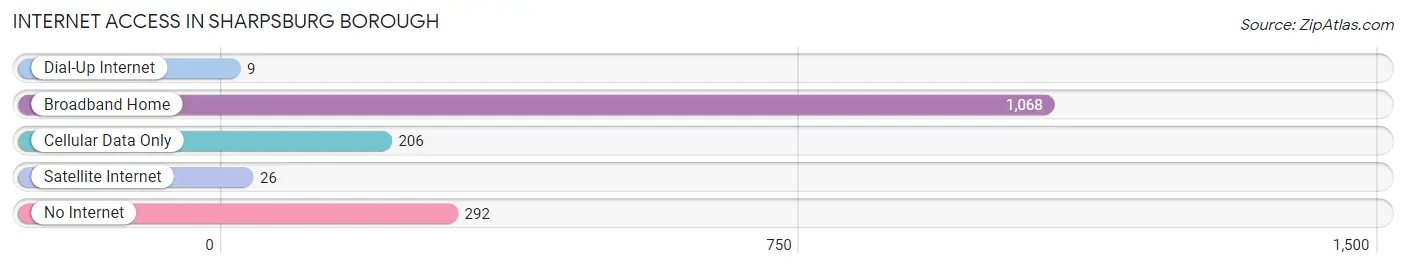
| Internet Type | # Households | % Households |
| Dial-Up Internet | 9 | 0.6% |
| Broadband Home | 1,068 | 66.9% |
| Cellular Data Only | 206 | 12.9% |
| Satellite Internet | 26 | 1.6% |
| No Internet | 292 | 18.3% |
| Total | 1,597 | 100.0% |
Sharpsburg borough Summary
Sharpburg Borough is a small borough located in Allegheny County, Pennsylvania. It is situated along the Monongahela River, just south of the city of Pittsburgh. The borough was founded in 1845 and is home to approximately 2,500 people.
History
Sharpburg Borough was founded in 1845 by a group of German immigrants who had settled in the area. The borough was named after the nearby Sharpsburg Creek, which was named after the Sharpsburg family who had settled in the area in the late 1700s. The borough was originally a farming community, but as the city of Pittsburgh grew, the borough became a bedroom community for the city.
In the late 1800s, the borough began to experience a period of industrialization. The Pittsburgh and Lake Erie Railroad was built through the borough in 1877, and the Pittsburgh and West Virginia Railroad was built in 1881. These railroads brought new industry to the borough, including steel mills, coal mines, and other manufacturing plants.
The borough experienced a period of growth in the early 1900s, as the population increased from 1,000 in 1900 to 2,500 in 1940. During this time, the borough was home to a variety of businesses, including a brewery, a brickyard, and a furniture factory.
Geography
Sharpburg Borough is located in Allegheny County, Pennsylvania. It is situated along the Monongahela River, just south of the city of Pittsburgh. The borough is bordered by the boroughs of Etna and Millvale to the north, and the boroughs of Reserve and West View to the south. The borough is approximately 2.5 square miles in size.
The terrain of the borough is mostly flat, with some rolling hills. The borough is located in the Allegheny Plateau region of Pennsylvania, and is part of the Appalachian Mountains. The borough is located in a humid continental climate zone, with hot summers and cold winters.
Economy
The economy of Sharpburg Borough is largely based on the service industry. The borough is home to a variety of restaurants, bars, and other businesses that serve the local community. The borough is also home to a number of small manufacturing businesses, including a furniture factory and a brewery.
The borough is also home to a number of small retail businesses, including a grocery store, a hardware store, and a variety of other shops. The borough is also home to a number of professional services, such as doctors, lawyers, and accountants.
Demographics
As of the 2010 census, the population of Sharpburg Borough was 2,521. The population is largely white (94.3%), with small percentages of African American (2.3%), Asian (1.2%), and Hispanic (1.2%) residents. The median household income in the borough is $41,944, and the median age is 44.
The borough is home to a variety of religious denominations, including Catholic (44.3%), Protestant (25.2%), and other (30.5%). The borough is also home to a variety of educational institutions, including a public elementary school, a public middle school, and a public high school.
Common Questions
What is Per Capita Income in Sharpsburg borough?
Per Capita income in Sharpsburg borough is $31,623.
What is the Median Family Income in Sharpsburg borough?
Median Family Income in Sharpsburg borough is $66,667.
What is the Median Household income in Sharpsburg borough?
Median Household Income in Sharpsburg borough is $44,571.
What is Income or Wage Gap in Sharpsburg borough?
Income or Wage Gap in Sharpsburg borough is 28.9%.
Women in Sharpsburg borough earn 71.1 cents for every dollar earned by a man.
What is Inequality or Gini Index in Sharpsburg borough?
Inequality or Gini Index in Sharpsburg borough is 0.44.
What is the Total Population of Sharpsburg borough?
Total Population of Sharpsburg borough is 3,189.
What is the Total Male Population of Sharpsburg borough?
Total Male Population of Sharpsburg borough is 1,566.
What is the Total Female Population of Sharpsburg borough?
Total Female Population of Sharpsburg borough is 1,623.
What is the Ratio of Males per 100 Females in Sharpsburg borough?
There are 96.49 Males per 100 Females in Sharpsburg borough.
What is the Ratio of Females per 100 Males in Sharpsburg borough?
There are 103.64 Females per 100 Males in Sharpsburg borough.
What is the Median Population Age in Sharpsburg borough?
Median Population Age in Sharpsburg borough is 36.3 Years.
What is the Average Family Size in Sharpsburg borough
Average Family Size in Sharpsburg borough is 3.0 People.
What is the Average Household Size in Sharpsburg borough
Average Household Size in Sharpsburg borough is 2.0 People.
How Large is the Labor Force in Sharpsburg borough?
There are 1,556 People in the Labor Forcein in Sharpsburg borough.
What is the Percentage of People in the Labor Force in Sharpsburg borough?
56.6% of People are in the Labor Force in Sharpsburg borough.
What is the Unemployment Rate in Sharpsburg borough?
Unemployment Rate in Sharpsburg borough is 10.8%.