Rochester borough, PA Map & Demographics
Rochester borough Overview
$22,297
PER CAPITA INCOME
$53,689
AVG FAMILY INCOME
$40,009
AVG HOUSEHOLD INCOME
23.8%
WAGE / INCOME GAP [ % ]
76.2¢/ $1
WAGE / INCOME GAP [ $ ]
0.41
INEQUALITY / GINI INDEX
3,460
TOTAL POPULATION
1,647
MALE POPULATION
1,813
FEMALE POPULATION
90.84
MALES / 100 FEMALES
110.08
FEMALES / 100 MALES
38.5
MEDIAN AGE
3.0
AVG FAMILY SIZE
2.1
AVG HOUSEHOLD SIZE
1,647
LABOR FORCE [ PEOPLE ]
59.3%
PERCENT IN LABOR FORCE
5.9%
UNEMPLOYMENT RATE
Income in Rochester borough
Income Overview in Rochester borough
Per Capita Income in Rochester borough is $22,297, while median incomes of families and households are $53,689 and $40,009 respectively.
| Characteristic | Number | Measure |
| Per Capita Income | 3,460 | $22,297 |
| Median Family Income | 801 | $53,689 |
| Mean Family Income | 801 | $63,917 |
| Median Household Income | 1,591 | $40,009 |
| Mean Household Income | 1,591 | $47,806 |
| Income Deficit | 801 | $0 |
| Wage / Income Gap (%) | 3,460 | 23.82% |
| Wage / Income Gap ($) | 3,460 | 76.18¢ per $1 |
| Gini / Inequality Index | 3,460 | 0.41 |
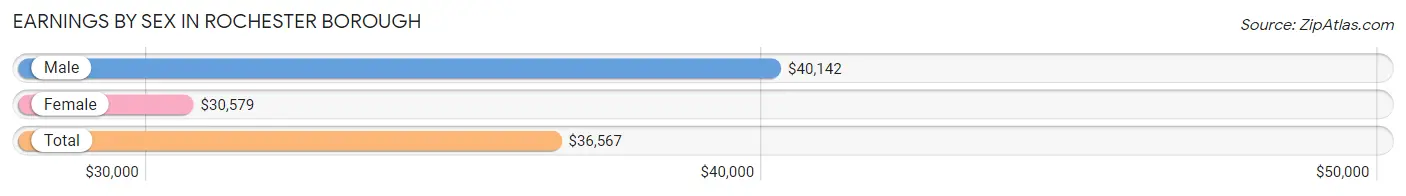
Earnings by Sex in Rochester borough
Average Earnings in Rochester borough are $36,567, $40,142 for men and $30,579 for women, a difference of 23.8%.
| Sex | Number | Average Earnings |
| Male | 909 (56.5%) | $40,142 |
| Female | 701 (43.5%) | $30,579 |
| Total | 1,610 (100.0%) | $36,567 |
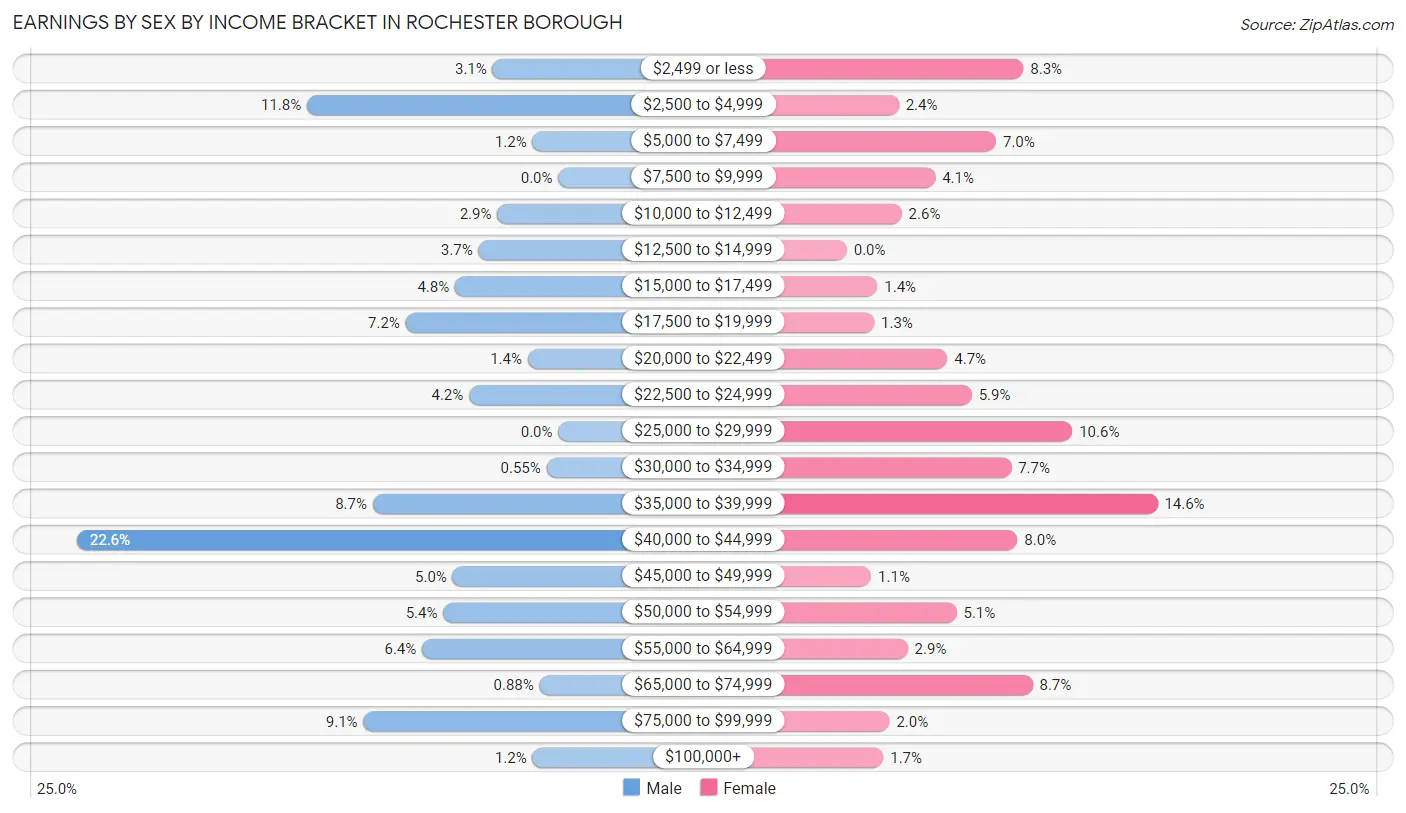
Earnings by Sex by Income Bracket in Rochester borough
The most common earnings brackets in Rochester borough are $40,000 to $44,999 for men (205 | 22.6%) and $35,000 to $39,999 for women (102 | 14.5%).
| Income | Male | Female |
| $2,499 or less | 28 (3.1%) | 58 (8.3%) |
| $2,500 to $4,999 | 107 (11.8%) | 17 (2.4%) |
| $5,000 to $7,499 | 11 (1.2%) | 49 (7.0%) |
| $7,500 to $9,999 | 0 (0.0%) | 29 (4.1%) |
| $10,000 to $12,499 | 26 (2.9%) | 18 (2.6%) |
| $12,500 to $14,999 | 34 (3.7%) | 0 (0.0%) |
| $15,000 to $17,499 | 44 (4.8%) | 10 (1.4%) |
| $17,500 to $19,999 | 65 (7.1%) | 9 (1.3%) |
| $20,000 to $22,499 | 13 (1.4%) | 33 (4.7%) |
| $22,500 to $24,999 | 38 (4.2%) | 41 (5.9%) |
| $25,000 to $29,999 | 0 (0.0%) | 74 (10.6%) |
| $30,000 to $34,999 | 5 (0.5%) | 54 (7.7%) |
| $35,000 to $39,999 | 79 (8.7%) | 102 (14.5%) |
| $40,000 to $44,999 | 205 (22.6%) | 56 (8.0%) |
| $45,000 to $49,999 | 45 (5.0%) | 8 (1.1%) |
| $50,000 to $54,999 | 49 (5.4%) | 36 (5.1%) |
| $55,000 to $64,999 | 58 (6.4%) | 20 (2.9%) |
| $65,000 to $74,999 | 8 (0.9%) | 61 (8.7%) |
| $75,000 to $99,999 | 83 (9.1%) | 14 (2.0%) |
| $100,000+ | 11 (1.2%) | 12 (1.7%) |
| Total | 909 (100.0%) | 701 (100.0%) |
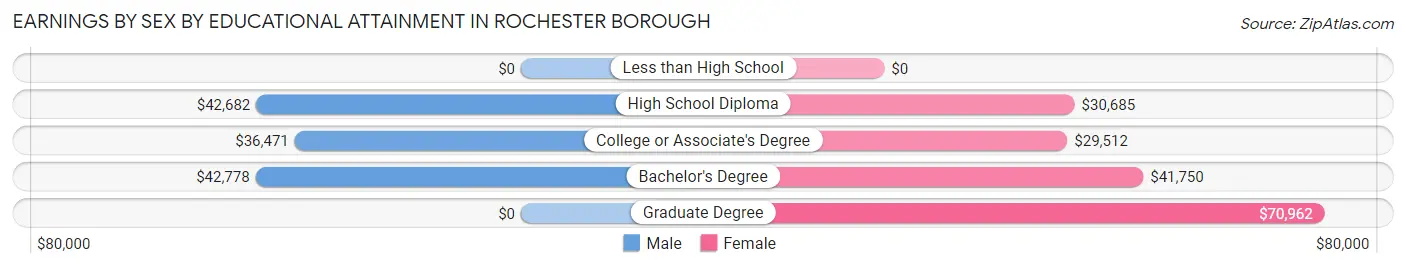
Earnings by Sex by Educational Attainment in Rochester borough
Average earnings in Rochester borough are $41,725 for men and $32,106 for women, a difference of 23.1%. Men with an educational attainment of bachelor's degree enjoy the highest average annual earnings of $42,778, while those with college or associate's degree education earn the least with $36,471. Women with an educational attainment of graduate degree earn the most with the average annual earnings of $70,962, while those with college or associate's degree education have the smallest earnings of $29,512.
| Educational Attainment | Male Income | Female Income |
| Less than High School | - | - |
| High School Diploma | $42,682 | $30,685 |
| College or Associate's Degree | $36,471 | $29,512 |
| Bachelor's Degree | $42,778 | $41,750 |
| Graduate Degree | - | - |
| Total | $41,725 | $32,106 |
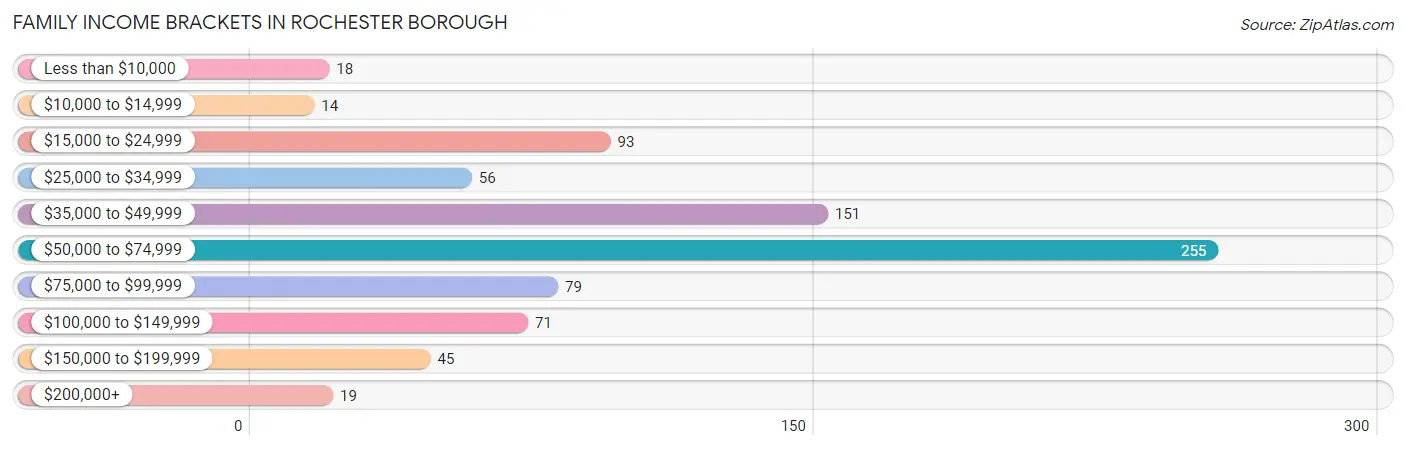
Family Income in Rochester borough
Family Income Brackets in Rochester borough
According to the Rochester borough family income data, there are 255 families falling into the $50,000 to $74,999 income range, which is the most common income bracket and makes up 31.8% of all families. Conversely, the $10,000 to $14,999 income bracket is the least frequent group with only 14 families (1.8%) belonging to this category.
| Income Bracket | # Families | % Families |
| Less than $10,000 | 18 | 2.2% |
| $10,000 to $14,999 | 14 | 1.7% |
| $15,000 to $24,999 | 93 | 11.6% |
| $25,000 to $34,999 | 56 | 7.0% |
| $35,000 to $49,999 | 151 | 18.9% |
| $50,000 to $74,999 | 255 | 31.8% |
| $75,000 to $99,999 | 79 | 9.9% |
| $100,000 to $149,999 | 71 | 8.9% |
| $150,000 to $199,999 | 45 | 5.6% |
| $200,000+ | 19 | 2.4% |
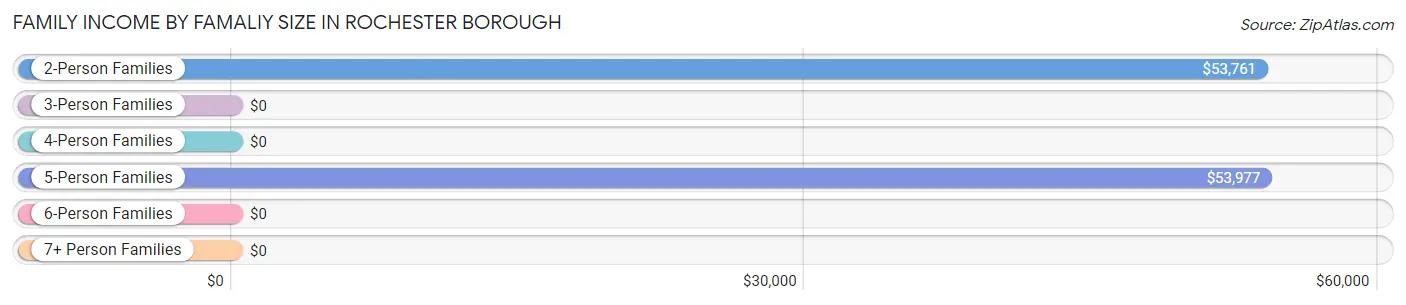
Family Income by Famaliy Size in Rochester borough
5-person families (79 | 9.9%) account for the highest median family income in Rochester borough with $53,977 per family, while 2-person families (382 | 47.7%) have the highest median income of $26,880 per family member.
| Income Bracket | # Families | Median Income |
| 2-Person Families | 382 (47.7%) | $53,761 |
| 3-Person Families | 171 (21.3%) | $0 |
| 4-Person Families | 160 (20.0%) | $0 |
| 5-Person Families | 79 (9.9%) | $53,977 |
| 6-Person Families | 9 (1.1%) | $0 |
| 7+ Person Families | 0 (0.0%) | $0 |
| Total | 801 (100.0%) | $53,689 |
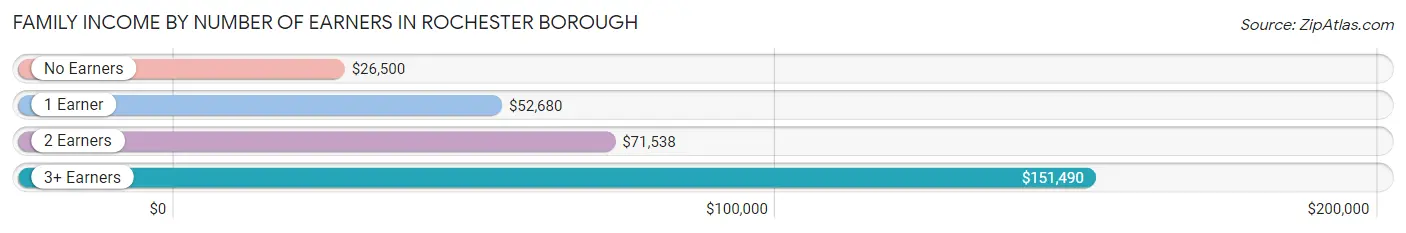
Family Income by Number of Earners in Rochester borough
The median family income in Rochester borough is $53,689, with families comprising 3+ earners (59) having the highest median family income of $151,490, while families with no earners (124) have the lowest median family income of $26,500, accounting for 7.4% and 15.5% of families, respectively.
| Number of Earners | # Families | Median Income |
| No Earners | 124 (15.5%) | $26,500 |
| 1 Earner | 364 (45.4%) | $52,680 |
| 2 Earners | 254 (31.7%) | $71,538 |
| 3+ Earners | 59 (7.4%) | $151,490 |
| Total | 801 (100.0%) | $53,689 |
Household Income in Rochester borough
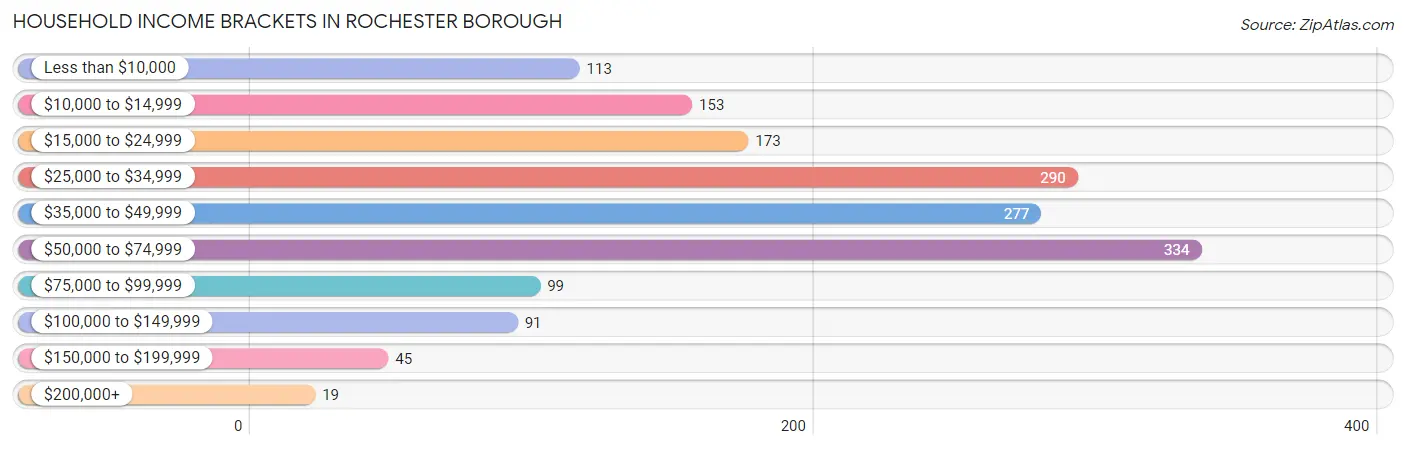
Household Income Brackets in Rochester borough
With 334 households falling in the category, the $50,000 to $74,999 income range is the most frequent in Rochester borough, accounting for 21.0% of all households. In contrast, only 19 households (1.2%) fall into the $200,000+ income bracket, making it the least populous group.
| Income Bracket | # Households | % Households |
| Less than $10,000 | 113 | 7.1% |
| $10,000 to $14,999 | 153 | 9.6% |
| $15,000 to $24,999 | 173 | 10.9% |
| $25,000 to $34,999 | 290 | 18.2% |
| $35,000 to $49,999 | 277 | 17.4% |
| $50,000 to $74,999 | 334 | 21.0% |
| $75,000 to $99,999 | 99 | 6.2% |
| $100,000 to $149,999 | 91 | 5.7% |
| $150,000 to $199,999 | 45 | 2.8% |
| $200,000+ | 19 | 1.2% |
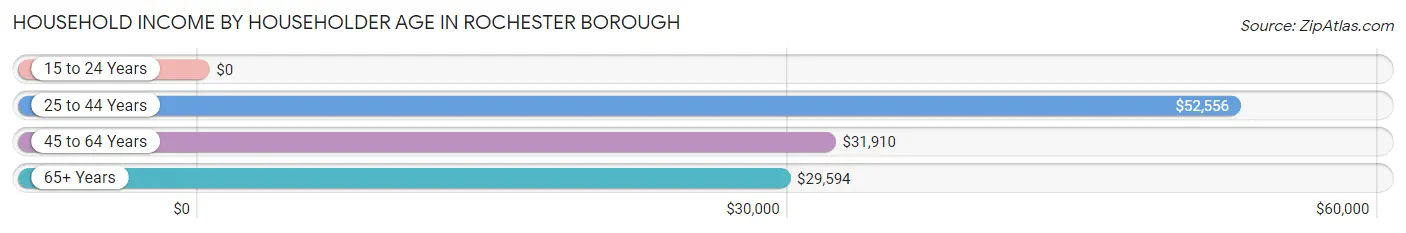
Household Income by Householder Age in Rochester borough
The median household income in Rochester borough is $40,009, with the highest median household income of $52,556 found in the 25 to 44 years age bracket for the primary householder. A total of 553 households (34.8%) fall into this category.
| Income Bracket | # Households | Median Income |
| 15 to 24 Years | 0 (0.0%) | $0 |
| 25 to 44 Years | 553 (34.8%) | $52,556 |
| 45 to 64 Years | 731 (46.0%) | $31,910 |
| 65+ Years | 307 (19.3%) | $29,594 |
| Total | 1,591 (100.0%) | $40,009 |
Poverty in Rochester borough
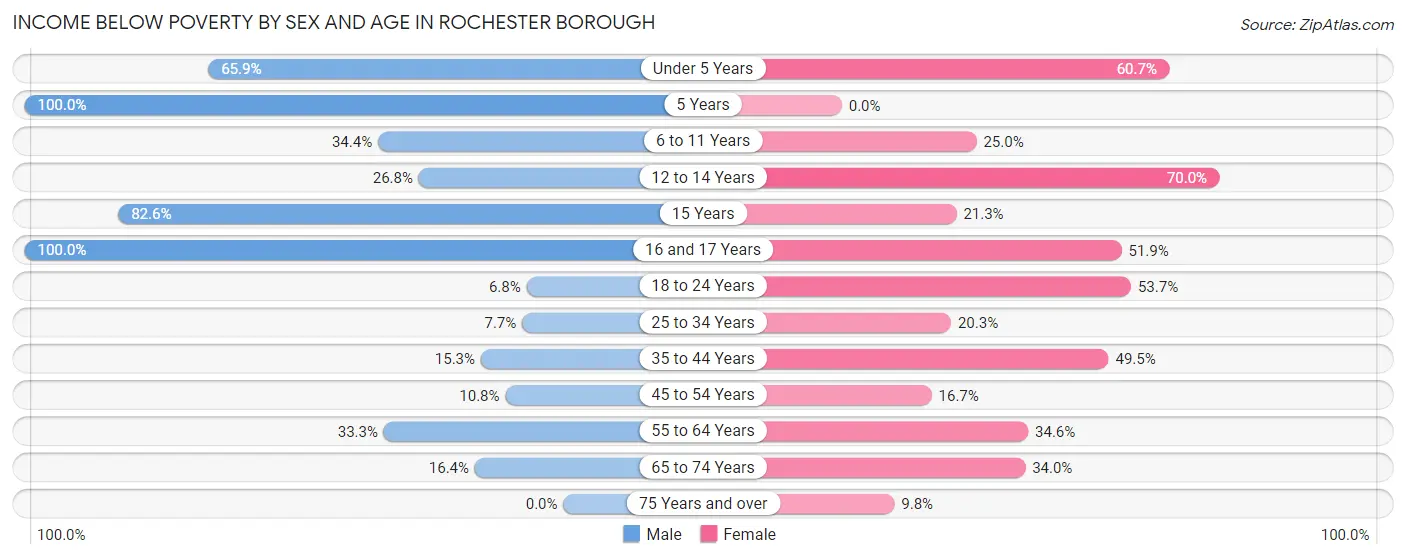
Income Below Poverty by Sex and Age in Rochester borough
With 23.3% poverty level for males and 33.8% for females among the residents of Rochester borough, 5 year old males and 12 to 14 year old females are the most vulnerable to poverty, with 45 males (100.0%) and 49 females (70.0%) in their respective age groups living below the poverty level.
| Age Bracket | Male | Female |
| Under 5 Years | 58 (65.9%) | 71 (60.7%) |
| 5 Years | 45 (100.0%) | 0 (0.0%) |
| 6 to 11 Years | 32 (34.4%) | 31 (25.0%) |
| 12 to 14 Years | 11 (26.8%) | 49 (70.0%) |
| 15 Years | 38 (82.6%) | 10 (21.3%) |
| 16 and 17 Years | 11 (100.0%) | 27 (51.9%) |
| 18 to 24 Years | 11 (6.8%) | 51 (53.7%) |
| 25 to 34 Years | 18 (7.7%) | 61 (20.3%) |
| 35 to 44 Years | 45 (15.3%) | 101 (49.5%) |
| 45 to 54 Years | 24 (10.8%) | 28 (16.7%) |
| 55 to 64 Years | 72 (33.3%) | 129 (34.6%) |
| 65 to 74 Years | 11 (16.4%) | 32 (34.0%) |
| 75 Years and over | 0 (0.0%) | 12 (9.8%) |
| Total | 376 (23.3%) | 602 (33.8%) |
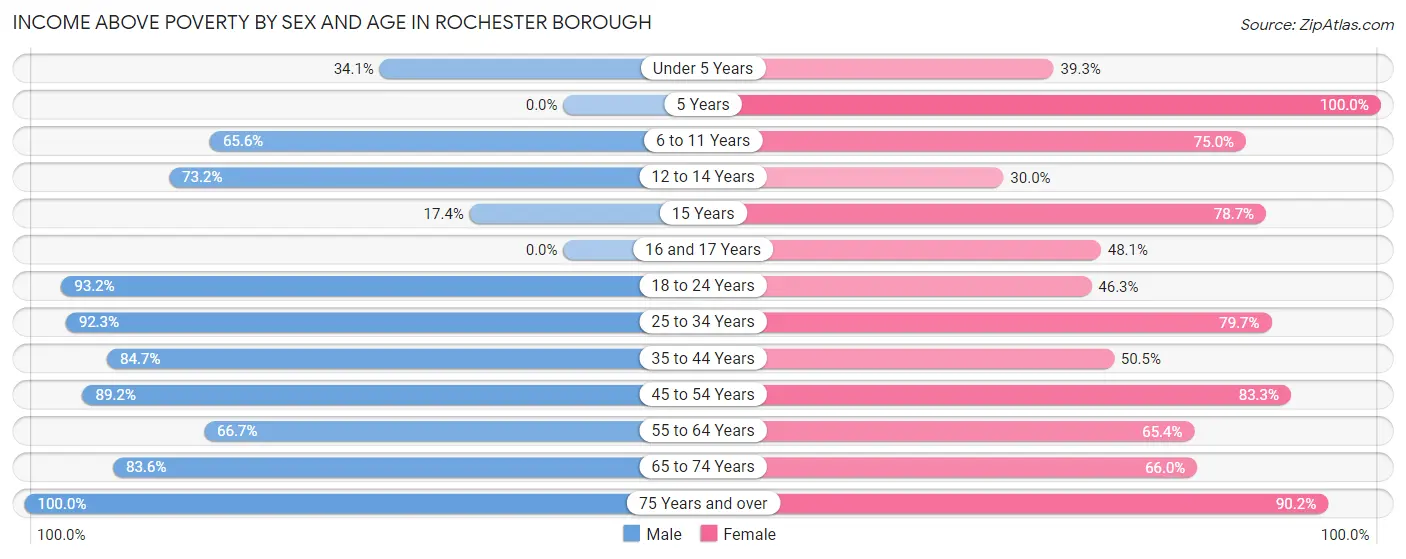
Income Above Poverty by Sex and Age in Rochester borough
According to the poverty statistics in Rochester borough, males aged 75 years and over and females aged 5 years are the age groups that are most secure financially, with 100.0% of males and 100.0% of females in these age groups living above the poverty line.
| Age Bracket | Male | Female |
| Under 5 Years | 30 (34.1%) | 46 (39.3%) |
| 5 Years | 0 (0.0%) | 12 (100.0%) |
| 6 to 11 Years | 61 (65.6%) | 93 (75.0%) |
| 12 to 14 Years | 30 (73.2%) | 21 (30.0%) |
| 15 Years | 8 (17.4%) | 37 (78.7%) |
| 16 and 17 Years | 0 (0.0%) | 25 (48.1%) |
| 18 to 24 Years | 150 (93.2%) | 44 (46.3%) |
| 25 to 34 Years | 217 (92.3%) | 240 (79.7%) |
| 35 to 44 Years | 249 (84.7%) | 103 (50.5%) |
| 45 to 54 Years | 199 (89.2%) | 140 (83.3%) |
| 55 to 64 Years | 144 (66.7%) | 244 (65.4%) |
| 65 to 74 Years | 56 (83.6%) | 62 (66.0%) |
| 75 Years and over | 97 (100.0%) | 111 (90.2%) |
| Total | 1,241 (76.7%) | 1,178 (66.2%) |
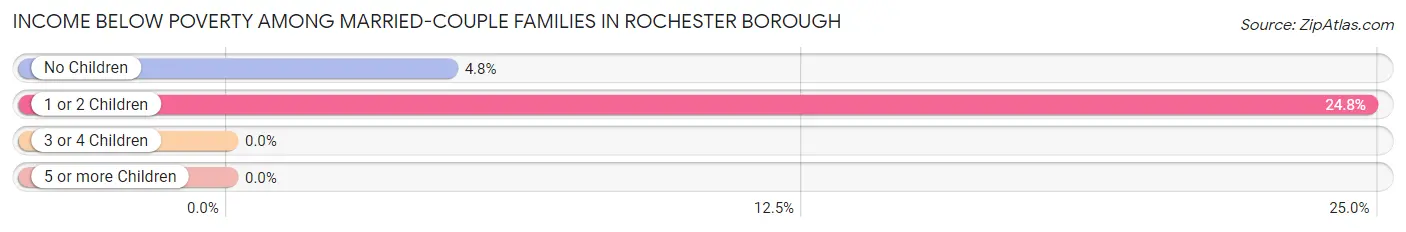
Income Below Poverty Among Married-Couple Families in Rochester borough
The poverty statistics for married-couple families in Rochester borough show that 9.8% or 48 of the total 490 families live below the poverty line. Families with 1 or 2 children have the highest poverty rate of 24.8%, comprising of 31 families. On the other hand, families with 3 or 4 children have the lowest poverty rate of 0.0%, which includes 0 families.
| Children | Above Poverty | Below Poverty |
| No Children | 339 (95.2%) | 17 (4.8%) |
| 1 or 2 Children | 94 (75.2%) | 31 (24.8%) |
| 3 or 4 Children | 9 (100.0%) | 0 (0.0%) |
| 5 or more Children | 0 (0.0%) | 0 (0.0%) |
| Total | 442 (90.2%) | 48 (9.8%) |
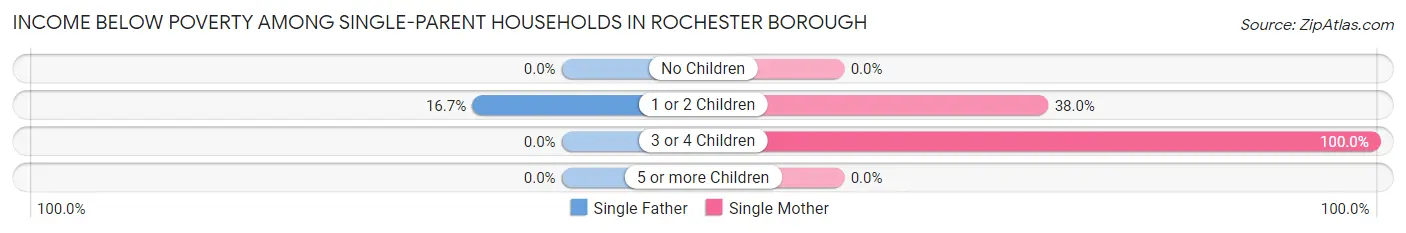
Income Below Poverty Among Single-Parent Households in Rochester borough
According to the poverty data in Rochester borough, 16.7% or 12 single-father households and 36.4% or 87 single-mother households are living below the poverty line. Among single-father households, those with 1 or 2 children have the highest poverty rate, with 12 households (16.7%) experiencing poverty. Likewise, among single-mother households, those with 3 or 4 children have the highest poverty rate, with 49 households (100.0%) falling below the poverty line.
| Children | Single Father | Single Mother |
| No Children | 0 (0.0%) | 0 (0.0%) |
| 1 or 2 Children | 12 (16.7%) | 38 (38.0%) |
| 3 or 4 Children | 0 (0.0%) | 49 (100.0%) |
| 5 or more Children | 0 (0.0%) | 0 (0.0%) |
| Total | 12 (16.7%) | 87 (36.4%) |
Income Below Poverty Among Married-Couple vs Single-Parent Households in Rochester borough
The poverty data for Rochester borough shows that 48 of the married-couple family households (9.8%) and 99 of the single-parent households (31.8%) are living below the poverty level. Within the married-couple family households, those with 1 or 2 children have the highest poverty rate, with 31 households (24.8%) falling below the poverty line. Among the single-parent households, those with 3 or 4 children have the highest poverty rate, with 49 household (100.0%) living below poverty.
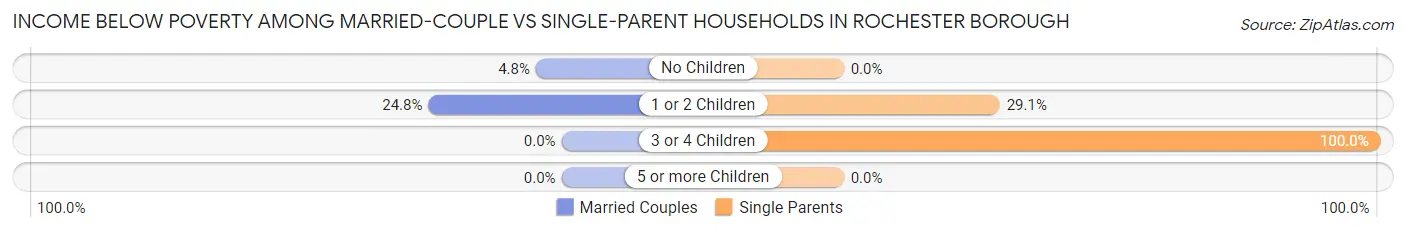
| Children | Married-Couple Families | Single-Parent Households |
| No Children | 17 (4.8%) | 0 (0.0%) |
| 1 or 2 Children | 31 (24.8%) | 50 (29.1%) |
| 3 or 4 Children | 0 (0.0%) | 49 (100.0%) |
| 5 or more Children | 0 (0.0%) | 0 (0.0%) |
| Total | 48 (9.8%) | 99 (31.8%) |
Race in Rochester borough
The most populous races in Rochester borough are White / Caucasian (2,742 | 79.2%), Black / African American (495 | 14.3%), and Two or more Races (200 | 5.8%).
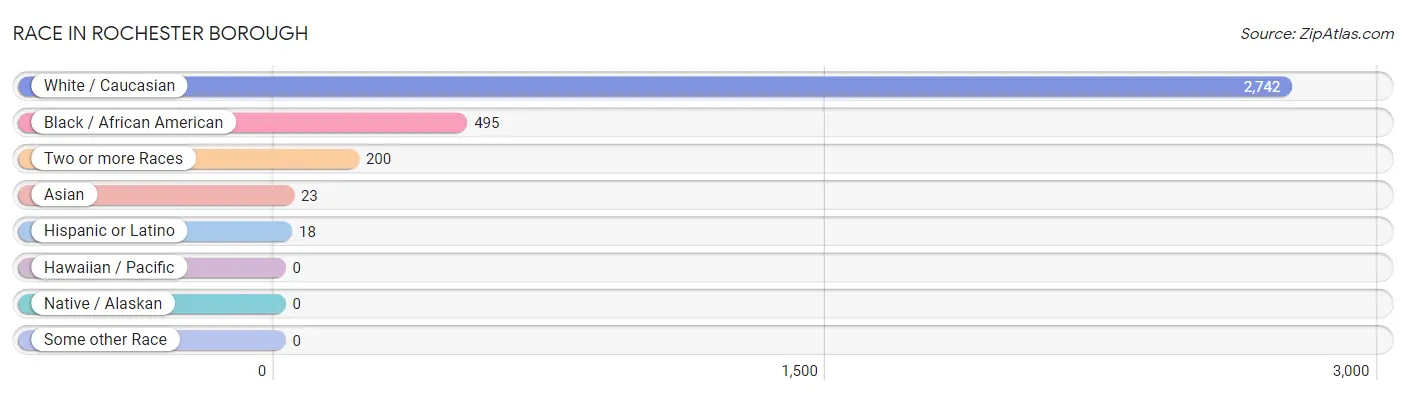
| Race | # Population | % Population |
| Asian | 23 | 0.7% |
| Black / African American | 495 | 14.3% |
| Hawaiian / Pacific | 0 | 0.0% |
| Hispanic or Latino | 18 | 0.5% |
| Native / Alaskan | 0 | 0.0% |
| White / Caucasian | 2,742 | 79.2% |
| Two or more Races | 200 | 5.8% |
| Some other Race | 0 | 0.0% |
| Total | 3,460 | 100.0% |
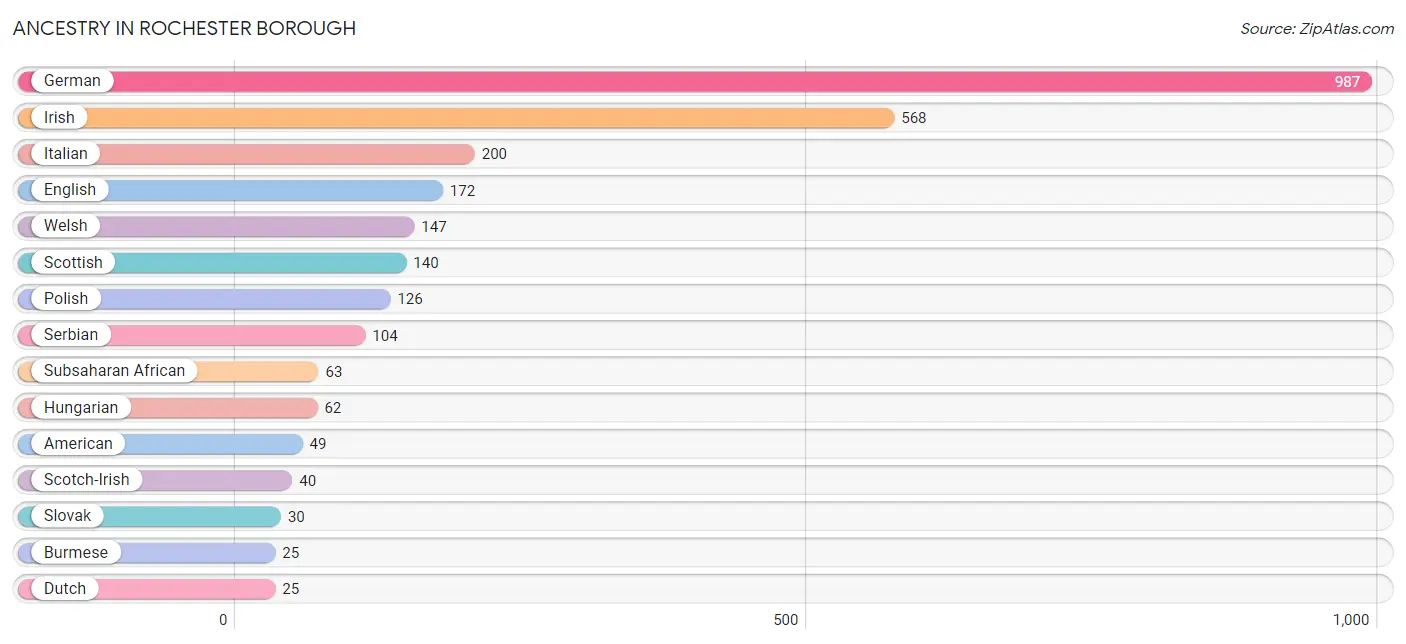
Ancestry in Rochester borough
The most populous ancestries reported in Rochester borough are German (987 | 28.5%), Irish (568 | 16.4%), Italian (200 | 5.8%), English (172 | 5.0%), and Welsh (147 | 4.3%), together accounting for 59.9% of all Rochester borough residents.
| Ancestry | # Population | % Population |
| African | 21 | 0.6% |
| American | 49 | 1.4% |
| Bhutanese | 12 | 0.4% |
| British | 11 | 0.3% |
| Burmese | 25 | 0.7% |
| Croatian | 11 | 0.3% |
| Czech | 19 | 0.5% |
| Dutch | 25 | 0.7% |
| English | 172 | 5.0% |
| French | 20 | 0.6% |
| French Canadian | 11 | 0.3% |
| German | 987 | 28.5% |
| Hungarian | 62 | 1.8% |
| Irish | 568 | 16.4% |
| Italian | 200 | 5.8% |
| Korean | 12 | 0.4% |
| Liberian | 16 | 0.5% |
| Polish | 126 | 3.6% |
| Portuguese | 11 | 0.3% |
| Puerto Rican | 1 | 0.0% |
| Scandinavian | 9 | 0.3% |
| Scotch-Irish | 40 | 1.2% |
| Scottish | 140 | 4.1% |
| Serbian | 104 | 3.0% |
| Slovak | 30 | 0.9% |
| Spaniard | 17 | 0.5% |
| Subsaharan African | 63 | 1.8% |
| Swedish | 9 | 0.3% |
| Turkish | 11 | 0.3% |
| Welsh | 147 | 4.3% | View All 30 Rows |
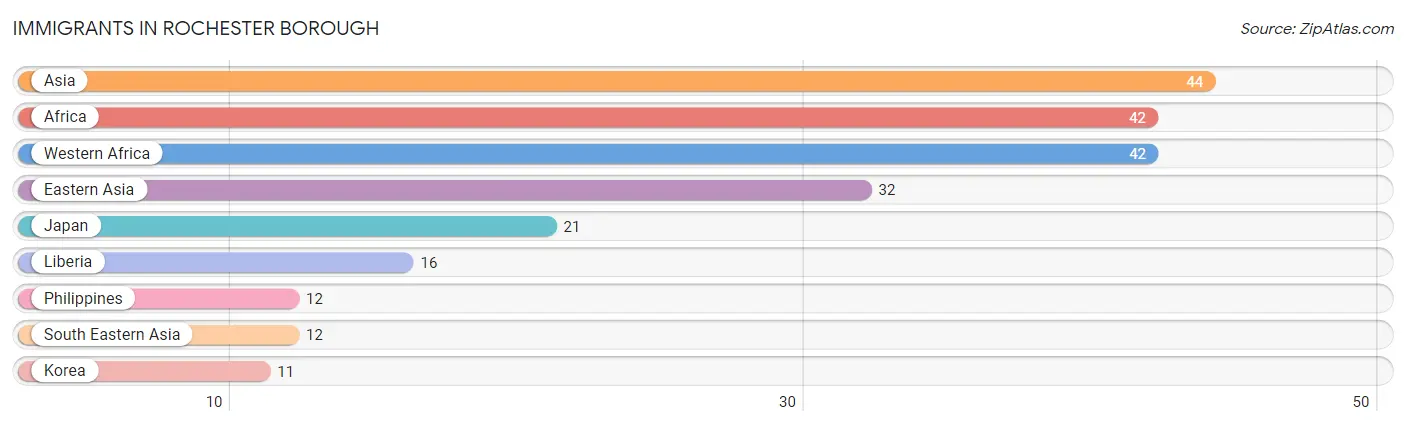
Immigrants in Rochester borough
The most numerous immigrant groups reported in Rochester borough came from Asia (44 | 1.3%), Africa (42 | 1.2%), Western Africa (42 | 1.2%), Eastern Asia (32 | 0.9%), and Japan (21 | 0.6%), together accounting for 5.2% of all Rochester borough residents.
| Immigration Origin | # Population | % Population |
| Africa | 42 | 1.2% |
| Asia | 44 | 1.3% |
| Eastern Asia | 32 | 0.9% |
| Japan | 21 | 0.6% |
| Korea | 11 | 0.3% |
| Liberia | 16 | 0.5% |
| Philippines | 12 | 0.4% |
| South Eastern Asia | 12 | 0.4% |
| Western Africa | 42 | 1.2% | View All 9 Rows |
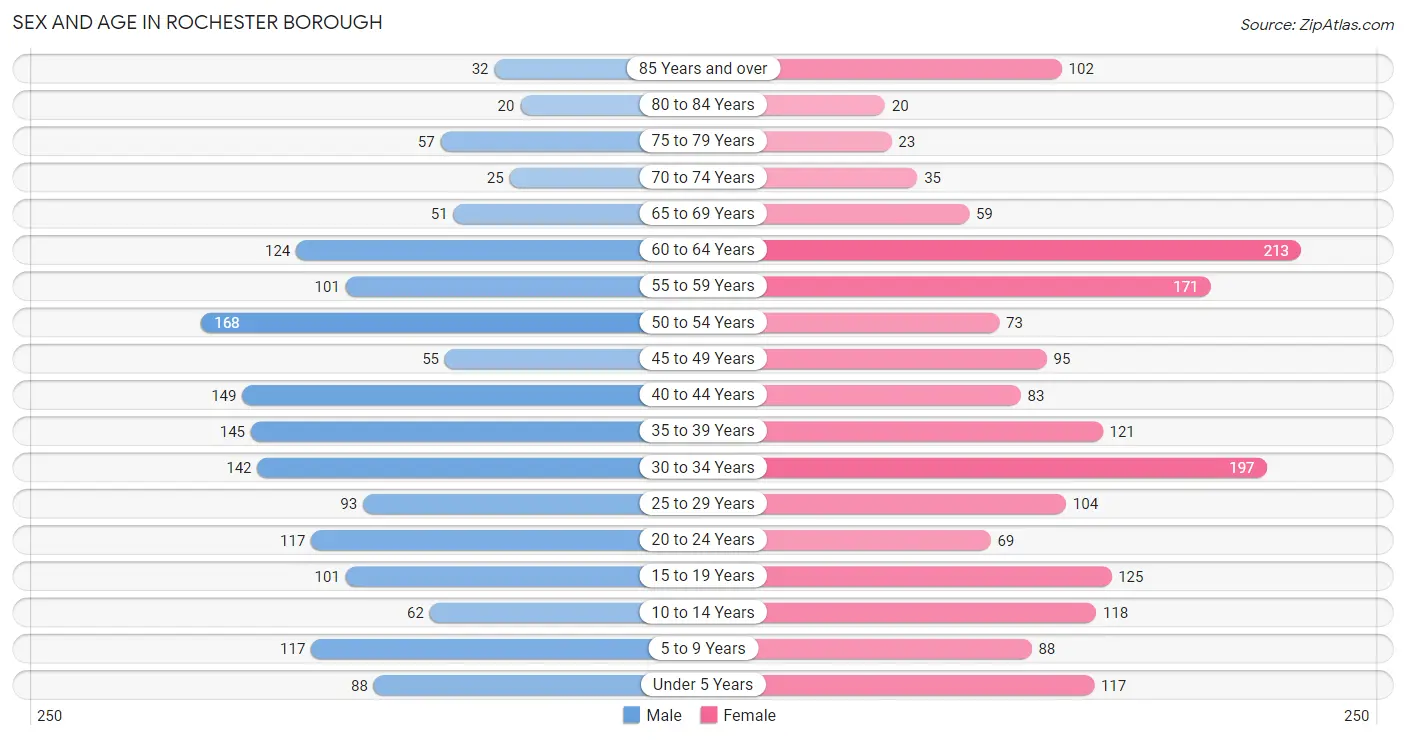
Sex and Age in Rochester borough
Sex and Age in Rochester borough
The most populous age groups in Rochester borough are 50 to 54 Years (168 | 10.2%) for men and 60 to 64 Years (213 | 11.7%) for women.
| Age Bracket | Male | Female |
| Under 5 Years | 88 (5.3%) | 117 (6.5%) |
| 5 to 9 Years | 117 (7.1%) | 88 (4.9%) |
| 10 to 14 Years | 62 (3.8%) | 118 (6.5%) |
| 15 to 19 Years | 101 (6.1%) | 125 (6.9%) |
| 20 to 24 Years | 117 (7.1%) | 69 (3.8%) |
| 25 to 29 Years | 93 (5.7%) | 104 (5.7%) |
| 30 to 34 Years | 142 (8.6%) | 197 (10.9%) |
| 35 to 39 Years | 145 (8.8%) | 121 (6.7%) |
| 40 to 44 Years | 149 (9.0%) | 83 (4.6%) |
| 45 to 49 Years | 55 (3.3%) | 95 (5.2%) |
| 50 to 54 Years | 168 (10.2%) | 73 (4.0%) |
| 55 to 59 Years | 101 (6.1%) | 171 (9.4%) |
| 60 to 64 Years | 124 (7.5%) | 213 (11.7%) |
| 65 to 69 Years | 51 (3.1%) | 59 (3.3%) |
| 70 to 74 Years | 25 (1.5%) | 35 (1.9%) |
| 75 to 79 Years | 57 (3.5%) | 23 (1.3%) |
| 80 to 84 Years | 20 (1.2%) | 20 (1.1%) |
| 85 Years and over | 32 (1.9%) | 102 (5.6%) |
| Total | 1,647 (100.0%) | 1,813 (100.0%) |
Families and Households in Rochester borough
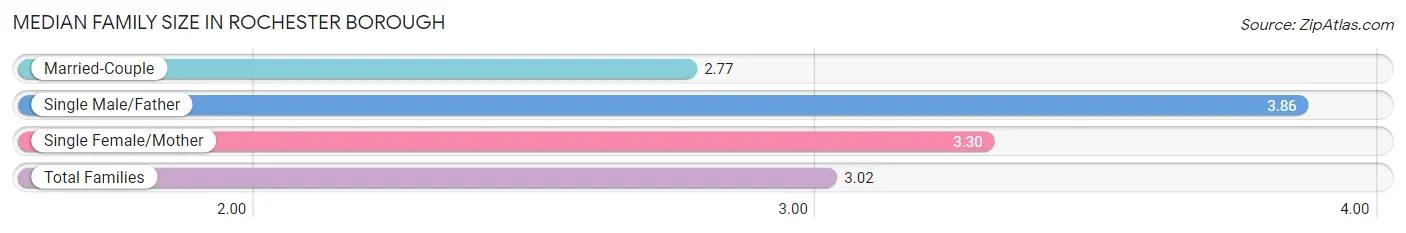
Median Family Size in Rochester borough
The median family size in Rochester borough is 3.02 persons per family, with single male/father families (72 | 9.0%) accounting for the largest median family size of 3.86 persons per family. On the other hand, married-couple families (490 | 61.2%) represent the smallest median family size with 2.77 persons per family.
| Family Type | # Families | Family Size |
| Married-Couple | 490 (61.2%) | 2.77 |
| Single Male/Father | 72 (9.0%) | 3.86 |
| Single Female/Mother | 239 (29.8%) | 3.30 |
| Total Families | 801 (100.0%) | 3.02 |
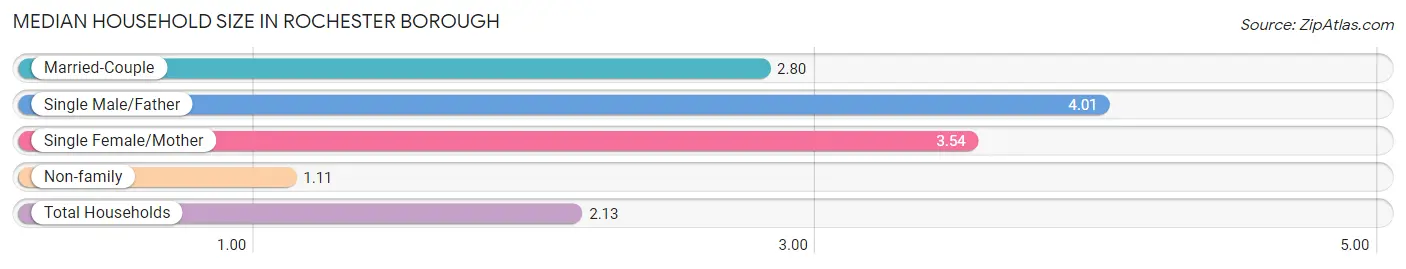
Median Household Size in Rochester borough
The median household size in Rochester borough is 2.13 persons per household, with single male/father households (72 | 4.5%) accounting for the largest median household size of 4.01 persons per household. non-family households (790 | 49.6%) represent the smallest median household size with 1.11 persons per household.
| Household Type | # Households | Household Size |
| Married-Couple | 490 (30.8%) | 2.80 |
| Single Male/Father | 72 (4.5%) | 4.01 |
| Single Female/Mother | 239 (15.0%) | 3.54 |
| Non-family | 790 (49.6%) | 1.11 |
| Total Households | 1,591 (100.0%) | 2.13 |
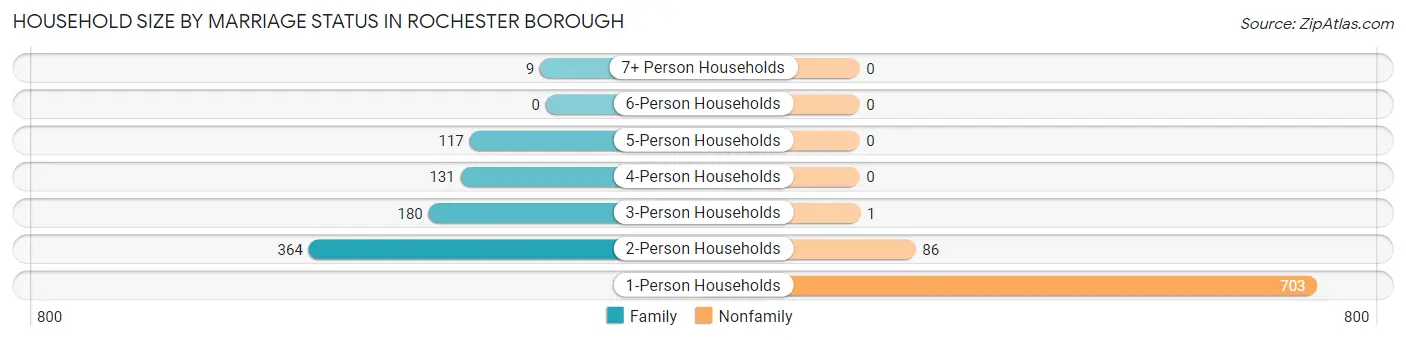
Household Size by Marriage Status in Rochester borough
Out of a total of 1,591 households in Rochester borough, 801 (50.3%) are family households, while 790 (49.6%) are nonfamily households. The most numerous type of family households are 2-person households, comprising 364, and the most common type of nonfamily households are 1-person households, comprising 703.
| Household Size | Family Households | Nonfamily Households |
| 1-Person Households | - | 703 (44.2%) |
| 2-Person Households | 364 (22.9%) | 86 (5.4%) |
| 3-Person Households | 180 (11.3%) | 1 (0.1%) |
| 4-Person Households | 131 (8.2%) | 0 (0.0%) |
| 5-Person Households | 117 (7.3%) | 0 (0.0%) |
| 6-Person Households | 0 (0.0%) | 0 (0.0%) |
| 7+ Person Households | 9 (0.6%) | 0 (0.0%) |
| Total | 801 (50.3%) | 790 (49.6%) |
Female Fertility in Rochester borough
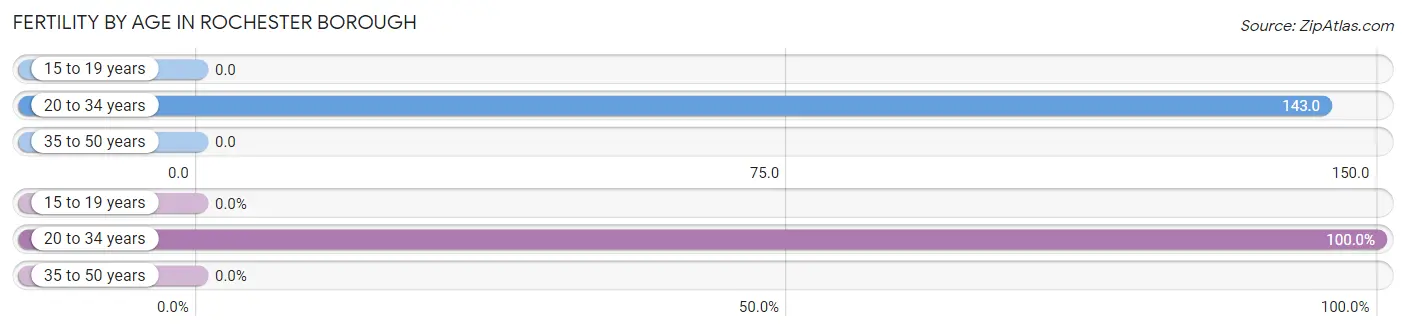
Fertility by Age in Rochester borough
Average fertility rate in Rochester borough is 63.0 births per 1,000 women. Women in the age bracket of 20 to 34 years have the highest fertility rate with 143.0 births per 1,000 women. Women in the age bracket of 20 to 34 years acount for 100.0% of all women with births.
| Age Bracket | Women with Births | Births / 1,000 Women |
| 15 to 19 years | 0 (0.0%) | 0.0 |
| 20 to 34 years | 53 (100.0%) | 143.0 |
| 35 to 50 years | 0 (0.0%) | 0.0 |
| Total | 53 (100.0%) | 63.0 |
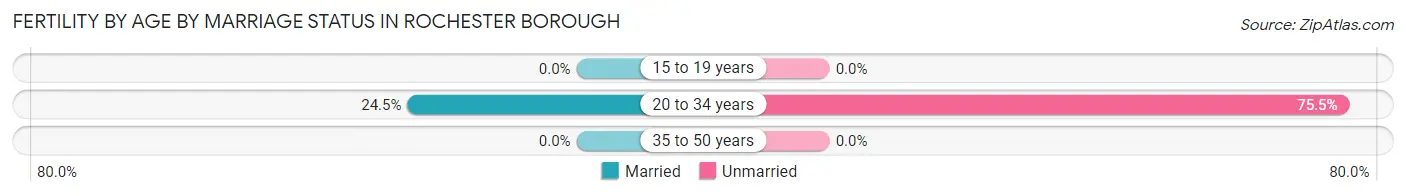
Fertility by Age by Marriage Status in Rochester borough
24.5% of women with births (53) in Rochester borough are married. The highest percentage of unmarried women with births falls into 20 to 34 years age bracket with 75.5% of them unmarried at the time of birth, while the lowest percentage of unmarried women with births belong to 20 to 34 years age bracket with 75.5% of them unmarried.
| Age Bracket | Married | Unmarried |
| 15 to 19 years | 0 (0.0%) | 0 (0.0%) |
| 20 to 34 years | 13 (24.5%) | 40 (75.5%) |
| 35 to 50 years | 0 (0.0%) | 0 (0.0%) |
| Total | 13 (24.5%) | 40 (75.5%) |
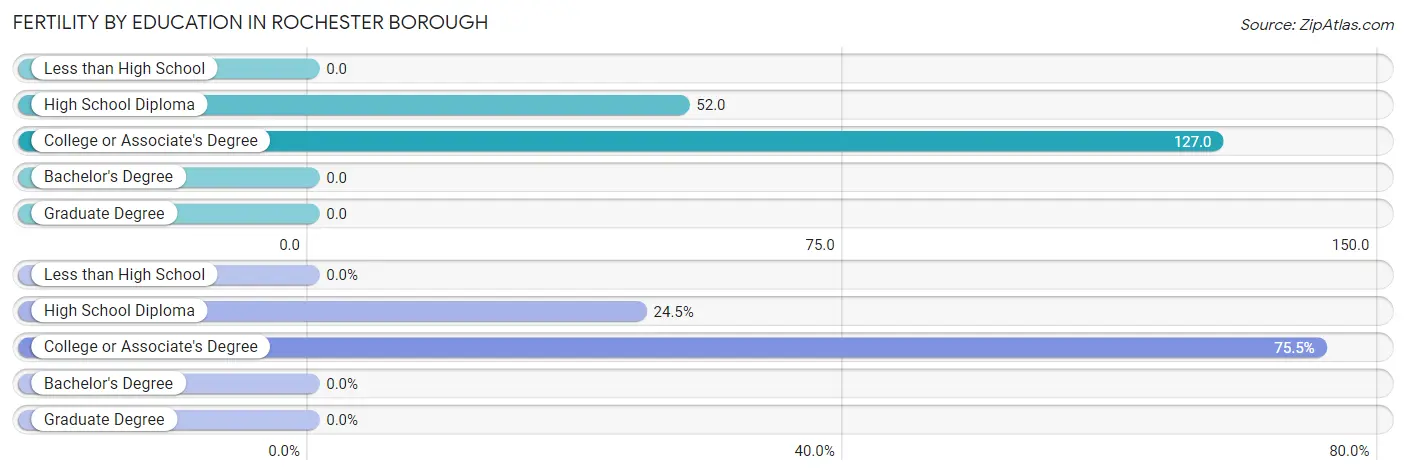
Fertility by Education in Rochester borough
| Educational Attainment | Women with Births | Births / 1,000 Women |
| Less than High School | 0 (0.0%) | 0.0 |
| High School Diploma | 13 (24.5%) | 52.0 |
| College or Associate's Degree | 40 (75.5%) | 127.0 |
| Bachelor's Degree | 0 (0.0%) | 0.0 |
| Graduate Degree | 0 (0.0%) | 0.0 |
| Total | 53 (100.0%) | 63.0 |
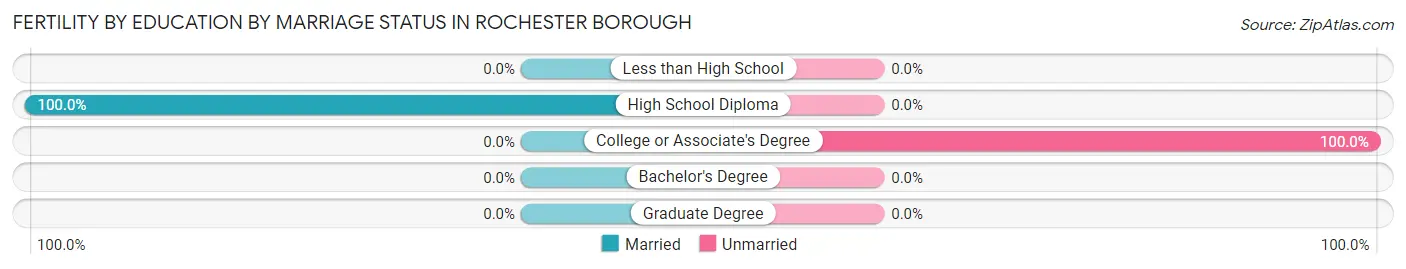
Fertility by Education by Marriage Status in Rochester borough
75.5% of women with births in Rochester borough are unmarried. Women with the educational attainment of high school diploma are most likely to be married with 100.0% of them married at childbirth, while women with the educational attainment of college or associate's degree are least likely to be married with 100.0% of them unmarried at childbirth.
| Educational Attainment | Married | Unmarried |
| Less than High School | 0 (0.0%) | 0 (0.0%) |
| High School Diploma | 13 (100.0%) | 0 (0.0%) |
| College or Associate's Degree | 0 (0.0%) | 40 (100.0%) |
| Bachelor's Degree | 0 (0.0%) | 0 (0.0%) |
| Graduate Degree | 0 (0.0%) | 0 (0.0%) |
| Total | 13 (24.5%) | 40 (75.5%) |
Employment Characteristics in Rochester borough
Employment by Class of Employer in Rochester borough
Among the 1,517 employed individuals in Rochester borough, private company employees (1,171 | 77.2%), not-for-profit organizations (181 | 11.9%), and local government employees (96 | 6.3%) make up the most common classes of employment.
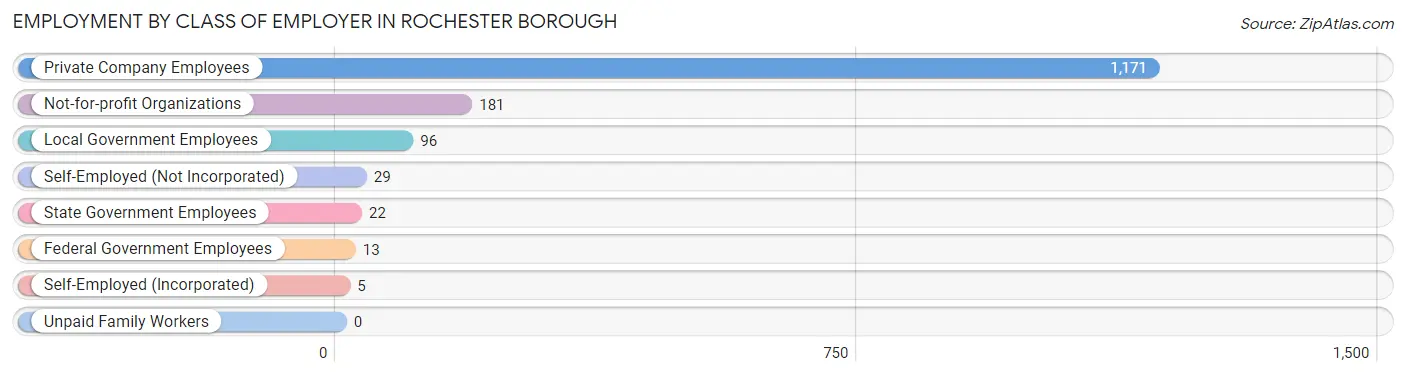
| Employer Class | # Employees | % Employees |
| Private Company Employees | 1,171 | 77.2% |
| Self-Employed (Incorporated) | 5 | 0.3% |
| Self-Employed (Not Incorporated) | 29 | 1.9% |
| Not-for-profit Organizations | 181 | 11.9% |
| Local Government Employees | 96 | 6.3% |
| State Government Employees | 22 | 1.5% |
| Federal Government Employees | 13 | 0.9% |
| Unpaid Family Workers | 0 | 0.0% |
| Total | 1,517 | 100.0% |
Employment Status by Age in Rochester borough
According to the labor force statistics for Rochester borough, out of the total population over 16 years of age (2,777), 59.3% or 1,647 individuals are in the labor force, with 5.9% or 97 of them unemployed. The age group with the highest labor force participation rate is 25 to 29 years, with 88.8% or 175 individuals in the labor force. Within the labor force, the 30 to 34 years age range has the highest percentage of unemployed individuals, with 23.4% or 68 of them being unemployed.
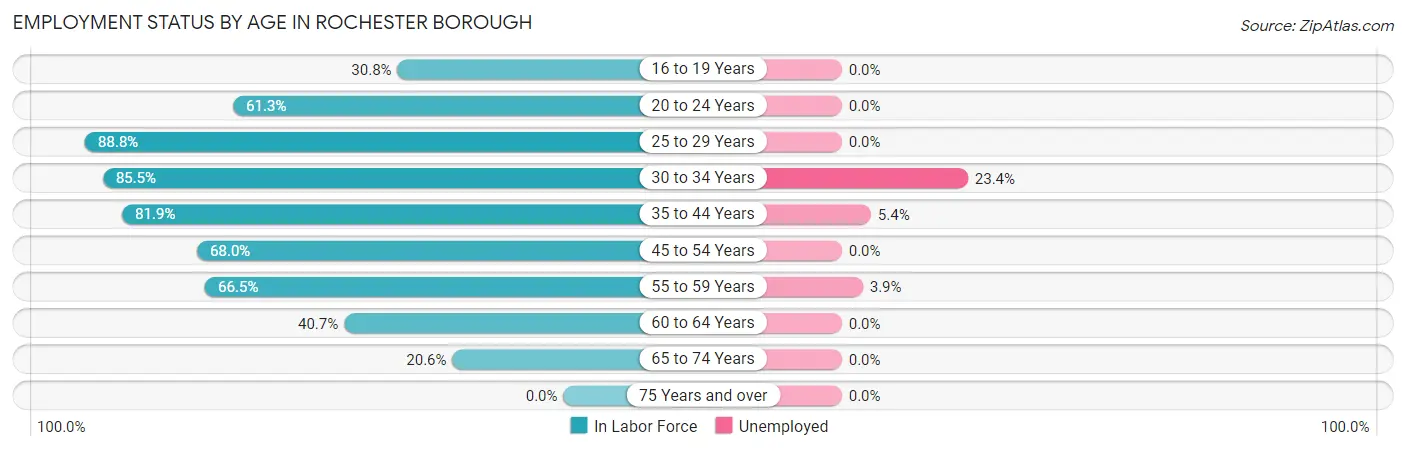
| Age Bracket | In Labor Force | Unemployed |
| 16 to 19 Years | 41 (30.8%) | 0 (0.0%) |
| 20 to 24 Years | 114 (61.3%) | 0 (0.0%) |
| 25 to 29 Years | 175 (88.8%) | 0 (0.0%) |
| 30 to 34 Years | 290 (85.5%) | 68 (23.4%) |
| 35 to 44 Years | 408 (81.9%) | 22 (5.4%) |
| 45 to 54 Years | 266 (68.0%) | 0 (0.0%) |
| 55 to 59 Years | 181 (66.5%) | 7 (3.9%) |
| 60 to 64 Years | 137 (40.7%) | 0 (0.0%) |
| 65 to 74 Years | 35 (20.6%) | 0 (0.0%) |
| 75 Years and over | 0 (0.0%) | 0 (0.0%) |
| Total | 1,647 (59.3%) | 97 (5.9%) |
Employment Status by Educational Attainment in Rochester borough
According to labor force statistics for Rochester borough, 71.6% of individuals (1,456) out of the total population between 25 and 64 years of age (2,034) are in the labor force, with 6.7% or 98 of them being unemployed. The group with the highest labor force participation rate are those with the educational attainment of college / associate degree, with 82.1% or 564 individuals in the labor force. Within the labor force, individuals with college / associate degree education have the highest percentage of unemployment, with 15.2% or 86 of them being unemployed.
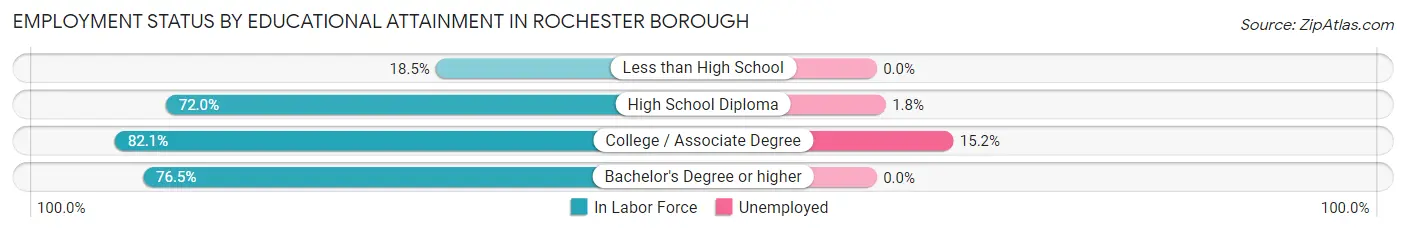
| Educational Attainment | In Labor Force | Unemployed |
| Less than High School | 32 (18.5%) | 0 (0.0%) |
| High School Diploma | 600 (72.0%) | 15 (1.8%) |
| College / Associate Degree | 564 (82.1%) | 104 (15.2%) |
| Bachelor's Degree or higher | 261 (76.5%) | 0 (0.0%) |
| Total | 1,456 (71.6%) | 136 (6.7%) |
Employment Occupations by Sex in Rochester borough
Management, Business, Science and Arts Occupations
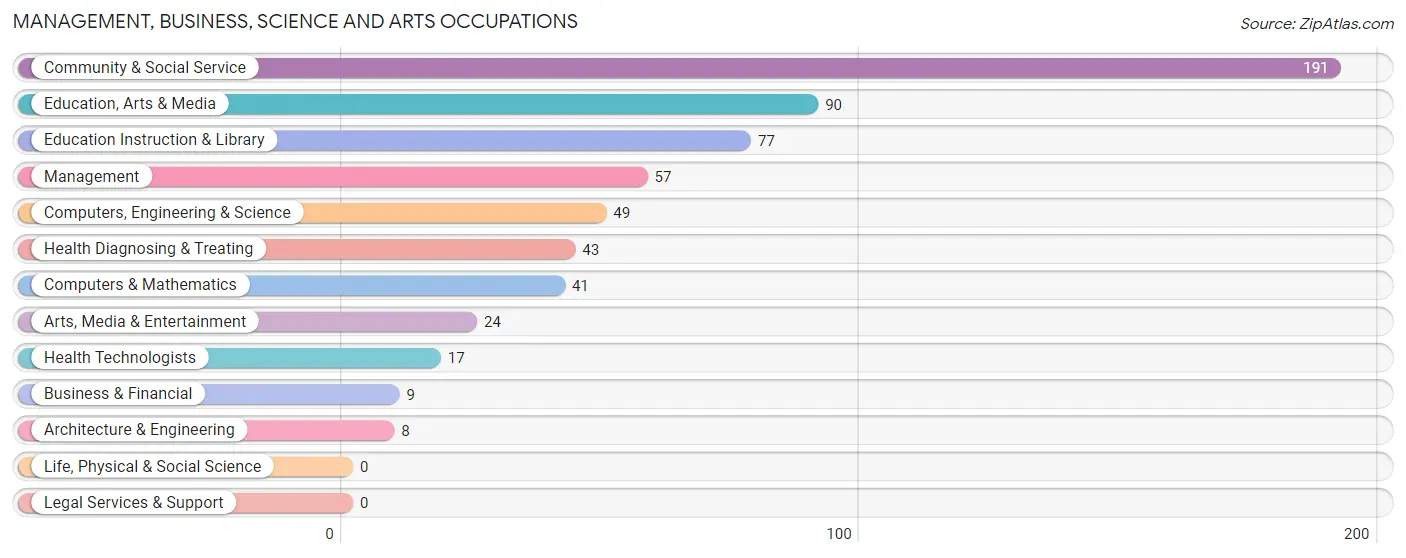
The most common Management, Business, Science and Arts occupations in Rochester borough are Community & Social Service (191 | 12.3%), Education, Arts & Media (90 | 5.8%), Education Instruction & Library (77 | 5.0%), Management (57 | 3.7%), and Computers, Engineering & Science (49 | 3.2%).
Management, Business, Science and Arts Occupations by Sex
Within the Management, Business, Science and Arts occupations in Rochester borough, the most male-oriented occupations are Architecture & Engineering (100.0%), Management (57.9%), and Computers, Engineering & Science (53.1%), while the most female-oriented occupations are Business & Financial (100.0%), Health Technologists (100.0%), and Health Diagnosing & Treating (81.4%).
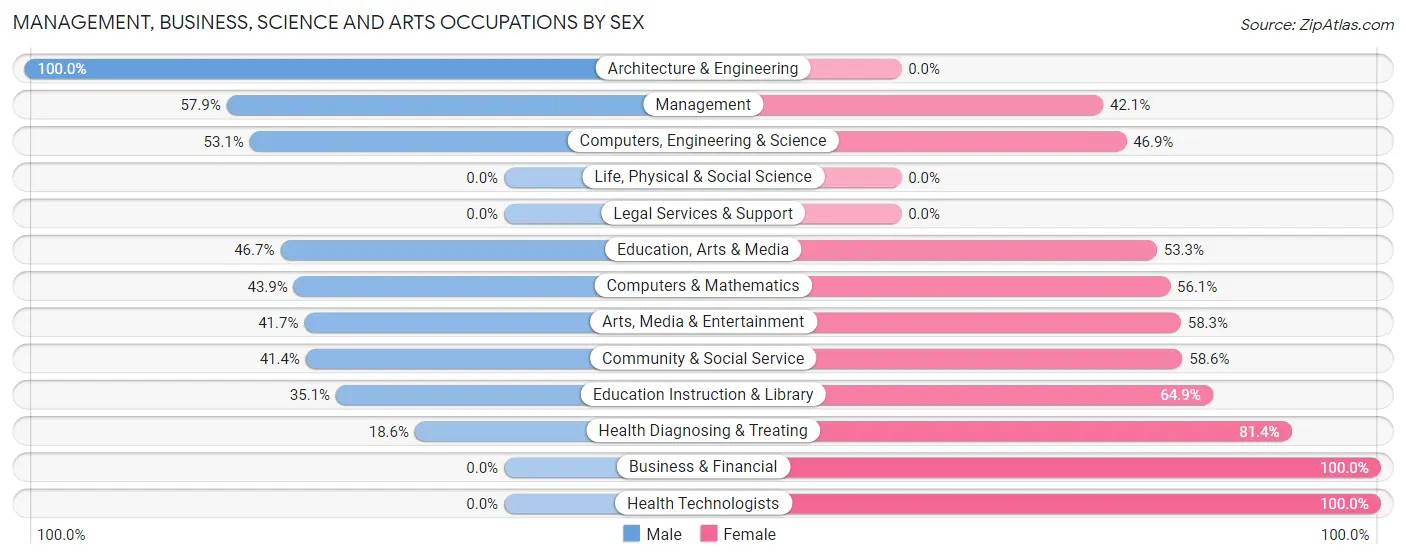
| Occupation | Male | Female |
| Management | 33 (57.9%) | 24 (42.1%) |
| Business & Financial | 0 (0.0%) | 9 (100.0%) |
| Computers, Engineering & Science | 26 (53.1%) | 23 (46.9%) |
| Computers & Mathematics | 18 (43.9%) | 23 (56.1%) |
| Architecture & Engineering | 8 (100.0%) | 0 (0.0%) |
| Life, Physical & Social Science | 0 (0.0%) | 0 (0.0%) |
| Community & Social Service | 79 (41.4%) | 112 (58.6%) |
| Education, Arts & Media | 42 (46.7%) | 48 (53.3%) |
| Legal Services & Support | 0 (0.0%) | 0 (0.0%) |
| Education Instruction & Library | 27 (35.1%) | 50 (64.9%) |
| Arts, Media & Entertainment | 10 (41.7%) | 14 (58.3%) |
| Health Diagnosing & Treating | 8 (18.6%) | 35 (81.4%) |
| Health Technologists | 0 (0.0%) | 17 (100.0%) |
| Total (Category) | 146 (41.8%) | 203 (58.2%) |
| Total (Overall) | 866 (55.9%) | 684 (44.1%) |
Services Occupations
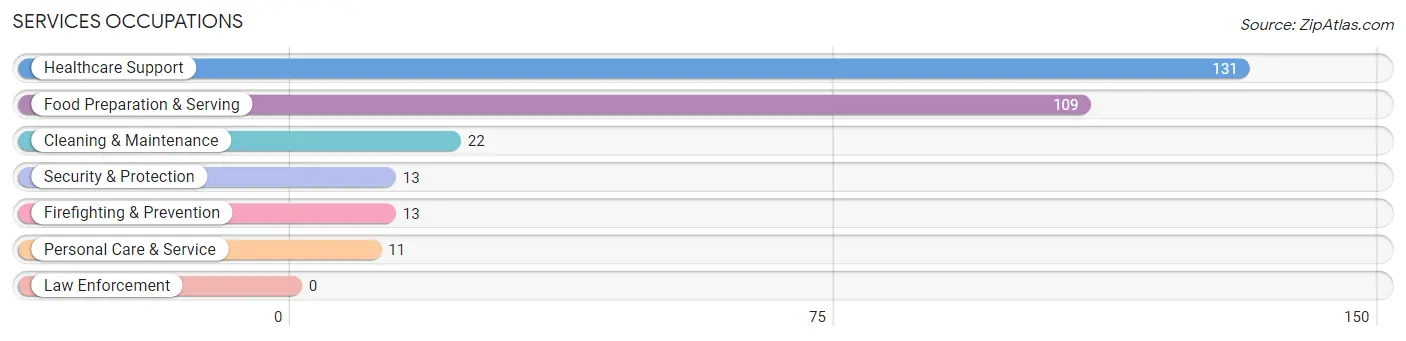
The most common Services occupations in Rochester borough are Healthcare Support (131 | 8.5%), Food Preparation & Serving (109 | 7.0%), Cleaning & Maintenance (22 | 1.4%), Security & Protection (13 | 0.8%), and Firefighting & Prevention (13 | 0.8%).
Services Occupations by Sex
Within the Services occupations in Rochester borough, the most male-oriented occupations are Security & Protection (100.0%), Firefighting & Prevention (100.0%), and Food Preparation & Serving (31.2%), while the most female-oriented occupations are Healthcare Support (100.0%), Cleaning & Maintenance (100.0%), and Personal Care & Service (100.0%).
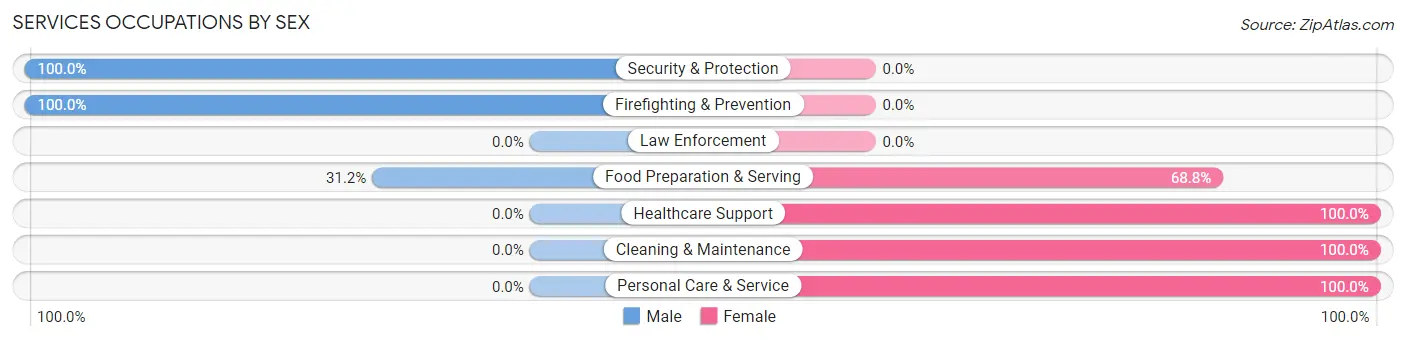
| Occupation | Male | Female |
| Healthcare Support | 0 (0.0%) | 131 (100.0%) |
| Security & Protection | 13 (100.0%) | 0 (0.0%) |
| Firefighting & Prevention | 13 (100.0%) | 0 (0.0%) |
| Law Enforcement | 0 (0.0%) | 0 (0.0%) |
| Food Preparation & Serving | 34 (31.2%) | 75 (68.8%) |
| Cleaning & Maintenance | 0 (0.0%) | 22 (100.0%) |
| Personal Care & Service | 0 (0.0%) | 11 (100.0%) |
| Total (Category) | 47 (16.4%) | 239 (83.6%) |
| Total (Overall) | 866 (55.9%) | 684 (44.1%) |
Sales and Office Occupations
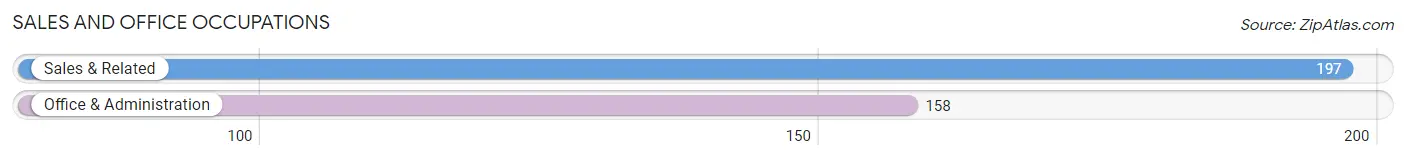
The most common Sales and Office occupations in Rochester borough are Sales & Related (197 | 12.7%), and Office & Administration (158 | 10.2%).
Sales and Office Occupations by Sex
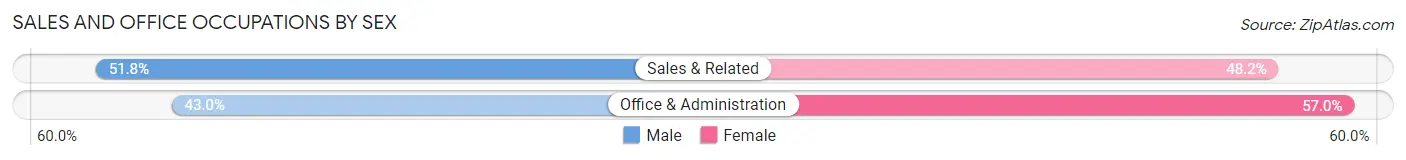
| Occupation | Male | Female |
| Sales & Related | 102 (51.8%) | 95 (48.2%) |
| Office & Administration | 68 (43.0%) | 90 (57.0%) |
| Total (Category) | 170 (47.9%) | 185 (52.1%) |
| Total (Overall) | 866 (55.9%) | 684 (44.1%) |
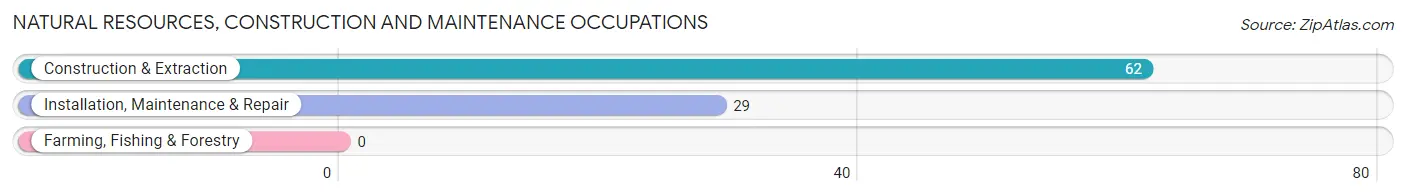
Natural Resources, Construction and Maintenance Occupations
The most common Natural Resources, Construction and Maintenance occupations in Rochester borough are Construction & Extraction (62 | 4.0%), and Installation, Maintenance & Repair (29 | 1.9%).
Natural Resources, Construction and Maintenance Occupations by Sex
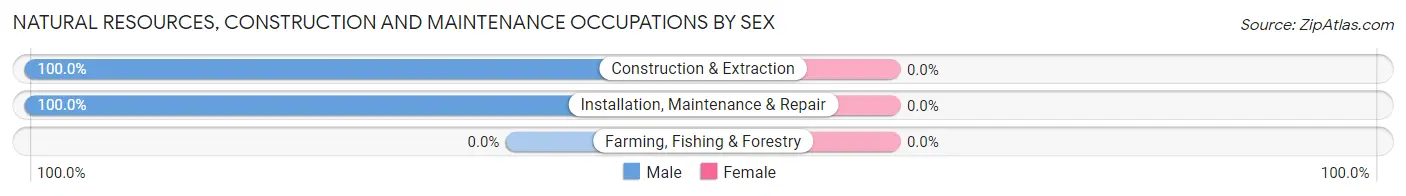
| Occupation | Male | Female |
| Farming, Fishing & Forestry | 0 (0.0%) | 0 (0.0%) |
| Construction & Extraction | 62 (100.0%) | 0 (0.0%) |
| Installation, Maintenance & Repair | 29 (100.0%) | 0 (0.0%) |
| Total (Category) | 91 (100.0%) | 0 (0.0%) |
| Total (Overall) | 866 (55.9%) | 684 (44.1%) |
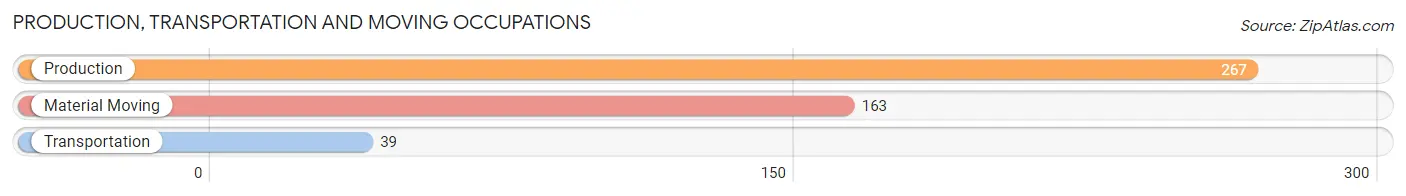
Production, Transportation and Moving Occupations
The most common Production, Transportation and Moving occupations in Rochester borough are Production (267 | 17.2%), Material Moving (163 | 10.5%), and Transportation (39 | 2.5%).
Production, Transportation and Moving Occupations by Sex
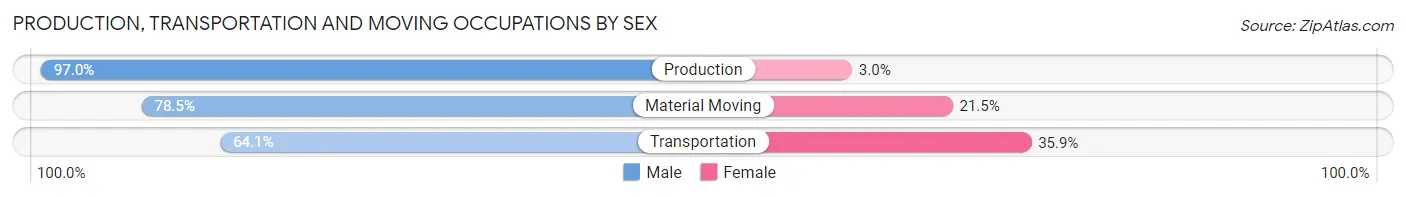
| Occupation | Male | Female |
| Production | 259 (97.0%) | 8 (3.0%) |
| Transportation | 25 (64.1%) | 14 (35.9%) |
| Material Moving | 128 (78.5%) | 35 (21.5%) |
| Total (Category) | 412 (87.8%) | 57 (12.1%) |
| Total (Overall) | 866 (55.9%) | 684 (44.1%) |
Employment Industries by Sex in Rochester borough
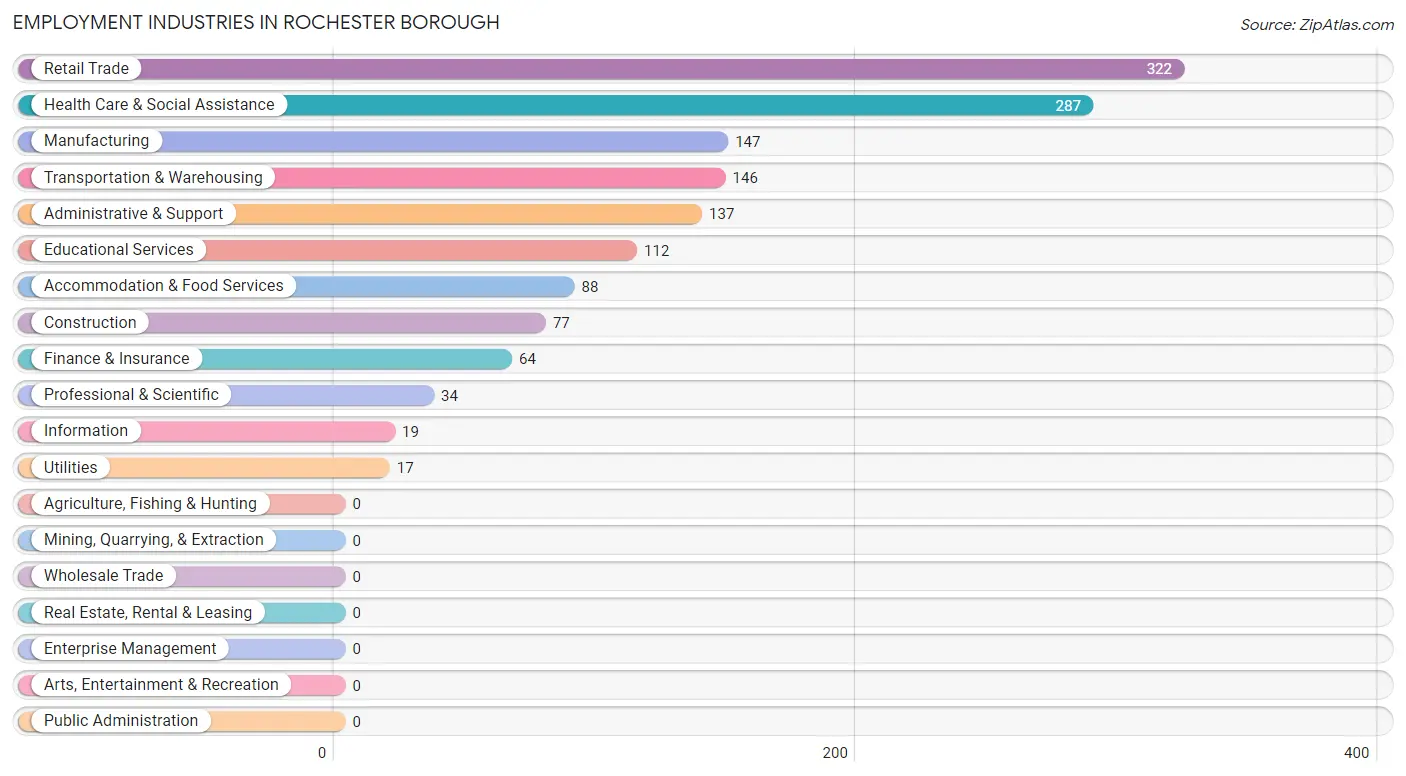
Employment Industries in Rochester borough
The major employment industries in Rochester borough include Retail Trade (322 | 20.8%), Health Care & Social Assistance (287 | 18.5%), Manufacturing (147 | 9.5%), Transportation & Warehousing (146 | 9.4%), and Administrative & Support (137 | 8.8%).
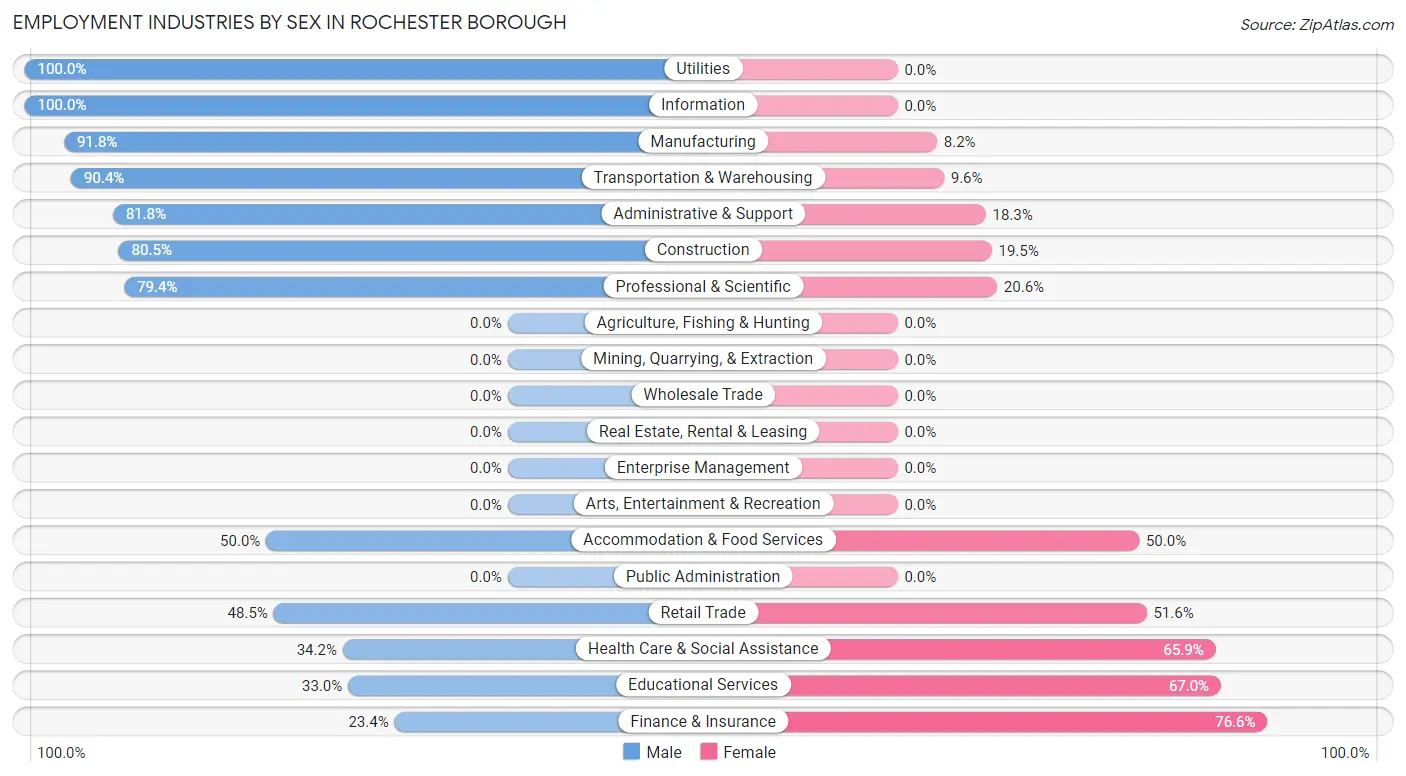
Employment Industries by Sex in Rochester borough
The Rochester borough industries that see more men than women are Utilities (100.0%), Information (100.0%), and Manufacturing (91.8%), whereas the industries that tend to have a higher number of women are Finance & Insurance (76.6%), Educational Services (67.0%), and Health Care & Social Assistance (65.8%).
| Industry | Male | Female |
| Agriculture, Fishing & Hunting | 0 (0.0%) | 0 (0.0%) |
| Mining, Quarrying, & Extraction | 0 (0.0%) | 0 (0.0%) |
| Construction | 62 (80.5%) | 15 (19.5%) |
| Manufacturing | 135 (91.8%) | 12 (8.2%) |
| Wholesale Trade | 0 (0.0%) | 0 (0.0%) |
| Retail Trade | 156 (48.4%) | 166 (51.5%) |
| Transportation & Warehousing | 132 (90.4%) | 14 (9.6%) |
| Utilities | 17 (100.0%) | 0 (0.0%) |
| Information | 19 (100.0%) | 0 (0.0%) |
| Finance & Insurance | 15 (23.4%) | 49 (76.6%) |
| Real Estate, Rental & Leasing | 0 (0.0%) | 0 (0.0%) |
| Professional & Scientific | 27 (79.4%) | 7 (20.6%) |
| Enterprise Management | 0 (0.0%) | 0 (0.0%) |
| Administrative & Support | 112 (81.8%) | 25 (18.2%) |
| Educational Services | 37 (33.0%) | 75 (67.0%) |
| Health Care & Social Assistance | 98 (34.2%) | 189 (65.8%) |
| Arts, Entertainment & Recreation | 0 (0.0%) | 0 (0.0%) |
| Accommodation & Food Services | 44 (50.0%) | 44 (50.0%) |
| Public Administration | 0 (0.0%) | 0 (0.0%) |
| Total | 866 (55.9%) | 684 (44.1%) |
Education in Rochester borough
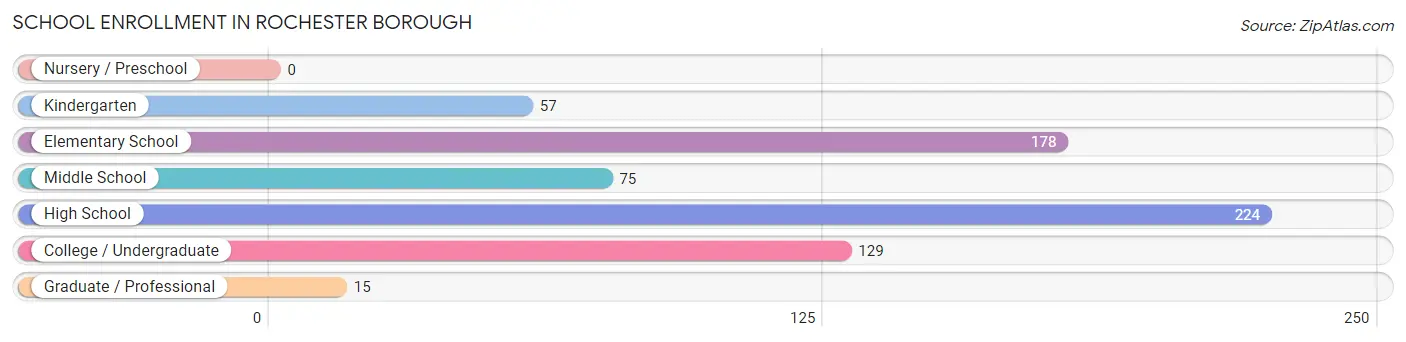
School Enrollment in Rochester borough
The most common levels of schooling among the 678 students in Rochester borough are high school (224 | 33.0%), elementary school (178 | 26.3%), and college / undergraduate (129 | 19.0%).
| School Level | # Students | % Students |
| Nursery / Preschool | 0 | 0.0% |
| Kindergarten | 57 | 8.4% |
| Elementary School | 178 | 26.3% |
| Middle School | 75 | 11.1% |
| High School | 224 | 33.0% |
| College / Undergraduate | 129 | 19.0% |
| Graduate / Professional | 15 | 2.2% |
| Total | 678 | 100.0% |
School Enrollment by Age by Funding Source in Rochester borough
Out of a total of 678 students who are enrolled in schools in Rochester borough, 148 (21.8%) attend a private institution, while the remaining 530 (78.2%) are enrolled in public schools. The age group of 25 to 34 year olds has the highest likelihood of being enrolled in private schools, with 32 (78.0% in the age bracket) enrolled. Conversely, the age group of 18 to 19 year olds has the lowest likelihood of being enrolled in a private school, with 43 (100.0% in the age bracket) attending a public institution.
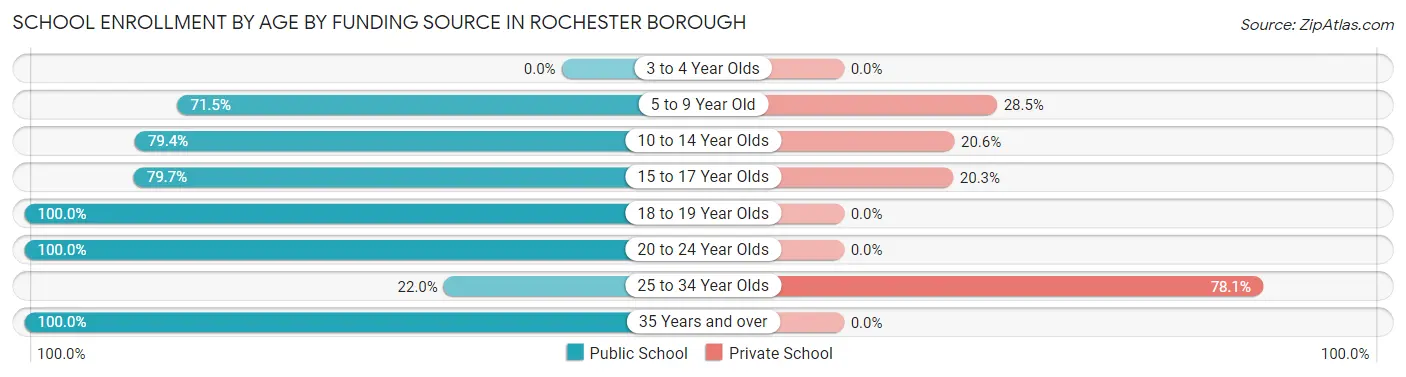
| Age Bracket | Public School | Private School |
| 3 to 4 Year Olds | 0 (0.0%) | 0 (0.0%) |
| 5 to 9 Year Old | 138 (71.5%) | 55 (28.5%) |
| 10 to 14 Year Olds | 143 (79.4%) | 37 (20.6%) |
| 15 to 17 Year Olds | 94 (79.7%) | 24 (20.3%) |
| 18 to 19 Year Olds | 43 (100.0%) | 0 (0.0%) |
| 20 to 24 Year Olds | 62 (100.0%) | 0 (0.0%) |
| 25 to 34 Year Olds | 9 (22.0%) | 32 (78.0%) |
| 35 Years and over | 41 (100.0%) | 0 (0.0%) |
| Total | 530 (78.2%) | 148 (21.8%) |
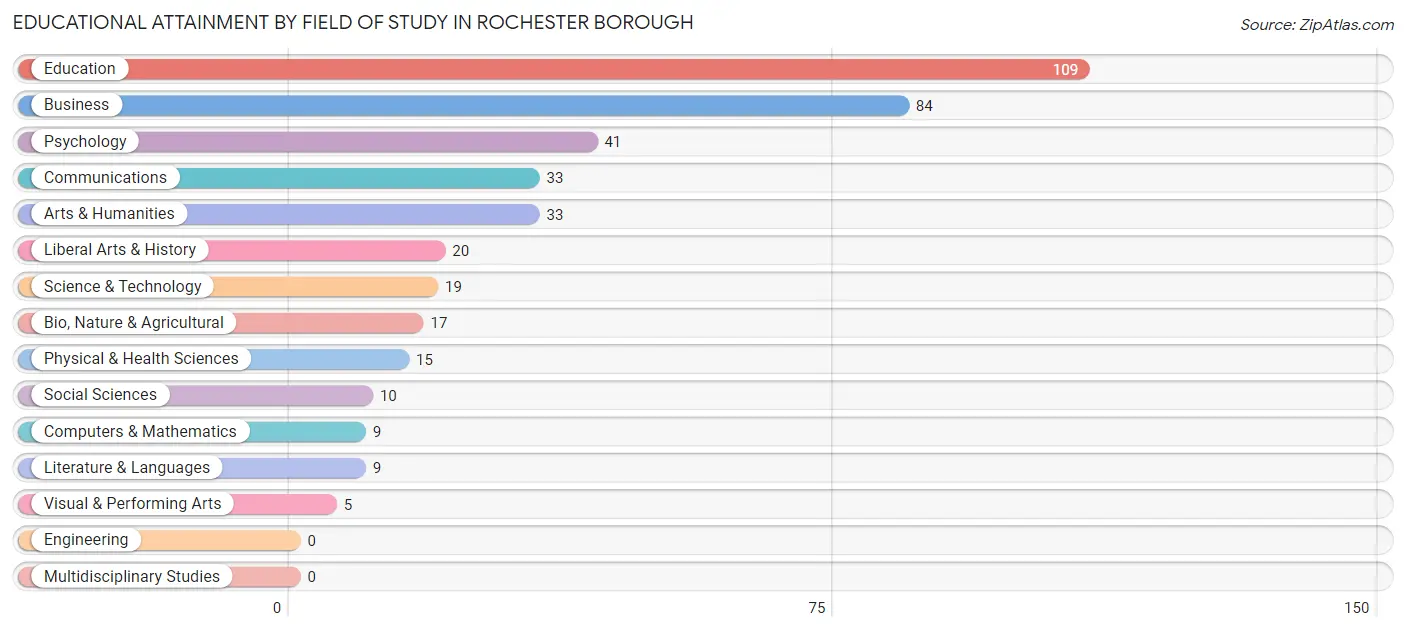
Educational Attainment by Field of Study in Rochester borough
Education (109 | 27.0%), business (84 | 20.8%), psychology (41 | 10.2%), communications (33 | 8.2%), and arts & humanities (33 | 8.2%) are the most common fields of study among 404 individuals in Rochester borough who have obtained a bachelor's degree or higher.
| Field of Study | # Graduates | % Graduates |
| Computers & Mathematics | 9 | 2.2% |
| Bio, Nature & Agricultural | 17 | 4.2% |
| Physical & Health Sciences | 15 | 3.7% |
| Psychology | 41 | 10.2% |
| Social Sciences | 10 | 2.5% |
| Engineering | 0 | 0.0% |
| Multidisciplinary Studies | 0 | 0.0% |
| Science & Technology | 19 | 4.7% |
| Business | 84 | 20.8% |
| Education | 109 | 27.0% |
| Literature & Languages | 9 | 2.2% |
| Liberal Arts & History | 20 | 5.0% |
| Visual & Performing Arts | 5 | 1.2% |
| Communications | 33 | 8.2% |
| Arts & Humanities | 33 | 8.2% |
| Total | 404 | 100.0% |
Transportation & Commute in Rochester borough
Vehicle Availability by Sex in Rochester borough
The most prevalent vehicle ownership categories in Rochester borough are males with 1 vehicle (418, accounting for 48.3%) and females with 1 vehicle (248, making up 64.3%).
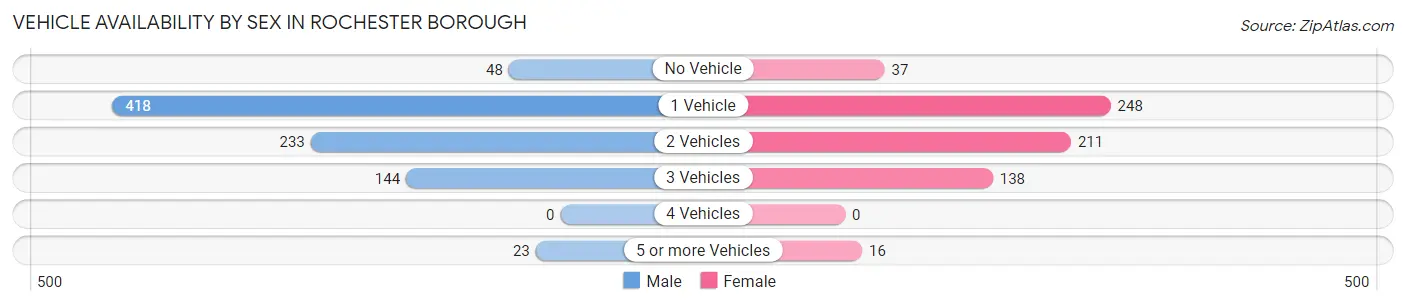
| Vehicles Available | Male | Female |
| No Vehicle | 48 (5.5%) | 37 (5.7%) |
| 1 Vehicle | 418 (48.3%) | 248 (38.2%) |
| 2 Vehicles | 233 (26.9%) | 211 (32.5%) |
| 3 Vehicles | 144 (16.6%) | 138 (21.2%) |
| 4 Vehicles | 0 (0.0%) | 0 (0.0%) |
| 5 or more Vehicles | 23 (2.7%) | 16 (2.5%) |
| Total | 866 (100.0%) | 650 (100.0%) |
Commute Time in Rochester borough
The most frequently occuring commute durations in Rochester borough are 10 to 14 minutes (367 commuters, 24.7%), 15 to 19 minutes (240 commuters, 16.2%), and 20 to 24 minutes (198 commuters, 13.3%).
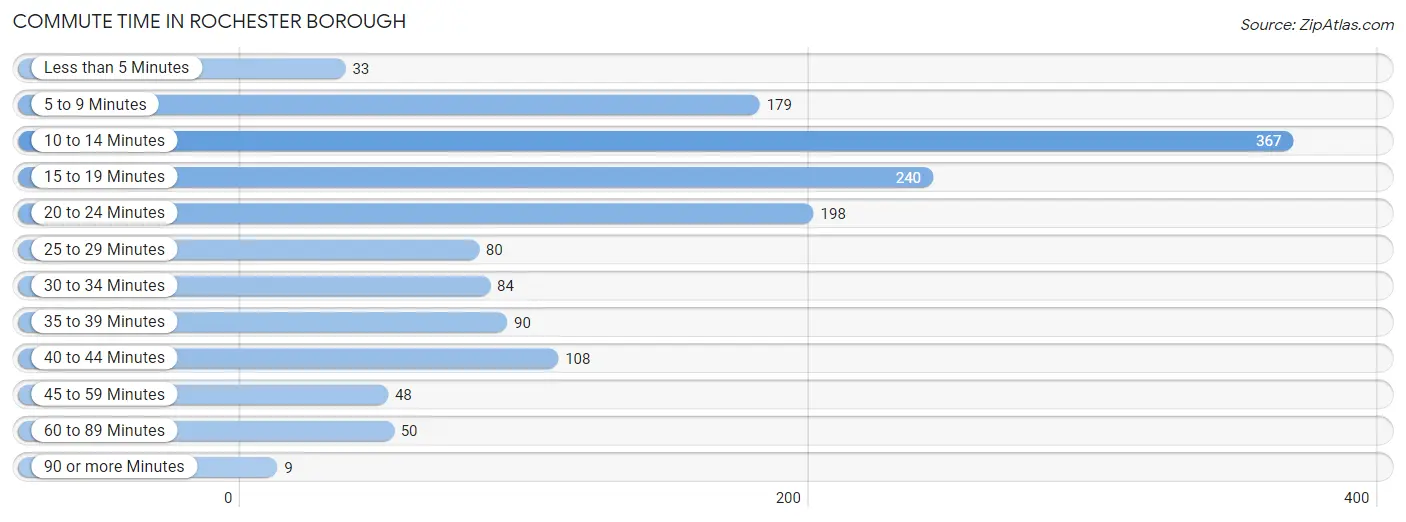
| Commute Time | # Commuters | % Commuters |
| Less than 5 Minutes | 33 | 2.2% |
| 5 to 9 Minutes | 179 | 12.0% |
| 10 to 14 Minutes | 367 | 24.7% |
| 15 to 19 Minutes | 240 | 16.2% |
| 20 to 24 Minutes | 198 | 13.3% |
| 25 to 29 Minutes | 80 | 5.4% |
| 30 to 34 Minutes | 84 | 5.7% |
| 35 to 39 Minutes | 90 | 6.1% |
| 40 to 44 Minutes | 108 | 7.3% |
| 45 to 59 Minutes | 48 | 3.2% |
| 60 to 89 Minutes | 50 | 3.4% |
| 90 or more Minutes | 9 | 0.6% |
Commute Time by Sex in Rochester borough
The most common commute times in Rochester borough are 15 to 19 minutes (215 commuters, 25.1%) for males and 10 to 14 minutes (180 commuters, 28.6%) for females.
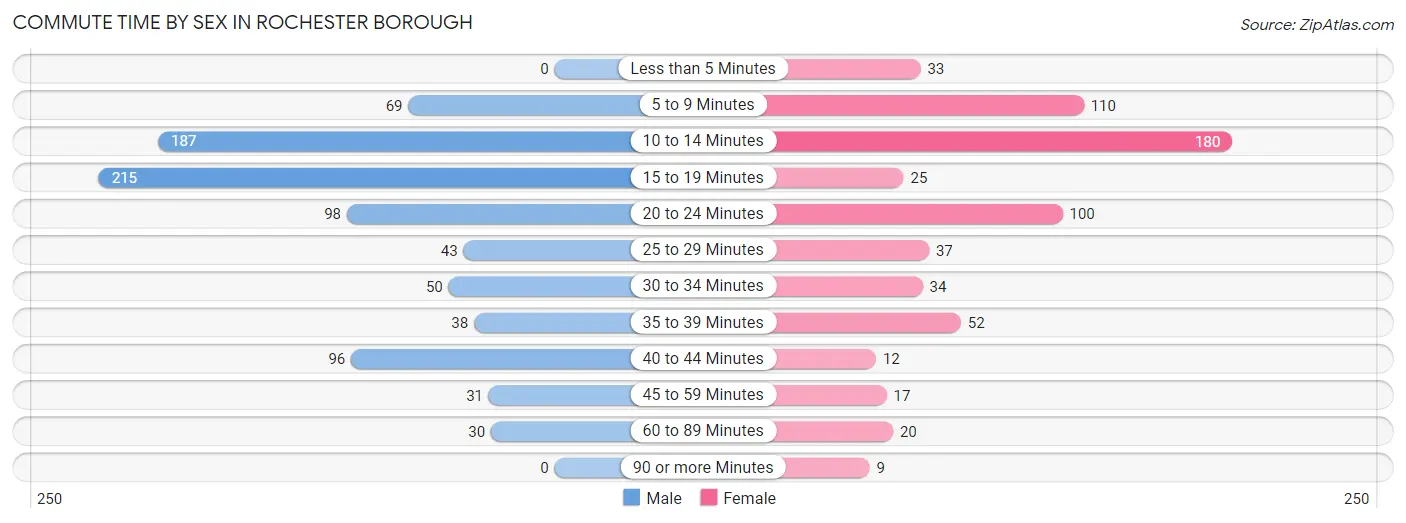
| Commute Time | Male | Female |
| Less than 5 Minutes | 0 (0.0%) | 33 (5.2%) |
| 5 to 9 Minutes | 69 (8.1%) | 110 (17.5%) |
| 10 to 14 Minutes | 187 (21.8%) | 180 (28.6%) |
| 15 to 19 Minutes | 215 (25.1%) | 25 (4.0%) |
| 20 to 24 Minutes | 98 (11.4%) | 100 (15.9%) |
| 25 to 29 Minutes | 43 (5.0%) | 37 (5.9%) |
| 30 to 34 Minutes | 50 (5.8%) | 34 (5.4%) |
| 35 to 39 Minutes | 38 (4.4%) | 52 (8.3%) |
| 40 to 44 Minutes | 96 (11.2%) | 12 (1.9%) |
| 45 to 59 Minutes | 31 (3.6%) | 17 (2.7%) |
| 60 to 89 Minutes | 30 (3.5%) | 20 (3.2%) |
| 90 or more Minutes | 0 (0.0%) | 9 (1.4%) |
Time of Departure to Work by Sex in Rochester borough
The most frequent times of departure to work in Rochester borough are 12:00 AM to 4:59 AM (124, 14.5%) for males and 6:30 AM to 6:59 AM (163, 25.9%) for females.
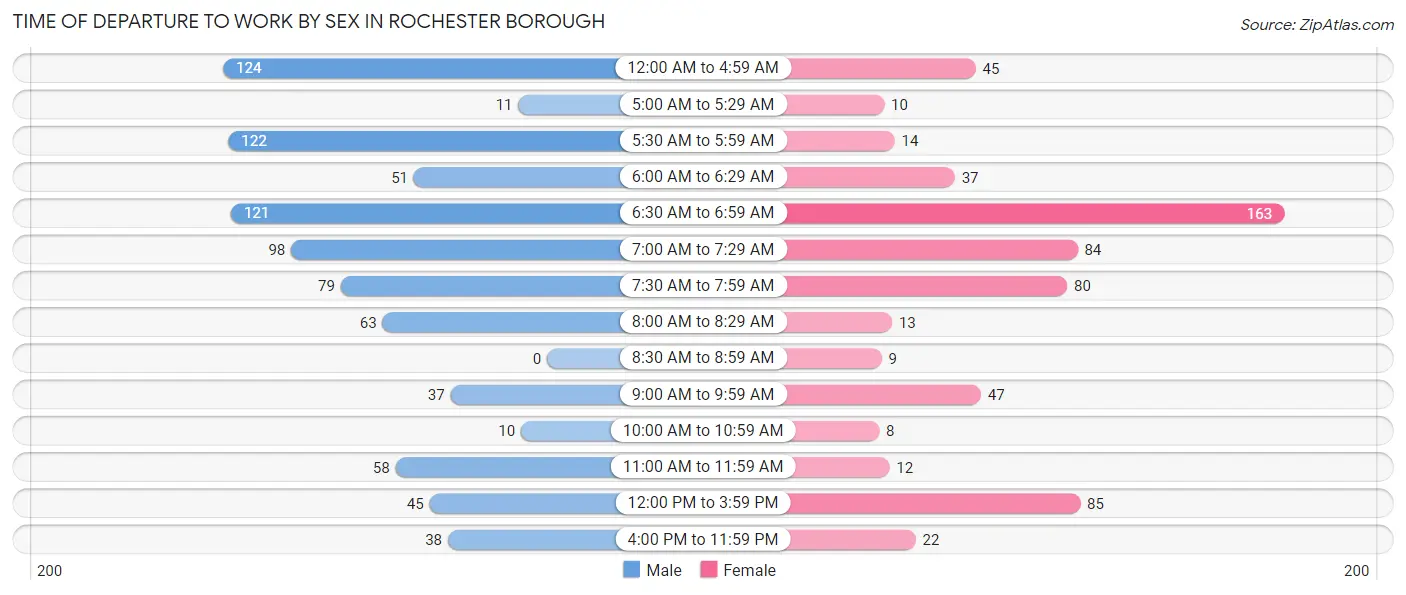
| Time of Departure | Male | Female |
| 12:00 AM to 4:59 AM | 124 (14.5%) | 45 (7.1%) |
| 5:00 AM to 5:29 AM | 11 (1.3%) | 10 (1.6%) |
| 5:30 AM to 5:59 AM | 122 (14.2%) | 14 (2.2%) |
| 6:00 AM to 6:29 AM | 51 (5.9%) | 37 (5.9%) |
| 6:30 AM to 6:59 AM | 121 (14.1%) | 163 (25.9%) |
| 7:00 AM to 7:29 AM | 98 (11.4%) | 84 (13.4%) |
| 7:30 AM to 7:59 AM | 79 (9.2%) | 80 (12.7%) |
| 8:00 AM to 8:29 AM | 63 (7.3%) | 13 (2.1%) |
| 8:30 AM to 8:59 AM | 0 (0.0%) | 9 (1.4%) |
| 9:00 AM to 9:59 AM | 37 (4.3%) | 47 (7.5%) |
| 10:00 AM to 10:59 AM | 10 (1.2%) | 8 (1.3%) |
| 11:00 AM to 11:59 AM | 58 (6.8%) | 12 (1.9%) |
| 12:00 PM to 3:59 PM | 45 (5.2%) | 85 (13.5%) |
| 4:00 PM to 11:59 PM | 38 (4.4%) | 22 (3.5%) |
| Total | 857 (100.0%) | 629 (100.0%) |
Housing Occupancy in Rochester borough
Occupancy by Ownership in Rochester borough
Of the total 1,591 dwellings in Rochester borough, owner-occupied units account for 746 (46.9%), while renter-occupied units make up 845 (53.1%).
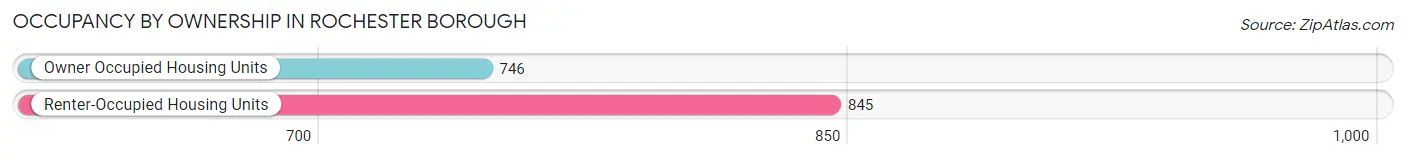
| Occupancy | # Housing Units | % Housing Units |
| Owner Occupied Housing Units | 746 | 46.9% |
| Renter-Occupied Housing Units | 845 | 53.1% |
| Total Occupied Housing Units | 1,591 | 100.0% |
Occupancy by Household Size in Rochester borough
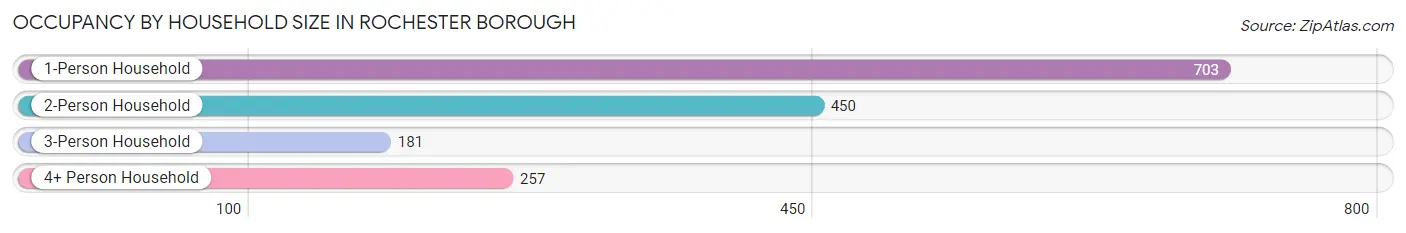
| Household Size | # Housing Units | % Housing Units |
| 1-Person Household | 703 | 44.2% |
| 2-Person Household | 450 | 28.3% |
| 3-Person Household | 181 | 11.4% |
| 4+ Person Household | 257 | 16.2% |
| Total Housing Units | 1,591 | 100.0% |
Occupancy by Ownership by Household Size in Rochester borough
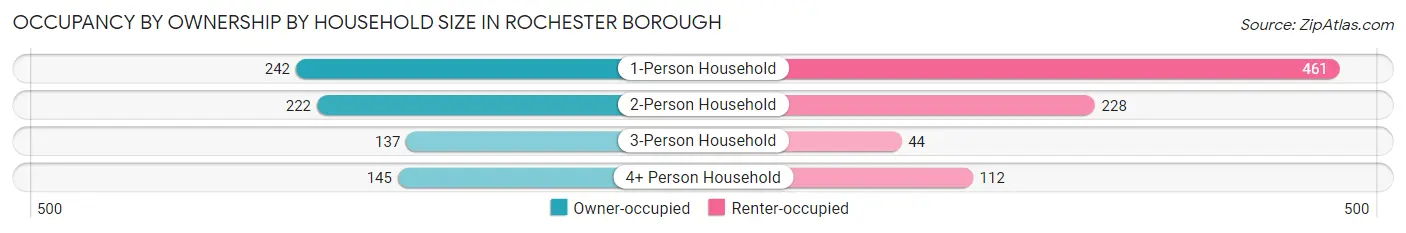
| Household Size | Owner-occupied | Renter-occupied |
| 1-Person Household | 242 (34.4%) | 461 (65.6%) |
| 2-Person Household | 222 (49.3%) | 228 (50.7%) |
| 3-Person Household | 137 (75.7%) | 44 (24.3%) |
| 4+ Person Household | 145 (56.4%) | 112 (43.6%) |
| Total Housing Units | 746 (46.9%) | 845 (53.1%) |
Occupancy by Educational Attainment in Rochester borough
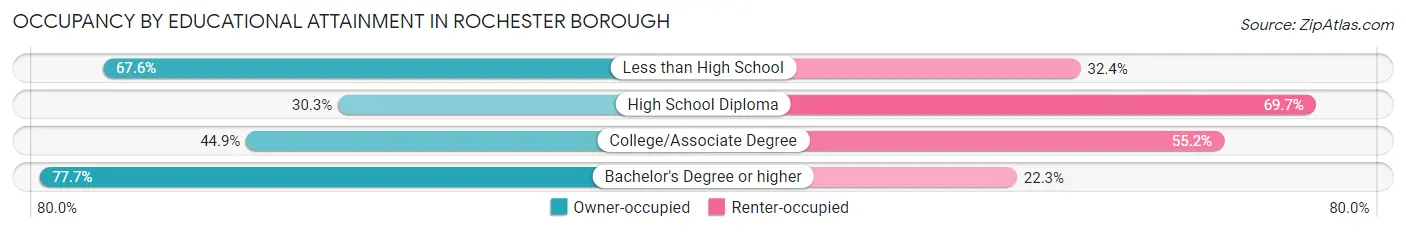
| Household Size | Owner-occupied | Renter-occupied |
| Less than High School | 125 (67.6%) | 60 (32.4%) |
| High School Diploma | 179 (30.3%) | 412 (69.7%) |
| College/Associate Degree | 261 (44.9%) | 321 (55.1%) |
| Bachelor's Degree or higher | 181 (77.7%) | 52 (22.3%) |
Occupancy by Age of Householder in Rochester borough
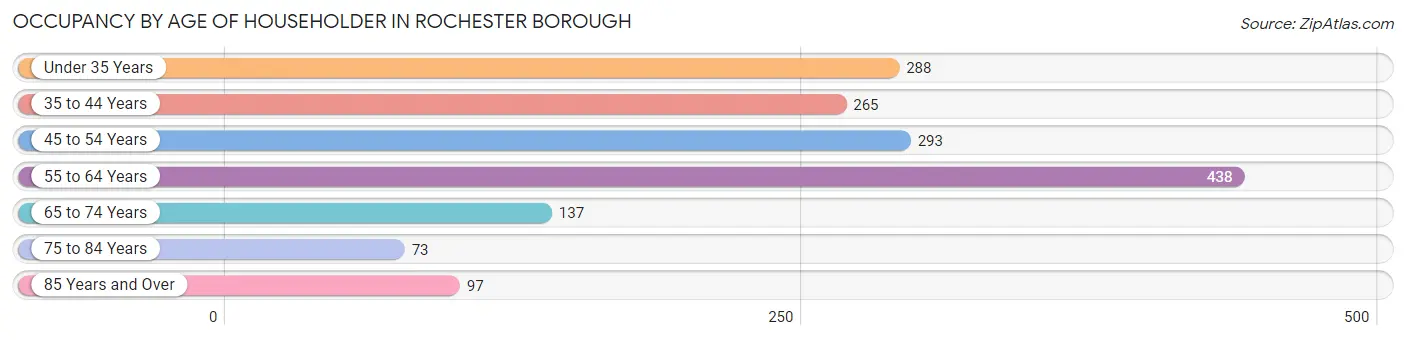
| Age Bracket | # Households | % Households |
| Under 35 Years | 288 | 18.1% |
| 35 to 44 Years | 265 | 16.7% |
| 45 to 54 Years | 293 | 18.4% |
| 55 to 64 Years | 438 | 27.5% |
| 65 to 74 Years | 137 | 8.6% |
| 75 to 84 Years | 73 | 4.6% |
| 85 Years and Over | 97 | 6.1% |
| Total | 1,591 | 100.0% |
Housing Finances in Rochester borough
Median Income by Occupancy in Rochester borough
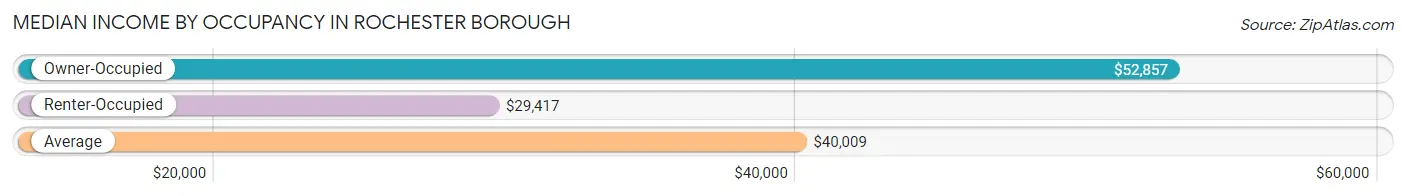
| Occupancy Type | # Households | Median Income |
| Owner-Occupied | 746 (46.9%) | $52,857 |
| Renter-Occupied | 845 (53.1%) | $29,417 |
| Average | 1,591 (100.0%) | $40,009 |
Occupancy by Householder Income Bracket in Rochester borough
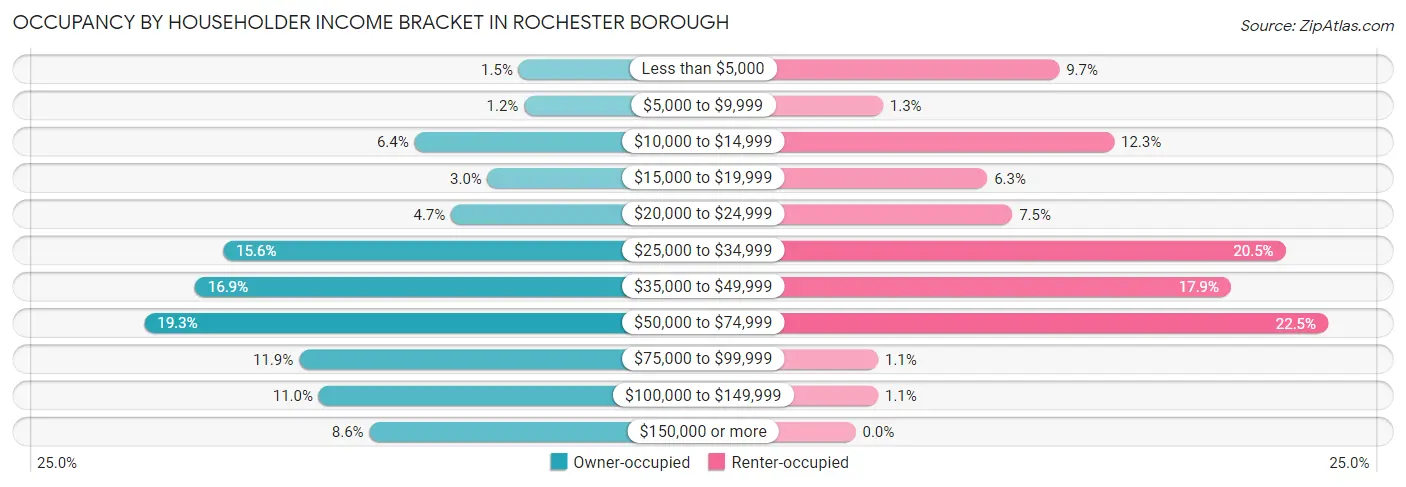
| Income Bracket | Owner-occupied | Renter-occupied |
| Less than $5,000 | 11 (1.5%) | 82 (9.7%) |
| $5,000 to $9,999 | 9 (1.2%) | 11 (1.3%) |
| $10,000 to $14,999 | 48 (6.4%) | 104 (12.3%) |
| $15,000 to $19,999 | 22 (2.9%) | 53 (6.3%) |
| $20,000 to $24,999 | 35 (4.7%) | 63 (7.5%) |
| $25,000 to $34,999 | 116 (15.5%) | 173 (20.5%) |
| $35,000 to $49,999 | 126 (16.9%) | 151 (17.9%) |
| $50,000 to $74,999 | 144 (19.3%) | 190 (22.5%) |
| $75,000 to $99,999 | 89 (11.9%) | 9 (1.1%) |
| $100,000 to $149,999 | 82 (11.0%) | 9 (1.1%) |
| $150,000 or more | 64 (8.6%) | 0 (0.0%) |
| Total | 746 (100.0%) | 845 (100.0%) |
Monthly Housing Cost Tiers in Rochester borough
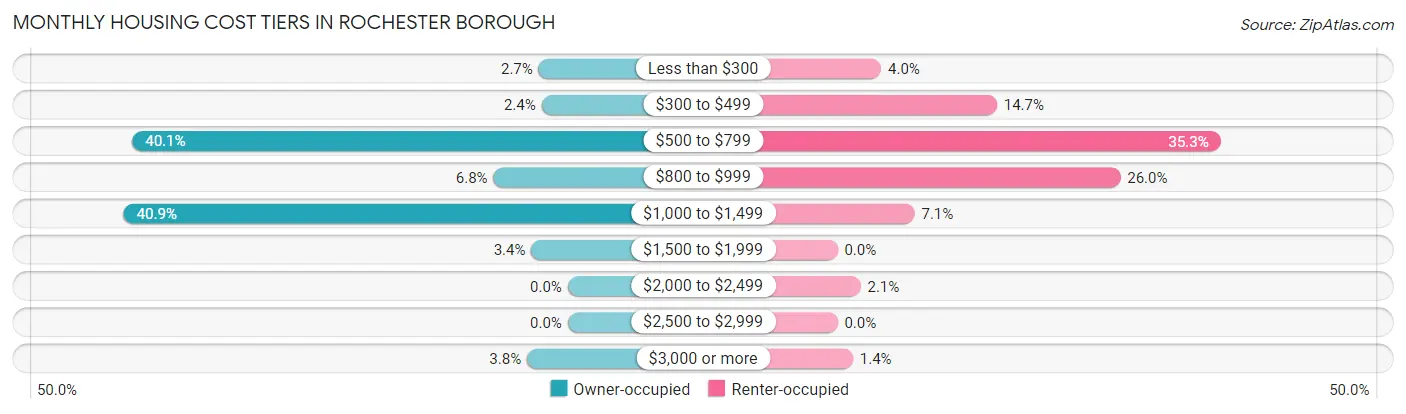
| Monthly Cost | Owner-occupied | Renter-occupied |
| Less than $300 | 20 (2.7%) | 34 (4.0%) |
| $300 to $499 | 18 (2.4%) | 124 (14.7%) |
| $500 to $799 | 299 (40.1%) | 298 (35.3%) |
| $800 to $999 | 51 (6.8%) | 220 (26.0%) |
| $1,000 to $1,499 | 305 (40.9%) | 60 (7.1%) |
| $1,500 to $1,999 | 25 (3.4%) | 0 (0.0%) |
| $2,000 to $2,499 | 0 (0.0%) | 18 (2.1%) |
| $2,500 to $2,999 | 0 (0.0%) | 0 (0.0%) |
| $3,000 or more | 28 (3.7%) | 12 (1.4%) |
| Total | 746 (100.0%) | 845 (100.0%) |
Physical Housing Characteristics in Rochester borough
Housing Structures in Rochester borough
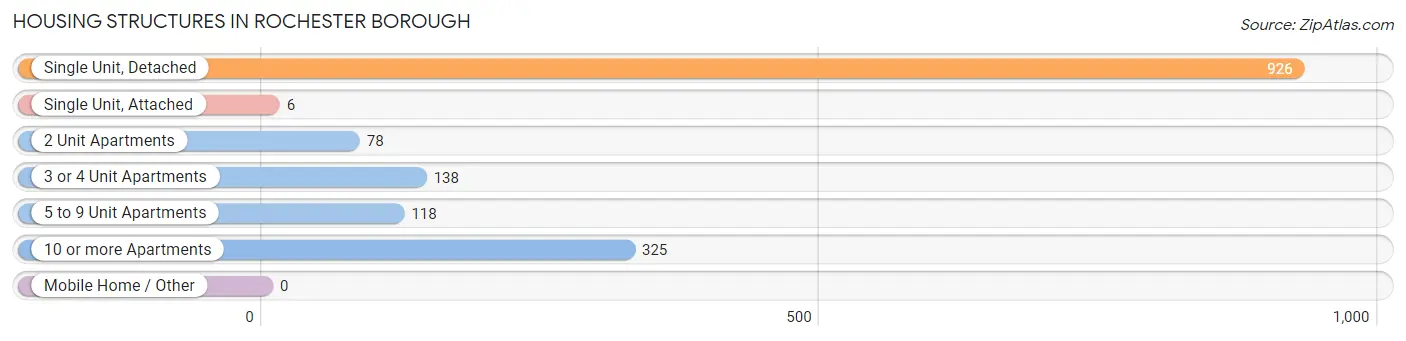
| Structure Type | # Housing Units | % Housing Units |
| Single Unit, Detached | 926 | 58.2% |
| Single Unit, Attached | 6 | 0.4% |
| 2 Unit Apartments | 78 | 4.9% |
| 3 or 4 Unit Apartments | 138 | 8.7% |
| 5 to 9 Unit Apartments | 118 | 7.4% |
| 10 or more Apartments | 325 | 20.4% |
| Mobile Home / Other | 0 | 0.0% |
| Total | 1,591 | 100.0% |
Housing Structures by Occupancy in Rochester borough
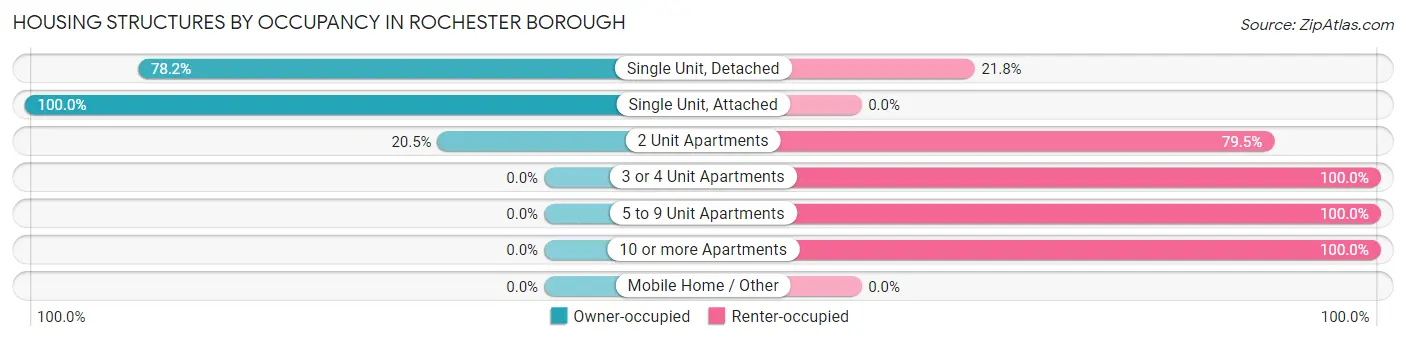
| Structure Type | Owner-occupied | Renter-occupied |
| Single Unit, Detached | 724 (78.2%) | 202 (21.8%) |
| Single Unit, Attached | 6 (100.0%) | 0 (0.0%) |
| 2 Unit Apartments | 16 (20.5%) | 62 (79.5%) |
| 3 or 4 Unit Apartments | 0 (0.0%) | 138 (100.0%) |
| 5 to 9 Unit Apartments | 0 (0.0%) | 118 (100.0%) |
| 10 or more Apartments | 0 (0.0%) | 325 (100.0%) |
| Mobile Home / Other | 0 (0.0%) | 0 (0.0%) |
| Total | 746 (46.9%) | 845 (53.1%) |
Housing Structures by Number of Rooms in Rochester borough
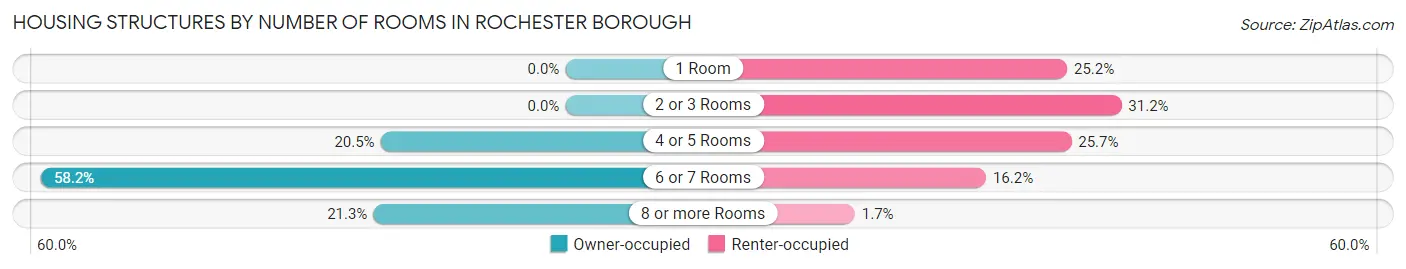
| Number of Rooms | Owner-occupied | Renter-occupied |
| 1 Room | 0 (0.0%) | 213 (25.2%) |
| 2 or 3 Rooms | 0 (0.0%) | 264 (31.2%) |
| 4 or 5 Rooms | 153 (20.5%) | 217 (25.7%) |
| 6 or 7 Rooms | 434 (58.2%) | 137 (16.2%) |
| 8 or more Rooms | 159 (21.3%) | 14 (1.7%) |
| Total | 746 (100.0%) | 845 (100.0%) |
Housing Structure by Heating Type in Rochester borough
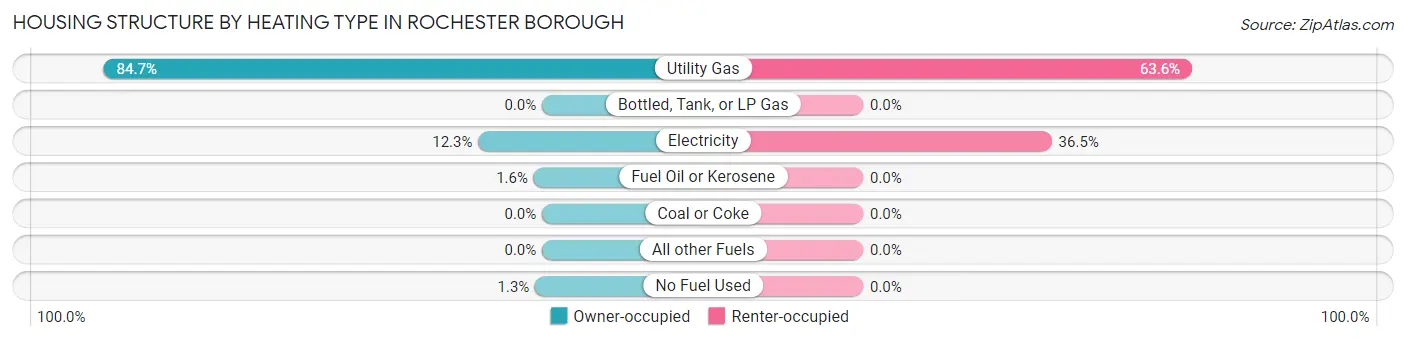
| Heating Type | Owner-occupied | Renter-occupied |
| Utility Gas | 632 (84.7%) | 537 (63.5%) |
| Bottled, Tank, or LP Gas | 0 (0.0%) | 0 (0.0%) |
| Electricity | 92 (12.3%) | 308 (36.4%) |
| Fuel Oil or Kerosene | 12 (1.6%) | 0 (0.0%) |
| Coal or Coke | 0 (0.0%) | 0 (0.0%) |
| All other Fuels | 0 (0.0%) | 0 (0.0%) |
| No Fuel Used | 10 (1.3%) | 0 (0.0%) |
| Total | 746 (100.0%) | 845 (100.0%) |
Household Vehicle Usage in Rochester borough
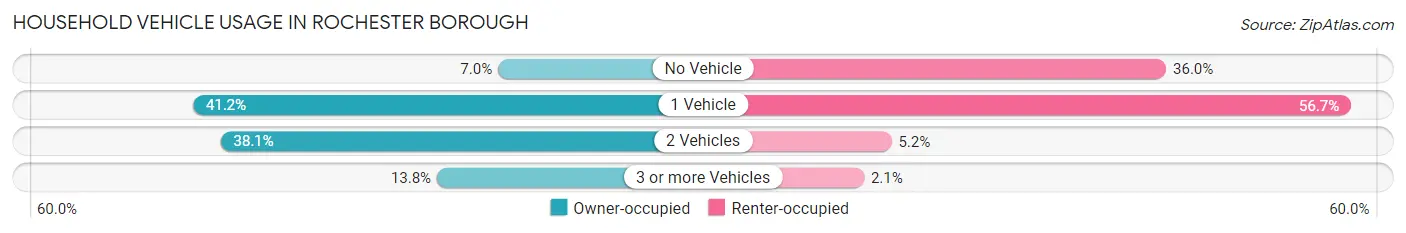
| Vehicles per Household | Owner-occupied | Renter-occupied |
| No Vehicle | 52 (7.0%) | 304 (36.0%) |
| 1 Vehicle | 307 (41.1%) | 479 (56.7%) |
| 2 Vehicles | 284 (38.1%) | 44 (5.2%) |
| 3 or more Vehicles | 103 (13.8%) | 18 (2.1%) |
| Total | 746 (100.0%) | 845 (100.0%) |
Real Estate & Mortgages in Rochester borough
Real Estate and Mortgage Overview in Rochester borough
| Characteristic | Without Mortgage | With Mortgage |
| Housing Units | 352 | 394 |
| Median Property Value | $105,600 | $90,700 |
| Median Household Income | $40,037 | $38 |
| Monthly Housing Costs | $615 | $28 |
| Real Estate Taxes | $2,324 | $10 |
Property Value by Mortgage Status in Rochester borough
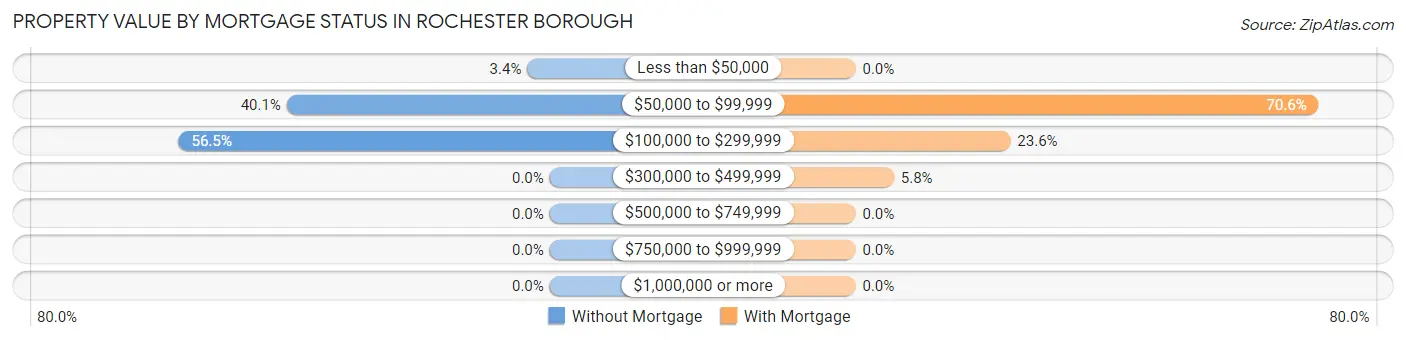
| Property Value | Without Mortgage | With Mortgage |
| Less than $50,000 | 12 (3.4%) | 0 (0.0%) |
| $50,000 to $99,999 | 141 (40.1%) | 278 (70.6%) |
| $100,000 to $299,999 | 199 (56.5%) | 93 (23.6%) |
| $300,000 to $499,999 | 0 (0.0%) | 23 (5.8%) |
| $500,000 to $749,999 | 0 (0.0%) | 0 (0.0%) |
| $750,000 to $999,999 | 0 (0.0%) | 0 (0.0%) |
| $1,000,000 or more | 0 (0.0%) | 0 (0.0%) |
| Total | 352 (100.0%) | 394 (100.0%) |
Household Income by Mortgage Status in Rochester borough
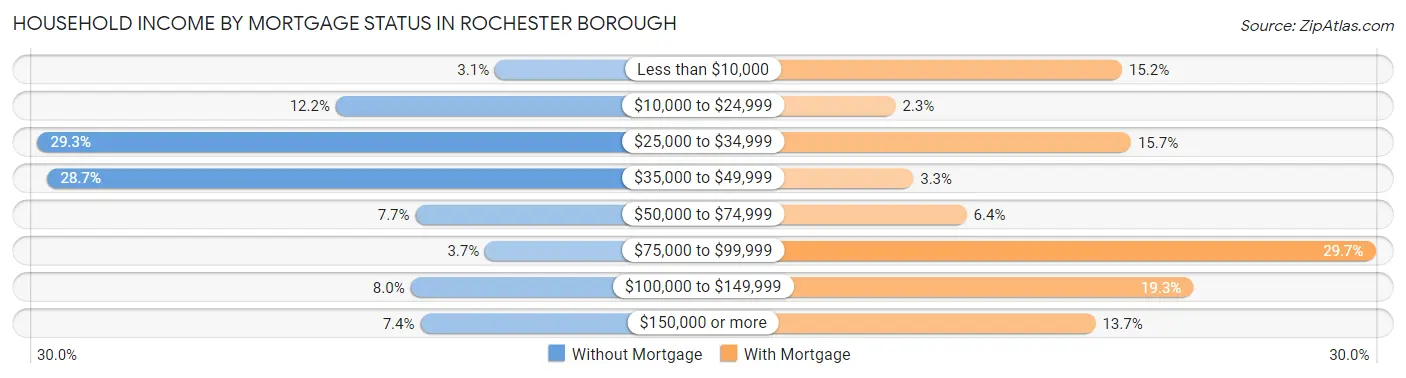
| Household Income | Without Mortgage | With Mortgage |
| Less than $10,000 | 11 (3.1%) | 60 (15.2%) |
| $10,000 to $24,999 | 43 (12.2%) | 9 (2.3%) |
| $25,000 to $34,999 | 103 (29.3%) | 62 (15.7%) |
| $35,000 to $49,999 | 101 (28.7%) | 13 (3.3%) |
| $50,000 to $74,999 | 27 (7.7%) | 25 (6.4%) |
| $75,000 to $99,999 | 13 (3.7%) | 117 (29.7%) |
| $100,000 to $149,999 | 28 (8.0%) | 76 (19.3%) |
| $150,000 or more | 26 (7.4%) | 54 (13.7%) |
| Total | 352 (100.0%) | 394 (100.0%) |
Property Value to Household Income Ratio in Rochester borough
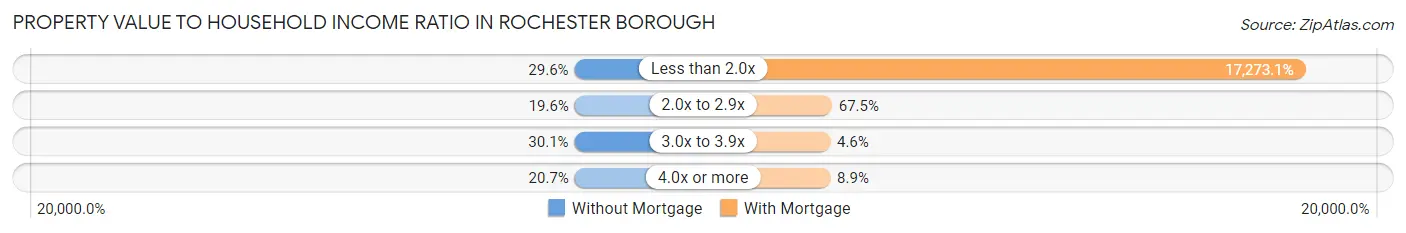
| Value-to-Income Ratio | Without Mortgage | With Mortgage |
| Less than 2.0x | 104 (29.5%) | 68,056 (17,273.1%) |
| 2.0x to 2.9x | 69 (19.6%) | 266 (67.5%) |
| 3.0x to 3.9x | 106 (30.1%) | 18 (4.6%) |
| 4.0x or more | 73 (20.7%) | 35 (8.9%) |
| Total | 352 (100.0%) | 394 (100.0%) |
Real Estate Taxes by Mortgage Status in Rochester borough
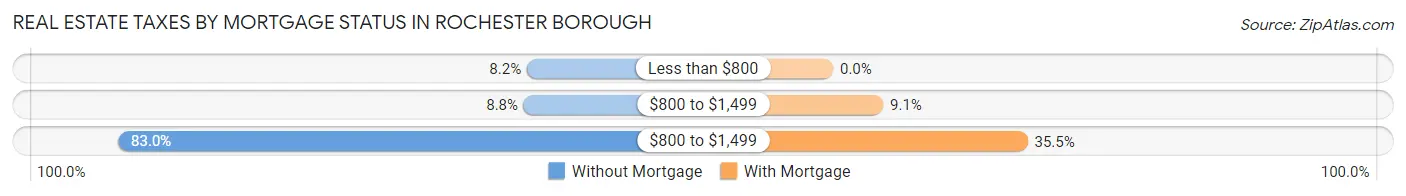
| Property Taxes | Without Mortgage | With Mortgage |
| Less than $800 | 29 (8.2%) | 0 (0.0%) |
| $800 to $1,499 | 31 (8.8%) | 36 (9.1%) |
| $800 to $1,499 | 292 (83.0%) | 140 (35.5%) |
| Total | 352 (100.0%) | 394 (100.0%) |
Health & Disability in Rochester borough
Health Insurance Coverage by Age in Rochester borough
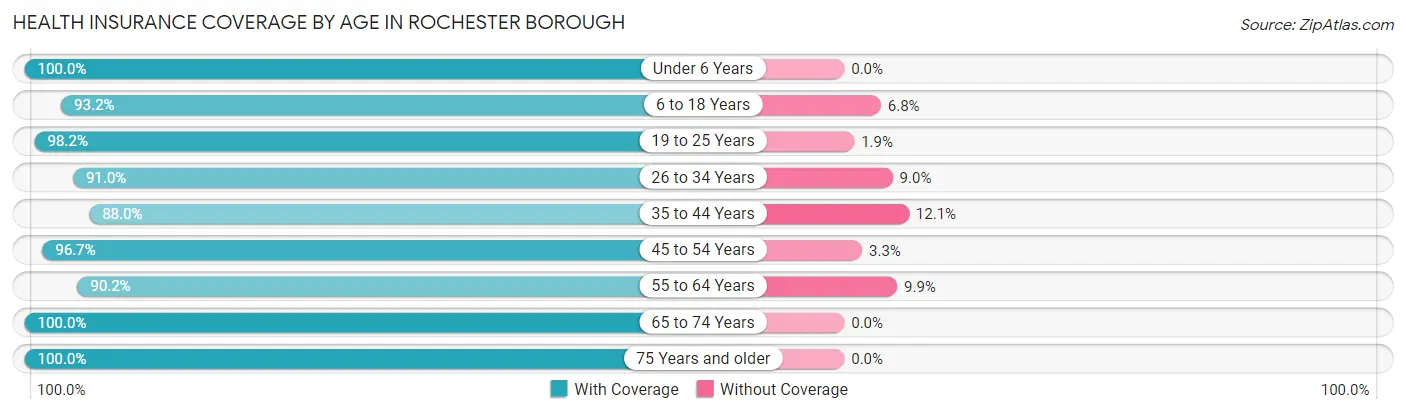
| Age Bracket | With Coverage | Without Coverage |
| Under 6 Years | 262 (100.0%) | 0 (0.0%) |
| 6 to 18 Years | 492 (93.2%) | 36 (6.8%) |
| 19 to 25 Years | 212 (98.2%) | 4 (1.8%) |
| 26 to 34 Years | 484 (91.0%) | 48 (9.0%) |
| 35 to 44 Years | 438 (87.9%) | 60 (12.0%) |
| 45 to 54 Years | 378 (96.7%) | 13 (3.3%) |
| 55 to 64 Years | 531 (90.1%) | 58 (9.9%) |
| 65 to 74 Years | 161 (100.0%) | 0 (0.0%) |
| 75 Years and older | 220 (100.0%) | 0 (0.0%) |
| Total | 3,178 (93.5%) | 219 (6.5%) |
Health Insurance Coverage by Citizenship Status in Rochester borough
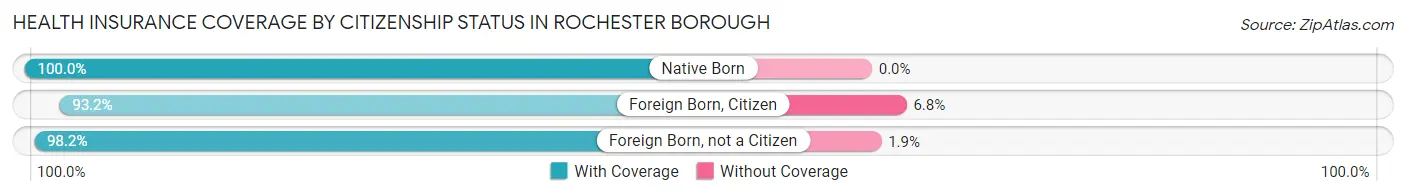
| Citizenship Status | With Coverage | Without Coverage |
| Native Born | 262 (100.0%) | 0 (0.0%) |
| Foreign Born, Citizen | 492 (93.2%) | 36 (6.8%) |
| Foreign Born, not a Citizen | 212 (98.2%) | 4 (1.8%) |
Health Insurance Coverage by Household Income in Rochester borough
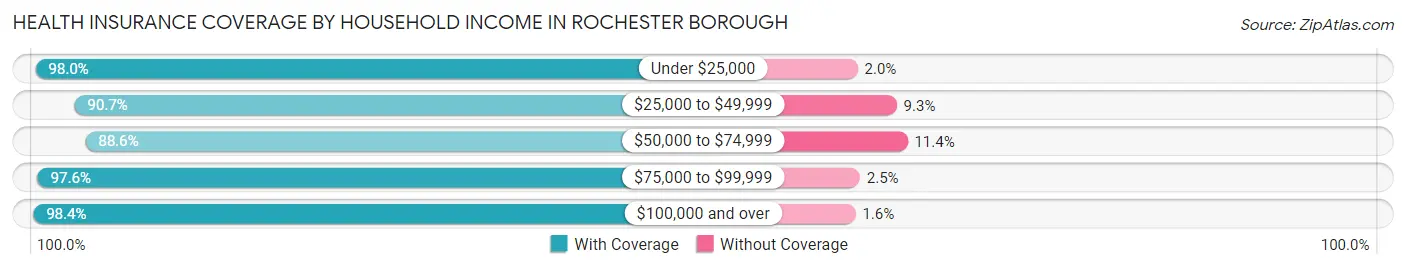
| Household Income | With Coverage | Without Coverage |
| Under $25,000 | 724 (98.0%) | 15 (2.0%) |
| $25,000 to $49,999 | 1,038 (90.7%) | 107 (9.3%) |
| $50,000 to $74,999 | 639 (88.6%) | 82 (11.4%) |
| $75,000 to $99,999 | 279 (97.6%) | 7 (2.5%) |
| $100,000 and over | 486 (98.4%) | 8 (1.6%) |
Public vs Private Health Insurance Coverage by Age in Rochester borough
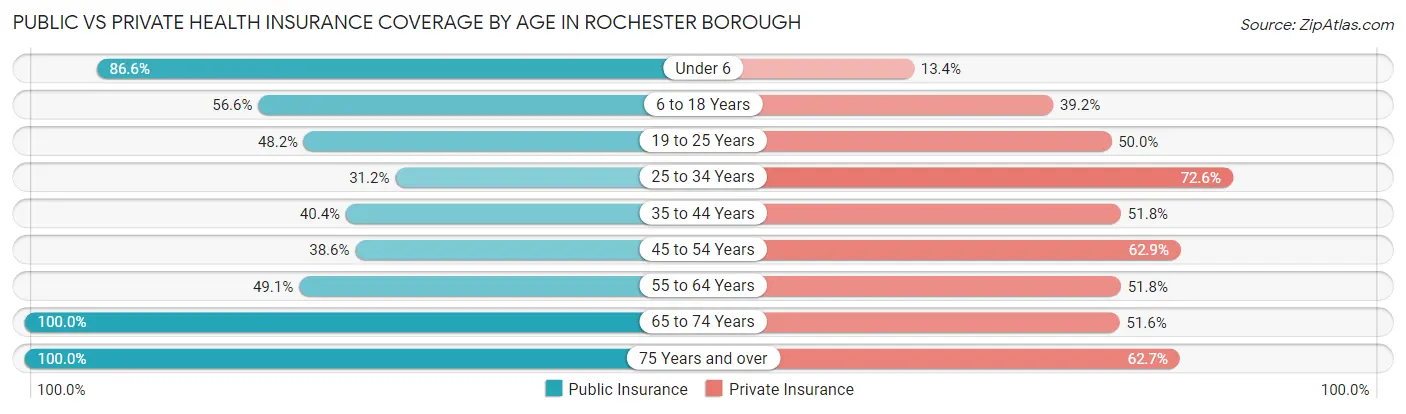
| Age Bracket | Public Insurance | Private Insurance |
| Under 6 | 227 (86.6%) | 35 (13.4%) |
| 6 to 18 Years | 299 (56.6%) | 207 (39.2%) |
| 19 to 25 Years | 104 (48.1%) | 108 (50.0%) |
| 25 to 34 Years | 166 (31.2%) | 386 (72.6%) |
| 35 to 44 Years | 201 (40.4%) | 258 (51.8%) |
| 45 to 54 Years | 151 (38.6%) | 246 (62.9%) |
| 55 to 64 Years | 289 (49.1%) | 305 (51.8%) |
| 65 to 74 Years | 161 (100.0%) | 83 (51.5%) |
| 75 Years and over | 220 (100.0%) | 138 (62.7%) |
| Total | 1,818 (53.5%) | 1,766 (52.0%) |
Disability Status by Sex by Age in Rochester borough
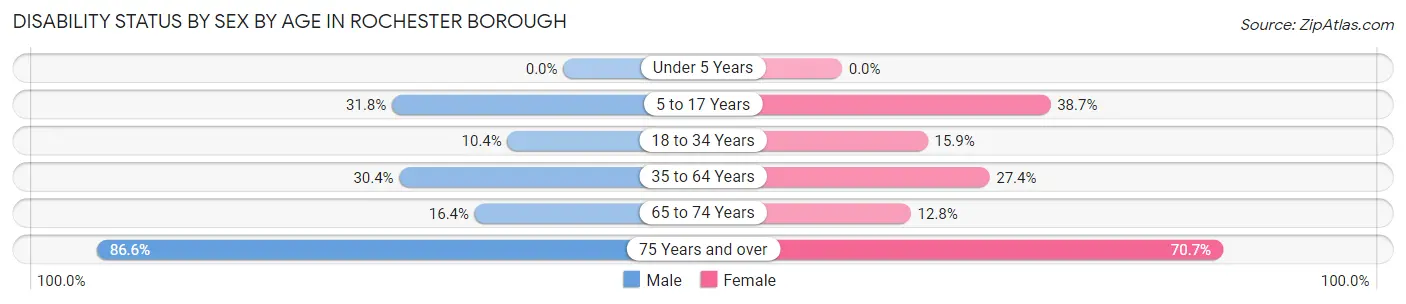
| Age Bracket | Male | Female |
| Under 5 Years | 0 (0.0%) | 0 (0.0%) |
| 5 to 17 Years | 75 (31.8%) | 118 (38.7%) |
| 18 to 34 Years | 41 (10.3%) | 63 (15.9%) |
| 35 to 64 Years | 223 (30.4%) | 204 (27.4%) |
| 65 to 74 Years | 11 (16.4%) | 12 (12.8%) |
| 75 Years and over | 84 (86.6%) | 87 (70.7%) |
Disability Class by Sex by Age in Rochester borough
Disability Class: Hearing Difficulty
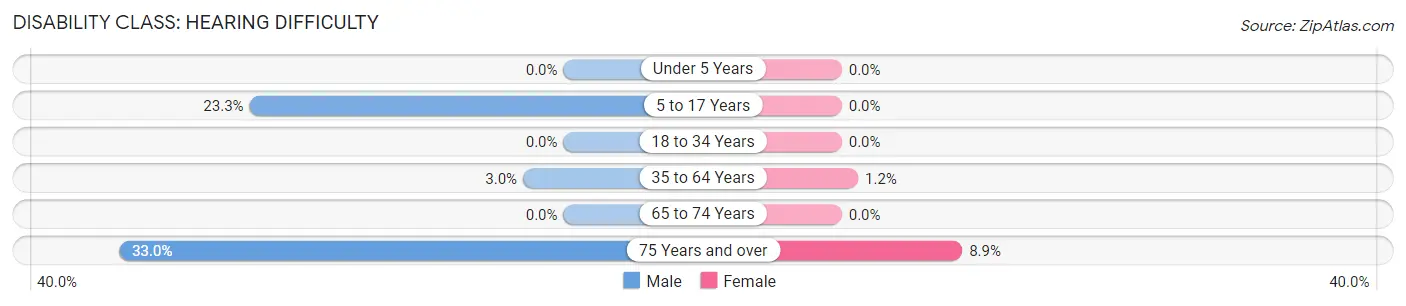
| Age Bracket | Male | Female |
| Under 5 Years | 0 (0.0%) | 0 (0.0%) |
| 5 to 17 Years | 55 (23.3%) | 0 (0.0%) |
| 18 to 34 Years | 0 (0.0%) | 0 (0.0%) |
| 35 to 64 Years | 22 (3.0%) | 9 (1.2%) |
| 65 to 74 Years | 0 (0.0%) | 0 (0.0%) |
| 75 Years and over | 32 (33.0%) | 11 (8.9%) |
Disability Class: Vision Difficulty
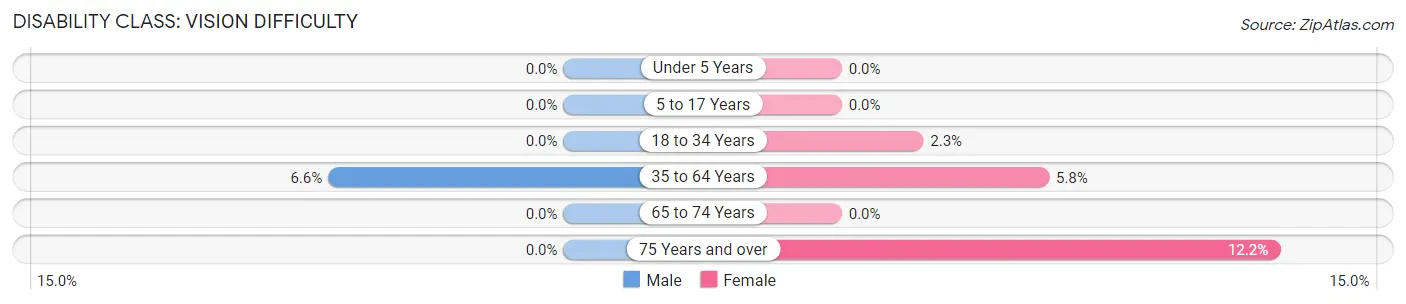
| Age Bracket | Male | Female |
| Under 5 Years | 0 (0.0%) | 0 (0.0%) |
| 5 to 17 Years | 0 (0.0%) | 0 (0.0%) |
| 18 to 34 Years | 0 (0.0%) | 9 (2.3%) |
| 35 to 64 Years | 48 (6.6%) | 43 (5.8%) |
| 65 to 74 Years | 0 (0.0%) | 0 (0.0%) |
| 75 Years and over | 0 (0.0%) | 15 (12.2%) |
Disability Class: Cognitive Difficulty
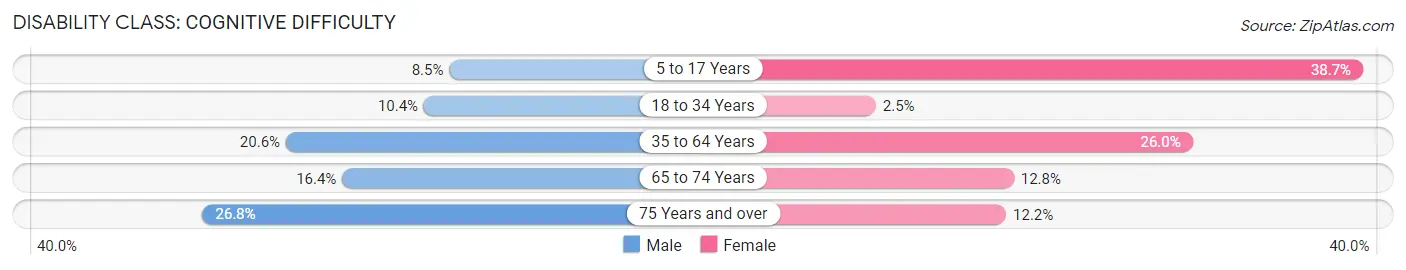
| Age Bracket | Male | Female |
| 5 to 17 Years | 20 (8.5%) | 118 (38.7%) |
| 18 to 34 Years | 41 (10.3%) | 10 (2.5%) |
| 35 to 64 Years | 151 (20.6%) | 194 (26.0%) |
| 65 to 74 Years | 11 (16.4%) | 12 (12.8%) |
| 75 Years and over | 26 (26.8%) | 15 (12.2%) |
Disability Class: Ambulatory Difficulty
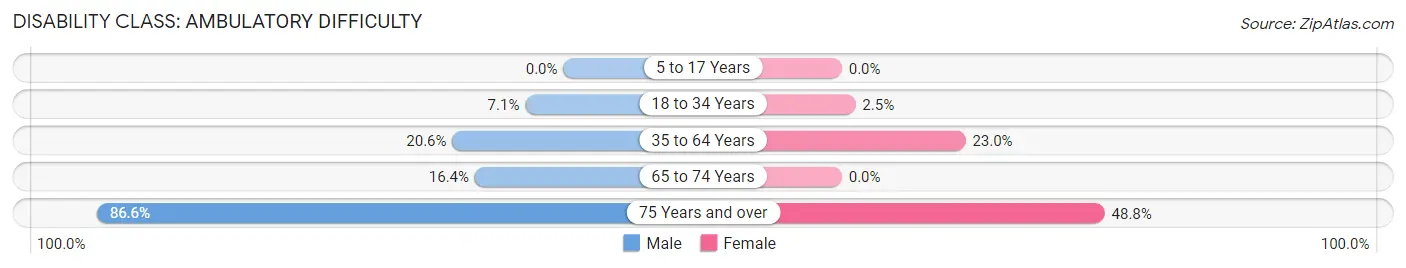
| Age Bracket | Male | Female |
| 5 to 17 Years | 0 (0.0%) | 0 (0.0%) |
| 18 to 34 Years | 28 (7.1%) | 10 (2.5%) |
| 35 to 64 Years | 151 (20.6%) | 171 (23.0%) |
| 65 to 74 Years | 11 (16.4%) | 0 (0.0%) |
| 75 Years and over | 84 (86.6%) | 60 (48.8%) |
Disability Class: Self-Care Difficulty
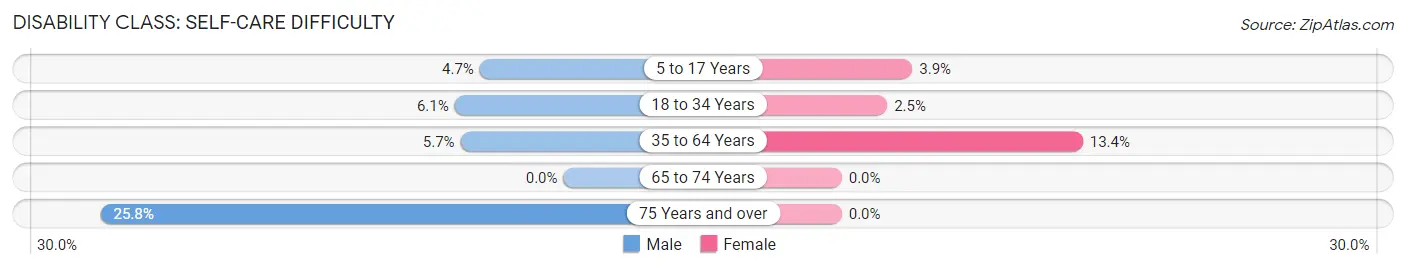
| Age Bracket | Male | Female |
| 5 to 17 Years | 11 (4.7%) | 12 (3.9%) |
| 18 to 34 Years | 24 (6.1%) | 10 (2.5%) |
| 35 to 64 Years | 42 (5.7%) | 100 (13.4%) |
| 65 to 74 Years | 0 (0.0%) | 0 (0.0%) |
| 75 Years and over | 25 (25.8%) | 0 (0.0%) |
Technology Access in Rochester borough
Computing Device Access in Rochester borough
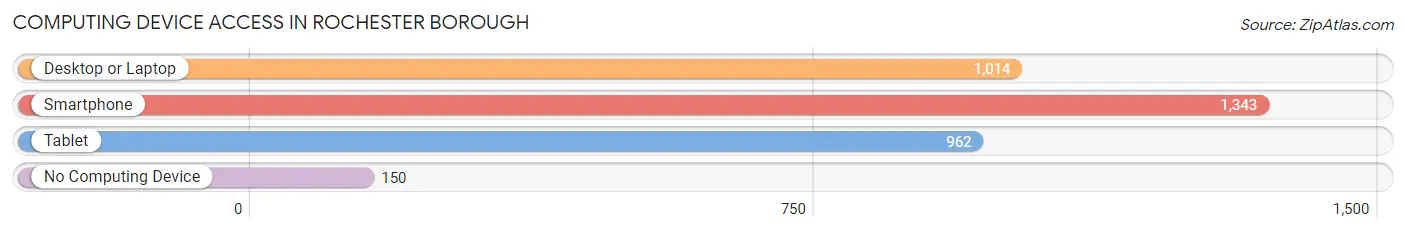
| Device Type | # Households | % Households |
| Desktop or Laptop | 1,014 | 63.7% |
| Smartphone | 1,343 | 84.4% |
| Tablet | 962 | 60.5% |
| No Computing Device | 150 | 9.4% |
| Total | 1,591 | 100.0% |
Internet Access in Rochester borough
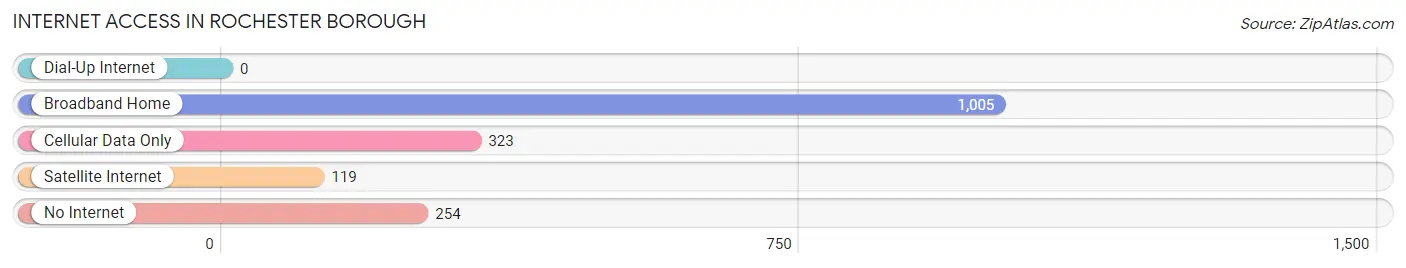
| Internet Type | # Households | % Households |
| Dial-Up Internet | 0 | 0.0% |
| Broadband Home | 1,005 | 63.2% |
| Cellular Data Only | 323 | 20.3% |
| Satellite Internet | 119 | 7.5% |
| No Internet | 254 | 16.0% |
| Total | 1,591 | 100.0% |
Rochester borough Summary
Rochester Borough is a small borough located in Beaver County, Pennsylvania. It is situated along the Ohio River, approximately 25 miles northwest of Pittsburgh. The borough has a population of 2,717 as of the 2010 census, and is part of the Pittsburgh metropolitan area.
History
Rochester Borough was founded in 1802 by John Simons, a Revolutionary War veteran. Simons purchased the land from the local Native American tribes and named the area after his hometown of Rochester, New York. The borough was incorporated in 1849 and was the first borough in Beaver County.
In the early 19th century, the borough was a major center for the production of iron and steel. The industry was centered around the Beaver Falls Iron Works, which was established in 1832. The iron works was the largest in the region and employed hundreds of workers. The industry declined in the late 19th century, but the borough remained an important center for the production of coal and other minerals.
Geography
Rochester Borough is located at 40°41'N 80°20'W (40.68, -80.33). It is situated along the Ohio River, approximately 25 miles northwest of Pittsburgh. The borough has a total area of 1.2 square miles, all of which is land.
The borough is located in the Allegheny Plateau region of Pennsylvania. The terrain is mostly flat, with some rolling hills. The climate is humid continental, with cold winters and hot, humid summers.
Economy
Rochester Borough has a diverse economy. The largest employers in the borough are the Beaver County Courthouse, the Beaver County Jail, and the Beaver County Health Center. Other major employers include the Rochester School District, the Rochester Public Library, and the Rochester Area Chamber of Commerce.
The borough also has a number of small businesses, including restaurants, retail stores, and professional services. The borough is home to several manufacturing companies, including a steel mill and a paper mill.
Demographics
As of the 2010 census, there were 2,717 people, 1,093 households, and 690 families residing in the borough. The population density was 2,250.7 people per square mile. The racial makeup of the borough was 94.2% White, 2.7% African American, 0.2% Native American, 0.7% Asian, 0.1% Pacific Islander, 0.7% from other races, and 1.4% from two or more races. Hispanic or Latino of any race were 1.7% of the population.
The median income for a household in the borough was $37,917, and the median income for a family was $45,938. The per capita income for the borough was $18,945. About 11.2% of families and 14.2% of the population were below the poverty line, including 22.2% of those under age 18 and 8.2% of those age 65 or over.
Common Questions
What is Per Capita Income in Rochester borough?
Per Capita income in Rochester borough is $22,297.
What is the Median Family Income in Rochester borough?
Median Family Income in Rochester borough is $53,689.
What is the Median Household income in Rochester borough?
Median Household Income in Rochester borough is $40,009.
What is Income or Wage Gap in Rochester borough?
Income or Wage Gap in Rochester borough is 23.8%.
Women in Rochester borough earn 76.2 cents for every dollar earned by a man.
What is Inequality or Gini Index in Rochester borough?
Inequality or Gini Index in Rochester borough is 0.41.
What is the Total Population of Rochester borough?
Total Population of Rochester borough is 3,460.
What is the Total Male Population of Rochester borough?
Total Male Population of Rochester borough is 1,647.
What is the Total Female Population of Rochester borough?
Total Female Population of Rochester borough is 1,813.
What is the Ratio of Males per 100 Females in Rochester borough?
There are 90.84 Males per 100 Females in Rochester borough.
What is the Ratio of Females per 100 Males in Rochester borough?
There are 110.08 Females per 100 Males in Rochester borough.
What is the Median Population Age in Rochester borough?
Median Population Age in Rochester borough is 38.5 Years.
What is the Average Family Size in Rochester borough
Average Family Size in Rochester borough is 3.0 People.
What is the Average Household Size in Rochester borough
Average Household Size in Rochester borough is 2.1 People.
How Large is the Labor Force in Rochester borough?
There are 1,647 People in the Labor Forcein in Rochester borough.
What is the Percentage of People in the Labor Force in Rochester borough?
59.3% of People are in the Labor Force in Rochester borough.
What is the Unemployment Rate in Rochester borough?
Unemployment Rate in Rochester borough is 5.9%.