Munhall borough, PA Map & Demographics
Munhall borough Overview
$33,373
PER CAPITA INCOME
$73,571
AVG FAMILY INCOME
$47,879
AVG HOUSEHOLD INCOME
20.2%
WAGE / INCOME GAP [ % ]
79.8¢/ $1
WAGE / INCOME GAP [ $ ]
0.46
INEQUALITY / GINI INDEX
10,738
TOTAL POPULATION
5,003
MALE POPULATION
5,735
FEMALE POPULATION
87.24
MALES / 100 FEMALES
114.63
FEMALES / 100 MALES
44.9
MEDIAN AGE
3.0
AVG FAMILY SIZE
2.1
AVG HOUSEHOLD SIZE
5,656
LABOR FORCE [ PEOPLE ]
63.2%
PERCENT IN LABOR FORCE
6.6%
UNEMPLOYMENT RATE
Income in Munhall borough
Income Overview in Munhall borough
Per Capita Income in Munhall borough is $33,373, while median incomes of families and households are $73,571 and $47,879 respectively.
| Characteristic | Number | Measure |
| Per Capita Income | 10,738 | $33,373 |
| Median Family Income | 2,466 | $73,571 |
| Mean Family Income | 2,466 | $90,450 |
| Median Household Income | 5,148 | $47,879 |
| Mean Household Income | 5,148 | $68,119 |
| Income Deficit | 2,466 | $0 |
| Wage / Income Gap (%) | 10,738 | 20.16% |
| Wage / Income Gap ($) | 10,738 | 79.84¢ per $1 |
| Gini / Inequality Index | 10,738 | 0.46 |
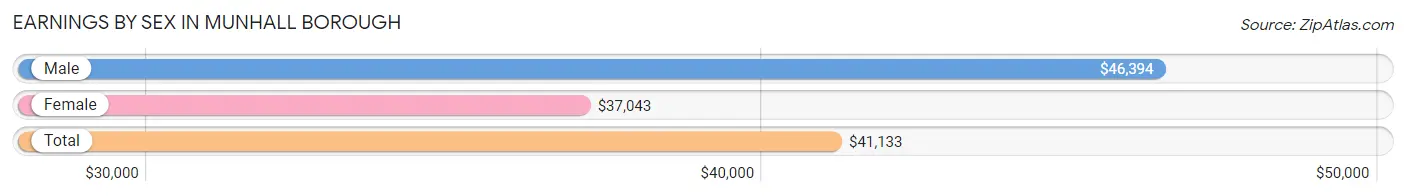
Earnings by Sex in Munhall borough
Average Earnings in Munhall borough are $41,133, $46,394 for men and $37,043 for women, a difference of 20.2%.
| Sex | Number | Average Earnings |
| Male | 2,666 (46.4%) | $46,394 |
| Female | 3,077 (53.6%) | $37,043 |
| Total | 5,743 (100.0%) | $41,133 |
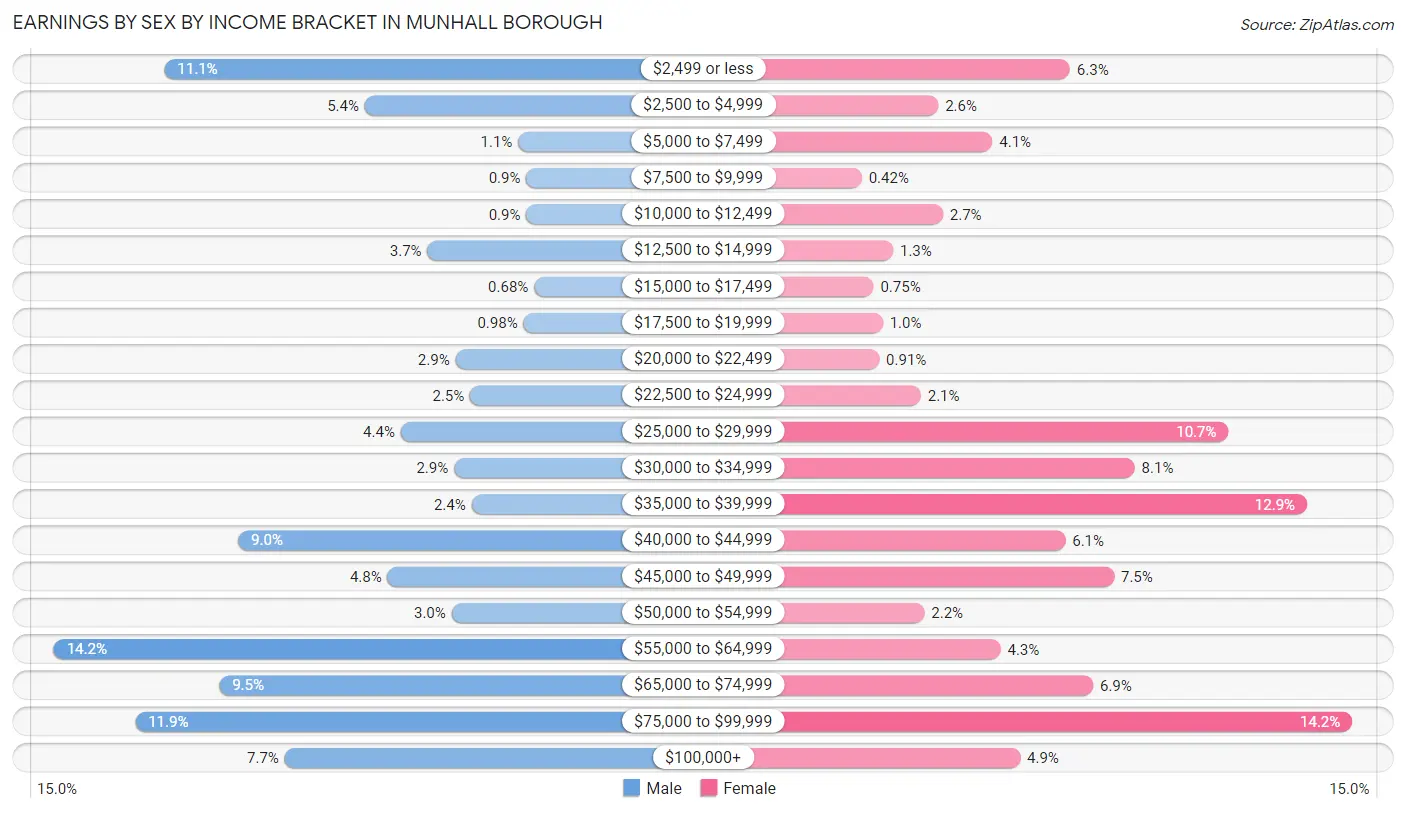
Earnings by Sex by Income Bracket in Munhall borough
The most common earnings brackets in Munhall borough are $55,000 to $64,999 for men (378 | 14.2%) and $75,000 to $99,999 for women (437 | 14.2%).
| Income | Male | Female |
| $2,499 or less | 295 (11.1%) | 193 (6.3%) |
| $2,500 to $4,999 | 145 (5.4%) | 79 (2.6%) |
| $5,000 to $7,499 | 30 (1.1%) | 126 (4.1%) |
| $7,500 to $9,999 | 24 (0.9%) | 13 (0.4%) |
| $10,000 to $12,499 | 24 (0.9%) | 83 (2.7%) |
| $12,500 to $14,999 | 98 (3.7%) | 40 (1.3%) |
| $15,000 to $17,499 | 18 (0.7%) | 23 (0.7%) |
| $17,500 to $19,999 | 26 (1.0%) | 31 (1.0%) |
| $20,000 to $22,499 | 77 (2.9%) | 28 (0.9%) |
| $22,500 to $24,999 | 66 (2.5%) | 64 (2.1%) |
| $25,000 to $29,999 | 118 (4.4%) | 330 (10.7%) |
| $30,000 to $34,999 | 78 (2.9%) | 249 (8.1%) |
| $35,000 to $39,999 | 65 (2.4%) | 398 (12.9%) |
| $40,000 to $44,999 | 240 (9.0%) | 189 (6.1%) |
| $45,000 to $49,999 | 128 (4.8%) | 231 (7.5%) |
| $50,000 to $54,999 | 80 (3.0%) | 67 (2.2%) |
| $55,000 to $64,999 | 378 (14.2%) | 133 (4.3%) |
| $65,000 to $74,999 | 254 (9.5%) | 213 (6.9%) |
| $75,000 to $99,999 | 317 (11.9%) | 437 (14.2%) |
| $100,000+ | 205 (7.7%) | 150 (4.9%) |
| Total | 2,666 (100.0%) | 3,077 (100.0%) |
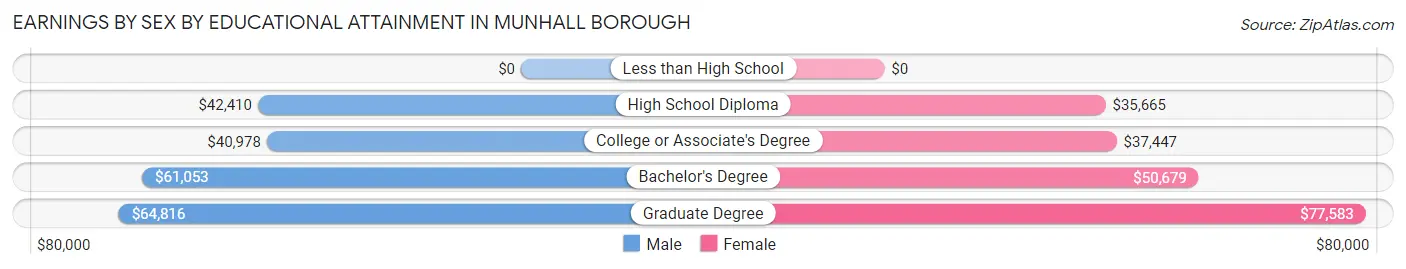
Earnings by Sex by Educational Attainment in Munhall borough
Average earnings in Munhall borough are $49,967 for men and $42,694 for women, a difference of 14.6%. Men with an educational attainment of graduate degree enjoy the highest average annual earnings of $64,816, while those with college or associate's degree education earn the least with $40,978. Women with an educational attainment of graduate degree earn the most with the average annual earnings of $77,583, while those with high school diploma education have the smallest earnings of $35,665.
| Educational Attainment | Male Income | Female Income |
| Less than High School | - | - |
| High School Diploma | $42,410 | $35,665 |
| College or Associate's Degree | $40,978 | $37,447 |
| Bachelor's Degree | $61,053 | $50,679 |
| Graduate Degree | $64,816 | $77,583 |
| Total | $49,967 | $42,694 |
Family Income in Munhall borough
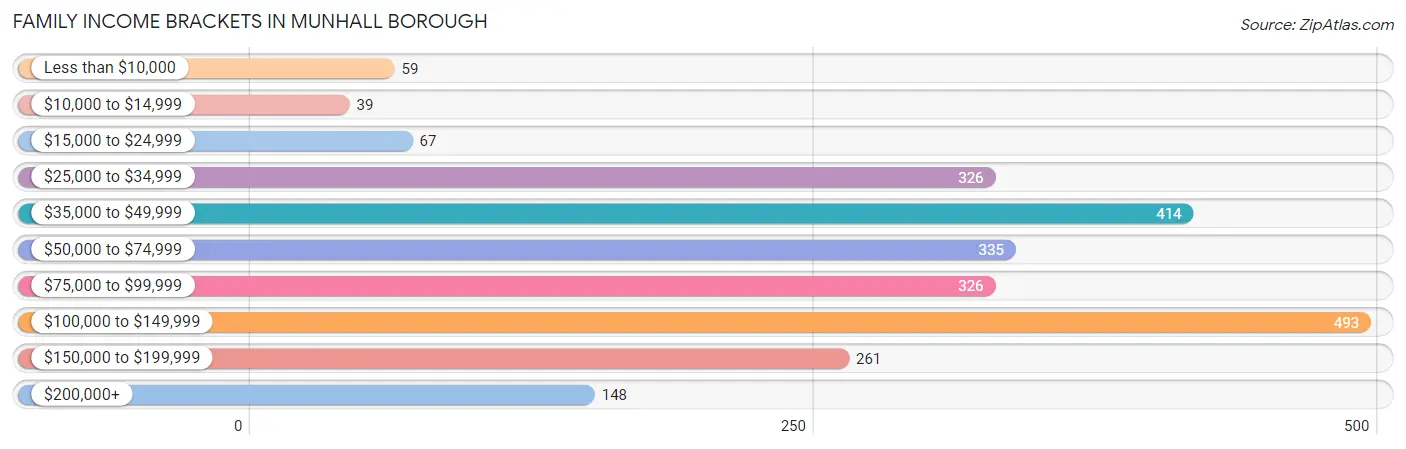
Family Income Brackets in Munhall borough
According to the Munhall borough family income data, there are 493 families falling into the $100,000 to $149,999 income range, which is the most common income bracket and makes up 20.0% of all families. Conversely, the $10,000 to $14,999 income bracket is the least frequent group with only 39 families (1.6%) belonging to this category.
| Income Bracket | # Families | % Families |
| Less than $10,000 | 59 | 2.4% |
| $10,000 to $14,999 | 39 | 1.6% |
| $15,000 to $24,999 | 67 | 2.7% |
| $25,000 to $34,999 | 326 | 13.2% |
| $35,000 to $49,999 | 414 | 16.8% |
| $50,000 to $74,999 | 335 | 13.6% |
| $75,000 to $99,999 | 326 | 13.2% |
| $100,000 to $149,999 | 493 | 20.0% |
| $150,000 to $199,999 | 261 | 10.6% |
| $200,000+ | 148 | 6.0% |
Family Income by Famaliy Size in Munhall borough
5-person families (249 | 10.1%) account for the highest median family income in Munhall borough with $105,360 per family, while 3-person families (527 | 21.4%) have the highest median income of $29,557 per family member.
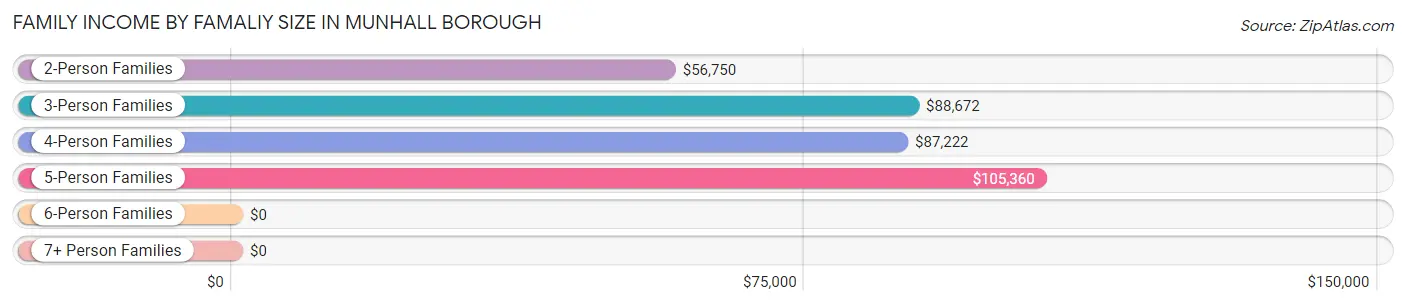
| Income Bracket | # Families | Median Income |
| 2-Person Families | 1,307 (53.0%) | $56,750 |
| 3-Person Families | 527 (21.4%) | $88,672 |
| 4-Person Families | 350 (14.2%) | $87,222 |
| 5-Person Families | 249 (10.1%) | $105,360 |
| 6-Person Families | 20 (0.8%) | $0 |
| 7+ Person Families | 13 (0.5%) | $0 |
| Total | 2,466 (100.0%) | $73,571 |
Family Income by Number of Earners in Munhall borough
The median family income in Munhall borough is $73,571, with families comprising 3+ earners (211) having the highest median family income of $152,917, while families with no earners (259) have the lowest median family income of $37,596, accounting for 8.6% and 10.5% of families, respectively.
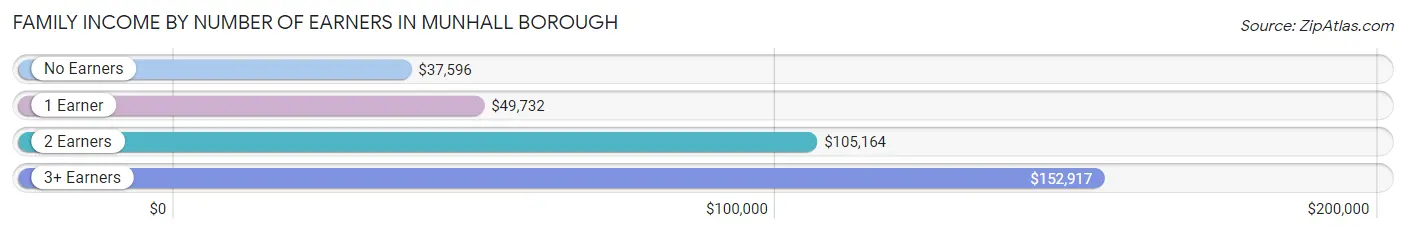
| Number of Earners | # Families | Median Income |
| No Earners | 259 (10.5%) | $37,596 |
| 1 Earner | 815 (33.1%) | $49,732 |
| 2 Earners | 1,181 (47.9%) | $105,164 |
| 3+ Earners | 211 (8.6%) | $152,917 |
| Total | 2,466 (100.0%) | $73,571 |
Household Income in Munhall borough
Household Income Brackets in Munhall borough
With 978 households falling in the category, the $35,000 to $49,999 income range is the most frequent in Munhall borough, accounting for 19.0% of all households. In contrast, only 196 households (3.8%) fall into the $200,000+ income bracket, making it the least populous group.
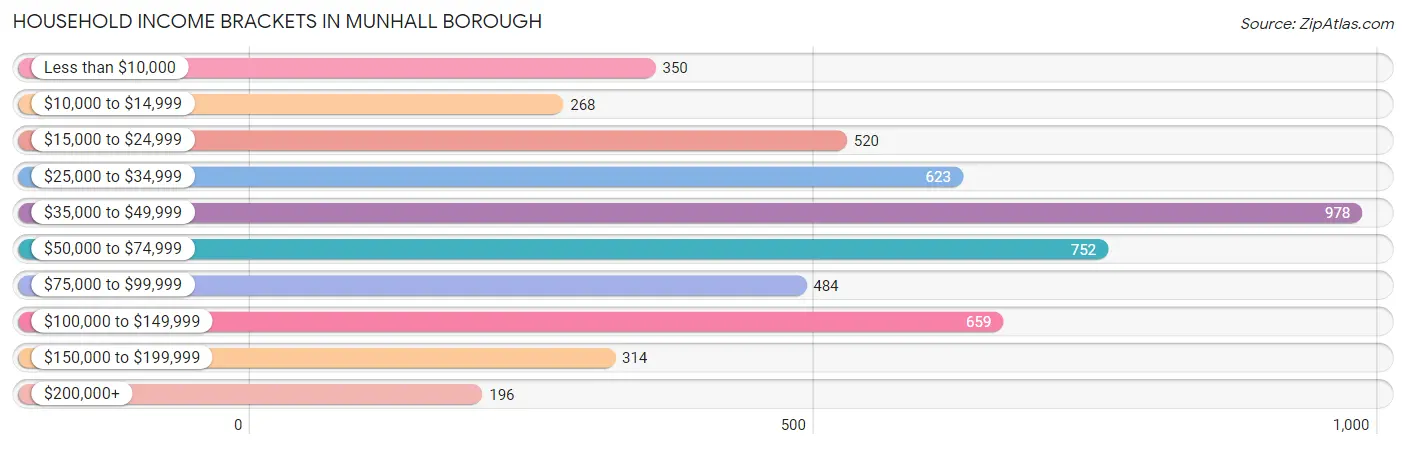
| Income Bracket | # Households | % Households |
| Less than $10,000 | 350 | 6.8% |
| $10,000 to $14,999 | 268 | 5.2% |
| $15,000 to $24,999 | 520 | 10.1% |
| $25,000 to $34,999 | 623 | 12.1% |
| $35,000 to $49,999 | 978 | 19.0% |
| $50,000 to $74,999 | 752 | 14.6% |
| $75,000 to $99,999 | 484 | 9.4% |
| $100,000 to $149,999 | 659 | 12.8% |
| $150,000 to $199,999 | 314 | 6.1% |
| $200,000+ | 196 | 3.8% |
Household Income by Householder Age in Munhall borough
The median household income in Munhall borough is $47,879, with the highest median household income of $66,971 found in the 45 to 64 years age bracket for the primary householder. A total of 1,741 households (33.8%) fall into this category. Meanwhile, the 15 to 24 years age bracket for the primary householder has the lowest median household income of $30,069, with 242 households (4.7%) in this group.
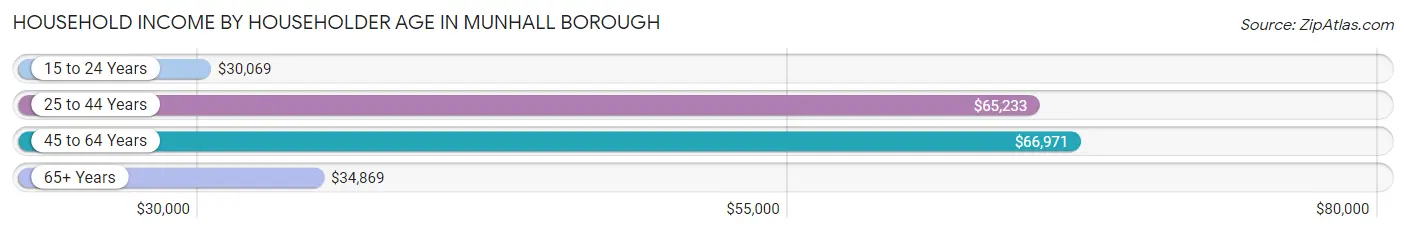
| Income Bracket | # Households | Median Income |
| 15 to 24 Years | 242 (4.7%) | $30,069 |
| 25 to 44 Years | 1,514 (29.4%) | $65,233 |
| 45 to 64 Years | 1,741 (33.8%) | $66,971 |
| 65+ Years | 1,651 (32.1%) | $34,869 |
| Total | 5,148 (100.0%) | $47,879 |
Poverty in Munhall borough
Income Below Poverty by Sex and Age in Munhall borough
With 11.5% poverty level for males and 14.8% for females among the residents of Munhall borough, 12 to 14 year old males and 25 to 34 year old females are the most vulnerable to poverty, with 38 males (26.0%) and 261 females (33.9%) in their respective age groups living below the poverty level.
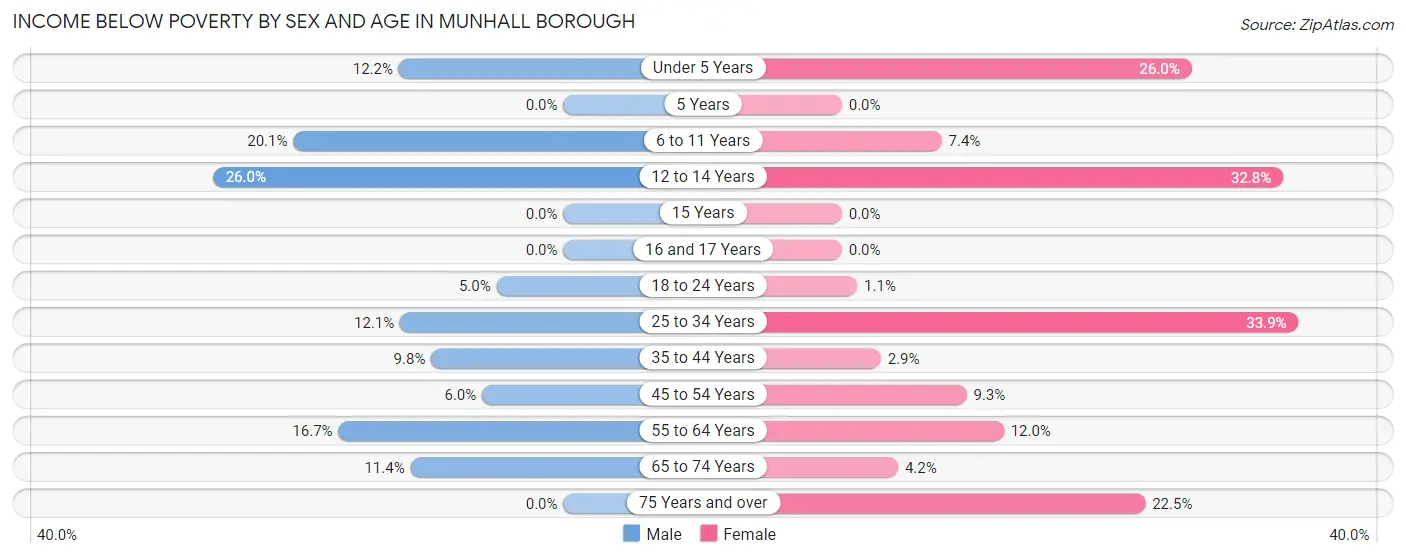
| Age Bracket | Male | Female |
| Under 5 Years | 61 (12.2%) | 67 (26.0%) |
| 5 Years | 0 (0.0%) | 0 (0.0%) |
| 6 to 11 Years | 75 (20.1%) | 14 (7.4%) |
| 12 to 14 Years | 38 (26.0%) | 76 (32.8%) |
| 15 Years | 0 (0.0%) | 0 (0.0%) |
| 16 and 17 Years | 0 (0.0%) | 0 (0.0%) |
| 18 to 24 Years | 17 (5.0%) | 7 (1.1%) |
| 25 to 34 Years | 80 (12.1%) | 261 (33.9%) |
| 35 to 44 Years | 52 (9.8%) | 16 (2.9%) |
| 45 to 54 Years | 38 (6.0%) | 61 (9.3%) |
| 55 to 64 Years | 149 (16.7%) | 106 (12.0%) |
| 65 to 74 Years | 63 (11.4%) | 23 (4.2%) |
| 75 Years and over | 0 (0.0%) | 214 (22.5%) |
| Total | 573 (11.5%) | 845 (14.8%) |
Income Above Poverty by Sex and Age in Munhall borough
According to the poverty statistics in Munhall borough, males aged 15 years and females aged 15 years are the age groups that are most secure financially, with 100.0% of males and 100.0% of females in these age groups living above the poverty line.
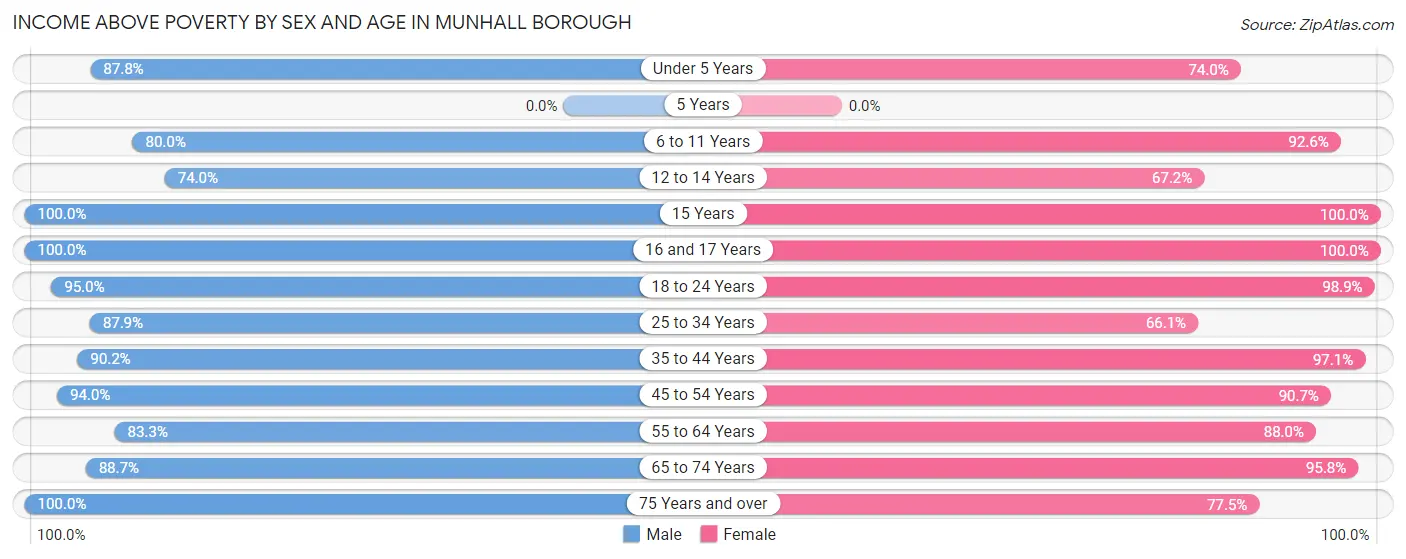
| Age Bracket | Male | Female |
| Under 5 Years | 438 (87.8%) | 191 (74.0%) |
| 5 Years | 0 (0.0%) | 0 (0.0%) |
| 6 to 11 Years | 299 (79.9%) | 175 (92.6%) |
| 12 to 14 Years | 108 (74.0%) | 156 (67.2%) |
| 15 Years | 61 (100.0%) | 30 (100.0%) |
| 16 and 17 Years | 80 (100.0%) | 29 (100.0%) |
| 18 to 24 Years | 326 (95.0%) | 605 (98.9%) |
| 25 to 34 Years | 580 (87.9%) | 509 (66.1%) |
| 35 to 44 Years | 478 (90.2%) | 538 (97.1%) |
| 45 to 54 Years | 592 (94.0%) | 598 (90.7%) |
| 55 to 64 Years | 743 (83.3%) | 776 (88.0%) |
| 65 to 74 Years | 492 (88.6%) | 529 (95.8%) |
| 75 Years and over | 208 (100.0%) | 736 (77.5%) |
| Total | 4,405 (88.5%) | 4,872 (85.2%) |
Income Below Poverty Among Married-Couple Families in Munhall borough
The poverty statistics for married-couple families in Munhall borough show that 6.0% or 98 of the total 1,641 families live below the poverty line. Families with 3 or 4 children have the highest poverty rate of 20.3%, comprising of 35 families. On the other hand, families with no children have the lowest poverty rate of 3.7%, which includes 43 families.
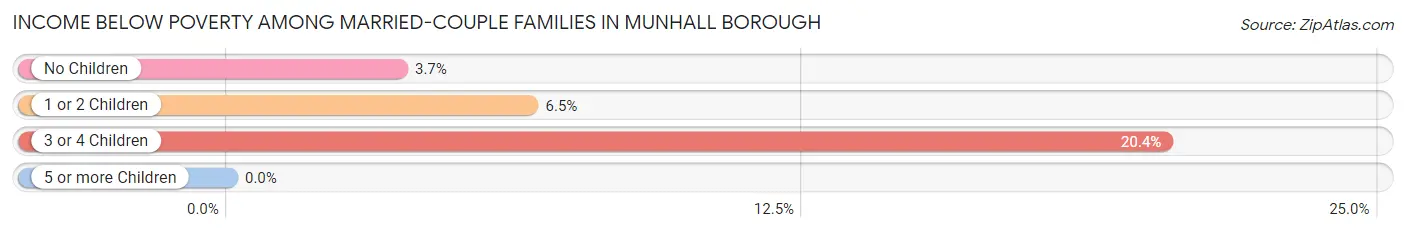
| Children | Above Poverty | Below Poverty |
| No Children | 1,120 (96.3%) | 43 (3.7%) |
| 1 or 2 Children | 286 (93.5%) | 20 (6.5%) |
| 3 or 4 Children | 137 (79.6%) | 35 (20.3%) |
| 5 or more Children | 0 (0.0%) | 0 (0.0%) |
| Total | 1,543 (94.0%) | 98 (6.0%) |
Income Below Poverty Among Single-Parent Households in Munhall borough
According to the poverty data in Munhall borough, 5.9% or 13 single-father households and 13.6% or 82 single-mother households are living below the poverty line. Among single-father households, those with no children have the highest poverty rate, with 13 households (7.9%) experiencing poverty. Likewise, among single-mother households, those with 3 or 4 children have the highest poverty rate, with 26 households (51.0%) falling below the poverty line.
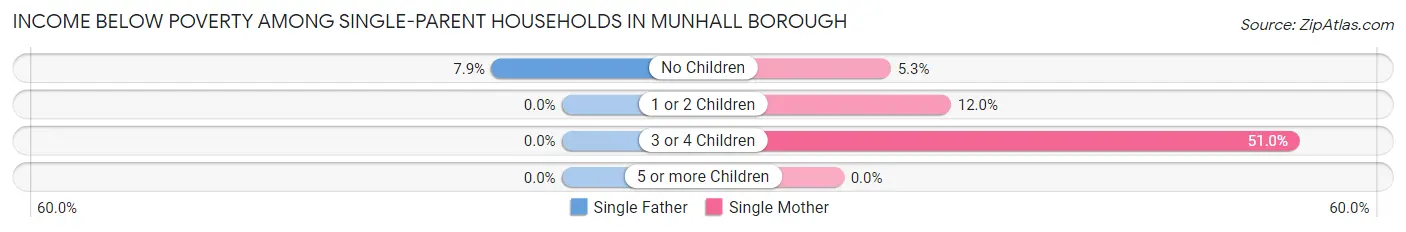
| Children | Single Father | Single Mother |
| No Children | 13 (7.9%) | 8 (5.3%) |
| 1 or 2 Children | 0 (0.0%) | 48 (12.0%) |
| 3 or 4 Children | 0 (0.0%) | 26 (51.0%) |
| 5 or more Children | 0 (0.0%) | 0 (0.0%) |
| Total | 13 (5.9%) | 82 (13.6%) |
Income Below Poverty Among Married-Couple vs Single-Parent Households in Munhall borough
The poverty data for Munhall borough shows that 98 of the married-couple family households (6.0%) and 95 of the single-parent households (11.5%) are living below the poverty level. Within the married-couple family households, those with 3 or 4 children have the highest poverty rate, with 35 households (20.3%) falling below the poverty line. Among the single-parent households, those with 3 or 4 children have the highest poverty rate, with 26 household (51.0%) living below poverty.
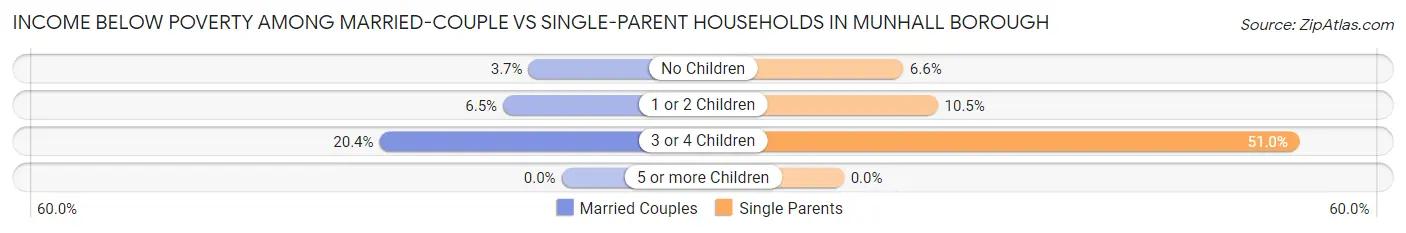
| Children | Married-Couple Families | Single-Parent Households |
| No Children | 43 (3.7%) | 21 (6.6%) |
| 1 or 2 Children | 20 (6.5%) | 48 (10.5%) |
| 3 or 4 Children | 35 (20.3%) | 26 (51.0%) |
| 5 or more Children | 0 (0.0%) | 0 (0.0%) |
| Total | 98 (6.0%) | 95 (11.5%) |
Race in Munhall borough
The most populous races in Munhall borough are White / Caucasian (8,832 | 82.3%), Black / African American (1,603 | 14.9%), and Two or more Races (247 | 2.3%).
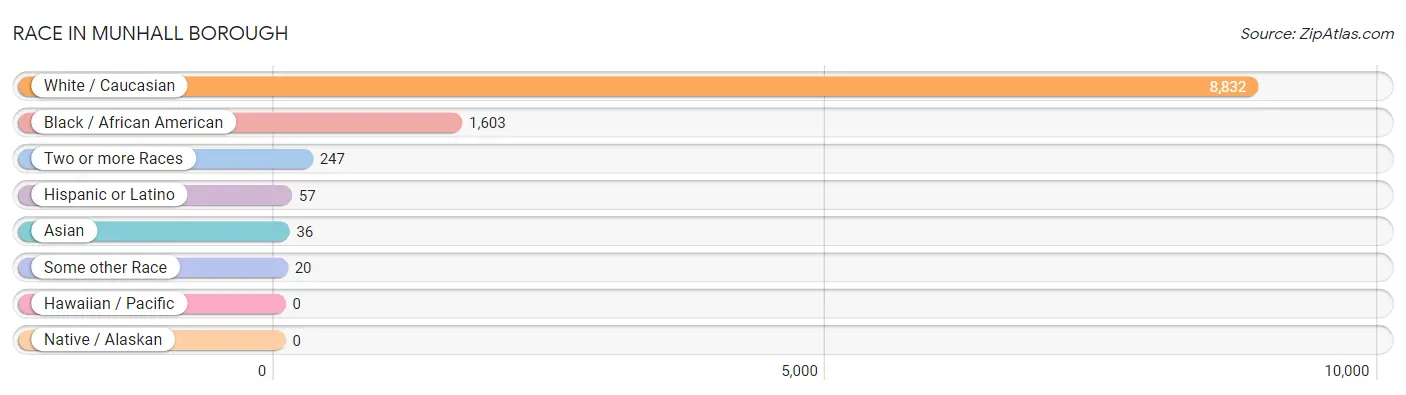
| Race | # Population | % Population |
| Asian | 36 | 0.3% |
| Black / African American | 1,603 | 14.9% |
| Hawaiian / Pacific | 0 | 0.0% |
| Hispanic or Latino | 57 | 0.5% |
| Native / Alaskan | 0 | 0.0% |
| White / Caucasian | 8,832 | 82.3% |
| Two or more Races | 247 | 2.3% |
| Some other Race | 20 | 0.2% |
| Total | 10,738 | 100.0% |
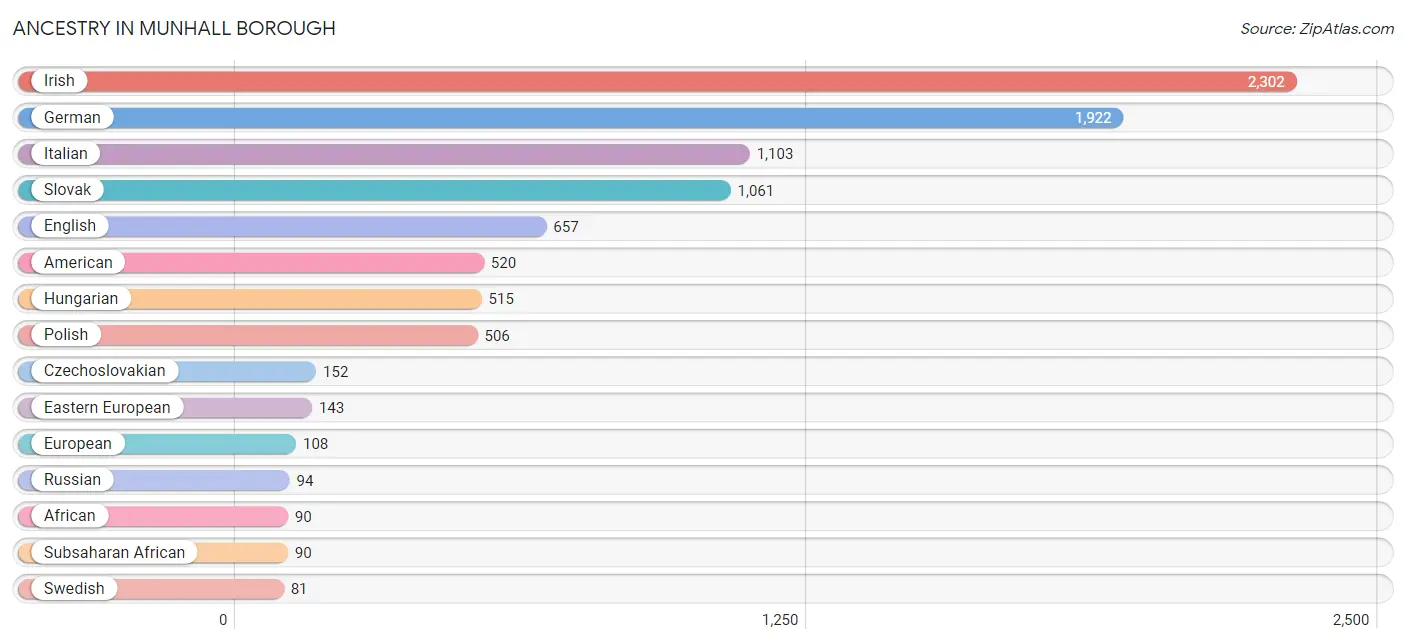
Ancestry in Munhall borough
The most populous ancestries reported in Munhall borough are Irish (2,302 | 21.4%), German (1,922 | 17.9%), Italian (1,103 | 10.3%), Slovak (1,061 | 9.9%), and English (657 | 6.1%), together accounting for 65.6% of all Munhall borough residents.
| Ancestry | # Population | % Population |
| African | 90 | 0.8% |
| American | 520 | 4.8% |
| Arab | 66 | 0.6% |
| Austrian | 52 | 0.5% |
| Bhutanese | 7 | 0.1% |
| Blackfeet | 10 | 0.1% |
| Brazilian | 6 | 0.1% |
| Central American | 14 | 0.1% |
| Cherokee | 80 | 0.7% |
| Croatian | 74 | 0.7% |
| Czech | 58 | 0.5% |
| Czechoslovakian | 152 | 1.4% |
| Danish | 18 | 0.2% |
| Dominican | 5 | 0.1% |
| Dutch | 15 | 0.1% |
| Eastern European | 143 | 1.3% |
| Egyptian | 36 | 0.3% |
| English | 657 | 6.1% |
| European | 108 | 1.0% |
| French | 48 | 0.4% |
| German | 1,922 | 17.9% |
| Greek | 66 | 0.6% |
| Haitian | 5 | 0.1% |
| Honduran | 14 | 0.1% |
| Hungarian | 515 | 4.8% |
| Indian (Asian) | 7 | 0.1% |
| Iranian | 6 | 0.1% |
| Irish | 2,302 | 21.4% |
| Italian | 1,103 | 10.3% |
| Jamaican | 24 | 0.2% |
| Korean | 40 | 0.4% |
| Lebanese | 30 | 0.3% |
| Lithuanian | 76 | 0.7% |
| Mexican | 19 | 0.2% |
| Polish | 506 | 4.7% |
| Puerto Rican | 19 | 0.2% |
| Russian | 94 | 0.9% |
| Samoan | 4 | 0.0% |
| Scotch-Irish | 73 | 0.7% |
| Scottish | 68 | 0.6% |
| Serbian | 25 | 0.2% |
| Sioux | 9 | 0.1% |
| Slavic | 44 | 0.4% |
| Slovak | 1,061 | 9.9% |
| Slovene | 13 | 0.1% |
| Subsaharan African | 90 | 0.8% |
| Swedish | 81 | 0.7% |
| Ukrainian | 34 | 0.3% |
| Welsh | 75 | 0.7% | View All 49 Rows |
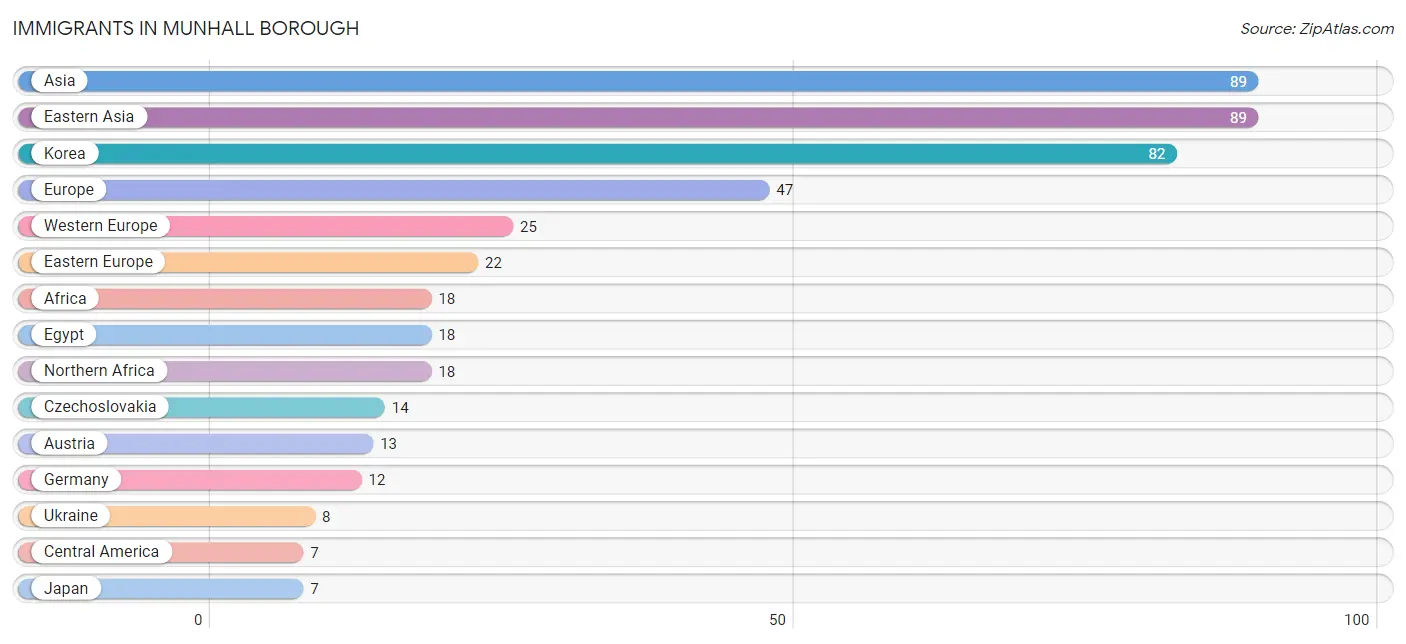
Immigrants in Munhall borough
The most numerous immigrant groups reported in Munhall borough came from Asia (89 | 0.8%), Eastern Asia (89 | 0.8%), Korea (82 | 0.8%), Europe (47 | 0.4%), and Western Europe (25 | 0.2%), together accounting for 3.1% of all Munhall borough residents.
| Immigration Origin | # Population | % Population |
| Africa | 18 | 0.2% |
| Asia | 89 | 0.8% |
| Austria | 13 | 0.1% |
| Central America | 7 | 0.1% |
| Czechoslovakia | 14 | 0.1% |
| Eastern Asia | 89 | 0.8% |
| Eastern Europe | 22 | 0.2% |
| Egypt | 18 | 0.2% |
| Europe | 47 | 0.4% |
| Germany | 12 | 0.1% |
| Japan | 7 | 0.1% |
| Korea | 82 | 0.8% |
| Latin America | 7 | 0.1% |
| Mexico | 7 | 0.1% |
| Northern Africa | 18 | 0.2% |
| Ukraine | 8 | 0.1% |
| Western Europe | 25 | 0.2% | View All 17 Rows |
Sex and Age in Munhall borough
Sex and Age in Munhall borough
The most populous age groups in Munhall borough are 55 to 59 Years (529 | 10.6%) for men and 55 to 59 Years (562 | 9.8%) for women.
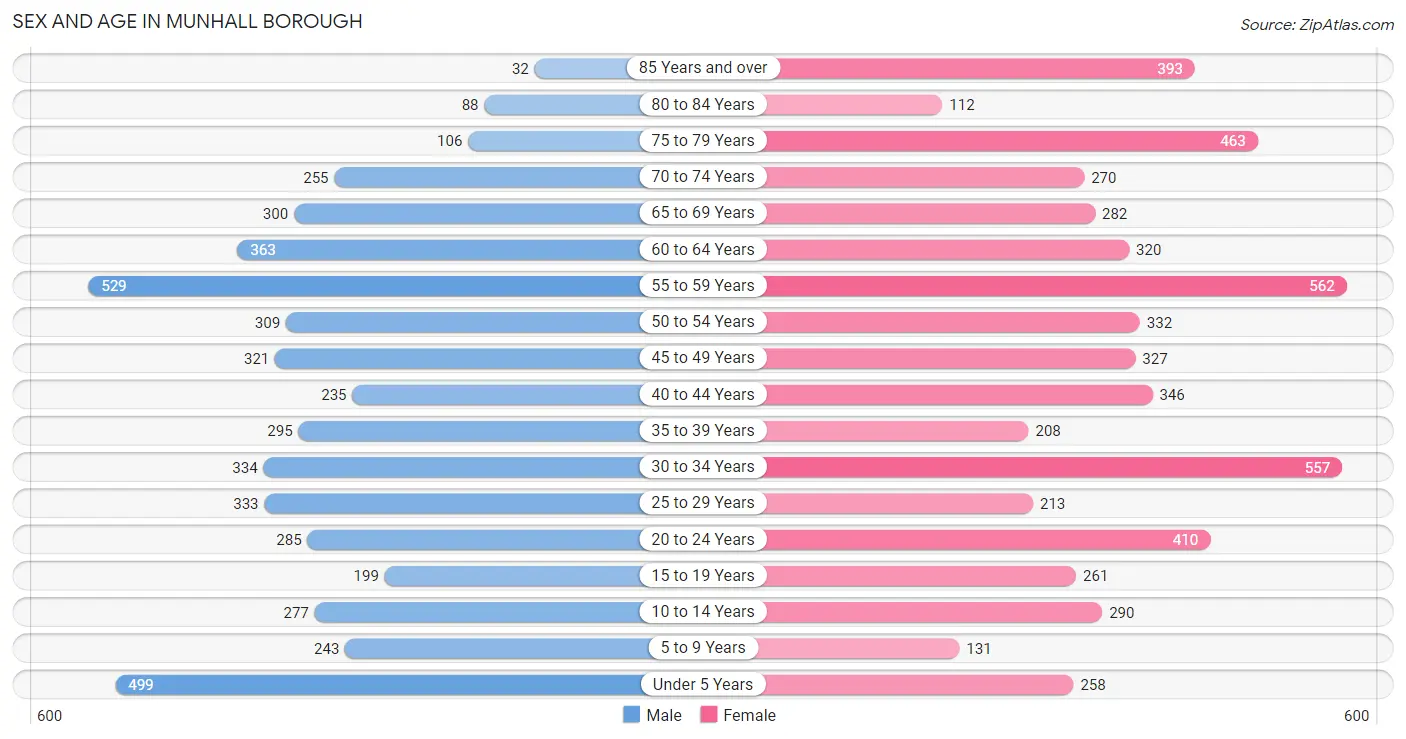
| Age Bracket | Male | Female |
| Under 5 Years | 499 (10.0%) | 258 (4.5%) |
| 5 to 9 Years | 243 (4.9%) | 131 (2.3%) |
| 10 to 14 Years | 277 (5.5%) | 290 (5.1%) |
| 15 to 19 Years | 199 (4.0%) | 261 (4.5%) |
| 20 to 24 Years | 285 (5.7%) | 410 (7.1%) |
| 25 to 29 Years | 333 (6.7%) | 213 (3.7%) |
| 30 to 34 Years | 334 (6.7%) | 557 (9.7%) |
| 35 to 39 Years | 295 (5.9%) | 208 (3.6%) |
| 40 to 44 Years | 235 (4.7%) | 346 (6.0%) |
| 45 to 49 Years | 321 (6.4%) | 327 (5.7%) |
| 50 to 54 Years | 309 (6.2%) | 332 (5.8%) |
| 55 to 59 Years | 529 (10.6%) | 562 (9.8%) |
| 60 to 64 Years | 363 (7.3%) | 320 (5.6%) |
| 65 to 69 Years | 300 (6.0%) | 282 (4.9%) |
| 70 to 74 Years | 255 (5.1%) | 270 (4.7%) |
| 75 to 79 Years | 106 (2.1%) | 463 (8.1%) |
| 80 to 84 Years | 88 (1.8%) | 112 (1.9%) |
| 85 Years and over | 32 (0.6%) | 393 (6.9%) |
| Total | 5,003 (100.0%) | 5,735 (100.0%) |
Families and Households in Munhall borough
Median Family Size in Munhall borough
The median family size in Munhall borough is 3.00 persons per family, with single female/mother families (604 | 24.5%) accounting for the largest median family size of 3.09 persons per family. On the other hand, single male/father families (221 | 9.0%) represent the smallest median family size with 2.90 persons per family.
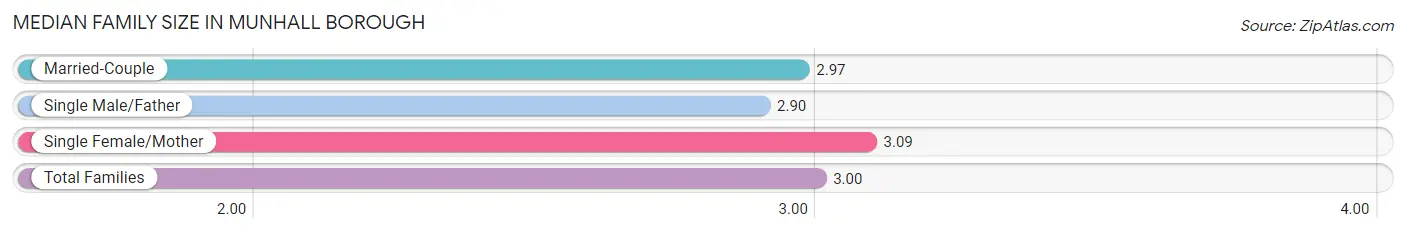
| Family Type | # Families | Family Size |
| Married-Couple | 1,641 (66.5%) | 2.97 |
| Single Male/Father | 221 (9.0%) | 2.90 |
| Single Female/Mother | 604 (24.5%) | 3.09 |
| Total Families | 2,466 (100.0%) | 3.00 |
Median Household Size in Munhall borough
The median household size in Munhall borough is 2.07 persons per household, with single female/mother households (604 | 11.7%) accounting for the largest median household size of 3.33 persons per household. non-family households (2,682 | 52.1%) represent the smallest median household size with 1.15 persons per household.
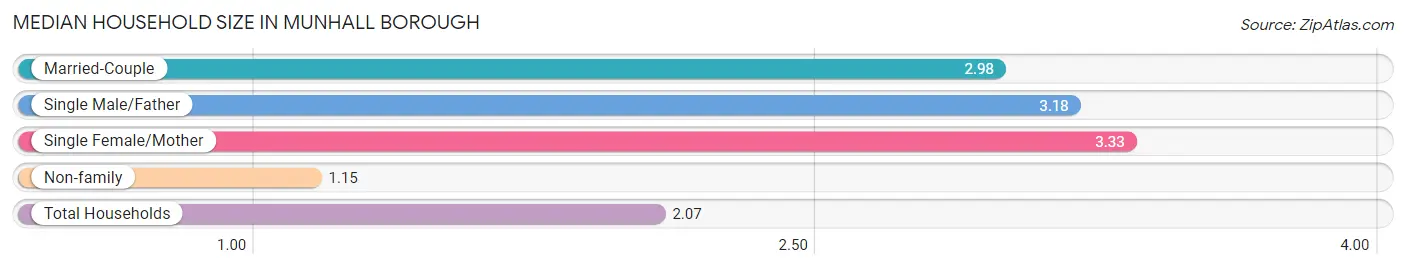
| Household Type | # Households | Household Size |
| Married-Couple | 1,641 (31.9%) | 2.98 |
| Single Male/Father | 221 (4.3%) | 3.18 |
| Single Female/Mother | 604 (11.7%) | 3.33 |
| Non-family | 2,682 (52.1%) | 1.15 |
| Total Households | 5,148 (100.0%) | 2.07 |
Household Size by Marriage Status in Munhall borough
Out of a total of 5,148 households in Munhall borough, 2,466 (47.9%) are family households, while 2,682 (52.1%) are nonfamily households. The most numerous type of family households are 2-person households, comprising 1,243, and the most common type of nonfamily households are 1-person households, comprising 2,350.
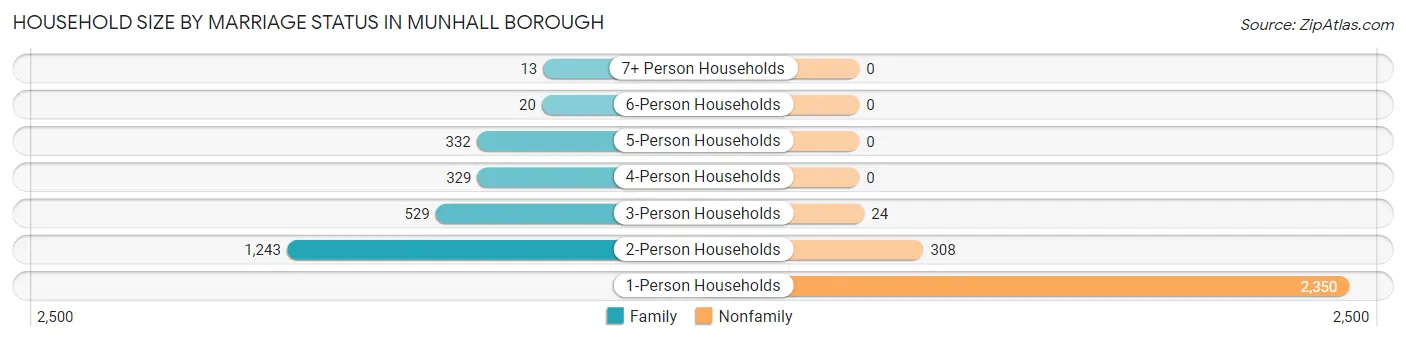
| Household Size | Family Households | Nonfamily Households |
| 1-Person Households | - | 2,350 (45.7%) |
| 2-Person Households | 1,243 (24.1%) | 308 (6.0%) |
| 3-Person Households | 529 (10.3%) | 24 (0.5%) |
| 4-Person Households | 329 (6.4%) | 0 (0.0%) |
| 5-Person Households | 332 (6.5%) | 0 (0.0%) |
| 6-Person Households | 20 (0.4%) | 0 (0.0%) |
| 7+ Person Households | 13 (0.3%) | 0 (0.0%) |
| Total | 2,466 (47.9%) | 2,682 (52.1%) |
Female Fertility in Munhall borough
Fertility by Age in Munhall borough
Average fertility rate in Munhall borough is 120.0 births per 1,000 women. Women in the age bracket of 20 to 34 years have the highest fertility rate with 203.0 births per 1,000 women. Women in the age bracket of 20 to 34 years acount for 83.3% of all women with births.
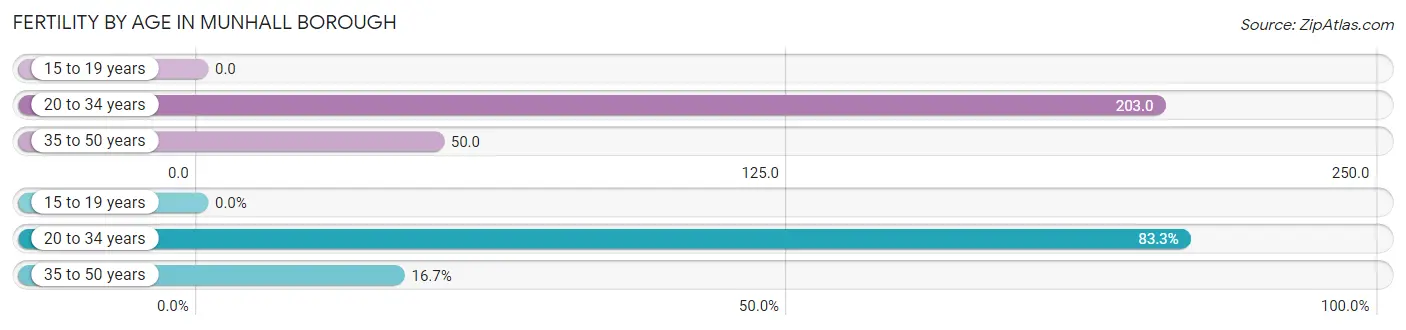
| Age Bracket | Women with Births | Births / 1,000 Women |
| 15 to 19 years | 0 (0.0%) | 0.0 |
| 20 to 34 years | 240 (83.3%) | 203.0 |
| 35 to 50 years | 48 (16.7%) | 50.0 |
| Total | 288 (100.0%) | 120.0 |
Fertility by Age by Marriage Status in Munhall borough
58.0% of women with births (288) in Munhall borough are married. The highest percentage of unmarried women with births falls into 20 to 34 years age bracket with 50.4% of them unmarried at the time of birth, while the lowest percentage of unmarried women with births belong to 35 to 50 years age bracket with 0.0% of them unmarried.
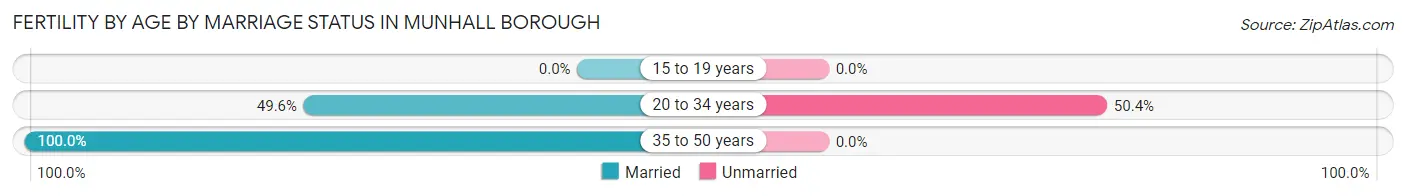
| Age Bracket | Married | Unmarried |
| 15 to 19 years | 0 (0.0%) | 0 (0.0%) |
| 20 to 34 years | 119 (49.6%) | 121 (50.4%) |
| 35 to 50 years | 48 (100.0%) | 0 (0.0%) |
| Total | 167 (58.0%) | 121 (42.0%) |
Fertility by Education in Munhall borough
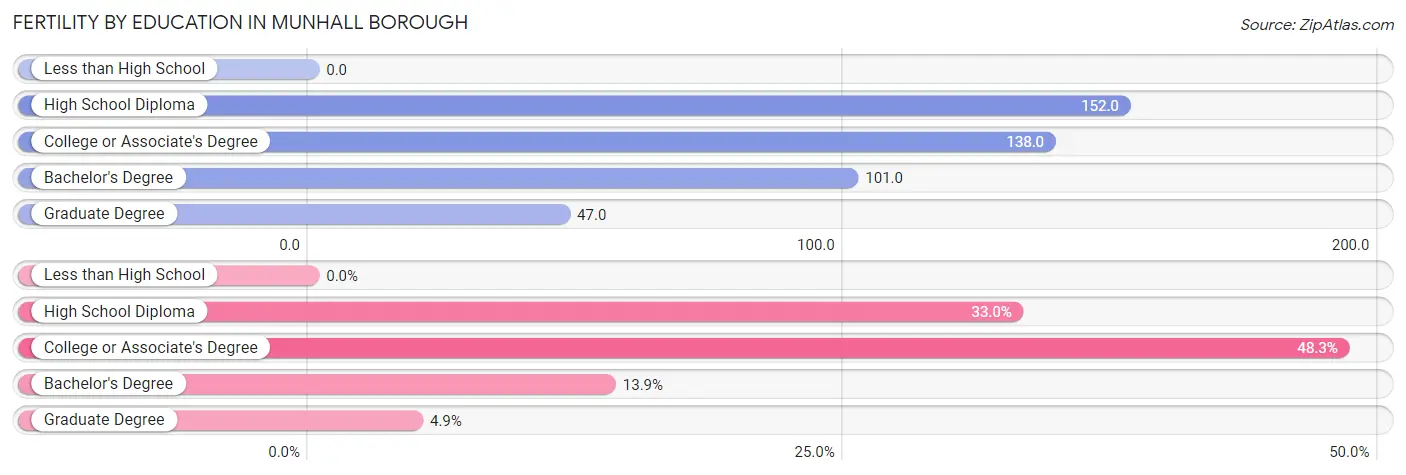
| Educational Attainment | Women with Births | Births / 1,000 Women |
| Less than High School | 0 (0.0%) | 0.0 |
| High School Diploma | 95 (33.0%) | 152.0 |
| College or Associate's Degree | 139 (48.3%) | 138.0 |
| Bachelor's Degree | 40 (13.9%) | 101.0 |
| Graduate Degree | 14 (4.9%) | 47.0 |
| Total | 288 (100.0%) | 120.0 |
Fertility by Education by Marriage Status in Munhall borough
42.0% of women with births in Munhall borough are unmarried. Women with the educational attainment of bachelor's degree are most likely to be married with 100.0% of them married at childbirth, while women with the educational attainment of high school diploma are least likely to be married with 100.0% of them unmarried at childbirth.
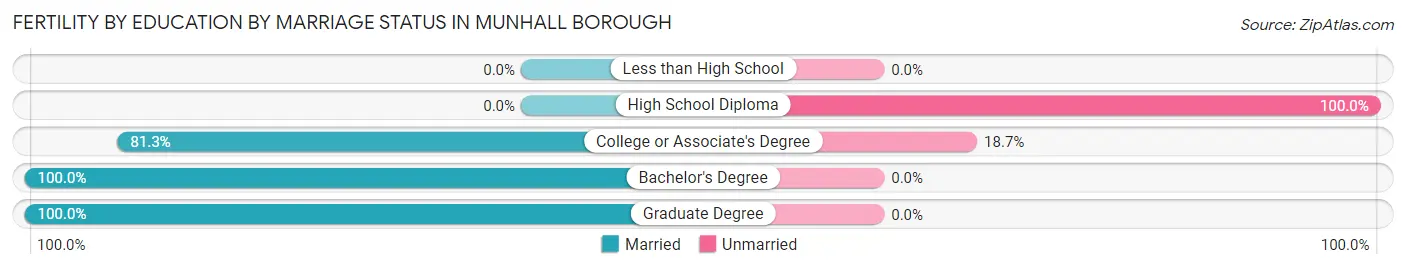
| Educational Attainment | Married | Unmarried |
| Less than High School | 0 (0.0%) | 0 (0.0%) |
| High School Diploma | 0 (0.0%) | 95 (100.0%) |
| College or Associate's Degree | 113 (81.3%) | 26 (18.7%) |
| Bachelor's Degree | 40 (100.0%) | 0 (0.0%) |
| Graduate Degree | 14 (100.0%) | 0 (0.0%) |
| Total | 167 (58.0%) | 121 (42.0%) |
Employment Characteristics in Munhall borough
Employment by Class of Employer in Munhall borough
Among the 5,234 employed individuals in Munhall borough, private company employees (3,759 | 71.8%), not-for-profit organizations (733 | 14.0%), and self-employed (not incorporated) (315 | 6.0%) make up the most common classes of employment.
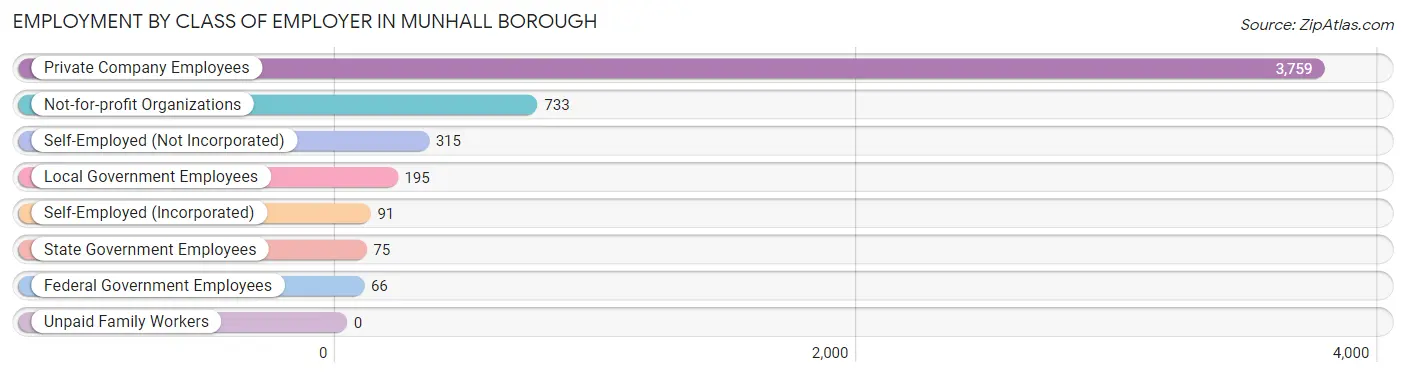
| Employer Class | # Employees | % Employees |
| Private Company Employees | 3,759 | 71.8% |
| Self-Employed (Incorporated) | 91 | 1.7% |
| Self-Employed (Not Incorporated) | 315 | 6.0% |
| Not-for-profit Organizations | 733 | 14.0% |
| Local Government Employees | 195 | 3.7% |
| State Government Employees | 75 | 1.4% |
| Federal Government Employees | 66 | 1.3% |
| Unpaid Family Workers | 0 | 0.0% |
| Total | 5,234 | 100.0% |
Employment Status by Age in Munhall borough
According to the labor force statistics for Munhall borough, out of the total population over 16 years of age (8,949), 63.2% or 5,656 individuals are in the labor force, with 6.6% or 373 of them unemployed. The age group with the highest labor force participation rate is 35 to 44 years, with 89.2% or 967 individuals in the labor force. Within the labor force, the 75 years and over age range has the highest percentage of unemployed individuals, with 48.1% or 25 of them being unemployed.
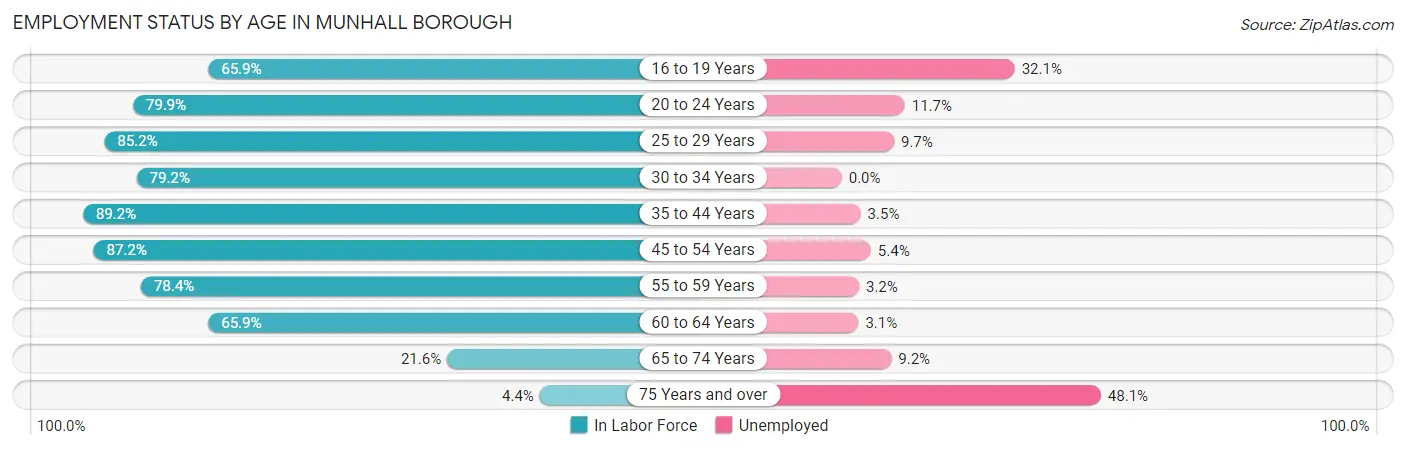
| Age Bracket | In Labor Force | Unemployed |
| 16 to 19 Years | 243 (65.9%) | 78 (32.1%) |
| 20 to 24 Years | 555 (79.9%) | 65 (11.7%) |
| 25 to 29 Years | 465 (85.2%) | 45 (9.7%) |
| 30 to 34 Years | 706 (79.2%) | 0 (0.0%) |
| 35 to 44 Years | 967 (89.2%) | 34 (3.5%) |
| 45 to 54 Years | 1,124 (87.2%) | 61 (5.4%) |
| 55 to 59 Years | 855 (78.4%) | 27 (3.2%) |
| 60 to 64 Years | 450 (65.9%) | 14 (3.1%) |
| 65 to 74 Years | 239 (21.6%) | 22 (9.2%) |
| 75 Years and over | 53 (4.4%) | 25 (48.1%) |
| Total | 5,656 (63.2%) | 373 (6.6%) |
Employment Status by Educational Attainment in Munhall borough
According to labor force statistics for Munhall borough, 81.8% of individuals (4,568) out of the total population between 25 and 64 years of age (5,584) are in the labor force, with 4.0% or 183 of them being unemployed. The group with the highest labor force participation rate are those with the educational attainment of bachelor's degree or higher, with 92.4% or 1,408 individuals in the labor force. Within the labor force, individuals with high school diploma education have the highest percentage of unemployment, with 5.7% or 78 of them being unemployed.
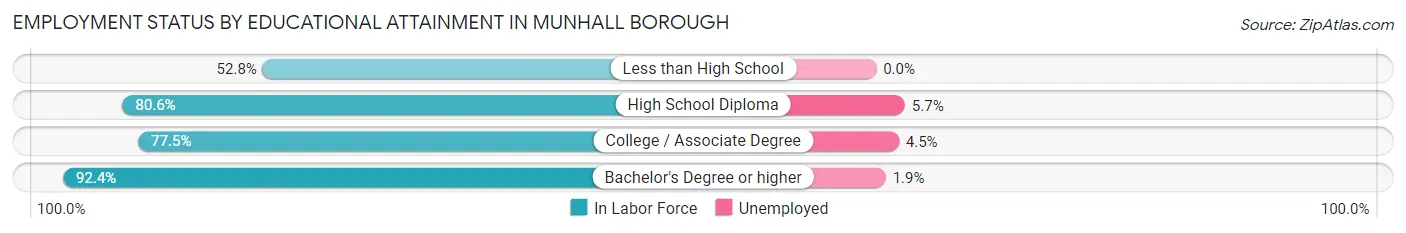
| Educational Attainment | In Labor Force | Unemployed |
| Less than High School | 86 (52.8%) | 0 (0.0%) |
| High School Diploma | 1,369 (80.6%) | 97 (5.7%) |
| College / Associate Degree | 1,704 (77.5%) | 99 (4.5%) |
| Bachelor's Degree or higher | 1,408 (92.4%) | 29 (1.9%) |
| Total | 4,568 (81.8%) | 223 (4.0%) |
Employment Occupations by Sex in Munhall borough
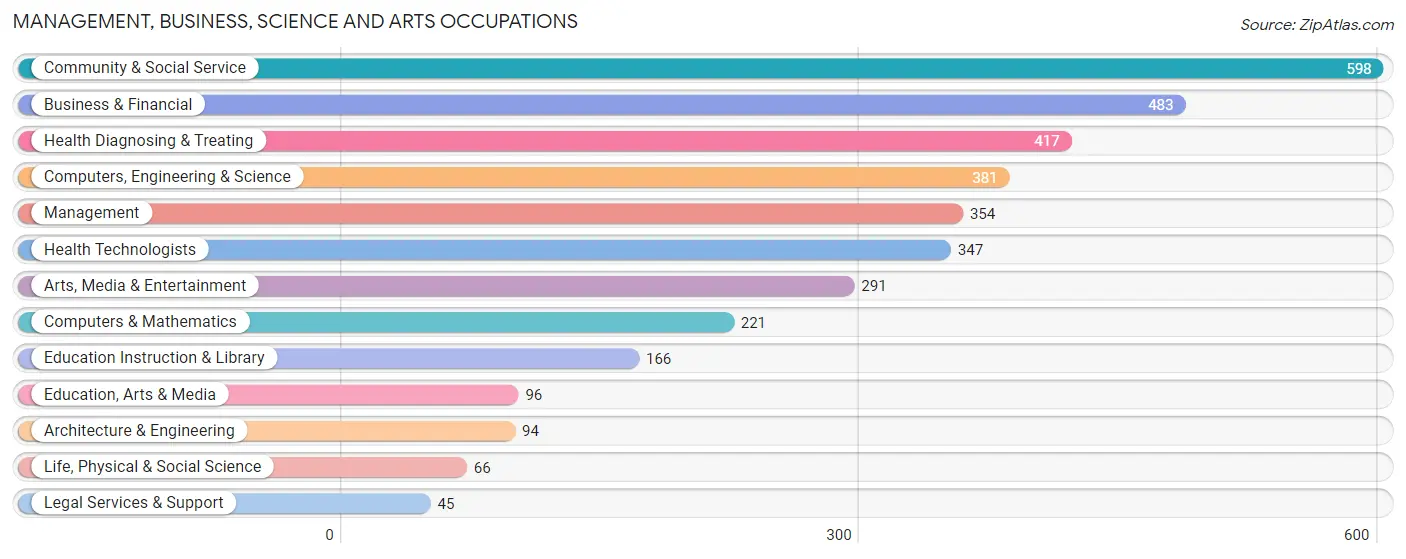
Management, Business, Science and Arts Occupations
The most common Management, Business, Science and Arts occupations in Munhall borough are Community & Social Service (598 | 11.4%), Business & Financial (483 | 9.2%), Health Diagnosing & Treating (417 | 7.9%), Computers, Engineering & Science (381 | 7.2%), and Management (354 | 6.7%).
Management, Business, Science and Arts Occupations by Sex
Within the Management, Business, Science and Arts occupations in Munhall borough, the most male-oriented occupations are Architecture & Engineering (89.4%), Arts, Media & Entertainment (71.5%), and Computers, Engineering & Science (68.2%), while the most female-oriented occupations are Health Diagnosing & Treating (87.5%), Health Technologists (85.0%), and Legal Services & Support (84.4%).
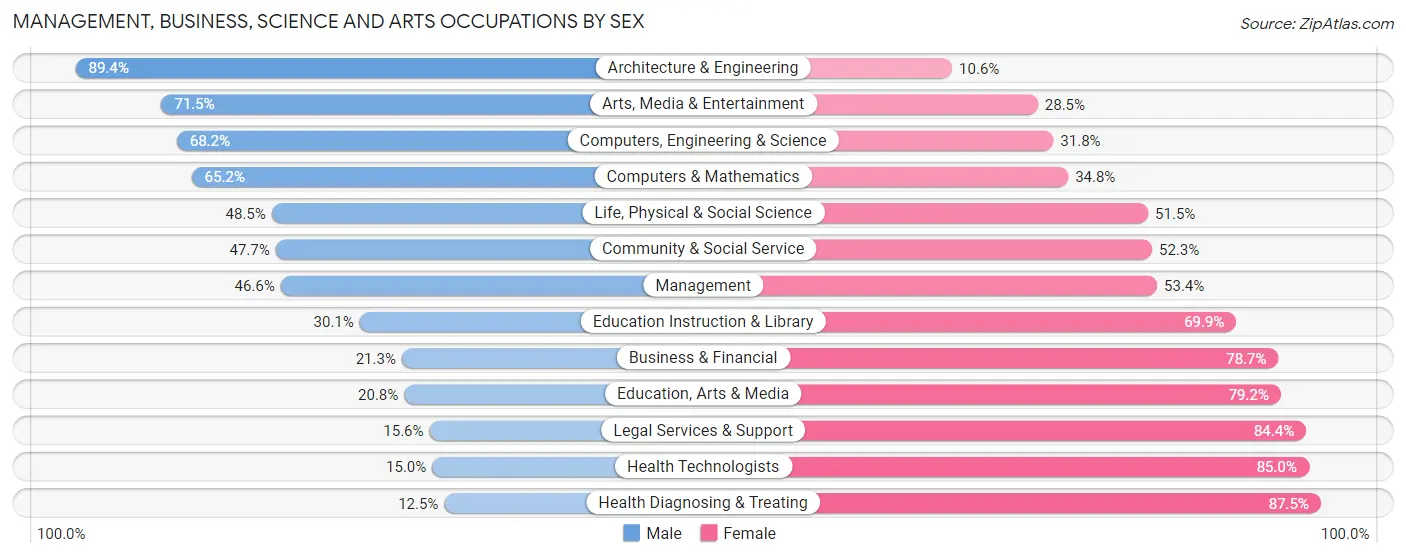
| Occupation | Male | Female |
| Management | 165 (46.6%) | 189 (53.4%) |
| Business & Financial | 103 (21.3%) | 380 (78.7%) |
| Computers, Engineering & Science | 260 (68.2%) | 121 (31.8%) |
| Computers & Mathematics | 144 (65.2%) | 77 (34.8%) |
| Architecture & Engineering | 84 (89.4%) | 10 (10.6%) |
| Life, Physical & Social Science | 32 (48.5%) | 34 (51.5%) |
| Community & Social Service | 285 (47.7%) | 313 (52.3%) |
| Education, Arts & Media | 20 (20.8%) | 76 (79.2%) |
| Legal Services & Support | 7 (15.6%) | 38 (84.4%) |
| Education Instruction & Library | 50 (30.1%) | 116 (69.9%) |
| Arts, Media & Entertainment | 208 (71.5%) | 83 (28.5%) |
| Health Diagnosing & Treating | 52 (12.5%) | 365 (87.5%) |
| Health Technologists | 52 (15.0%) | 295 (85.0%) |
| Total (Category) | 865 (38.7%) | 1,368 (61.3%) |
| Total (Overall) | 2,475 (47.0%) | 2,796 (53.0%) |
Services Occupations
The most common Services occupations in Munhall borough are Healthcare Support (299 | 5.7%), Food Preparation & Serving (256 | 4.9%), Cleaning & Maintenance (166 | 3.2%), Personal Care & Service (117 | 2.2%), and Security & Protection (107 | 2.0%).

Services Occupations by Sex
Within the Services occupations in Munhall borough, the most male-oriented occupations are Security & Protection (81.3%), Firefighting & Prevention (81.3%), and Cleaning & Maintenance (70.5%), while the most female-oriented occupations are Healthcare Support (84.3%), Food Preparation & Serving (46.9%), and Personal Care & Service (46.2%).
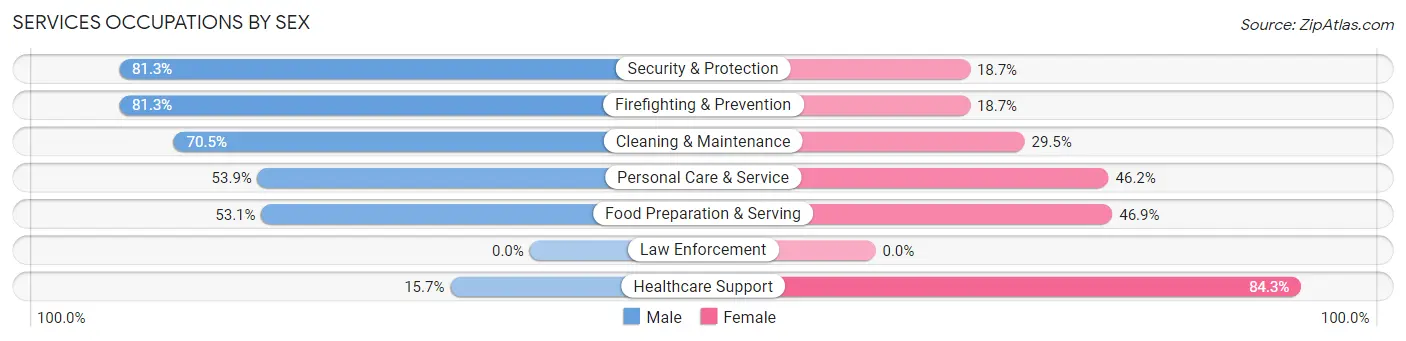
| Occupation | Male | Female |
| Healthcare Support | 47 (15.7%) | 252 (84.3%) |
| Security & Protection | 87 (81.3%) | 20 (18.7%) |
| Firefighting & Prevention | 87 (81.3%) | 20 (18.7%) |
| Law Enforcement | 0 (0.0%) | 0 (0.0%) |
| Food Preparation & Serving | 136 (53.1%) | 120 (46.9%) |
| Cleaning & Maintenance | 117 (70.5%) | 49 (29.5%) |
| Personal Care & Service | 63 (53.8%) | 54 (46.2%) |
| Total (Category) | 450 (47.6%) | 495 (52.4%) |
| Total (Overall) | 2,475 (47.0%) | 2,796 (53.0%) |
Sales and Office Occupations
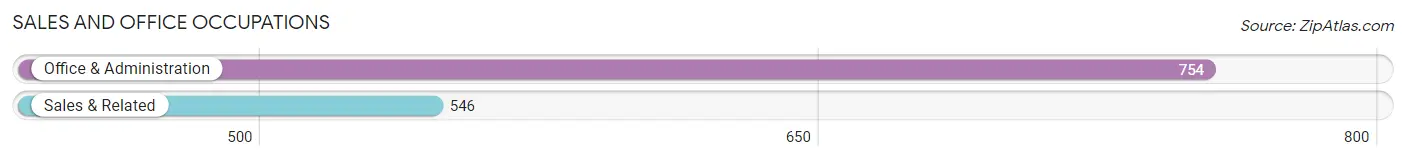
The most common Sales and Office occupations in Munhall borough are Office & Administration (754 | 14.3%), and Sales & Related (546 | 10.4%).
Sales and Office Occupations by Sex
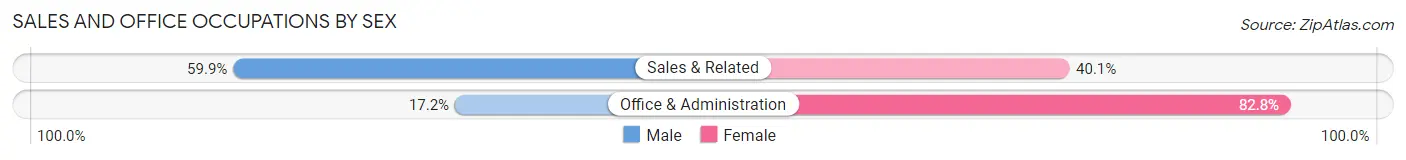
| Occupation | Male | Female |
| Sales & Related | 327 (59.9%) | 219 (40.1%) |
| Office & Administration | 130 (17.2%) | 624 (82.8%) |
| Total (Category) | 457 (35.1%) | 843 (64.8%) |
| Total (Overall) | 2,475 (47.0%) | 2,796 (53.0%) |
Natural Resources, Construction and Maintenance Occupations
The most common Natural Resources, Construction and Maintenance occupations in Munhall borough are Construction & Extraction (210 | 4.0%), and Installation, Maintenance & Repair (136 | 2.6%).

Natural Resources, Construction and Maintenance Occupations by Sex
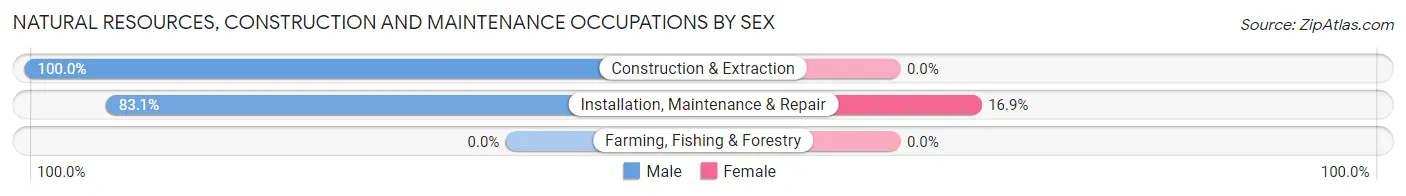
| Occupation | Male | Female |
| Farming, Fishing & Forestry | 0 (0.0%) | 0 (0.0%) |
| Construction & Extraction | 210 (100.0%) | 0 (0.0%) |
| Installation, Maintenance & Repair | 113 (83.1%) | 23 (16.9%) |
| Total (Category) | 323 (93.3%) | 23 (6.7%) |
| Total (Overall) | 2,475 (47.0%) | 2,796 (53.0%) |
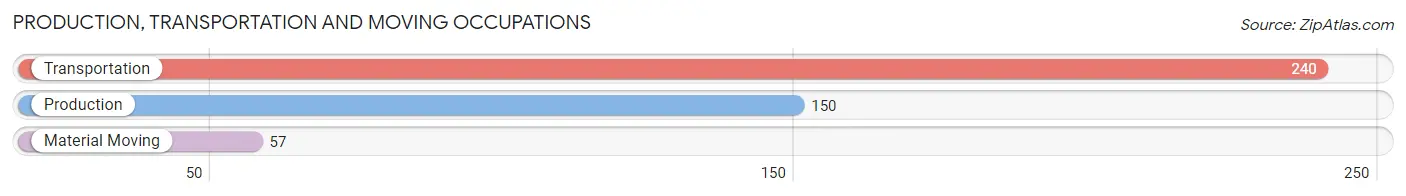
Production, Transportation and Moving Occupations
The most common Production, Transportation and Moving occupations in Munhall borough are Transportation (240 | 4.5%), Production (150 | 2.9%), and Material Moving (57 | 1.1%).
Production, Transportation and Moving Occupations by Sex
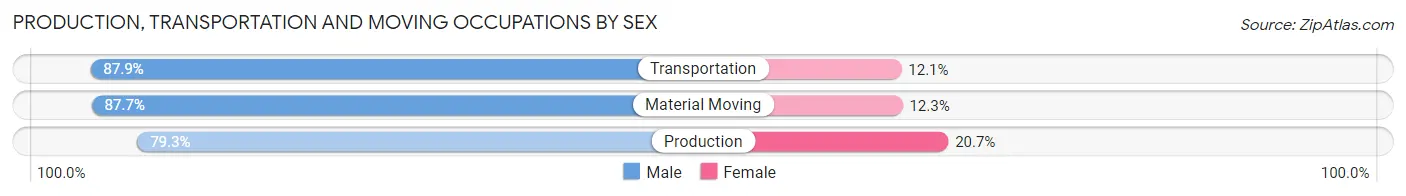
| Occupation | Male | Female |
| Production | 119 (79.3%) | 31 (20.7%) |
| Transportation | 211 (87.9%) | 29 (12.1%) |
| Material Moving | 50 (87.7%) | 7 (12.3%) |
| Total (Category) | 380 (85.0%) | 67 (15.0%) |
| Total (Overall) | 2,475 (47.0%) | 2,796 (53.0%) |
Employment Industries by Sex in Munhall borough
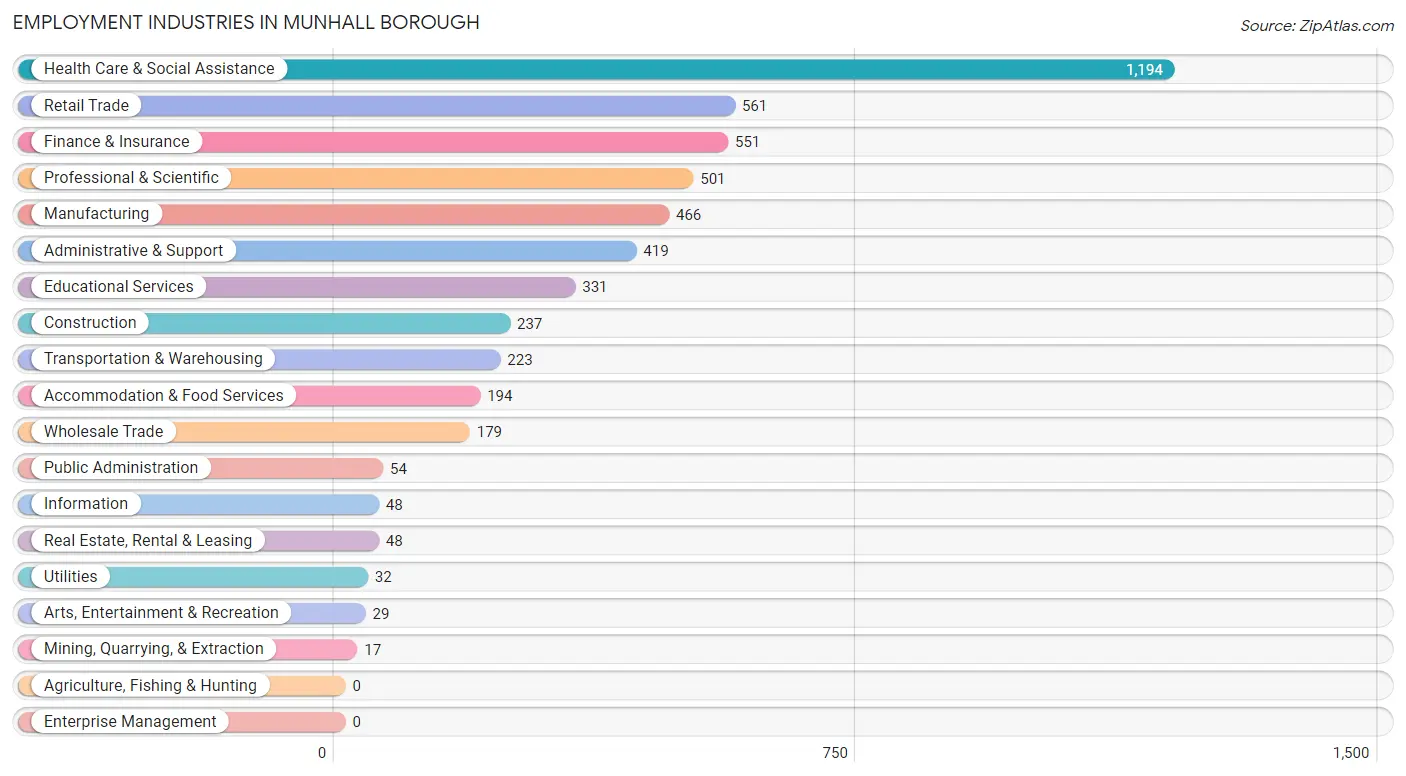
Employment Industries in Munhall borough
The major employment industries in Munhall borough include Health Care & Social Assistance (1,194 | 22.7%), Retail Trade (561 | 10.6%), Finance & Insurance (551 | 10.4%), Professional & Scientific (501 | 9.5%), and Manufacturing (466 | 8.8%).
Employment Industries by Sex in Munhall borough
The Munhall borough industries that see more men than women are Mining, Quarrying, & Extraction (100.0%), Construction (83.5%), and Wholesale Trade (78.8%), whereas the industries that tend to have a higher number of women are Health Care & Social Assistance (78.5%), Finance & Insurance (76.8%), and Educational Services (73.1%).
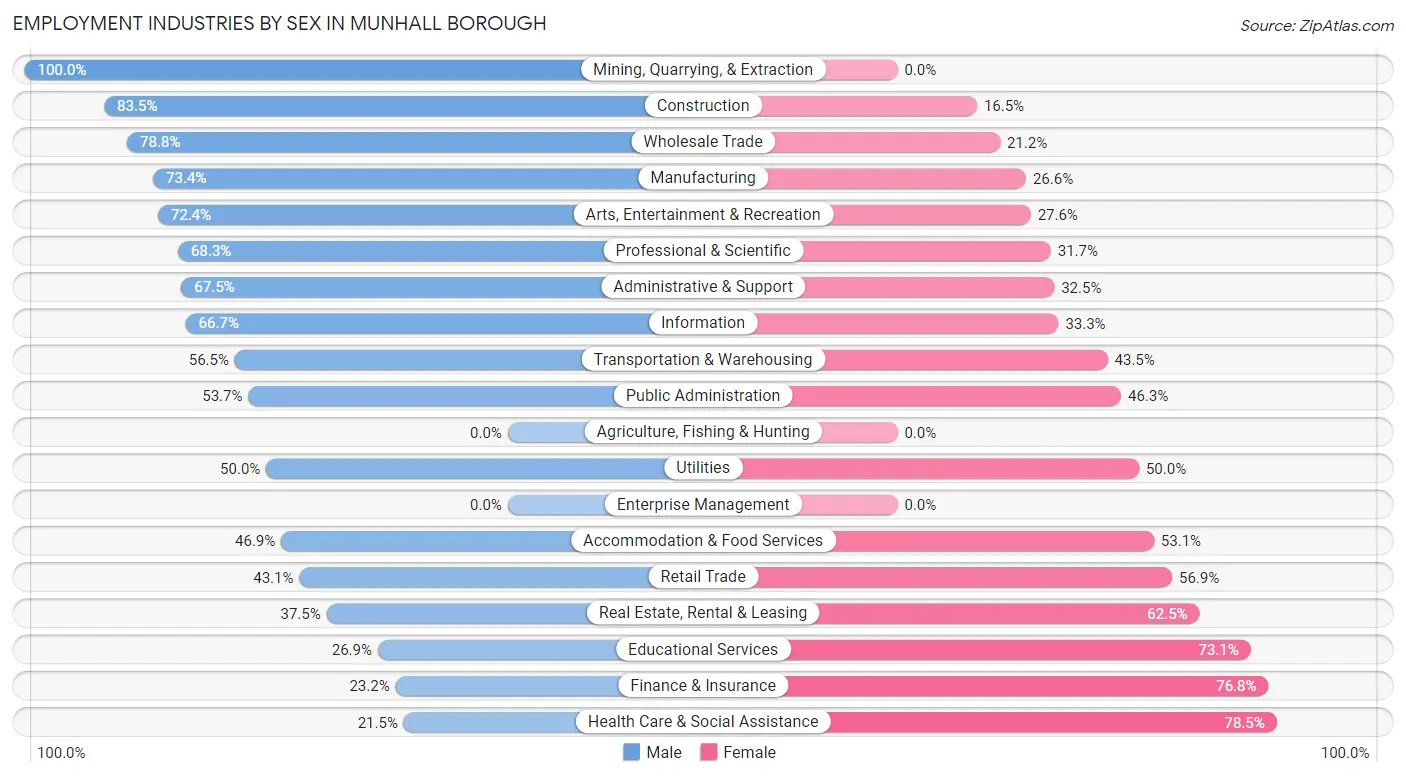
| Industry | Male | Female |
| Agriculture, Fishing & Hunting | 0 (0.0%) | 0 (0.0%) |
| Mining, Quarrying, & Extraction | 17 (100.0%) | 0 (0.0%) |
| Construction | 198 (83.5%) | 39 (16.5%) |
| Manufacturing | 342 (73.4%) | 124 (26.6%) |
| Wholesale Trade | 141 (78.8%) | 38 (21.2%) |
| Retail Trade | 242 (43.1%) | 319 (56.9%) |
| Transportation & Warehousing | 126 (56.5%) | 97 (43.5%) |
| Utilities | 16 (50.0%) | 16 (50.0%) |
| Information | 32 (66.7%) | 16 (33.3%) |
| Finance & Insurance | 128 (23.2%) | 423 (76.8%) |
| Real Estate, Rental & Leasing | 18 (37.5%) | 30 (62.5%) |
| Professional & Scientific | 342 (68.3%) | 159 (31.7%) |
| Enterprise Management | 0 (0.0%) | 0 (0.0%) |
| Administrative & Support | 283 (67.5%) | 136 (32.5%) |
| Educational Services | 89 (26.9%) | 242 (73.1%) |
| Health Care & Social Assistance | 257 (21.5%) | 937 (78.5%) |
| Arts, Entertainment & Recreation | 21 (72.4%) | 8 (27.6%) |
| Accommodation & Food Services | 91 (46.9%) | 103 (53.1%) |
| Public Administration | 29 (53.7%) | 25 (46.3%) |
| Total | 2,475 (47.0%) | 2,796 (53.0%) |
Education in Munhall borough
School Enrollment in Munhall borough
The most common levels of schooling among the 1,647 students in Munhall borough are elementary school (414 | 25.1%), middle school (386 | 23.4%), and high school (339 | 20.6%).
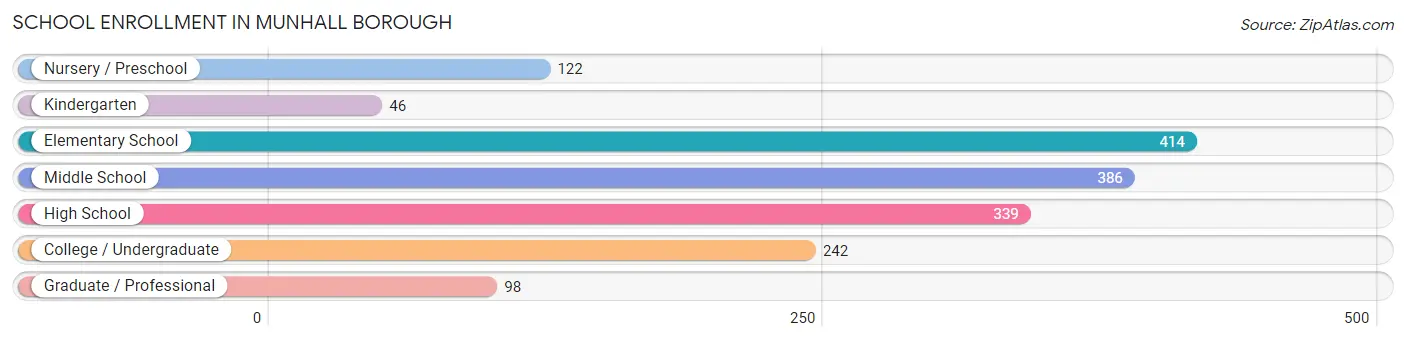
| School Level | # Students | % Students |
| Nursery / Preschool | 122 | 7.4% |
| Kindergarten | 46 | 2.8% |
| Elementary School | 414 | 25.1% |
| Middle School | 386 | 23.4% |
| High School | 339 | 20.6% |
| College / Undergraduate | 242 | 14.7% |
| Graduate / Professional | 98 | 5.9% |
| Total | 1,647 | 100.0% |
School Enrollment by Age by Funding Source in Munhall borough
Out of a total of 1,647 students who are enrolled in schools in Munhall borough, 354 (21.5%) attend a private institution, while the remaining 1,293 (78.5%) are enrolled in public schools. The age group of 3 to 4 year olds has the highest likelihood of being enrolled in private schools, with 122 (100.0% in the age bracket) enrolled. Conversely, the age group of 15 to 17 year olds has the lowest likelihood of being enrolled in a private school, with 196 (98.0% in the age bracket) attending a public institution.
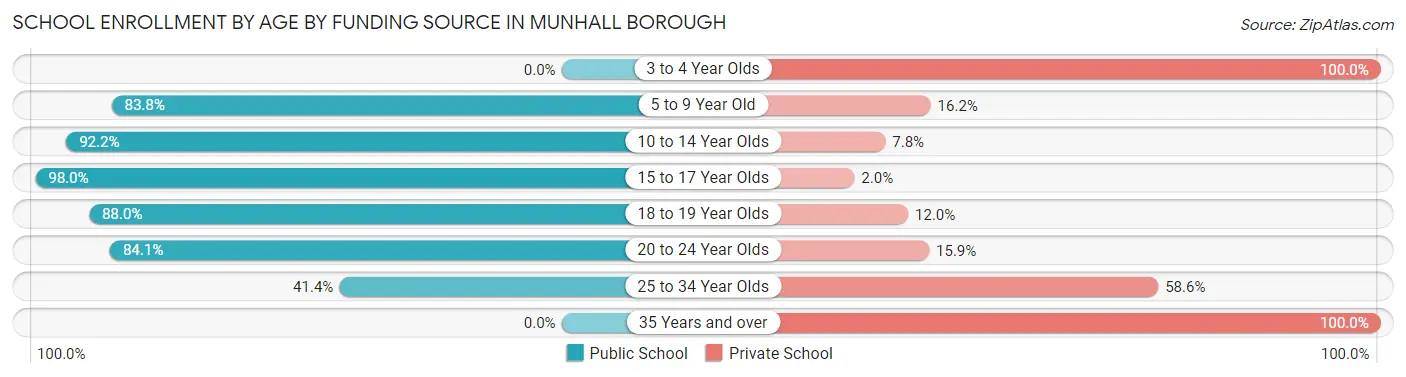
| Age Bracket | Public School | Private School |
| 3 to 4 Year Olds | 0 (0.0%) | 122 (100.0%) |
| 5 to 9 Year Old | 300 (83.8%) | 58 (16.2%) |
| 10 to 14 Year Olds | 523 (92.2%) | 44 (7.8%) |
| 15 to 17 Year Olds | 196 (98.0%) | 4 (2.0%) |
| 18 to 19 Year Olds | 110 (88.0%) | 15 (12.0%) |
| 20 to 24 Year Olds | 111 (84.1%) | 21 (15.9%) |
| 25 to 34 Year Olds | 53 (41.4%) | 75 (58.6%) |
| 35 Years and over | 0 (0.0%) | 15 (100.0%) |
| Total | 1,293 (78.5%) | 354 (21.5%) |
Educational Attainment by Field of Study in Munhall borough
Business (361 | 16.9%), education (336 | 15.7%), science & technology (254 | 11.9%), psychology (249 | 11.6%), and social sciences (139 | 6.5%) are the most common fields of study among 2,140 individuals in Munhall borough who have obtained a bachelor's degree or higher.
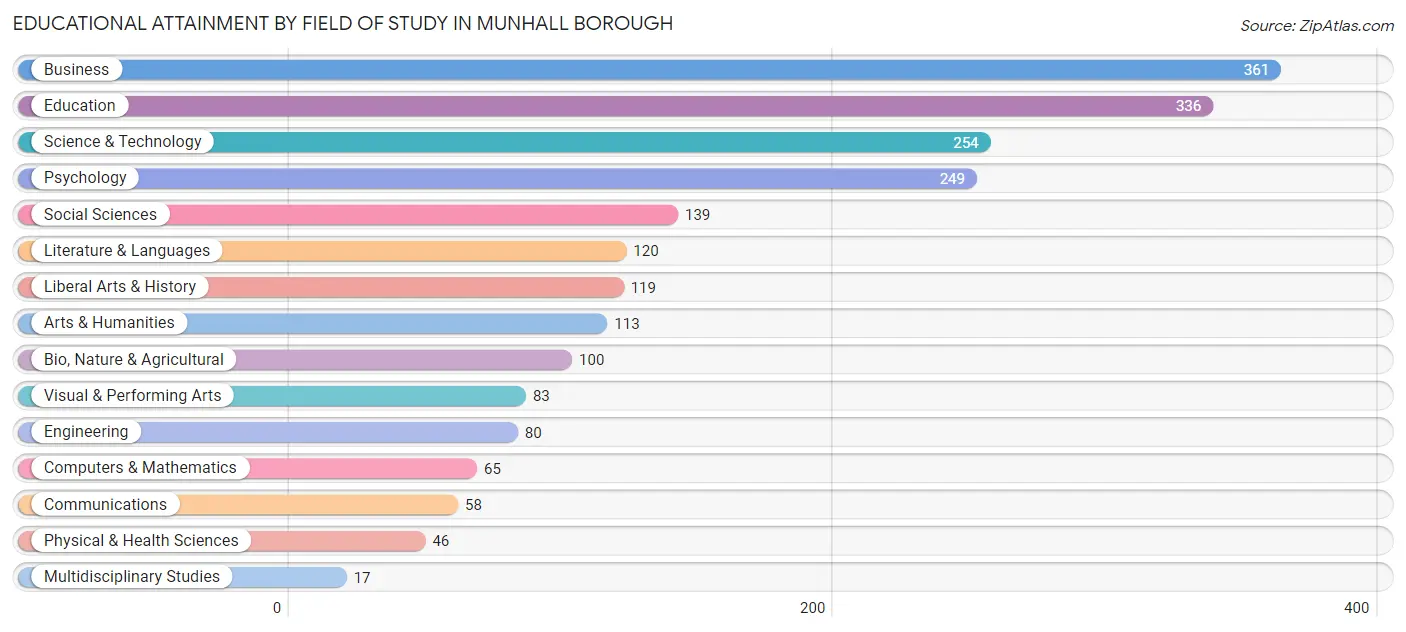
| Field of Study | # Graduates | % Graduates |
| Computers & Mathematics | 65 | 3.0% |
| Bio, Nature & Agricultural | 100 | 4.7% |
| Physical & Health Sciences | 46 | 2.1% |
| Psychology | 249 | 11.6% |
| Social Sciences | 139 | 6.5% |
| Engineering | 80 | 3.7% |
| Multidisciplinary Studies | 17 | 0.8% |
| Science & Technology | 254 | 11.9% |
| Business | 361 | 16.9% |
| Education | 336 | 15.7% |
| Literature & Languages | 120 | 5.6% |
| Liberal Arts & History | 119 | 5.6% |
| Visual & Performing Arts | 83 | 3.9% |
| Communications | 58 | 2.7% |
| Arts & Humanities | 113 | 5.3% |
| Total | 2,140 | 100.0% |
Transportation & Commute in Munhall borough
Vehicle Availability by Sex in Munhall borough
The most prevalent vehicle ownership categories in Munhall borough are males with 2 vehicles (1,095, accounting for 44.0%) and females with 2 vehicles (1,116, making up 39.9%).
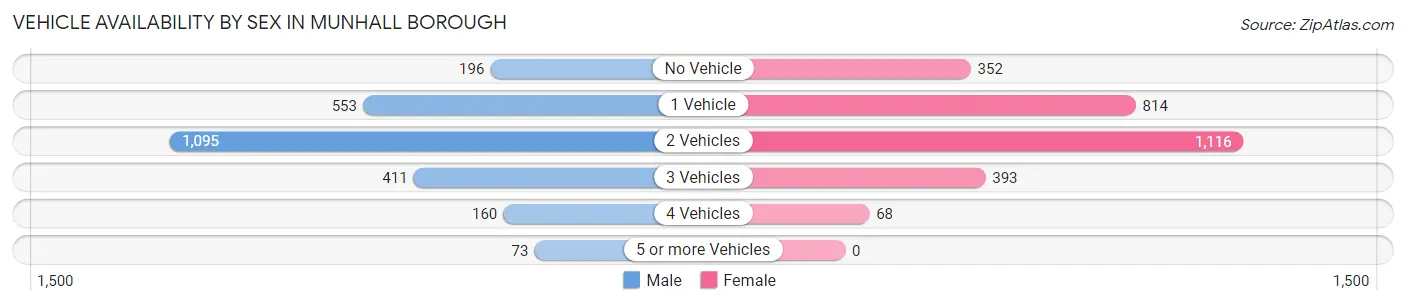
| Vehicles Available | Male | Female |
| No Vehicle | 196 (7.9%) | 352 (12.8%) |
| 1 Vehicle | 553 (22.2%) | 814 (29.7%) |
| 2 Vehicles | 1,095 (44.0%) | 1,116 (40.7%) |
| 3 Vehicles | 411 (16.5%) | 393 (14.3%) |
| 4 Vehicles | 160 (6.4%) | 68 (2.5%) |
| 5 or more Vehicles | 73 (2.9%) | 0 (0.0%) |
| Total | 2,488 (100.0%) | 2,743 (100.0%) |
Commute Time in Munhall borough
The most frequently occuring commute durations in Munhall borough are 30 to 34 minutes (1,051 commuters, 21.7%), 15 to 19 minutes (793 commuters, 16.4%), and 5 to 9 minutes (566 commuters, 11.7%).
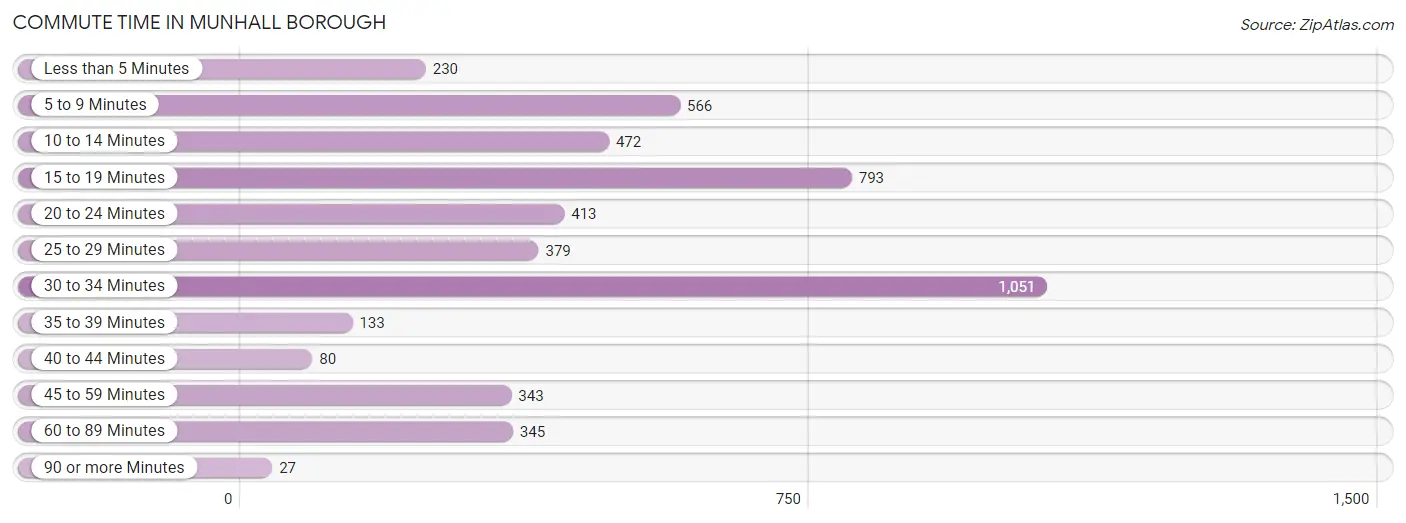
| Commute Time | # Commuters | % Commuters |
| Less than 5 Minutes | 230 | 4.8% |
| 5 to 9 Minutes | 566 | 11.7% |
| 10 to 14 Minutes | 472 | 9.8% |
| 15 to 19 Minutes | 793 | 16.4% |
| 20 to 24 Minutes | 413 | 8.6% |
| 25 to 29 Minutes | 379 | 7.8% |
| 30 to 34 Minutes | 1,051 | 21.7% |
| 35 to 39 Minutes | 133 | 2.8% |
| 40 to 44 Minutes | 80 | 1.7% |
| 45 to 59 Minutes | 343 | 7.1% |
| 60 to 89 Minutes | 345 | 7.1% |
| 90 or more Minutes | 27 | 0.6% |
Commute Time by Sex in Munhall borough
The most common commute times in Munhall borough are 5 to 9 minutes (378 commuters, 16.9%) for males and 30 to 34 minutes (735 commuters, 28.4%) for females.
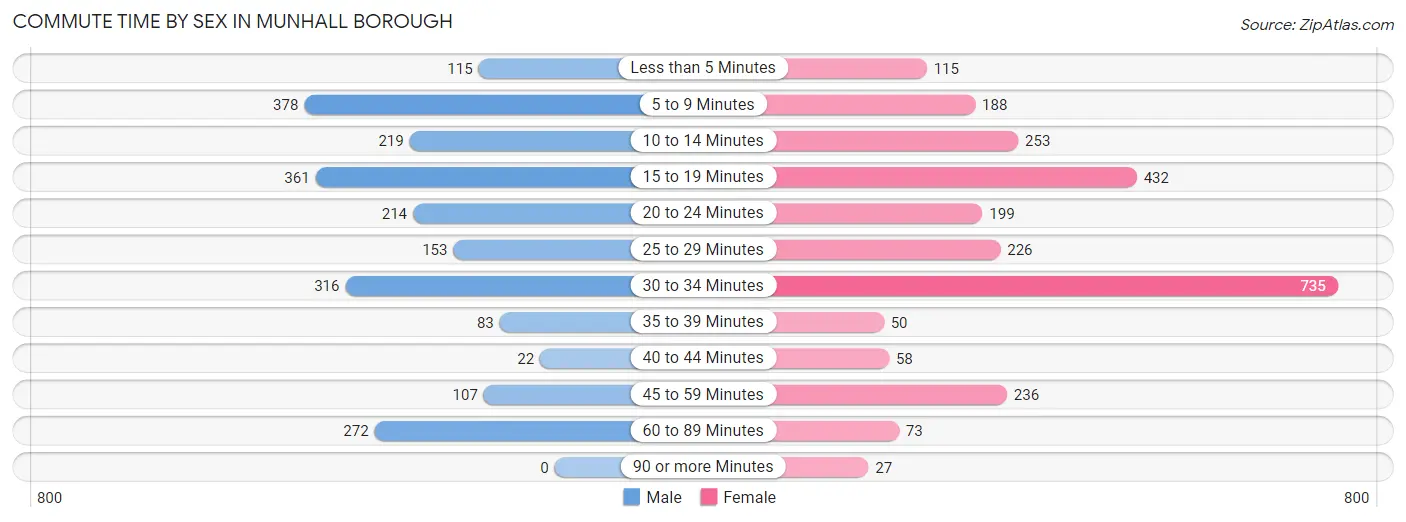
| Commute Time | Male | Female |
| Less than 5 Minutes | 115 (5.1%) | 115 (4.4%) |
| 5 to 9 Minutes | 378 (16.9%) | 188 (7.2%) |
| 10 to 14 Minutes | 219 (9.8%) | 253 (9.8%) |
| 15 to 19 Minutes | 361 (16.1%) | 432 (16.7%) |
| 20 to 24 Minutes | 214 (9.6%) | 199 (7.7%) |
| 25 to 29 Minutes | 153 (6.8%) | 226 (8.7%) |
| 30 to 34 Minutes | 316 (14.1%) | 735 (28.4%) |
| 35 to 39 Minutes | 83 (3.7%) | 50 (1.9%) |
| 40 to 44 Minutes | 22 (1.0%) | 58 (2.2%) |
| 45 to 59 Minutes | 107 (4.8%) | 236 (9.1%) |
| 60 to 89 Minutes | 272 (12.1%) | 73 (2.8%) |
| 90 or more Minutes | 0 (0.0%) | 27 (1.0%) |
Time of Departure to Work by Sex in Munhall borough
The most frequent times of departure to work in Munhall borough are 7:00 AM to 7:29 AM (366, 16.3%) for males and 7:30 AM to 7:59 AM (484, 18.7%) for females.
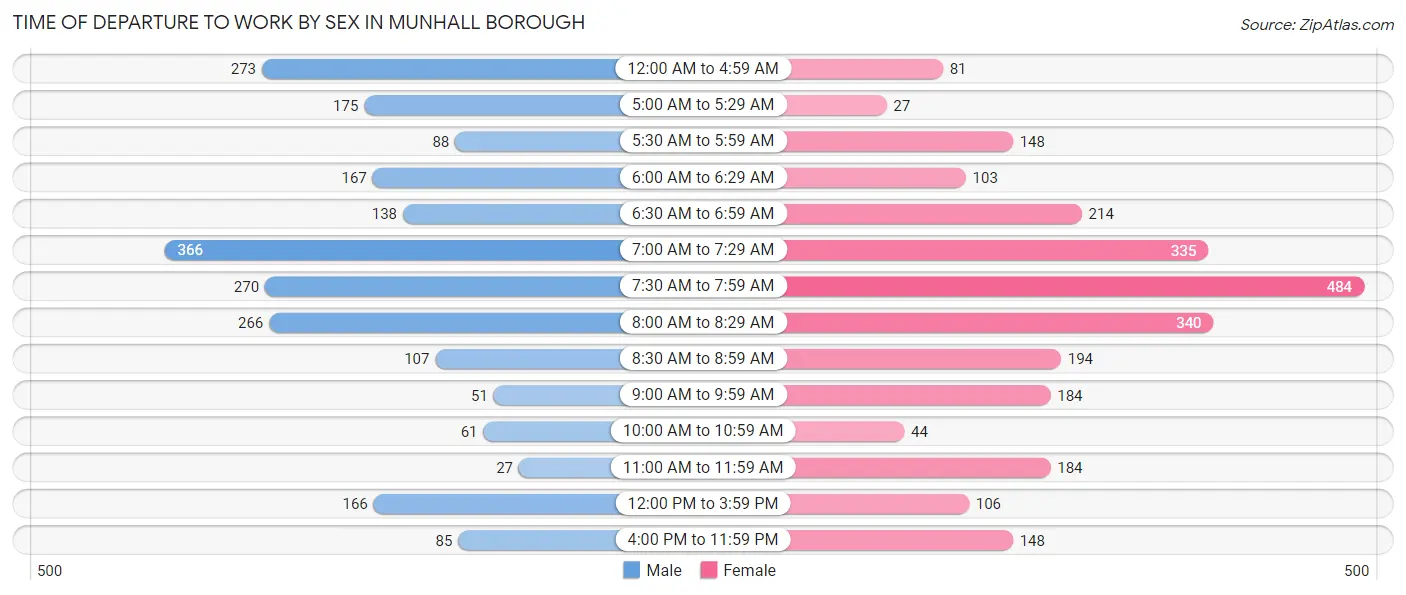
| Time of Departure | Male | Female |
| 12:00 AM to 4:59 AM | 273 (12.2%) | 81 (3.1%) |
| 5:00 AM to 5:29 AM | 175 (7.8%) | 27 (1.0%) |
| 5:30 AM to 5:59 AM | 88 (3.9%) | 148 (5.7%) |
| 6:00 AM to 6:29 AM | 167 (7.5%) | 103 (4.0%) |
| 6:30 AM to 6:59 AM | 138 (6.2%) | 214 (8.3%) |
| 7:00 AM to 7:29 AM | 366 (16.3%) | 335 (12.9%) |
| 7:30 AM to 7:59 AM | 270 (12.0%) | 484 (18.7%) |
| 8:00 AM to 8:29 AM | 266 (11.9%) | 340 (13.1%) |
| 8:30 AM to 8:59 AM | 107 (4.8%) | 194 (7.5%) |
| 9:00 AM to 9:59 AM | 51 (2.3%) | 184 (7.1%) |
| 10:00 AM to 10:59 AM | 61 (2.7%) | 44 (1.7%) |
| 11:00 AM to 11:59 AM | 27 (1.2%) | 184 (7.1%) |
| 12:00 PM to 3:59 PM | 166 (7.4%) | 106 (4.1%) |
| 4:00 PM to 11:59 PM | 85 (3.8%) | 148 (5.7%) |
| Total | 2,240 (100.0%) | 2,592 (100.0%) |
Housing Occupancy in Munhall borough
Occupancy by Ownership in Munhall borough
Of the total 5,148 dwellings in Munhall borough, owner-occupied units account for 3,218 (62.5%), while renter-occupied units make up 1,930 (37.5%).
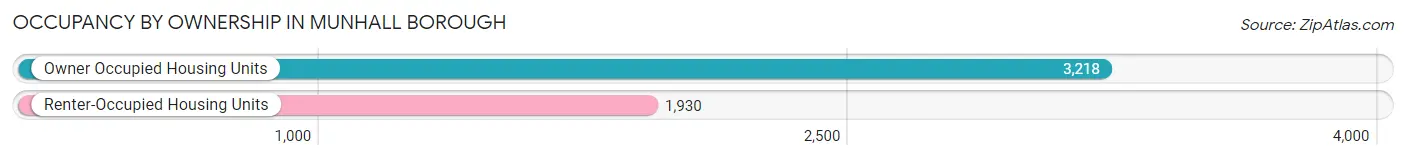
| Occupancy | # Housing Units | % Housing Units |
| Owner Occupied Housing Units | 3,218 | 62.5% |
| Renter-Occupied Housing Units | 1,930 | 37.5% |
| Total Occupied Housing Units | 5,148 | 100.0% |
Occupancy by Household Size in Munhall borough
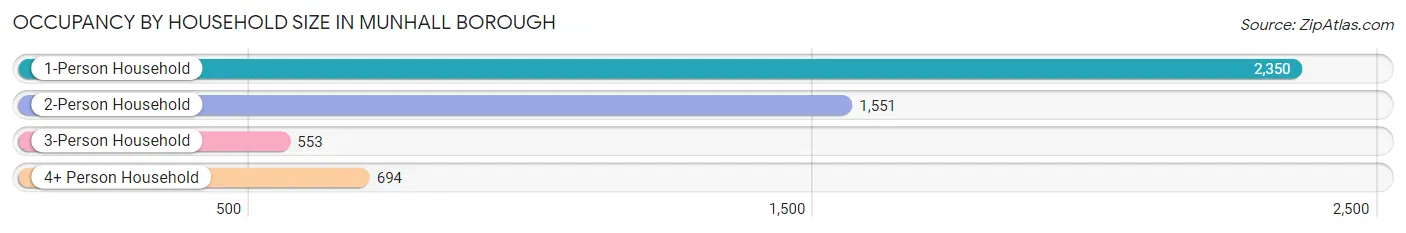
| Household Size | # Housing Units | % Housing Units |
| 1-Person Household | 2,350 | 45.7% |
| 2-Person Household | 1,551 | 30.1% |
| 3-Person Household | 553 | 10.7% |
| 4+ Person Household | 694 | 13.5% |
| Total Housing Units | 5,148 | 100.0% |
Occupancy by Ownership by Household Size in Munhall borough
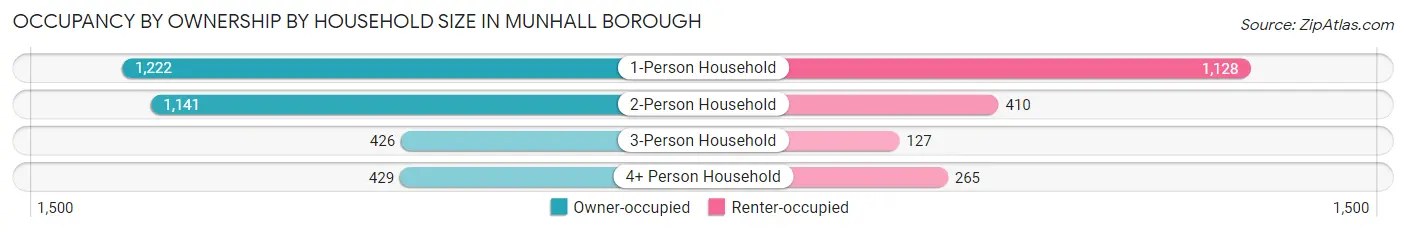
| Household Size | Owner-occupied | Renter-occupied |
| 1-Person Household | 1,222 (52.0%) | 1,128 (48.0%) |
| 2-Person Household | 1,141 (73.6%) | 410 (26.4%) |
| 3-Person Household | 426 (77.0%) | 127 (23.0%) |
| 4+ Person Household | 429 (61.8%) | 265 (38.2%) |
| Total Housing Units | 3,218 (62.5%) | 1,930 (37.5%) |
Occupancy by Educational Attainment in Munhall borough
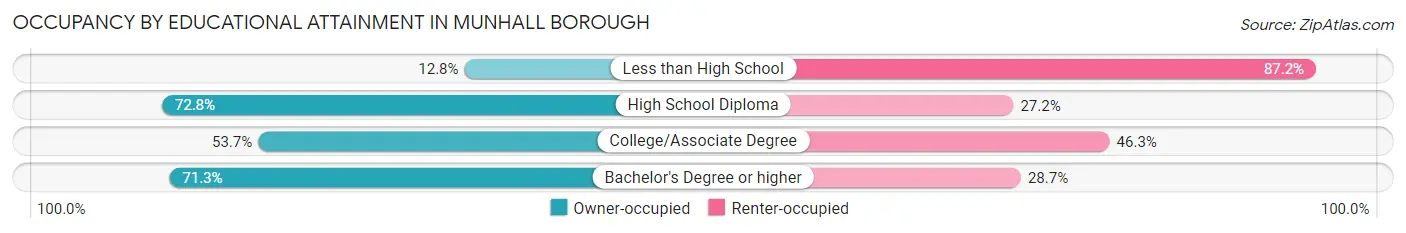
| Household Size | Owner-occupied | Renter-occupied |
| Less than High School | 31 (12.8%) | 211 (87.2%) |
| High School Diploma | 1,158 (72.8%) | 433 (27.2%) |
| College/Associate Degree | 1,021 (53.7%) | 880 (46.3%) |
| Bachelor's Degree or higher | 1,008 (71.3%) | 406 (28.7%) |
Occupancy by Age of Householder in Munhall borough
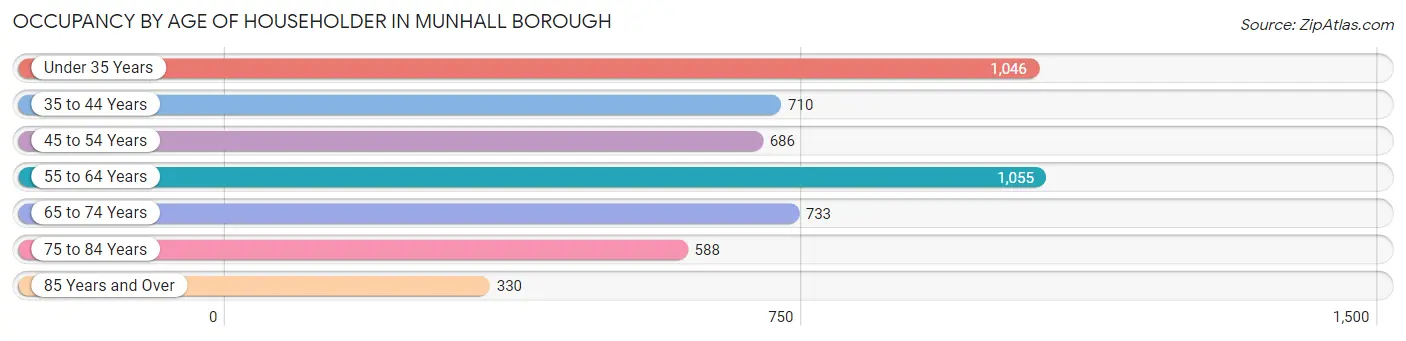
| Age Bracket | # Households | % Households |
| Under 35 Years | 1,046 | 20.3% |
| 35 to 44 Years | 710 | 13.8% |
| 45 to 54 Years | 686 | 13.3% |
| 55 to 64 Years | 1,055 | 20.5% |
| 65 to 74 Years | 733 | 14.2% |
| 75 to 84 Years | 588 | 11.4% |
| 85 Years and Over | 330 | 6.4% |
| Total | 5,148 | 100.0% |
Housing Finances in Munhall borough
Median Income by Occupancy in Munhall borough
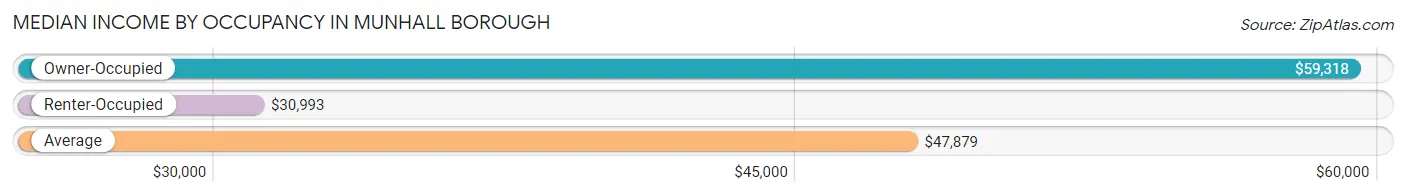
| Occupancy Type | # Households | Median Income |
| Owner-Occupied | 3,218 (62.5%) | $59,318 |
| Renter-Occupied | 1,930 (37.5%) | $30,993 |
| Average | 5,148 (100.0%) | $47,879 |
Occupancy by Householder Income Bracket in Munhall borough
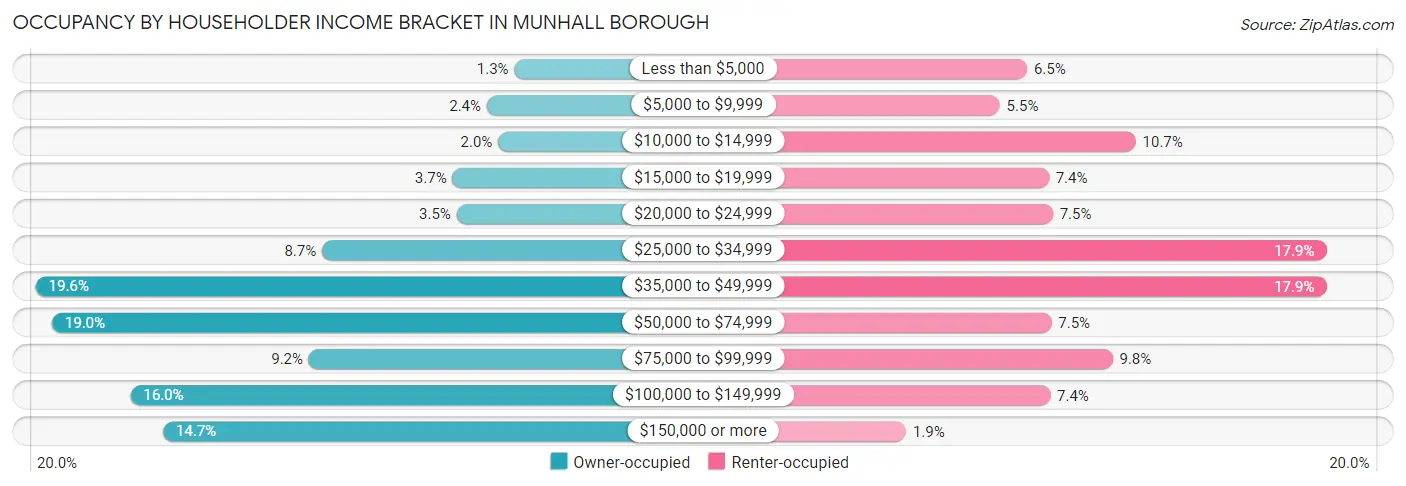
| Income Bracket | Owner-occupied | Renter-occupied |
| Less than $5,000 | 43 (1.3%) | 126 (6.5%) |
| $5,000 to $9,999 | 77 (2.4%) | 106 (5.5%) |
| $10,000 to $14,999 | 63 (2.0%) | 206 (10.7%) |
| $15,000 to $19,999 | 119 (3.7%) | 142 (7.4%) |
| $20,000 to $24,999 | 114 (3.5%) | 145 (7.5%) |
| $25,000 to $34,999 | 279 (8.7%) | 346 (17.9%) |
| $35,000 to $49,999 | 630 (19.6%) | 346 (17.9%) |
| $50,000 to $74,999 | 610 (19.0%) | 144 (7.5%) |
| $75,000 to $99,999 | 295 (9.2%) | 189 (9.8%) |
| $100,000 to $149,999 | 514 (16.0%) | 143 (7.4%) |
| $150,000 or more | 474 (14.7%) | 37 (1.9%) |
| Total | 3,218 (100.0%) | 1,930 (100.0%) |
Monthly Housing Cost Tiers in Munhall borough
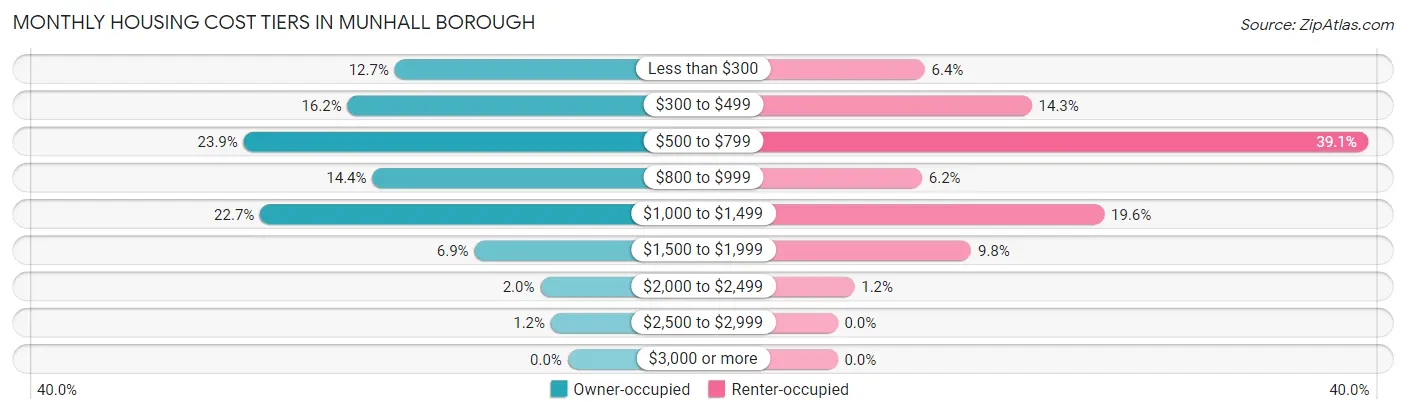
| Monthly Cost | Owner-occupied | Renter-occupied |
| Less than $300 | 410 (12.7%) | 124 (6.4%) |
| $300 to $499 | 522 (16.2%) | 276 (14.3%) |
| $500 to $799 | 768 (23.9%) | 755 (39.1%) |
| $800 to $999 | 463 (14.4%) | 120 (6.2%) |
| $1,000 to $1,499 | 729 (22.7%) | 379 (19.6%) |
| $1,500 to $1,999 | 221 (6.9%) | 190 (9.8%) |
| $2,000 to $2,499 | 65 (2.0%) | 24 (1.2%) |
| $2,500 to $2,999 | 40 (1.2%) | 0 (0.0%) |
| $3,000 or more | 0 (0.0%) | 0 (0.0%) |
| Total | 3,218 (100.0%) | 1,930 (100.0%) |
Physical Housing Characteristics in Munhall borough
Housing Structures in Munhall borough
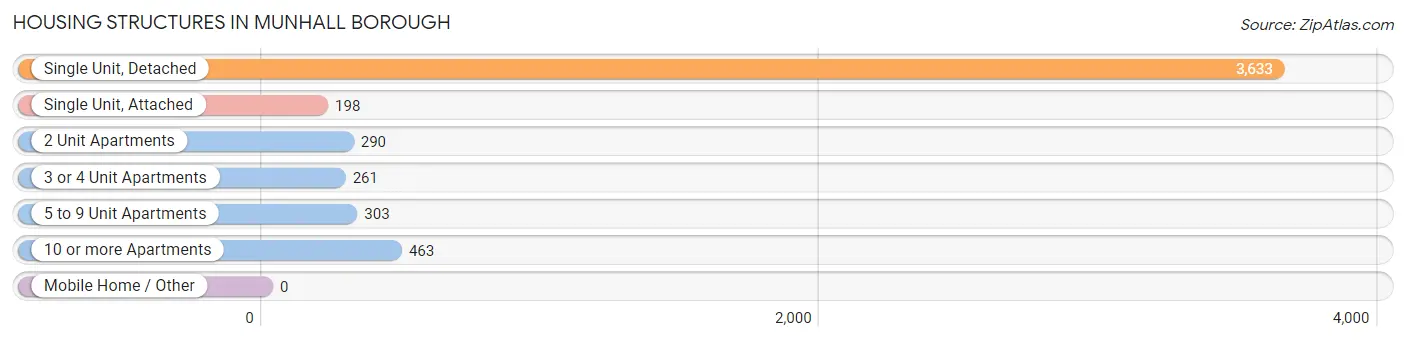
| Structure Type | # Housing Units | % Housing Units |
| Single Unit, Detached | 3,633 | 70.6% |
| Single Unit, Attached | 198 | 3.8% |
| 2 Unit Apartments | 290 | 5.6% |
| 3 or 4 Unit Apartments | 261 | 5.1% |
| 5 to 9 Unit Apartments | 303 | 5.9% |
| 10 or more Apartments | 463 | 9.0% |
| Mobile Home / Other | 0 | 0.0% |
| Total | 5,148 | 100.0% |
Housing Structures by Occupancy in Munhall borough
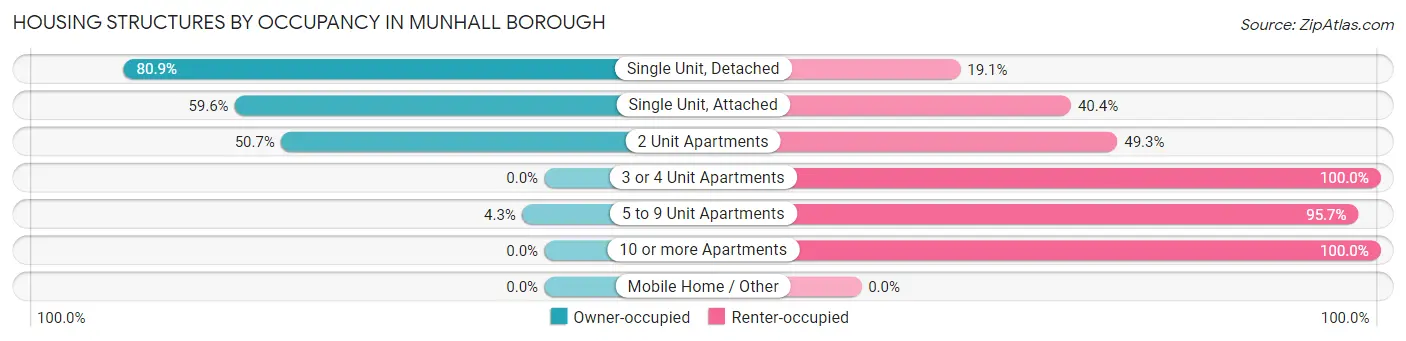
| Structure Type | Owner-occupied | Renter-occupied |
| Single Unit, Detached | 2,940 (80.9%) | 693 (19.1%) |
| Single Unit, Attached | 118 (59.6%) | 80 (40.4%) |
| 2 Unit Apartments | 147 (50.7%) | 143 (49.3%) |
| 3 or 4 Unit Apartments | 0 (0.0%) | 261 (100.0%) |
| 5 to 9 Unit Apartments | 13 (4.3%) | 290 (95.7%) |
| 10 or more Apartments | 0 (0.0%) | 463 (100.0%) |
| Mobile Home / Other | 0 (0.0%) | 0 (0.0%) |
| Total | 3,218 (62.5%) | 1,930 (37.5%) |
Housing Structures by Number of Rooms in Munhall borough
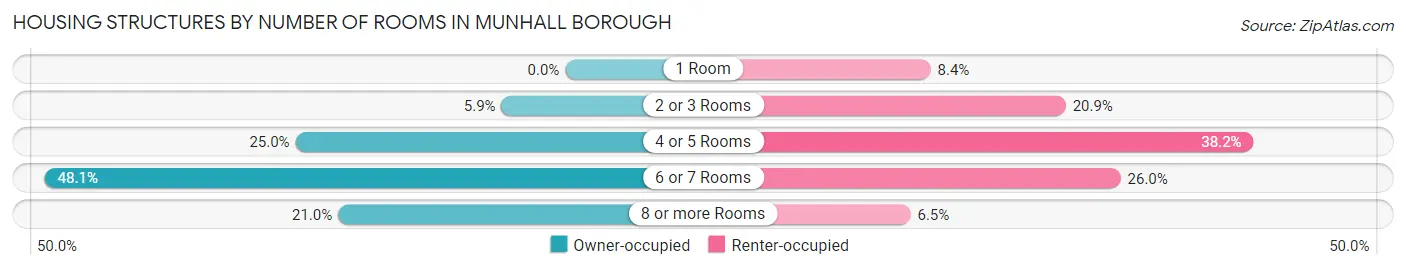
| Number of Rooms | Owner-occupied | Renter-occupied |
| 1 Room | 0 (0.0%) | 162 (8.4%) |
| 2 or 3 Rooms | 190 (5.9%) | 403 (20.9%) |
| 4 or 5 Rooms | 803 (24.9%) | 738 (38.2%) |
| 6 or 7 Rooms | 1,549 (48.1%) | 501 (26.0%) |
| 8 or more Rooms | 676 (21.0%) | 126 (6.5%) |
| Total | 3,218 (100.0%) | 1,930 (100.0%) |
Housing Structure by Heating Type in Munhall borough
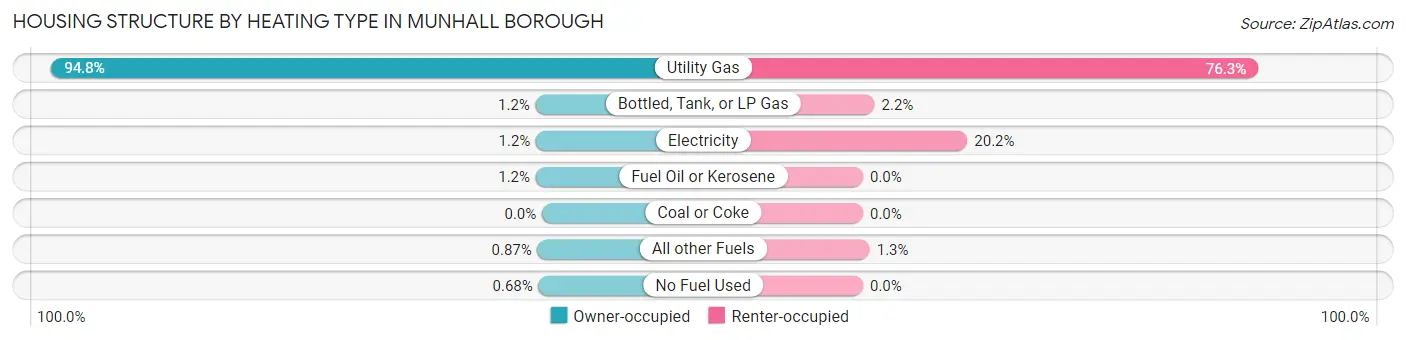
| Heating Type | Owner-occupied | Renter-occupied |
| Utility Gas | 3,052 (94.8%) | 1,473 (76.3%) |
| Bottled, Tank, or LP Gas | 40 (1.2%) | 43 (2.2%) |
| Electricity | 37 (1.1%) | 389 (20.2%) |
| Fuel Oil or Kerosene | 39 (1.2%) | 0 (0.0%) |
| Coal or Coke | 0 (0.0%) | 0 (0.0%) |
| All other Fuels | 28 (0.9%) | 25 (1.3%) |
| No Fuel Used | 22 (0.7%) | 0 (0.0%) |
| Total | 3,218 (100.0%) | 1,930 (100.0%) |
Household Vehicle Usage in Munhall borough
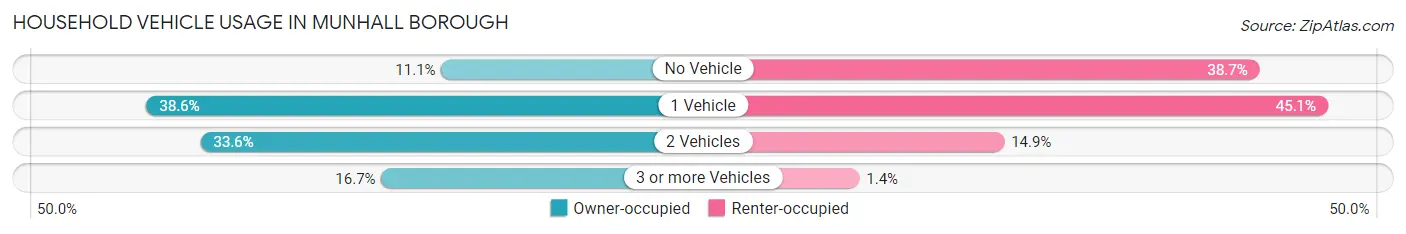
| Vehicles per Household | Owner-occupied | Renter-occupied |
| No Vehicle | 357 (11.1%) | 747 (38.7%) |
| 1 Vehicle | 1,243 (38.6%) | 870 (45.1%) |
| 2 Vehicles | 1,081 (33.6%) | 287 (14.9%) |
| 3 or more Vehicles | 537 (16.7%) | 26 (1.3%) |
| Total | 3,218 (100.0%) | 1,930 (100.0%) |
Real Estate & Mortgages in Munhall borough
Real Estate and Mortgage Overview in Munhall borough
| Characteristic | Without Mortgage | With Mortgage |
| Housing Units | 1,517 | 1,701 |
| Median Property Value | $91,500 | $122,900 |
| Median Household Income | $46,208 | $348 |
| Monthly Housing Costs | $478 | $0 |
| Real Estate Taxes | $2,015 | $39 |
Property Value by Mortgage Status in Munhall borough
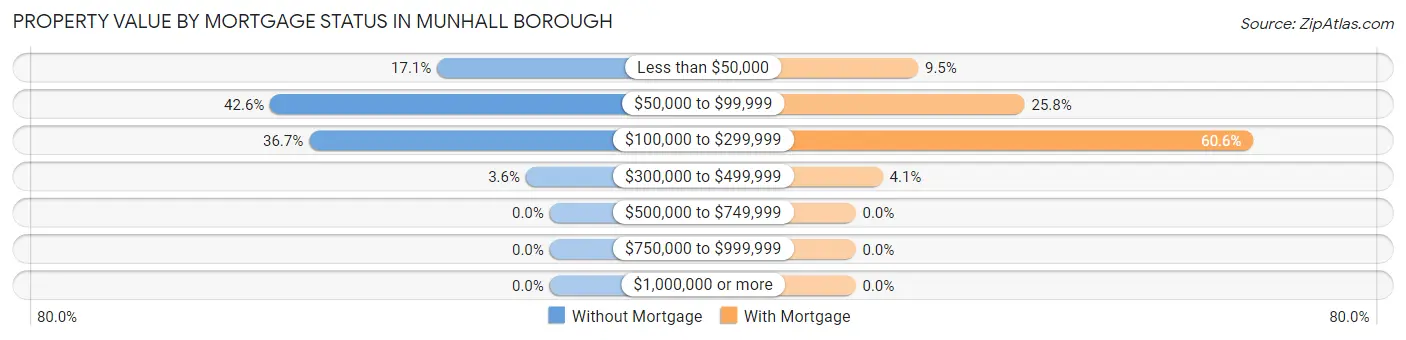
| Property Value | Without Mortgage | With Mortgage |
| Less than $50,000 | 260 (17.1%) | 162 (9.5%) |
| $50,000 to $99,999 | 646 (42.6%) | 438 (25.8%) |
| $100,000 to $299,999 | 556 (36.6%) | 1,031 (60.6%) |
| $300,000 to $499,999 | 55 (3.6%) | 70 (4.1%) |
| $500,000 to $749,999 | 0 (0.0%) | 0 (0.0%) |
| $750,000 to $999,999 | 0 (0.0%) | 0 (0.0%) |
| $1,000,000 or more | 0 (0.0%) | 0 (0.0%) |
| Total | 1,517 (100.0%) | 1,701 (100.0%) |
Household Income by Mortgage Status in Munhall borough
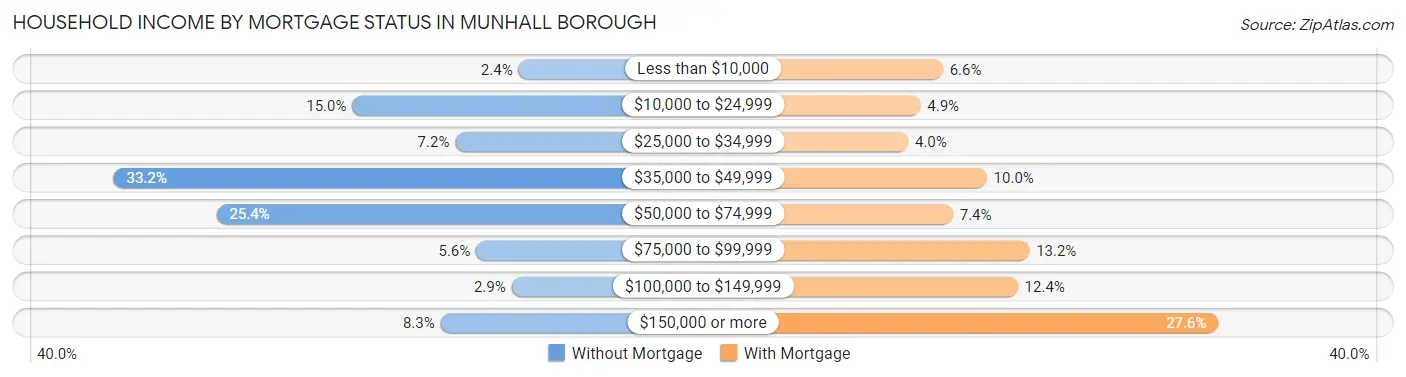
| Household Income | Without Mortgage | With Mortgage |
| Less than $10,000 | 36 (2.4%) | 113 (6.6%) |
| $10,000 to $24,999 | 228 (15.0%) | 84 (4.9%) |
| $25,000 to $34,999 | 109 (7.2%) | 68 (4.0%) |
| $35,000 to $49,999 | 504 (33.2%) | 170 (10.0%) |
| $50,000 to $74,999 | 385 (25.4%) | 126 (7.4%) |
| $75,000 to $99,999 | 85 (5.6%) | 225 (13.2%) |
| $100,000 to $149,999 | 44 (2.9%) | 210 (12.3%) |
| $150,000 or more | 126 (8.3%) | 470 (27.6%) |
| Total | 1,517 (100.0%) | 1,701 (100.0%) |
Property Value to Household Income Ratio in Munhall borough
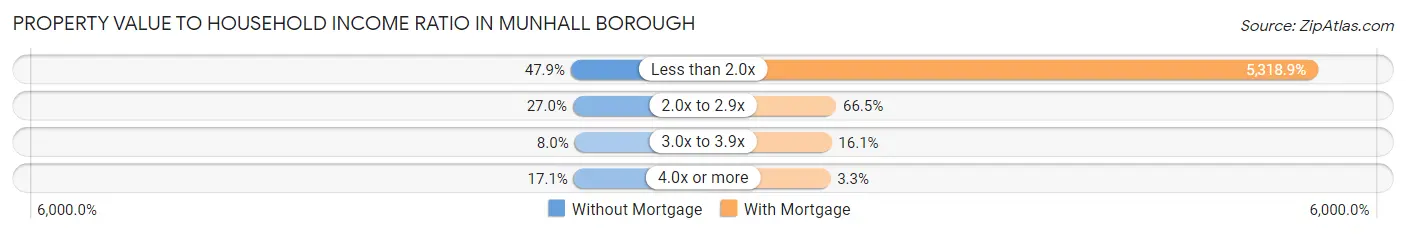
| Value-to-Income Ratio | Without Mortgage | With Mortgage |
| Less than 2.0x | 727 (47.9%) | 90,474 (5,318.9%) |
| 2.0x to 2.9x | 409 (27.0%) | 1,131 (66.5%) |
| 3.0x to 3.9x | 121 (8.0%) | 273 (16.1%) |
| 4.0x or more | 260 (17.1%) | 56 (3.3%) |
| Total | 1,517 (100.0%) | 1,701 (100.0%) |
Real Estate Taxes by Mortgage Status in Munhall borough
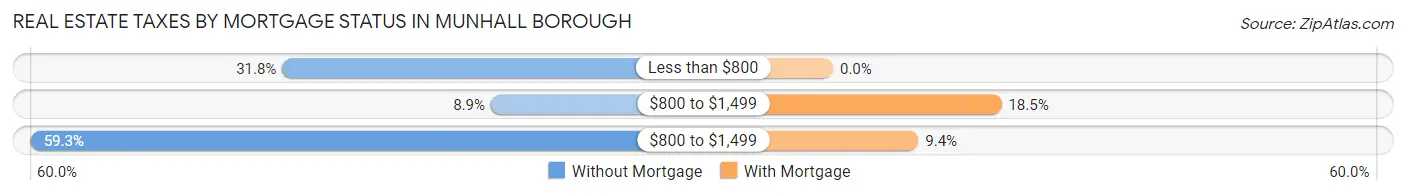
| Property Taxes | Without Mortgage | With Mortgage |
| Less than $800 | 482 (31.8%) | 0 (0.0%) |
| $800 to $1,499 | 135 (8.9%) | 314 (18.5%) |
| $800 to $1,499 | 900 (59.3%) | 159 (9.3%) |
| Total | 1,517 (100.0%) | 1,701 (100.0%) |
Health & Disability in Munhall borough
Health Insurance Coverage by Age in Munhall borough
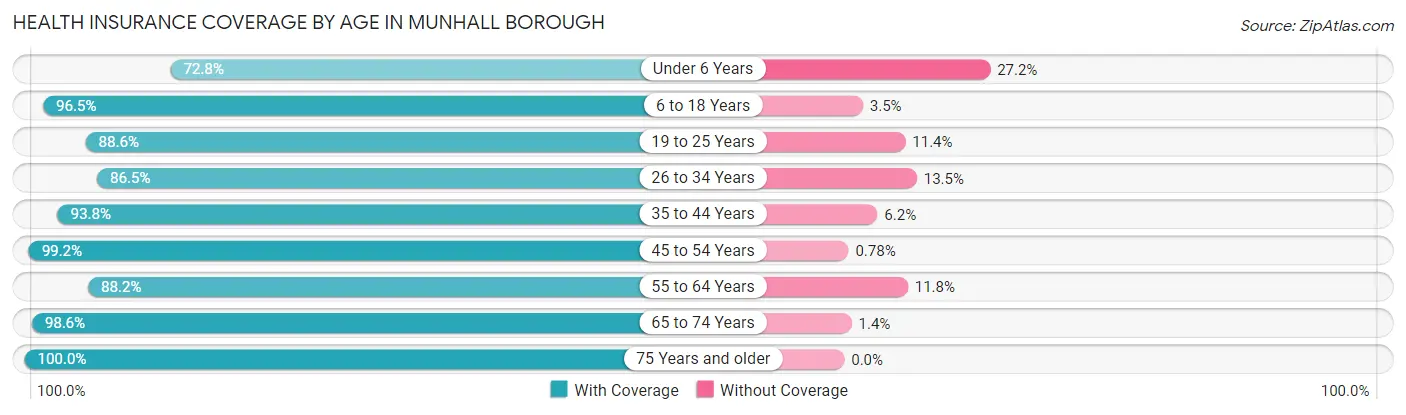
| Age Bracket | With Coverage | Without Coverage |
| Under 6 Years | 551 (72.8%) | 206 (27.2%) |
| 6 to 18 Years | 1,171 (96.5%) | 42 (3.5%) |
| 19 to 25 Years | 817 (88.6%) | 105 (11.4%) |
| 26 to 34 Years | 1,203 (86.5%) | 188 (13.5%) |
| 35 to 44 Years | 1,003 (93.8%) | 66 (6.2%) |
| 45 to 54 Years | 1,279 (99.2%) | 10 (0.8%) |
| 55 to 64 Years | 1,564 (88.2%) | 210 (11.8%) |
| 65 to 74 Years | 1,092 (98.6%) | 15 (1.4%) |
| 75 Years and older | 1,158 (100.0%) | 0 (0.0%) |
| Total | 9,838 (92.1%) | 842 (7.9%) |
Health Insurance Coverage by Citizenship Status in Munhall borough
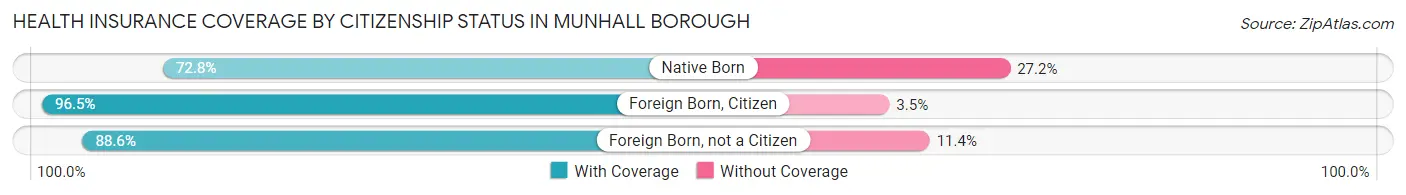
| Citizenship Status | With Coverage | Without Coverage |
| Native Born | 551 (72.8%) | 206 (27.2%) |
| Foreign Born, Citizen | 1,171 (96.5%) | 42 (3.5%) |
| Foreign Born, not a Citizen | 817 (88.6%) | 105 (11.4%) |
Health Insurance Coverage by Household Income in Munhall borough
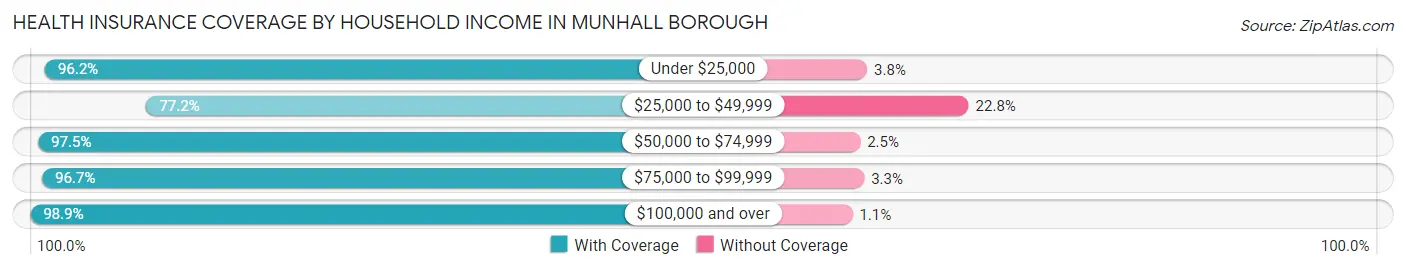
| Household Income | With Coverage | Without Coverage |
| Under $25,000 | 1,412 (96.2%) | 56 (3.8%) |
| $25,000 to $49,999 | 2,275 (77.2%) | 673 (22.8%) |
| $50,000 to $74,999 | 1,314 (97.5%) | 34 (2.5%) |
| $75,000 to $99,999 | 1,184 (96.7%) | 40 (3.3%) |
| $100,000 and over | 3,628 (98.9%) | 39 (1.1%) |
Public vs Private Health Insurance Coverage by Age in Munhall borough
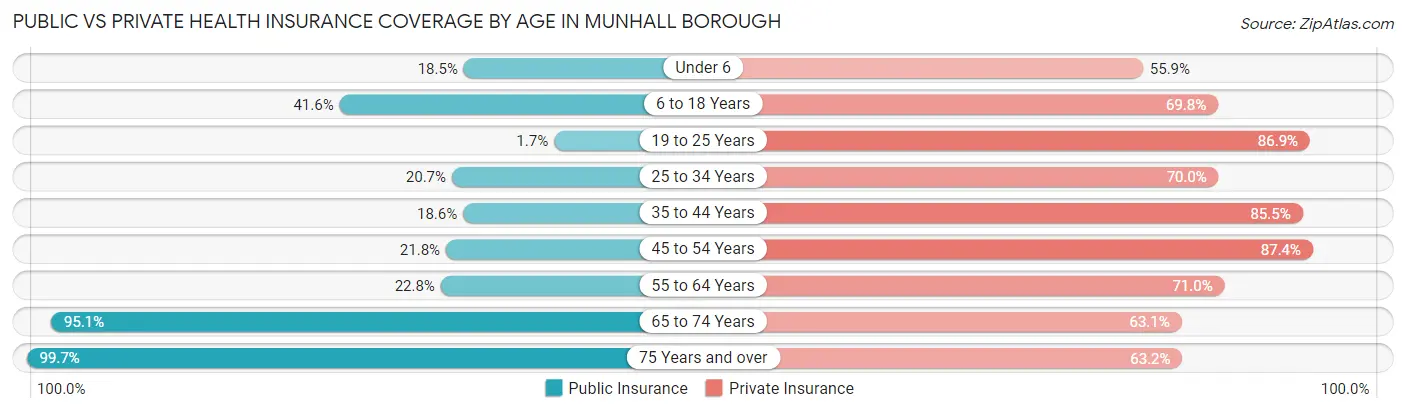
| Age Bracket | Public Insurance | Private Insurance |
| Under 6 | 140 (18.5%) | 423 (55.9%) |
| 6 to 18 Years | 504 (41.5%) | 847 (69.8%) |
| 19 to 25 Years | 16 (1.7%) | 801 (86.9%) |
| 25 to 34 Years | 288 (20.7%) | 973 (70.0%) |
| 35 to 44 Years | 199 (18.6%) | 914 (85.5%) |
| 45 to 54 Years | 281 (21.8%) | 1,127 (87.4%) |
| 55 to 64 Years | 404 (22.8%) | 1,260 (71.0%) |
| 65 to 74 Years | 1,053 (95.1%) | 698 (63.0%) |
| 75 Years and over | 1,154 (99.7%) | 732 (63.2%) |
| Total | 4,039 (37.8%) | 7,775 (72.8%) |
Disability Status by Sex by Age in Munhall borough
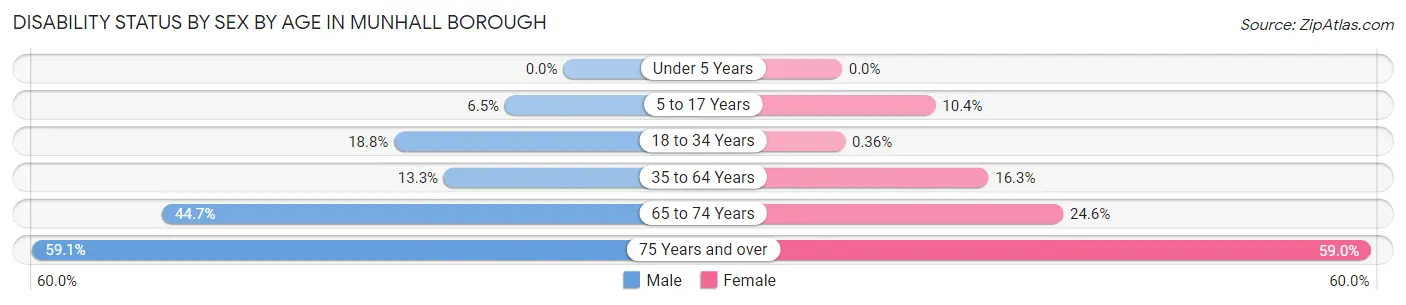
| Age Bracket | Male | Female |
| Under 5 Years | 0 (0.0%) | 0 (0.0%) |
| 5 to 17 Years | 43 (6.5%) | 50 (10.4%) |
| 18 to 34 Years | 189 (18.8%) | 5 (0.4%) |
| 35 to 64 Years | 271 (13.3%) | 342 (16.3%) |
| 65 to 74 Years | 248 (44.7%) | 136 (24.6%) |
| 75 Years and over | 123 (59.1%) | 560 (59.0%) |
Disability Class by Sex by Age in Munhall borough
Disability Class: Hearing Difficulty
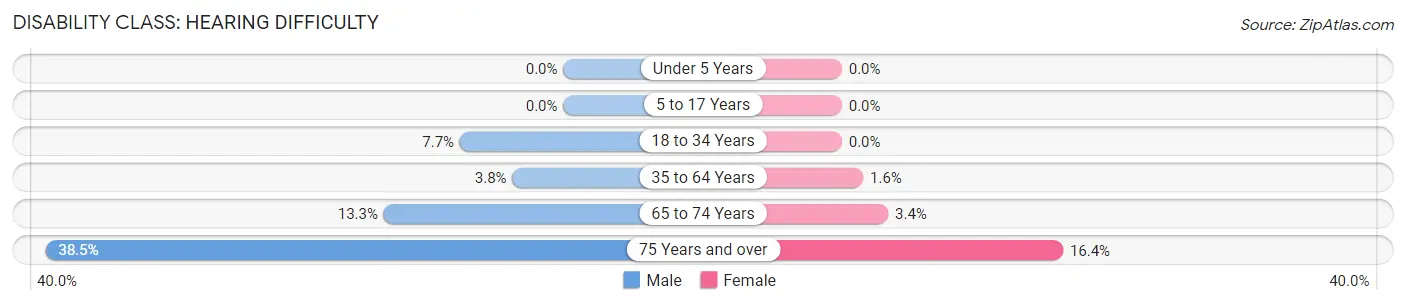
| Age Bracket | Male | Female |
| Under 5 Years | 0 (0.0%) | 0 (0.0%) |
| 5 to 17 Years | 0 (0.0%) | 0 (0.0%) |
| 18 to 34 Years | 77 (7.7%) | 0 (0.0%) |
| 35 to 64 Years | 77 (3.8%) | 33 (1.6%) |
| 65 to 74 Years | 74 (13.3%) | 19 (3.4%) |
| 75 Years and over | 80 (38.5%) | 156 (16.4%) |
Disability Class: Vision Difficulty
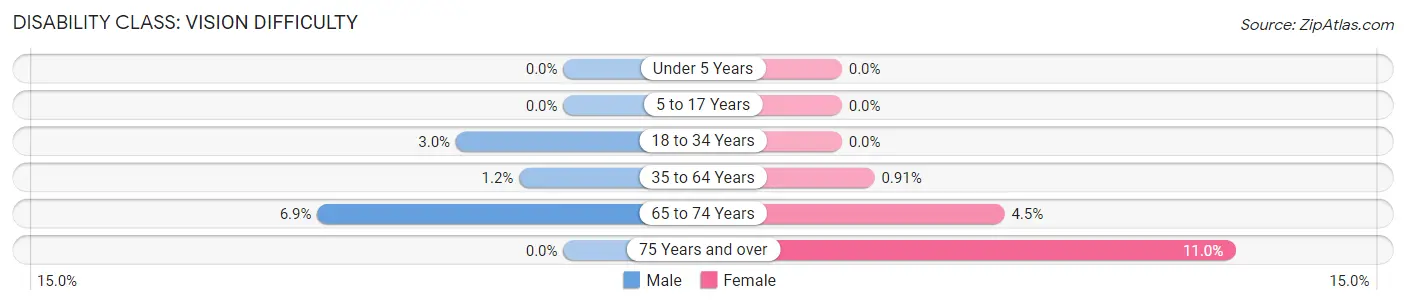
| Age Bracket | Male | Female |
| Under 5 Years | 0 (0.0%) | 0 (0.0%) |
| 5 to 17 Years | 0 (0.0%) | 0 (0.0%) |
| 18 to 34 Years | 30 (3.0%) | 0 (0.0%) |
| 35 to 64 Years | 25 (1.2%) | 19 (0.9%) |
| 65 to 74 Years | 38 (6.9%) | 25 (4.5%) |
| 75 Years and over | 0 (0.0%) | 104 (11.0%) |
Disability Class: Cognitive Difficulty
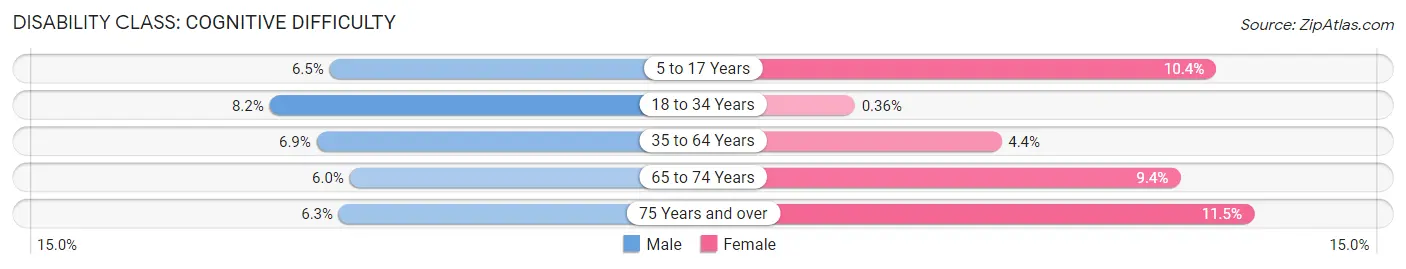
| Age Bracket | Male | Female |
| 5 to 17 Years | 43 (6.5%) | 50 (10.4%) |
| 18 to 34 Years | 82 (8.2%) | 5 (0.4%) |
| 35 to 64 Years | 140 (6.9%) | 93 (4.4%) |
| 65 to 74 Years | 33 (5.9%) | 52 (9.4%) |
| 75 Years and over | 13 (6.2%) | 109 (11.5%) |
Disability Class: Ambulatory Difficulty
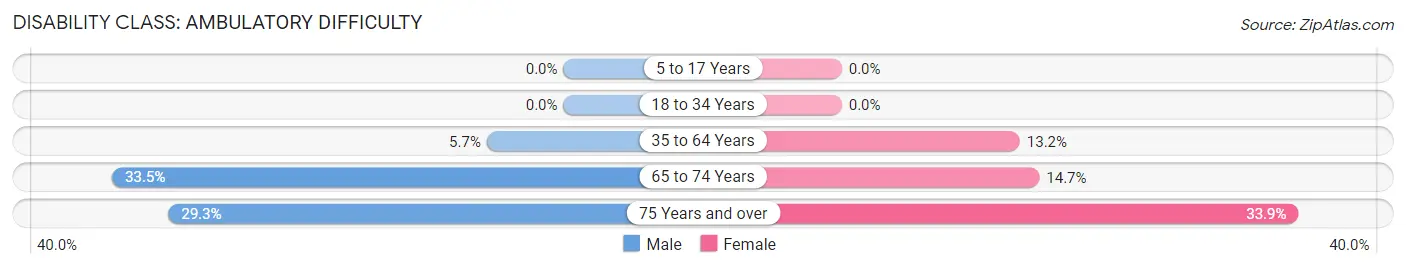
| Age Bracket | Male | Female |
| 5 to 17 Years | 0 (0.0%) | 0 (0.0%) |
| 18 to 34 Years | 0 (0.0%) | 0 (0.0%) |
| 35 to 64 Years | 116 (5.7%) | 277 (13.2%) |
| 65 to 74 Years | 186 (33.5%) | 81 (14.7%) |
| 75 Years and over | 61 (29.3%) | 322 (33.9%) |
Disability Class: Self-Care Difficulty
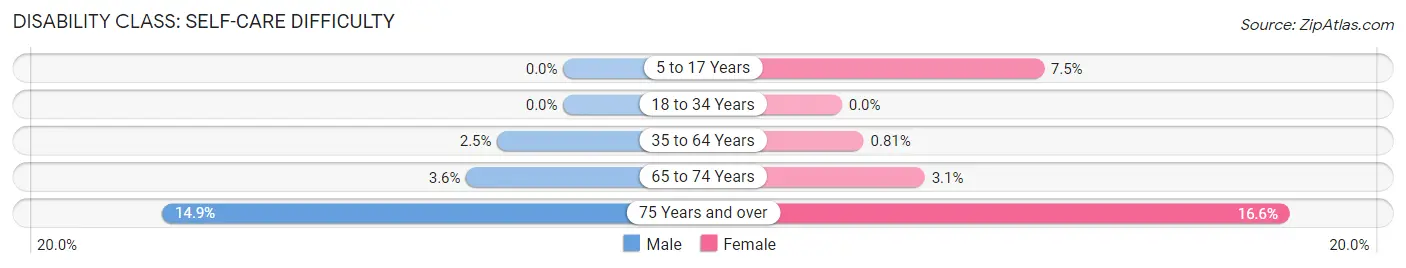
| Age Bracket | Male | Female |
| 5 to 17 Years | 0 (0.0%) | 36 (7.5%) |
| 18 to 34 Years | 0 (0.0%) | 0 (0.0%) |
| 35 to 64 Years | 50 (2.5%) | 17 (0.8%) |
| 65 to 74 Years | 20 (3.6%) | 17 (3.1%) |
| 75 Years and over | 31 (14.9%) | 158 (16.6%) |
Technology Access in Munhall borough
Computing Device Access in Munhall borough
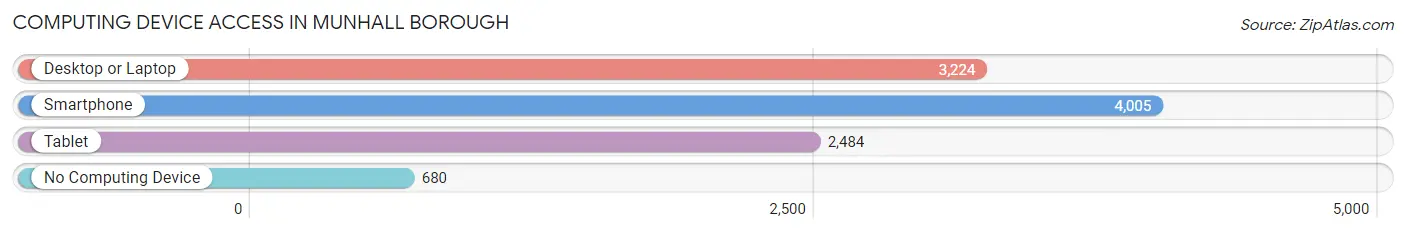
| Device Type | # Households | % Households |
| Desktop or Laptop | 3,224 | 62.6% |
| Smartphone | 4,005 | 77.8% |
| Tablet | 2,484 | 48.2% |
| No Computing Device | 680 | 13.2% |
| Total | 5,148 | 100.0% |
Internet Access in Munhall borough
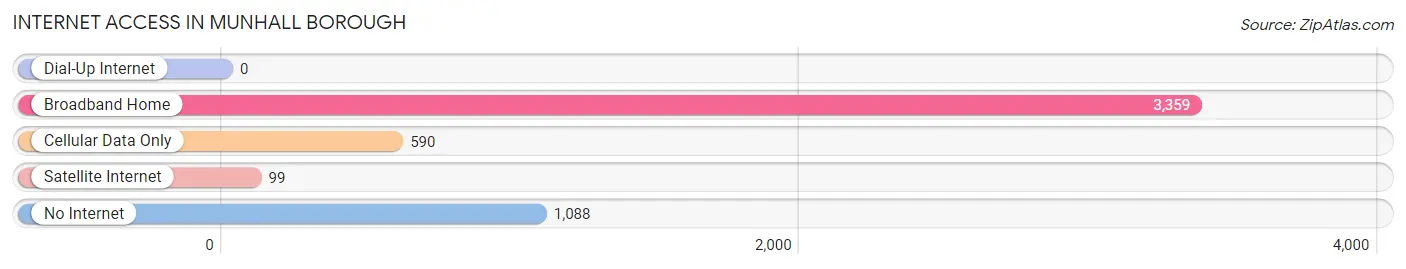
| Internet Type | # Households | % Households |
| Dial-Up Internet | 0 | 0.0% |
| Broadband Home | 3,359 | 65.2% |
| Cellular Data Only | 590 | 11.5% |
| Satellite Internet | 99 | 1.9% |
| No Internet | 1,088 | 21.1% |
| Total | 5,148 | 100.0% |
Munhall borough Summary
Munhall Borough is a small borough located in Allegheny County, Pennsylvania. It is situated along the Monongahela River, just south of Pittsburgh. The borough was incorporated in 1876 and has a population of approximately 8,000 people.
Geography
Munhall Borough is located in the southwestern corner of Allegheny County, Pennsylvania. It is situated along the Monongahela River, just south of Pittsburgh. The borough is bordered by the boroughs of Homestead, West Homestead, and Whitaker, as well as the city of Pittsburgh. The borough is approximately 2.5 square miles in size and is located at an elevation of 890 feet.
The borough is located in the Allegheny Plateau region of Pennsylvania. The terrain is mostly flat, with some rolling hills. The borough is located in the humid continental climate zone, with hot summers and cold winters. The average annual temperature is around 50 degrees Fahrenheit.
Economy
Munhall Borough has a diverse economy. The borough is home to several large employers, including U.S. Steel, Allegheny Technologies, and the University of Pittsburgh Medical Center. The borough also has a number of small businesses, including restaurants, retail stores, and professional services.
The borough is also home to several industrial parks, which provide employment opportunities for local residents. The borough is also home to the Carnegie Science Center, which is a popular tourist attraction.
Demographics
As of the 2010 census, the population of Munhall Borough was 8,073. The racial makeup of the borough was 79.3% White, 15.2% African American, 0.3% Native American, 1.2% Asian, 0.1% Pacific Islander, and 3.9% from other races. Hispanic or Latino of any race were 2.3% of the population.
The median household income in the borough was $37,941, and the median family income was $45,941. The per capita income was $20,945. About 11.3% of families and 14.2% of the population were below the poverty line, including 22.2% of those under age 18 and 8.2% of those age 65 or over.
Conclusion
Munhall Borough is a small borough located in Allegheny County, Pennsylvania. It is situated along the Monongahela River, just south of Pittsburgh. The borough was incorporated in 1876 and has a population of approximately 8,000 people. The borough has a diverse economy, with several large employers and a number of small businesses. The population of the borough is mostly White, with a significant African American population. The median household income in the borough is $37,941, and the median family income is $45,941. The per capita income is $20,945.
Common Questions
What is Per Capita Income in Munhall borough?
Per Capita income in Munhall borough is $33,373.
What is the Median Family Income in Munhall borough?
Median Family Income in Munhall borough is $73,571.
What is the Median Household income in Munhall borough?
Median Household Income in Munhall borough is $47,879.
What is Income or Wage Gap in Munhall borough?
Income or Wage Gap in Munhall borough is 20.2%.
Women in Munhall borough earn 79.8 cents for every dollar earned by a man.
What is Inequality or Gini Index in Munhall borough?
Inequality or Gini Index in Munhall borough is 0.46.
What is the Total Population of Munhall borough?
Total Population of Munhall borough is 10,738.
What is the Total Male Population of Munhall borough?
Total Male Population of Munhall borough is 5,003.
What is the Total Female Population of Munhall borough?
Total Female Population of Munhall borough is 5,735.
What is the Ratio of Males per 100 Females in Munhall borough?
There are 87.24 Males per 100 Females in Munhall borough.
What is the Ratio of Females per 100 Males in Munhall borough?
There are 114.63 Females per 100 Males in Munhall borough.
What is the Median Population Age in Munhall borough?
Median Population Age in Munhall borough is 44.9 Years.
What is the Average Family Size in Munhall borough
Average Family Size in Munhall borough is 3.0 People.
What is the Average Household Size in Munhall borough
Average Household Size in Munhall borough is 2.1 People.
How Large is the Labor Force in Munhall borough?
There are 5,656 People in the Labor Forcein in Munhall borough.
What is the Percentage of People in the Labor Force in Munhall borough?
63.2% of People are in the Labor Force in Munhall borough.
What is the Unemployment Rate in Munhall borough?
Unemployment Rate in Munhall borough is 6.6%.