Lattimer, PA Map & Demographics
Lattimer Map
Lattimer Overview
$37,679
PER CAPITA INCOME
$91,916
AVG FAMILY INCOME
0.36
INEQUALITY / GINI INDEX
584
TOTAL POPULATION
251
MALE POPULATION
333
FEMALE POPULATION
75.38
MALES / 100 FEMALES
132.67
FEMALES / 100 MALES
52.9
MEDIAN AGE
2.9
AVG FAMILY SIZE
1.6
AVG HOUSEHOLD SIZE
321
LABOR FORCE [ PEOPLE ]
56.7%
PERCENT IN LABOR FORCE
Income in Lattimer
Income Overview in Lattimer
| Characteristic | Number | Measure |
| Per Capita Income | 584 | $37,679 |
| Median Family Income | 118 | $91,916 |
| Mean Family Income | 118 | $104,856 |
| Median Household Income | 363 | $0 |
| Mean Household Income | 363 | $58,358 |
| Income Deficit | 118 | $0 |
| Wage / Income Gap (%) | 584 | 0.00% |
| Wage / Income Gap ($) | 584 | 100.00¢ per $1 |
| Gini / Inequality Index | 584 | 0.36 |
Earnings by Sex in Lattimer
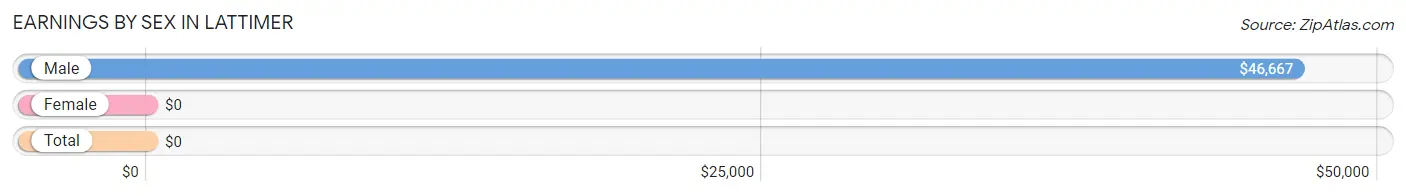
| Sex | Number | Average Earnings |
| Male | 70 (20.8%) | $46,667 |
| Female | 266 (79.2%) | $0 |
| Total | 336 (100.0%) | $0 |
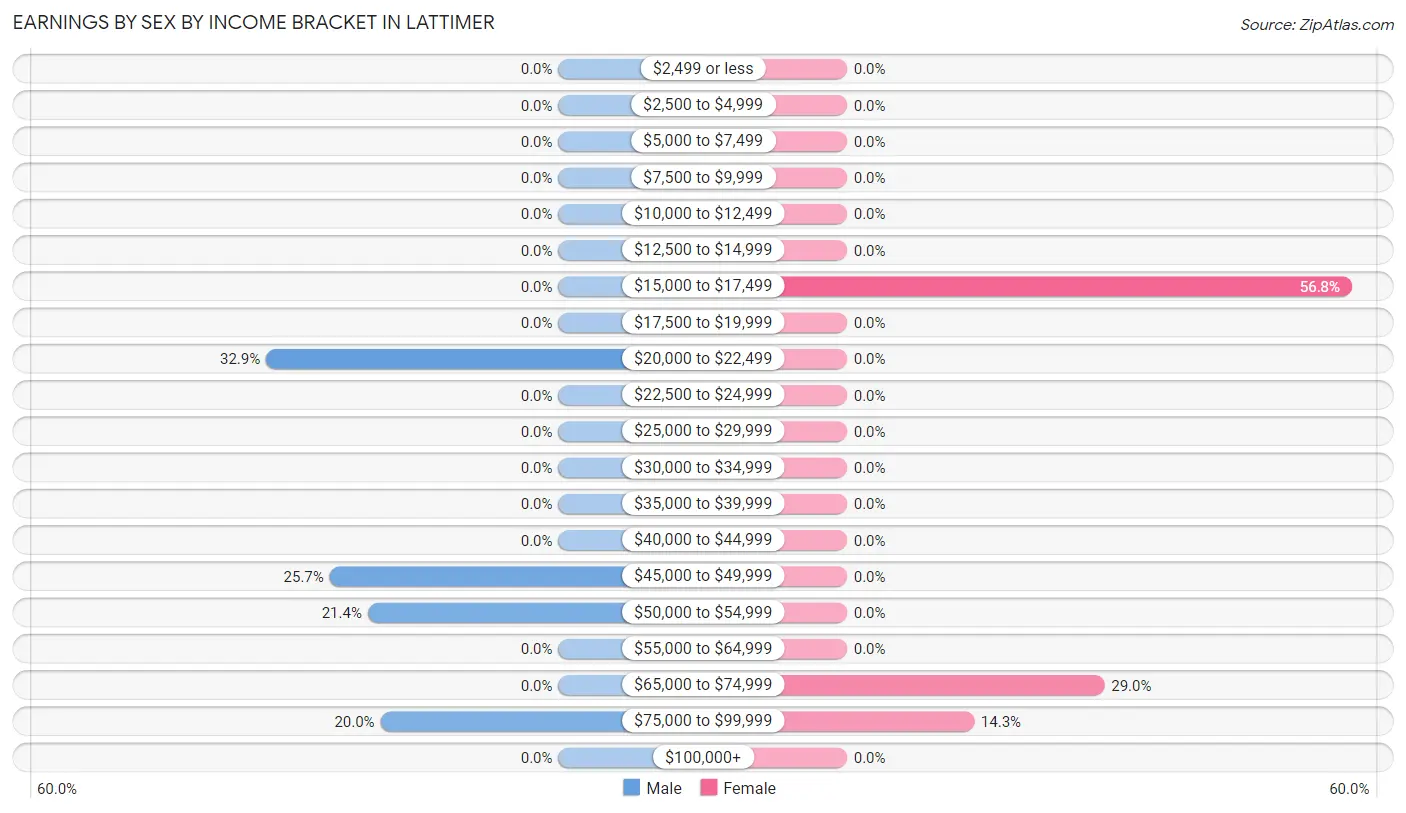
Earnings by Sex by Income Bracket in Lattimer
The most common earnings brackets in Lattimer are $20,000 to $22,499 for men (23 | 32.9%) and $15,000 to $17,499 for women (151 | 56.8%).
| Income | Male | Female |
| $2,499 or less | 0 (0.0%) | 0 (0.0%) |
| $2,500 to $4,999 | 0 (0.0%) | 0 (0.0%) |
| $5,000 to $7,499 | 0 (0.0%) | 0 (0.0%) |
| $7,500 to $9,999 | 0 (0.0%) | 0 (0.0%) |
| $10,000 to $12,499 | 0 (0.0%) | 0 (0.0%) |
| $12,500 to $14,999 | 0 (0.0%) | 0 (0.0%) |
| $15,000 to $17,499 | 0 (0.0%) | 151 (56.8%) |
| $17,500 to $19,999 | 0 (0.0%) | 0 (0.0%) |
| $20,000 to $22,499 | 23 (32.9%) | 0 (0.0%) |
| $22,500 to $24,999 | 0 (0.0%) | 0 (0.0%) |
| $25,000 to $29,999 | 0 (0.0%) | 0 (0.0%) |
| $30,000 to $34,999 | 0 (0.0%) | 0 (0.0%) |
| $35,000 to $39,999 | 0 (0.0%) | 0 (0.0%) |
| $40,000 to $44,999 | 0 (0.0%) | 0 (0.0%) |
| $45,000 to $49,999 | 18 (25.7%) | 0 (0.0%) |
| $50,000 to $54,999 | 15 (21.4%) | 0 (0.0%) |
| $55,000 to $64,999 | 0 (0.0%) | 0 (0.0%) |
| $65,000 to $74,999 | 0 (0.0%) | 77 (28.9%) |
| $75,000 to $99,999 | 14 (20.0%) | 38 (14.3%) |
| $100,000+ | 0 (0.0%) | 0 (0.0%) |
| Total | 70 (100.0%) | 266 (100.0%) |
Earnings by Sex by Educational Attainment in Lattimer
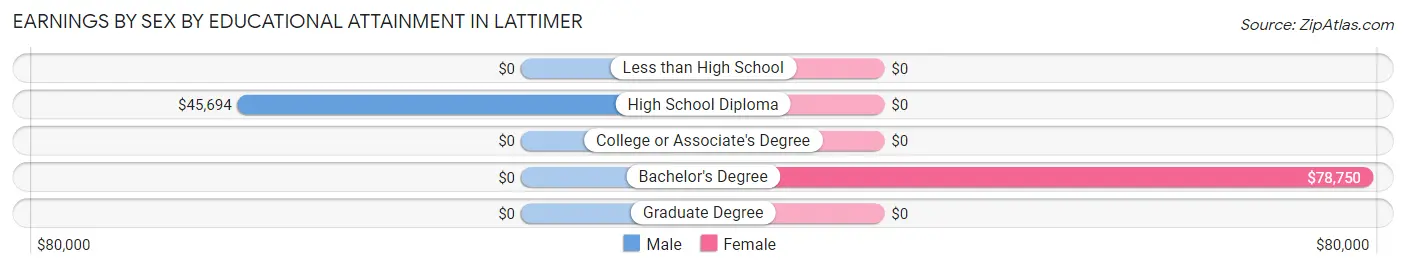
| Educational Attainment | Male Income | Female Income |
| Less than High School | - | - |
| High School Diploma | $45,694 | $0 |
| College or Associate's Degree | - | - |
| Bachelor's Degree | - | - |
| Graduate Degree | - | - |
| Total | $46,667 | $0 |
Family Income in Lattimer
Family Income Brackets in Lattimer
According to the Lattimer family income data, there are 77 families falling into the $75,000 to $99,999 income range, which is the most common income bracket and makes up 65.2% of all families.
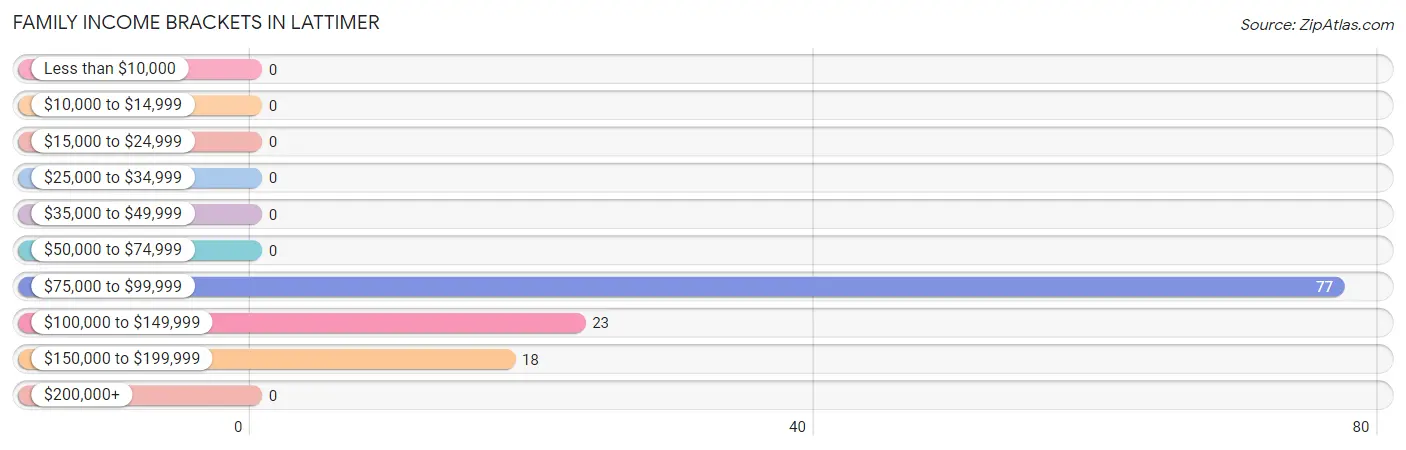
| Income Bracket | # Families | % Families |
| Less than $10,000 | 0 | 0.0% |
| $10,000 to $14,999 | 0 | 0.0% |
| $15,000 to $24,999 | 0 | 0.0% |
| $25,000 to $34,999 | 0 | 0.0% |
| $35,000 to $49,999 | 0 | 0.0% |
| $50,000 to $74,999 | 0 | 0.0% |
| $75,000 to $99,999 | 77 | 65.3% |
| $100,000 to $149,999 | 23 | 19.5% |
| $150,000 to $199,999 | 18 | 15.3% |
| $200,000+ | 0 | 0.0% |
Family Income by Famaliy Size in Lattimer
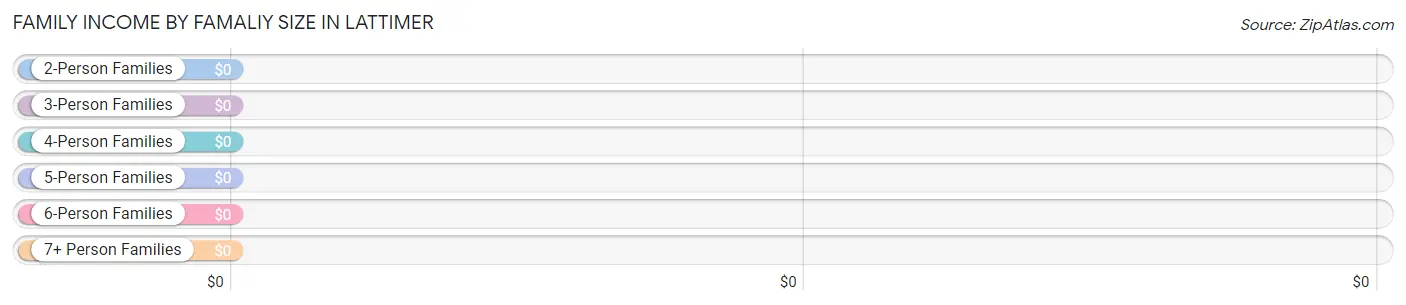
| Income Bracket | # Families | Median Income |
| 2-Person Families | 77 (65.2%) | $0 |
| 3-Person Families | 23 (19.5%) | $0 |
| 4-Person Families | 18 (15.2%) | $0 |
| 5-Person Families | 0 (0.0%) | $0 |
| 6-Person Families | 0 (0.0%) | $0 |
| 7+ Person Families | 0 (0.0%) | $0 |
| Total | 118 (100.0%) | $91,916 |
Family Income by Number of Earners in Lattimer
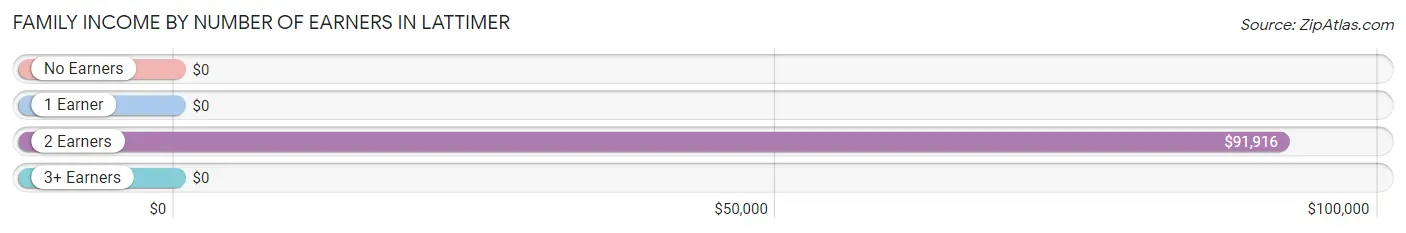
| Number of Earners | # Families | Median Income |
| No Earners | 0 (0.0%) | $0 |
| 1 Earner | 0 (0.0%) | $0 |
| 2 Earners | 118 (100.0%) | $91,916 |
| 3+ Earners | 0 (0.0%) | $0 |
| Total | 118 (100.0%) | $91,916 |
Household Income in Lattimer
Household Income Brackets in Lattimer
With 138 households falling in the category, the $25,000 to $34,999 income range is the most frequent in Lattimer, accounting for 38.0% of all households.
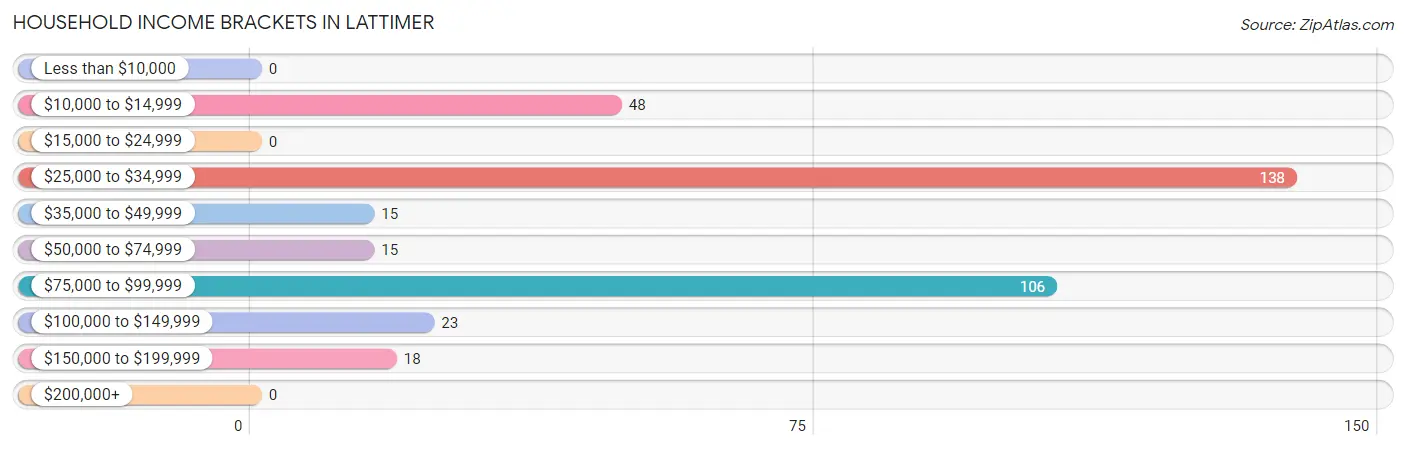
| Income Bracket | # Households | % Households |
| Less than $10,000 | 0 | 0.0% |
| $10,000 to $14,999 | 48 | 13.2% |
| $15,000 to $24,999 | 0 | 0.0% |
| $25,000 to $34,999 | 138 | 38.0% |
| $35,000 to $49,999 | 15 | 4.1% |
| $50,000 to $74,999 | 15 | 4.1% |
| $75,000 to $99,999 | 106 | 29.2% |
| $100,000 to $149,999 | 23 | 6.3% |
| $150,000 to $199,999 | 18 | 5.0% |
| $200,000+ | 0 | 0.0% |
Household Income by Householder Age in Lattimer
The median household income in Lattimer is $0, with the highest median household income of $92,250 found in the 45 to 64 years age bracket for the primary householder. A total of 85 households (23.4%) fall into this category.
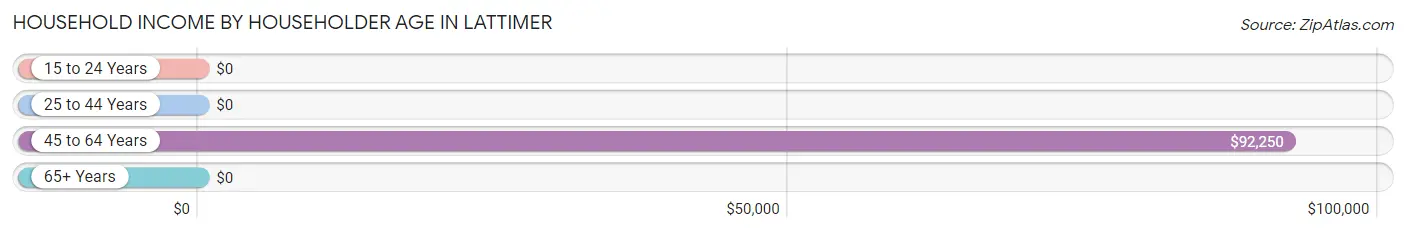
| Income Bracket | # Households | Median Income |
| 15 to 24 Years | 0 (0.0%) | $0 |
| 25 to 44 Years | 138 (38.0%) | $0 |
| 45 to 64 Years | 85 (23.4%) | $92,250 |
| 65+ Years | 140 (38.6%) | $0 |
| Total | 363 (100.0%) | $0 |
Poverty in Lattimer
Income Below Poverty by Sex and Age in Lattimer
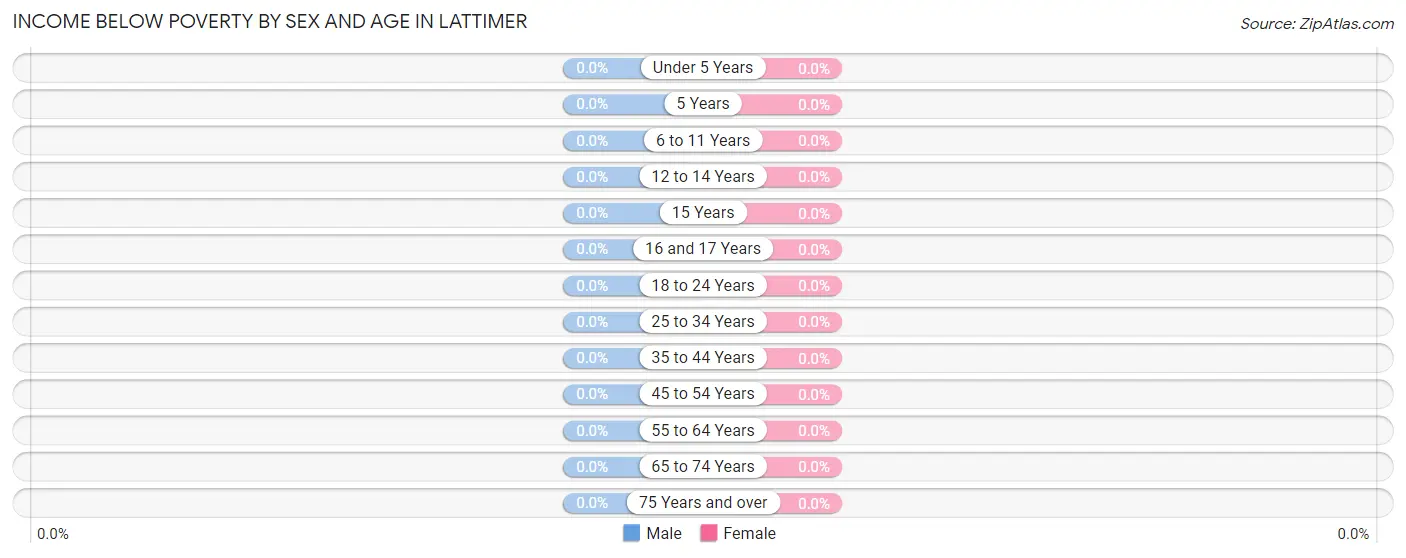
| Age Bracket | Male | Female |
| Under 5 Years | 0 (0.0%) | 0 (0.0%) |
| 5 Years | 0 (0.0%) | 0 (0.0%) |
| 6 to 11 Years | 0 (0.0%) | 0 (0.0%) |
| 12 to 14 Years | 0 (0.0%) | 0 (0.0%) |
| 15 Years | 0 (0.0%) | 0 (0.0%) |
| 16 and 17 Years | 0 (0.0%) | 0 (0.0%) |
| 18 to 24 Years | 0 (0.0%) | 0 (0.0%) |
| 25 to 34 Years | 0 (0.0%) | 0 (0.0%) |
| 35 to 44 Years | 0 (0.0%) | 0 (0.0%) |
| 45 to 54 Years | 0 (0.0%) | 0 (0.0%) |
| 55 to 64 Years | 0 (0.0%) | 0 (0.0%) |
| 65 to 74 Years | 0 (0.0%) | 0 (0.0%) |
| 75 Years and over | 0 (0.0%) | 0 (0.0%) |
| Total | 0 (0.0%) | 0 (0.0%) |
Income Above Poverty by Sex and Age in Lattimer
According to the poverty statistics in Lattimer, males aged 12 to 14 years and females aged 18 to 24 years are the age groups that are most secure financially, with 100.0% of males and 100.0% of females in these age groups living above the poverty line.
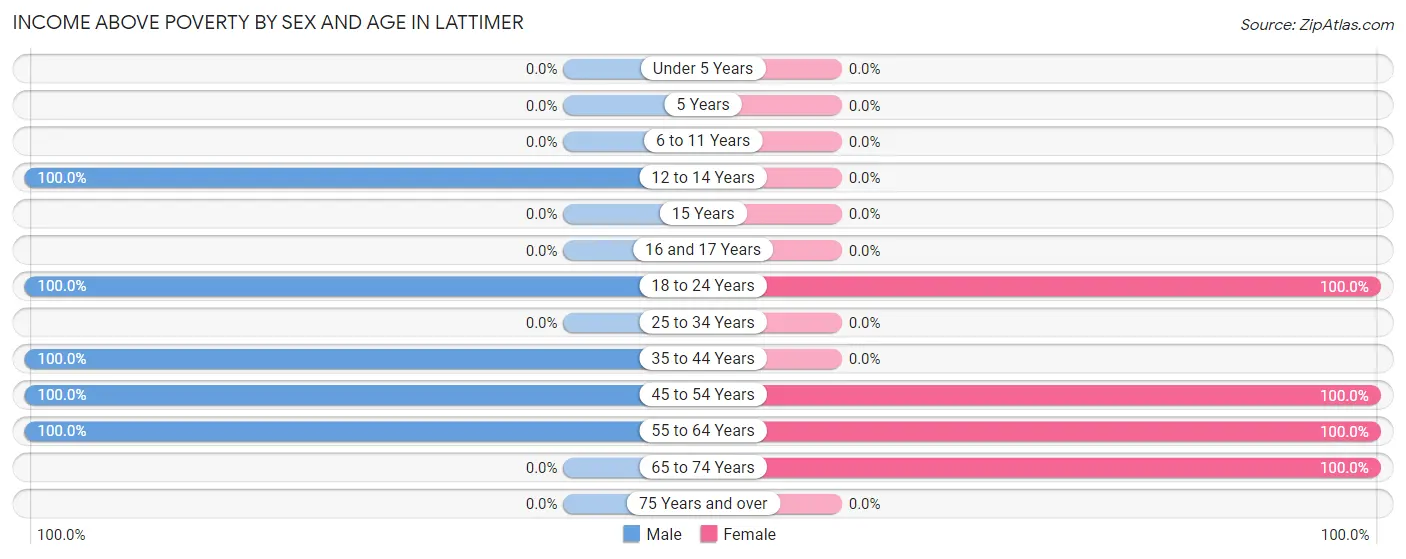
| Age Bracket | Male | Female |
| Under 5 Years | 0 (0.0%) | 0 (0.0%) |
| 5 Years | 0 (0.0%) | 0 (0.0%) |
| 6 to 11 Years | 0 (0.0%) | 0 (0.0%) |
| 12 to 14 Years | 18 (100.0%) | 0 (0.0%) |
| 15 Years | 0 (0.0%) | 0 (0.0%) |
| 16 and 17 Years | 0 (0.0%) | 0 (0.0%) |
| 18 to 24 Years | 25 (100.0%) | 19 (100.0%) |
| 25 to 34 Years | 0 (0.0%) | 0 (0.0%) |
| 35 to 44 Years | 138 (100.0%) | 0 (0.0%) |
| 45 to 54 Years | 55 (100.0%) | 42 (100.0%) |
| 55 to 64 Years | 15 (100.0%) | 15 (100.0%) |
| 65 to 74 Years | 0 (0.0%) | 257 (100.0%) |
| 75 Years and over | 0 (0.0%) | 0 (0.0%) |
| Total | 251 (100.0%) | 333 (100.0%) |
Income Below Poverty Among Married-Couple Families in Lattimer
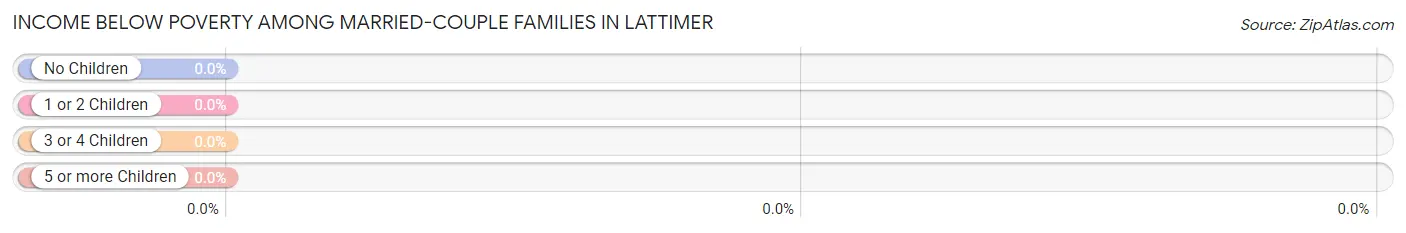
| Children | Above Poverty | Below Poverty |
| No Children | 23 (100.0%) | 0 (0.0%) |
| 1 or 2 Children | 18 (100.0%) | 0 (0.0%) |
| 3 or 4 Children | 0 (0.0%) | 0 (0.0%) |
| 5 or more Children | 0 (0.0%) | 0 (0.0%) |
| Total | 41 (100.0%) | 0 (0.0%) |
Income Below Poverty Among Single-Parent Households in Lattimer
| Children | Single Father | Single Mother |
| No Children | 0 (0.0%) | 0 (0.0%) |
| 1 or 2 Children | 0 (0.0%) | 0 (0.0%) |
| 3 or 4 Children | 0 (0.0%) | 0 (0.0%) |
| 5 or more Children | 0 (0.0%) | 0 (0.0%) |
| Total | 0 (0.0%) | 0 (0.0%) |
Income Below Poverty Among Married-Couple vs Single-Parent Households in Lattimer
| Children | Married-Couple Families | Single-Parent Households |
| No Children | 0 (0.0%) | 0 (0.0%) |
| 1 or 2 Children | 0 (0.0%) | 0 (0.0%) |
| 3 or 4 Children | 0 (0.0%) | 0 (0.0%) |
| 5 or more Children | 0 (0.0%) | 0 (0.0%) |
| Total | 0 (0.0%) | 0 (0.0%) |
Race in Lattimer
The most populous races in Lattimer are , and White / Caucasian (584 | 100.0%).
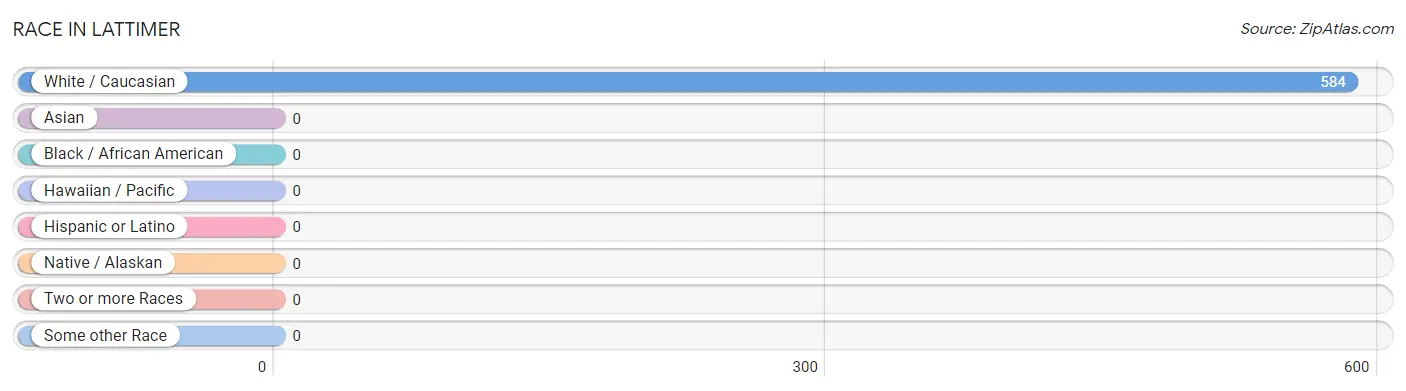
| Race | # Population | % Population |
| Asian | 0 | 0.0% |
| Black / African American | 0 | 0.0% |
| Hawaiian / Pacific | 0 | 0.0% |
| Hispanic or Latino | 0 | 0.0% |
| Native / Alaskan | 0 | 0.0% |
| White / Caucasian | 584 | 100.0% |
| Two or more Races | 0 | 0.0% |
| Some other Race | 0 | 0.0% |
| Total | 584 | 100.0% |
Ancestry in Lattimer
The most populous ancestries reported in Lattimer are German (215 | 36.8%), Ukrainian (194 | 33.2%), Italian (186 | 31.9%), Slovak (71 | 12.2%), and Irish (62 | 10.6%), together accounting for 124.7% of all Lattimer residents.
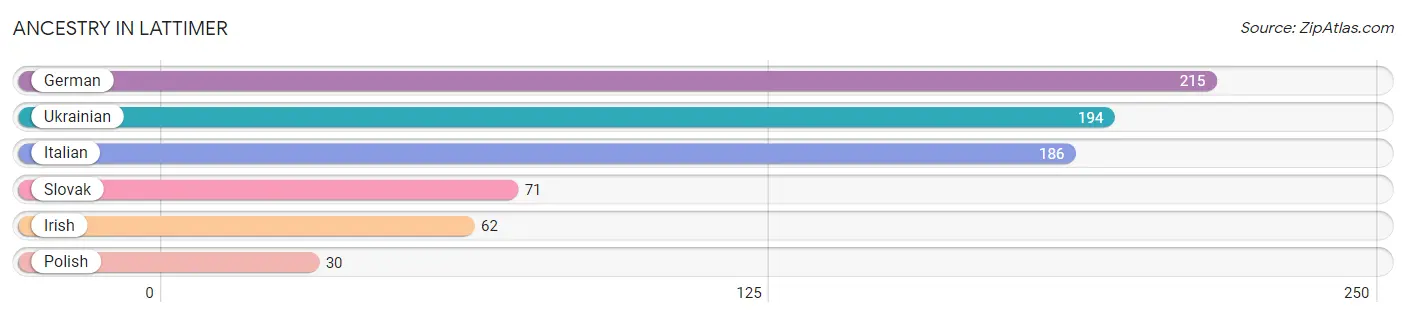
| Ancestry | # Population | % Population |
| German | 215 | 36.8% |
| Irish | 62 | 10.6% |
| Italian | 186 | 31.9% |
| Polish | 30 | 5.1% |
| Slovak | 71 | 12.2% |
| Ukrainian | 194 | 33.2% | View All 6 Rows |
Immigrants in Lattimer

| Immigration Origin | # Population | % Population | View All 0 Rows |
Sex and Age in Lattimer
Sex and Age in Lattimer
The most populous age groups in Lattimer are 40 to 44 Years (138 | 55.0%) for men and 65 to 69 Years (209 | 62.8%) for women.
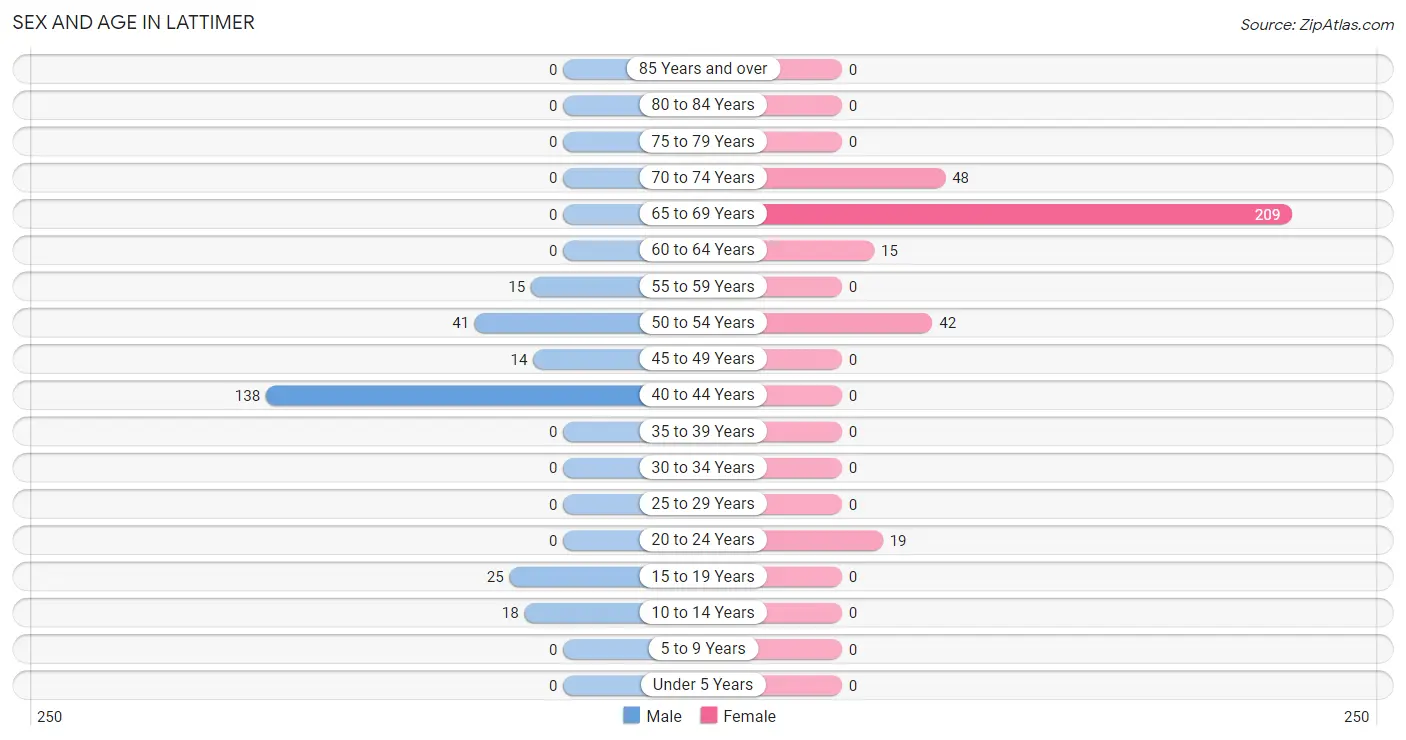
| Age Bracket | Male | Female |
| Under 5 Years | 0 (0.0%) | 0 (0.0%) |
| 5 to 9 Years | 0 (0.0%) | 0 (0.0%) |
| 10 to 14 Years | 18 (7.2%) | 0 (0.0%) |
| 15 to 19 Years | 25 (10.0%) | 0 (0.0%) |
| 20 to 24 Years | 0 (0.0%) | 19 (5.7%) |
| 25 to 29 Years | 0 (0.0%) | 0 (0.0%) |
| 30 to 34 Years | 0 (0.0%) | 0 (0.0%) |
| 35 to 39 Years | 0 (0.0%) | 0 (0.0%) |
| 40 to 44 Years | 138 (55.0%) | 0 (0.0%) |
| 45 to 49 Years | 14 (5.6%) | 0 (0.0%) |
| 50 to 54 Years | 41 (16.3%) | 42 (12.6%) |
| 55 to 59 Years | 15 (6.0%) | 0 (0.0%) |
| 60 to 64 Years | 0 (0.0%) | 15 (4.5%) |
| 65 to 69 Years | 0 (0.0%) | 209 (62.8%) |
| 70 to 74 Years | 0 (0.0%) | 48 (14.4%) |
| 75 to 79 Years | 0 (0.0%) | 0 (0.0%) |
| 80 to 84 Years | 0 (0.0%) | 0 (0.0%) |
| 85 Years and over | 0 (0.0%) | 0 (0.0%) |
| Total | 251 (100.0%) | 333 (100.0%) |
Families and Households in Lattimer
Median Family Size in Lattimer
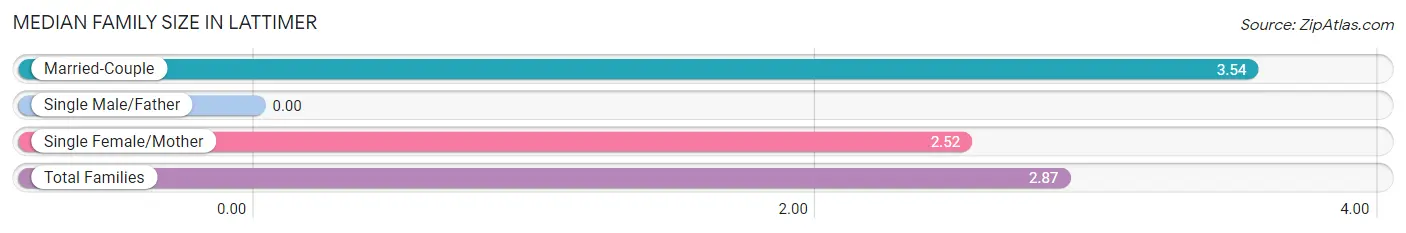
| Family Type | # Families | Family Size |
| Married-Couple | 41 (34.7%) | 3.54 |
| Single Male/Father | 0 (0.0%) | - |
| Single Female/Mother | 77 (65.2%) | 2.52 |
| Total Families | 118 (100.0%) | 2.87 |
Median Household Size in Lattimer
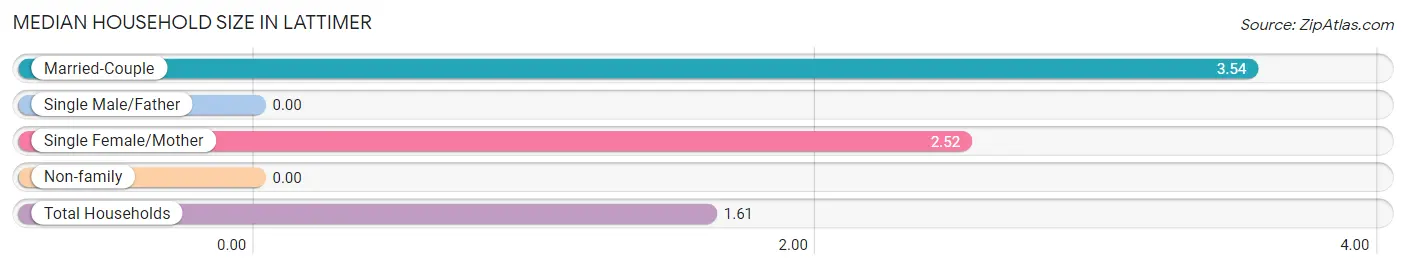
| Household Type | # Households | Household Size |
| Married-Couple | 41 (11.3%) | 3.54 |
| Single Male/Father | 0 (0.0%) | - |
| Single Female/Mother | 77 (21.2%) | 2.52 |
| Non-family | 245 (67.5%) | - |
| Total Households | 363 (100.0%) | 1.61 |
Household Size by Marriage Status in Lattimer
Out of a total of 363 households in Lattimer, 118 (32.5%) are family households, while 245 (67.5%) are nonfamily households. The most numerous type of family households are 2-person households, comprising 77, and the most common type of nonfamily households are 1-person households, comprising 245.
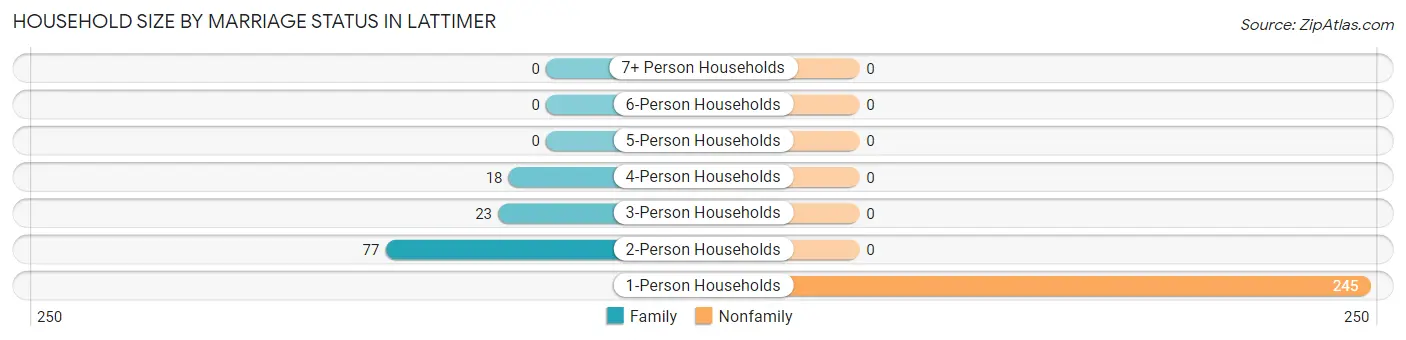
| Household Size | Family Households | Nonfamily Households |
| 1-Person Households | - | 245 (67.5%) |
| 2-Person Households | 77 (21.2%) | 0 (0.0%) |
| 3-Person Households | 23 (6.3%) | 0 (0.0%) |
| 4-Person Households | 18 (5.0%) | 0 (0.0%) |
| 5-Person Households | 0 (0.0%) | 0 (0.0%) |
| 6-Person Households | 0 (0.0%) | 0 (0.0%) |
| 7+ Person Households | 0 (0.0%) | 0 (0.0%) |
| Total | 118 (32.5%) | 245 (67.5%) |
Female Fertility in Lattimer
Fertility by Age in Lattimer
| Age Bracket | Women with Births | Births / 1,000 Women |
| 15 to 19 years | 0 (0.0%) | 0.0 |
| 20 to 34 years | 0 (0.0%) | 0.0 |
| 35 to 50 years | 0 (0.0%) | 0.0 |
| Total | 0 (0.0%) | 0.0 |
Fertility by Age by Marriage Status in Lattimer
| Age Bracket | Married | Unmarried |
| 15 to 19 years | 0 (0.0%) | 0 (0.0%) |
| 20 to 34 years | 0 (0.0%) | 0 (0.0%) |
| 35 to 50 years | 0 (0.0%) | 0 (0.0%) |
| Total | 0 (0.0%) | 0 (0.0%) |
Fertility by Education in Lattimer
| Educational Attainment | Women with Births | Births / 1,000 Women |
| Less than High School | 0 (0.0%) | 0.0 |
| High School Diploma | 0 (0.0%) | 0.0 |
| College or Associate's Degree | 0 (0.0%) | 0.0 |
| Bachelor's Degree | 0 (0.0%) | 0.0 |
| Graduate Degree | 0 (0.0%) | 0.0 |
| Total | 0 (0.0%) | 0.0 |
Fertility by Education by Marriage Status in Lattimer
| Educational Attainment | Married | Unmarried |
| Less than High School | 0 (0.0%) | 0 (0.0%) |
| High School Diploma | 0 (0.0%) | 0 (0.0%) |
| College or Associate's Degree | 0 (0.0%) | 0 (0.0%) |
| Bachelor's Degree | 0 (0.0%) | 0 (0.0%) |
| Graduate Degree | 0 (0.0%) | 0 (0.0%) |
| Total | 0 (0.0%) | 0 (0.0%) |
Employment Characteristics in Lattimer
Employment by Class of Employer in Lattimer
Among the 321 employed individuals in Lattimer, private company employees (180 | 56.1%), not-for-profit organizations (100 | 31.1%), and self-employed (not incorporated) (23 | 7.2%) make up the most common classes of employment.
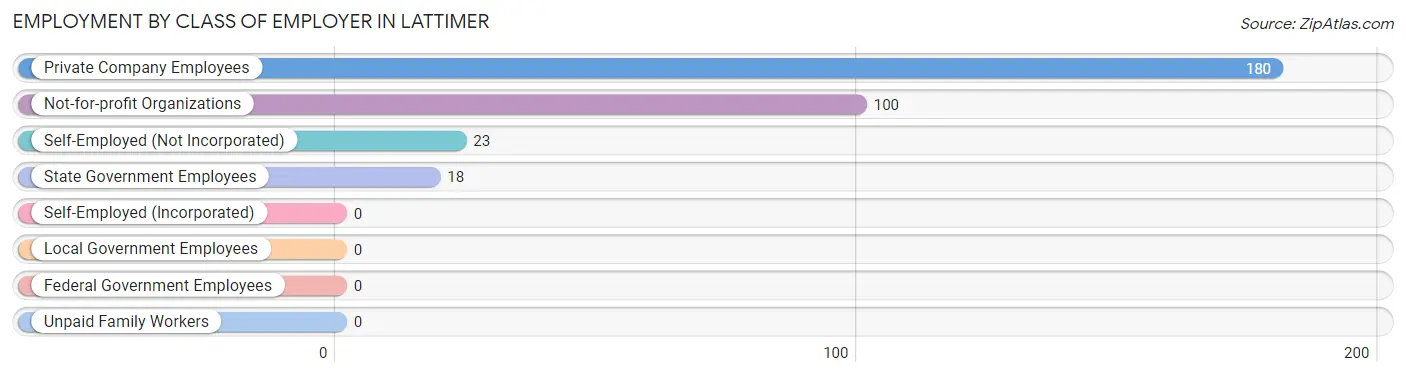
| Employer Class | # Employees | % Employees |
| Private Company Employees | 180 | 56.1% |
| Self-Employed (Incorporated) | 0 | 0.0% |
| Self-Employed (Not Incorporated) | 23 | 7.2% |
| Not-for-profit Organizations | 100 | 31.1% |
| Local Government Employees | 0 | 0.0% |
| State Government Employees | 18 | 5.6% |
| Federal Government Employees | 0 | 0.0% |
| Unpaid Family Workers | 0 | 0.0% |
| Total | 321 | 100.0% |
Employment Status by Age in Lattimer
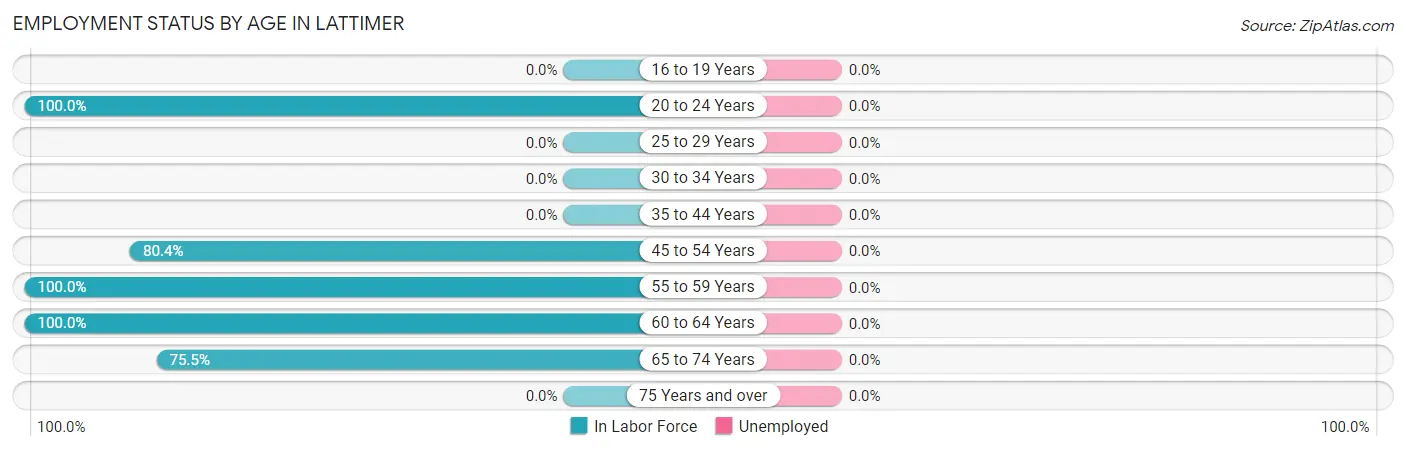
| Age Bracket | In Labor Force | Unemployed |
| 16 to 19 Years | 0 (0.0%) | 0 (0.0%) |
| 20 to 24 Years | 19 (100.0%) | 0 (0.0%) |
| 25 to 29 Years | 0 (0.0%) | 0 (0.0%) |
| 30 to 34 Years | 0 (0.0%) | 0 (0.0%) |
| 35 to 44 Years | 0 (0.0%) | 0 (0.0%) |
| 45 to 54 Years | 78 (80.4%) | 0 (0.0%) |
| 55 to 59 Years | 15 (100.0%) | 0 (0.0%) |
| 60 to 64 Years | 15 (100.0%) | 0 (0.0%) |
| 65 to 74 Years | 194 (75.5%) | 0 (0.0%) |
| 75 Years and over | 0 (0.0%) | 0 (0.0%) |
| Total | 321 (56.7%) | 0 (0.0%) |
Employment Status by Educational Attainment in Lattimer
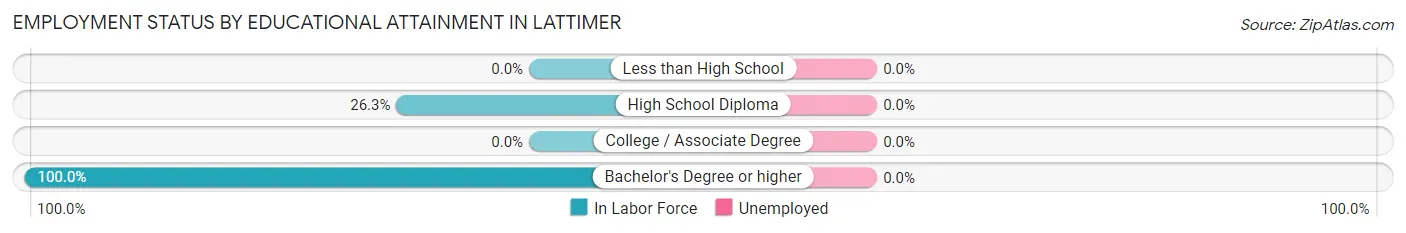
| Educational Attainment | In Labor Force | Unemployed |
| Less than High School | 0 (0.0%) | 0 (0.0%) |
| High School Diploma | 56 (26.3%) | 0 (0.0%) |
| College / Associate Degree | 0 (0.0%) | 0 (0.0%) |
| Bachelor's Degree or higher | 52 (100.0%) | 0 (0.0%) |
| Total | 108 (40.8%) | 0 (0.0%) |
Employment Occupations by Sex in Lattimer
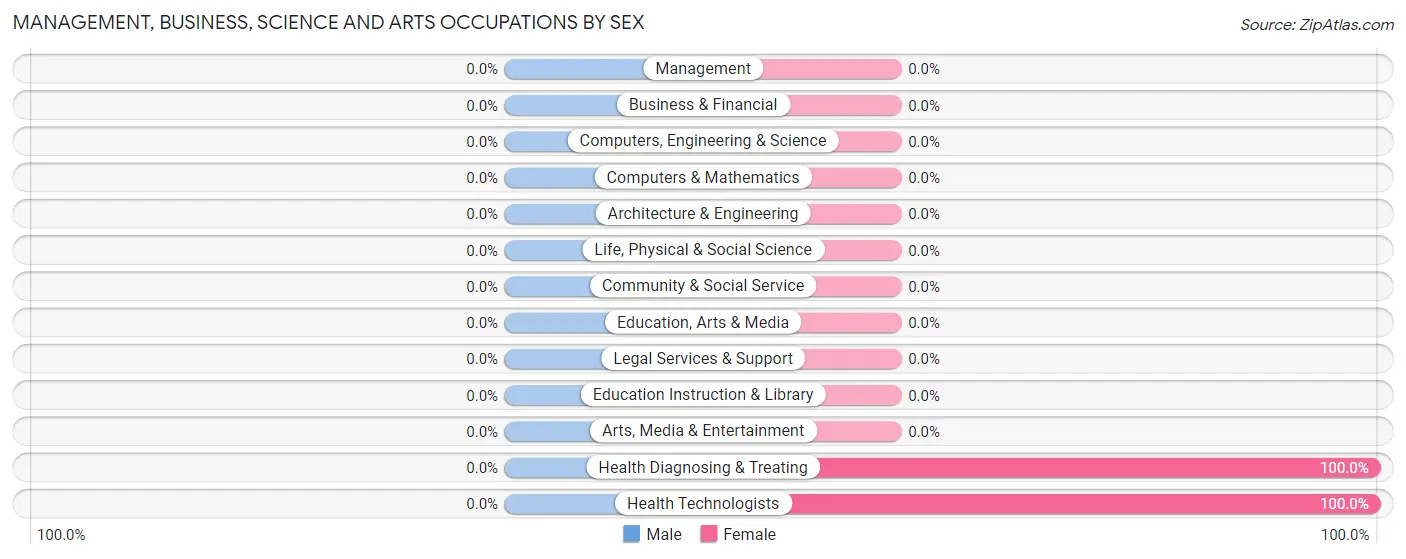
Management, Business, Science and Arts Occupations
The most common Management, Business, Science and Arts occupations in Lattimer are Health Diagnosing & Treating (115 | 35.8%), and Health Technologists (115 | 35.8%).
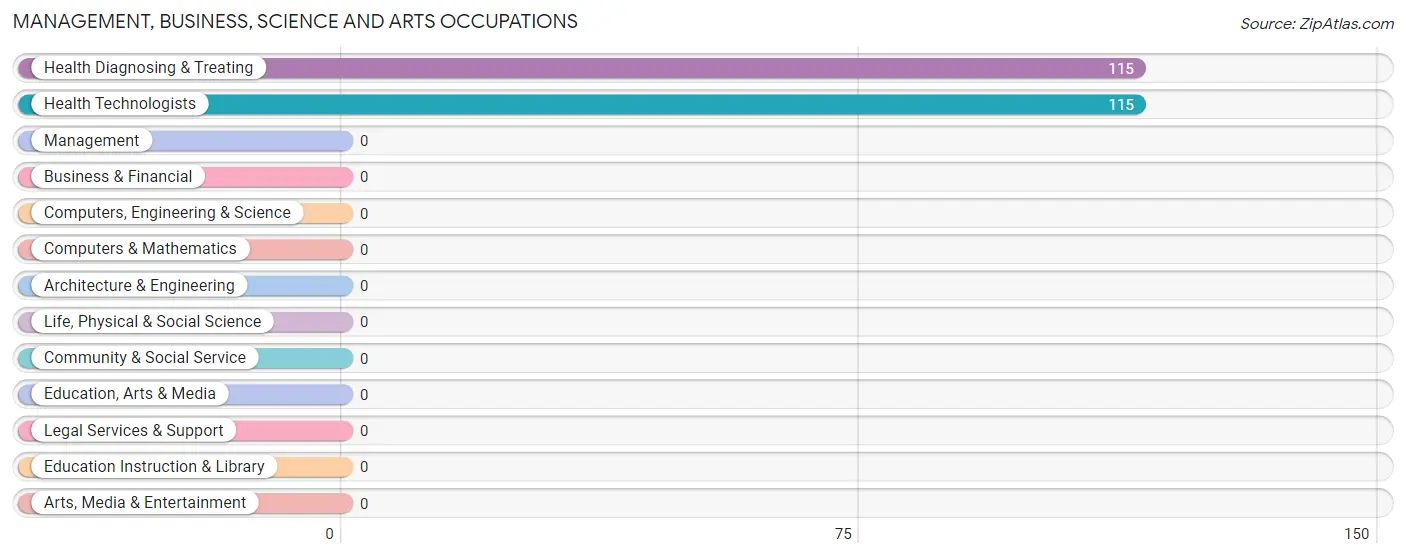
Management, Business, Science and Arts Occupations by Sex
| Occupation | Male | Female |
| Management | 0 (0.0%) | 0 (0.0%) |
| Business & Financial | 0 (0.0%) | 0 (0.0%) |
| Computers, Engineering & Science | 0 (0.0%) | 0 (0.0%) |
| Computers & Mathematics | 0 (0.0%) | 0 (0.0%) |
| Architecture & Engineering | 0 (0.0%) | 0 (0.0%) |
| Life, Physical & Social Science | 0 (0.0%) | 0 (0.0%) |
| Community & Social Service | 0 (0.0%) | 0 (0.0%) |
| Education, Arts & Media | 0 (0.0%) | 0 (0.0%) |
| Legal Services & Support | 0 (0.0%) | 0 (0.0%) |
| Education Instruction & Library | 0 (0.0%) | 0 (0.0%) |
| Arts, Media & Entertainment | 0 (0.0%) | 0 (0.0%) |
| Health Diagnosing & Treating | 0 (0.0%) | 115 (100.0%) |
| Health Technologists | 0 (0.0%) | 115 (100.0%) |
| Total (Category) | 0 (0.0%) | 115 (100.0%) |
| Total (Overall) | 70 (21.8%) | 251 (78.2%) |
Services Occupations
Services Occupations by Sex
| Occupation | Male | Female |
| Healthcare Support | 0 (0.0%) | 0 (0.0%) |
| Security & Protection | 0 (0.0%) | 0 (0.0%) |
| Firefighting & Prevention | 0 (0.0%) | 0 (0.0%) |
| Law Enforcement | 0 (0.0%) | 0 (0.0%) |
| Food Preparation & Serving | 0 (0.0%) | 0 (0.0%) |
| Cleaning & Maintenance | 0 (0.0%) | 0 (0.0%) |
| Personal Care & Service | 0 (0.0%) | 0 (0.0%) |
| Total (Category) | 0 (0.0%) | 0 (0.0%) |
| Total (Overall) | 70 (21.8%) | 251 (78.2%) |
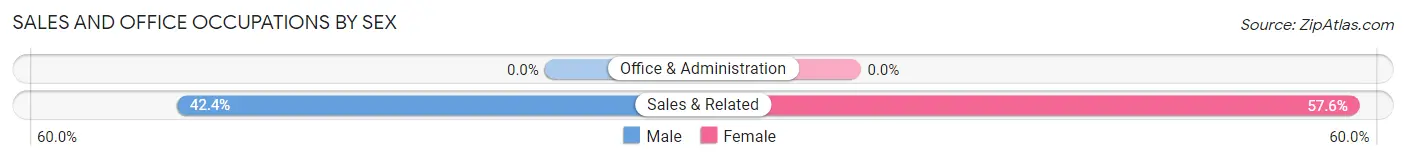
Sales and Office Occupations
The most common Sales and Office occupations in Lattimer are , and Sales & Related (33 | 10.3%).
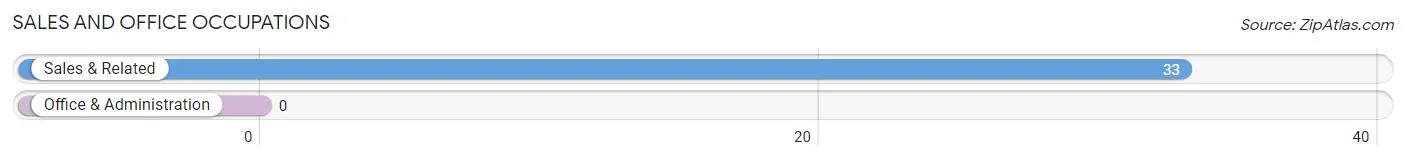
Sales and Office Occupations by Sex
| Occupation | Male | Female |
| Sales & Related | 14 (42.4%) | 19 (57.6%) |
| Office & Administration | 0 (0.0%) | 0 (0.0%) |
| Total (Category) | 14 (42.4%) | 19 (57.6%) |
| Total (Overall) | 70 (21.8%) | 251 (78.2%) |
Natural Resources, Construction and Maintenance Occupations
The most common Natural Resources, Construction and Maintenance occupations in Lattimer are , and Construction & Extraction (41 | 12.8%).
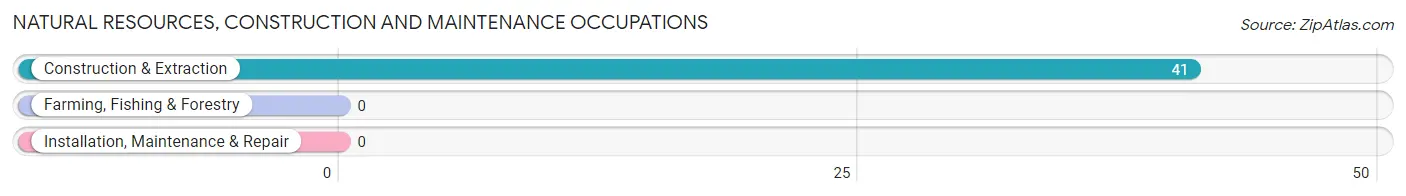
Natural Resources, Construction and Maintenance Occupations by Sex
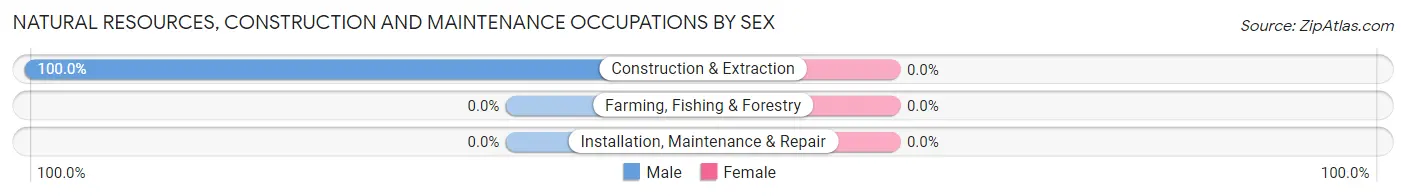
| Occupation | Male | Female |
| Farming, Fishing & Forestry | 0 (0.0%) | 0 (0.0%) |
| Construction & Extraction | 41 (100.0%) | 0 (0.0%) |
| Installation, Maintenance & Repair | 0 (0.0%) | 0 (0.0%) |
| Total (Category) | 41 (100.0%) | 0 (0.0%) |
| Total (Overall) | 70 (21.8%) | 251 (78.2%) |
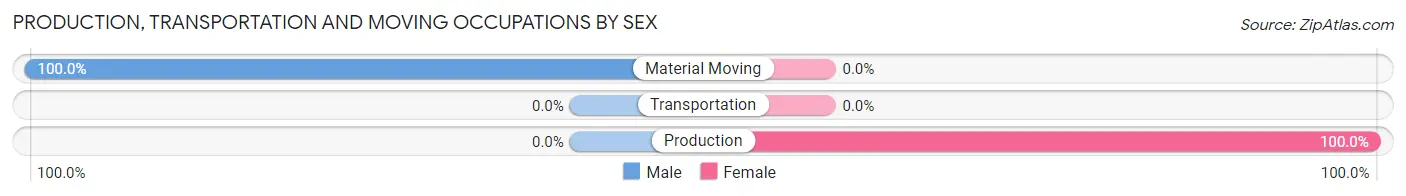
Production, Transportation and Moving Occupations
The most common Production, Transportation and Moving occupations in Lattimer are Production (117 | 36.4%), and Material Moving (15 | 4.7%).
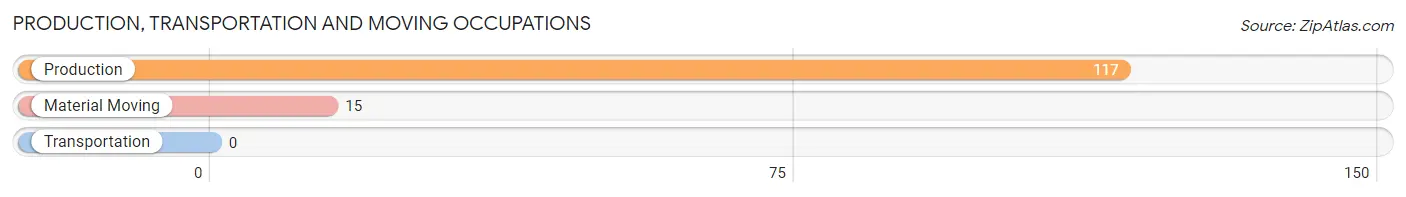
Production, Transportation and Moving Occupations by Sex
| Occupation | Male | Female |
| Production | 0 (0.0%) | 117 (100.0%) |
| Transportation | 0 (0.0%) | 0 (0.0%) |
| Material Moving | 15 (100.0%) | 0 (0.0%) |
| Total (Category) | 15 (11.4%) | 117 (88.6%) |
| Total (Overall) | 70 (21.8%) | 251 (78.2%) |
Employment Industries by Sex in Lattimer
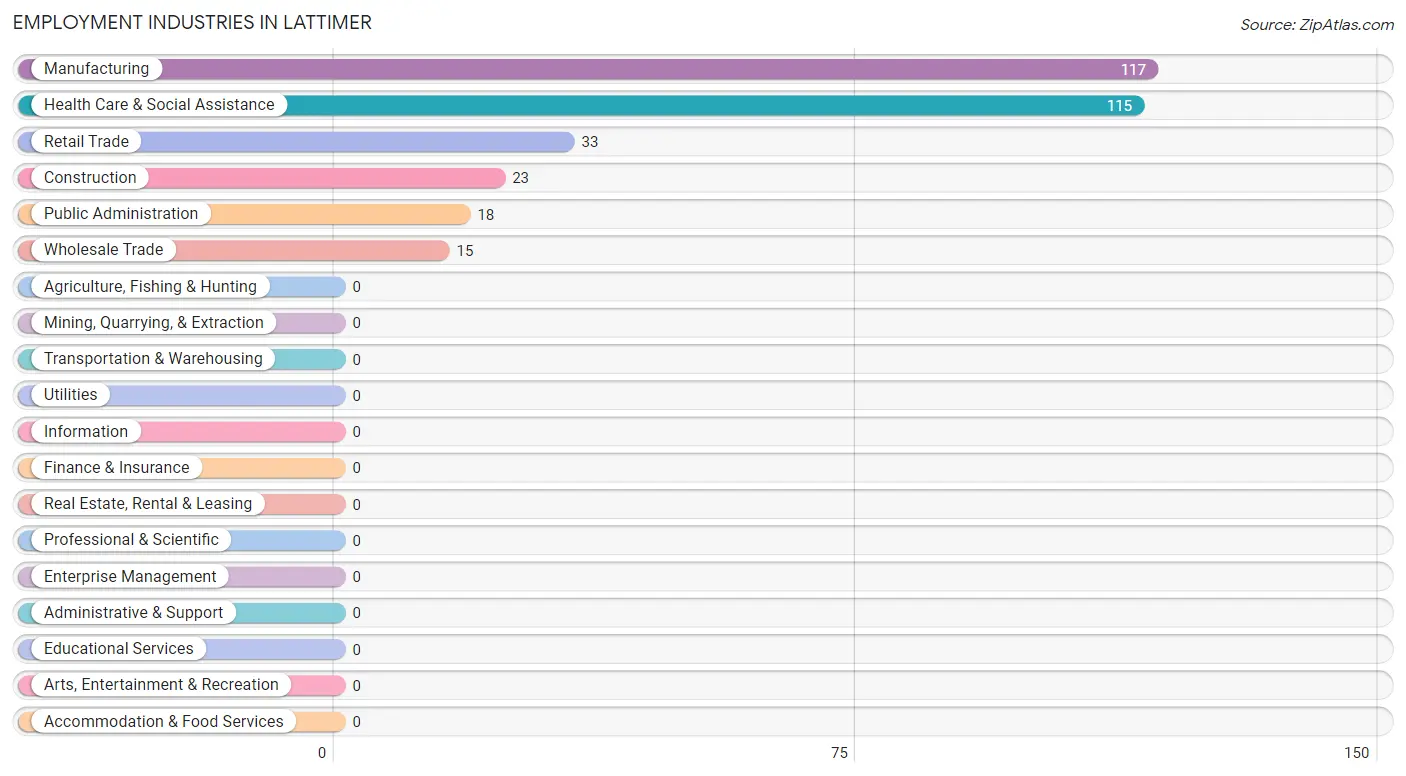
Employment Industries in Lattimer
The major employment industries in Lattimer include Manufacturing (117 | 36.4%), Health Care & Social Assistance (115 | 35.8%), Retail Trade (33 | 10.3%), Construction (23 | 7.2%), and Public Administration (18 | 5.6%).
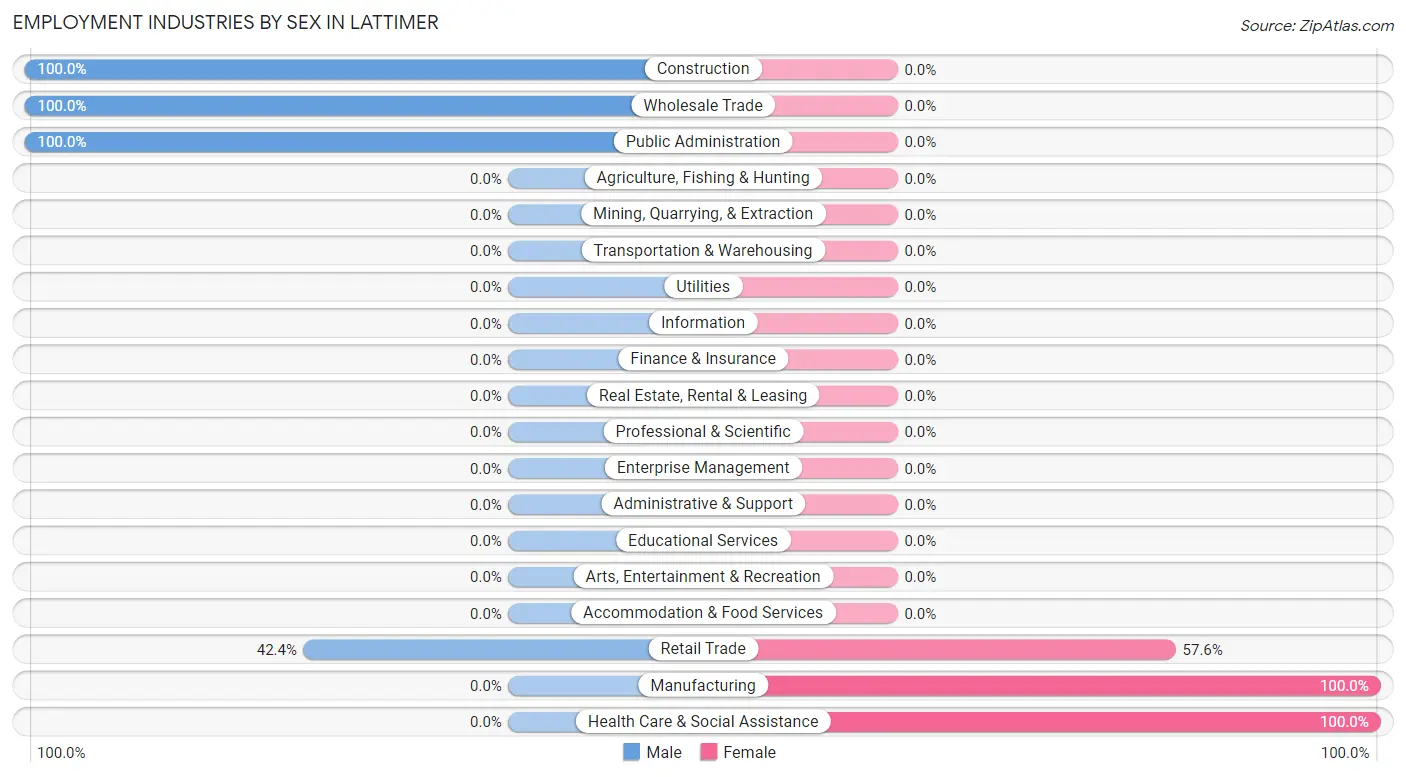
Employment Industries by Sex in Lattimer
The Lattimer industries that see more men than women are Construction (100.0%), Wholesale Trade (100.0%), and Public Administration (100.0%), whereas the industries that tend to have a higher number of women are Manufacturing (100.0%), Health Care & Social Assistance (100.0%), and Retail Trade (57.6%).
| Industry | Male | Female |
| Agriculture, Fishing & Hunting | 0 (0.0%) | 0 (0.0%) |
| Mining, Quarrying, & Extraction | 0 (0.0%) | 0 (0.0%) |
| Construction | 23 (100.0%) | 0 (0.0%) |
| Manufacturing | 0 (0.0%) | 117 (100.0%) |
| Wholesale Trade | 15 (100.0%) | 0 (0.0%) |
| Retail Trade | 14 (42.4%) | 19 (57.6%) |
| Transportation & Warehousing | 0 (0.0%) | 0 (0.0%) |
| Utilities | 0 (0.0%) | 0 (0.0%) |
| Information | 0 (0.0%) | 0 (0.0%) |
| Finance & Insurance | 0 (0.0%) | 0 (0.0%) |
| Real Estate, Rental & Leasing | 0 (0.0%) | 0 (0.0%) |
| Professional & Scientific | 0 (0.0%) | 0 (0.0%) |
| Enterprise Management | 0 (0.0%) | 0 (0.0%) |
| Administrative & Support | 0 (0.0%) | 0 (0.0%) |
| Educational Services | 0 (0.0%) | 0 (0.0%) |
| Health Care & Social Assistance | 0 (0.0%) | 115 (100.0%) |
| Arts, Entertainment & Recreation | 0 (0.0%) | 0 (0.0%) |
| Accommodation & Food Services | 0 (0.0%) | 0 (0.0%) |
| Public Administration | 18 (100.0%) | 0 (0.0%) |
| Total | 70 (21.8%) | 251 (78.2%) |
Education in Lattimer
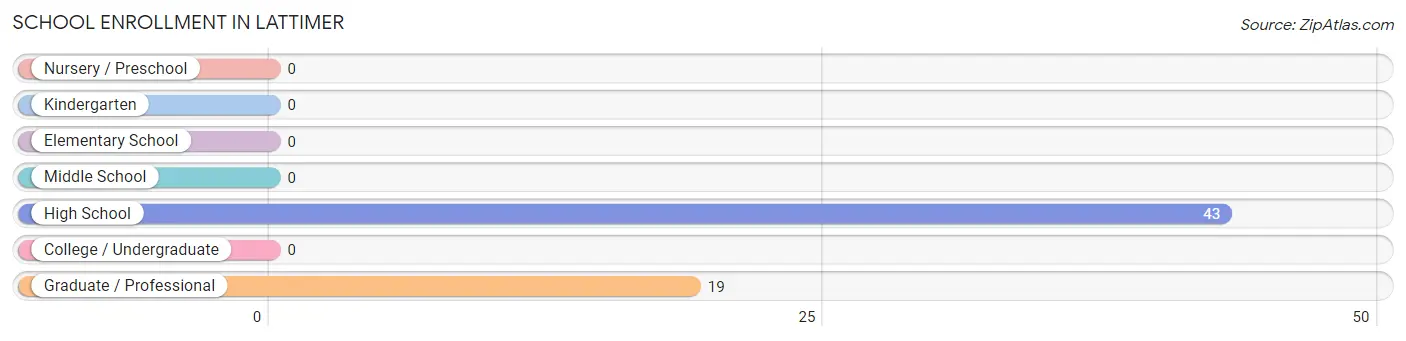
School Enrollment in Lattimer
The most common levels of schooling among the 62 students in Lattimer are high school (43 | 69.4%), and graduate / professional (19 | 30.6%).
| School Level | # Students | % Students |
| Nursery / Preschool | 0 | 0.0% |
| Kindergarten | 0 | 0.0% |
| Elementary School | 0 | 0.0% |
| Middle School | 0 | 0.0% |
| High School | 43 | 69.4% |
| College / Undergraduate | 0 | 0.0% |
| Graduate / Professional | 19 | 30.6% |
| Total | 62 | 100.0% |
School Enrollment by Age by Funding Source in Lattimer
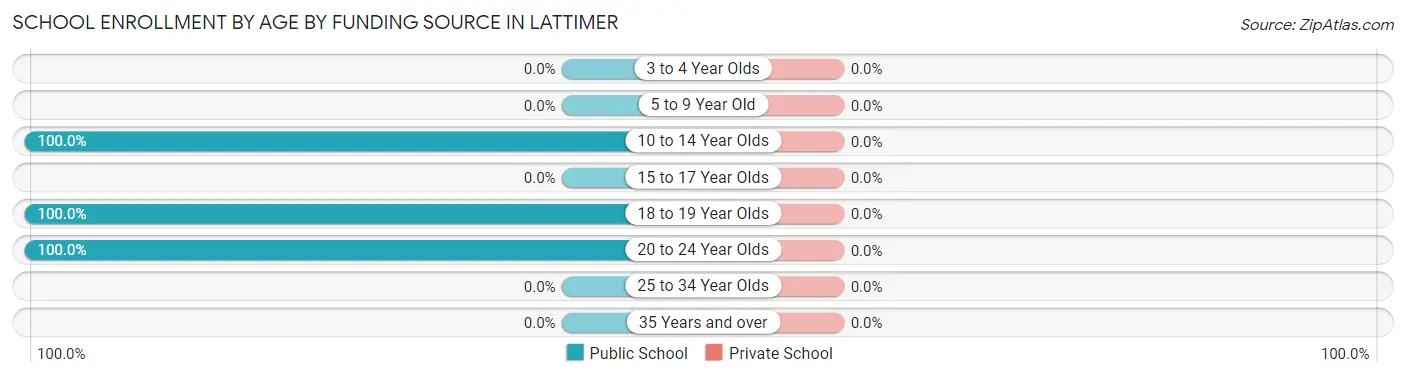
| Age Bracket | Public School | Private School |
| 3 to 4 Year Olds | 0 (0.0%) | 0 (0.0%) |
| 5 to 9 Year Old | 0 (0.0%) | 0 (0.0%) |
| 10 to 14 Year Olds | 18 (100.0%) | 0 (0.0%) |
| 15 to 17 Year Olds | 0 (0.0%) | 0 (0.0%) |
| 18 to 19 Year Olds | 25 (100.0%) | 0 (0.0%) |
| 20 to 24 Year Olds | 19 (100.0%) | 0 (0.0%) |
| 25 to 34 Year Olds | 0 (0.0%) | 0 (0.0%) |
| 35 Years and over | 0 (0.0%) | 0 (0.0%) |
| Total | 62 (100.0%) | 0 (0.0%) |
Educational Attainment by Field of Study in Lattimer
Multidisciplinary studies (23 | 34.3%), science & technology (15 | 22.4%), education (15 | 22.4%), and arts & humanities (14 | 20.9%) are the most common fields of study among 67 individuals in Lattimer who have obtained a bachelor's degree or higher.
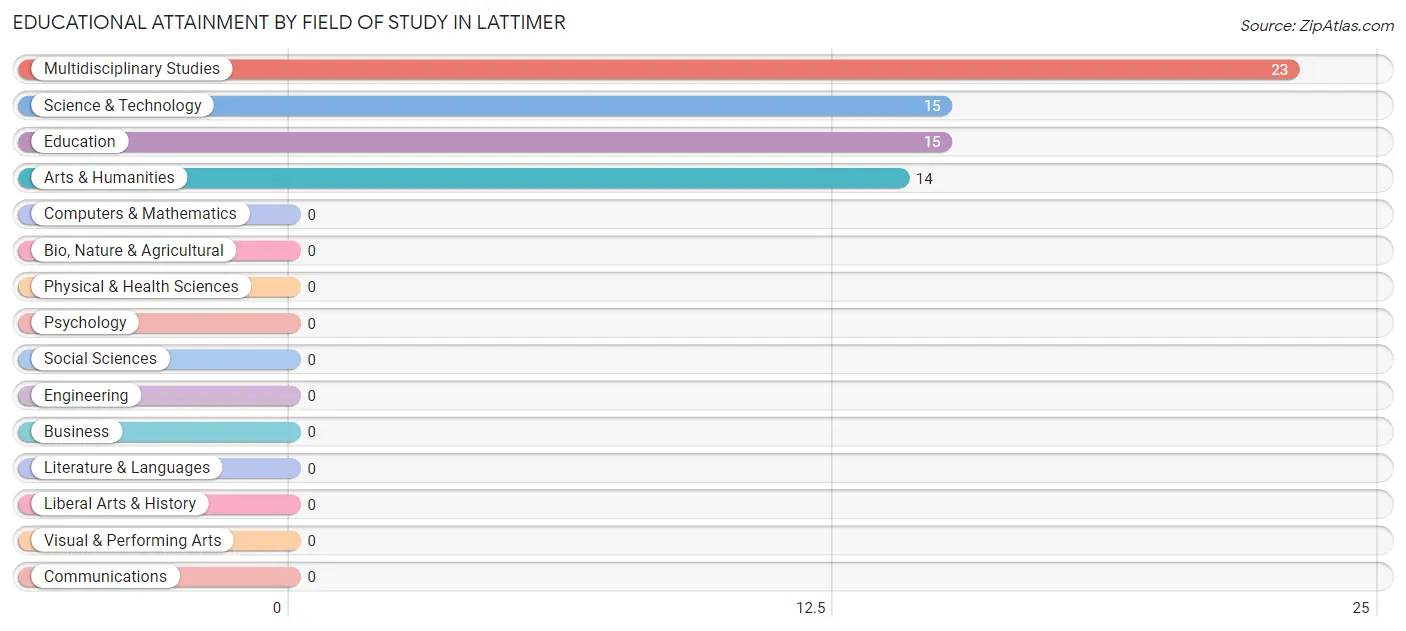
| Field of Study | # Graduates | % Graduates |
| Computers & Mathematics | 0 | 0.0% |
| Bio, Nature & Agricultural | 0 | 0.0% |
| Physical & Health Sciences | 0 | 0.0% |
| Psychology | 0 | 0.0% |
| Social Sciences | 0 | 0.0% |
| Engineering | 0 | 0.0% |
| Multidisciplinary Studies | 23 | 34.3% |
| Science & Technology | 15 | 22.4% |
| Business | 0 | 0.0% |
| Education | 15 | 22.4% |
| Literature & Languages | 0 | 0.0% |
| Liberal Arts & History | 0 | 0.0% |
| Visual & Performing Arts | 0 | 0.0% |
| Communications | 0 | 0.0% |
| Arts & Humanities | 14 | 20.9% |
| Total | 67 | 100.0% |
Transportation & Commute in Lattimer
Vehicle Availability by Sex in Lattimer
The most prevalent vehicle ownership categories in Lattimer are males with 2 vehicles (52, accounting for 74.3%) and females with 2 vehicles (23, making up 20.7%).
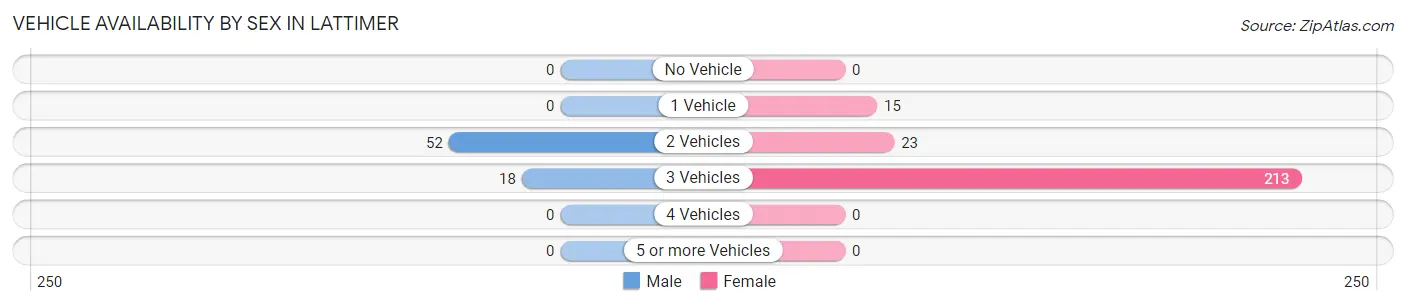
| Vehicles Available | Male | Female |
| No Vehicle | 0 (0.0%) | 0 (0.0%) |
| 1 Vehicle | 0 (0.0%) | 15 (6.0%) |
| 2 Vehicles | 52 (74.3%) | 23 (9.2%) |
| 3 Vehicles | 18 (25.7%) | 213 (84.9%) |
| 4 Vehicles | 0 (0.0%) | 0 (0.0%) |
| 5 or more Vehicles | 0 (0.0%) | 0 (0.0%) |
| Total | 70 (100.0%) | 251 (100.0%) |
Commute Time in Lattimer
The most frequently occuring commute durations in Lattimer are 20 to 24 minutes (154 commuters, 50.8%), 15 to 19 minutes (92 commuters, 30.4%), and 40 to 44 minutes (23 commuters, 7.6%).
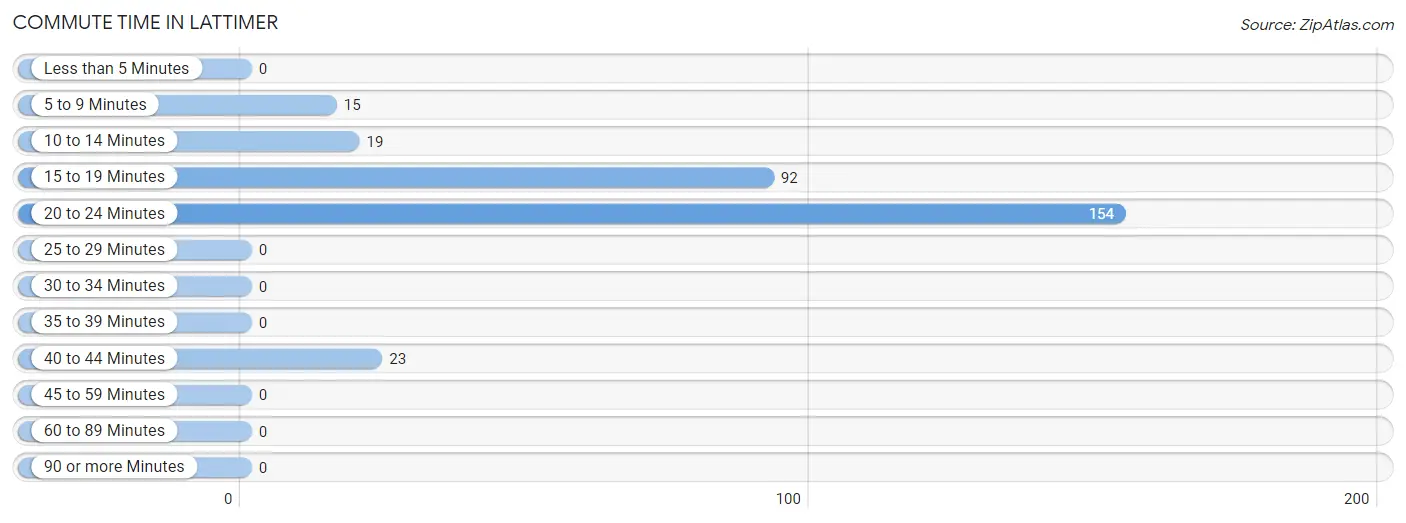
| Commute Time | # Commuters | % Commuters |
| Less than 5 Minutes | 0 | 0.0% |
| 5 to 9 Minutes | 15 | 5.0% |
| 10 to 14 Minutes | 19 | 6.3% |
| 15 to 19 Minutes | 92 | 30.4% |
| 20 to 24 Minutes | 154 | 50.8% |
| 25 to 29 Minutes | 0 | 0.0% |
| 30 to 34 Minutes | 0 | 0.0% |
| 35 to 39 Minutes | 0 | 0.0% |
| 40 to 44 Minutes | 23 | 7.6% |
| 45 to 59 Minutes | 0 | 0.0% |
| 60 to 89 Minutes | 0 | 0.0% |
| 90 or more Minutes | 0 | 0.0% |
Commute Time by Sex in Lattimer
The most common commute times in Lattimer are 20 to 24 minutes (37 commuters, 71.2%) for males and 20 to 24 minutes (117 commuters, 46.6%) for females.
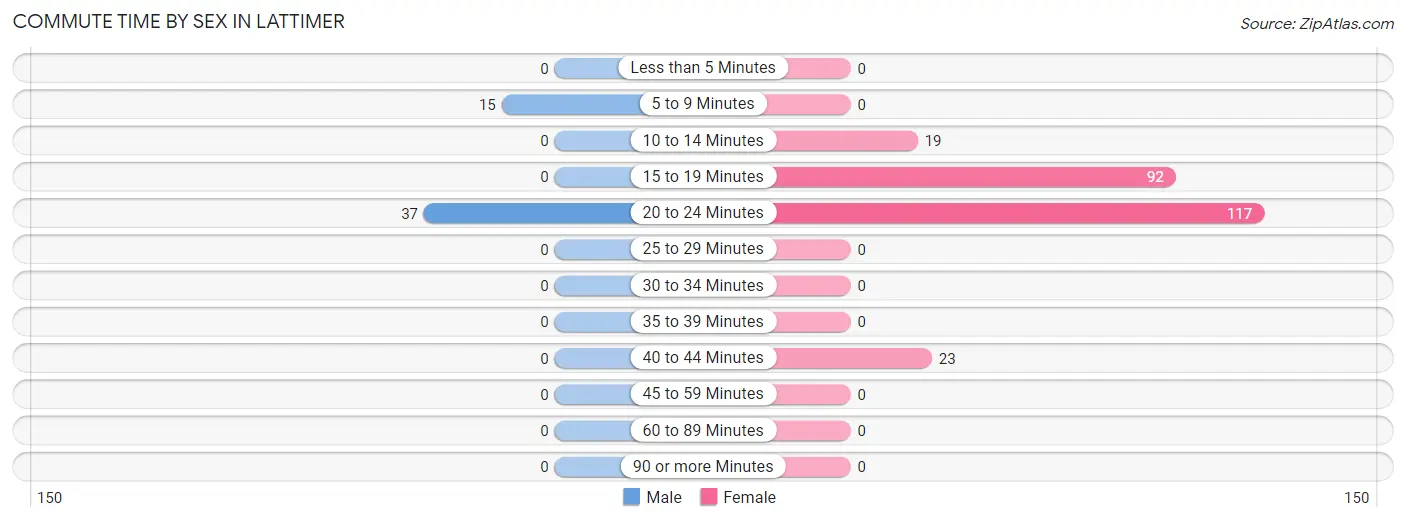
| Commute Time | Male | Female |
| Less than 5 Minutes | 0 (0.0%) | 0 (0.0%) |
| 5 to 9 Minutes | 15 (28.8%) | 0 (0.0%) |
| 10 to 14 Minutes | 0 (0.0%) | 19 (7.6%) |
| 15 to 19 Minutes | 0 (0.0%) | 92 (36.6%) |
| 20 to 24 Minutes | 37 (71.2%) | 117 (46.6%) |
| 25 to 29 Minutes | 0 (0.0%) | 0 (0.0%) |
| 30 to 34 Minutes | 0 (0.0%) | 0 (0.0%) |
| 35 to 39 Minutes | 0 (0.0%) | 0 (0.0%) |
| 40 to 44 Minutes | 0 (0.0%) | 23 (9.2%) |
| 45 to 59 Minutes | 0 (0.0%) | 0 (0.0%) |
| 60 to 89 Minutes | 0 (0.0%) | 0 (0.0%) |
| 90 or more Minutes | 0 (0.0%) | 0 (0.0%) |
Time of Departure to Work by Sex in Lattimer
The most frequent times of departure to work in Lattimer are 12:00 PM to 3:59 PM (29, 55.8%) for males and 4:00 PM to 11:59 PM (194, 77.3%) for females.
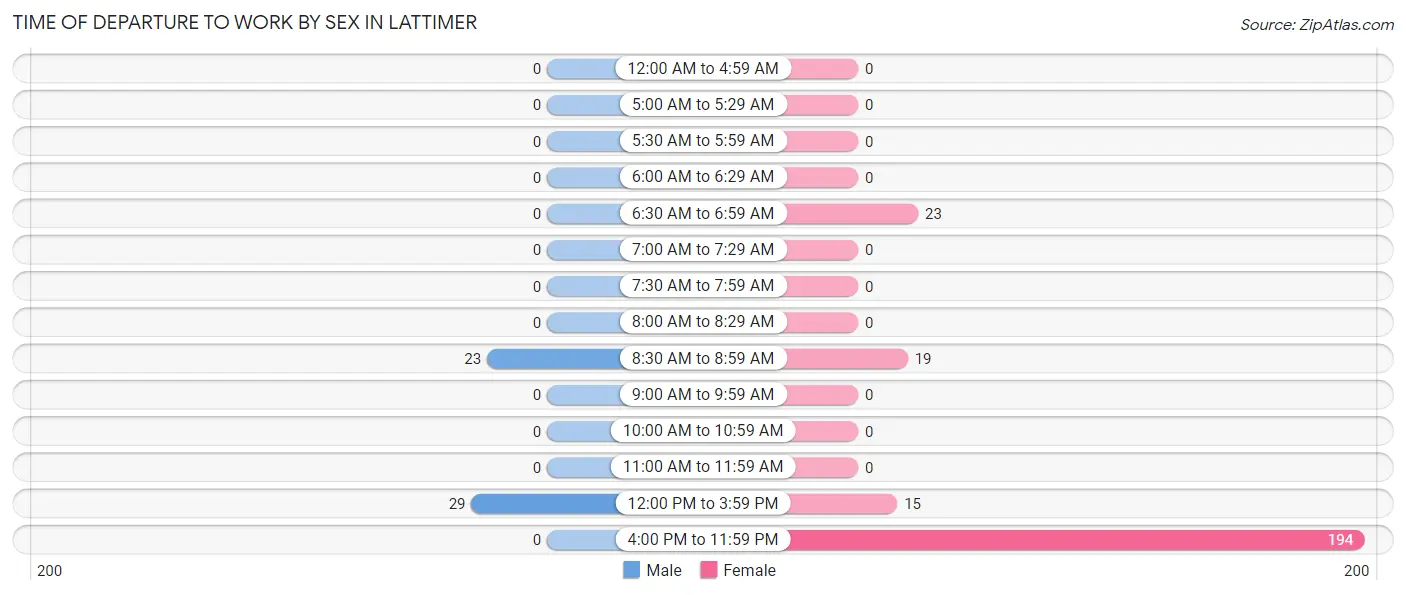
| Time of Departure | Male | Female |
| 12:00 AM to 4:59 AM | 0 (0.0%) | 0 (0.0%) |
| 5:00 AM to 5:29 AM | 0 (0.0%) | 0 (0.0%) |
| 5:30 AM to 5:59 AM | 0 (0.0%) | 0 (0.0%) |
| 6:00 AM to 6:29 AM | 0 (0.0%) | 0 (0.0%) |
| 6:30 AM to 6:59 AM | 0 (0.0%) | 23 (9.2%) |
| 7:00 AM to 7:29 AM | 0 (0.0%) | 0 (0.0%) |
| 7:30 AM to 7:59 AM | 0 (0.0%) | 0 (0.0%) |
| 8:00 AM to 8:29 AM | 0 (0.0%) | 0 (0.0%) |
| 8:30 AM to 8:59 AM | 23 (44.2%) | 19 (7.6%) |
| 9:00 AM to 9:59 AM | 0 (0.0%) | 0 (0.0%) |
| 10:00 AM to 10:59 AM | 0 (0.0%) | 0 (0.0%) |
| 11:00 AM to 11:59 AM | 0 (0.0%) | 0 (0.0%) |
| 12:00 PM to 3:59 PM | 29 (55.8%) | 15 (6.0%) |
| 4:00 PM to 11:59 PM | 0 (0.0%) | 194 (77.3%) |
| Total | 52 (100.0%) | 251 (100.0%) |
Housing Occupancy in Lattimer
Occupancy by Ownership in Lattimer
Of the total 363 dwellings in Lattimer, owner-occupied units account for 211 (58.1%), while renter-occupied units make up 152 (41.9%).
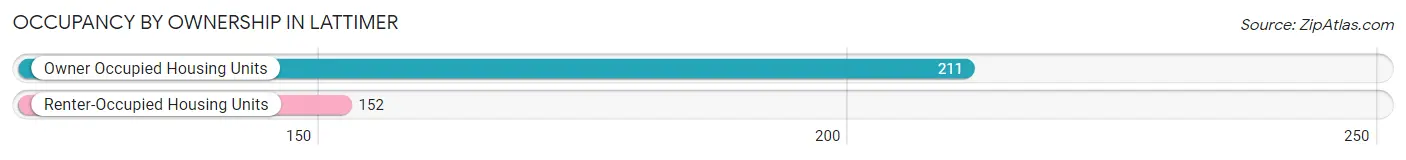
| Occupancy | # Housing Units | % Housing Units |
| Owner Occupied Housing Units | 211 | 58.1% |
| Renter-Occupied Housing Units | 152 | 41.9% |
| Total Occupied Housing Units | 363 | 100.0% |
Occupancy by Household Size in Lattimer
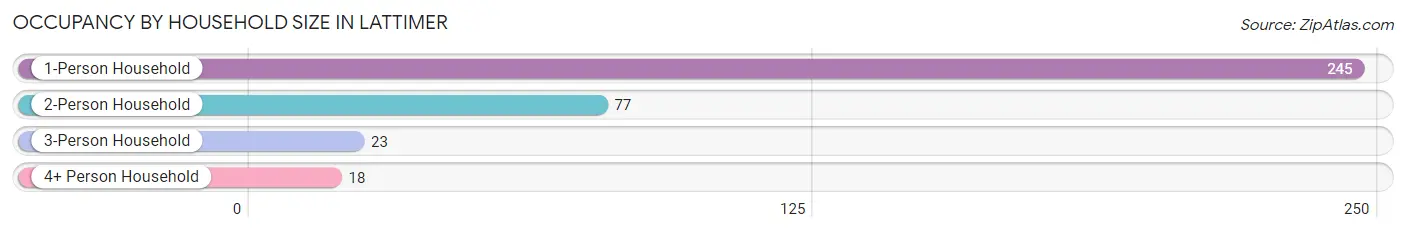
| Household Size | # Housing Units | % Housing Units |
| 1-Person Household | 245 | 67.5% |
| 2-Person Household | 77 | 21.2% |
| 3-Person Household | 23 | 6.3% |
| 4+ Person Household | 18 | 5.0% |
| Total Housing Units | 363 | 100.0% |
Occupancy by Ownership by Household Size in Lattimer
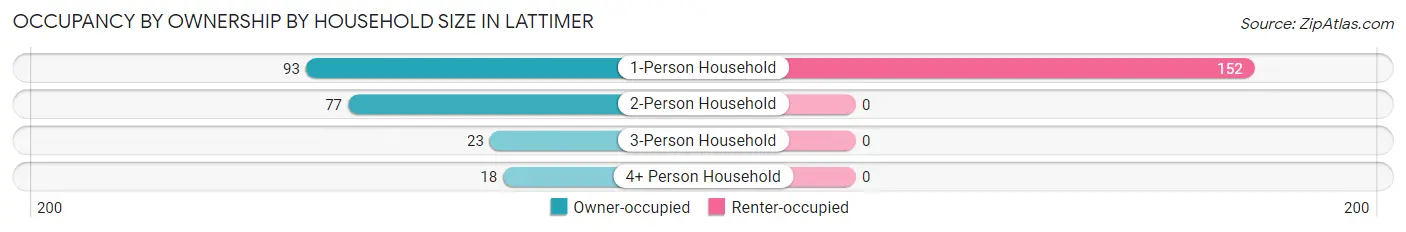
| Household Size | Owner-occupied | Renter-occupied |
| 1-Person Household | 93 (38.0%) | 152 (62.0%) |
| 2-Person Household | 77 (100.0%) | 0 (0.0%) |
| 3-Person Household | 23 (100.0%) | 0 (0.0%) |
| 4+ Person Household | 18 (100.0%) | 0 (0.0%) |
| Total Housing Units | 211 (58.1%) | 152 (41.9%) |
Occupancy by Educational Attainment in Lattimer
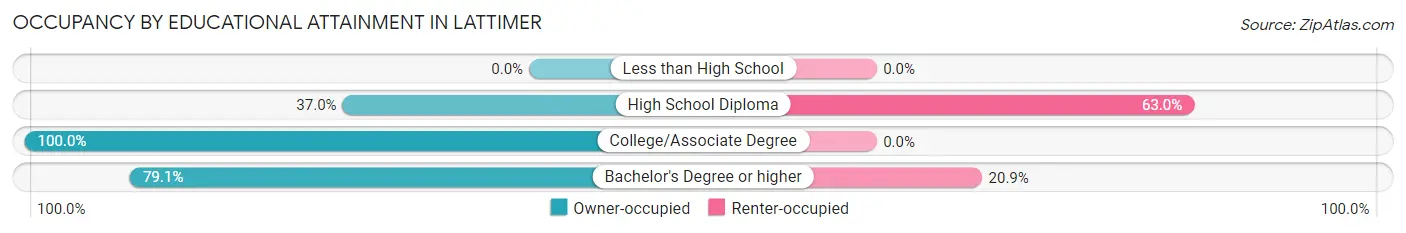
| Household Size | Owner-occupied | Renter-occupied |
| Less than High School | 0 (0.0%) | 0 (0.0%) |
| High School Diploma | 81 (37.0%) | 138 (63.0%) |
| College/Associate Degree | 77 (100.0%) | 0 (0.0%) |
| Bachelor's Degree or higher | 53 (79.1%) | 14 (20.9%) |
Occupancy by Age of Householder in Lattimer
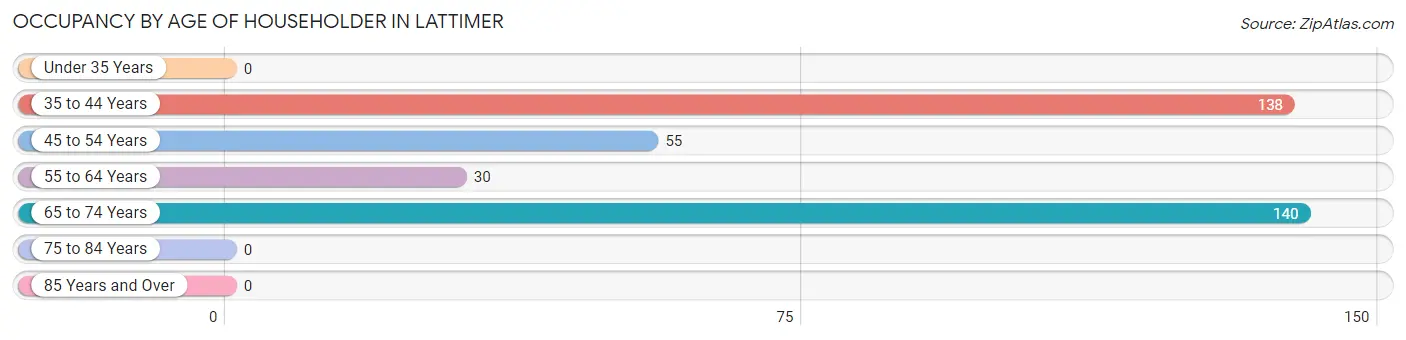
| Age Bracket | # Households | % Households |
| Under 35 Years | 0 | 0.0% |
| 35 to 44 Years | 138 | 38.0% |
| 45 to 54 Years | 55 | 15.1% |
| 55 to 64 Years | 30 | 8.3% |
| 65 to 74 Years | 140 | 38.6% |
| 75 to 84 Years | 0 | 0.0% |
| 85 Years and Over | 0 | 0.0% |
| Total | 363 | 100.0% |
Housing Finances in Lattimer
Median Income by Occupancy in Lattimer
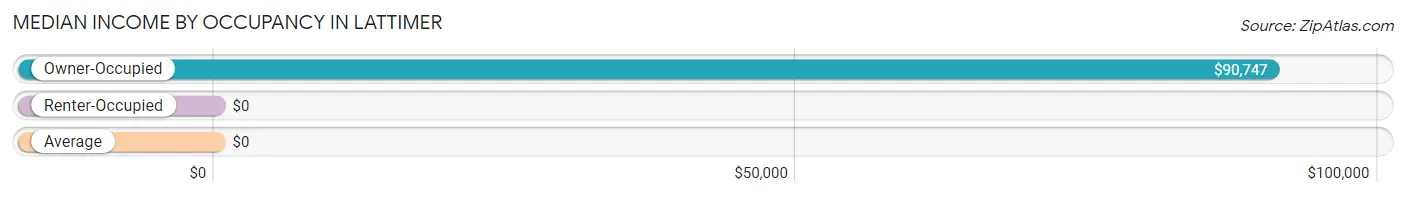
| Occupancy Type | # Households | Median Income |
| Owner-Occupied | 211 (58.1%) | $90,747 |
| Renter-Occupied | 152 (41.9%) | $0 |
| Average | 363 (100.0%) | $0 |
Occupancy by Householder Income Bracket in Lattimer
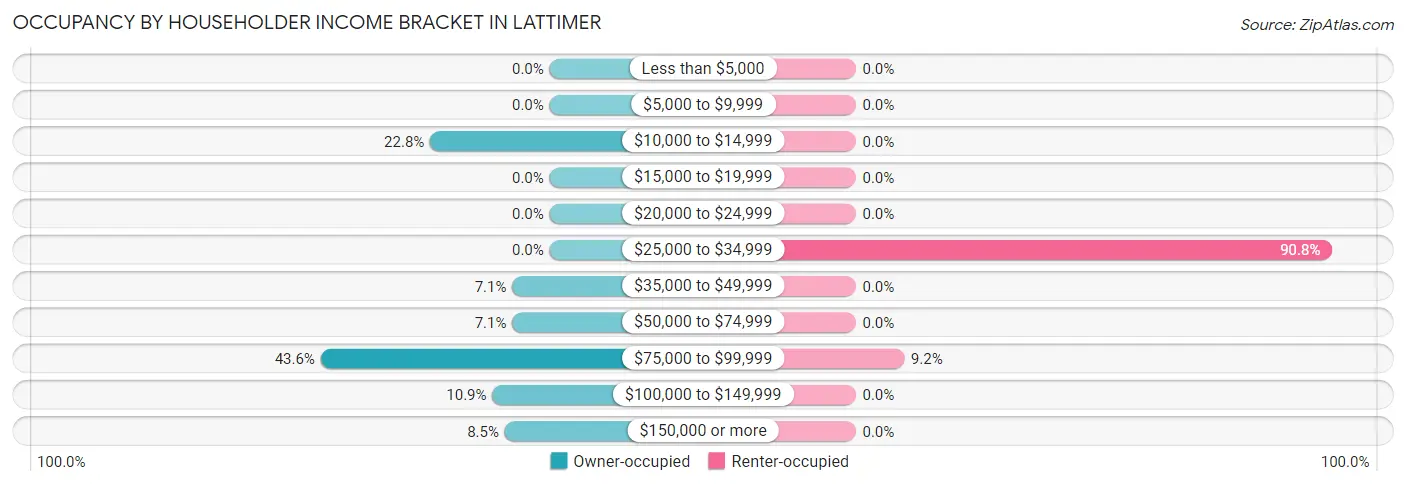
| Income Bracket | Owner-occupied | Renter-occupied |
| Less than $5,000 | 0 (0.0%) | 0 (0.0%) |
| $5,000 to $9,999 | 0 (0.0%) | 0 (0.0%) |
| $10,000 to $14,999 | 48 (22.8%) | 0 (0.0%) |
| $15,000 to $19,999 | 0 (0.0%) | 0 (0.0%) |
| $20,000 to $24,999 | 0 (0.0%) | 0 (0.0%) |
| $25,000 to $34,999 | 0 (0.0%) | 138 (90.8%) |
| $35,000 to $49,999 | 15 (7.1%) | 0 (0.0%) |
| $50,000 to $74,999 | 15 (7.1%) | 0 (0.0%) |
| $75,000 to $99,999 | 92 (43.6%) | 14 (9.2%) |
| $100,000 to $149,999 | 23 (10.9%) | 0 (0.0%) |
| $150,000 or more | 18 (8.5%) | 0 (0.0%) |
| Total | 211 (100.0%) | 152 (100.0%) |
Monthly Housing Cost Tiers in Lattimer
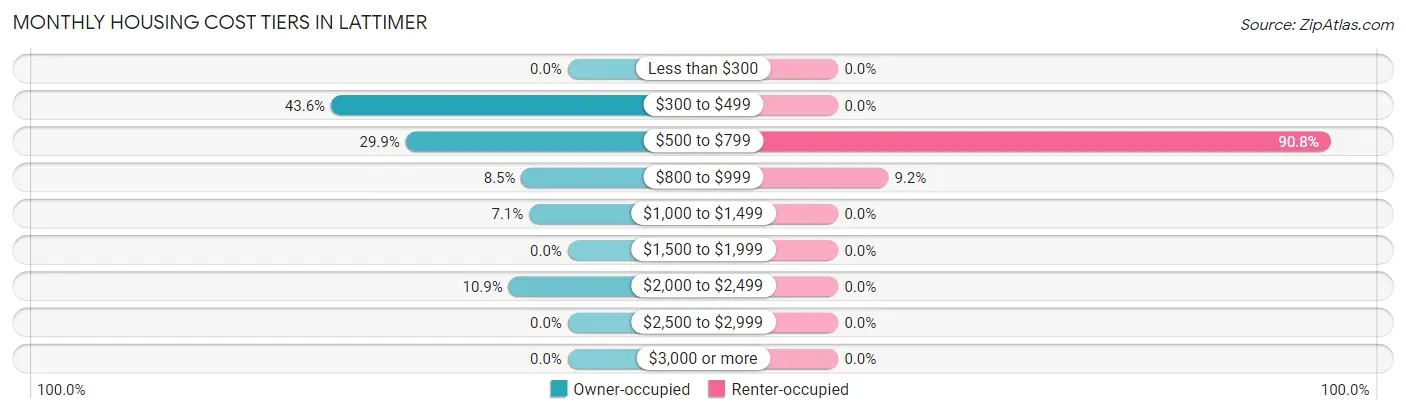
| Monthly Cost | Owner-occupied | Renter-occupied |
| Less than $300 | 0 (0.0%) | 0 (0.0%) |
| $300 to $499 | 92 (43.6%) | 0 (0.0%) |
| $500 to $799 | 63 (29.9%) | 138 (90.8%) |
| $800 to $999 | 18 (8.5%) | 14 (9.2%) |
| $1,000 to $1,499 | 15 (7.1%) | 0 (0.0%) |
| $1,500 to $1,999 | 0 (0.0%) | 0 (0.0%) |
| $2,000 to $2,499 | 23 (10.9%) | 0 (0.0%) |
| $2,500 to $2,999 | 0 (0.0%) | 0 (0.0%) |
| $3,000 or more | 0 (0.0%) | 0 (0.0%) |
| Total | 211 (100.0%) | 152 (100.0%) |
Physical Housing Characteristics in Lattimer
Housing Structures in Lattimer
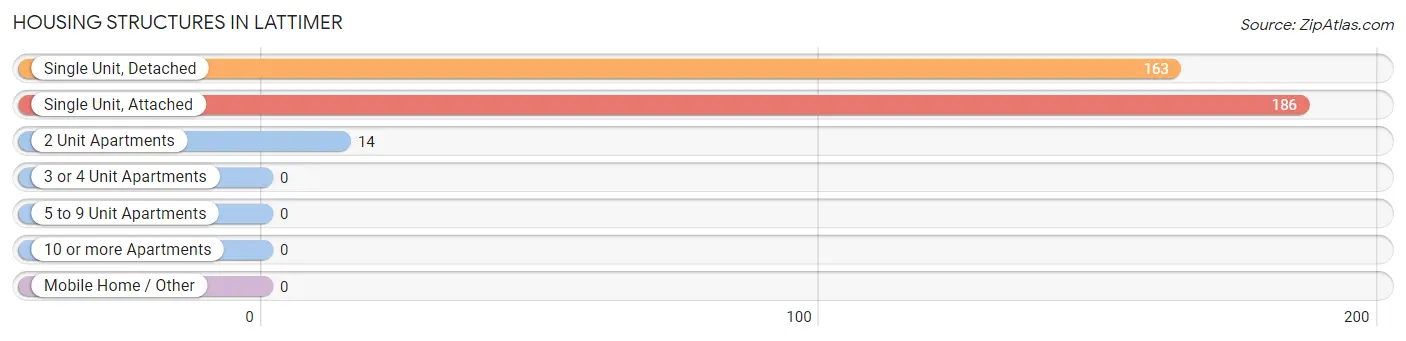
| Structure Type | # Housing Units | % Housing Units |
| Single Unit, Detached | 163 | 44.9% |
| Single Unit, Attached | 186 | 51.2% |
| 2 Unit Apartments | 14 | 3.9% |
| 3 or 4 Unit Apartments | 0 | 0.0% |
| 5 to 9 Unit Apartments | 0 | 0.0% |
| 10 or more Apartments | 0 | 0.0% |
| Mobile Home / Other | 0 | 0.0% |
| Total | 363 | 100.0% |
Housing Structures by Occupancy in Lattimer
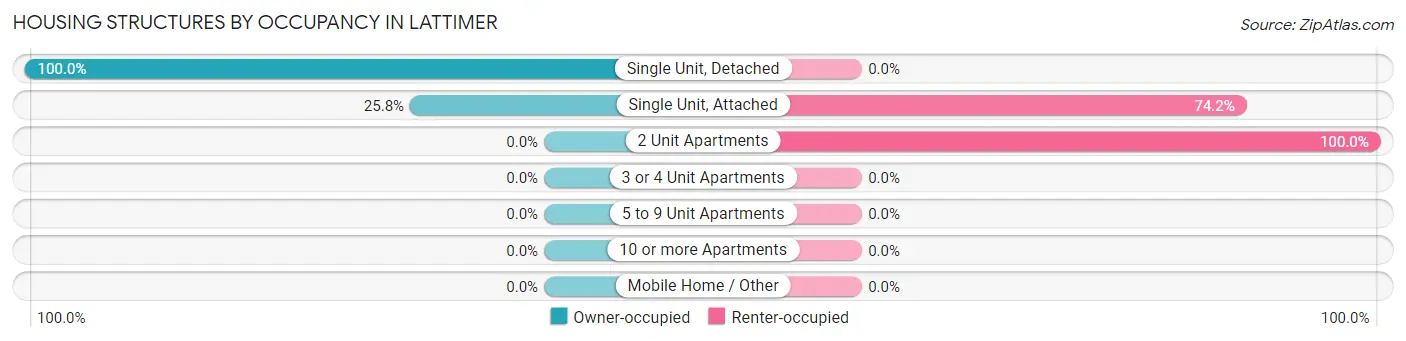
| Structure Type | Owner-occupied | Renter-occupied |
| Single Unit, Detached | 163 (100.0%) | 0 (0.0%) |
| Single Unit, Attached | 48 (25.8%) | 138 (74.2%) |
| 2 Unit Apartments | 0 (0.0%) | 14 (100.0%) |
| 3 or 4 Unit Apartments | 0 (0.0%) | 0 (0.0%) |
| 5 to 9 Unit Apartments | 0 (0.0%) | 0 (0.0%) |
| 10 or more Apartments | 0 (0.0%) | 0 (0.0%) |
| Mobile Home / Other | 0 (0.0%) | 0 (0.0%) |
| Total | 211 (58.1%) | 152 (41.9%) |
Housing Structures by Number of Rooms in Lattimer
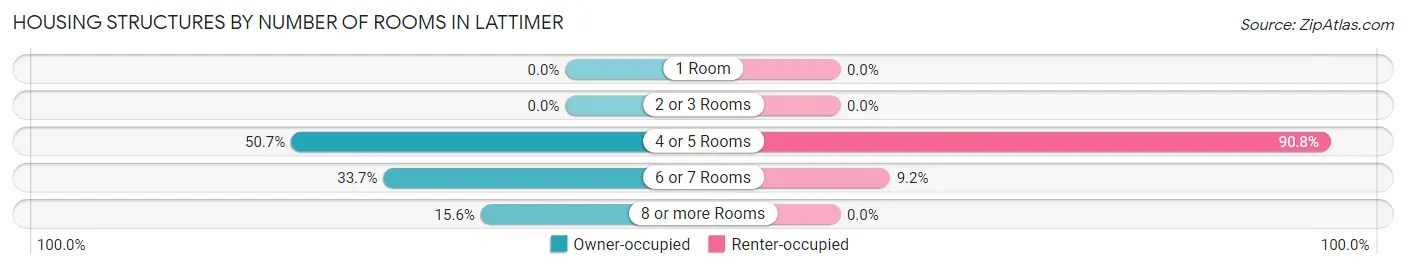
| Number of Rooms | Owner-occupied | Renter-occupied |
| 1 Room | 0 (0.0%) | 0 (0.0%) |
| 2 or 3 Rooms | 0 (0.0%) | 0 (0.0%) |
| 4 or 5 Rooms | 107 (50.7%) | 138 (90.8%) |
| 6 or 7 Rooms | 71 (33.7%) | 14 (9.2%) |
| 8 or more Rooms | 33 (15.6%) | 0 (0.0%) |
| Total | 211 (100.0%) | 152 (100.0%) |
Housing Structure by Heating Type in Lattimer
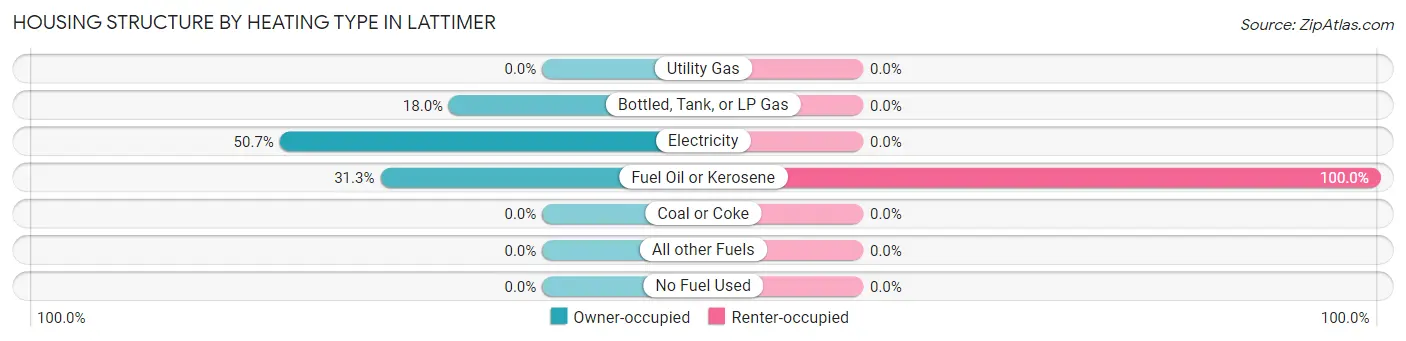
| Heating Type | Owner-occupied | Renter-occupied |
| Utility Gas | 0 (0.0%) | 0 (0.0%) |
| Bottled, Tank, or LP Gas | 38 (18.0%) | 0 (0.0%) |
| Electricity | 107 (50.7%) | 0 (0.0%) |
| Fuel Oil or Kerosene | 66 (31.3%) | 152 (100.0%) |
| Coal or Coke | 0 (0.0%) | 0 (0.0%) |
| All other Fuels | 0 (0.0%) | 0 (0.0%) |
| No Fuel Used | 0 (0.0%) | 0 (0.0%) |
| Total | 211 (100.0%) | 152 (100.0%) |
Household Vehicle Usage in Lattimer
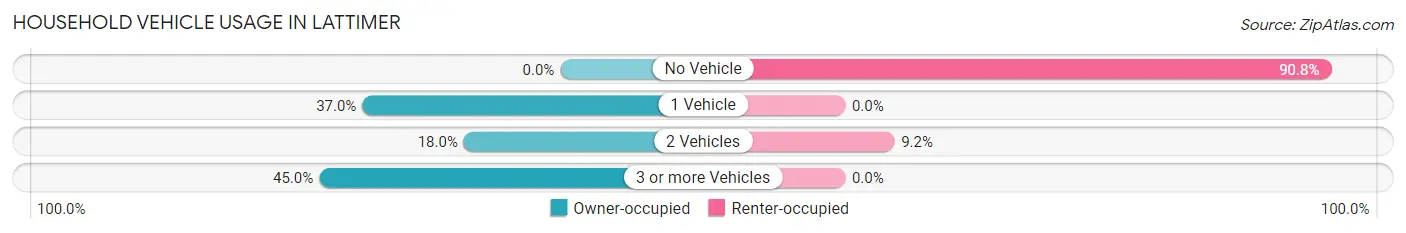
| Vehicles per Household | Owner-occupied | Renter-occupied |
| No Vehicle | 0 (0.0%) | 138 (90.8%) |
| 1 Vehicle | 78 (37.0%) | 0 (0.0%) |
| 2 Vehicles | 38 (18.0%) | 14 (9.2%) |
| 3 or more Vehicles | 95 (45.0%) | 0 (0.0%) |
| Total | 211 (100.0%) | 152 (100.0%) |
Real Estate & Mortgages in Lattimer
Real Estate and Mortgage Overview in Lattimer
| Characteristic | Without Mortgage | With Mortgage |
| Housing Units | 107 | 104 |
| Median Property Value | $265,300 | $0 |
| Median Household Income | $90,763 | $18 |
| Monthly Housing Costs | $458 | $0 |
| Real Estate Taxes | $1,750 | $0 |
Property Value by Mortgage Status in Lattimer
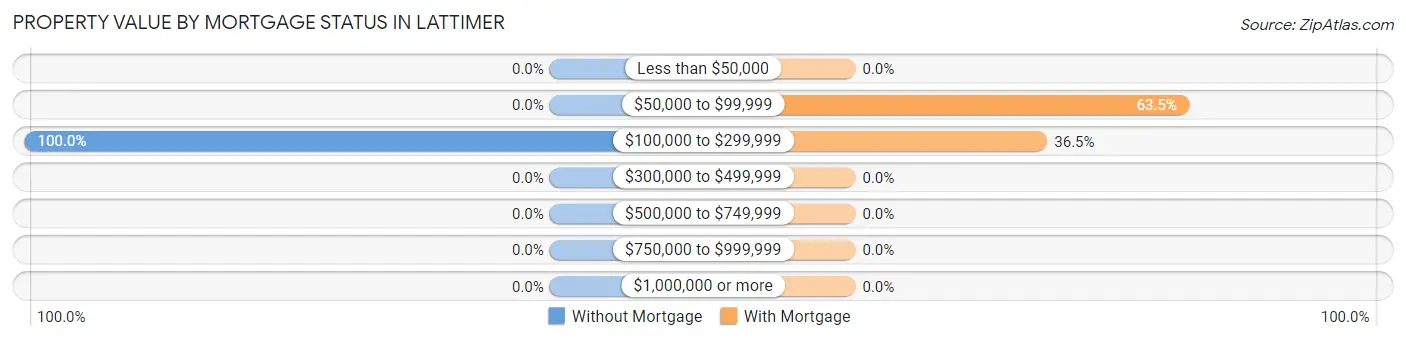
| Property Value | Without Mortgage | With Mortgage |
| Less than $50,000 | 0 (0.0%) | 0 (0.0%) |
| $50,000 to $99,999 | 0 (0.0%) | 66 (63.5%) |
| $100,000 to $299,999 | 107 (100.0%) | 38 (36.5%) |
| $300,000 to $499,999 | 0 (0.0%) | 0 (0.0%) |
| $500,000 to $749,999 | 0 (0.0%) | 0 (0.0%) |
| $750,000 to $999,999 | 0 (0.0%) | 0 (0.0%) |
| $1,000,000 or more | 0 (0.0%) | 0 (0.0%) |
| Total | 107 (100.0%) | 104 (100.0%) |
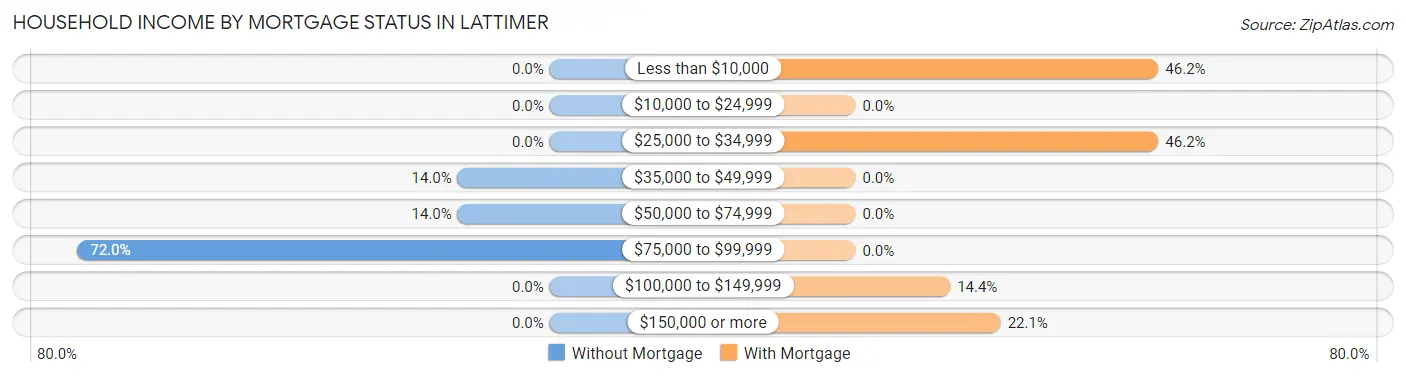
Household Income by Mortgage Status in Lattimer
| Household Income | Without Mortgage | With Mortgage |
| Less than $10,000 | 0 (0.0%) | 48 (46.2%) |
| $10,000 to $24,999 | 0 (0.0%) | 0 (0.0%) |
| $25,000 to $34,999 | 0 (0.0%) | 48 (46.2%) |
| $35,000 to $49,999 | 15 (14.0%) | 0 (0.0%) |
| $50,000 to $74,999 | 15 (14.0%) | 0 (0.0%) |
| $75,000 to $99,999 | 77 (72.0%) | 0 (0.0%) |
| $100,000 to $149,999 | 0 (0.0%) | 15 (14.4%) |
| $150,000 or more | 0 (0.0%) | 23 (22.1%) |
| Total | 107 (100.0%) | 104 (100.0%) |
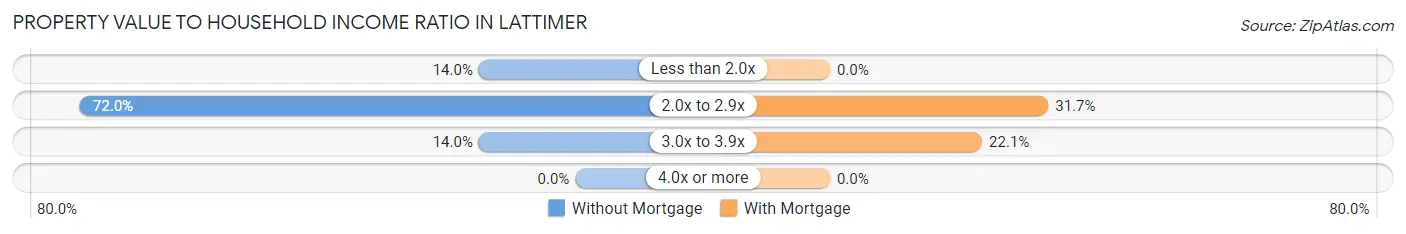
Property Value to Household Income Ratio in Lattimer
| Value-to-Income Ratio | Without Mortgage | With Mortgage |
| Less than 2.0x | 15 (14.0%) | 0 (0.0%) |
| 2.0x to 2.9x | 77 (72.0%) | 33 (31.7%) |
| 3.0x to 3.9x | 15 (14.0%) | 23 (22.1%) |
| 4.0x or more | 0 (0.0%) | 0 (0.0%) |
| Total | 107 (100.0%) | 104 (100.0%) |
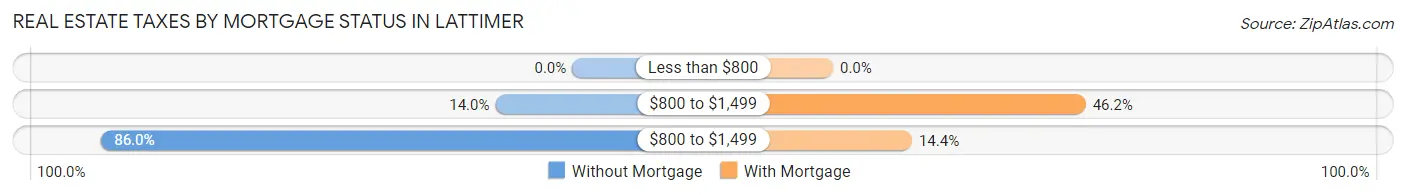
Real Estate Taxes by Mortgage Status in Lattimer
| Property Taxes | Without Mortgage | With Mortgage |
| Less than $800 | 0 (0.0%) | 0 (0.0%) |
| $800 to $1,499 | 15 (14.0%) | 48 (46.2%) |
| $800 to $1,499 | 92 (86.0%) | 15 (14.4%) |
| Total | 107 (100.0%) | 104 (100.0%) |
Health & Disability in Lattimer
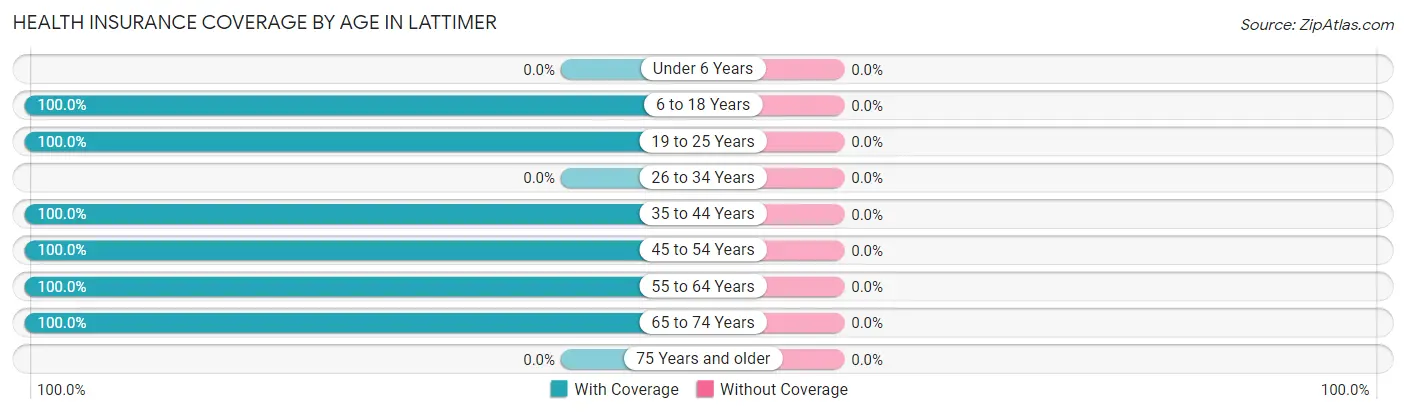
Health Insurance Coverage by Age in Lattimer
| Age Bracket | With Coverage | Without Coverage |
| Under 6 Years | 0 (0.0%) | 0 (0.0%) |
| 6 to 18 Years | 18 (100.0%) | 0 (0.0%) |
| 19 to 25 Years | 44 (100.0%) | 0 (0.0%) |
| 26 to 34 Years | 0 (0.0%) | 0 (0.0%) |
| 35 to 44 Years | 138 (100.0%) | 0 (0.0%) |
| 45 to 54 Years | 97 (100.0%) | 0 (0.0%) |
| 55 to 64 Years | 30 (100.0%) | 0 (0.0%) |
| 65 to 74 Years | 257 (100.0%) | 0 (0.0%) |
| 75 Years and older | 0 (0.0%) | 0 (0.0%) |
| Total | 584 (100.0%) | 0 (0.0%) |
Health Insurance Coverage by Citizenship Status in Lattimer
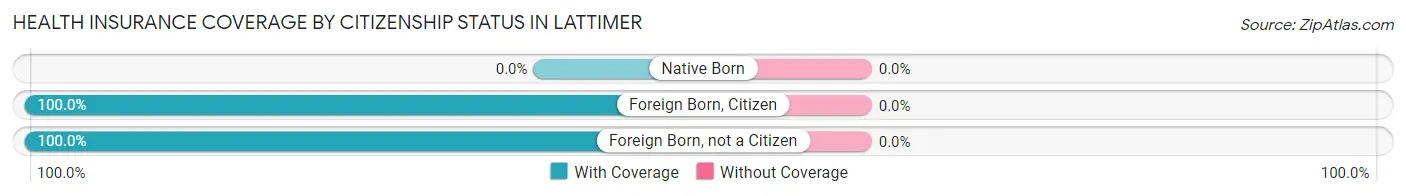
| Citizenship Status | With Coverage | Without Coverage |
| Native Born | 0 (0.0%) | 0 (0.0%) |
| Foreign Born, Citizen | 18 (100.0%) | 0 (0.0%) |
| Foreign Born, not a Citizen | 44 (100.0%) | 0 (0.0%) |
Health Insurance Coverage by Household Income in Lattimer
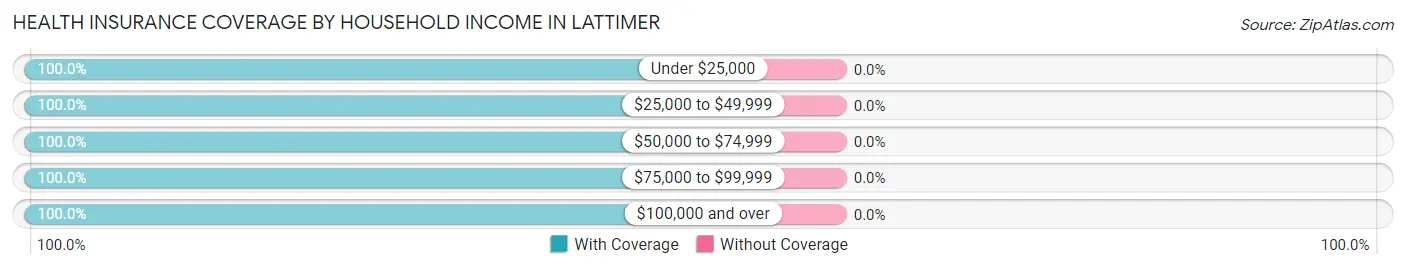
| Household Income | With Coverage | Without Coverage |
| Under $25,000 | 48 (100.0%) | 0 (0.0%) |
| $25,000 to $49,999 | 153 (100.0%) | 0 (0.0%) |
| $50,000 to $74,999 | 15 (100.0%) | 0 (0.0%) |
| $75,000 to $99,999 | 223 (100.0%) | 0 (0.0%) |
| $100,000 and over | 145 (100.0%) | 0 (0.0%) |
Public vs Private Health Insurance Coverage by Age in Lattimer
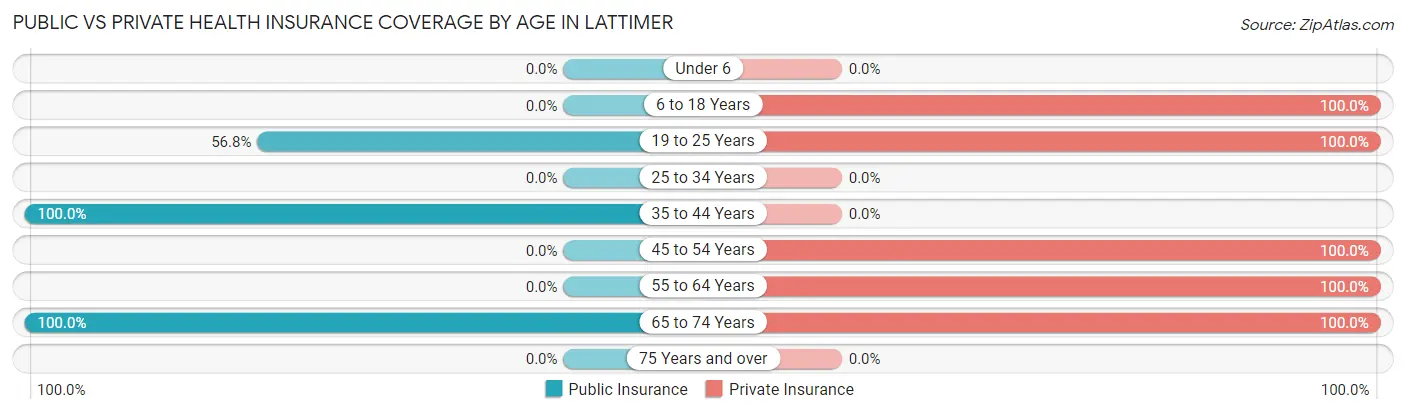
| Age Bracket | Public Insurance | Private Insurance |
| Under 6 | 0 (0.0%) | 0 (0.0%) |
| 6 to 18 Years | 0 (0.0%) | 18 (100.0%) |
| 19 to 25 Years | 25 (56.8%) | 44 (100.0%) |
| 25 to 34 Years | 0 (0.0%) | 0 (0.0%) |
| 35 to 44 Years | 138 (100.0%) | 0 (0.0%) |
| 45 to 54 Years | 0 (0.0%) | 97 (100.0%) |
| 55 to 64 Years | 0 (0.0%) | 30 (100.0%) |
| 65 to 74 Years | 257 (100.0%) | 257 (100.0%) |
| 75 Years and over | 0 (0.0%) | 0 (0.0%) |
| Total | 420 (71.9%) | 446 (76.4%) |
Disability Status by Sex by Age in Lattimer
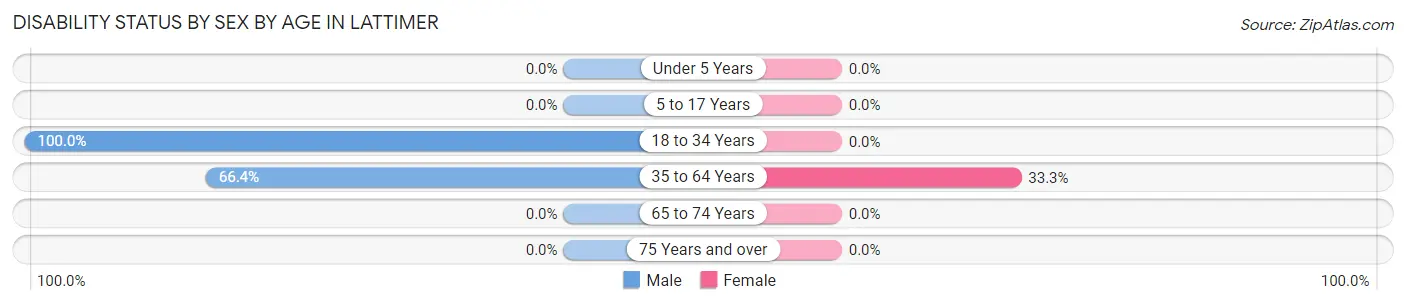
| Age Bracket | Male | Female |
| Under 5 Years | 0 (0.0%) | 0 (0.0%) |
| 5 to 17 Years | 0 (0.0%) | 0 (0.0%) |
| 18 to 34 Years | 25 (100.0%) | 0 (0.0%) |
| 35 to 64 Years | 138 (66.3%) | 19 (33.3%) |
| 65 to 74 Years | 0 (0.0%) | 0 (0.0%) |
| 75 Years and over | 0 (0.0%) | 0 (0.0%) |
Disability Class by Sex by Age in Lattimer
Disability Class: Hearing Difficulty
| Age Bracket | Male | Female |
| Under 5 Years | 0 (0.0%) | 0 (0.0%) |
| 5 to 17 Years | 0 (0.0%) | 0 (0.0%) |
| 18 to 34 Years | 0 (0.0%) | 0 (0.0%) |
| 35 to 64 Years | 0 (0.0%) | 0 (0.0%) |
| 65 to 74 Years | 0 (0.0%) | 0 (0.0%) |
| 75 Years and over | 0 (0.0%) | 0 (0.0%) |
Disability Class: Vision Difficulty
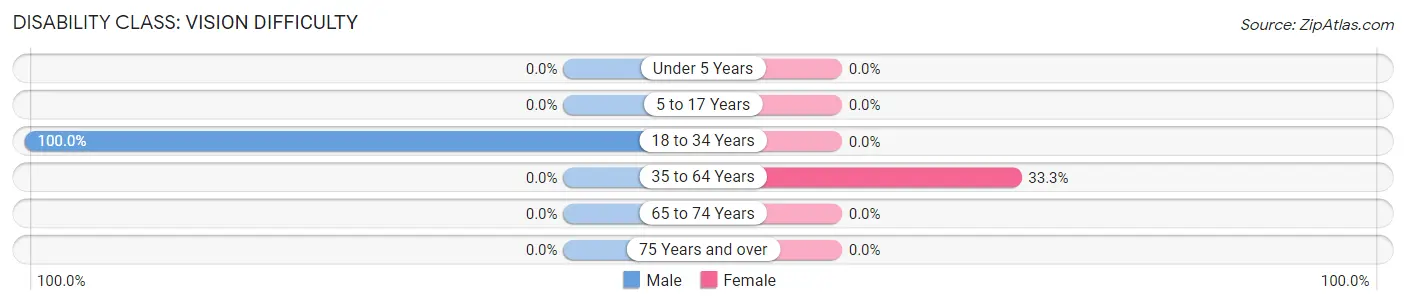
| Age Bracket | Male | Female |
| Under 5 Years | 0 (0.0%) | 0 (0.0%) |
| 5 to 17 Years | 0 (0.0%) | 0 (0.0%) |
| 18 to 34 Years | 25 (100.0%) | 0 (0.0%) |
| 35 to 64 Years | 0 (0.0%) | 19 (33.3%) |
| 65 to 74 Years | 0 (0.0%) | 0 (0.0%) |
| 75 Years and over | 0 (0.0%) | 0 (0.0%) |
Disability Class: Cognitive Difficulty
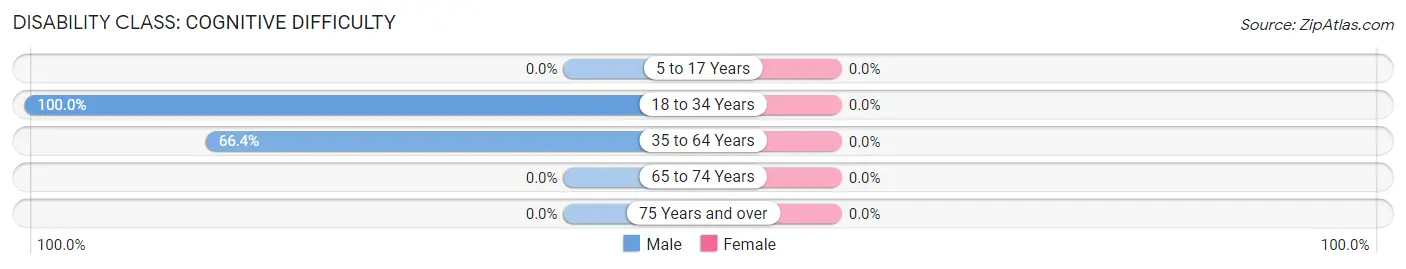
| Age Bracket | Male | Female |
| 5 to 17 Years | 0 (0.0%) | 0 (0.0%) |
| 18 to 34 Years | 25 (100.0%) | 0 (0.0%) |
| 35 to 64 Years | 138 (66.3%) | 0 (0.0%) |
| 65 to 74 Years | 0 (0.0%) | 0 (0.0%) |
| 75 Years and over | 0 (0.0%) | 0 (0.0%) |
Disability Class: Ambulatory Difficulty
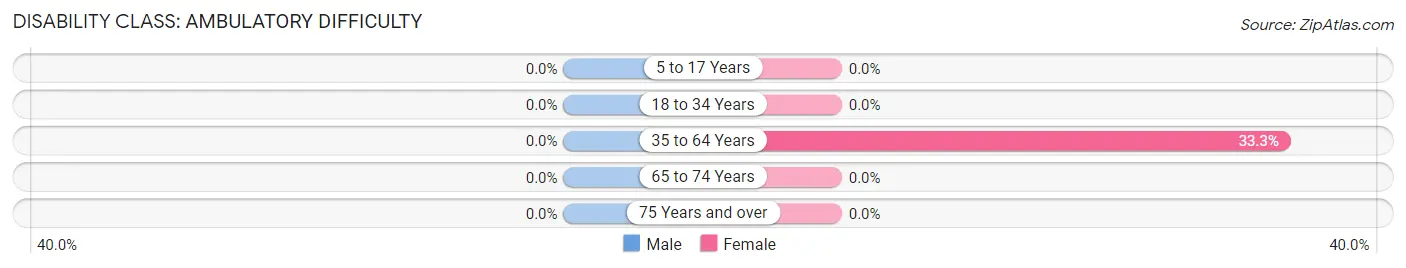
| Age Bracket | Male | Female |
| 5 to 17 Years | 0 (0.0%) | 0 (0.0%) |
| 18 to 34 Years | 0 (0.0%) | 0 (0.0%) |
| 35 to 64 Years | 0 (0.0%) | 19 (33.3%) |
| 65 to 74 Years | 0 (0.0%) | 0 (0.0%) |
| 75 Years and over | 0 (0.0%) | 0 (0.0%) |
Disability Class: Self-Care Difficulty
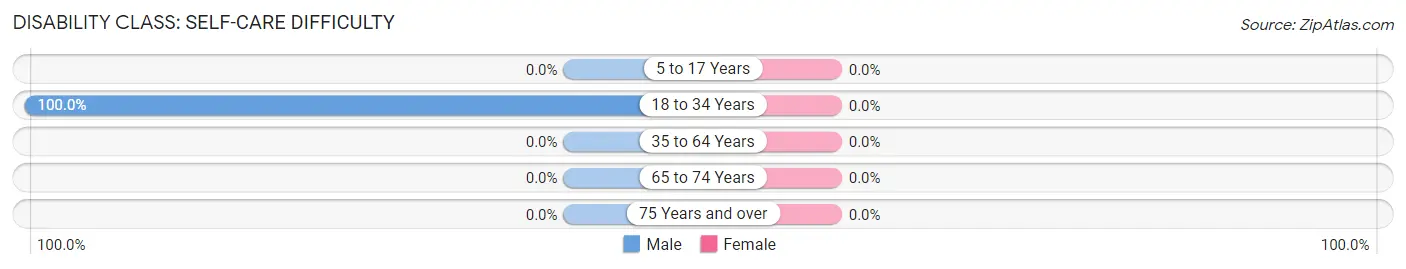
| Age Bracket | Male | Female |
| 5 to 17 Years | 0 (0.0%) | 0 (0.0%) |
| 18 to 34 Years | 25 (100.0%) | 0 (0.0%) |
| 35 to 64 Years | 0 (0.0%) | 0 (0.0%) |
| 65 to 74 Years | 0 (0.0%) | 0 (0.0%) |
| 75 Years and over | 0 (0.0%) | 0 (0.0%) |
Technology Access in Lattimer
Computing Device Access in Lattimer
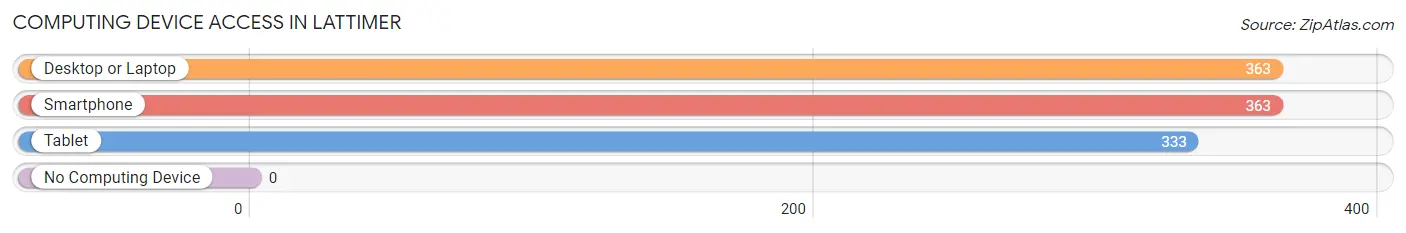
| Device Type | # Households | % Households |
| Desktop or Laptop | 363 | 100.0% |
| Smartphone | 363 | 100.0% |
| Tablet | 333 | 91.7% |
| No Computing Device | 0 | 0.0% |
| Total | 363 | 100.0% |
Internet Access in Lattimer
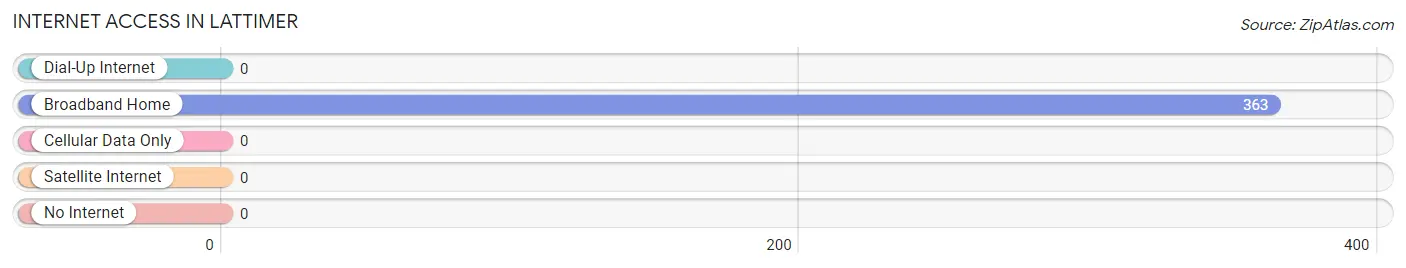
| Internet Type | # Households | % Households |
| Dial-Up Internet | 0 | 0.0% |
| Broadband Home | 363 | 100.0% |
| Cellular Data Only | 0 | 0.0% |
| Satellite Internet | 0 | 0.0% |
| No Internet | 0 | 0.0% |
| Total | 363 | 100.0% |
Lattimer Summary
Lattimer is a small unincorporated community located in Hazle Township, Luzerne County, Pennsylvania. It is situated in the northeastern part of the state, approximately 10 miles south of Wilkes-Barre and about 20 miles north of Hazleton. The population of Lattimer was estimated to be around 1,000 in 2020.
History
Lattimer was founded in 1869 by John Lattimer, a coal miner from England. He purchased a large tract of land in the area and began to develop it into a mining community. The first coal mine in the area was opened in 1871 and the town quickly grew to include a post office, a school, a church, and several stores.
In 1897, the Lattimer Massacre occurred in the town. A group of striking miners were fired upon by a group of sheriff's deputies, resulting in the deaths of 19 miners and the wounding of many more. The incident sparked national outrage and led to the formation of the United Mine Workers of America.
Geography
Lattimer is located in the northeastern part of Pennsylvania, in the foothills of the Appalachian Mountains. The town is situated in a valley between two mountain ridges, with the Susquehanna River running through the valley. The town is surrounded by forests and rolling hills, with the nearest major city being Wilkes-Barre, located about 10 miles to the north.
Economy
The economy of Lattimer is largely based on coal mining. The town is home to several coal mines, which provide employment for many of the town's residents. In addition to coal mining, the town also has a few small businesses, including a grocery store, a hardware store, and a few restaurants.
Demographics
As of the 2010 census, the population of Lattimer was 1,037. The racial makeup of the town was 97.3% White, 0.9% African American, 0.3% Native American, 0.2% Asian, and 1.3% from other races. The median household income was $37,917, and the median family income was $45,938. The per capita income was $19,945.
Conclusion
Lattimer is a small unincorporated community located in Hazle Township, Luzerne County, Pennsylvania. It is situated in the northeastern part of the state, approximately 10 miles south of Wilkes-Barre and about 20 miles north of Hazleton. The population of Lattimer was estimated to be around 1,000 in 2020. The economy of Lattimer is largely based on coal mining, with the town also having a few small businesses. The racial makeup of the town was 97.3% White, 0.9% African American, 0.3% Native American, 0.2% Asian, and 1.3% from other races. The median household income was $37,917, and the median family income was $45,938. The per capita income was $19,945. Lattimer is a small town with a rich history and a strong sense of community.
Common Questions
What is Per Capita Income in Lattimer?
Per Capita income in Lattimer is $37,679.
What is the Median Family Income in Lattimer?
Median Family Income in Lattimer is $91,916.
What is Inequality or Gini Index in Lattimer?
Inequality or Gini Index in Lattimer is 0.36.
What is the Total Population of Lattimer?
Total Population of Lattimer is 584.
What is the Total Male Population of Lattimer?
Total Male Population of Lattimer is 251.
What is the Total Female Population of Lattimer?
Total Female Population of Lattimer is 333.
What is the Ratio of Males per 100 Females in Lattimer?
There are 75.38 Males per 100 Females in Lattimer.
What is the Ratio of Females per 100 Males in Lattimer?
There are 132.67 Females per 100 Males in Lattimer.
What is the Median Population Age in Lattimer?
Median Population Age in Lattimer is 52.9 Years.
What is the Average Family Size in Lattimer
Average Family Size in Lattimer is 2.9 People.
What is the Average Household Size in Lattimer
Average Household Size in Lattimer is 1.6 People.
How Large is the Labor Force in Lattimer?
There are 321 People in the Labor Forcein in Lattimer.
What is the Percentage of People in the Labor Force in Lattimer?
56.7% of People are in the Labor Force in Lattimer.