Intercourse, PA Map & Demographics
Intercourse Map
Intercourse Overview
$34,534
PER CAPITA INCOME
$118,110
AVG FAMILY INCOME
$98,571
AVG HOUSEHOLD INCOME
60.6%
WAGE / INCOME GAP [ % ]
39.4¢/ $1
WAGE / INCOME GAP [ $ ]
0.38
INEQUALITY / GINI INDEX
1,691
TOTAL POPULATION
802
MALE POPULATION
889
FEMALE POPULATION
90.21
MALES / 100 FEMALES
110.85
FEMALES / 100 MALES
32.8
MEDIAN AGE
4.4
AVG FAMILY SIZE
3.5
AVG HOUSEHOLD SIZE
837
LABOR FORCE [ PEOPLE ]
61.6%
PERCENT IN LABOR FORCE
Intercourse Zip Codes
Intercourse Area Codes
Income in Intercourse
Income Overview in Intercourse
Per Capita Income in Intercourse is $34,534, while median incomes of families and households are $118,110 and $98,571 respectively.
| Characteristic | Number | Measure |
| Per Capita Income | 1,691 | $34,534 |
| Median Family Income | 354 | $118,110 |
| Mean Family Income | 354 | $128,100 |
| Median Household Income | 478 | $98,571 |
| Mean Household Income | 478 | $110,334 |
| Income Deficit | 354 | $0 |
| Wage / Income Gap (%) | 1,691 | 60.58% |
| Wage / Income Gap ($) | 1,691 | 39.42¢ per $1 |
| Gini / Inequality Index | 1,691 | 0.38 |
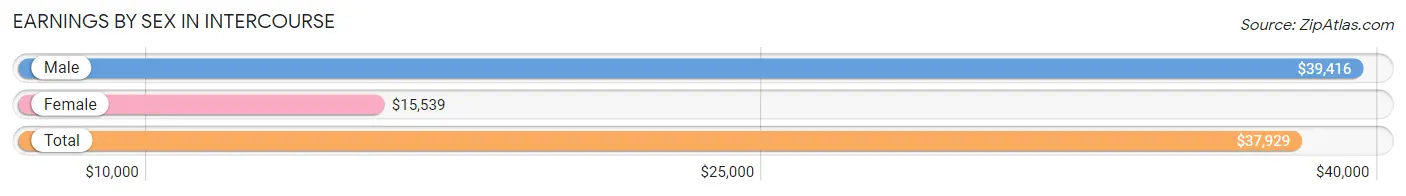
Earnings by Sex in Intercourse
Average Earnings in Intercourse are $37,929, $39,416 for men and $15,539 for women, a difference of 60.6%.
| Sex | Number | Average Earnings |
| Male | 595 (64.0%) | $39,416 |
| Female | 335 (36.0%) | $15,539 |
| Total | 930 (100.0%) | $37,929 |
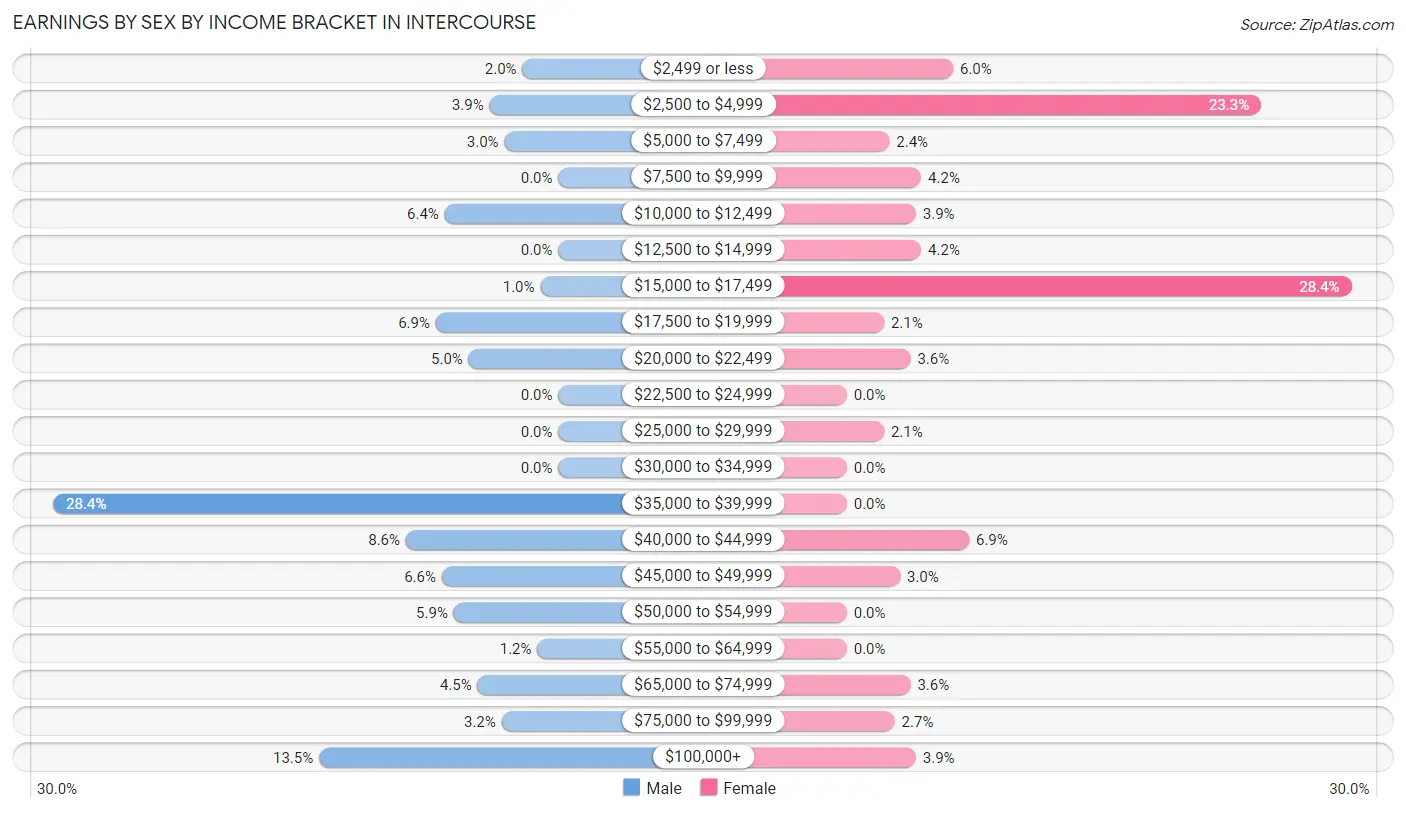
Earnings by Sex by Income Bracket in Intercourse
The most common earnings brackets in Intercourse are $35,000 to $39,999 for men (169 | 28.4%) and $15,000 to $17,499 for women (95 | 28.4%).
| Income | Male | Female |
| $2,499 or less | 12 (2.0%) | 20 (6.0%) |
| $2,500 to $4,999 | 23 (3.9%) | 78 (23.3%) |
| $5,000 to $7,499 | 18 (3.0%) | 8 (2.4%) |
| $7,500 to $9,999 | 0 (0.0%) | 14 (4.2%) |
| $10,000 to $12,499 | 38 (6.4%) | 13 (3.9%) |
| $12,500 to $14,999 | 0 (0.0%) | 14 (4.2%) |
| $15,000 to $17,499 | 6 (1.0%) | 95 (28.4%) |
| $17,500 to $19,999 | 41 (6.9%) | 7 (2.1%) |
| $20,000 to $22,499 | 30 (5.0%) | 12 (3.6%) |
| $22,500 to $24,999 | 0 (0.0%) | 0 (0.0%) |
| $25,000 to $29,999 | 0 (0.0%) | 7 (2.1%) |
| $30,000 to $34,999 | 0 (0.0%) | 0 (0.0%) |
| $35,000 to $39,999 | 169 (28.4%) | 0 (0.0%) |
| $40,000 to $44,999 | 51 (8.6%) | 23 (6.9%) |
| $45,000 to $49,999 | 39 (6.6%) | 10 (3.0%) |
| $50,000 to $54,999 | 35 (5.9%) | 0 (0.0%) |
| $55,000 to $64,999 | 7 (1.2%) | 0 (0.0%) |
| $65,000 to $74,999 | 27 (4.5%) | 12 (3.6%) |
| $75,000 to $99,999 | 19 (3.2%) | 9 (2.7%) |
| $100,000+ | 80 (13.5%) | 13 (3.9%) |
| Total | 595 (100.0%) | 335 (100.0%) |
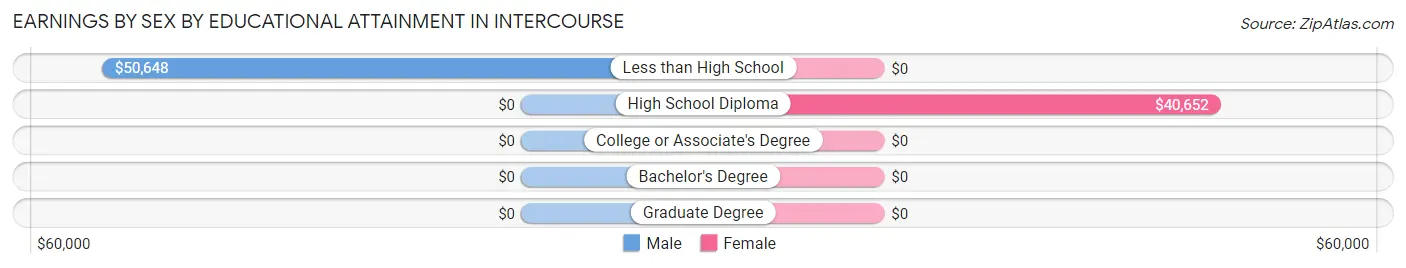
Earnings by Sex by Educational Attainment in Intercourse
| Educational Attainment | Male Income | Female Income |
| Less than High School | $50,648 | $0 |
| High School Diploma | - | - |
| College or Associate's Degree | - | - |
| Bachelor's Degree | - | - |
| Graduate Degree | - | - |
| Total | $46,250 | $0 |
Family Income in Intercourse
Family Income Brackets in Intercourse
According to the Intercourse family income data, there are 127 families falling into the $100,000 to $149,999 income range, which is the most common income bracket and makes up 35.9% of all families.
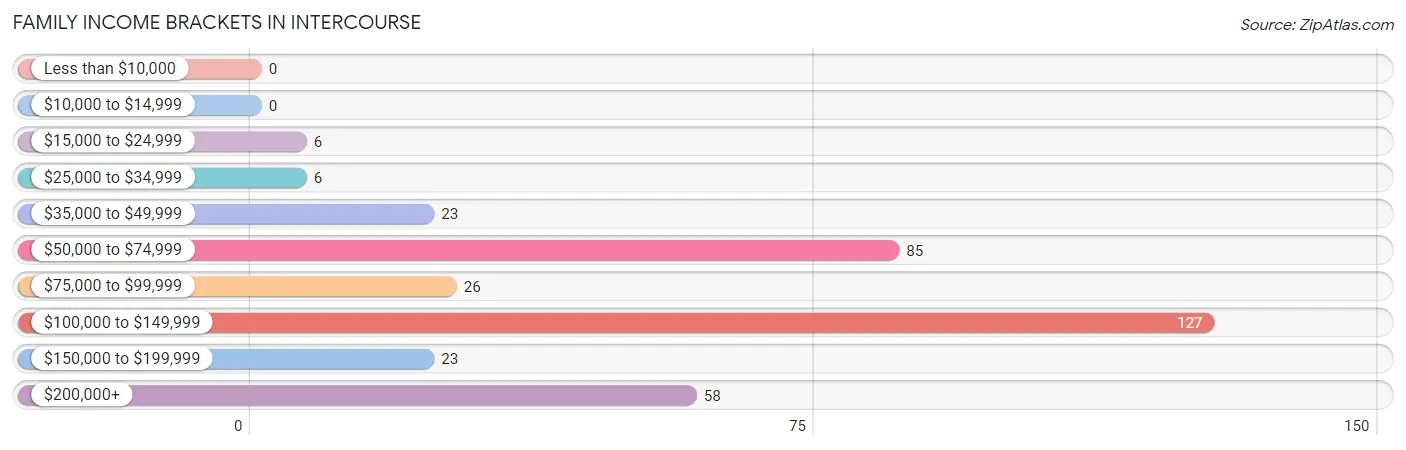
| Income Bracket | # Families | % Families |
| Less than $10,000 | 0 | 0.0% |
| $10,000 to $14,999 | 0 | 0.0% |
| $15,000 to $24,999 | 6 | 1.7% |
| $25,000 to $34,999 | 6 | 1.7% |
| $35,000 to $49,999 | 23 | 6.5% |
| $50,000 to $74,999 | 85 | 24.0% |
| $75,000 to $99,999 | 26 | 7.3% |
| $100,000 to $149,999 | 127 | 35.9% |
| $150,000 to $199,999 | 23 | 6.5% |
| $200,000+ | 58 | 16.4% |
Family Income by Famaliy Size in Intercourse
3-person families (25 | 7.1%) account for the highest median family income in Intercourse with $250,001 per family, while 3-person families (25 | 7.1%) have the highest median income of $83,334 per family member.
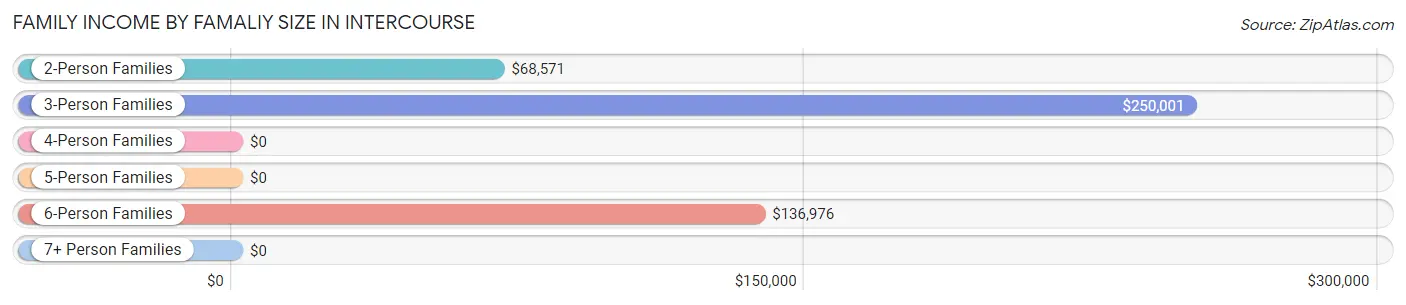
| Income Bracket | # Families | Median Income |
| 2-Person Families | 192 (54.2%) | $68,571 |
| 3-Person Families | 25 (7.1%) | $250,001 |
| 4-Person Families | 0 (0.0%) | $0 |
| 5-Person Families | 23 (6.5%) | $0 |
| 6-Person Families | 49 (13.8%) | $136,976 |
| 7+ Person Families | 65 (18.4%) | $0 |
| Total | 354 (100.0%) | $118,110 |
Family Income by Number of Earners in Intercourse
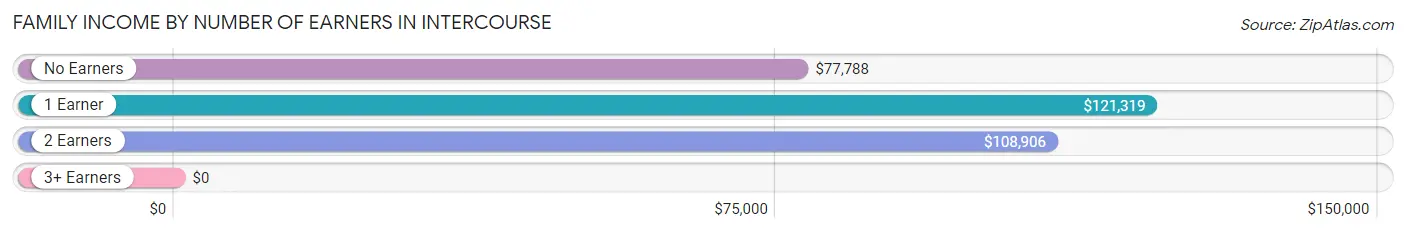
| Number of Earners | # Families | Median Income |
| No Earners | 73 (20.6%) | $77,788 |
| 1 Earner | 141 (39.8%) | $121,319 |
| 2 Earners | 47 (13.3%) | $108,906 |
| 3+ Earners | 93 (26.3%) | $0 |
| Total | 354 (100.0%) | $118,110 |
Household Income in Intercourse
Household Income Brackets in Intercourse
With 154 households falling in the category, the $100,000 to $149,999 income range is the most frequent in Intercourse, accounting for 32.2% of all households.
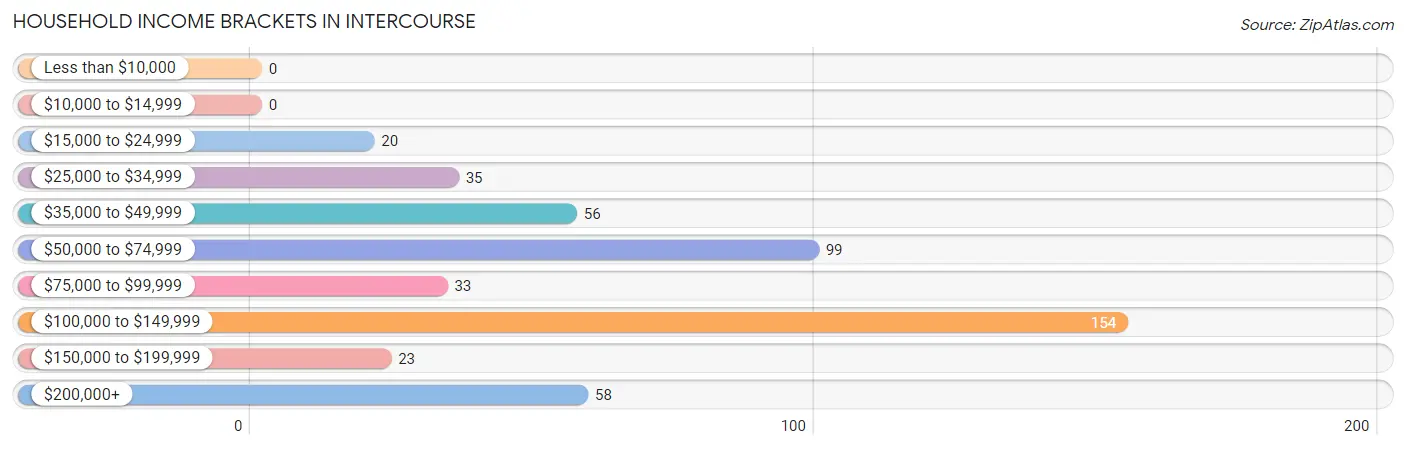
| Income Bracket | # Households | % Households |
| Less than $10,000 | 0 | 0.0% |
| $10,000 to $14,999 | 0 | 0.0% |
| $15,000 to $24,999 | 20 | 4.2% |
| $25,000 to $34,999 | 35 | 7.3% |
| $35,000 to $49,999 | 56 | 11.7% |
| $50,000 to $74,999 | 99 | 20.7% |
| $75,000 to $99,999 | 33 | 6.9% |
| $100,000 to $149,999 | 154 | 32.2% |
| $150,000 to $199,999 | 23 | 4.8% |
| $200,000+ | 58 | 12.1% |
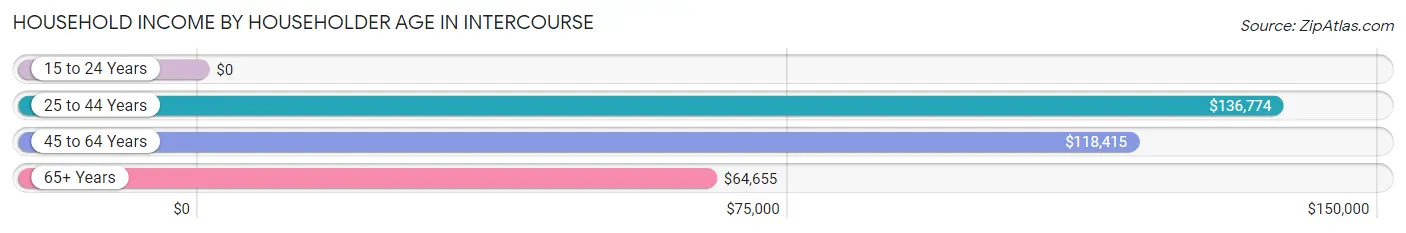
Household Income by Householder Age in Intercourse
The median household income in Intercourse is $98,571, with the highest median household income of $136,774 found in the 25 to 44 years age bracket for the primary householder. A total of 64 households (13.4%) fall into this category.
| Income Bracket | # Households | Median Income |
| 15 to 24 Years | 0 (0.0%) | $0 |
| 25 to 44 Years | 64 (13.4%) | $136,774 |
| 45 to 64 Years | 130 (27.2%) | $118,415 |
| 65+ Years | 284 (59.4%) | $64,655 |
| Total | 478 (100.0%) | $98,571 |
Poverty in Intercourse
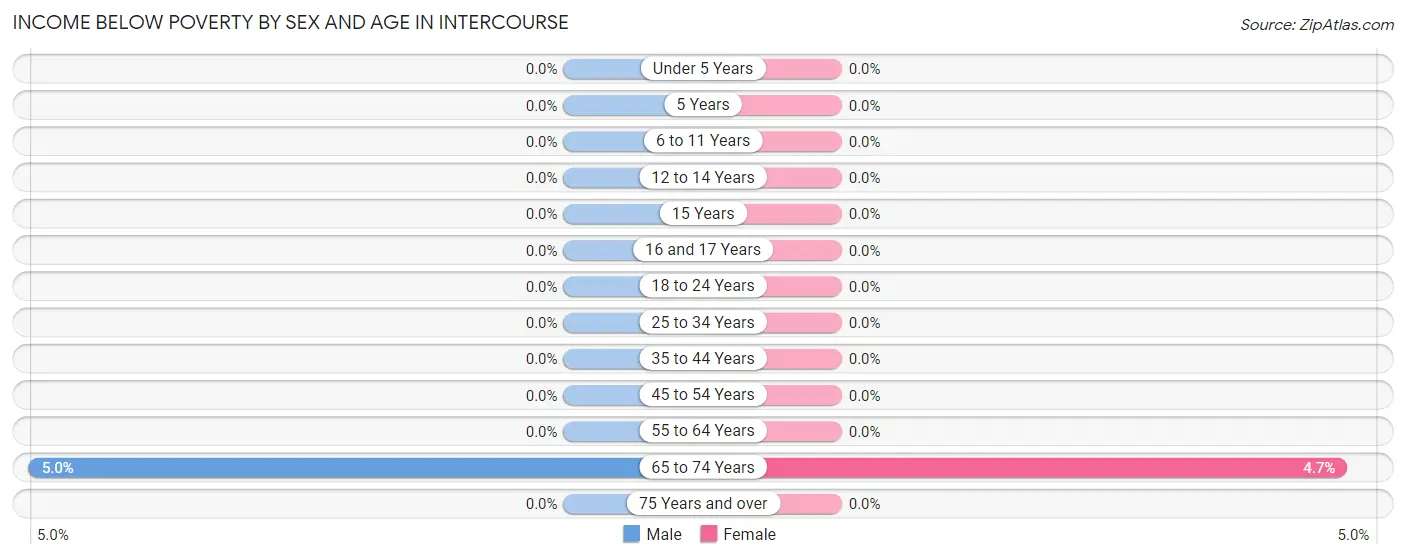
Income Below Poverty by Sex and Age in Intercourse
With 0.7% poverty level for males and 0.7% for females among the residents of Intercourse, 65 to 74 year old males and 65 to 74 year old females are the most vulnerable to poverty, with 6 males (5.0%) and 6 females (4.7%) in their respective age groups living below the poverty level.
| Age Bracket | Male | Female |
| Under 5 Years | 0 (0.0%) | 0 (0.0%) |
| 5 Years | 0 (0.0%) | 0 (0.0%) |
| 6 to 11 Years | 0 (0.0%) | 0 (0.0%) |
| 12 to 14 Years | 0 (0.0%) | 0 (0.0%) |
| 15 Years | 0 (0.0%) | 0 (0.0%) |
| 16 and 17 Years | 0 (0.0%) | 0 (0.0%) |
| 18 to 24 Years | 0 (0.0%) | 0 (0.0%) |
| 25 to 34 Years | 0 (0.0%) | 0 (0.0%) |
| 35 to 44 Years | 0 (0.0%) | 0 (0.0%) |
| 45 to 54 Years | 0 (0.0%) | 0 (0.0%) |
| 55 to 64 Years | 0 (0.0%) | 0 (0.0%) |
| 65 to 74 Years | 6 (5.0%) | 6 (4.7%) |
| 75 Years and over | 0 (0.0%) | 0 (0.0%) |
| Total | 6 (0.7%) | 6 (0.7%) |
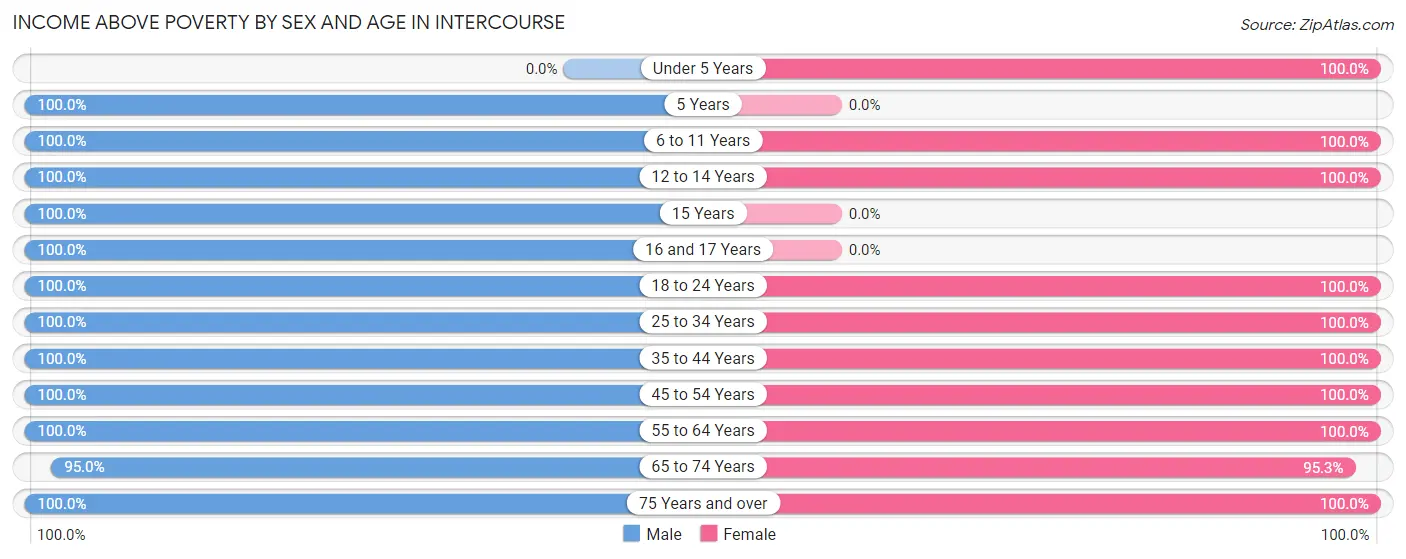
Income Above Poverty by Sex and Age in Intercourse
According to the poverty statistics in Intercourse, males aged 5 years and females aged under 5 years are the age groups that are most secure financially, with 100.0% of males and 100.0% of females in these age groups living above the poverty line.
| Age Bracket | Male | Female |
| Under 5 Years | 0 (0.0%) | 39 (100.0%) |
| 5 Years | 11 (100.0%) | 0 (0.0%) |
| 6 to 11 Years | 93 (100.0%) | 49 (100.0%) |
| 12 to 14 Years | 10 (100.0%) | 123 (100.0%) |
| 15 Years | 7 (100.0%) | 0 (0.0%) |
| 16 and 17 Years | 79 (100.0%) | 0 (0.0%) |
| 18 to 24 Years | 157 (100.0%) | 123 (100.0%) |
| 25 to 34 Years | 91 (100.0%) | 76 (100.0%) |
| 35 to 44 Years | 42 (100.0%) | 89 (100.0%) |
| 45 to 54 Years | 62 (100.0%) | 30 (100.0%) |
| 55 to 64 Years | 56 (100.0%) | 93 (100.0%) |
| 65 to 74 Years | 115 (95.0%) | 122 (95.3%) |
| 75 Years and over | 73 (100.0%) | 139 (100.0%) |
| Total | 796 (99.3%) | 883 (99.3%) |
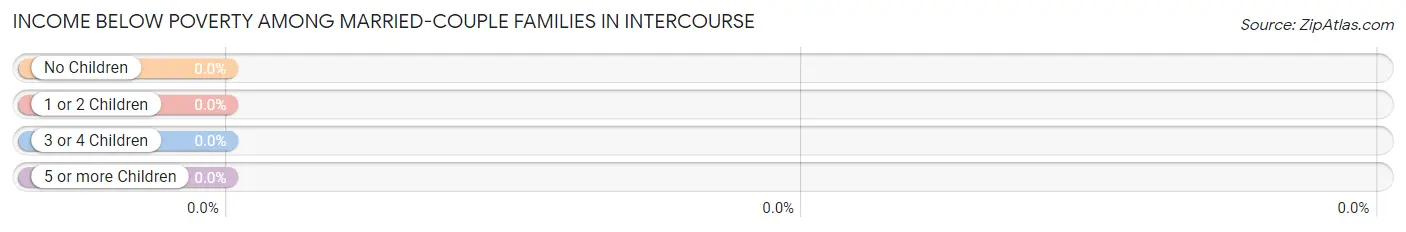
Income Below Poverty Among Married-Couple Families in Intercourse
| Children | Above Poverty | Below Poverty |
| No Children | 237 (100.0%) | 0 (0.0%) |
| 1 or 2 Children | 9 (100.0%) | 0 (0.0%) |
| 3 or 4 Children | 95 (100.0%) | 0 (0.0%) |
| 5 or more Children | 0 (0.0%) | 0 (0.0%) |
| Total | 341 (100.0%) | 0 (0.0%) |
Income Below Poverty Among Single-Parent Households in Intercourse
| Children | Single Father | Single Mother |
| No Children | 0 (0.0%) | 0 (0.0%) |
| 1 or 2 Children | 0 (0.0%) | 0 (0.0%) |
| 3 or 4 Children | 0 (0.0%) | 0 (0.0%) |
| 5 or more Children | 0 (0.0%) | 0 (0.0%) |
| Total | 0 (0.0%) | 0 (0.0%) |
Income Below Poverty Among Married-Couple vs Single-Parent Households in Intercourse
| Children | Married-Couple Families | Single-Parent Households |
| No Children | 0 (0.0%) | 0 (0.0%) |
| 1 or 2 Children | 0 (0.0%) | 0 (0.0%) |
| 3 or 4 Children | 0 (0.0%) | 0 (0.0%) |
| 5 or more Children | 0 (0.0%) | 0 (0.0%) |
| Total | 0 (0.0%) | 0 (0.0%) |
Race in Intercourse
The most populous races in Intercourse are , and White / Caucasian (1,691 | 100.0%).
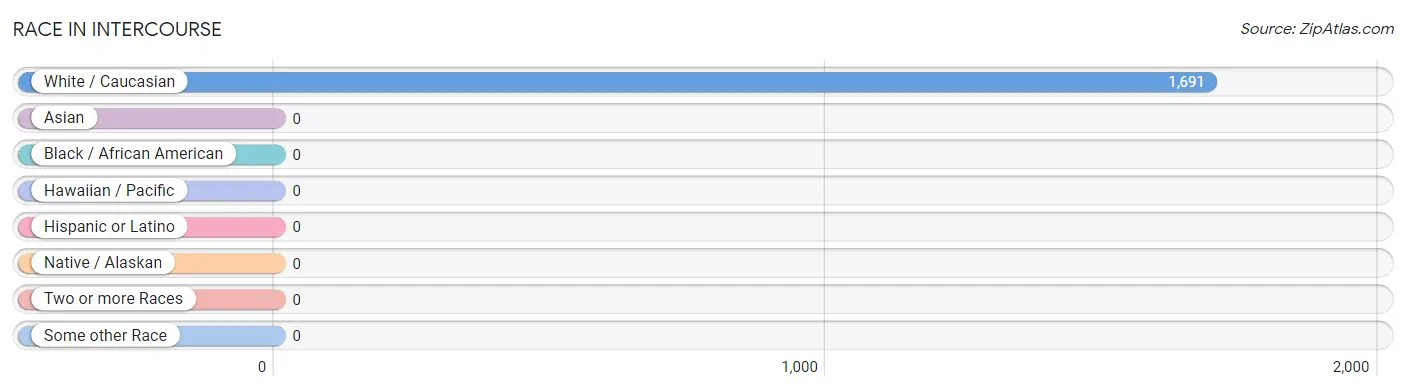
| Race | # Population | % Population |
| Asian | 0 | 0.0% |
| Black / African American | 0 | 0.0% |
| Hawaiian / Pacific | 0 | 0.0% |
| Hispanic or Latino | 0 | 0.0% |
| Native / Alaskan | 0 | 0.0% |
| White / Caucasian | 1,691 | 100.0% |
| Two or more Races | 0 | 0.0% |
| Some other Race | 0 | 0.0% |
| Total | 1,691 | 100.0% |
Ancestry in Intercourse
The most populous ancestries reported in Intercourse are German (902 | 53.3%), English (647 | 38.3%), Irish (151 | 8.9%), Pennsylvania German (95 | 5.6%), and American (86 | 5.1%), together accounting for 111.2% of all Intercourse residents.
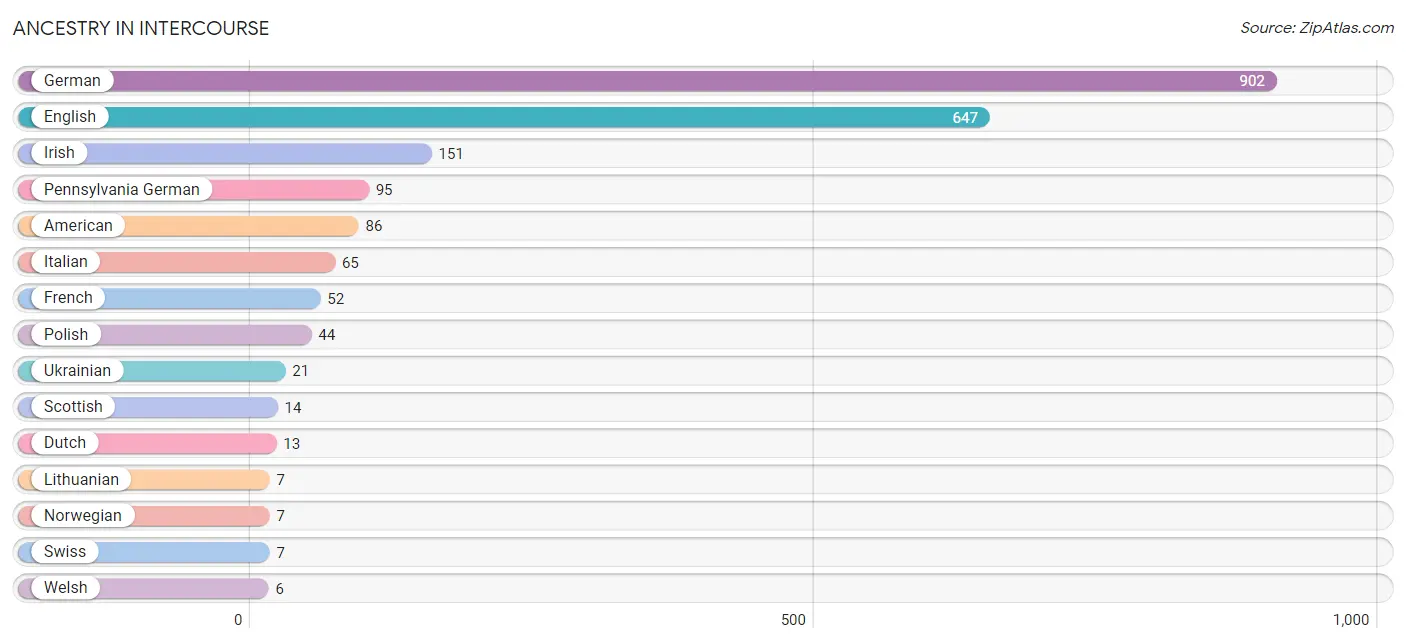
| Ancestry | # Population | % Population |
| American | 86 | 5.1% |
| British | 3 | 0.2% |
| Dutch | 13 | 0.8% |
| English | 647 | 38.3% |
| French | 52 | 3.1% |
| German | 902 | 53.3% |
| Irish | 151 | 8.9% |
| Italian | 65 | 3.8% |
| Lithuanian | 7 | 0.4% |
| Northern European | 3 | 0.2% |
| Norwegian | 7 | 0.4% |
| Pennsylvania German | 95 | 5.6% |
| Polish | 44 | 2.6% |
| Scottish | 14 | 0.8% |
| Swiss | 7 | 0.4% |
| Ukrainian | 21 | 1.2% |
| Welsh | 6 | 0.4% | View All 17 Rows |
Immigrants in Intercourse
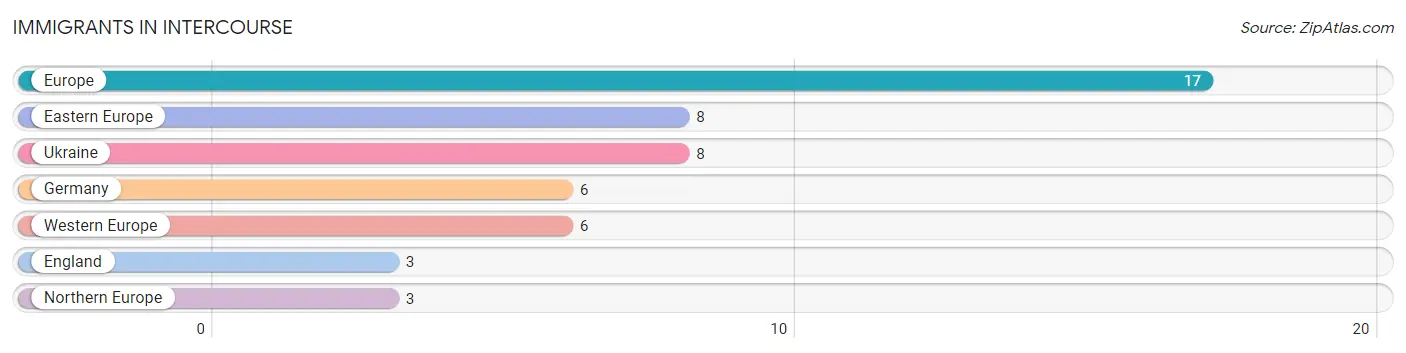
The most numerous immigrant groups reported in Intercourse came from Europe (17 | 1.0%), Eastern Europe (8 | 0.5%), Ukraine (8 | 0.5%), Germany (6 | 0.4%), and Western Europe (6 | 0.4%), together accounting for 2.6% of all Intercourse residents.
| Immigration Origin | # Population | % Population |
| Eastern Europe | 8 | 0.5% |
| England | 3 | 0.2% |
| Europe | 17 | 1.0% |
| Germany | 6 | 0.4% |
| Northern Europe | 3 | 0.2% |
| Ukraine | 8 | 0.5% |
| Western Europe | 6 | 0.4% | View All 7 Rows |
Sex and Age in Intercourse
Sex and Age in Intercourse
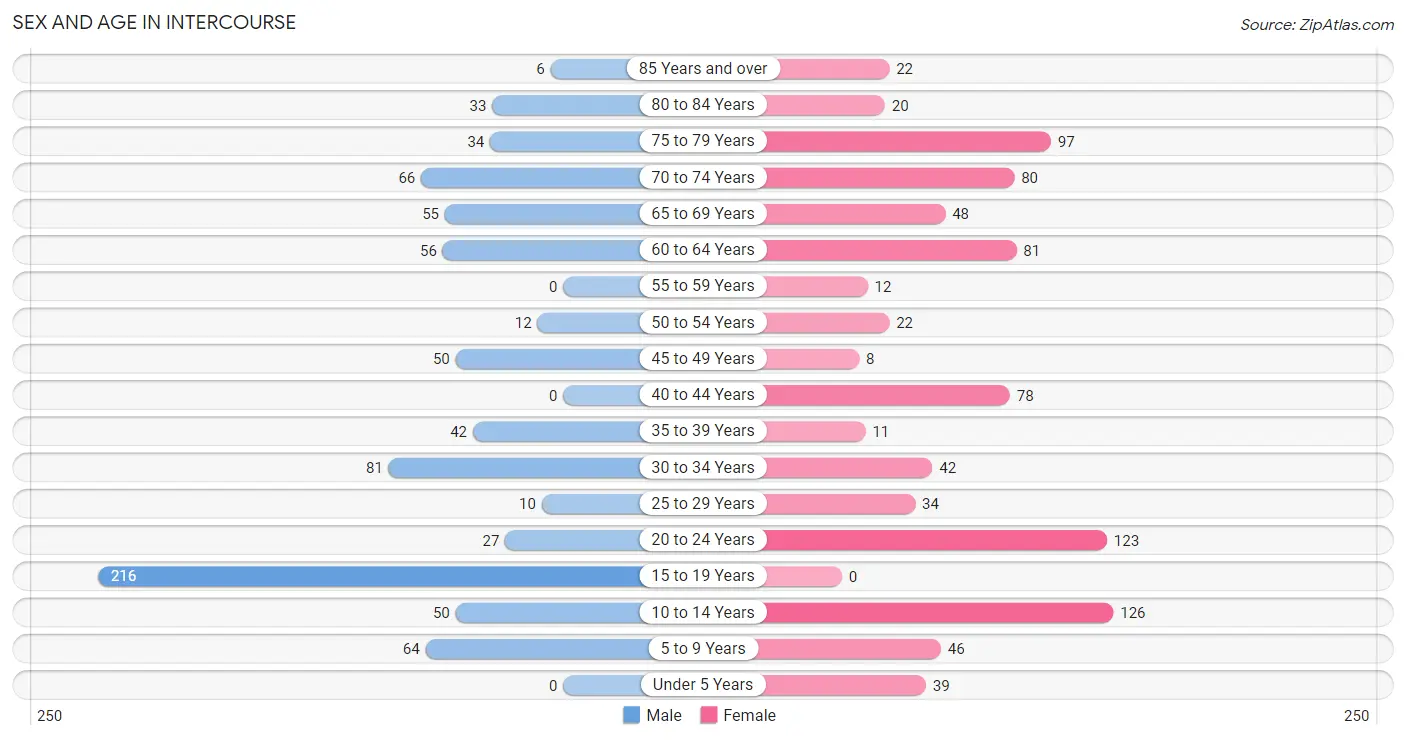
The most populous age groups in Intercourse are 15 to 19 Years (216 | 26.9%) for men and 10 to 14 Years (126 | 14.2%) for women.
| Age Bracket | Male | Female |
| Under 5 Years | 0 (0.0%) | 39 (4.4%) |
| 5 to 9 Years | 64 (8.0%) | 46 (5.2%) |
| 10 to 14 Years | 50 (6.2%) | 126 (14.2%) |
| 15 to 19 Years | 216 (26.9%) | 0 (0.0%) |
| 20 to 24 Years | 27 (3.4%) | 123 (13.8%) |
| 25 to 29 Years | 10 (1.3%) | 34 (3.8%) |
| 30 to 34 Years | 81 (10.1%) | 42 (4.7%) |
| 35 to 39 Years | 42 (5.2%) | 11 (1.2%) |
| 40 to 44 Years | 0 (0.0%) | 78 (8.8%) |
| 45 to 49 Years | 50 (6.2%) | 8 (0.9%) |
| 50 to 54 Years | 12 (1.5%) | 22 (2.5%) |
| 55 to 59 Years | 0 (0.0%) | 12 (1.3%) |
| 60 to 64 Years | 56 (7.0%) | 81 (9.1%) |
| 65 to 69 Years | 55 (6.9%) | 48 (5.4%) |
| 70 to 74 Years | 66 (8.2%) | 80 (9.0%) |
| 75 to 79 Years | 34 (4.2%) | 97 (10.9%) |
| 80 to 84 Years | 33 (4.1%) | 20 (2.2%) |
| 85 Years and over | 6 (0.7%) | 22 (2.5%) |
| Total | 802 (100.0%) | 889 (100.0%) |
Families and Households in Intercourse
Median Family Size in Intercourse
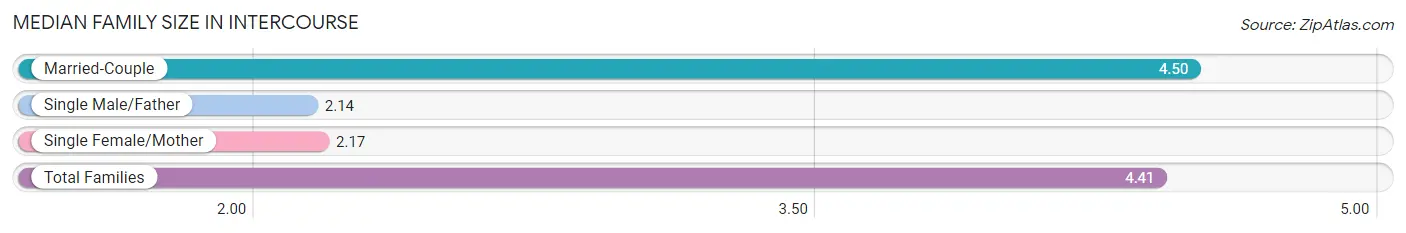
The median family size in Intercourse is 4.41 persons per family, with married-couple families (341 | 96.3%) accounting for the largest median family size of 4.5 persons per family. On the other hand, single male/father families (7 | 2.0%) represent the smallest median family size with 2.14 persons per family.
| Family Type | # Families | Family Size |
| Married-Couple | 341 (96.3%) | 4.50 |
| Single Male/Father | 7 (2.0%) | 2.14 |
| Single Female/Mother | 6 (1.7%) | 2.17 |
| Total Families | 354 (100.0%) | 4.41 |
Median Household Size in Intercourse
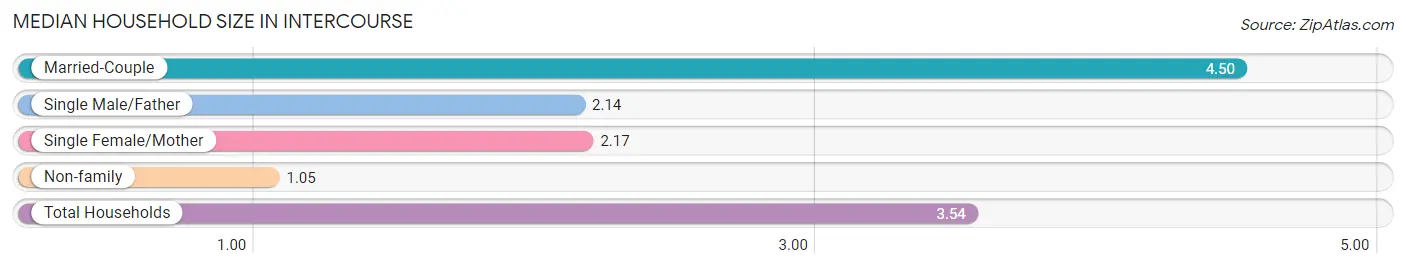
The median household size in Intercourse is 3.54 persons per household, with married-couple households (341 | 71.3%) accounting for the largest median household size of 4.5 persons per household. non-family households (124 | 25.9%) represent the smallest median household size with 1.05 persons per household.
| Household Type | # Households | Household Size |
| Married-Couple | 341 (71.3%) | 4.50 |
| Single Male/Father | 7 (1.5%) | 2.14 |
| Single Female/Mother | 6 (1.3%) | 2.17 |
| Non-family | 124 (25.9%) | 1.05 |
| Total Households | 478 (100.0%) | 3.54 |
Household Size by Marriage Status in Intercourse
Out of a total of 478 households in Intercourse, 354 (74.1%) are family households, while 124 (25.9%) are nonfamily households. The most numerous type of family households are 2-person households, comprising 192, and the most common type of nonfamily households are 1-person households, comprising 118.
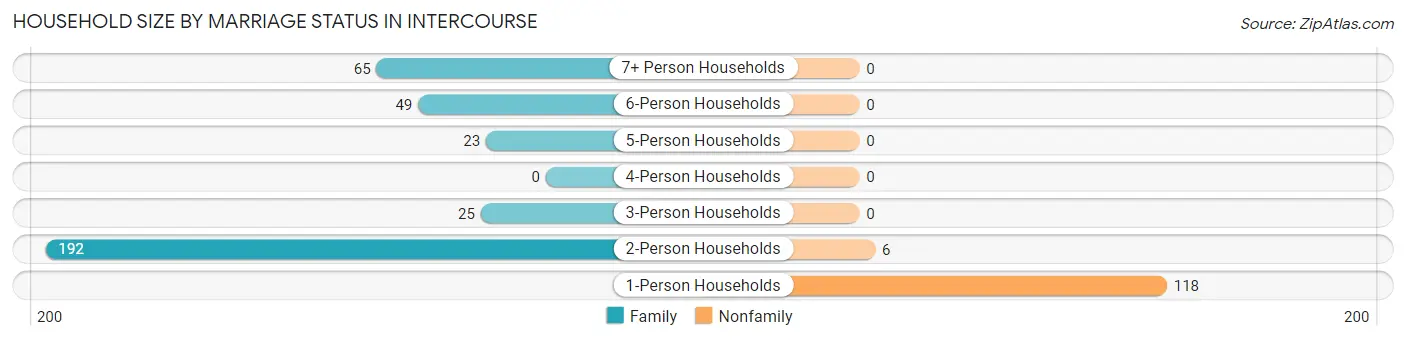
| Household Size | Family Households | Nonfamily Households |
| 1-Person Households | - | 118 (24.7%) |
| 2-Person Households | 192 (40.2%) | 6 (1.3%) |
| 3-Person Households | 25 (5.2%) | 0 (0.0%) |
| 4-Person Households | 0 (0.0%) | 0 (0.0%) |
| 5-Person Households | 23 (4.8%) | 0 (0.0%) |
| 6-Person Households | 49 (10.2%) | 0 (0.0%) |
| 7+ Person Households | 65 (13.6%) | 0 (0.0%) |
| Total | 354 (74.1%) | 124 (25.9%) |
Female Fertility in Intercourse
Fertility by Age in Intercourse
| Age Bracket | Women with Births | Births / 1,000 Women |
| 15 to 19 years | 0 (0.0%) | 0.0 |
| 20 to 34 years | 0 (0.0%) | 0.0 |
| 35 to 50 years | 0 (0.0%) | 0.0 |
| Total | 0 (0.0%) | 0.0 |
Fertility by Age by Marriage Status in Intercourse
| Age Bracket | Married | Unmarried |
| 15 to 19 years | 0 (0.0%) | 0 (0.0%) |
| 20 to 34 years | 0 (0.0%) | 0 (0.0%) |
| 35 to 50 years | 0 (0.0%) | 0 (0.0%) |
| Total | 0 (0.0%) | 0 (0.0%) |
Fertility by Education in Intercourse
| Educational Attainment | Women with Births | Births / 1,000 Women |
| Less than High School | 0 (0.0%) | 0.0 |
| High School Diploma | 0 (0.0%) | 0.0 |
| College or Associate's Degree | 0 (0.0%) | 0.0 |
| Bachelor's Degree | 0 (0.0%) | 0.0 |
| Graduate Degree | 0 (0.0%) | 0.0 |
| Total | 0 (0.0%) | 0.0 |
Fertility by Education by Marriage Status in Intercourse
| Educational Attainment | Married | Unmarried |
| Less than High School | 0 (0.0%) | 0 (0.0%) |
| High School Diploma | 0 (0.0%) | 0 (0.0%) |
| College or Associate's Degree | 0 (0.0%) | 0 (0.0%) |
| Bachelor's Degree | 0 (0.0%) | 0 (0.0%) |
| Graduate Degree | 0 (0.0%) | 0 (0.0%) |
| Total | 0 (0.0%) | 0 (0.0%) |
Employment Characteristics in Intercourse
Employment by Class of Employer in Intercourse
Among the 837 employed individuals in Intercourse, private company employees (598 | 71.5%), self-employed (not incorporated) (146 | 17.4%), and not-for-profit organizations (58 | 6.9%) make up the most common classes of employment.
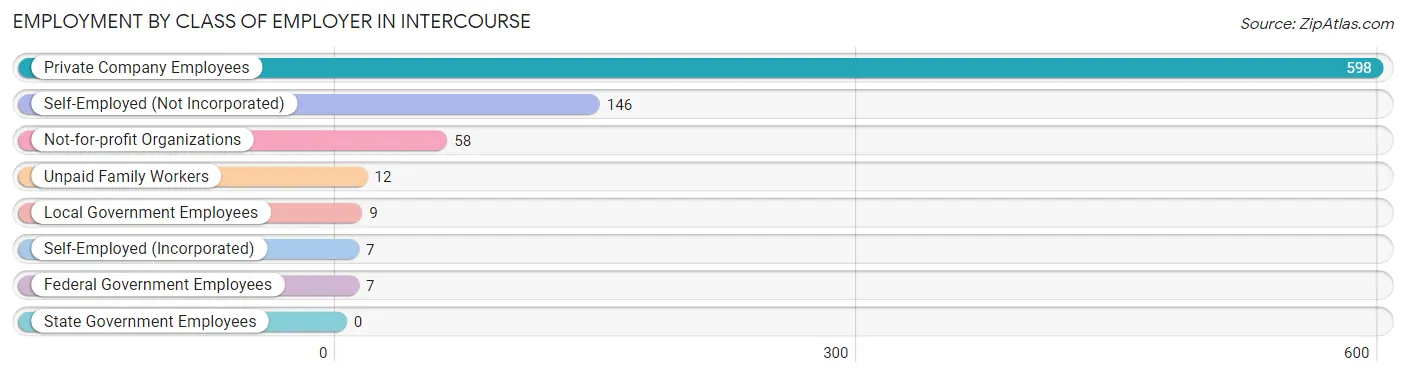
| Employer Class | # Employees | % Employees |
| Private Company Employees | 598 | 71.5% |
| Self-Employed (Incorporated) | 7 | 0.8% |
| Self-Employed (Not Incorporated) | 146 | 17.4% |
| Not-for-profit Organizations | 58 | 6.9% |
| Local Government Employees | 9 | 1.1% |
| State Government Employees | 0 | 0.0% |
| Federal Government Employees | 7 | 0.8% |
| Unpaid Family Workers | 12 | 1.4% |
| Total | 837 | 100.0% |
Employment Status by Age in Intercourse
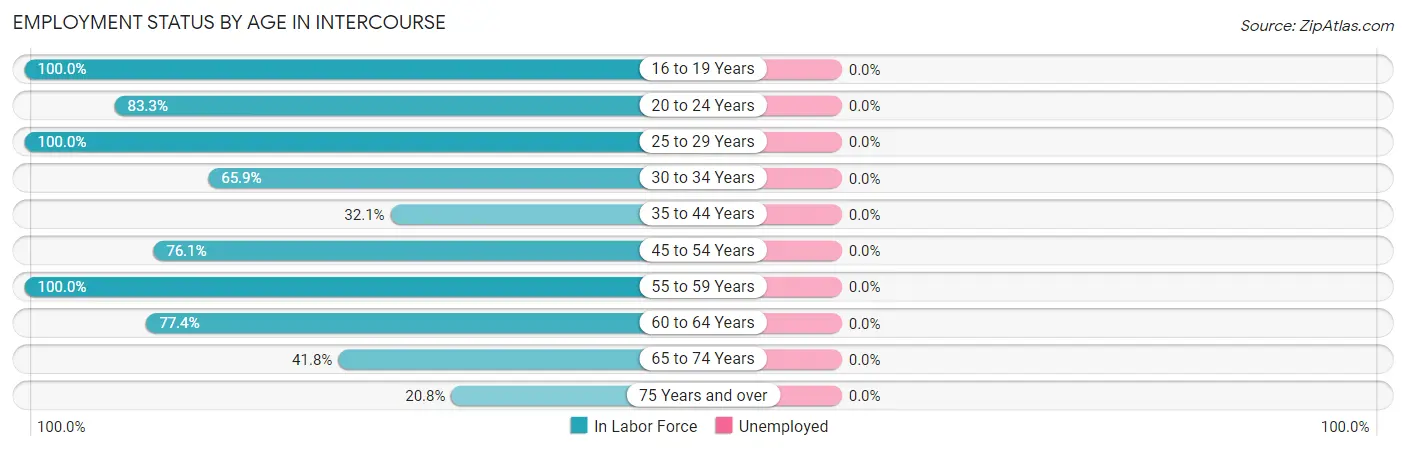
| Age Bracket | In Labor Force | Unemployed |
| 16 to 19 Years | 209 (100.0%) | 0 (0.0%) |
| 20 to 24 Years | 125 (83.3%) | 0 (0.0%) |
| 25 to 29 Years | 44 (100.0%) | 0 (0.0%) |
| 30 to 34 Years | 81 (65.9%) | 0 (0.0%) |
| 35 to 44 Years | 42 (32.1%) | 0 (0.0%) |
| 45 to 54 Years | 70 (76.1%) | 0 (0.0%) |
| 55 to 59 Years | 12 (100.0%) | 0 (0.0%) |
| 60 to 64 Years | 106 (77.4%) | 0 (0.0%) |
| 65 to 74 Years | 104 (41.8%) | 0 (0.0%) |
| 75 Years and over | 44 (20.8%) | 0 (0.0%) |
| Total | 837 (61.6%) | 0 (0.0%) |
Employment Status by Educational Attainment in Intercourse
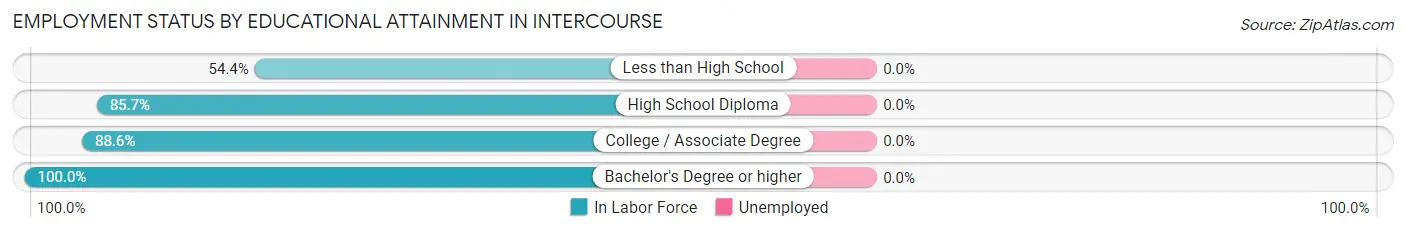
| Educational Attainment | In Labor Force | Unemployed |
| Less than High School | 202 (54.4%) | 0 (0.0%) |
| High School Diploma | 42 (85.7%) | 0 (0.0%) |
| College / Associate Degree | 62 (88.6%) | 0 (0.0%) |
| Bachelor's Degree or higher | 49 (100.0%) | 0 (0.0%) |
| Total | 355 (65.9%) | 0 (0.0%) |
Employment Occupations by Sex in Intercourse
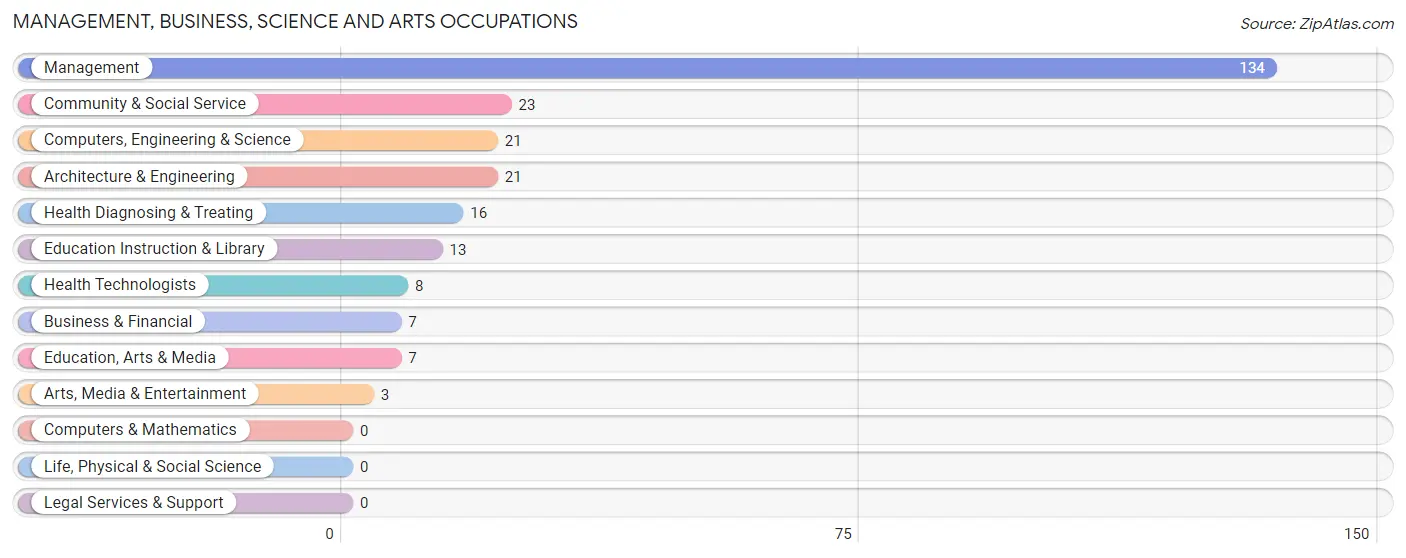
Management, Business, Science and Arts Occupations
The most common Management, Business, Science and Arts occupations in Intercourse are Management (134 | 16.0%), Community & Social Service (23 | 2.8%), Computers, Engineering & Science (21 | 2.5%), Architecture & Engineering (21 | 2.5%), and Health Diagnosing & Treating (16 | 1.9%).
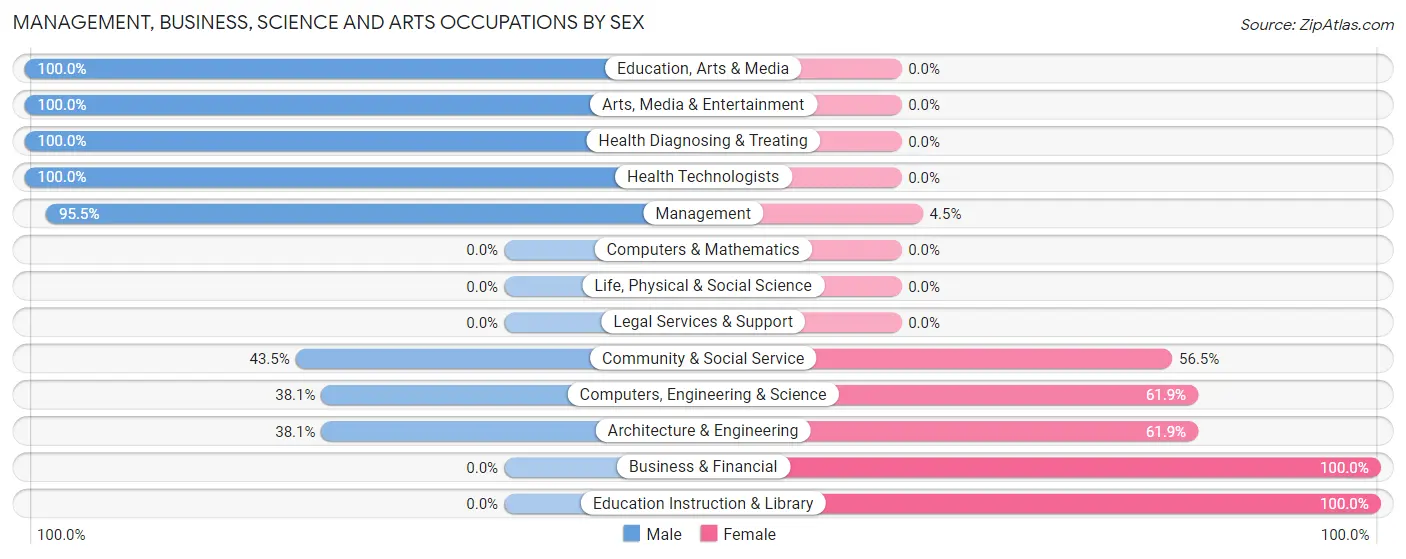
Management, Business, Science and Arts Occupations by Sex
Within the Management, Business, Science and Arts occupations in Intercourse, the most male-oriented occupations are Education, Arts & Media (100.0%), Arts, Media & Entertainment (100.0%), and Health Diagnosing & Treating (100.0%), while the most female-oriented occupations are Business & Financial (100.0%), Education Instruction & Library (100.0%), and Computers, Engineering & Science (61.9%).
| Occupation | Male | Female |
| Management | 128 (95.5%) | 6 (4.5%) |
| Business & Financial | 0 (0.0%) | 7 (100.0%) |
| Computers, Engineering & Science | 8 (38.1%) | 13 (61.9%) |
| Computers & Mathematics | 0 (0.0%) | 0 (0.0%) |
| Architecture & Engineering | 8 (38.1%) | 13 (61.9%) |
| Life, Physical & Social Science | 0 (0.0%) | 0 (0.0%) |
| Community & Social Service | 10 (43.5%) | 13 (56.5%) |
| Education, Arts & Media | 7 (100.0%) | 0 (0.0%) |
| Legal Services & Support | 0 (0.0%) | 0 (0.0%) |
| Education Instruction & Library | 0 (0.0%) | 13 (100.0%) |
| Arts, Media & Entertainment | 3 (100.0%) | 0 (0.0%) |
| Health Diagnosing & Treating | 16 (100.0%) | 0 (0.0%) |
| Health Technologists | 8 (100.0%) | 0 (0.0%) |
| Total (Category) | 162 (80.6%) | 39 (19.4%) |
| Total (Overall) | 580 (69.3%) | 257 (30.7%) |
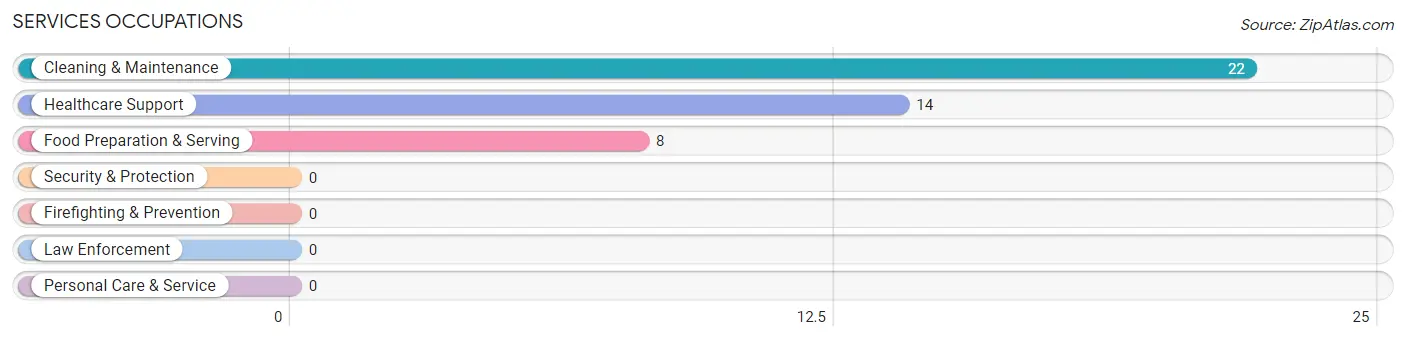
Services Occupations
The most common Services occupations in Intercourse are Cleaning & Maintenance (22 | 2.6%), Healthcare Support (14 | 1.7%), and Food Preparation & Serving (8 | 1.0%).
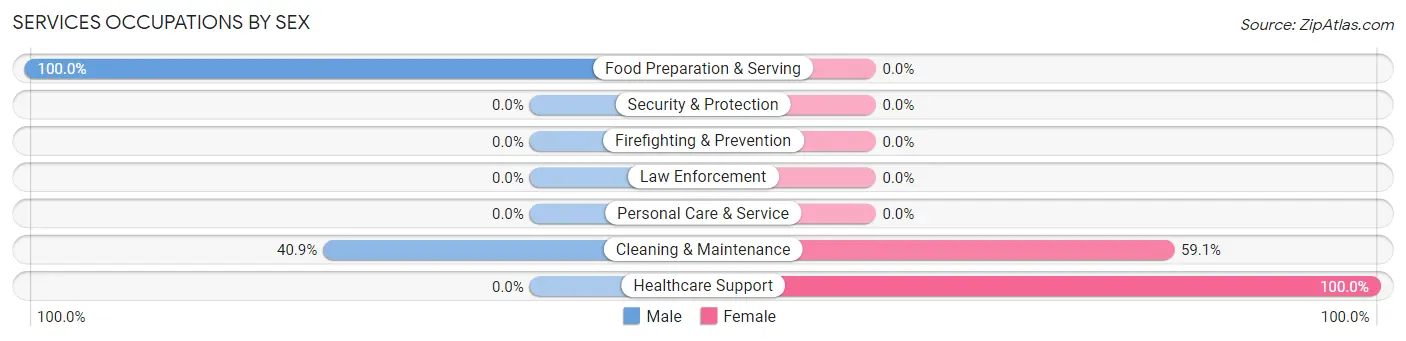
Services Occupations by Sex
Within the Services occupations in Intercourse, the most male-oriented occupations are Food Preparation & Serving (100.0%), and Cleaning & Maintenance (40.9%), while the most female-oriented occupations are Healthcare Support (100.0%), and Cleaning & Maintenance (59.1%).
| Occupation | Male | Female |
| Healthcare Support | 0 (0.0%) | 14 (100.0%) |
| Security & Protection | 0 (0.0%) | 0 (0.0%) |
| Firefighting & Prevention | 0 (0.0%) | 0 (0.0%) |
| Law Enforcement | 0 (0.0%) | 0 (0.0%) |
| Food Preparation & Serving | 8 (100.0%) | 0 (0.0%) |
| Cleaning & Maintenance | 9 (40.9%) | 13 (59.1%) |
| Personal Care & Service | 0 (0.0%) | 0 (0.0%) |
| Total (Category) | 17 (38.6%) | 27 (61.4%) |
| Total (Overall) | 580 (69.3%) | 257 (30.7%) |
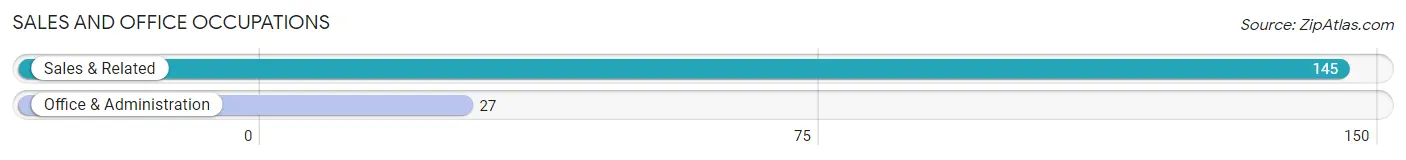
Sales and Office Occupations
The most common Sales and Office occupations in Intercourse are Sales & Related (145 | 17.3%), and Office & Administration (27 | 3.2%).
Sales and Office Occupations by Sex
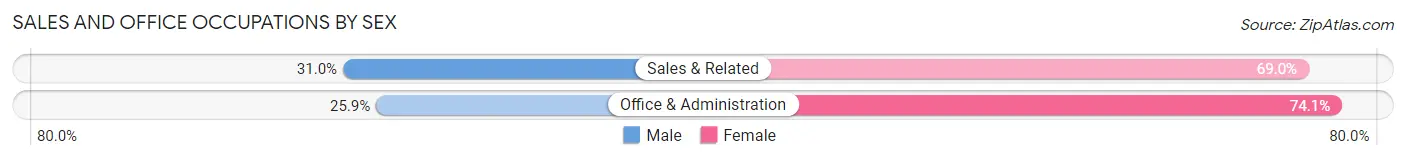
| Occupation | Male | Female |
| Sales & Related | 45 (31.0%) | 100 (69.0%) |
| Office & Administration | 7 (25.9%) | 20 (74.1%) |
| Total (Category) | 52 (30.2%) | 120 (69.8%) |
| Total (Overall) | 580 (69.3%) | 257 (30.7%) |
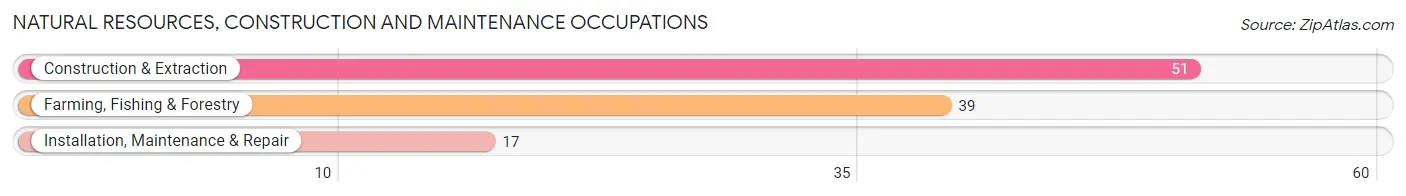
Natural Resources, Construction and Maintenance Occupations
The most common Natural Resources, Construction and Maintenance occupations in Intercourse are Construction & Extraction (51 | 6.1%), Farming, Fishing & Forestry (39 | 4.7%), and Installation, Maintenance & Repair (17 | 2.0%).
Natural Resources, Construction and Maintenance Occupations by Sex
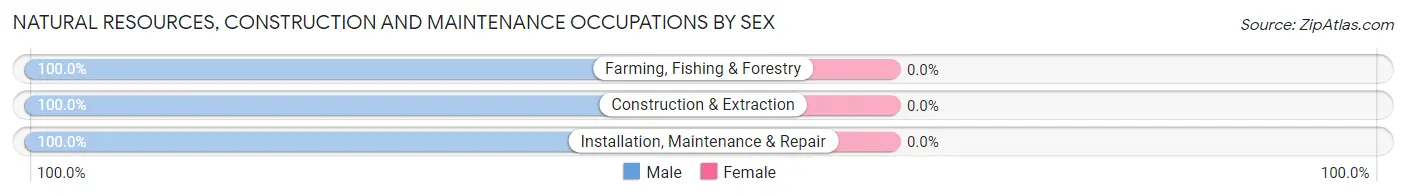
| Occupation | Male | Female |
| Farming, Fishing & Forestry | 39 (100.0%) | 0 (0.0%) |
| Construction & Extraction | 51 (100.0%) | 0 (0.0%) |
| Installation, Maintenance & Repair | 17 (100.0%) | 0 (0.0%) |
| Total (Category) | 107 (100.0%) | 0 (0.0%) |
| Total (Overall) | 580 (69.3%) | 257 (30.7%) |
Production, Transportation and Moving Occupations
The most common Production, Transportation and Moving occupations in Intercourse are Material Moving (184 | 22.0%), Production (98 | 11.7%), and Transportation (31 | 3.7%).
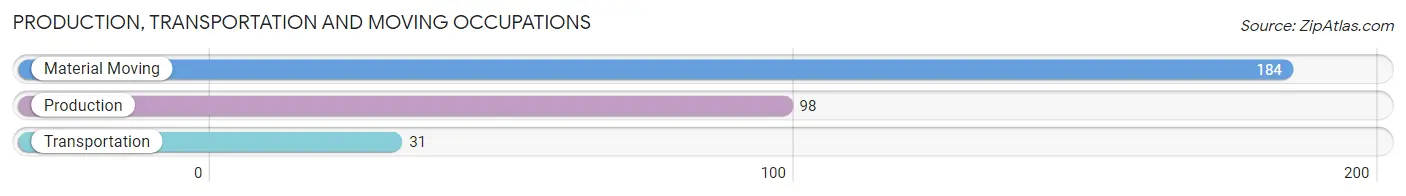
Production, Transportation and Moving Occupations by Sex
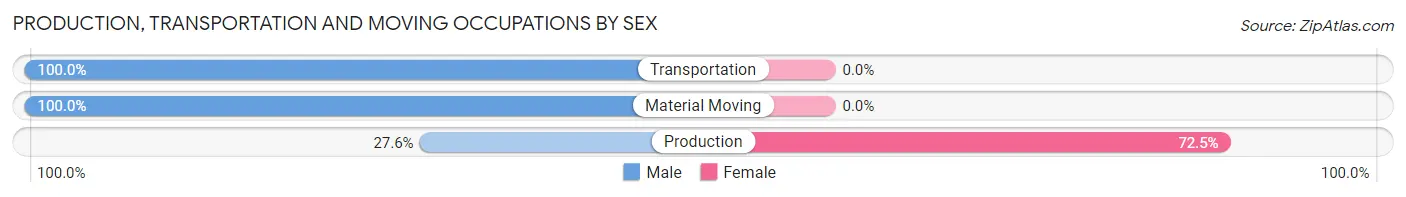
| Occupation | Male | Female |
| Production | 27 (27.6%) | 71 (72.5%) |
| Transportation | 31 (100.0%) | 0 (0.0%) |
| Material Moving | 184 (100.0%) | 0 (0.0%) |
| Total (Category) | 242 (77.3%) | 71 (22.7%) |
| Total (Overall) | 580 (69.3%) | 257 (30.7%) |
Employment Industries by Sex in Intercourse
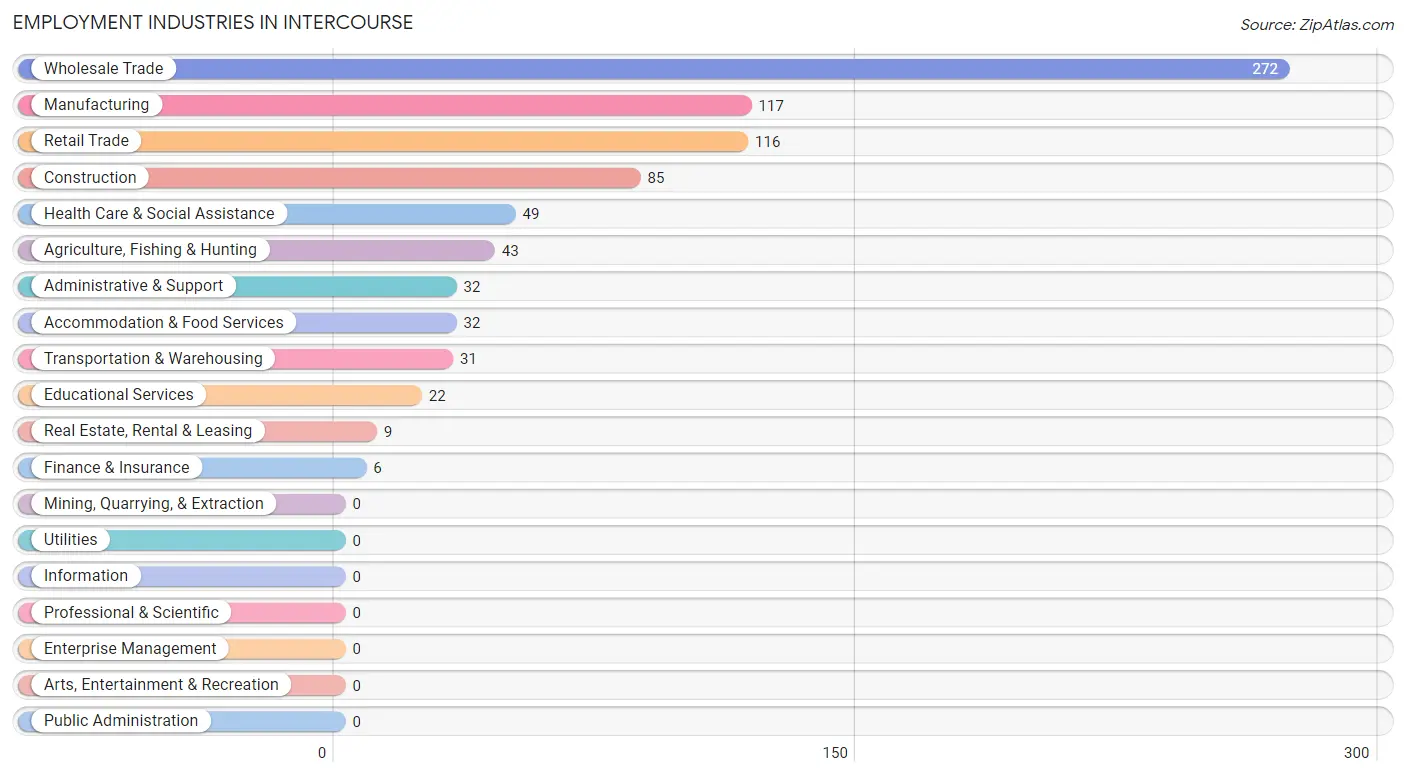
Employment Industries in Intercourse
The major employment industries in Intercourse include Wholesale Trade (272 | 32.5%), Manufacturing (117 | 14.0%), Retail Trade (116 | 13.9%), Construction (85 | 10.2%), and Health Care & Social Assistance (49 | 5.9%).
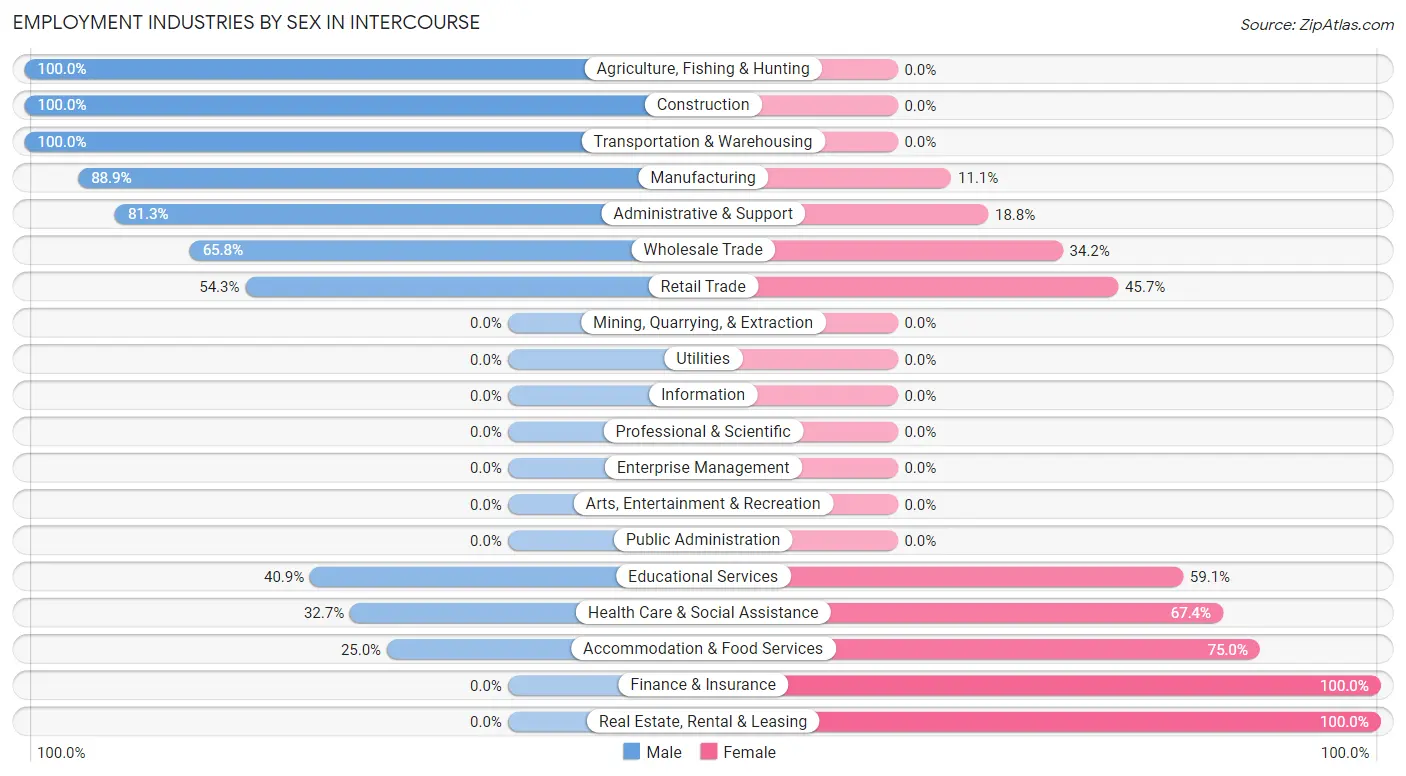
Employment Industries by Sex in Intercourse
The Intercourse industries that see more men than women are Agriculture, Fishing & Hunting (100.0%), Construction (100.0%), and Transportation & Warehousing (100.0%), whereas the industries that tend to have a higher number of women are Finance & Insurance (100.0%), Real Estate, Rental & Leasing (100.0%), and Accommodation & Food Services (75.0%).
| Industry | Male | Female |
| Agriculture, Fishing & Hunting | 43 (100.0%) | 0 (0.0%) |
| Mining, Quarrying, & Extraction | 0 (0.0%) | 0 (0.0%) |
| Construction | 85 (100.0%) | 0 (0.0%) |
| Manufacturing | 104 (88.9%) | 13 (11.1%) |
| Wholesale Trade | 179 (65.8%) | 93 (34.2%) |
| Retail Trade | 63 (54.3%) | 53 (45.7%) |
| Transportation & Warehousing | 31 (100.0%) | 0 (0.0%) |
| Utilities | 0 (0.0%) | 0 (0.0%) |
| Information | 0 (0.0%) | 0 (0.0%) |
| Finance & Insurance | 0 (0.0%) | 6 (100.0%) |
| Real Estate, Rental & Leasing | 0 (0.0%) | 9 (100.0%) |
| Professional & Scientific | 0 (0.0%) | 0 (0.0%) |
| Enterprise Management | 0 (0.0%) | 0 (0.0%) |
| Administrative & Support | 26 (81.2%) | 6 (18.8%) |
| Educational Services | 9 (40.9%) | 13 (59.1%) |
| Health Care & Social Assistance | 16 (32.7%) | 33 (67.3%) |
| Arts, Entertainment & Recreation | 0 (0.0%) | 0 (0.0%) |
| Accommodation & Food Services | 8 (25.0%) | 24 (75.0%) |
| Public Administration | 0 (0.0%) | 0 (0.0%) |
| Total | 580 (69.3%) | 257 (30.7%) |
Education in Intercourse
School Enrollment in Intercourse
The most common levels of schooling among the 391 students in Intercourse are middle school (117 | 29.9%), elementary school (99 | 25.3%), and high school (74 | 18.9%).
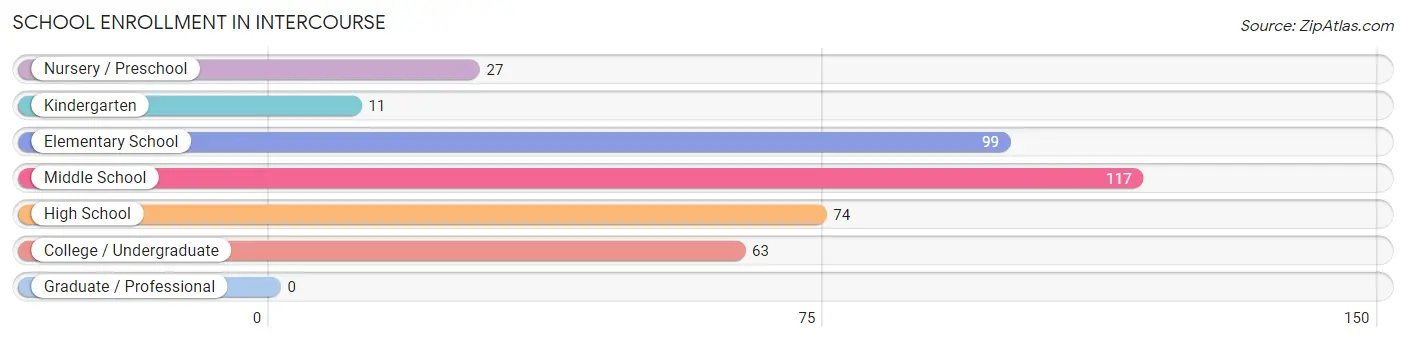
| School Level | # Students | % Students |
| Nursery / Preschool | 27 | 6.9% |
| Kindergarten | 11 | 2.8% |
| Elementary School | 99 | 25.3% |
| Middle School | 117 | 29.9% |
| High School | 74 | 18.9% |
| College / Undergraduate | 63 | 16.1% |
| Graduate / Professional | 0 | 0.0% |
| Total | 391 | 100.0% |
School Enrollment by Age by Funding Source in Intercourse
Out of a total of 391 students who are enrolled in schools in Intercourse, 334 (85.4%) attend a private institution, while the remaining 57 (14.6%) are enrolled in public schools. The age group of 3 to 4 year olds has the highest likelihood of being enrolled in private schools, with 27 (100.0% in the age bracket) enrolled. Conversely, the age group of 15 to 17 year olds has the lowest likelihood of being enrolled in a private school, with 7 (100.0% in the age bracket) attending a public institution.
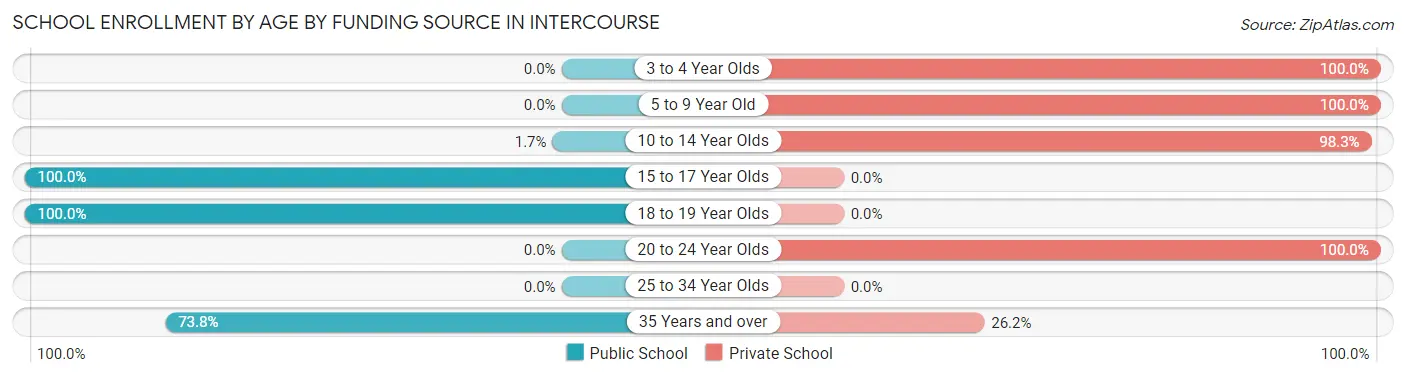
| Age Bracket | Public School | Private School |
| 3 to 4 Year Olds | 0 (0.0%) | 27 (100.0%) |
| 5 to 9 Year Old | 0 (0.0%) | 110 (100.0%) |
| 10 to 14 Year Olds | 3 (1.7%) | 173 (98.3%) |
| 15 to 17 Year Olds | 7 (100.0%) | 0 (0.0%) |
| 18 to 19 Year Olds | 16 (100.0%) | 0 (0.0%) |
| 20 to 24 Year Olds | 0 (0.0%) | 13 (100.0%) |
| 25 to 34 Year Olds | 0 (0.0%) | 0 (0.0%) |
| 35 Years and over | 31 (73.8%) | 11 (26.2%) |
| Total | 57 (14.6%) | 334 (85.4%) |
Educational Attainment by Field of Study in Intercourse
Business (44 | 21.9%), education (39 | 19.4%), physical & health sciences (21 | 10.4%), science & technology (21 | 10.4%), and computers & mathematics (20 | 10.0%) are the most common fields of study among 201 individuals in Intercourse who have obtained a bachelor's degree or higher.
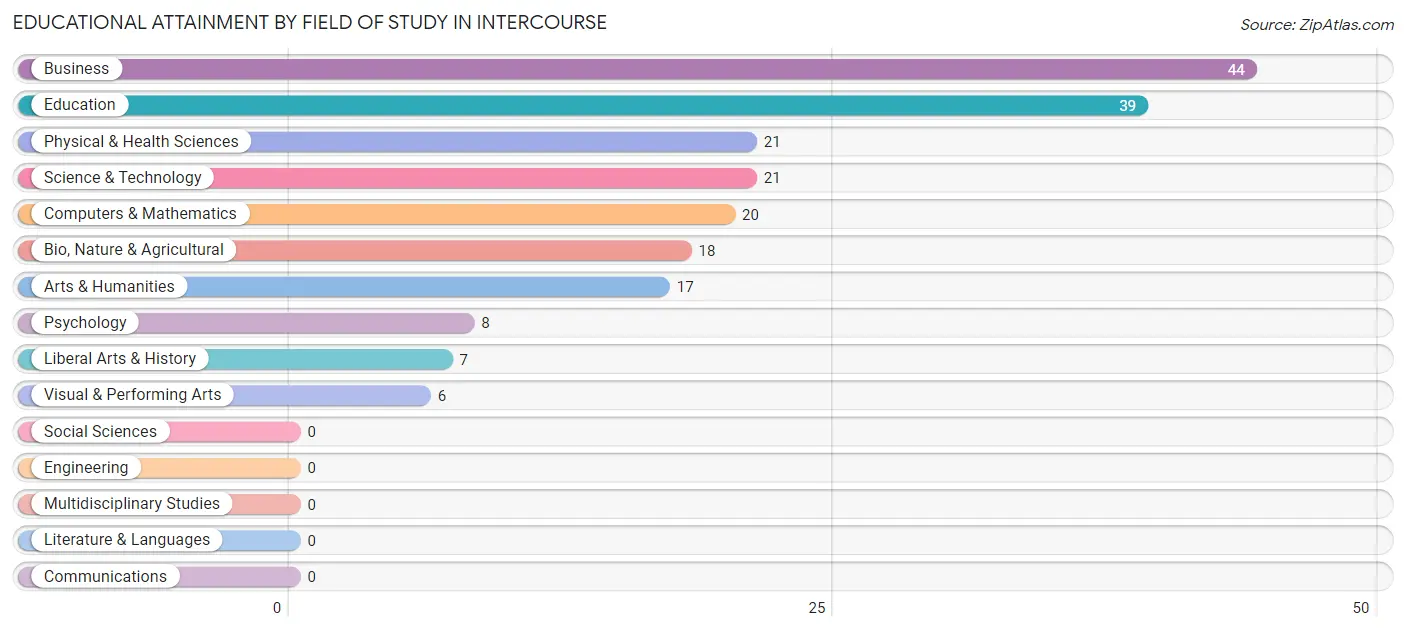
| Field of Study | # Graduates | % Graduates |
| Computers & Mathematics | 20 | 10.0% |
| Bio, Nature & Agricultural | 18 | 9.0% |
| Physical & Health Sciences | 21 | 10.4% |
| Psychology | 8 | 4.0% |
| Social Sciences | 0 | 0.0% |
| Engineering | 0 | 0.0% |
| Multidisciplinary Studies | 0 | 0.0% |
| Science & Technology | 21 | 10.4% |
| Business | 44 | 21.9% |
| Education | 39 | 19.4% |
| Literature & Languages | 0 | 0.0% |
| Liberal Arts & History | 7 | 3.5% |
| Visual & Performing Arts | 6 | 3.0% |
| Communications | 0 | 0.0% |
| Arts & Humanities | 17 | 8.5% |
| Total | 201 | 100.0% |
Transportation & Commute in Intercourse
Vehicle Availability by Sex in Intercourse
The most prevalent vehicle ownership categories in Intercourse are males with 4 vehicles (210, accounting for 36.2%) and females with 4 vehicles (71, making up 81.7%).
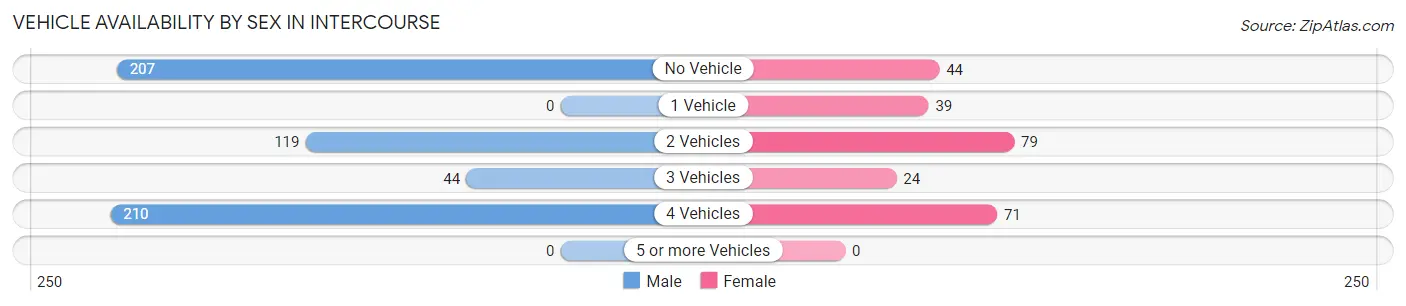
| Vehicles Available | Male | Female |
| No Vehicle | 207 (35.7%) | 44 (17.1%) |
| 1 Vehicle | 0 (0.0%) | 39 (15.2%) |
| 2 Vehicles | 119 (20.5%) | 79 (30.7%) |
| 3 Vehicles | 44 (7.6%) | 24 (9.3%) |
| 4 Vehicles | 210 (36.2%) | 71 (27.6%) |
| 5 or more Vehicles | 0 (0.0%) | 0 (0.0%) |
| Total | 580 (100.0%) | 257 (100.0%) |
Commute Time in Intercourse
The most frequently occuring commute durations in Intercourse are 5 to 9 minutes (291 commuters, 39.7%), 10 to 14 minutes (138 commuters, 18.8%), and 15 to 19 minutes (81 commuters, 11.1%).
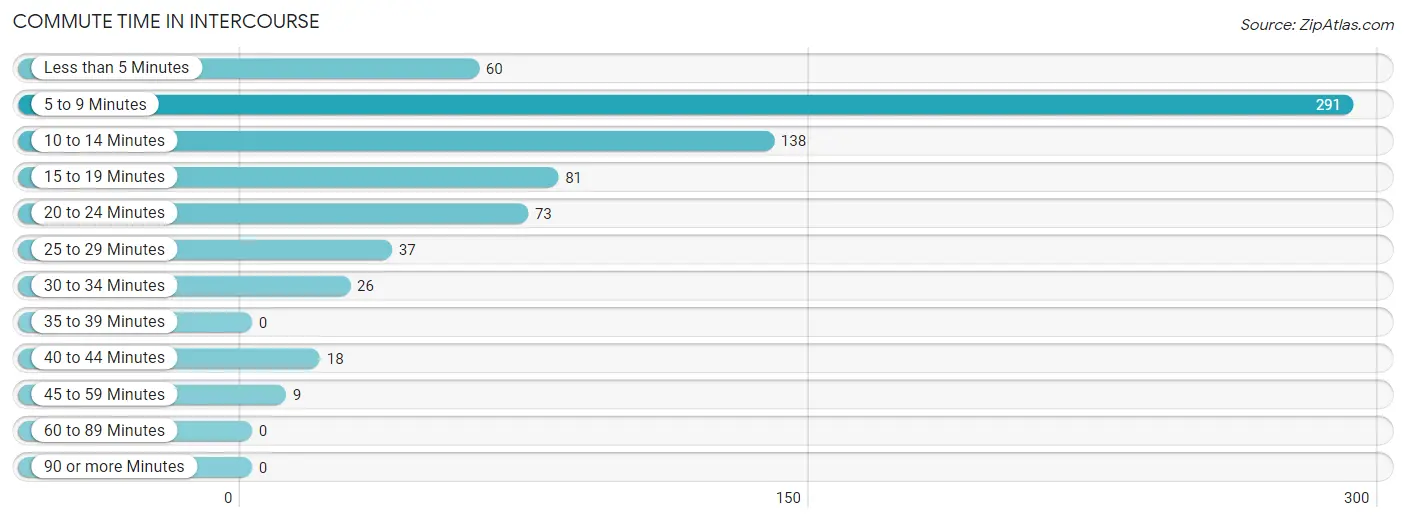
| Commute Time | # Commuters | % Commuters |
| Less than 5 Minutes | 60 | 8.2% |
| 5 to 9 Minutes | 291 | 39.7% |
| 10 to 14 Minutes | 138 | 18.8% |
| 15 to 19 Minutes | 81 | 11.1% |
| 20 to 24 Minutes | 73 | 10.0% |
| 25 to 29 Minutes | 37 | 5.1% |
| 30 to 34 Minutes | 26 | 3.5% |
| 35 to 39 Minutes | 0 | 0.0% |
| 40 to 44 Minutes | 18 | 2.5% |
| 45 to 59 Minutes | 9 | 1.2% |
| 60 to 89 Minutes | 0 | 0.0% |
| 90 or more Minutes | 0 | 0.0% |
Commute Time by Sex in Intercourse
The most common commute times in Intercourse are 5 to 9 minutes (216 commuters, 43.6%) for males and 10 to 14 minutes (78 commuters, 32.8%) for females.
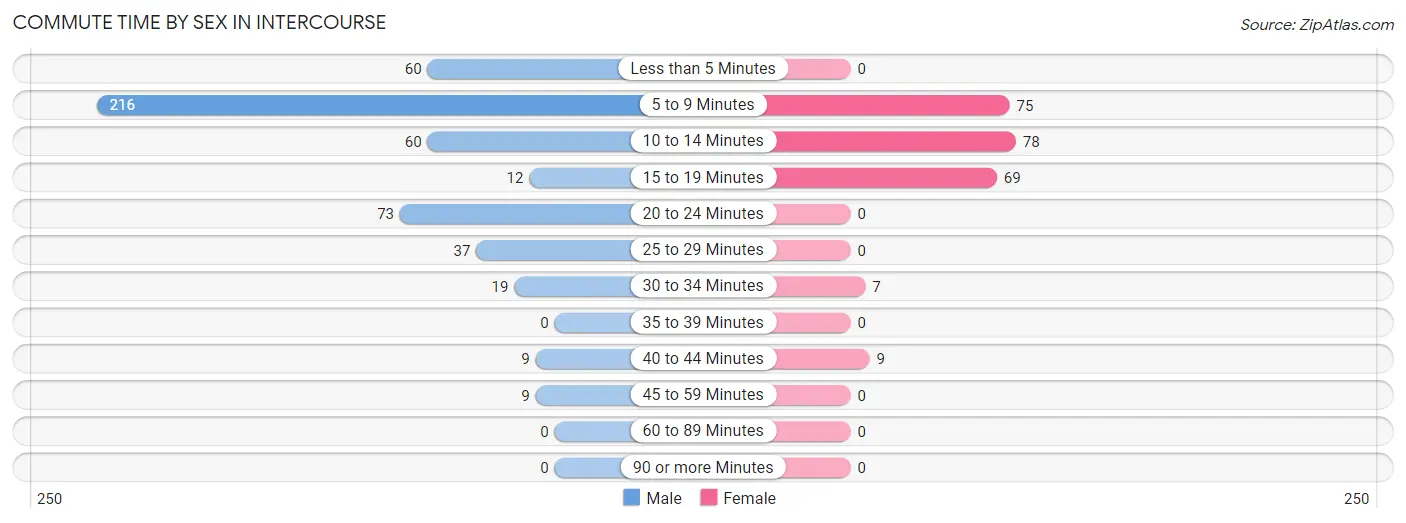
| Commute Time | Male | Female |
| Less than 5 Minutes | 60 (12.1%) | 0 (0.0%) |
| 5 to 9 Minutes | 216 (43.6%) | 75 (31.5%) |
| 10 to 14 Minutes | 60 (12.1%) | 78 (32.8%) |
| 15 to 19 Minutes | 12 (2.4%) | 69 (29.0%) |
| 20 to 24 Minutes | 73 (14.7%) | 0 (0.0%) |
| 25 to 29 Minutes | 37 (7.5%) | 0 (0.0%) |
| 30 to 34 Minutes | 19 (3.8%) | 7 (2.9%) |
| 35 to 39 Minutes | 0 (0.0%) | 0 (0.0%) |
| 40 to 44 Minutes | 9 (1.8%) | 9 (3.8%) |
| 45 to 59 Minutes | 9 (1.8%) | 0 (0.0%) |
| 60 to 89 Minutes | 0 (0.0%) | 0 (0.0%) |
| 90 or more Minutes | 0 (0.0%) | 0 (0.0%) |
Time of Departure to Work by Sex in Intercourse
The most frequent times of departure to work in Intercourse are 6:00 AM to 6:29 AM (220, 44.4%) for males and 7:00 AM to 7:29 AM (104, 43.7%) for females.
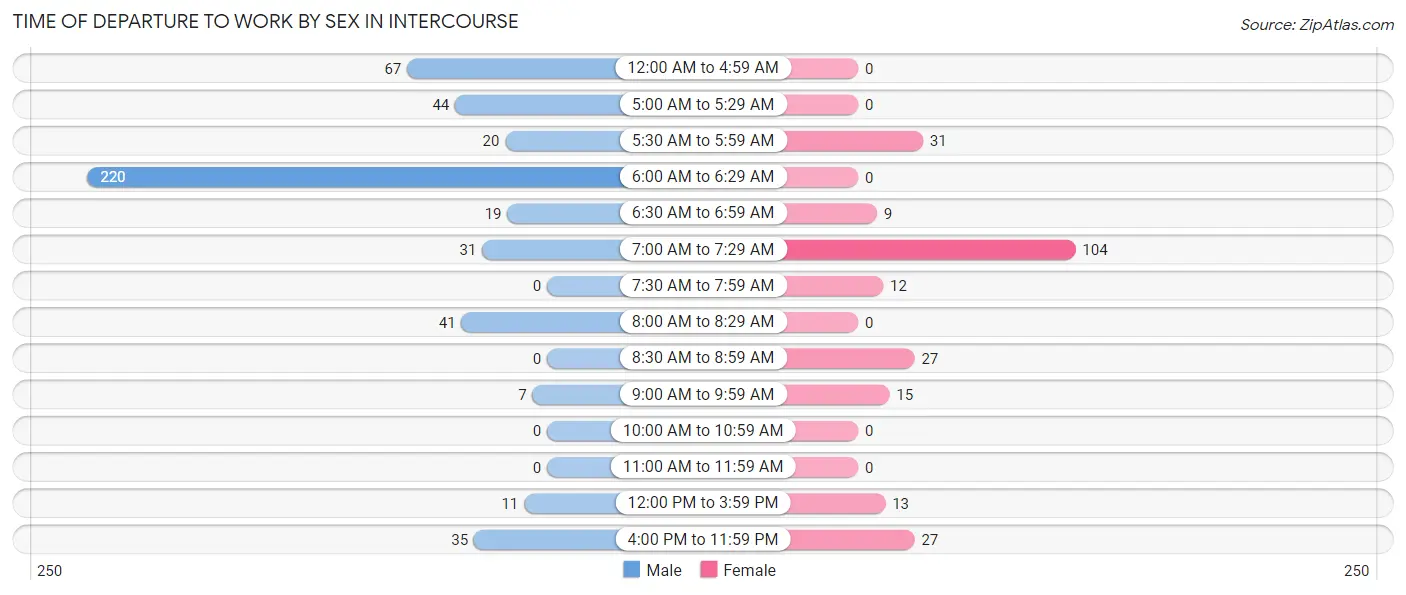
| Time of Departure | Male | Female |
| 12:00 AM to 4:59 AM | 67 (13.5%) | 0 (0.0%) |
| 5:00 AM to 5:29 AM | 44 (8.9%) | 0 (0.0%) |
| 5:30 AM to 5:59 AM | 20 (4.0%) | 31 (13.0%) |
| 6:00 AM to 6:29 AM | 220 (44.4%) | 0 (0.0%) |
| 6:30 AM to 6:59 AM | 19 (3.8%) | 9 (3.8%) |
| 7:00 AM to 7:29 AM | 31 (6.3%) | 104 (43.7%) |
| 7:30 AM to 7:59 AM | 0 (0.0%) | 12 (5.0%) |
| 8:00 AM to 8:29 AM | 41 (8.3%) | 0 (0.0%) |
| 8:30 AM to 8:59 AM | 0 (0.0%) | 27 (11.3%) |
| 9:00 AM to 9:59 AM | 7 (1.4%) | 15 (6.3%) |
| 10:00 AM to 10:59 AM | 0 (0.0%) | 0 (0.0%) |
| 11:00 AM to 11:59 AM | 0 (0.0%) | 0 (0.0%) |
| 12:00 PM to 3:59 PM | 11 (2.2%) | 13 (5.5%) |
| 4:00 PM to 11:59 PM | 35 (7.1%) | 27 (11.3%) |
| Total | 495 (100.0%) | 238 (100.0%) |
Housing Occupancy in Intercourse
Occupancy by Ownership in Intercourse
Of the total 478 dwellings in Intercourse, owner-occupied units account for 413 (86.4%), while renter-occupied units make up 65 (13.6%).
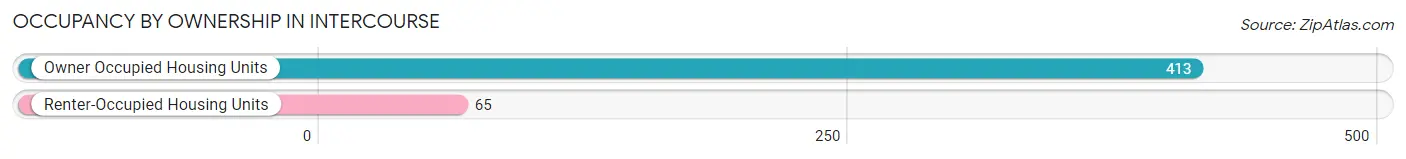
| Occupancy | # Housing Units | % Housing Units |
| Owner Occupied Housing Units | 413 | 86.4% |
| Renter-Occupied Housing Units | 65 | 13.6% |
| Total Occupied Housing Units | 478 | 100.0% |
Occupancy by Household Size in Intercourse
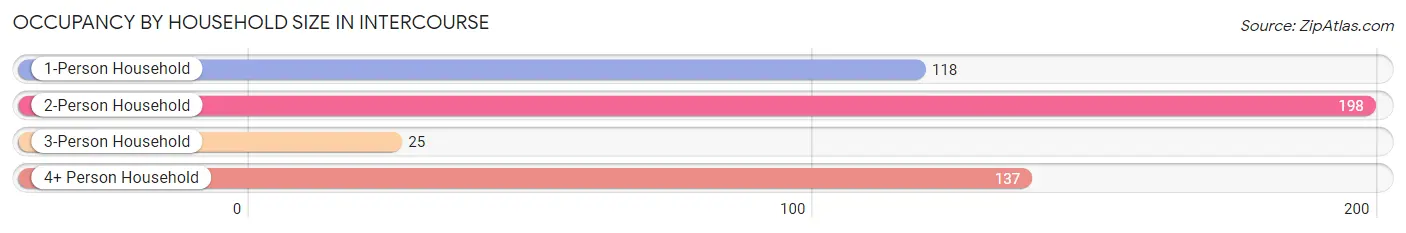
| Household Size | # Housing Units | % Housing Units |
| 1-Person Household | 118 | 24.7% |
| 2-Person Household | 198 | 41.4% |
| 3-Person Household | 25 | 5.2% |
| 4+ Person Household | 137 | 28.7% |
| Total Housing Units | 478 | 100.0% |
Occupancy by Ownership by Household Size in Intercourse
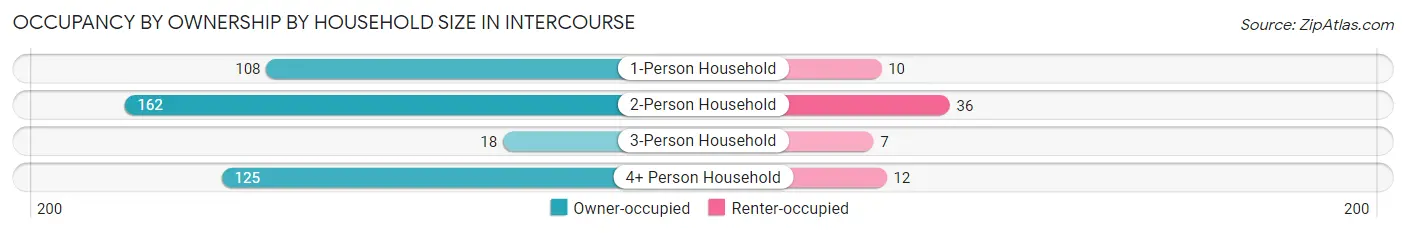
| Household Size | Owner-occupied | Renter-occupied |
| 1-Person Household | 108 (91.5%) | 10 (8.5%) |
| 2-Person Household | 162 (81.8%) | 36 (18.2%) |
| 3-Person Household | 18 (72.0%) | 7 (28.0%) |
| 4+ Person Household | 125 (91.2%) | 12 (8.8%) |
| Total Housing Units | 413 (86.4%) | 65 (13.6%) |
Occupancy by Educational Attainment in Intercourse
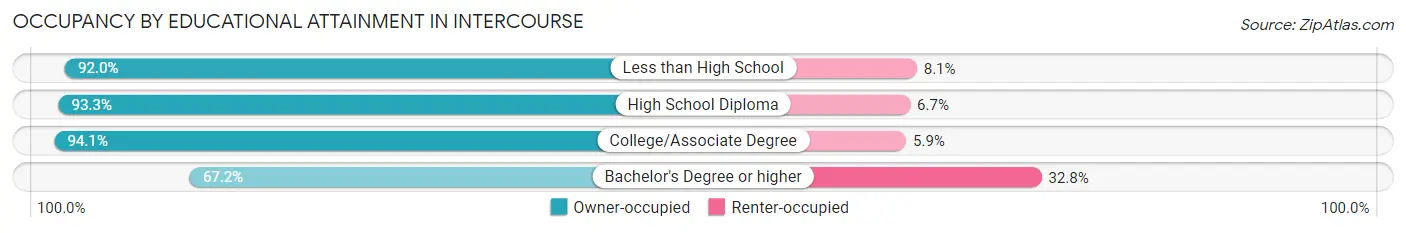
| Household Size | Owner-occupied | Renter-occupied |
| Less than High School | 137 (91.9%) | 12 (8.1%) |
| High School Diploma | 83 (93.3%) | 6 (6.7%) |
| College/Associate Degree | 111 (94.1%) | 7 (5.9%) |
| Bachelor's Degree or higher | 82 (67.2%) | 40 (32.8%) |
Occupancy by Age of Householder in Intercourse
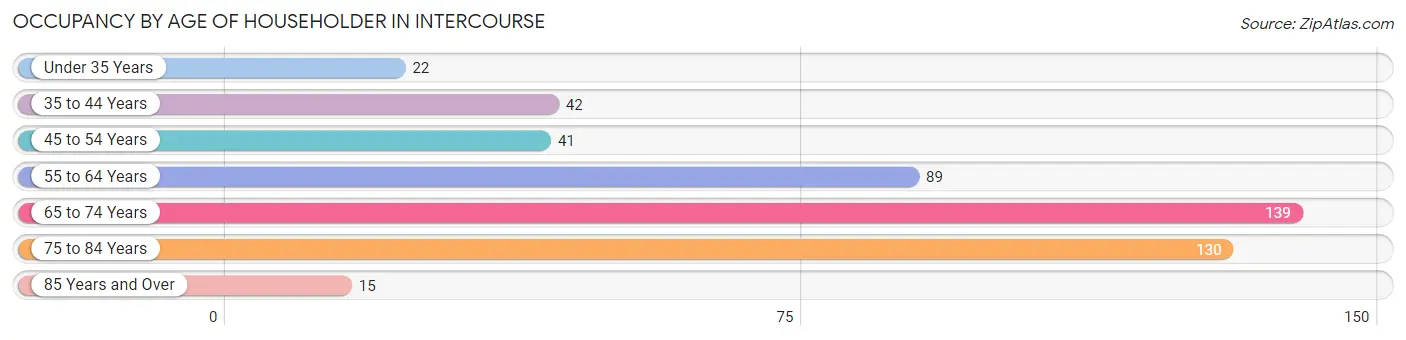
| Age Bracket | # Households | % Households |
| Under 35 Years | 22 | 4.6% |
| 35 to 44 Years | 42 | 8.8% |
| 45 to 54 Years | 41 | 8.6% |
| 55 to 64 Years | 89 | 18.6% |
| 65 to 74 Years | 139 | 29.1% |
| 75 to 84 Years | 130 | 27.2% |
| 85 Years and Over | 15 | 3.1% |
| Total | 478 | 100.0% |
Housing Finances in Intercourse
Median Income by Occupancy in Intercourse
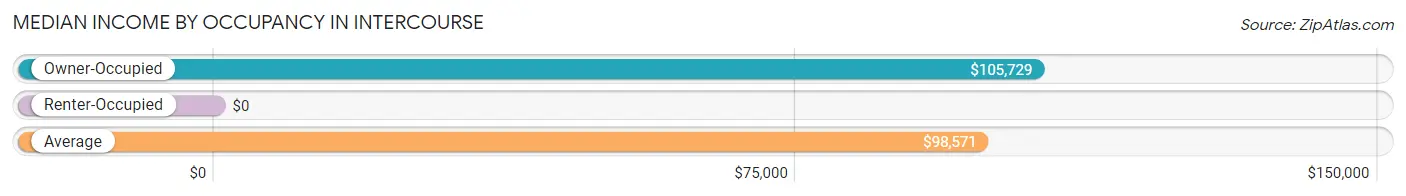
| Occupancy Type | # Households | Median Income |
| Owner-Occupied | 413 (86.4%) | $105,729 |
| Renter-Occupied | 65 (13.6%) | $0 |
| Average | 478 (100.0%) | $98,571 |
Occupancy by Householder Income Bracket in Intercourse
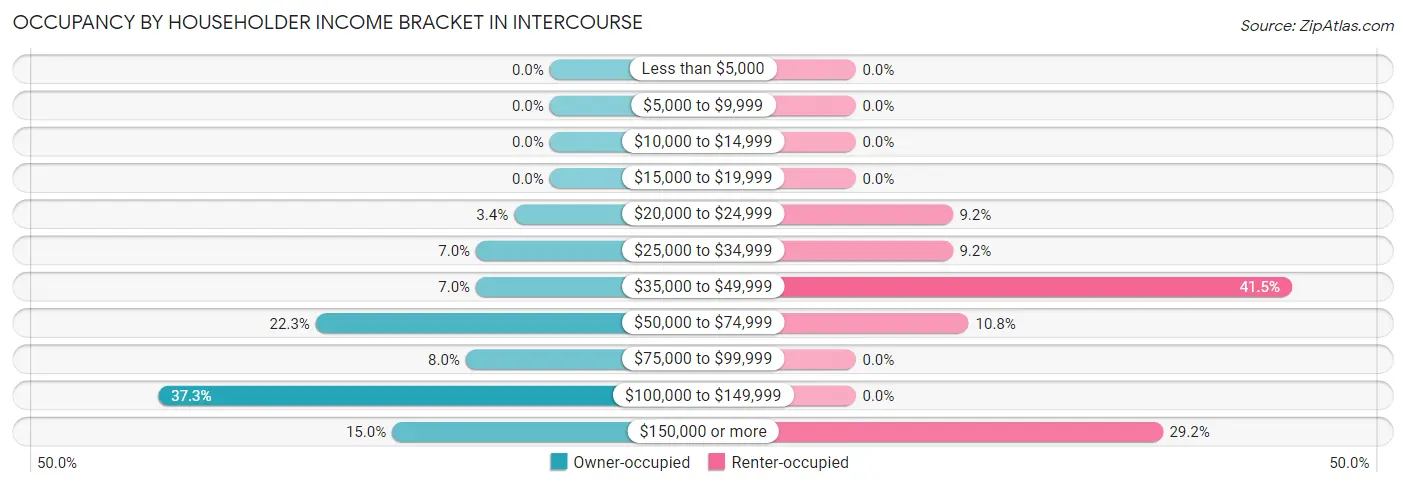
| Income Bracket | Owner-occupied | Renter-occupied |
| Less than $5,000 | 0 (0.0%) | 0 (0.0%) |
| $5,000 to $9,999 | 0 (0.0%) | 0 (0.0%) |
| $10,000 to $14,999 | 0 (0.0%) | 0 (0.0%) |
| $15,000 to $19,999 | 0 (0.0%) | 0 (0.0%) |
| $20,000 to $24,999 | 14 (3.4%) | 6 (9.2%) |
| $25,000 to $34,999 | 29 (7.0%) | 6 (9.2%) |
| $35,000 to $49,999 | 29 (7.0%) | 27 (41.5%) |
| $50,000 to $74,999 | 92 (22.3%) | 7 (10.8%) |
| $75,000 to $99,999 | 33 (8.0%) | 0 (0.0%) |
| $100,000 to $149,999 | 154 (37.3%) | 0 (0.0%) |
| $150,000 or more | 62 (15.0%) | 19 (29.2%) |
| Total | 413 (100.0%) | 65 (100.0%) |
Monthly Housing Cost Tiers in Intercourse
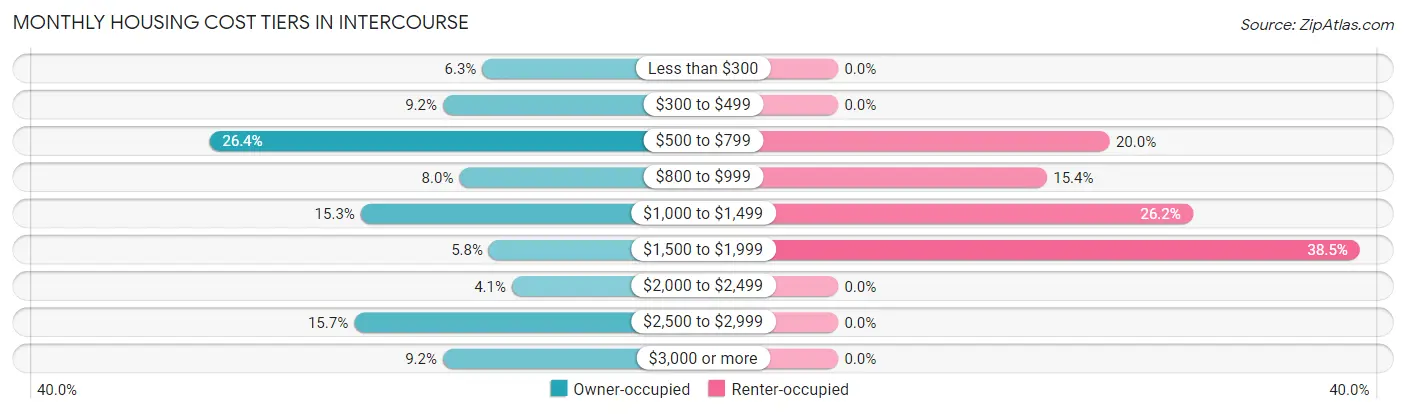
| Monthly Cost | Owner-occupied | Renter-occupied |
| Less than $300 | 26 (6.3%) | 0 (0.0%) |
| $300 to $499 | 38 (9.2%) | 0 (0.0%) |
| $500 to $799 | 109 (26.4%) | 13 (20.0%) |
| $800 to $999 | 33 (8.0%) | 10 (15.4%) |
| $1,000 to $1,499 | 63 (15.2%) | 17 (26.2%) |
| $1,500 to $1,999 | 24 (5.8%) | 25 (38.5%) |
| $2,000 to $2,499 | 17 (4.1%) | 0 (0.0%) |
| $2,500 to $2,999 | 65 (15.7%) | 0 (0.0%) |
| $3,000 or more | 38 (9.2%) | 0 (0.0%) |
| Total | 413 (100.0%) | 65 (100.0%) |
Physical Housing Characteristics in Intercourse
Housing Structures in Intercourse
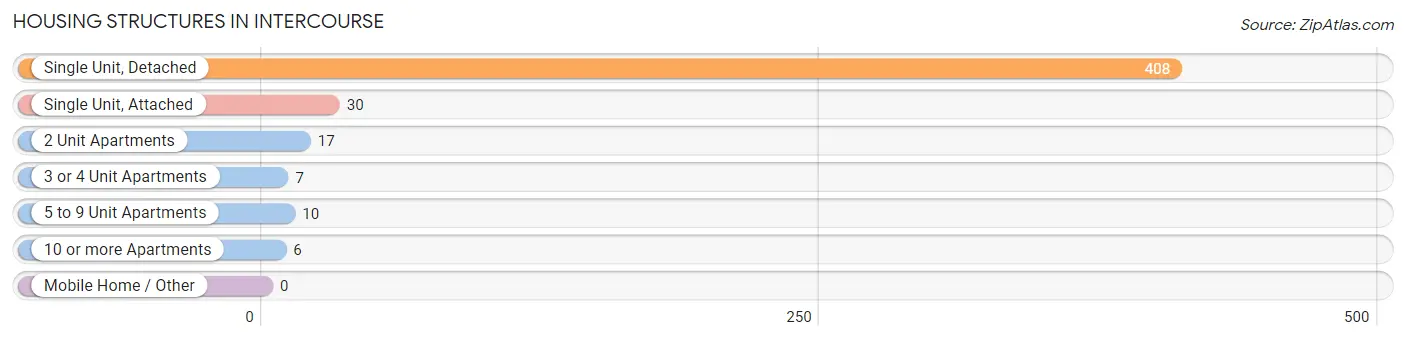
| Structure Type | # Housing Units | % Housing Units |
| Single Unit, Detached | 408 | 85.4% |
| Single Unit, Attached | 30 | 6.3% |
| 2 Unit Apartments | 17 | 3.6% |
| 3 or 4 Unit Apartments | 7 | 1.5% |
| 5 to 9 Unit Apartments | 10 | 2.1% |
| 10 or more Apartments | 6 | 1.3% |
| Mobile Home / Other | 0 | 0.0% |
| Total | 478 | 100.0% |
Housing Structures by Occupancy in Intercourse
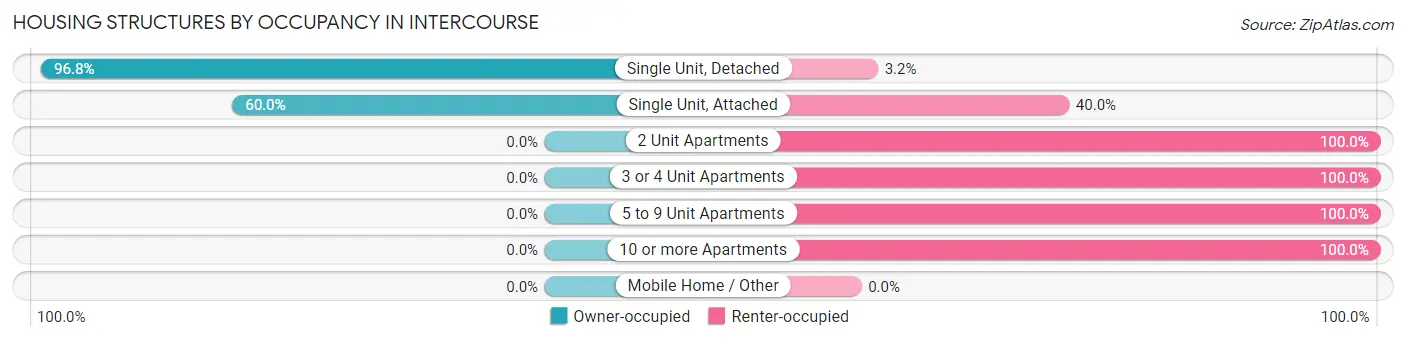
| Structure Type | Owner-occupied | Renter-occupied |
| Single Unit, Detached | 395 (96.8%) | 13 (3.2%) |
| Single Unit, Attached | 18 (60.0%) | 12 (40.0%) |
| 2 Unit Apartments | 0 (0.0%) | 17 (100.0%) |
| 3 or 4 Unit Apartments | 0 (0.0%) | 7 (100.0%) |
| 5 to 9 Unit Apartments | 0 (0.0%) | 10 (100.0%) |
| 10 or more Apartments | 0 (0.0%) | 6 (100.0%) |
| Mobile Home / Other | 0 (0.0%) | 0 (0.0%) |
| Total | 413 (86.4%) | 65 (13.6%) |
Housing Structures by Number of Rooms in Intercourse
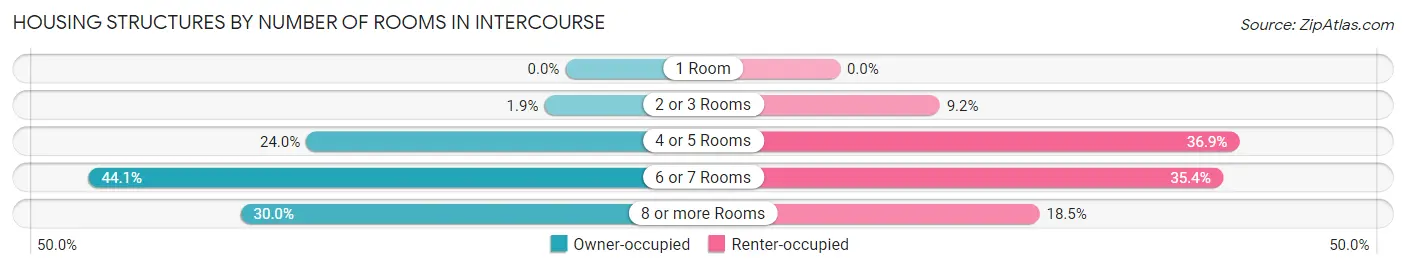
| Number of Rooms | Owner-occupied | Renter-occupied |
| 1 Room | 0 (0.0%) | 0 (0.0%) |
| 2 or 3 Rooms | 8 (1.9%) | 6 (9.2%) |
| 4 or 5 Rooms | 99 (24.0%) | 24 (36.9%) |
| 6 or 7 Rooms | 182 (44.1%) | 23 (35.4%) |
| 8 or more Rooms | 124 (30.0%) | 12 (18.5%) |
| Total | 413 (100.0%) | 65 (100.0%) |
Housing Structure by Heating Type in Intercourse
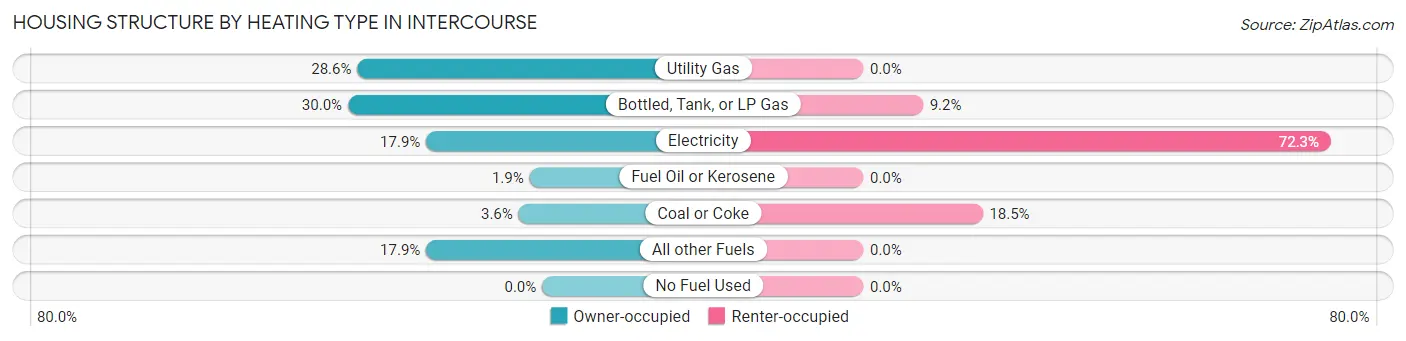
| Heating Type | Owner-occupied | Renter-occupied |
| Utility Gas | 118 (28.6%) | 0 (0.0%) |
| Bottled, Tank, or LP Gas | 124 (30.0%) | 6 (9.2%) |
| Electricity | 74 (17.9%) | 47 (72.3%) |
| Fuel Oil or Kerosene | 8 (1.9%) | 0 (0.0%) |
| Coal or Coke | 15 (3.6%) | 12 (18.5%) |
| All other Fuels | 74 (17.9%) | 0 (0.0%) |
| No Fuel Used | 0 (0.0%) | 0 (0.0%) |
| Total | 413 (100.0%) | 65 (100.0%) |
Household Vehicle Usage in Intercourse
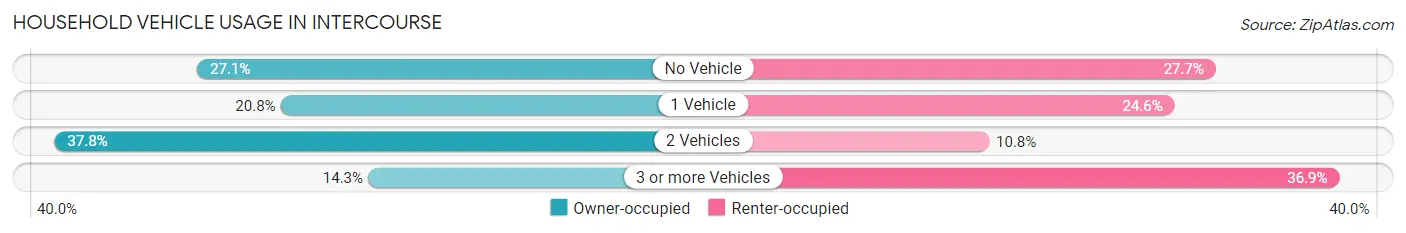
| Vehicles per Household | Owner-occupied | Renter-occupied |
| No Vehicle | 112 (27.1%) | 18 (27.7%) |
| 1 Vehicle | 86 (20.8%) | 16 (24.6%) |
| 2 Vehicles | 156 (37.8%) | 7 (10.8%) |
| 3 or more Vehicles | 59 (14.3%) | 24 (36.9%) |
| Total | 413 (100.0%) | 65 (100.0%) |
Real Estate & Mortgages in Intercourse
Real Estate and Mortgage Overview in Intercourse
| Characteristic | Without Mortgage | With Mortgage |
| Housing Units | 200 | 213 |
| Median Property Value | $389,100 | $0 |
| Median Household Income | $69,643 | $41 |
| Monthly Housing Costs | $663 | $38 |
| Real Estate Taxes | $4,167 | $0 |
Property Value by Mortgage Status in Intercourse
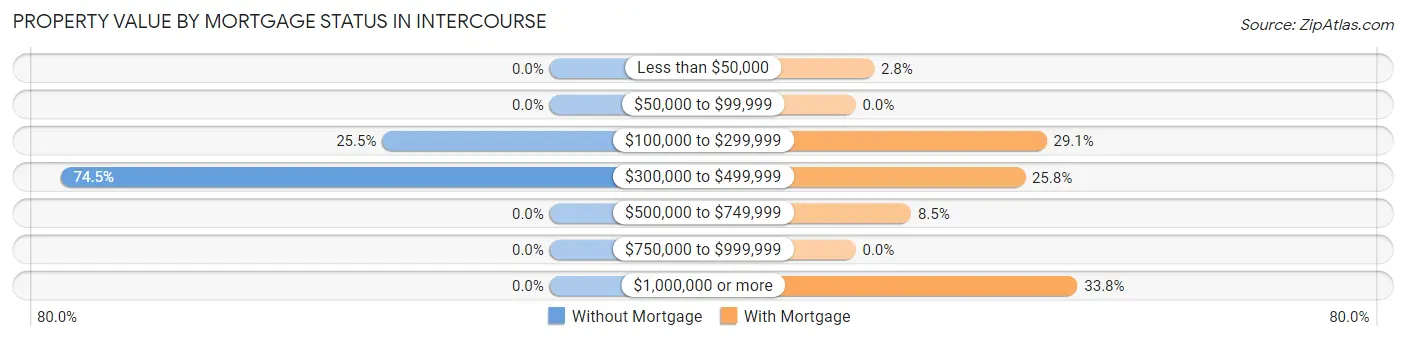
| Property Value | Without Mortgage | With Mortgage |
| Less than $50,000 | 0 (0.0%) | 6 (2.8%) |
| $50,000 to $99,999 | 0 (0.0%) | 0 (0.0%) |
| $100,000 to $299,999 | 51 (25.5%) | 62 (29.1%) |
| $300,000 to $499,999 | 149 (74.5%) | 55 (25.8%) |
| $500,000 to $749,999 | 0 (0.0%) | 18 (8.5%) |
| $750,000 to $999,999 | 0 (0.0%) | 0 (0.0%) |
| $1,000,000 or more | 0 (0.0%) | 72 (33.8%) |
| Total | 200 (100.0%) | 213 (100.0%) |
Household Income by Mortgage Status in Intercourse
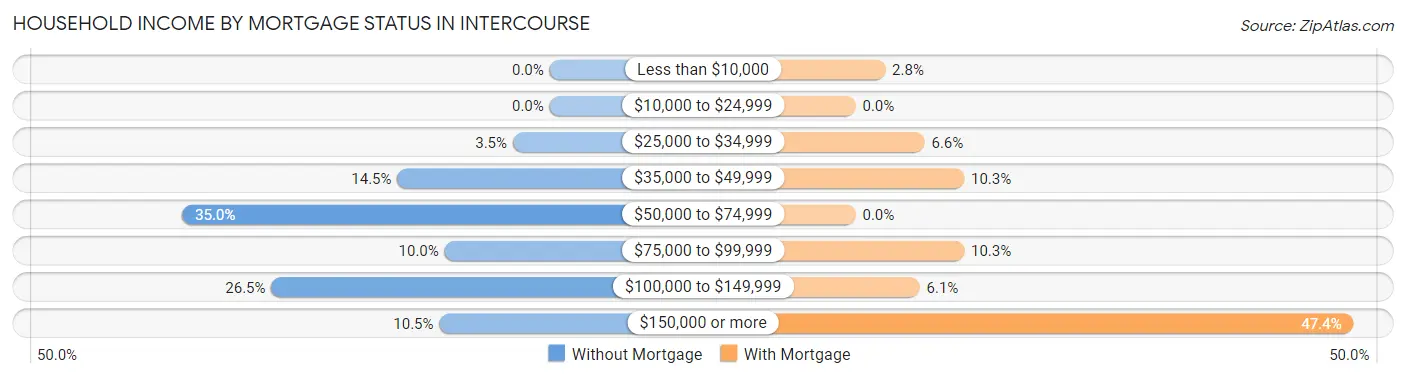
| Household Income | Without Mortgage | With Mortgage |
| Less than $10,000 | 0 (0.0%) | 6 (2.8%) |
| $10,000 to $24,999 | 0 (0.0%) | 0 (0.0%) |
| $25,000 to $34,999 | 7 (3.5%) | 14 (6.6%) |
| $35,000 to $49,999 | 29 (14.5%) | 22 (10.3%) |
| $50,000 to $74,999 | 70 (35.0%) | 0 (0.0%) |
| $75,000 to $99,999 | 20 (10.0%) | 22 (10.3%) |
| $100,000 to $149,999 | 53 (26.5%) | 13 (6.1%) |
| $150,000 or more | 21 (10.5%) | 101 (47.4%) |
| Total | 200 (100.0%) | 213 (100.0%) |
Property Value to Household Income Ratio in Intercourse
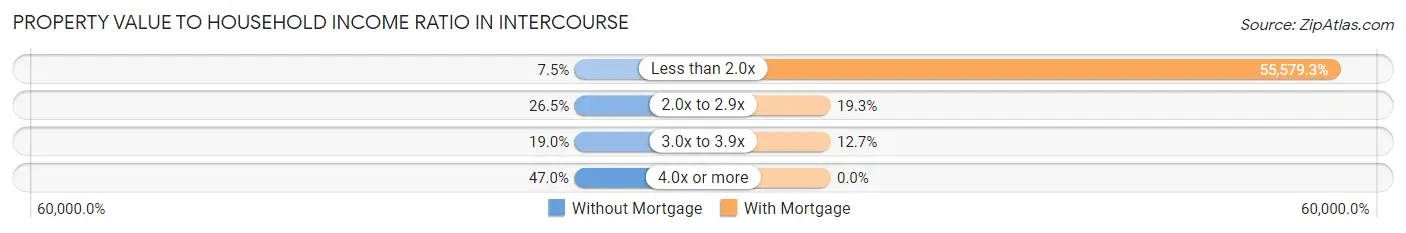
| Value-to-Income Ratio | Without Mortgage | With Mortgage |
| Less than 2.0x | 15 (7.5%) | 118,384 (55,579.3%) |
| 2.0x to 2.9x | 53 (26.5%) | 41 (19.3%) |
| 3.0x to 3.9x | 38 (19.0%) | 27 (12.7%) |
| 4.0x or more | 94 (47.0%) | 0 (0.0%) |
| Total | 200 (100.0%) | 213 (100.0%) |
Real Estate Taxes by Mortgage Status in Intercourse
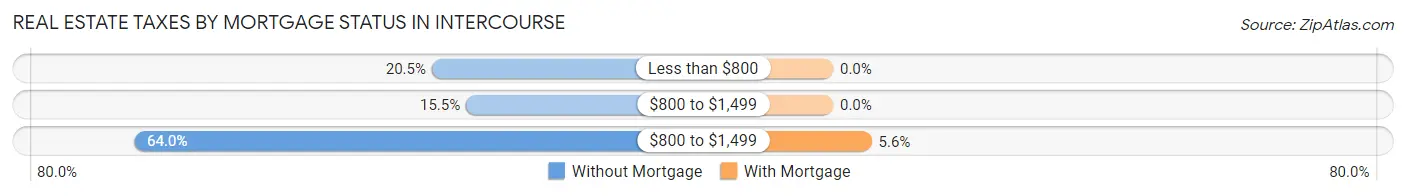
| Property Taxes | Without Mortgage | With Mortgage |
| Less than $800 | 41 (20.5%) | 0 (0.0%) |
| $800 to $1,499 | 31 (15.5%) | 0 (0.0%) |
| $800 to $1,499 | 128 (64.0%) | 12 (5.6%) |
| Total | 200 (100.0%) | 213 (100.0%) |
Health & Disability in Intercourse
Health Insurance Coverage by Age in Intercourse
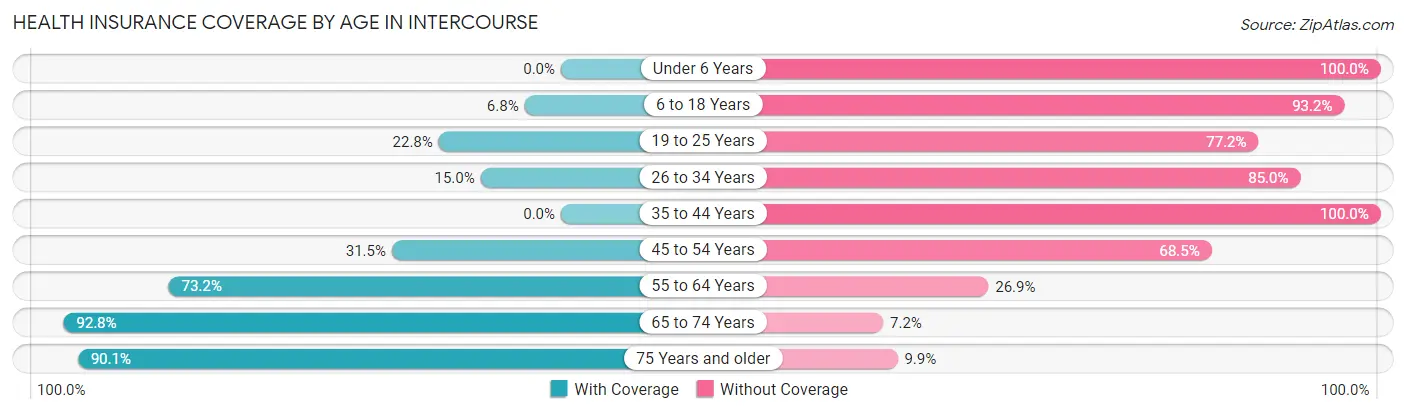
| Age Bracket | With Coverage | Without Coverage |
| Under 6 Years | 0 (0.0%) | 50 (100.0%) |
| 6 to 18 Years | 25 (6.8%) | 344 (93.2%) |
| 19 to 25 Years | 62 (22.8%) | 210 (77.2%) |
| 26 to 34 Years | 25 (15.0%) | 142 (85.0%) |
| 35 to 44 Years | 0 (0.0%) | 131 (100.0%) |
| 45 to 54 Years | 29 (31.5%) | 63 (68.5%) |
| 55 to 64 Years | 109 (73.2%) | 40 (26.9%) |
| 65 to 74 Years | 231 (92.8%) | 18 (7.2%) |
| 75 Years and older | 191 (90.1%) | 21 (9.9%) |
| Total | 672 (39.7%) | 1,019 (60.3%) |
Health Insurance Coverage by Citizenship Status in Intercourse
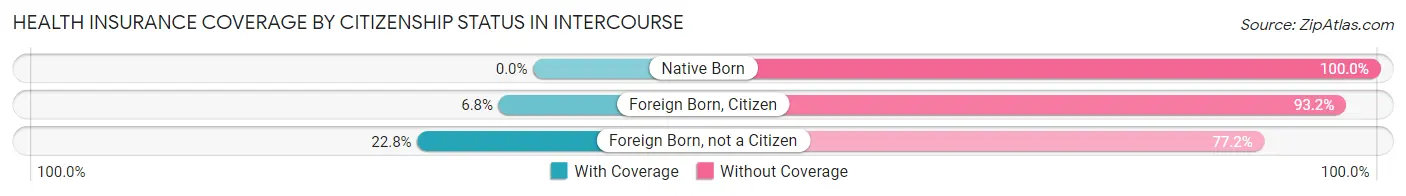
| Citizenship Status | With Coverage | Without Coverage |
| Native Born | 0 (0.0%) | 50 (100.0%) |
| Foreign Born, Citizen | 25 (6.8%) | 344 (93.2%) |
| Foreign Born, not a Citizen | 62 (22.8%) | 210 (77.2%) |
Health Insurance Coverage by Household Income in Intercourse
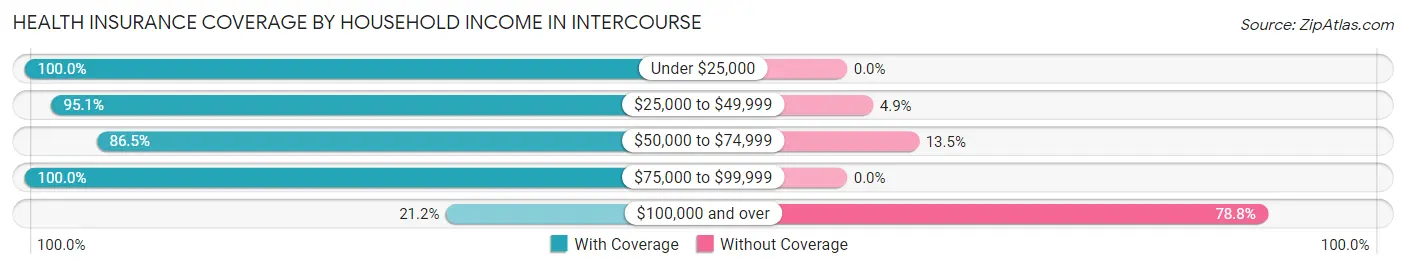
| Household Income | With Coverage | Without Coverage |
| Under $25,000 | 32 (100.0%) | 0 (0.0%) |
| $25,000 to $49,999 | 117 (95.1%) | 6 (4.9%) |
| $50,000 to $74,999 | 199 (86.5%) | 31 (13.5%) |
| $75,000 to $99,999 | 60 (100.0%) | 0 (0.0%) |
| $100,000 and over | 264 (21.2%) | 982 (78.8%) |
Public vs Private Health Insurance Coverage by Age in Intercourse
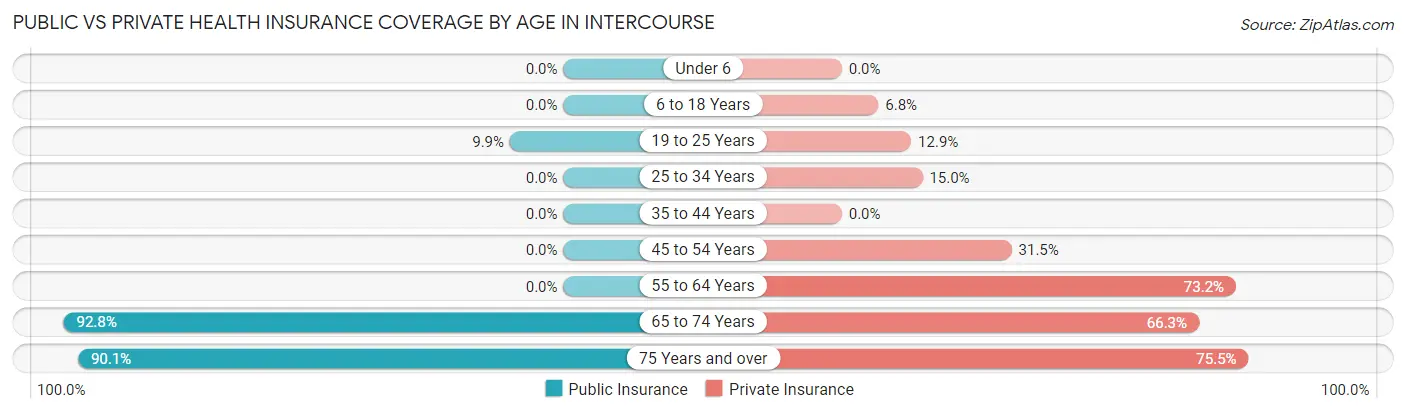
| Age Bracket | Public Insurance | Private Insurance |
| Under 6 | 0 (0.0%) | 0 (0.0%) |
| 6 to 18 Years | 0 (0.0%) | 25 (6.8%) |
| 19 to 25 Years | 27 (9.9%) | 35 (12.9%) |
| 25 to 34 Years | 0 (0.0%) | 25 (15.0%) |
| 35 to 44 Years | 0 (0.0%) | 0 (0.0%) |
| 45 to 54 Years | 0 (0.0%) | 29 (31.5%) |
| 55 to 64 Years | 0 (0.0%) | 109 (73.2%) |
| 65 to 74 Years | 231 (92.8%) | 165 (66.3%) |
| 75 Years and over | 191 (90.1%) | 160 (75.5%) |
| Total | 449 (26.6%) | 548 (32.4%) |
Disability Status by Sex by Age in Intercourse
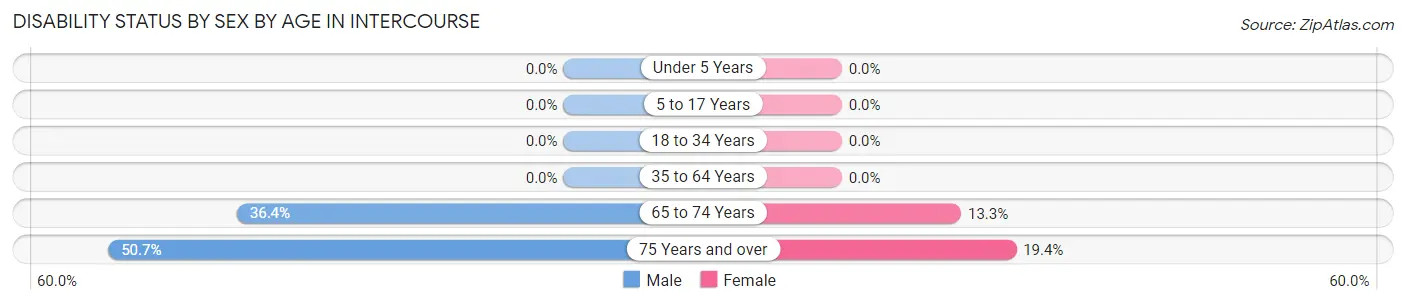
| Age Bracket | Male | Female |
| Under 5 Years | 0 (0.0%) | 0 (0.0%) |
| 5 to 17 Years | 0 (0.0%) | 0 (0.0%) |
| 18 to 34 Years | 0 (0.0%) | 0 (0.0%) |
| 35 to 64 Years | 0 (0.0%) | 0 (0.0%) |
| 65 to 74 Years | 44 (36.4%) | 17 (13.3%) |
| 75 Years and over | 37 (50.7%) | 27 (19.4%) |
Disability Class by Sex by Age in Intercourse
Disability Class: Hearing Difficulty
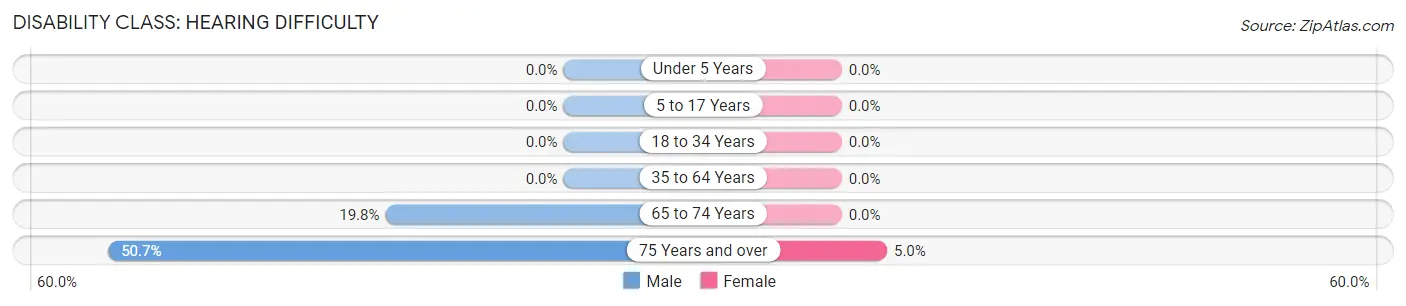
| Age Bracket | Male | Female |
| Under 5 Years | 0 (0.0%) | 0 (0.0%) |
| 5 to 17 Years | 0 (0.0%) | 0 (0.0%) |
| 18 to 34 Years | 0 (0.0%) | 0 (0.0%) |
| 35 to 64 Years | 0 (0.0%) | 0 (0.0%) |
| 65 to 74 Years | 24 (19.8%) | 0 (0.0%) |
| 75 Years and over | 37 (50.7%) | 7 (5.0%) |
Disability Class: Vision Difficulty
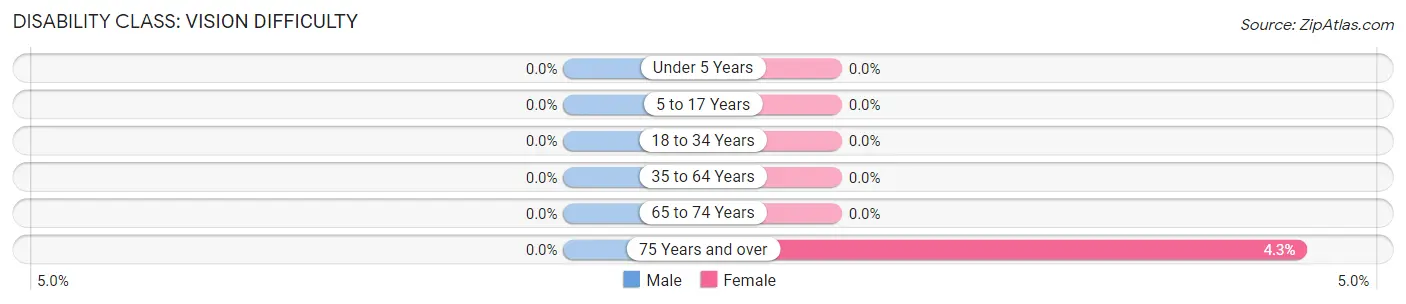
| Age Bracket | Male | Female |
| Under 5 Years | 0 (0.0%) | 0 (0.0%) |
| 5 to 17 Years | 0 (0.0%) | 0 (0.0%) |
| 18 to 34 Years | 0 (0.0%) | 0 (0.0%) |
| 35 to 64 Years | 0 (0.0%) | 0 (0.0%) |
| 65 to 74 Years | 0 (0.0%) | 0 (0.0%) |
| 75 Years and over | 0 (0.0%) | 6 (4.3%) |
Disability Class: Cognitive Difficulty
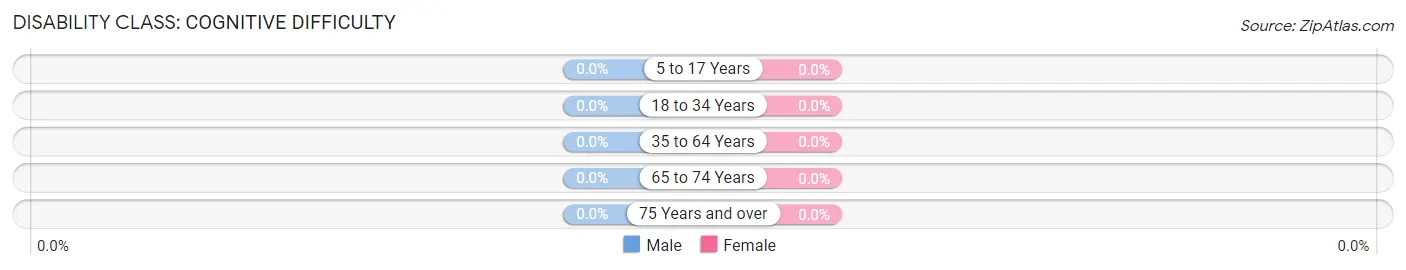
| Age Bracket | Male | Female |
| 5 to 17 Years | 0 (0.0%) | 0 (0.0%) |
| 18 to 34 Years | 0 (0.0%) | 0 (0.0%) |
| 35 to 64 Years | 0 (0.0%) | 0 (0.0%) |
| 65 to 74 Years | 0 (0.0%) | 0 (0.0%) |
| 75 Years and over | 0 (0.0%) | 0 (0.0%) |
Disability Class: Ambulatory Difficulty
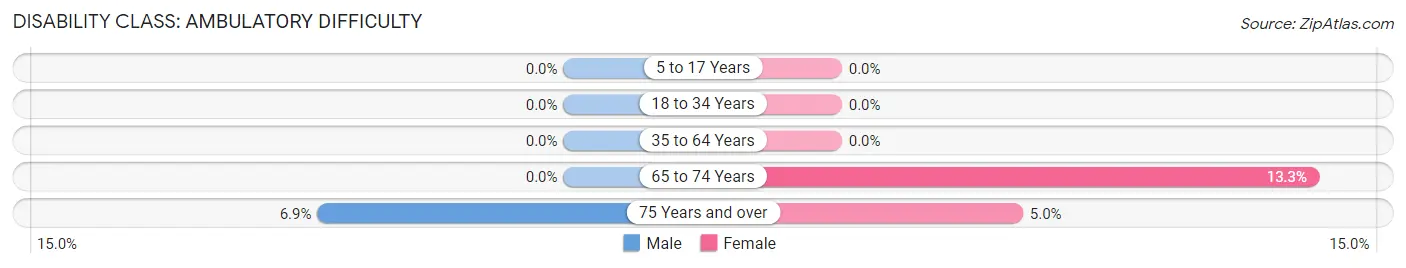
| Age Bracket | Male | Female |
| 5 to 17 Years | 0 (0.0%) | 0 (0.0%) |
| 18 to 34 Years | 0 (0.0%) | 0 (0.0%) |
| 35 to 64 Years | 0 (0.0%) | 0 (0.0%) |
| 65 to 74 Years | 0 (0.0%) | 17 (13.3%) |
| 75 Years and over | 5 (6.9%) | 7 (5.0%) |
Disability Class: Self-Care Difficulty
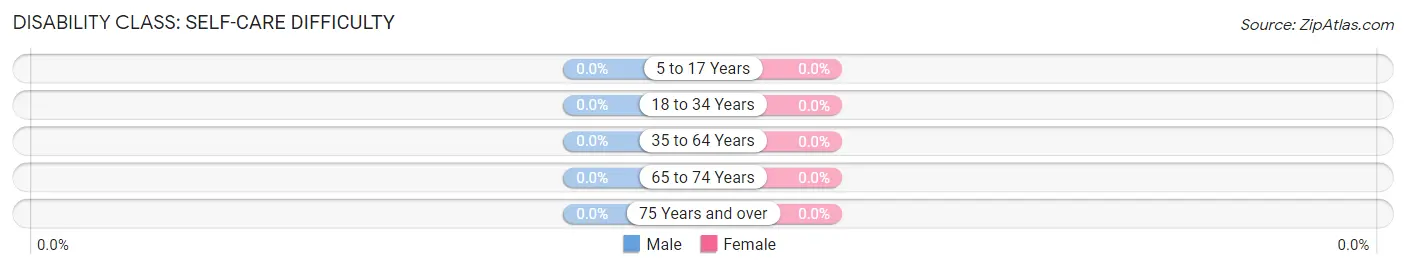
| Age Bracket | Male | Female |
| 5 to 17 Years | 0 (0.0%) | 0 (0.0%) |
| 18 to 34 Years | 0 (0.0%) | 0 (0.0%) |
| 35 to 64 Years | 0 (0.0%) | 0 (0.0%) |
| 65 to 74 Years | 0 (0.0%) | 0 (0.0%) |
| 75 Years and over | 0 (0.0%) | 0 (0.0%) |
Technology Access in Intercourse
Computing Device Access in Intercourse
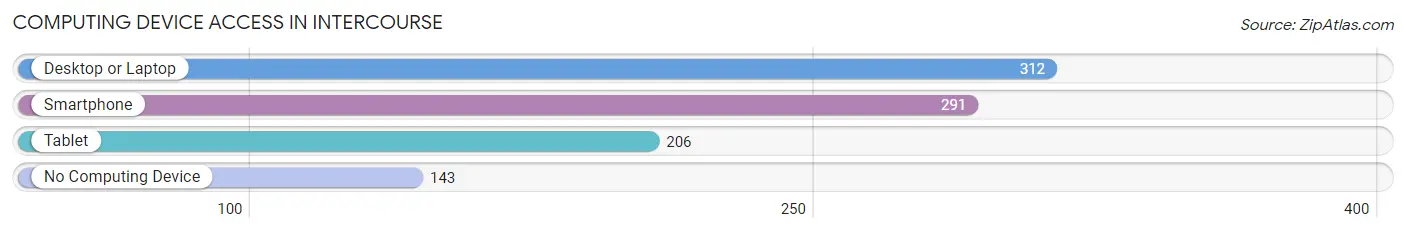
| Device Type | # Households | % Households |
| Desktop or Laptop | 312 | 65.3% |
| Smartphone | 291 | 60.9% |
| Tablet | 206 | 43.1% |
| No Computing Device | 143 | 29.9% |
| Total | 478 | 100.0% |
Internet Access in Intercourse
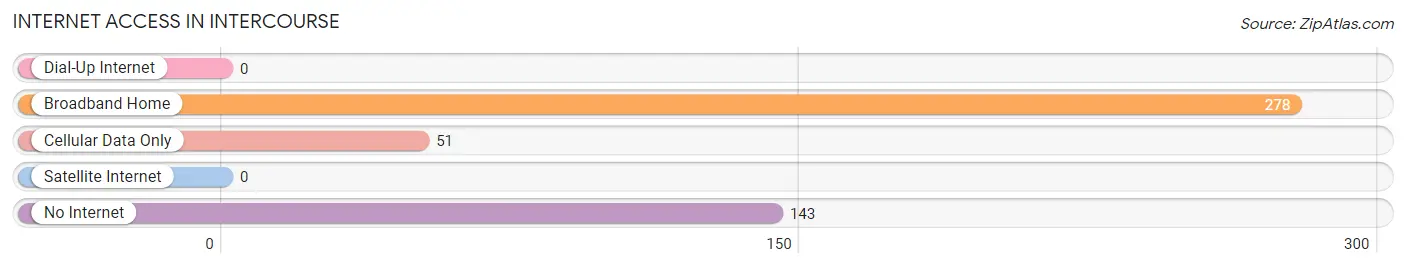
| Internet Type | # Households | % Households |
| Dial-Up Internet | 0 | 0.0% |
| Broadband Home | 278 | 58.2% |
| Cellular Data Only | 51 | 10.7% |
| Satellite Internet | 0 | 0.0% |
| No Internet | 143 | 29.9% |
| Total | 478 | 100.0% |
Intercourse Summary
Intercourse, Pennsylvania is a small borough located in the heart of Lancaster County, Pennsylvania. It is situated in the southeastern corner of the county, approximately 8 miles east of the city of Lancaster. The population of Intercourse was 869 as of the 2010 census.
Geography
Intercourse is located at 40°04'N 76°14'W. It is situated in the southeastern corner of Lancaster County, approximately 8 miles east of the city of Lancaster. The borough is bordered by Leacock Township to the north, Paradise Township to the east, and East Lampeter Township to the south and west. The borough is located in the Conestoga Valley, a fertile agricultural region of the county. The Conestoga River flows through the borough, and is a major tributary of the Susquehanna River.
History
Intercourse was founded in 1754 by Mennonite settlers from Germany. The borough was originally known as Cross Keys, but was later renamed Intercourse in 1814. The name is derived from the intersection of two major roads, the Old King's Highway and the Great Conestoga Road. The intersection of these two roads was a popular stopping point for travelers, and the name Intercourse was chosen to reflect this.
Intercourse was an important stop on the Underground Railroad during the 19th century. The borough was home to a number of Quaker families who provided shelter and assistance to escaped slaves.
Economy
Intercourse is a small, rural community with a primarily agricultural economy. The borough is home to a number of small businesses, including restaurants, shops, and bed and breakfasts. The borough is also home to a number of Amish and Mennonite businesses, including furniture makers, quilt shops, and farmers markets.
Demographics
As of the 2010 census, the population of Intercourse was 869. The racial makeup of the borough was 97.3% White, 0.9% African American, 0.2% Native American, 0.2% Asian, 0.2% from other races, and 1.2% from two or more races. Hispanic or Latino of any race were 0.9% of the population.
The median income for a household in the borough was $50,000, and the median income for a family was $54,375. The per capita income for the borough was $20,945. About 4.2% of families and 5.2% of the population were below the poverty line, including 6.3% of those under age 18 and 4.2% of those age 65 or over.
Common Questions
What is Per Capita Income in Intercourse?
Per Capita income in Intercourse is $34,534.
What is the Median Family Income in Intercourse?
Median Family Income in Intercourse is $118,110.
What is the Median Household income in Intercourse?
Median Household Income in Intercourse is $98,571.
What is Income or Wage Gap in Intercourse?
Income or Wage Gap in Intercourse is 60.6%.
Women in Intercourse earn 39.4 cents for every dollar earned by a man.
What is Inequality or Gini Index in Intercourse?
Inequality or Gini Index in Intercourse is 0.38.
What is the Total Population of Intercourse?
Total Population of Intercourse is 1,691.
What is the Total Male Population of Intercourse?
Total Male Population of Intercourse is 802.
What is the Total Female Population of Intercourse?
Total Female Population of Intercourse is 889.
What is the Ratio of Males per 100 Females in Intercourse?
There are 90.21 Males per 100 Females in Intercourse.
What is the Ratio of Females per 100 Males in Intercourse?
There are 110.85 Females per 100 Males in Intercourse.
What is the Median Population Age in Intercourse?
Median Population Age in Intercourse is 32.8 Years.
What is the Average Family Size in Intercourse
Average Family Size in Intercourse is 4.4 People.
What is the Average Household Size in Intercourse
Average Household Size in Intercourse is 3.5 People.
How Large is the Labor Force in Intercourse?
There are 837 People in the Labor Forcein in Intercourse.
What is the Percentage of People in the Labor Force in Intercourse?
61.6% of People are in the Labor Force in Intercourse.