Zip Codes with the Highest Percentage of Households Without a Vehicle in Pittsburgh, PA
RELATED REPORTS & OPTIONS
Households without a Cars
Pittsburgh
Compare Zip Codes
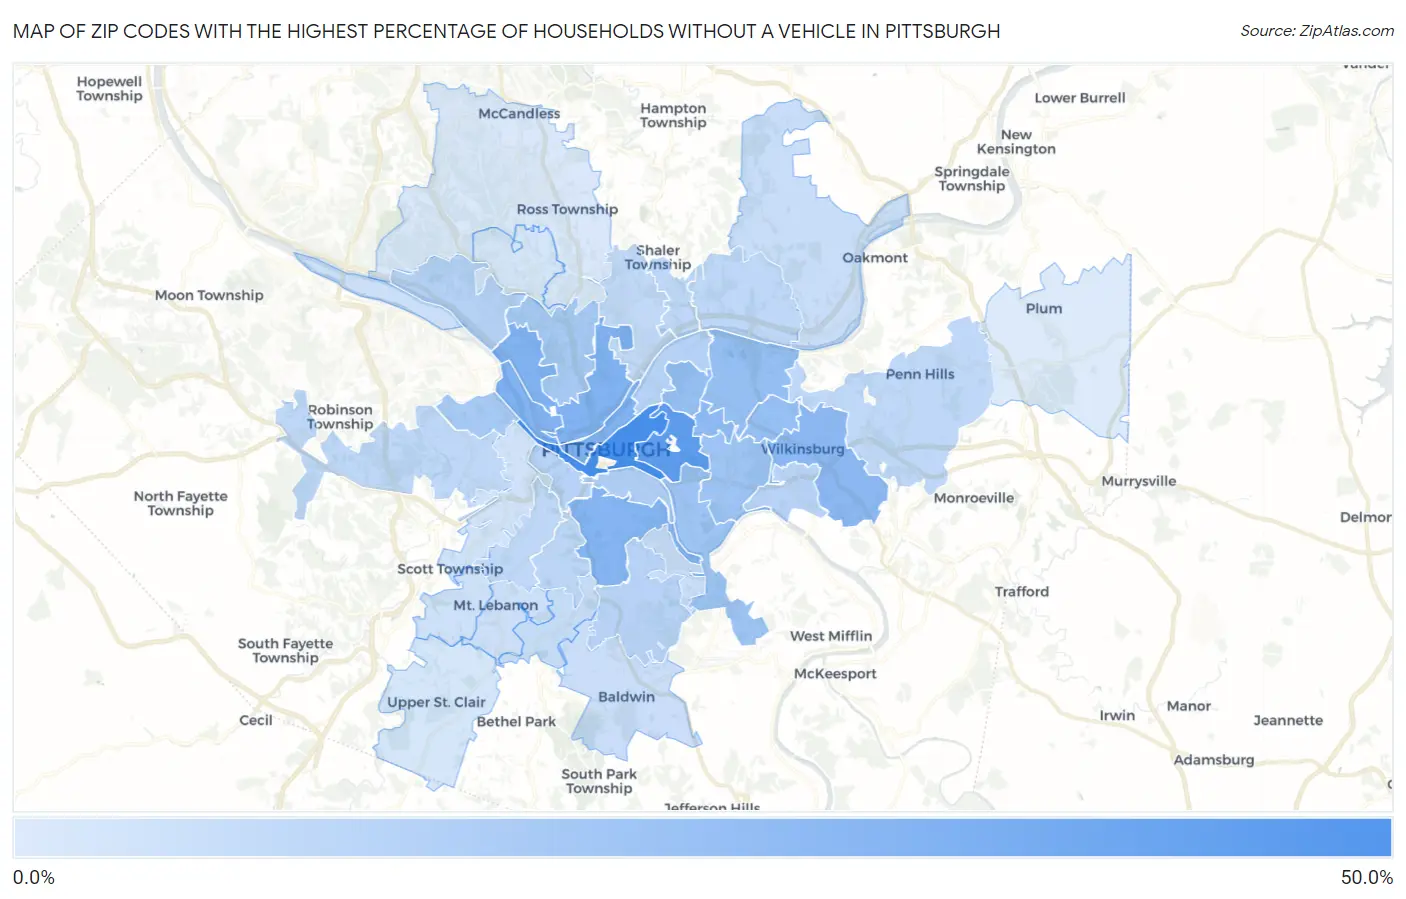
Map of Zip Codes with the Highest Percentage of Households Without a Vehicle in Pittsburgh
3.8%
44.8%
Zip Codes with the Highest Percentage of Households Without a Vehicle in Pittsburgh, PA
| Zip Code | Housholds Without a Car | vs State | vs National | |
| 1. | 15219 | 44.8% | 10.6%(+34.2)#24 | 8.3%(+36.5)#402 |
| 2. | 15213 | 37.6% | 10.6%(+27.0)#38 | 8.3%(+29.3)#573 |
| 3. | 15222 | 27.7% | 10.6%(+17.1)#72 | 8.3%(+19.4)#904 |
| 4. | 15212 | 27.1% | 10.6%(+16.5)#76 | 8.3%(+18.8)#931 |
| 5. | 15233 | 27.0% | 10.6%(+16.4)#79 | 8.3%(+18.7)#940 |
| 6. | 15210 | 26.3% | 10.6%(+15.7)#81 | 8.3%(+18.0)#978 |
| 7. | 15221 | 24.1% | 10.6%(+13.5)#97 | 8.3%(+15.8)#1,127 |
| 8. | 15232 | 23.6% | 10.6%(+13.0)#99 | 8.3%(+15.3)#1,169 |
| 9. | 15206 | 21.9% | 10.6%(+11.3)#111 | 8.3%(+13.6)#1,304 |
| 10. | 15208 | 21.9% | 10.6%(+11.3)#112 | 8.3%(+13.6)#1,308 |
| 11. | 15224 | 21.4% | 10.6%(+10.8)#114 | 8.3%(+13.1)#1,348 |
| 12. | 15217 | 19.1% | 10.6%(+8.50)#139 | 8.3%(+10.8)#1,616 |
| 13. | 15207 | 19.1% | 10.6%(+8.50)#140 | 8.3%(+10.8)#1,619 |
| 14. | 15214 | 16.6% | 10.6%(+6.00)#169 | 8.3%(+8.30)#2,041 |
| 15. | 15204 | 16.5% | 10.6%(+5.90)#170 | 8.3%(+8.20)#2,061 |
| 16. | 15203 | 15.1% | 10.6%(+4.50)#205 | 8.3%(+6.80)#2,362 |
| 17. | 15201 | 13.3% | 10.6%(+2.70)#244 | 8.3%(+5.00)#2,974 |
| 18. | 15202 | 13.1% | 10.6%(+2.50)#250 | 8.3%(+4.80)#3,058 |
| 19. | 15227 | 12.8% | 10.6%(+2.20)#257 | 8.3%(+4.50)#3,179 |
| 20. | 15218 | 12.7% | 10.6%(+2.10)#261 | 8.3%(+4.40)#3,229 |
| 21. | 15211 | 12.5% | 10.6%(+1.90)#266 | 8.3%(+4.20)#3,324 |
| 22. | 15226 | 11.6% | 10.6%(+1.000)#303 | 8.3%(+3.30)#3,773 |
| 23. | 15235 | 11.1% | 10.6%(+0.500)#320 | 8.3%(+2.80)#4,072 |
| 24. | 15215 | 11.1% | 10.6%(+0.500)#324 | 8.3%(+2.80)#4,085 |
| 25. | 15223 | 10.9% | 10.6%(+0.300)#331 | 8.3%(+2.60)#4,208 |
| 26. | 15205 | 10.8% | 10.6%(+0.200)#335 | 8.3%(+2.50)#4,248 |
| 27. | 15216 | 10.8% | 10.6%(+0.200)#336 | 8.3%(+2.50)#4,250 |
| 28. | 15209 | 10.1% | 10.6%(-0.500)#375 | 8.3%(+1.80)#4,793 |
| 29. | 15234 | 9.0% | 10.6%(-1.60)#435 | 8.3%(+0.700)#5,757 |
| 30. | 15238 | 8.7% | 10.6%(-1.90)#460 | 8.3%(+0.400)#6,090 |
| 31. | 15236 | 8.4% | 10.6%(-2.20)#481 | 8.3%(+0.100)#6,430 |
| 32. | 15228 | 7.5% | 10.6%(-3.10)#557 | 8.3%(-0.800)#7,718 |
| 33. | 15225 | 7.4% | 10.6%(-3.20)#578 | 8.3%(-0.900)#7,979 |
| 34. | 15243 | 7.0% | 10.6%(-3.60)#619 | 8.3%(-1.30)#8,586 |
| 35. | 15220 | 6.7% | 10.6%(-3.90)#649 | 8.3%(-1.60)#9,046 |
| 36. | 15229 | 5.4% | 10.6%(-5.20)#817 | 8.3%(-2.90)#11,891 |
| 37. | 15241 | 5.3% | 10.6%(-5.30)#828 | 8.3%(-3.00)#12,118 |
| 38. | 15237 | 4.4% | 10.6%(-6.20)#956 | 8.3%(-3.90)#14,466 |
| 39. | 15239 | 3.8% | 10.6%(-6.80)#1,048 | 8.3%(-4.50)#16,376 |
1
Common Questions
What are the Top 10 Zip Codes with the Highest Percentage of Households Without a Vehicle in Pittsburgh, PA?
Top 10 Zip Codes with the Highest Percentage of Households Without a Vehicle in Pittsburgh, PA are:
What zip code has the Highest Percentage of Households Without a Vehicle in Pittsburgh, PA?
15219 has the Highest Percentage of Households Without a Vehicle in Pittsburgh, PA with 44.8%.
What is the Percentage of Households Without a Vehicle in Pittsburgh, PA?
Percentage of Households Without a Vehicle in Pittsburgh is 21.8%.
What is the Percentage of Households Without a Vehicle in Pennsylvania?
Percentage of Households Without a Vehicle in Pennsylvania is 10.6%.
What is the Percentage of Households Without a Vehicle in the United States?
Percentage of Households Without a Vehicle in the United States is 8.3%.