Danville borough, PA Map & Demographics
Danville borough Overview
$34,962
PER CAPITA INCOME
$73,634
AVG FAMILY INCOME
$58,910
AVG HOUSEHOLD INCOME
43.6%
WAGE / INCOME GAP [ % ]
56.4¢/ $1
WAGE / INCOME GAP [ $ ]
0.48
INEQUALITY / GINI INDEX
4,265
TOTAL POPULATION
1,821
MALE POPULATION
2,444
FEMALE POPULATION
74.51
MALES / 100 FEMALES
134.21
FEMALES / 100 MALES
36.1
MEDIAN AGE
2.6
AVG FAMILY SIZE
2.0
AVG HOUSEHOLD SIZE
1,969
LABOR FORCE [ PEOPLE ]
57.6%
PERCENT IN LABOR FORCE
2.4%
UNEMPLOYMENT RATE
Income in Danville borough
Income Overview in Danville borough
Per Capita Income in Danville borough is $34,962, while median incomes of families and households are $73,634 and $58,910 respectively.
| Characteristic | Number | Measure |
| Per Capita Income | 4,265 | $34,962 |
| Median Family Income | 1,177 | $73,634 |
| Mean Family Income | 1,177 | $87,911 |
| Median Household Income | 2,016 | $58,910 |
| Mean Household Income | 2,016 | $75,196 |
| Income Deficit | 1,177 | $0 |
| Wage / Income Gap (%) | 4,265 | 43.62% |
| Wage / Income Gap ($) | 4,265 | 56.38¢ per $1 |
| Gini / Inequality Index | 4,265 | 0.48 |
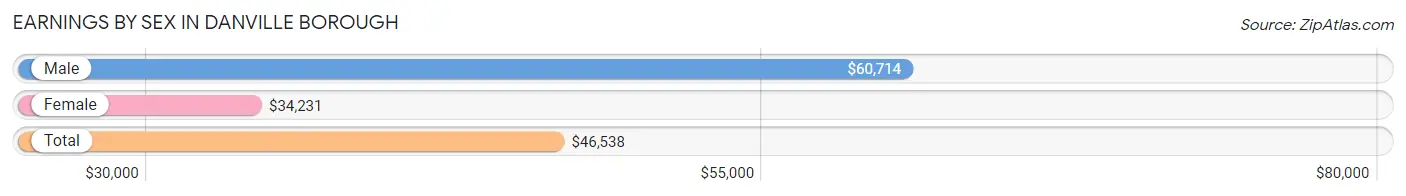
Earnings by Sex in Danville borough
Average Earnings in Danville borough are $46,538, $60,714 for men and $34,231 for women, a difference of 43.6%.
| Sex | Number | Average Earnings |
| Male | 984 (48.5%) | $60,714 |
| Female | 1,046 (51.5%) | $34,231 |
| Total | 2,030 (100.0%) | $46,538 |
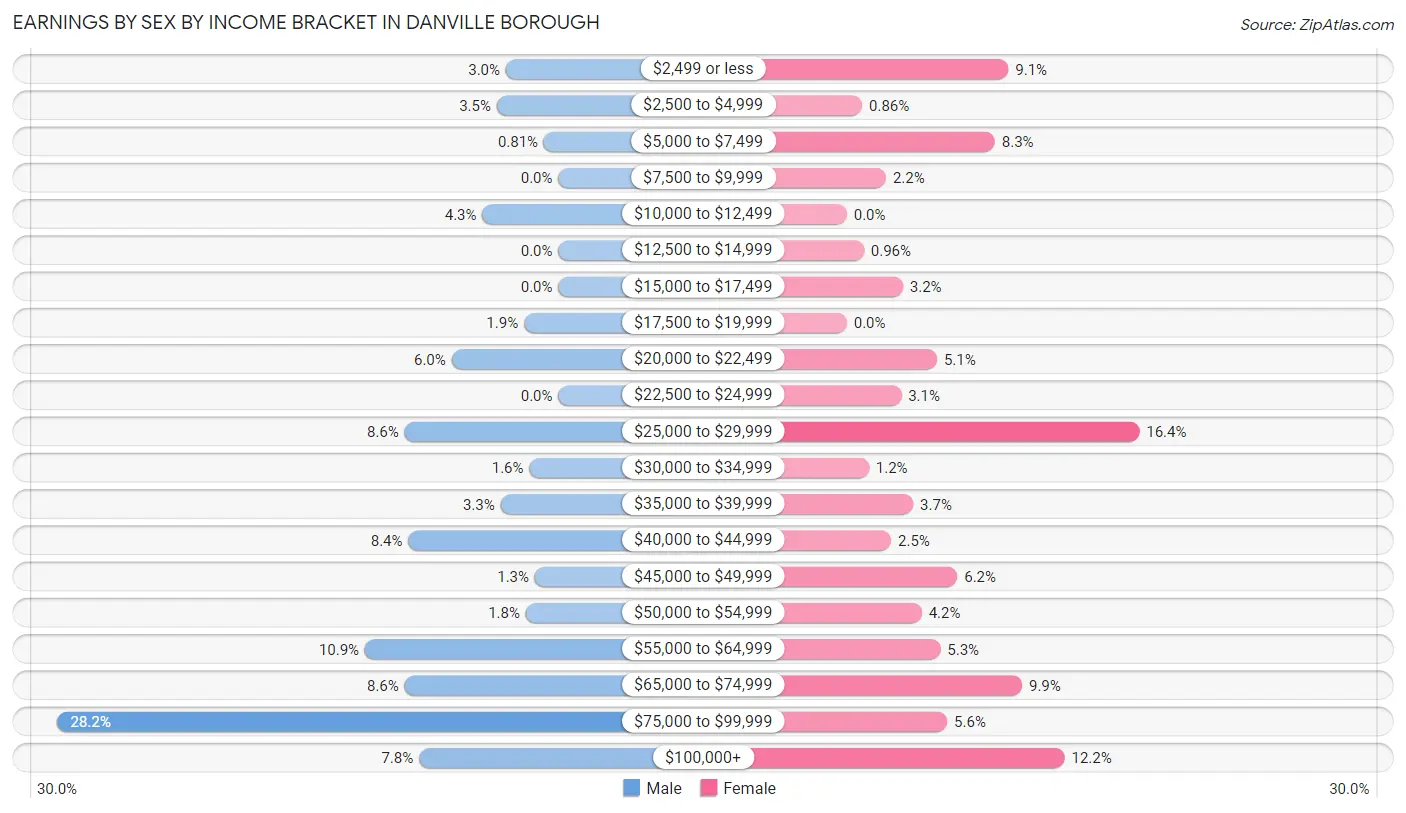
Earnings by Sex by Income Bracket in Danville borough
The most common earnings brackets in Danville borough are $75,000 to $99,999 for men (277 | 28.1%) and $25,000 to $29,999 for women (172 | 16.4%).
| Income | Male | Female |
| $2,499 or less | 29 (2.9%) | 95 (9.1%) |
| $2,500 to $4,999 | 34 (3.5%) | 9 (0.9%) |
| $5,000 to $7,499 | 8 (0.8%) | 87 (8.3%) |
| $7,500 to $9,999 | 0 (0.0%) | 23 (2.2%) |
| $10,000 to $12,499 | 42 (4.3%) | 0 (0.0%) |
| $12,500 to $14,999 | 0 (0.0%) | 10 (1.0%) |
| $15,000 to $17,499 | 0 (0.0%) | 33 (3.2%) |
| $17,500 to $19,999 | 19 (1.9%) | 0 (0.0%) |
| $20,000 to $22,499 | 59 (6.0%) | 53 (5.1%) |
| $22,500 to $24,999 | 0 (0.0%) | 32 (3.1%) |
| $25,000 to $29,999 | 85 (8.6%) | 172 (16.4%) |
| $30,000 to $34,999 | 16 (1.6%) | 13 (1.2%) |
| $35,000 to $39,999 | 32 (3.3%) | 39 (3.7%) |
| $40,000 to $44,999 | 83 (8.4%) | 26 (2.5%) |
| $45,000 to $49,999 | 13 (1.3%) | 65 (6.2%) |
| $50,000 to $54,999 | 18 (1.8%) | 44 (4.2%) |
| $55,000 to $64,999 | 107 (10.9%) | 55 (5.3%) |
| $65,000 to $74,999 | 85 (8.6%) | 103 (9.9%) |
| $75,000 to $99,999 | 277 (28.1%) | 59 (5.6%) |
| $100,000+ | 77 (7.8%) | 128 (12.2%) |
| Total | 984 (100.0%) | 1,046 (100.0%) |
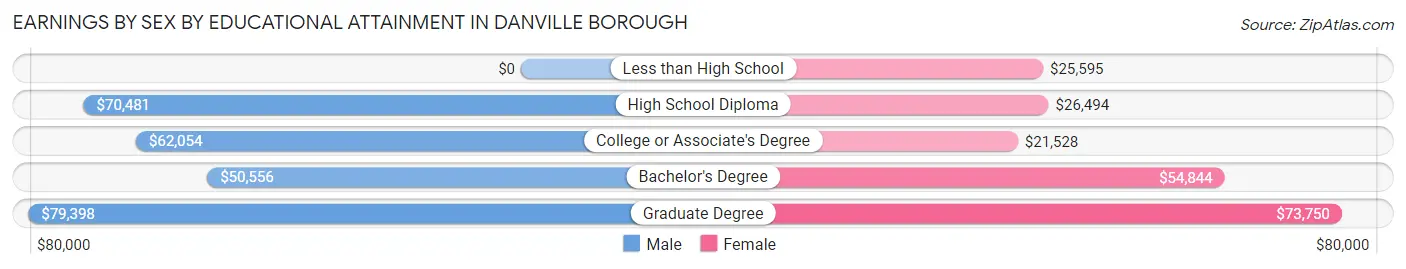
Earnings by Sex by Educational Attainment in Danville borough
Average earnings in Danville borough are $64,946 for men and $43,750 for women, a difference of 32.6%. Men with an educational attainment of graduate degree enjoy the highest average annual earnings of $79,398, while those with bachelor's degree education earn the least with $50,556. Women with an educational attainment of graduate degree earn the most with the average annual earnings of $73,750, while those with college or associate's degree education have the smallest earnings of $21,528.
| Educational Attainment | Male Income | Female Income |
| Less than High School | - | - |
| High School Diploma | $70,481 | $26,494 |
| College or Associate's Degree | $62,054 | $21,528 |
| Bachelor's Degree | $50,556 | $54,844 |
| Graduate Degree | $79,398 | $73,750 |
| Total | $64,946 | $43,750 |
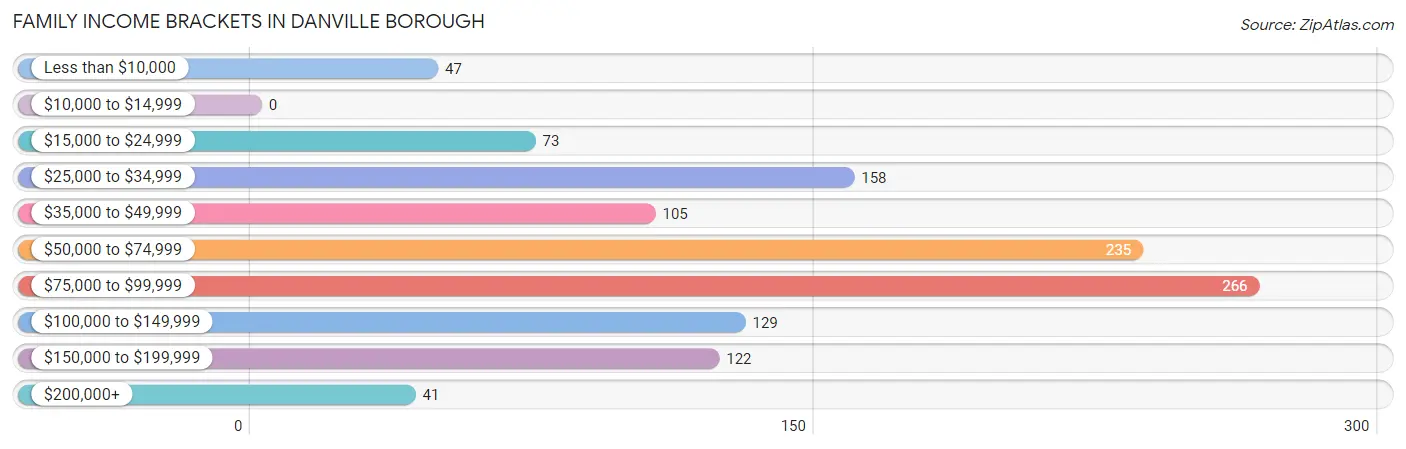
Family Income in Danville borough
Family Income Brackets in Danville borough
According to the Danville borough family income data, there are 266 families falling into the $75,000 to $99,999 income range, which is the most common income bracket and makes up 22.6% of all families.
| Income Bracket | # Families | % Families |
| Less than $10,000 | 47 | 4.0% |
| $10,000 to $14,999 | 0 | 0.0% |
| $15,000 to $24,999 | 73 | 6.2% |
| $25,000 to $34,999 | 158 | 13.4% |
| $35,000 to $49,999 | 105 | 8.9% |
| $50,000 to $74,999 | 235 | 20.0% |
| $75,000 to $99,999 | 266 | 22.6% |
| $100,000 to $149,999 | 129 | 11.0% |
| $150,000 to $199,999 | 122 | 10.4% |
| $200,000+ | 41 | 3.5% |
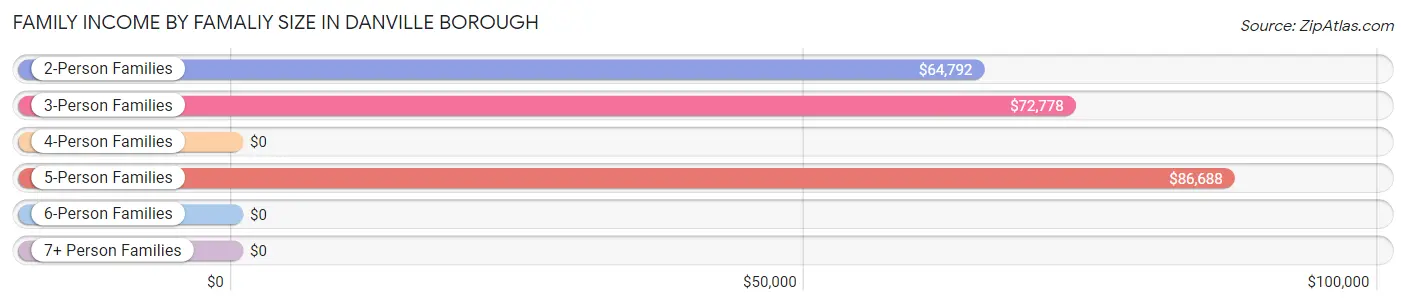
Family Income by Famaliy Size in Danville borough
5-person families (78 | 6.6%) account for the highest median family income in Danville borough with $86,688 per family, while 2-person families (620 | 52.7%) have the highest median income of $32,396 per family member.
| Income Bracket | # Families | Median Income |
| 2-Person Families | 620 (52.7%) | $64,792 |
| 3-Person Families | 416 (35.3%) | $72,778 |
| 4-Person Families | 0 (0.0%) | $0 |
| 5-Person Families | 78 (6.6%) | $86,688 |
| 6-Person Families | 63 (5.3%) | $0 |
| 7+ Person Families | 0 (0.0%) | $0 |
| Total | 1,177 (100.0%) | $73,634 |
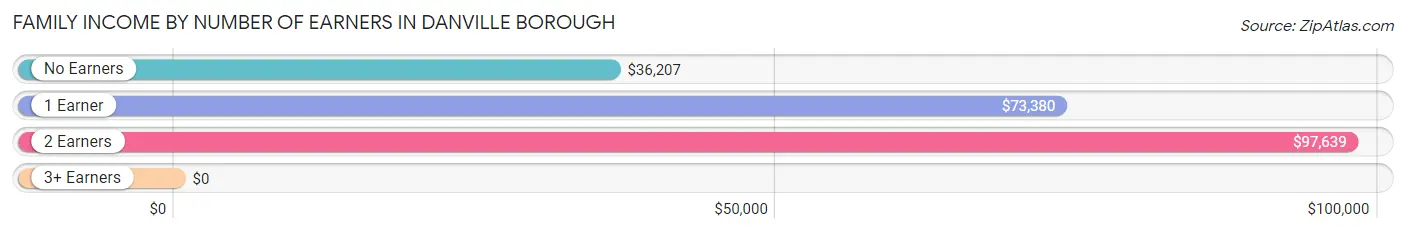
Family Income by Number of Earners in Danville borough
| Number of Earners | # Families | Median Income |
| No Earners | 226 (19.2%) | $36,207 |
| 1 Earner | 482 (40.9%) | $73,380 |
| 2 Earners | 371 (31.5%) | $97,639 |
| 3+ Earners | 98 (8.3%) | $0 |
| Total | 1,177 (100.0%) | $73,634 |
Household Income in Danville borough
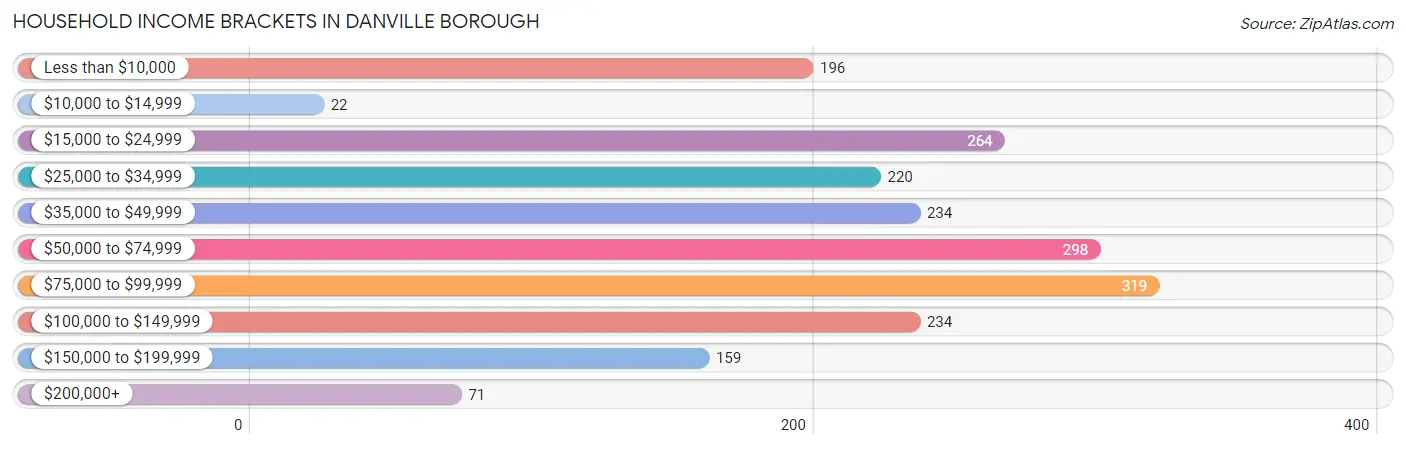
Household Income Brackets in Danville borough
With 319 households falling in the category, the $75,000 to $99,999 income range is the most frequent in Danville borough, accounting for 15.8% of all households. In contrast, only 22 households (1.1%) fall into the $10,000 to $14,999 income bracket, making it the least populous group.
| Income Bracket | # Households | % Households |
| Less than $10,000 | 196 | 9.7% |
| $10,000 to $14,999 | 22 | 1.1% |
| $15,000 to $24,999 | 264 | 13.1% |
| $25,000 to $34,999 | 220 | 10.9% |
| $35,000 to $49,999 | 234 | 11.6% |
| $50,000 to $74,999 | 298 | 14.8% |
| $75,000 to $99,999 | 319 | 15.8% |
| $100,000 to $149,999 | 234 | 11.6% |
| $150,000 to $199,999 | 159 | 7.9% |
| $200,000+ | 71 | 3.5% |
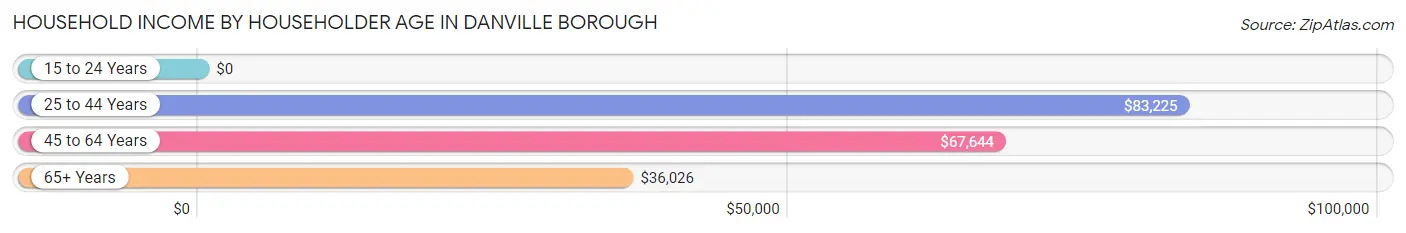
Household Income by Householder Age in Danville borough
The median household income in Danville borough is $58,910, with the highest median household income of $83,225 found in the 25 to 44 years age bracket for the primary householder. A total of 853 households (42.3%) fall into this category. Meanwhile, the 15 to 24 years age bracket for the primary householder has the lowest median household income of $0, with 143 households (7.1%) in this group.
| Income Bracket | # Households | Median Income |
| 15 to 24 Years | 143 (7.1%) | $0 |
| 25 to 44 Years | 853 (42.3%) | $83,225 |
| 45 to 64 Years | 417 (20.7%) | $67,644 |
| 65+ Years | 603 (29.9%) | $36,026 |
| Total | 2,016 (100.0%) | $58,910 |
Poverty in Danville borough
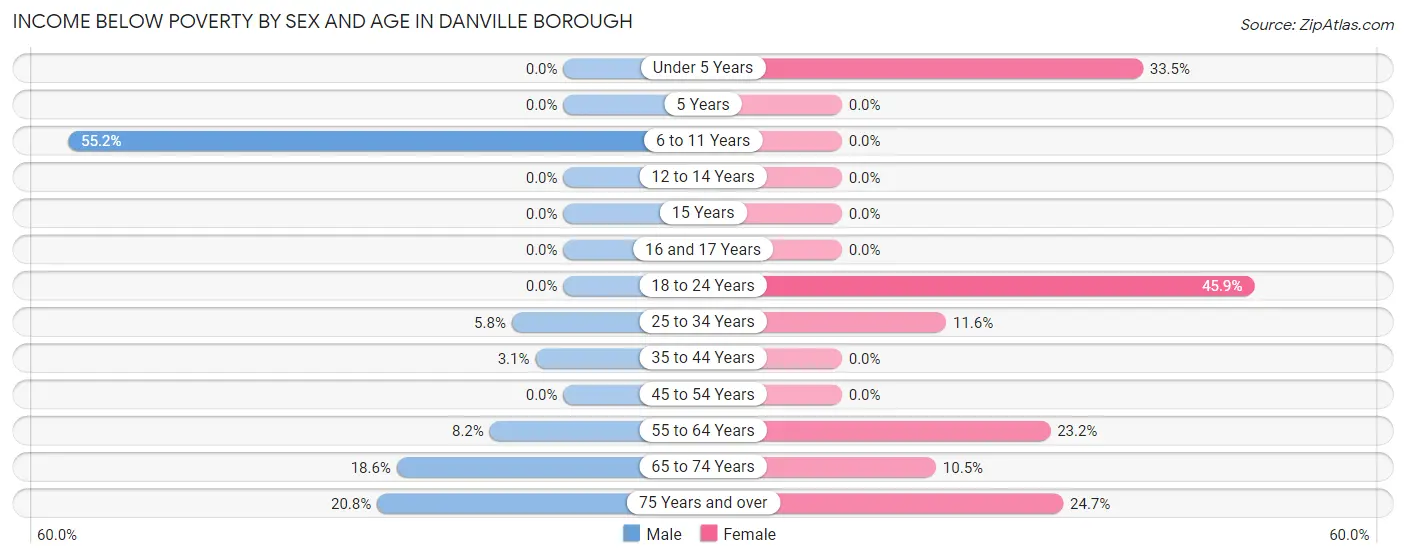
Income Below Poverty by Sex and Age in Danville borough
With 10.9% poverty level for males and 14.9% for females among the residents of Danville borough, 6 to 11 year old males and 18 to 24 year old females are the most vulnerable to poverty, with 91 males (55.1%) and 62 females (45.9%) in their respective age groups living below the poverty level.
| Age Bracket | Male | Female |
| Under 5 Years | 0 (0.0%) | 59 (33.5%) |
| 5 Years | 0 (0.0%) | 0 (0.0%) |
| 6 to 11 Years | 91 (55.1%) | 0 (0.0%) |
| 12 to 14 Years | 0 (0.0%) | 0 (0.0%) |
| 15 Years | 0 (0.0%) | 0 (0.0%) |
| 16 and 17 Years | 0 (0.0%) | 0 (0.0%) |
| 18 to 24 Years | 0 (0.0%) | 62 (45.9%) |
| 25 to 34 Years | 25 (5.8%) | 57 (11.6%) |
| 35 to 44 Years | 8 (3.1%) | 0 (0.0%) |
| 45 to 54 Years | 0 (0.0%) | 0 (0.0%) |
| 55 to 64 Years | 22 (8.2%) | 68 (23.2%) |
| 65 to 74 Years | 36 (18.6%) | 35 (10.5%) |
| 75 Years and over | 11 (20.7%) | 71 (24.6%) |
| Total | 193 (10.9%) | 352 (14.9%) |
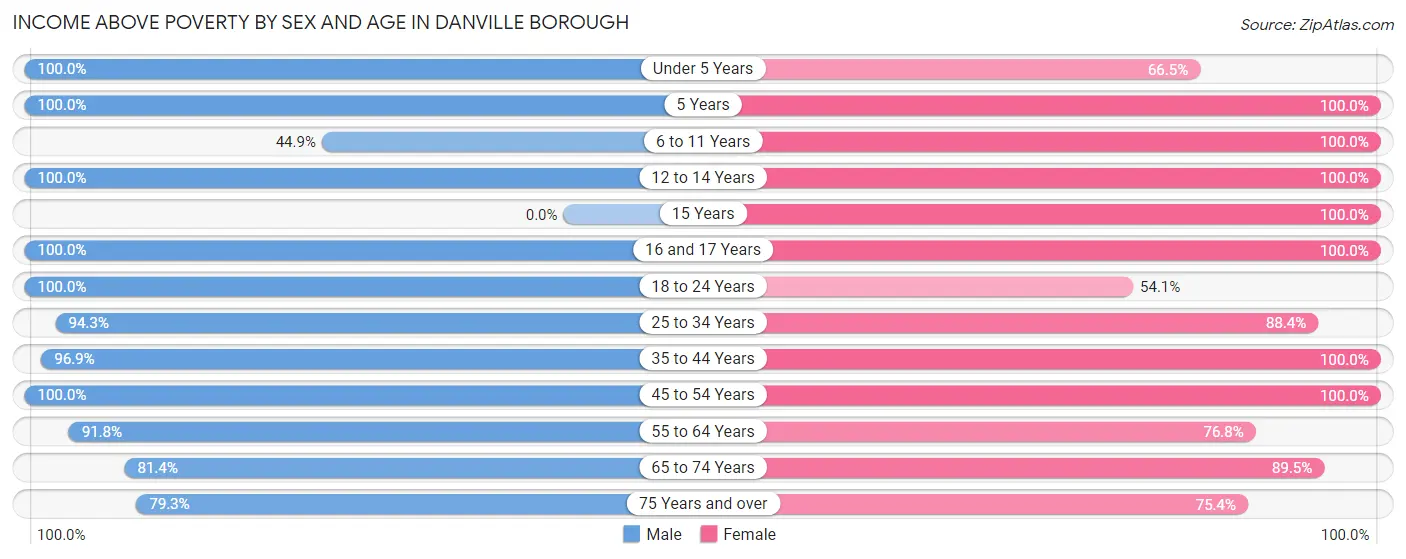
Income Above Poverty by Sex and Age in Danville borough
According to the poverty statistics in Danville borough, males aged under 5 years and females aged 5 years are the age groups that are most secure financially, with 100.0% of males and 100.0% of females in these age groups living above the poverty line.
| Age Bracket | Male | Female |
| Under 5 Years | 139 (100.0%) | 117 (66.5%) |
| 5 Years | 29 (100.0%) | 14 (100.0%) |
| 6 to 11 Years | 74 (44.9%) | 141 (100.0%) |
| 12 to 14 Years | 35 (100.0%) | 41 (100.0%) |
| 15 Years | 0 (0.0%) | 22 (100.0%) |
| 16 and 17 Years | 32 (100.0%) | 66 (100.0%) |
| 18 to 24 Years | 73 (100.0%) | 73 (54.1%) |
| 25 to 34 Years | 410 (94.3%) | 434 (88.4%) |
| 35 to 44 Years | 248 (96.9%) | 245 (100.0%) |
| 45 to 54 Years | 85 (100.0%) | 123 (100.0%) |
| 55 to 64 Years | 246 (91.8%) | 225 (76.8%) |
| 65 to 74 Years | 158 (81.4%) | 299 (89.5%) |
| 75 Years and over | 42 (79.2%) | 217 (75.3%) |
| Total | 1,571 (89.1%) | 2,017 (85.1%) |
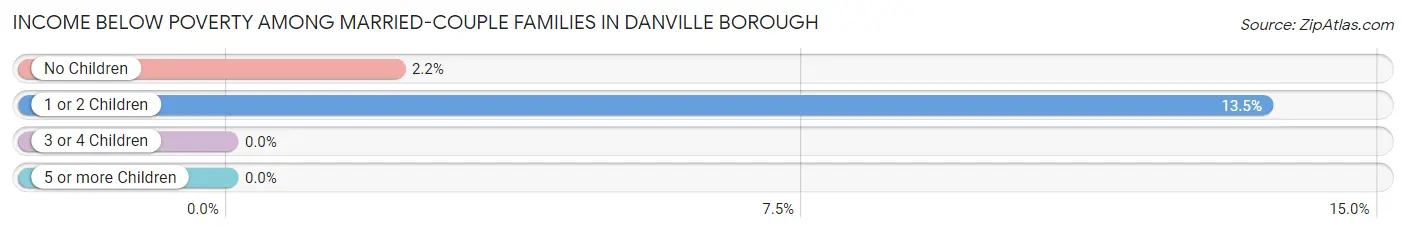
Income Below Poverty Among Married-Couple Families in Danville borough
The poverty statistics for married-couple families in Danville borough show that 5.4% or 44 of the total 814 families live below the poverty line. Families with 1 or 2 children have the highest poverty rate of 13.5%, comprising of 33 families. On the other hand, families with 3 or 4 children have the lowest poverty rate of 0.0%, which includes 0 families.
| Children | Above Poverty | Below Poverty |
| No Children | 494 (97.8%) | 11 (2.2%) |
| 1 or 2 Children | 211 (86.5%) | 33 (13.5%) |
| 3 or 4 Children | 65 (100.0%) | 0 (0.0%) |
| 5 or more Children | 0 (0.0%) | 0 (0.0%) |
| Total | 770 (94.6%) | 44 (5.4%) |
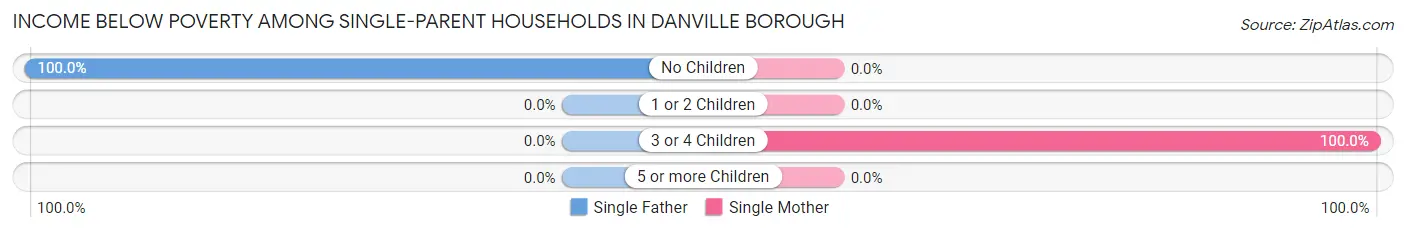
Income Below Poverty Among Single-Parent Households in Danville borough
According to the poverty data in Danville borough, 9.5% or 14 single-father households and 16.7% or 36 single-mother households are living below the poverty line. Among single-father households, those with no children have the highest poverty rate, with 14 households (100.0%) experiencing poverty. Likewise, among single-mother households, those with 3 or 4 children have the highest poverty rate, with 36 households (100.0%) falling below the poverty line.
| Children | Single Father | Single Mother |
| No Children | 14 (100.0%) | 0 (0.0%) |
| 1 or 2 Children | 0 (0.0%) | 0 (0.0%) |
| 3 or 4 Children | 0 (0.0%) | 36 (100.0%) |
| 5 or more Children | 0 (0.0%) | 0 (0.0%) |
| Total | 14 (9.5%) | 36 (16.7%) |
Income Below Poverty Among Married-Couple vs Single-Parent Households in Danville borough
The poverty data for Danville borough shows that 44 of the married-couple family households (5.4%) and 50 of the single-parent households (13.8%) are living below the poverty level. Within the married-couple family households, those with 1 or 2 children have the highest poverty rate, with 33 households (13.5%) falling below the poverty line. Among the single-parent households, those with 3 or 4 children have the highest poverty rate, with 36 household (100.0%) living below poverty.
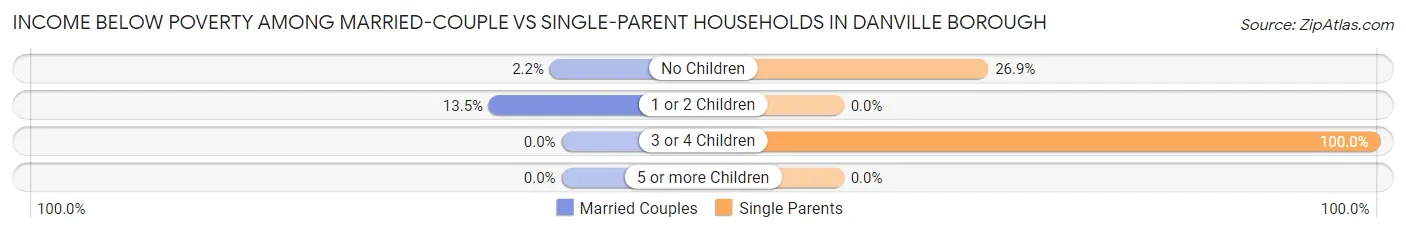
| Children | Married-Couple Families | Single-Parent Households |
| No Children | 11 (2.2%) | 14 (26.9%) |
| 1 or 2 Children | 33 (13.5%) | 0 (0.0%) |
| 3 or 4 Children | 0 (0.0%) | 36 (100.0%) |
| 5 or more Children | 0 (0.0%) | 0 (0.0%) |
| Total | 44 (5.4%) | 50 (13.8%) |
Race in Danville borough
The most populous races in Danville borough are White / Caucasian (3,745 | 87.8%), Asian (226 | 5.3%), and Black / African American (175 | 4.1%).
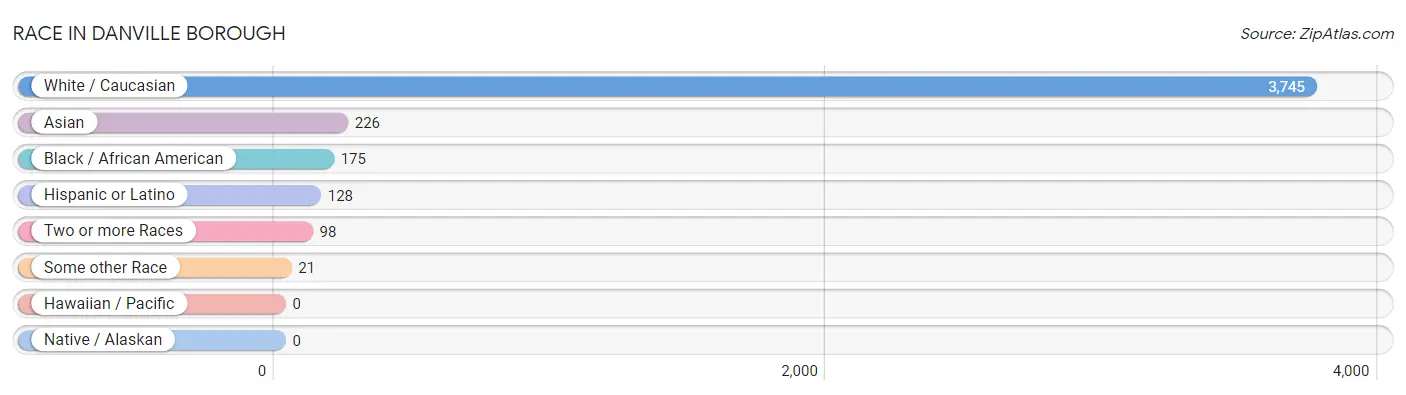
| Race | # Population | % Population |
| Asian | 226 | 5.3% |
| Black / African American | 175 | 4.1% |
| Hawaiian / Pacific | 0 | 0.0% |
| Hispanic or Latino | 128 | 3.0% |
| Native / Alaskan | 0 | 0.0% |
| White / Caucasian | 3,745 | 87.8% |
| Two or more Races | 98 | 2.3% |
| Some other Race | 21 | 0.5% |
| Total | 4,265 | 100.0% |
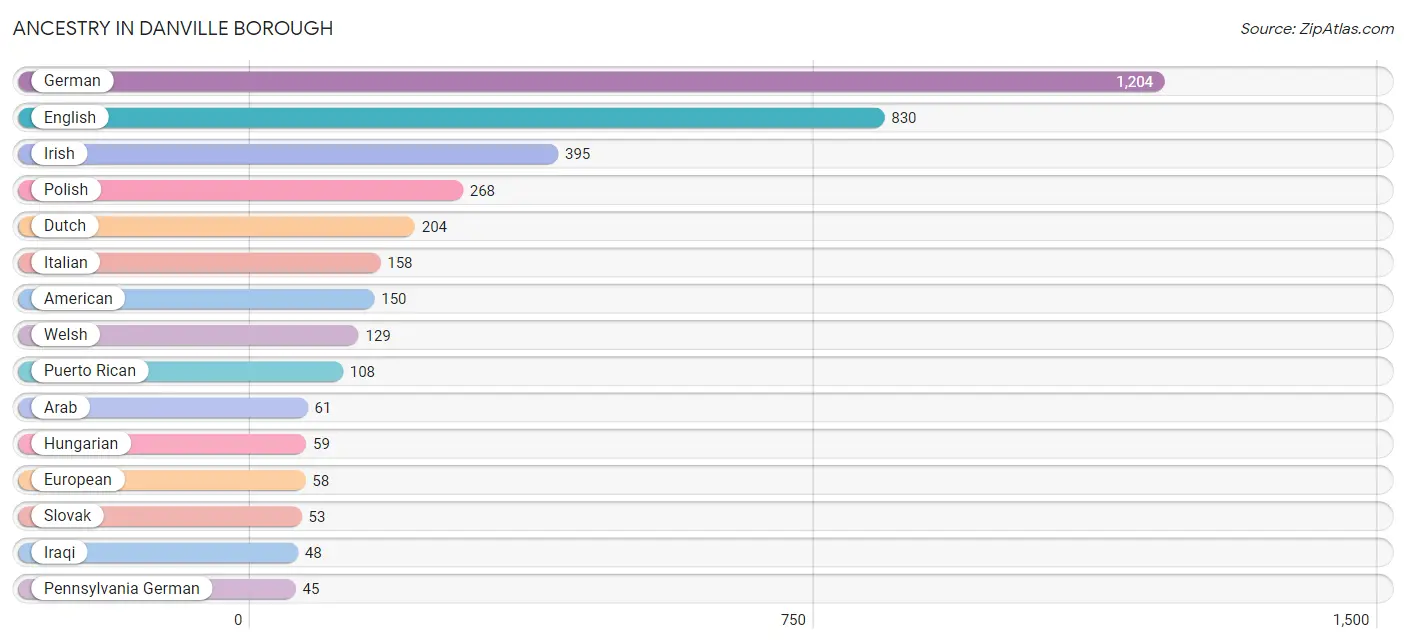
Ancestry in Danville borough
The most populous ancestries reported in Danville borough are German (1,204 | 28.2%), English (830 | 19.5%), Irish (395 | 9.3%), Polish (268 | 6.3%), and Dutch (204 | 4.8%), together accounting for 68.0% of all Danville borough residents.
| Ancestry | # Population | % Population |
| African | 1 | 0.0% |
| American | 150 | 3.5% |
| Arab | 61 | 1.4% |
| Blackfeet | 5 | 0.1% |
| British | 33 | 0.8% |
| Bulgarian | 16 | 0.4% |
| Czech | 14 | 0.3% |
| Dutch | 204 | 4.8% |
| Egyptian | 13 | 0.3% |
| English | 830 | 19.5% |
| European | 58 | 1.4% |
| French | 32 | 0.7% |
| German | 1,204 | 28.2% |
| Hungarian | 59 | 1.4% |
| Iraqi | 48 | 1.1% |
| Irish | 395 | 9.3% |
| Iroquois | 13 | 0.3% |
| Italian | 158 | 3.7% |
| Lithuanian | 1 | 0.0% |
| Norwegian | 15 | 0.4% |
| Pennsylvania German | 45 | 1.1% |
| Polish | 268 | 6.3% |
| Puerto Rican | 108 | 2.5% |
| Romanian | 10 | 0.2% |
| Scotch-Irish | 21 | 0.5% |
| Scottish | 32 | 0.7% |
| Slavic | 26 | 0.6% |
| Slovak | 53 | 1.2% |
| Spaniard | 20 | 0.5% |
| Subsaharan African | 1 | 0.0% |
| Swedish | 21 | 0.5% |
| Swiss | 33 | 0.8% |
| Thai | 23 | 0.5% |
| Ukrainian | 19 | 0.4% |
| Welsh | 129 | 3.0% |
| West Indian | 18 | 0.4% | View All 36 Rows |
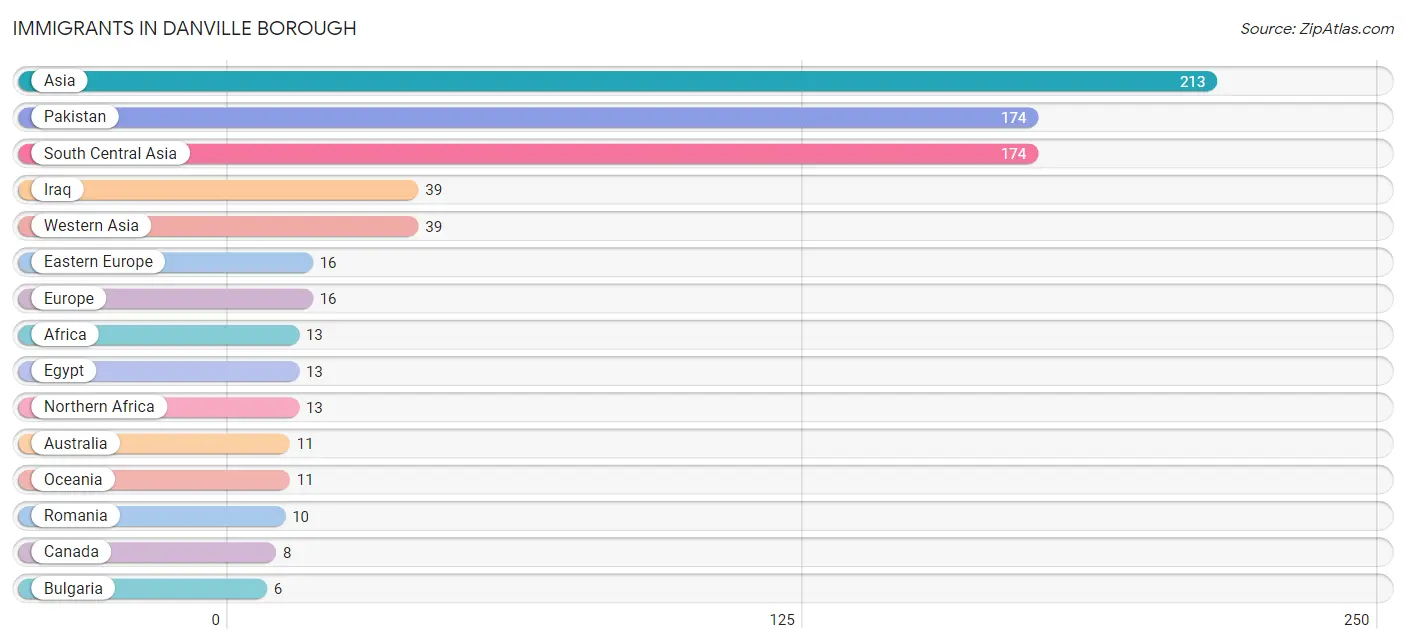
Immigrants in Danville borough
The most numerous immigrant groups reported in Danville borough came from Asia (213 | 5.0%), Pakistan (174 | 4.1%), South Central Asia (174 | 4.1%), Iraq (39 | 0.9%), and Western Asia (39 | 0.9%), together accounting for 15.0% of all Danville borough residents.
| Immigration Origin | # Population | % Population |
| Africa | 13 | 0.3% |
| Asia | 213 | 5.0% |
| Australia | 11 | 0.3% |
| Bulgaria | 6 | 0.1% |
| Canada | 8 | 0.2% |
| Eastern Europe | 16 | 0.4% |
| Egypt | 13 | 0.3% |
| Europe | 16 | 0.4% |
| Iraq | 39 | 0.9% |
| Northern Africa | 13 | 0.3% |
| Oceania | 11 | 0.3% |
| Pakistan | 174 | 4.1% |
| Romania | 10 | 0.2% |
| South Central Asia | 174 | 4.1% |
| Western Asia | 39 | 0.9% | View All 15 Rows |
Sex and Age in Danville borough
Sex and Age in Danville borough
The most populous age groups in Danville borough are 30 to 34 Years (315 | 17.3%) for men and 30 to 34 Years (292 | 11.9%) for women.
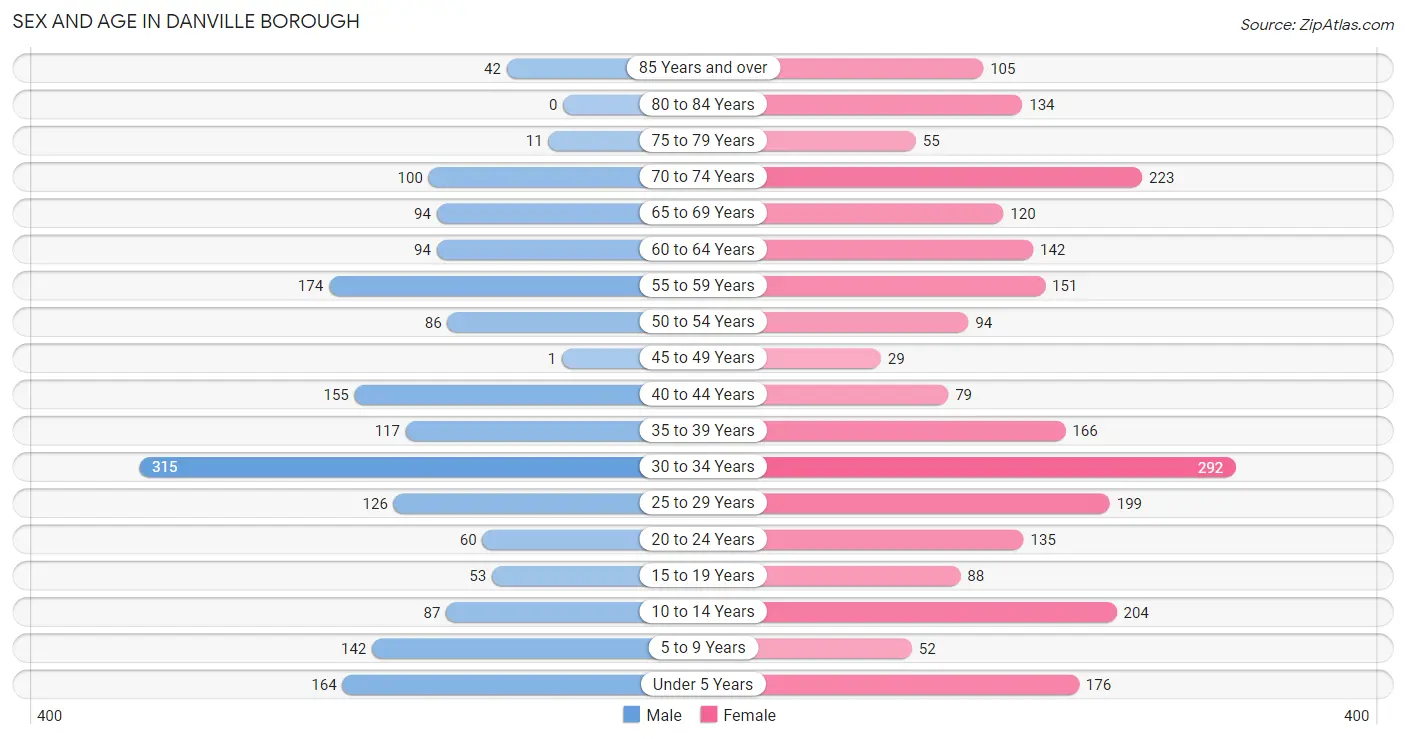
| Age Bracket | Male | Female |
| Under 5 Years | 164 (9.0%) | 176 (7.2%) |
| 5 to 9 Years | 142 (7.8%) | 52 (2.1%) |
| 10 to 14 Years | 87 (4.8%) | 204 (8.4%) |
| 15 to 19 Years | 53 (2.9%) | 88 (3.6%) |
| 20 to 24 Years | 60 (3.3%) | 135 (5.5%) |
| 25 to 29 Years | 126 (6.9%) | 199 (8.1%) |
| 30 to 34 Years | 315 (17.3%) | 292 (11.9%) |
| 35 to 39 Years | 117 (6.4%) | 166 (6.8%) |
| 40 to 44 Years | 155 (8.5%) | 79 (3.2%) |
| 45 to 49 Years | 1 (0.1%) | 29 (1.2%) |
| 50 to 54 Years | 86 (4.7%) | 94 (3.8%) |
| 55 to 59 Years | 174 (9.6%) | 151 (6.2%) |
| 60 to 64 Years | 94 (5.2%) | 142 (5.8%) |
| 65 to 69 Years | 94 (5.2%) | 120 (4.9%) |
| 70 to 74 Years | 100 (5.5%) | 223 (9.1%) |
| 75 to 79 Years | 11 (0.6%) | 55 (2.2%) |
| 80 to 84 Years | 0 (0.0%) | 134 (5.5%) |
| 85 Years and over | 42 (2.3%) | 105 (4.3%) |
| Total | 1,821 (100.0%) | 2,444 (100.0%) |
Families and Households in Danville borough
Median Family Size in Danville borough
The median family size in Danville borough is 2.59 persons per family, with married-couple families (814 | 69.2%) accounting for the largest median family size of 2.66 persons per family. On the other hand, single male/father families (147 | 12.5%) represent the smallest median family size with 2.30 persons per family.
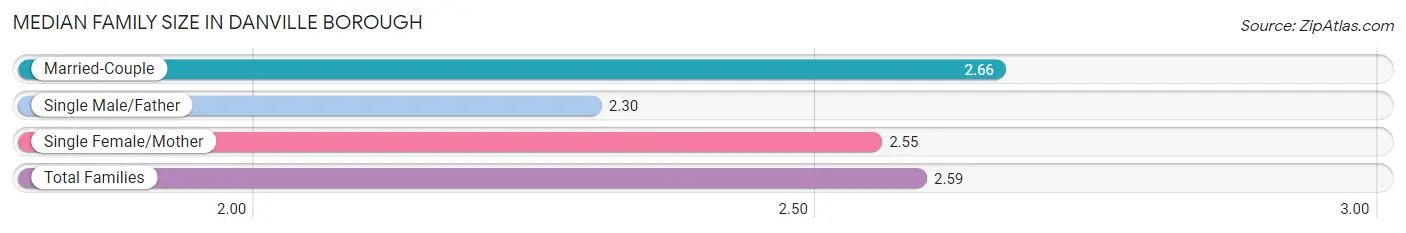
| Family Type | # Families | Family Size |
| Married-Couple | 814 (69.2%) | 2.66 |
| Single Male/Father | 147 (12.5%) | 2.30 |
| Single Female/Mother | 216 (18.3%) | 2.55 |
| Total Families | 1,177 (100.0%) | 2.59 |
Median Household Size in Danville borough
The median household size in Danville borough is 2.05 persons per household, with single male/father households (147 | 7.3%) accounting for the largest median household size of 3.32 persons per household. non-family households (839 | 41.6%) represent the smallest median household size with 1.09 persons per household.
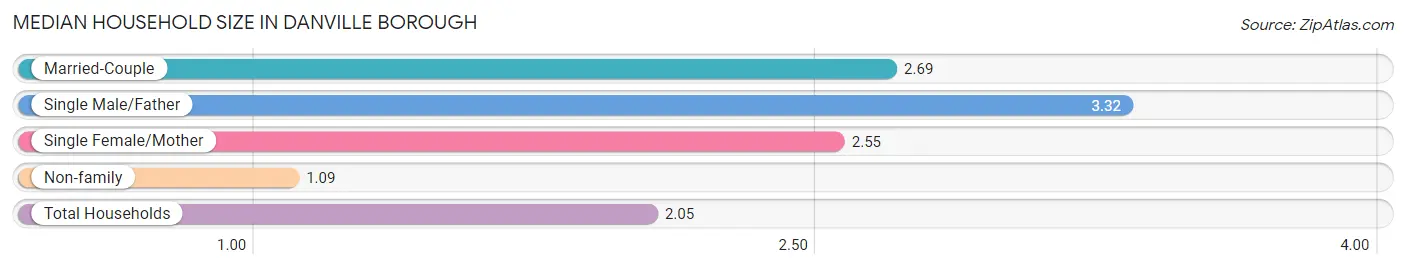
| Household Type | # Households | Household Size |
| Married-Couple | 814 (40.4%) | 2.69 |
| Single Male/Father | 147 (7.3%) | 3.32 |
| Single Female/Mother | 216 (10.7%) | 2.55 |
| Non-family | 839 (41.6%) | 1.09 |
| Total Households | 2,016 (100.0%) | 2.05 |
Household Size by Marriage Status in Danville borough
Out of a total of 2,016 households in Danville borough, 1,177 (58.4%) are family households, while 839 (41.6%) are nonfamily households. The most numerous type of family households are 2-person households, comprising 590, and the most common type of nonfamily households are 1-person households, comprising 767.
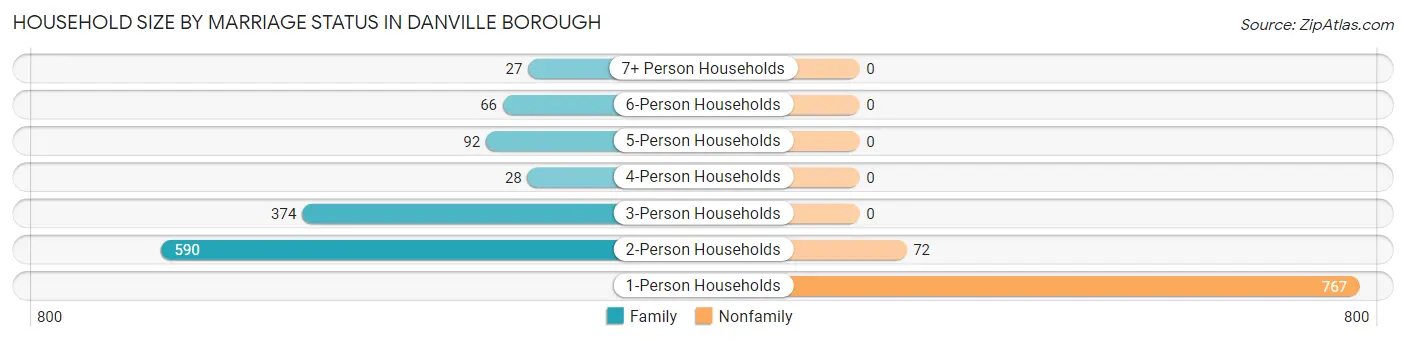
| Household Size | Family Households | Nonfamily Households |
| 1-Person Households | - | 767 (38.1%) |
| 2-Person Households | 590 (29.3%) | 72 (3.6%) |
| 3-Person Households | 374 (18.5%) | 0 (0.0%) |
| 4-Person Households | 28 (1.4%) | 0 (0.0%) |
| 5-Person Households | 92 (4.6%) | 0 (0.0%) |
| 6-Person Households | 66 (3.3%) | 0 (0.0%) |
| 7+ Person Households | 27 (1.3%) | 0 (0.0%) |
| Total | 1,177 (58.4%) | 839 (41.6%) |
Female Fertility in Danville borough
Fertility by Age in Danville borough
Average fertility rate in Danville borough is 57.0 births per 1,000 women. Women in the age bracket of 35 to 50 years have the highest fertility rate with 139.0 births per 1,000 women. Women in the age bracket of 35 to 50 years acount for 70.2% of all women with births.
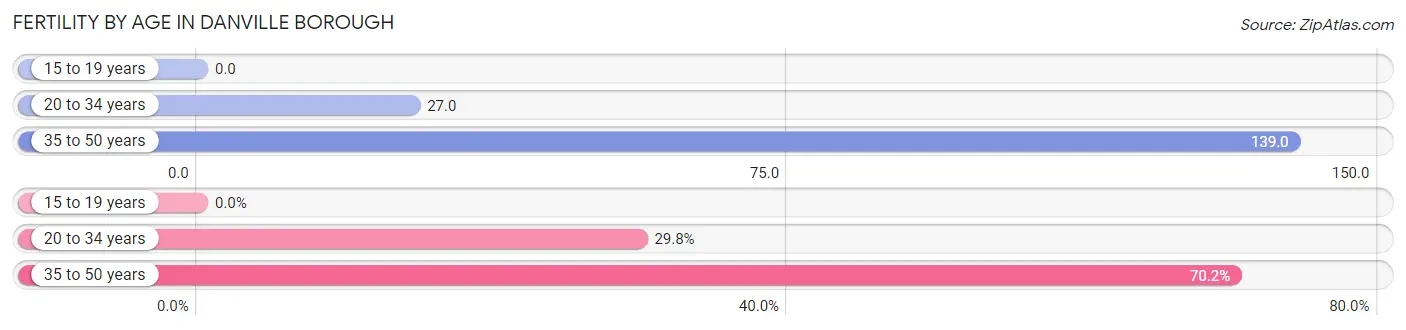
| Age Bracket | Women with Births | Births / 1,000 Women |
| 15 to 19 years | 0 (0.0%) | 0.0 |
| 20 to 34 years | 17 (29.8%) | 27.0 |
| 35 to 50 years | 40 (70.2%) | 139.0 |
| Total | 57 (100.0%) | 57.0 |
Fertility by Age by Marriage Status in Danville borough
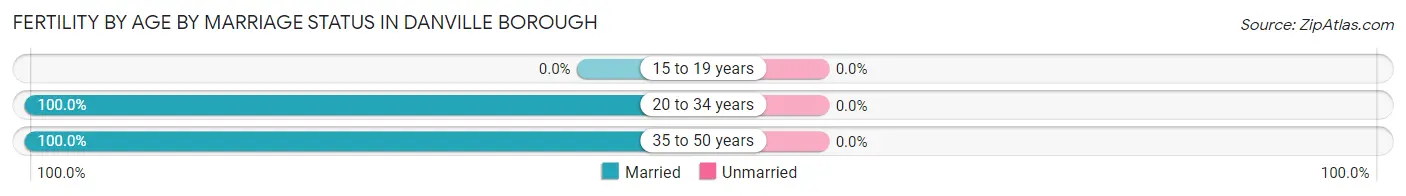
| Age Bracket | Married | Unmarried |
| 15 to 19 years | 0 (0.0%) | 0 (0.0%) |
| 20 to 34 years | 17 (100.0%) | 0 (0.0%) |
| 35 to 50 years | 40 (100.0%) | 0 (0.0%) |
| Total | 57 (100.0%) | 0 (0.0%) |
Fertility by Education in Danville borough
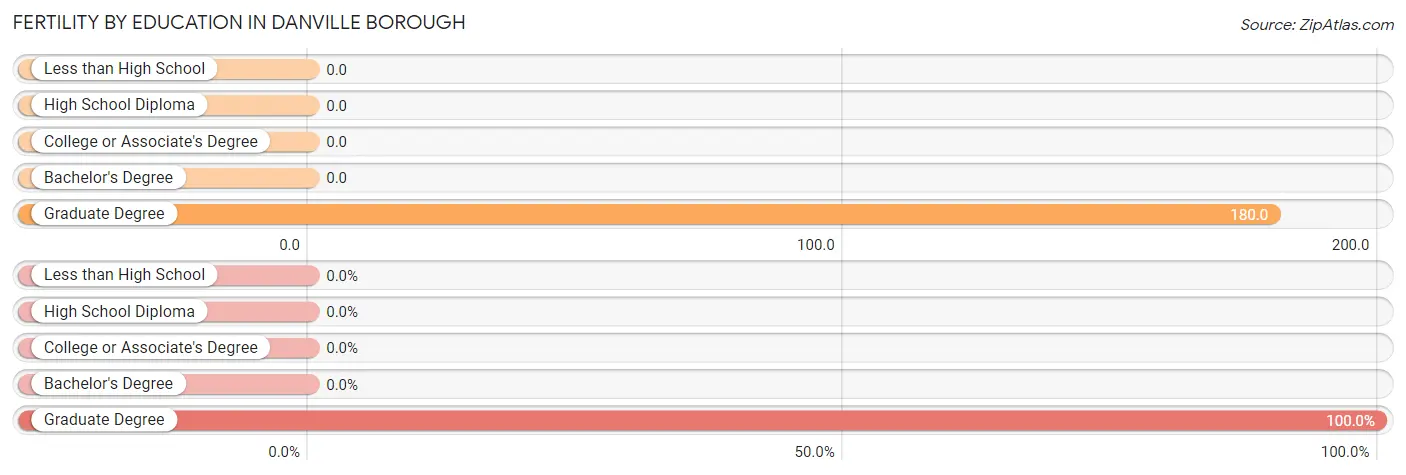
| Educational Attainment | Women with Births | Births / 1,000 Women |
| Less than High School | 0 (0.0%) | 0.0 |
| High School Diploma | 0 (0.0%) | 0.0 |
| College or Associate's Degree | 0 (0.0%) | 0.0 |
| Bachelor's Degree | 0 (0.0%) | 0.0 |
| Graduate Degree | 57 (100.0%) | 180.0 |
| Total | 57 (100.0%) | 57.0 |
Fertility by Education by Marriage Status in Danville borough
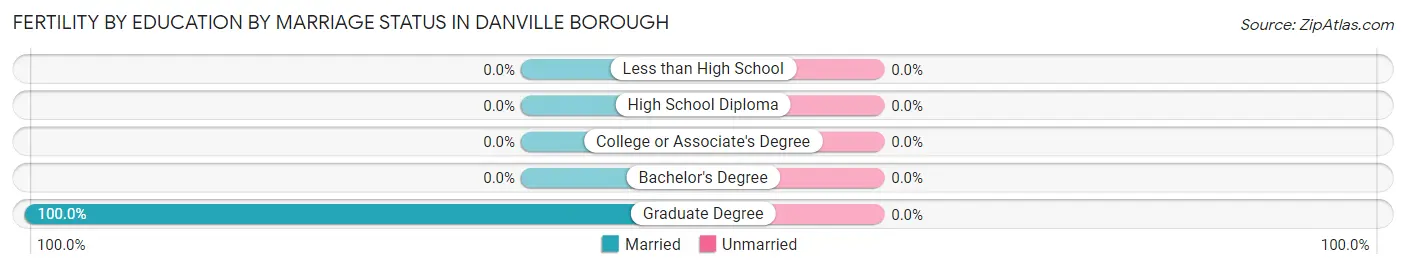
| Educational Attainment | Married | Unmarried |
| Less than High School | 0 (0.0%) | 0 (0.0%) |
| High School Diploma | 0 (0.0%) | 0 (0.0%) |
| College or Associate's Degree | 0 (0.0%) | 0 (0.0%) |
| Bachelor's Degree | 0 (0.0%) | 0 (0.0%) |
| Graduate Degree | 57 (100.0%) | 0 (0.0%) |
| Total | 57 (100.0%) | 0 (0.0%) |
Employment Characteristics in Danville borough
Employment by Class of Employer in Danville borough
Among the 1,904 employed individuals in Danville borough, private company employees (928 | 48.7%), not-for-profit organizations (642 | 33.7%), and local government employees (143 | 7.5%) make up the most common classes of employment.
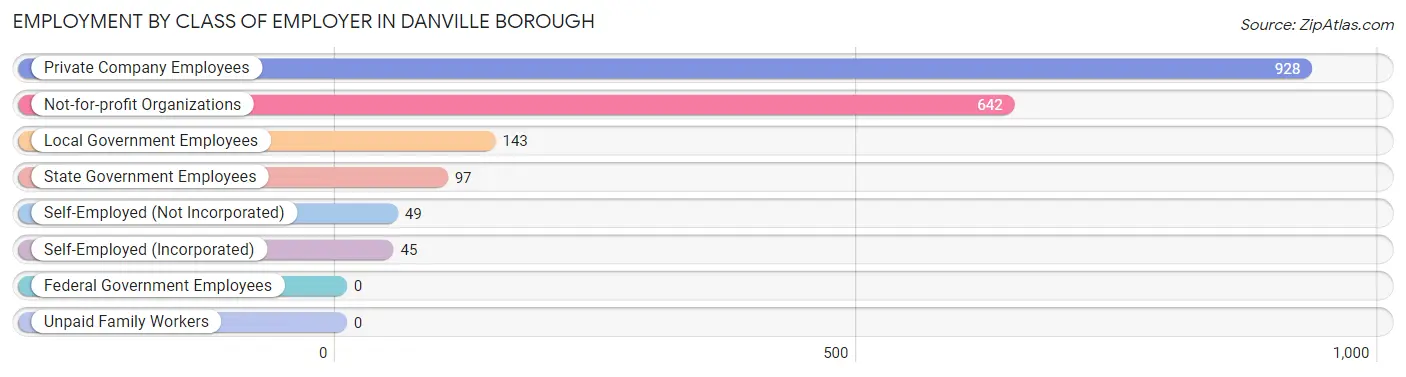
| Employer Class | # Employees | % Employees |
| Private Company Employees | 928 | 48.7% |
| Self-Employed (Incorporated) | 45 | 2.4% |
| Self-Employed (Not Incorporated) | 49 | 2.6% |
| Not-for-profit Organizations | 642 | 33.7% |
| Local Government Employees | 143 | 7.5% |
| State Government Employees | 97 | 5.1% |
| Federal Government Employees | 0 | 0.0% |
| Unpaid Family Workers | 0 | 0.0% |
| Total | 1,904 | 100.0% |
Employment Status by Age in Danville borough
According to the labor force statistics for Danville borough, out of the total population over 16 years of age (3,418), 57.6% or 1,969 individuals are in the labor force, with 2.4% or 47 of them unemployed. The age group with the highest labor force participation rate is 16 to 19 years, with 99.2% or 118 individuals in the labor force. Within the labor force, the 65 to 74 years age range has the highest percentage of unemployed individuals, with 10.0% or 10 of them being unemployed.
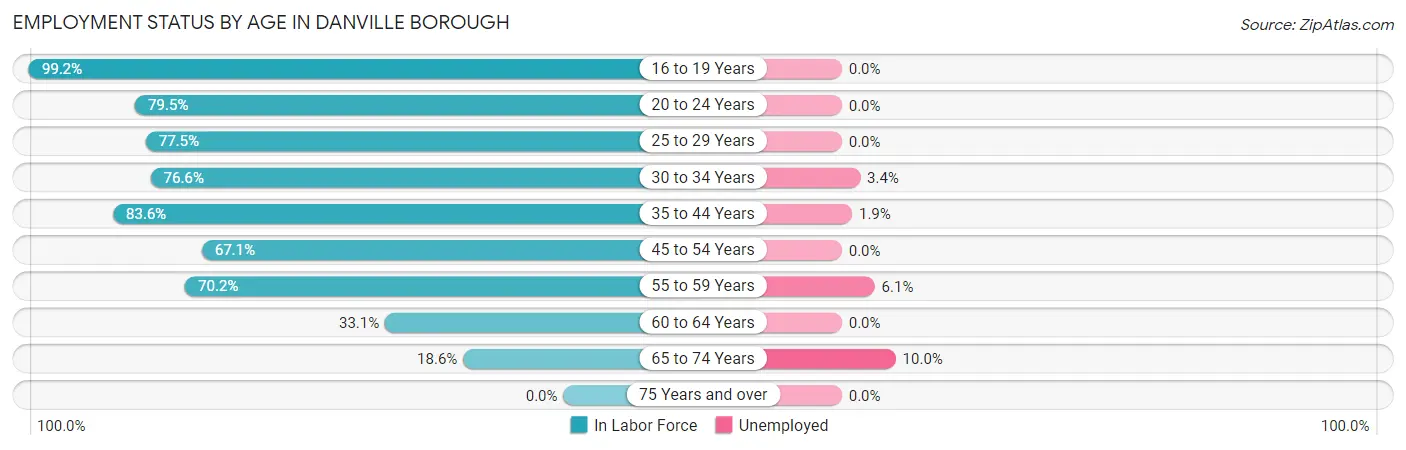
| Age Bracket | In Labor Force | Unemployed |
| 16 to 19 Years | 118 (99.2%) | 0 (0.0%) |
| 20 to 24 Years | 155 (79.5%) | 0 (0.0%) |
| 25 to 29 Years | 252 (77.5%) | 0 (0.0%) |
| 30 to 34 Years | 465 (76.6%) | 16 (3.4%) |
| 35 to 44 Years | 432 (83.6%) | 8 (1.9%) |
| 45 to 54 Years | 141 (67.1%) | 0 (0.0%) |
| 55 to 59 Years | 228 (70.2%) | 14 (6.1%) |
| 60 to 64 Years | 78 (33.1%) | 0 (0.0%) |
| 65 to 74 Years | 100 (18.6%) | 10 (10.0%) |
| 75 Years and over | 0 (0.0%) | 0 (0.0%) |
| Total | 1,969 (57.6%) | 47 (2.4%) |
Employment Status by Educational Attainment in Danville borough
According to labor force statistics for Danville borough, 71.9% of individuals (1,596) out of the total population between 25 and 64 years of age (2,220) are in the labor force, with 2.4% or 38 of them being unemployed. The group with the highest labor force participation rate are those with the educational attainment of bachelor's degree or higher, with 90.1% or 1,023 individuals in the labor force. Within the labor force, individuals with less than high school education have the highest percentage of unemployment, with 25.0% or 14 of them being unemployed.
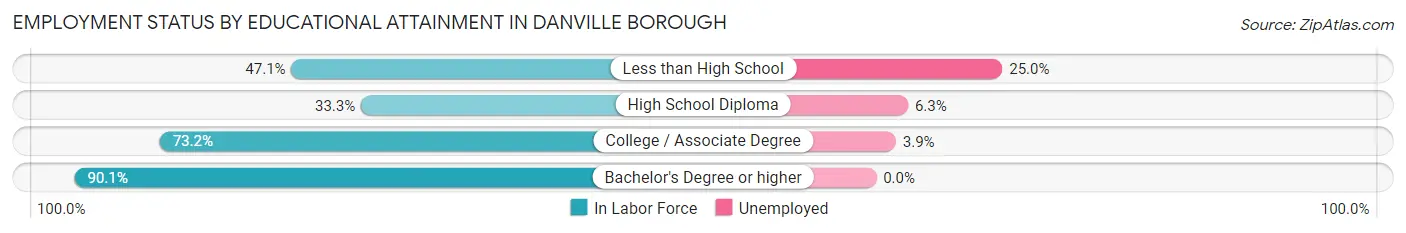
| Educational Attainment | In Labor Force | Unemployed |
| Less than High School | 56 (47.1%) | 30 (25.0%) |
| High School Diploma | 159 (33.3%) | 30 (6.3%) |
| College / Associate Degree | 358 (73.2%) | 19 (3.9%) |
| Bachelor's Degree or higher | 1,023 (90.1%) | 0 (0.0%) |
| Total | 1,596 (71.9%) | 53 (2.4%) |
Employment Occupations by Sex in Danville borough
Management, Business, Science and Arts Occupations
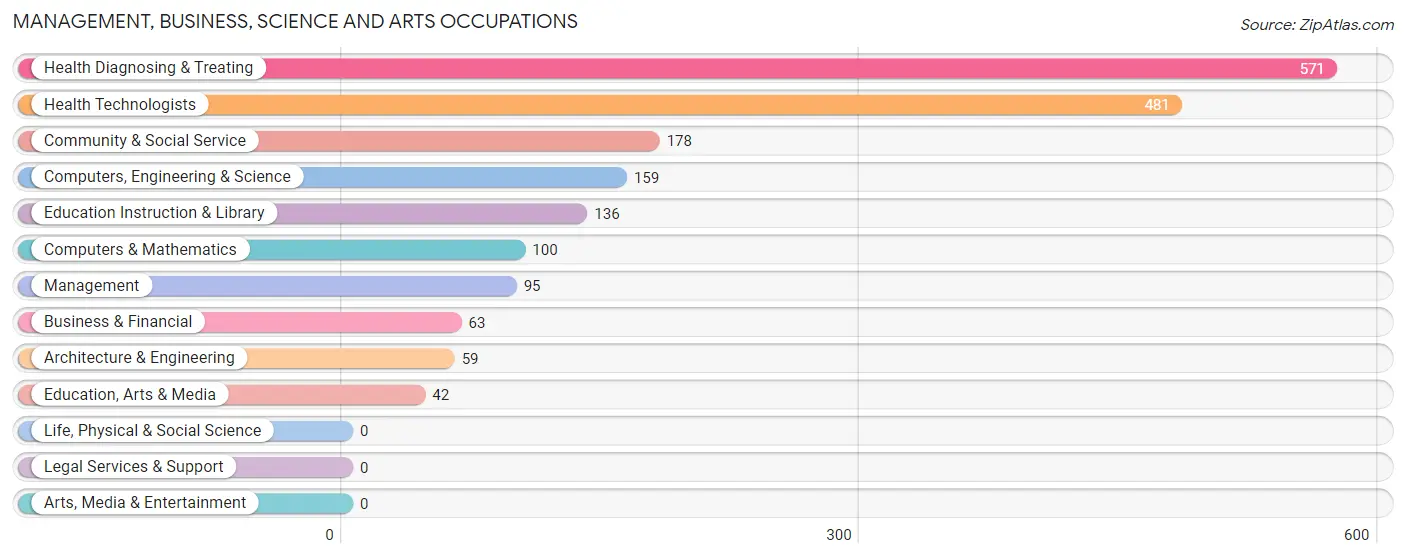
The most common Management, Business, Science and Arts occupations in Danville borough are Health Diagnosing & Treating (571 | 29.7%), Health Technologists (481 | 25.0%), Community & Social Service (178 | 9.3%), Computers, Engineering & Science (159 | 8.3%), and Education Instruction & Library (136 | 7.1%).
Management, Business, Science and Arts Occupations by Sex
Within the Management, Business, Science and Arts occupations in Danville borough, the most male-oriented occupations are Management (100.0%), Architecture & Engineering (100.0%), and Computers, Engineering & Science (91.8%), while the most female-oriented occupations are Education, Arts & Media (100.0%), Community & Social Service (80.3%), and Education Instruction & Library (74.3%).
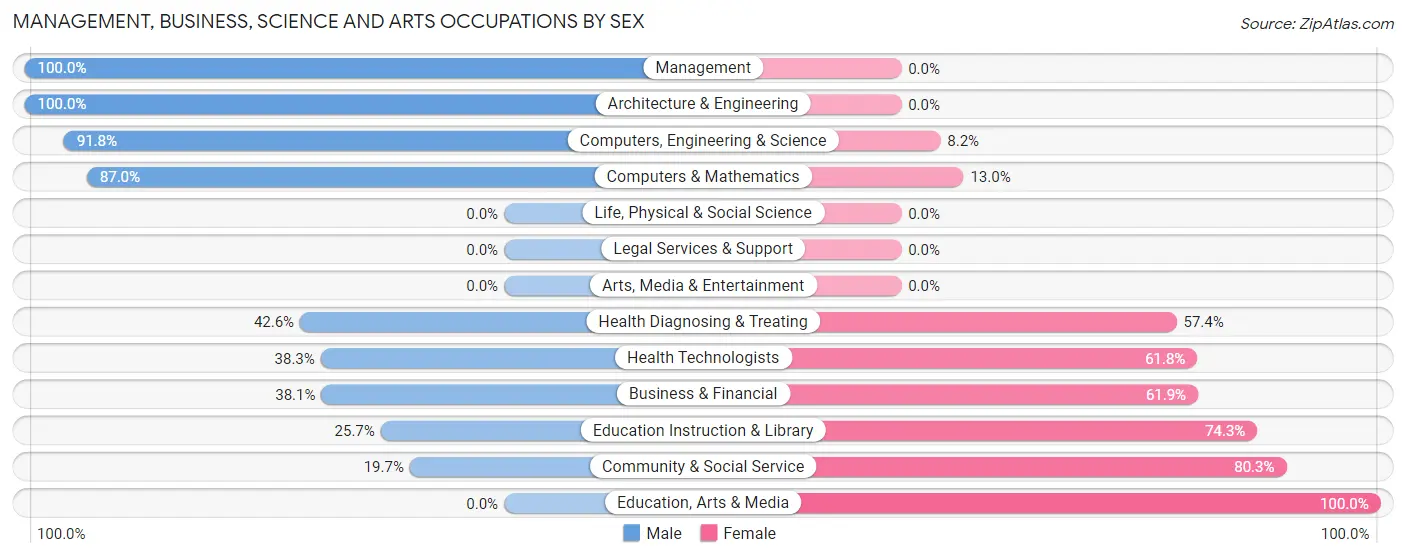
| Occupation | Male | Female |
| Management | 95 (100.0%) | 0 (0.0%) |
| Business & Financial | 24 (38.1%) | 39 (61.9%) |
| Computers, Engineering & Science | 146 (91.8%) | 13 (8.2%) |
| Computers & Mathematics | 87 (87.0%) | 13 (13.0%) |
| Architecture & Engineering | 59 (100.0%) | 0 (0.0%) |
| Life, Physical & Social Science | 0 (0.0%) | 0 (0.0%) |
| Community & Social Service | 35 (19.7%) | 143 (80.3%) |
| Education, Arts & Media | 0 (0.0%) | 42 (100.0%) |
| Legal Services & Support | 0 (0.0%) | 0 (0.0%) |
| Education Instruction & Library | 35 (25.7%) | 101 (74.3%) |
| Arts, Media & Entertainment | 0 (0.0%) | 0 (0.0%) |
| Health Diagnosing & Treating | 243 (42.6%) | 328 (57.4%) |
| Health Technologists | 184 (38.3%) | 297 (61.8%) |
| Total (Category) | 543 (50.9%) | 523 (49.1%) |
| Total (Overall) | 946 (49.2%) | 975 (50.7%) |
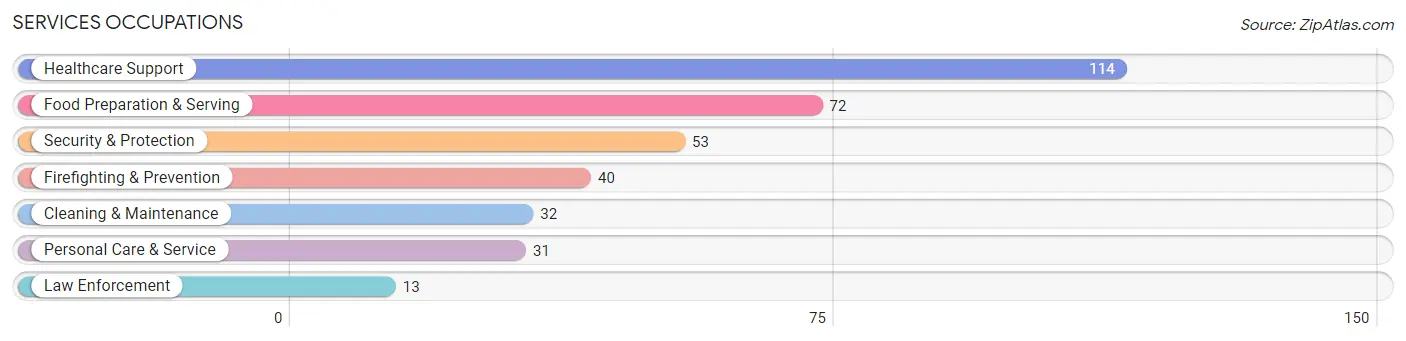
Services Occupations
The most common Services occupations in Danville borough are Healthcare Support (114 | 5.9%), Food Preparation & Serving (72 | 3.7%), Security & Protection (53 | 2.8%), Firefighting & Prevention (40 | 2.1%), and Cleaning & Maintenance (32 | 1.7%).
Services Occupations by Sex
Within the Services occupations in Danville borough, the most male-oriented occupations are Security & Protection (100.0%), Firefighting & Prevention (100.0%), and Law Enforcement (100.0%), while the most female-oriented occupations are Healthcare Support (93.0%), Food Preparation & Serving (80.6%), and Personal Care & Service (41.9%).
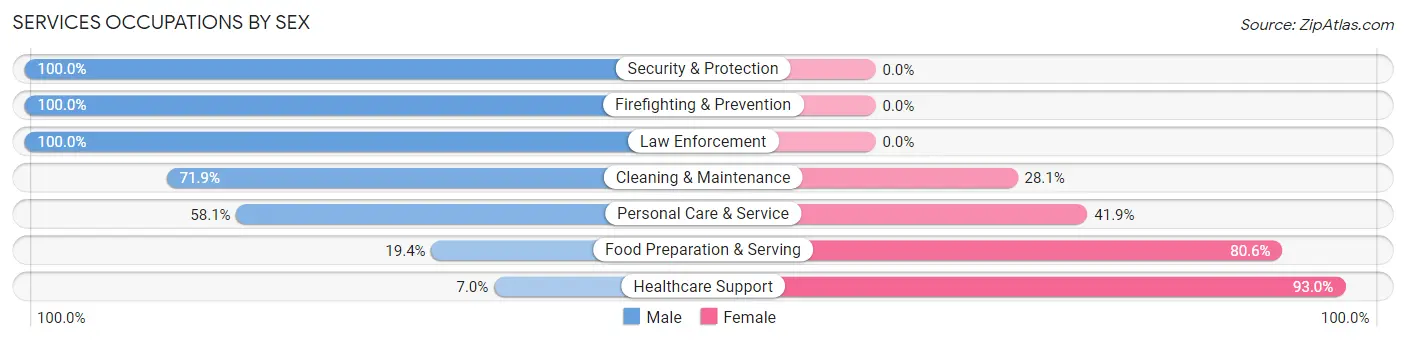
| Occupation | Male | Female |
| Healthcare Support | 8 (7.0%) | 106 (93.0%) |
| Security & Protection | 53 (100.0%) | 0 (0.0%) |
| Firefighting & Prevention | 40 (100.0%) | 0 (0.0%) |
| Law Enforcement | 13 (100.0%) | 0 (0.0%) |
| Food Preparation & Serving | 14 (19.4%) | 58 (80.6%) |
| Cleaning & Maintenance | 23 (71.9%) | 9 (28.1%) |
| Personal Care & Service | 18 (58.1%) | 13 (41.9%) |
| Total (Category) | 116 (38.4%) | 186 (61.6%) |
| Total (Overall) | 946 (49.2%) | 975 (50.7%) |
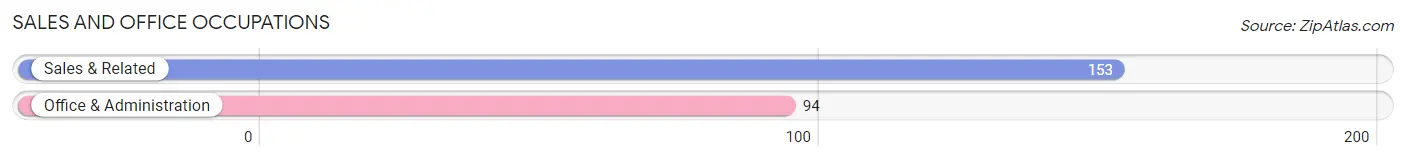
Sales and Office Occupations
The most common Sales and Office occupations in Danville borough are Sales & Related (153 | 8.0%), and Office & Administration (94 | 4.9%).
Sales and Office Occupations by Sex
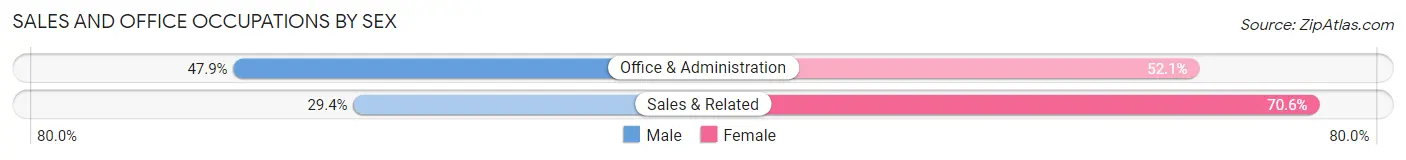
| Occupation | Male | Female |
| Sales & Related | 45 (29.4%) | 108 (70.6%) |
| Office & Administration | 45 (47.9%) | 49 (52.1%) |
| Total (Category) | 90 (36.4%) | 157 (63.6%) |
| Total (Overall) | 946 (49.2%) | 975 (50.7%) |
Natural Resources, Construction and Maintenance Occupations
The most common Natural Resources, Construction and Maintenance occupations in Danville borough are Construction & Extraction (64 | 3.3%), and Installation, Maintenance & Repair (20 | 1.0%).
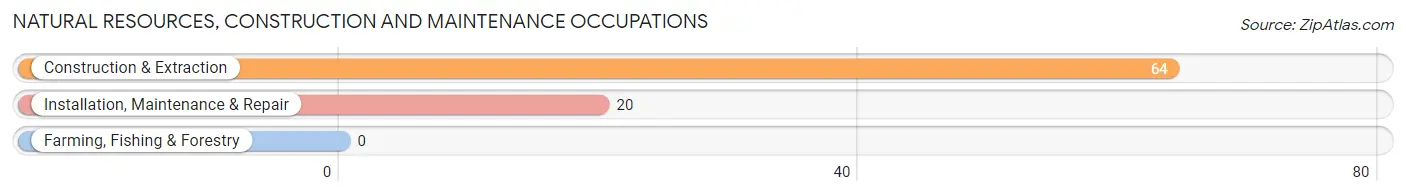
Natural Resources, Construction and Maintenance Occupations by Sex

| Occupation | Male | Female |
| Farming, Fishing & Forestry | 0 (0.0%) | 0 (0.0%) |
| Construction & Extraction | 64 (100.0%) | 0 (0.0%) |
| Installation, Maintenance & Repair | 20 (100.0%) | 0 (0.0%) |
| Total (Category) | 84 (100.0%) | 0 (0.0%) |
| Total (Overall) | 946 (49.2%) | 975 (50.7%) |
Production, Transportation and Moving Occupations
The most common Production, Transportation and Moving occupations in Danville borough are Material Moving (123 | 6.4%), and Production (99 | 5.1%).
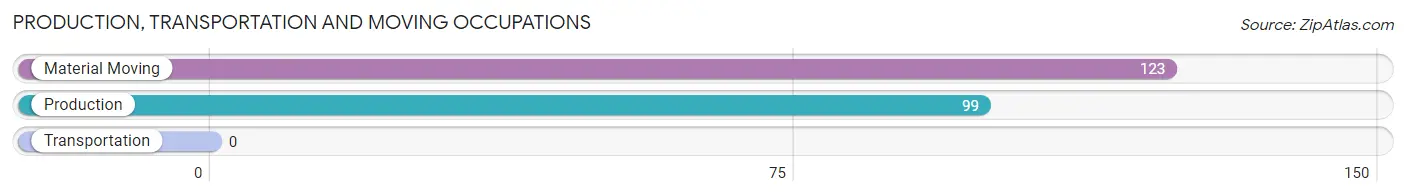
Production, Transportation and Moving Occupations by Sex
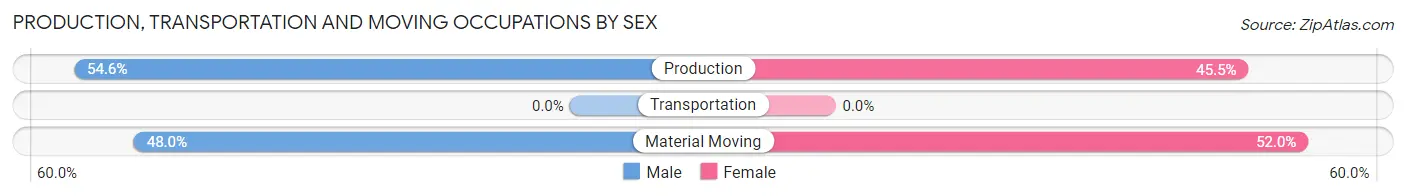
| Occupation | Male | Female |
| Production | 54 (54.5%) | 45 (45.5%) |
| Transportation | 0 (0.0%) | 0 (0.0%) |
| Material Moving | 59 (48.0%) | 64 (52.0%) |
| Total (Category) | 113 (50.9%) | 109 (49.1%) |
| Total (Overall) | 946 (49.2%) | 975 (50.7%) |
Employment Industries by Sex in Danville borough
Employment Industries in Danville borough
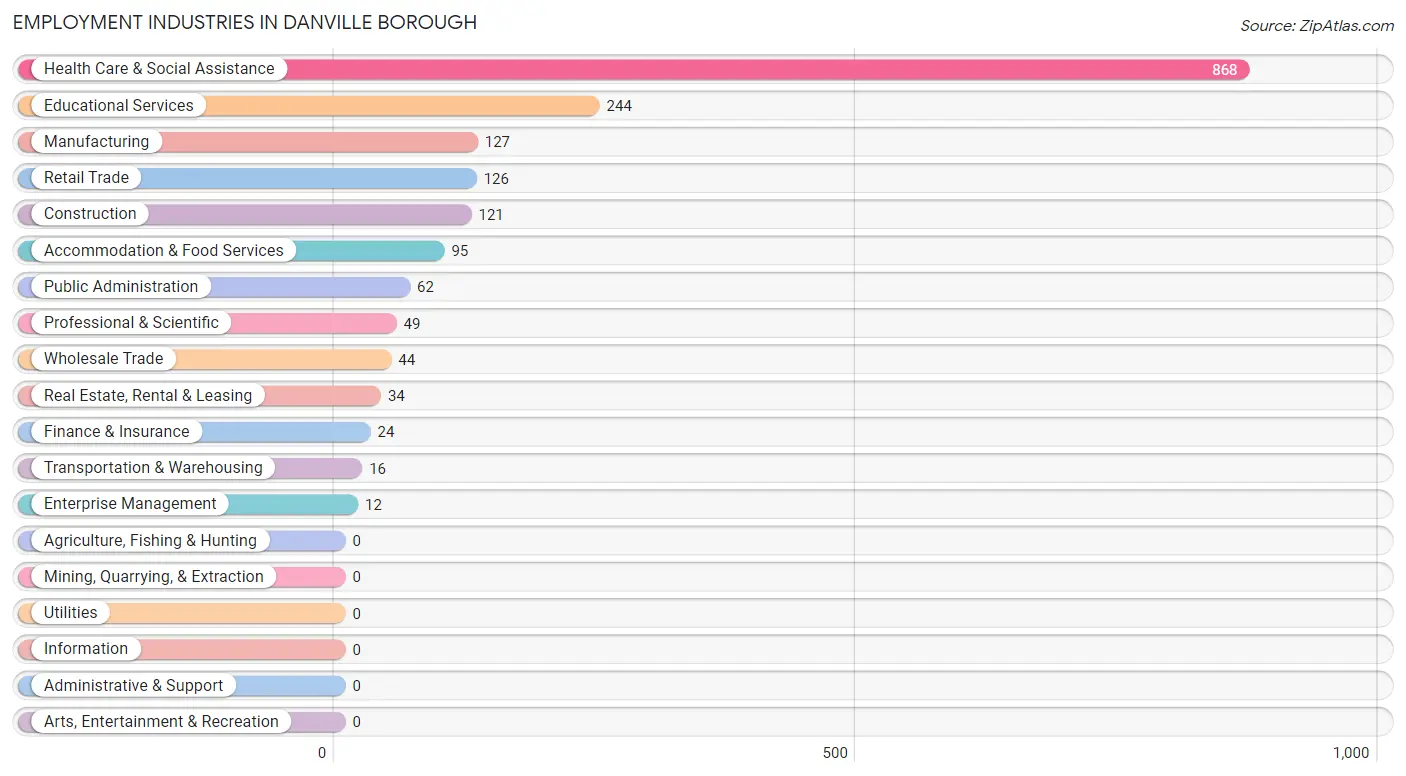
The major employment industries in Danville borough include Health Care & Social Assistance (868 | 45.2%), Educational Services (244 | 12.7%), Manufacturing (127 | 6.6%), Retail Trade (126 | 6.6%), and Construction (121 | 6.3%).
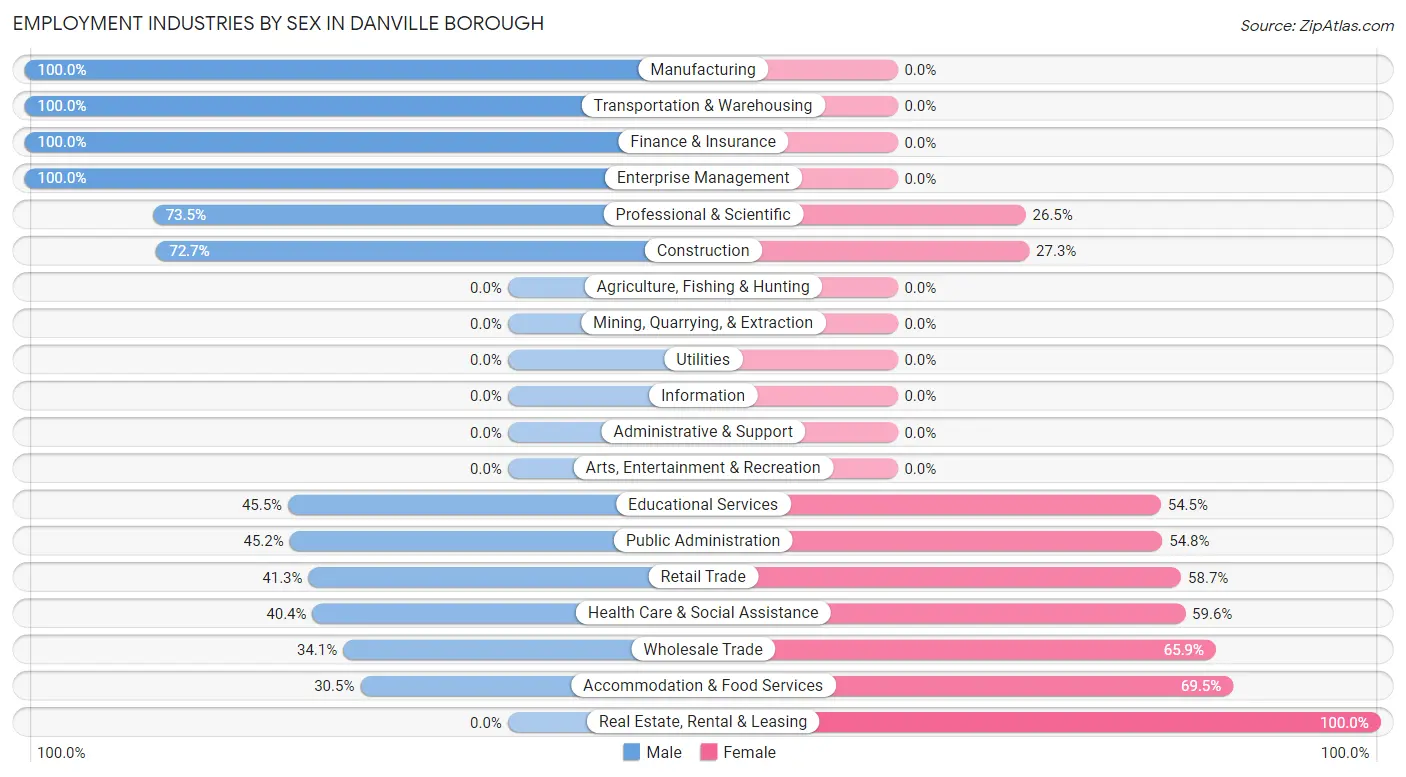
Employment Industries by Sex in Danville borough
The Danville borough industries that see more men than women are Manufacturing (100.0%), Transportation & Warehousing (100.0%), and Finance & Insurance (100.0%), whereas the industries that tend to have a higher number of women are Real Estate, Rental & Leasing (100.0%), Accommodation & Food Services (69.5%), and Wholesale Trade (65.9%).
| Industry | Male | Female |
| Agriculture, Fishing & Hunting | 0 (0.0%) | 0 (0.0%) |
| Mining, Quarrying, & Extraction | 0 (0.0%) | 0 (0.0%) |
| Construction | 88 (72.7%) | 33 (27.3%) |
| Manufacturing | 127 (100.0%) | 0 (0.0%) |
| Wholesale Trade | 15 (34.1%) | 29 (65.9%) |
| Retail Trade | 52 (41.3%) | 74 (58.7%) |
| Transportation & Warehousing | 16 (100.0%) | 0 (0.0%) |
| Utilities | 0 (0.0%) | 0 (0.0%) |
| Information | 0 (0.0%) | 0 (0.0%) |
| Finance & Insurance | 24 (100.0%) | 0 (0.0%) |
| Real Estate, Rental & Leasing | 0 (0.0%) | 34 (100.0%) |
| Professional & Scientific | 36 (73.5%) | 13 (26.5%) |
| Enterprise Management | 12 (100.0%) | 0 (0.0%) |
| Administrative & Support | 0 (0.0%) | 0 (0.0%) |
| Educational Services | 111 (45.5%) | 133 (54.5%) |
| Health Care & Social Assistance | 351 (40.4%) | 517 (59.6%) |
| Arts, Entertainment & Recreation | 0 (0.0%) | 0 (0.0%) |
| Accommodation & Food Services | 29 (30.5%) | 66 (69.5%) |
| Public Administration | 28 (45.2%) | 34 (54.8%) |
| Total | 946 (49.2%) | 975 (50.7%) |
Education in Danville borough
School Enrollment in Danville borough
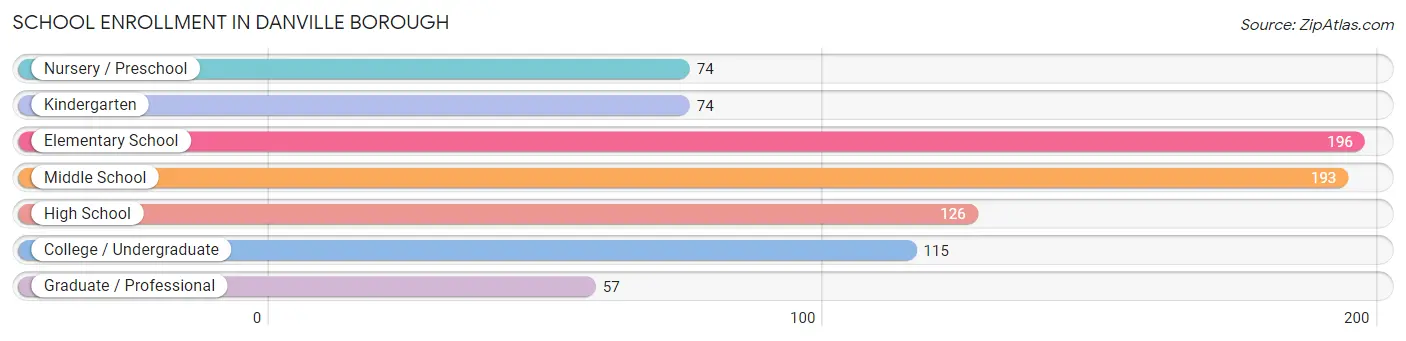
The most common levels of schooling among the 835 students in Danville borough are elementary school (196 | 23.5%), middle school (193 | 23.1%), and high school (126 | 15.1%).
| School Level | # Students | % Students |
| Nursery / Preschool | 74 | 8.9% |
| Kindergarten | 74 | 8.9% |
| Elementary School | 196 | 23.5% |
| Middle School | 193 | 23.1% |
| High School | 126 | 15.1% |
| College / Undergraduate | 115 | 13.8% |
| Graduate / Professional | 57 | 6.8% |
| Total | 835 | 100.0% |
School Enrollment by Age by Funding Source in Danville borough
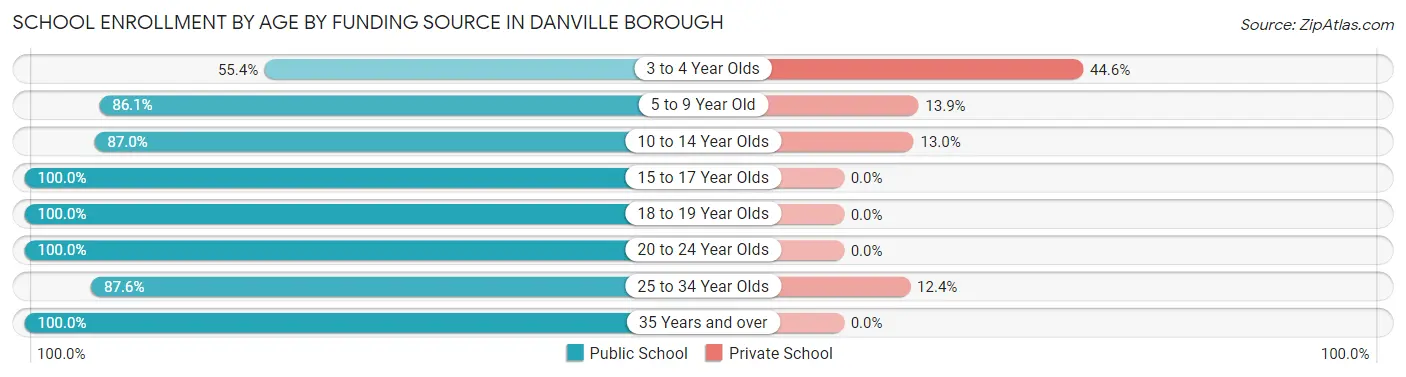
Out of a total of 835 students who are enrolled in schools in Danville borough, 108 (12.9%) attend a private institution, while the remaining 727 (87.1%) are enrolled in public schools. The age group of 3 to 4 year olds has the highest likelihood of being enrolled in private schools, with 33 (44.6% in the age bracket) enrolled. Conversely, the age group of 15 to 17 year olds has the lowest likelihood of being enrolled in a private school, with 106 (100.0% in the age bracket) attending a public institution.
| Age Bracket | Public School | Private School |
| 3 to 4 Year Olds | 41 (55.4%) | 33 (44.6%) |
| 5 to 9 Year Old | 167 (86.1%) | 27 (13.9%) |
| 10 to 14 Year Olds | 234 (87.0%) | 35 (13.0%) |
| 15 to 17 Year Olds | 106 (100.0%) | 0 (0.0%) |
| 18 to 19 Year Olds | 20 (100.0%) | 0 (0.0%) |
| 20 to 24 Year Olds | 33 (100.0%) | 0 (0.0%) |
| 25 to 34 Year Olds | 92 (87.6%) | 13 (12.4%) |
| 35 Years and over | 34 (100.0%) | 0 (0.0%) |
| Total | 727 (87.1%) | 108 (12.9%) |
Educational Attainment by Field of Study in Danville borough
Science & technology (273 | 16.8%), education (271 | 16.6%), bio, nature & agricultural (227 | 13.9%), visual & performing arts (113 | 6.9%), and psychology (103 | 6.3%) are the most common fields of study among 1,630 individuals in Danville borough who have obtained a bachelor's degree or higher.
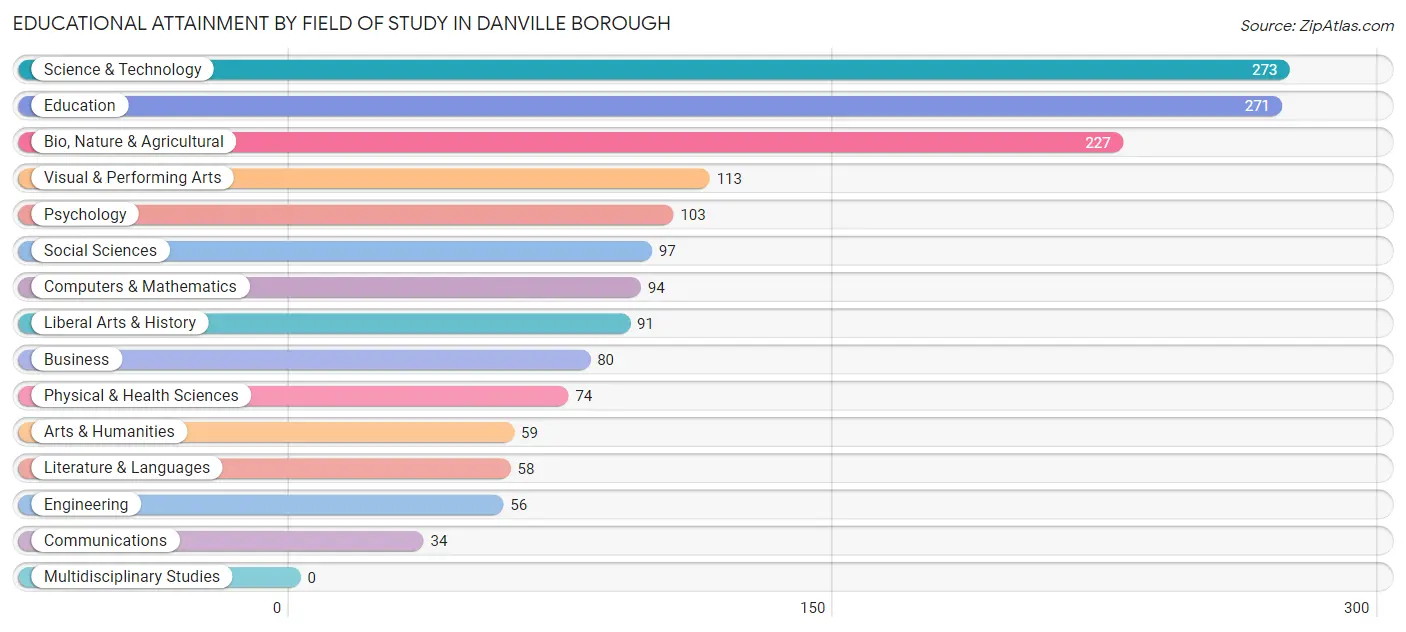
| Field of Study | # Graduates | % Graduates |
| Computers & Mathematics | 94 | 5.8% |
| Bio, Nature & Agricultural | 227 | 13.9% |
| Physical & Health Sciences | 74 | 4.5% |
| Psychology | 103 | 6.3% |
| Social Sciences | 97 | 5.9% |
| Engineering | 56 | 3.4% |
| Multidisciplinary Studies | 0 | 0.0% |
| Science & Technology | 273 | 16.8% |
| Business | 80 | 4.9% |
| Education | 271 | 16.6% |
| Literature & Languages | 58 | 3.6% |
| Liberal Arts & History | 91 | 5.6% |
| Visual & Performing Arts | 113 | 6.9% |
| Communications | 34 | 2.1% |
| Arts & Humanities | 59 | 3.6% |
| Total | 1,630 | 100.0% |
Transportation & Commute in Danville borough
Vehicle Availability by Sex in Danville borough
The most prevalent vehicle ownership categories in Danville borough are males with 2 vehicles (442, accounting for 46.7%) and females with 2 vehicles (453, making up 47.1%).
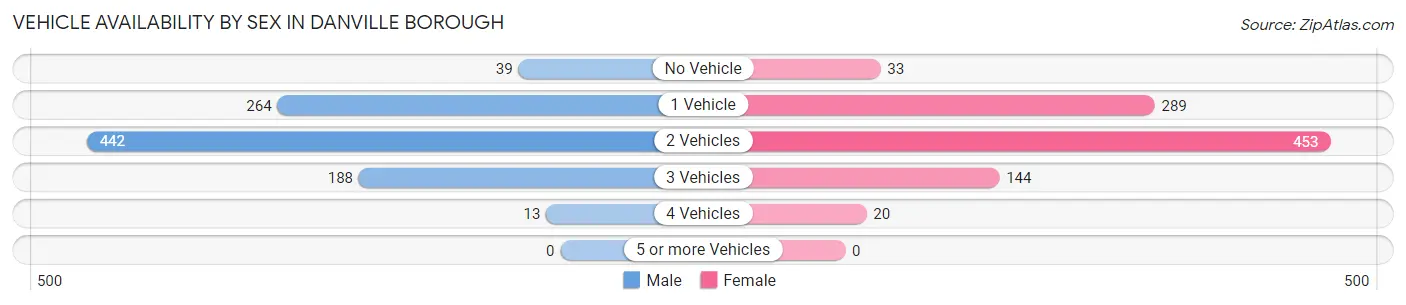
| Vehicles Available | Male | Female |
| No Vehicle | 39 (4.1%) | 33 (3.5%) |
| 1 Vehicle | 264 (27.9%) | 289 (30.8%) |
| 2 Vehicles | 442 (46.7%) | 453 (48.2%) |
| 3 Vehicles | 188 (19.9%) | 144 (15.3%) |
| 4 Vehicles | 13 (1.4%) | 20 (2.1%) |
| 5 or more Vehicles | 0 (0.0%) | 0 (0.0%) |
| Total | 946 (100.0%) | 939 (100.0%) |
Commute Time in Danville borough
The most frequently occuring commute durations in Danville borough are 5 to 9 minutes (778 commuters, 45.7%), 15 to 19 minutes (235 commuters, 13.8%), and 20 to 24 minutes (220 commuters, 12.9%).
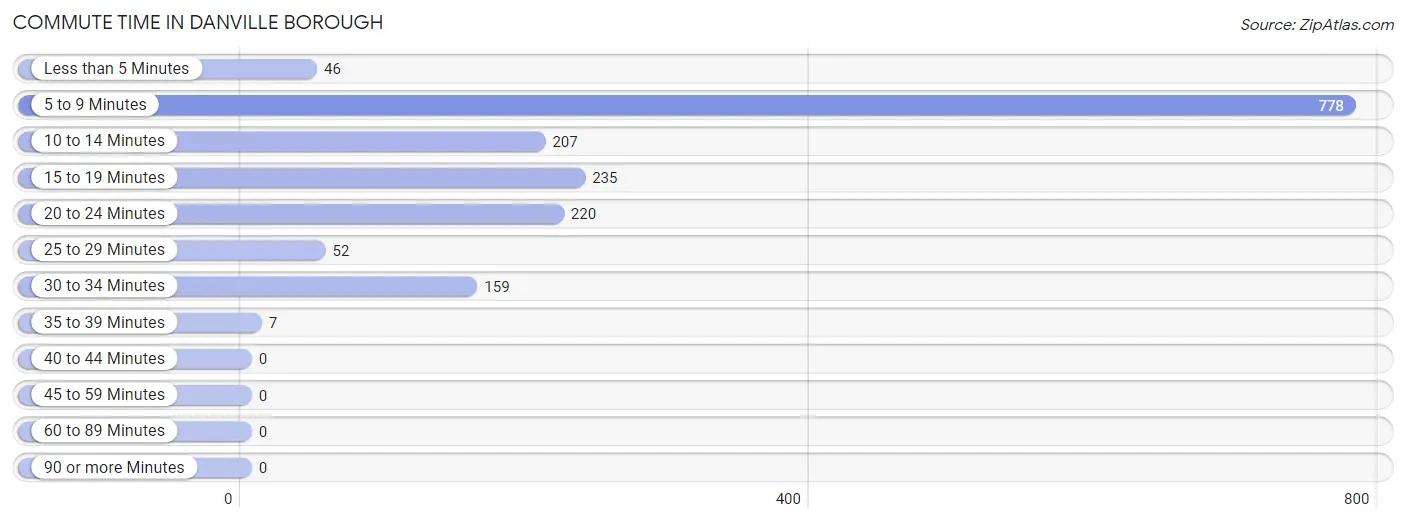
| Commute Time | # Commuters | % Commuters |
| Less than 5 Minutes | 46 | 2.7% |
| 5 to 9 Minutes | 778 | 45.7% |
| 10 to 14 Minutes | 207 | 12.1% |
| 15 to 19 Minutes | 235 | 13.8% |
| 20 to 24 Minutes | 220 | 12.9% |
| 25 to 29 Minutes | 52 | 3.0% |
| 30 to 34 Minutes | 159 | 9.3% |
| 35 to 39 Minutes | 7 | 0.4% |
| 40 to 44 Minutes | 0 | 0.0% |
| 45 to 59 Minutes | 0 | 0.0% |
| 60 to 89 Minutes | 0 | 0.0% |
| 90 or more Minutes | 0 | 0.0% |
Commute Time by Sex in Danville borough
The most common commute times in Danville borough are 5 to 9 minutes (471 commuters, 56.2%) for males and 5 to 9 minutes (307 commuters, 35.4%) for females.
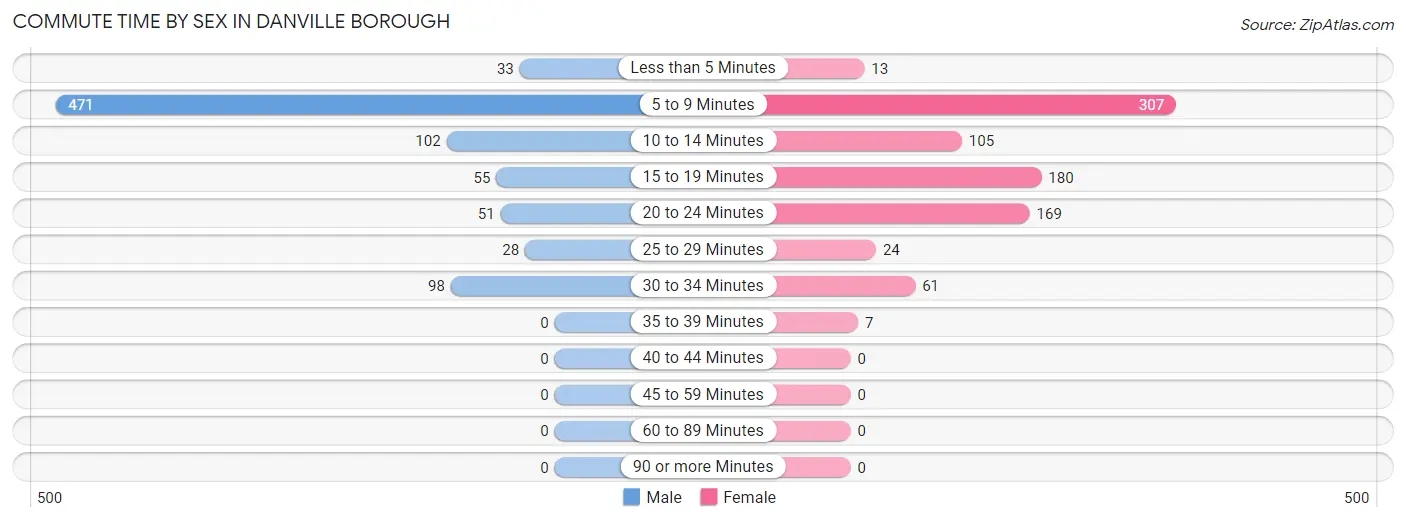
| Commute Time | Male | Female |
| Less than 5 Minutes | 33 (3.9%) | 13 (1.5%) |
| 5 to 9 Minutes | 471 (56.2%) | 307 (35.4%) |
| 10 to 14 Minutes | 102 (12.2%) | 105 (12.1%) |
| 15 to 19 Minutes | 55 (6.6%) | 180 (20.8%) |
| 20 to 24 Minutes | 51 (6.1%) | 169 (19.5%) |
| 25 to 29 Minutes | 28 (3.3%) | 24 (2.8%) |
| 30 to 34 Minutes | 98 (11.7%) | 61 (7.0%) |
| 35 to 39 Minutes | 0 (0.0%) | 7 (0.8%) |
| 40 to 44 Minutes | 0 (0.0%) | 0 (0.0%) |
| 45 to 59 Minutes | 0 (0.0%) | 0 (0.0%) |
| 60 to 89 Minutes | 0 (0.0%) | 0 (0.0%) |
| 90 or more Minutes | 0 (0.0%) | 0 (0.0%) |
Time of Departure to Work by Sex in Danville borough
The most frequent times of departure to work in Danville borough are 6:30 AM to 6:59 AM (204, 24.3%) for males and 7:00 AM to 7:29 AM (228, 26.3%) for females.
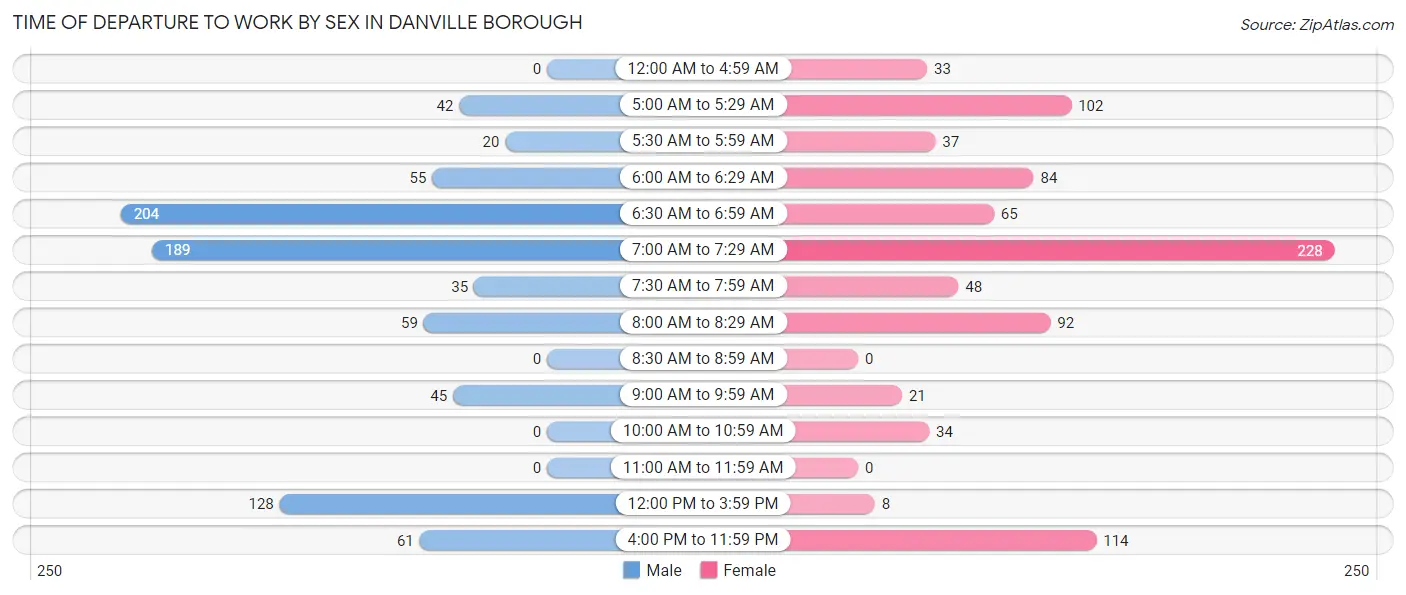
| Time of Departure | Male | Female |
| 12:00 AM to 4:59 AM | 0 (0.0%) | 33 (3.8%) |
| 5:00 AM to 5:29 AM | 42 (5.0%) | 102 (11.8%) |
| 5:30 AM to 5:59 AM | 20 (2.4%) | 37 (4.3%) |
| 6:00 AM to 6:29 AM | 55 (6.6%) | 84 (9.7%) |
| 6:30 AM to 6:59 AM | 204 (24.3%) | 65 (7.5%) |
| 7:00 AM to 7:29 AM | 189 (22.6%) | 228 (26.3%) |
| 7:30 AM to 7:59 AM | 35 (4.2%) | 48 (5.5%) |
| 8:00 AM to 8:29 AM | 59 (7.0%) | 92 (10.6%) |
| 8:30 AM to 8:59 AM | 0 (0.0%) | 0 (0.0%) |
| 9:00 AM to 9:59 AM | 45 (5.4%) | 21 (2.4%) |
| 10:00 AM to 10:59 AM | 0 (0.0%) | 34 (3.9%) |
| 11:00 AM to 11:59 AM | 0 (0.0%) | 0 (0.0%) |
| 12:00 PM to 3:59 PM | 128 (15.3%) | 8 (0.9%) |
| 4:00 PM to 11:59 PM | 61 (7.3%) | 114 (13.2%) |
| Total | 838 (100.0%) | 866 (100.0%) |
Housing Occupancy in Danville borough
Occupancy by Ownership in Danville borough
Of the total 2,016 dwellings in Danville borough, owner-occupied units account for 875 (43.4%), while renter-occupied units make up 1,141 (56.6%).
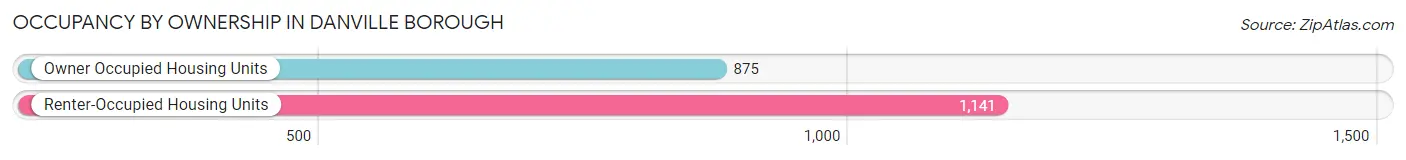
| Occupancy | # Housing Units | % Housing Units |
| Owner Occupied Housing Units | 875 | 43.4% |
| Renter-Occupied Housing Units | 1,141 | 56.6% |
| Total Occupied Housing Units | 2,016 | 100.0% |
Occupancy by Household Size in Danville borough
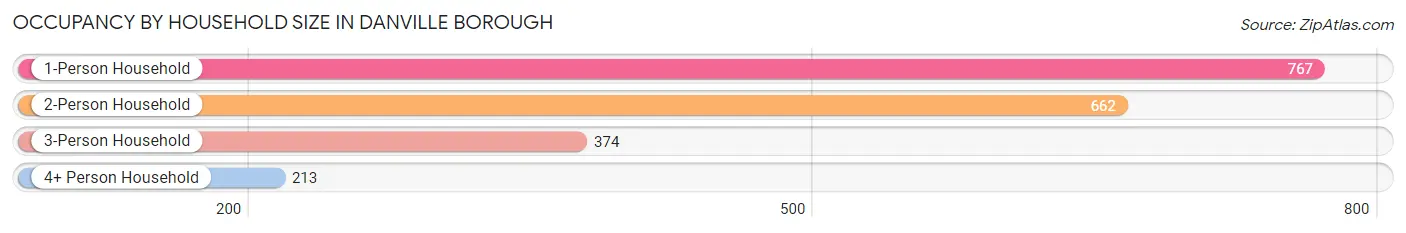
| Household Size | # Housing Units | % Housing Units |
| 1-Person Household | 767 | 38.1% |
| 2-Person Household | 662 | 32.8% |
| 3-Person Household | 374 | 18.5% |
| 4+ Person Household | 213 | 10.6% |
| Total Housing Units | 2,016 | 100.0% |
Occupancy by Ownership by Household Size in Danville borough
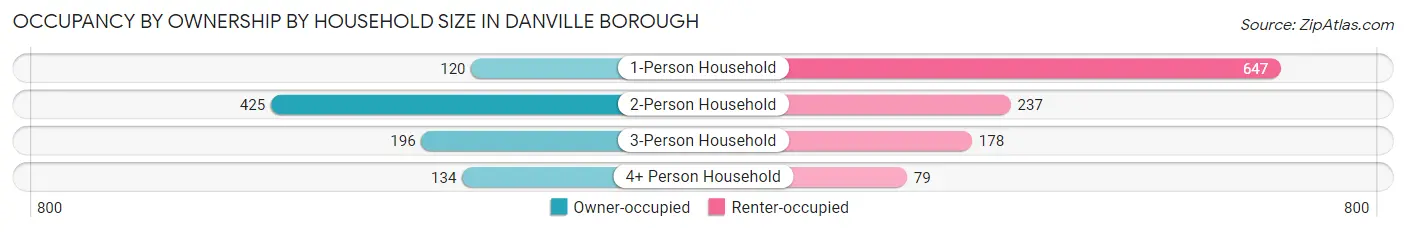
| Household Size | Owner-occupied | Renter-occupied |
| 1-Person Household | 120 (15.7%) | 647 (84.4%) |
| 2-Person Household | 425 (64.2%) | 237 (35.8%) |
| 3-Person Household | 196 (52.4%) | 178 (47.6%) |
| 4+ Person Household | 134 (62.9%) | 79 (37.1%) |
| Total Housing Units | 875 (43.4%) | 1,141 (56.6%) |
Occupancy by Educational Attainment in Danville borough
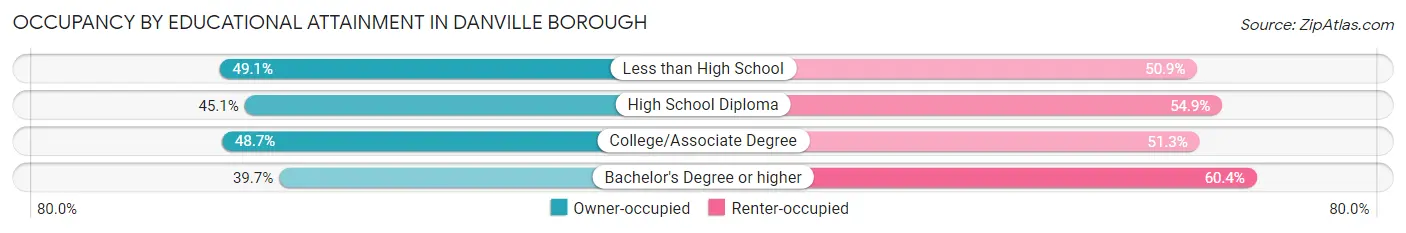
| Household Size | Owner-occupied | Renter-occupied |
| Less than High School | 78 (49.1%) | 81 (50.9%) |
| High School Diploma | 185 (45.1%) | 225 (54.9%) |
| College/Associate Degree | 206 (48.7%) | 217 (51.3%) |
| Bachelor's Degree or higher | 406 (39.7%) | 618 (60.4%) |
Occupancy by Age of Householder in Danville borough
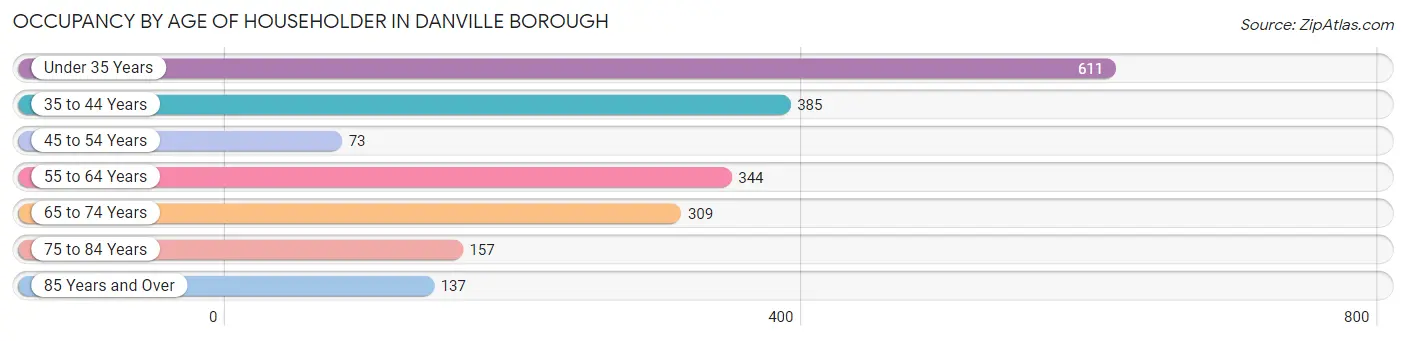
| Age Bracket | # Households | % Households |
| Under 35 Years | 611 | 30.3% |
| 35 to 44 Years | 385 | 19.1% |
| 45 to 54 Years | 73 | 3.6% |
| 55 to 64 Years | 344 | 17.1% |
| 65 to 74 Years | 309 | 15.3% |
| 75 to 84 Years | 157 | 7.8% |
| 85 Years and Over | 137 | 6.8% |
| Total | 2,016 | 100.0% |
Housing Finances in Danville borough
Median Income by Occupancy in Danville borough
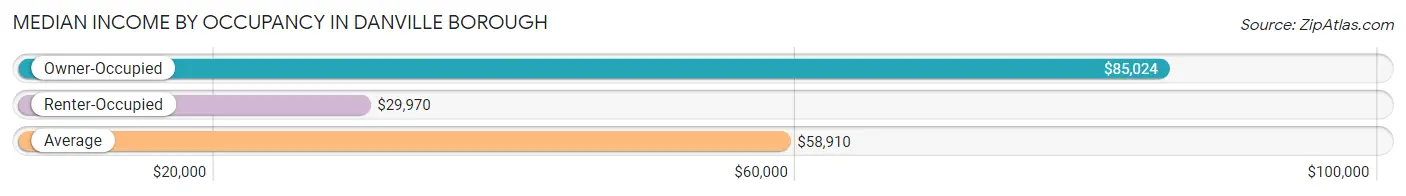
| Occupancy Type | # Households | Median Income |
| Owner-Occupied | 875 (43.4%) | $85,024 |
| Renter-Occupied | 1,141 (56.6%) | $29,970 |
| Average | 2,016 (100.0%) | $58,910 |
Occupancy by Householder Income Bracket in Danville borough
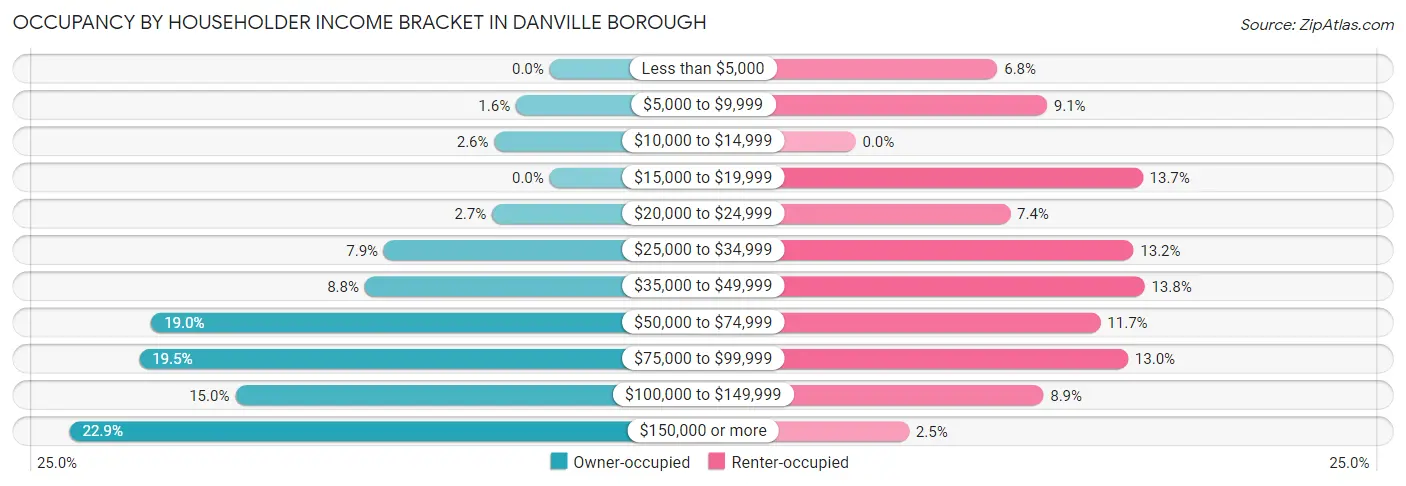
| Income Bracket | Owner-occupied | Renter-occupied |
| Less than $5,000 | 0 (0.0%) | 77 (6.8%) |
| $5,000 to $9,999 | 14 (1.6%) | 104 (9.1%) |
| $10,000 to $14,999 | 23 (2.6%) | 0 (0.0%) |
| $15,000 to $19,999 | 0 (0.0%) | 156 (13.7%) |
| $20,000 to $24,999 | 24 (2.7%) | 84 (7.4%) |
| $25,000 to $34,999 | 69 (7.9%) | 151 (13.2%) |
| $35,000 to $49,999 | 77 (8.8%) | 157 (13.8%) |
| $50,000 to $74,999 | 166 (19.0%) | 133 (11.7%) |
| $75,000 to $99,999 | 171 (19.5%) | 148 (13.0%) |
| $100,000 to $149,999 | 131 (15.0%) | 102 (8.9%) |
| $150,000 or more | 200 (22.9%) | 29 (2.5%) |
| Total | 875 (100.0%) | 1,141 (100.0%) |
Monthly Housing Cost Tiers in Danville borough
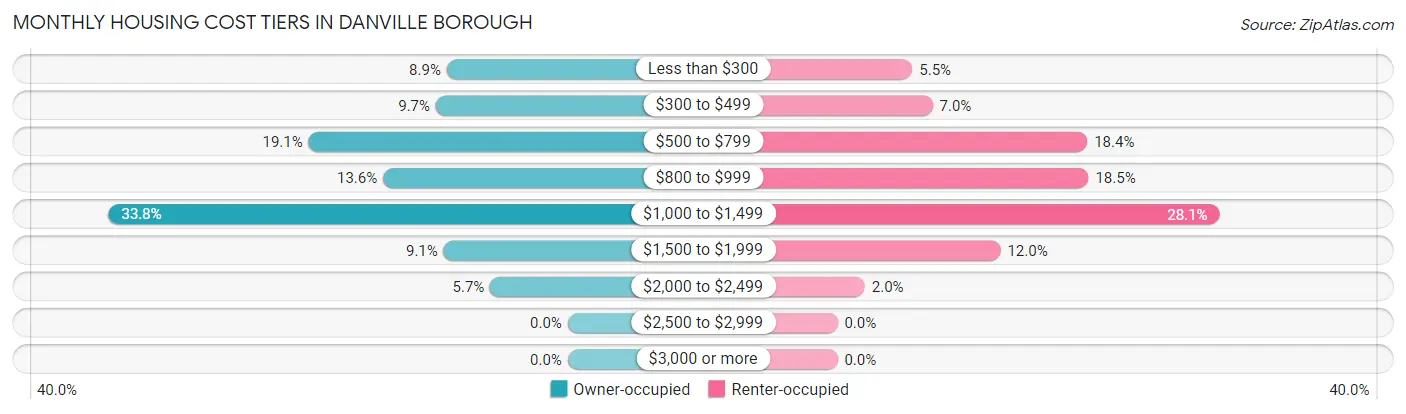
| Monthly Cost | Owner-occupied | Renter-occupied |
| Less than $300 | 78 (8.9%) | 63 (5.5%) |
| $300 to $499 | 85 (9.7%) | 80 (7.0%) |
| $500 to $799 | 167 (19.1%) | 210 (18.4%) |
| $800 to $999 | 119 (13.6%) | 211 (18.5%) |
| $1,000 to $1,499 | 296 (33.8%) | 321 (28.1%) |
| $1,500 to $1,999 | 80 (9.1%) | 137 (12.0%) |
| $2,000 to $2,499 | 50 (5.7%) | 23 (2.0%) |
| $2,500 to $2,999 | 0 (0.0%) | 0 (0.0%) |
| $3,000 or more | 0 (0.0%) | 0 (0.0%) |
| Total | 875 (100.0%) | 1,141 (100.0%) |
Physical Housing Characteristics in Danville borough
Housing Structures in Danville borough
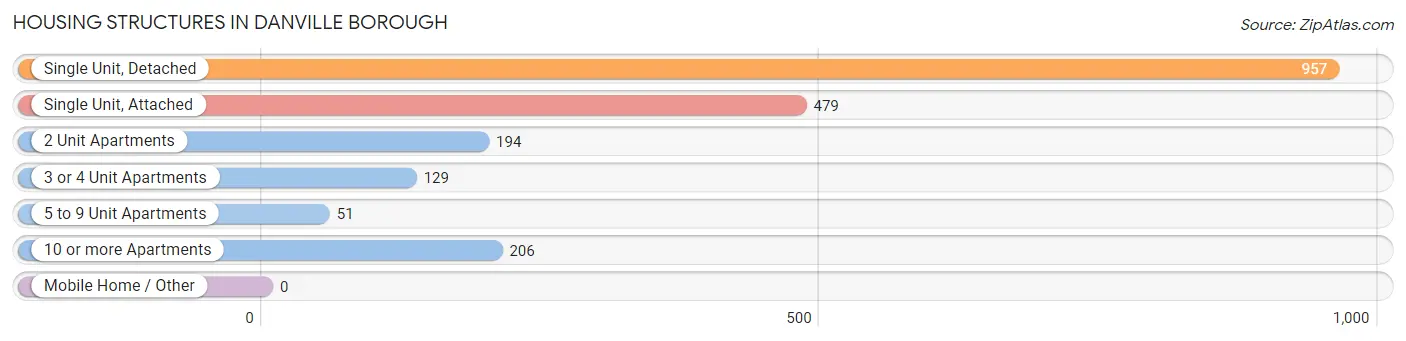
| Structure Type | # Housing Units | % Housing Units |
| Single Unit, Detached | 957 | 47.5% |
| Single Unit, Attached | 479 | 23.8% |
| 2 Unit Apartments | 194 | 9.6% |
| 3 or 4 Unit Apartments | 129 | 6.4% |
| 5 to 9 Unit Apartments | 51 | 2.5% |
| 10 or more Apartments | 206 | 10.2% |
| Mobile Home / Other | 0 | 0.0% |
| Total | 2,016 | 100.0% |
Housing Structures by Occupancy in Danville borough
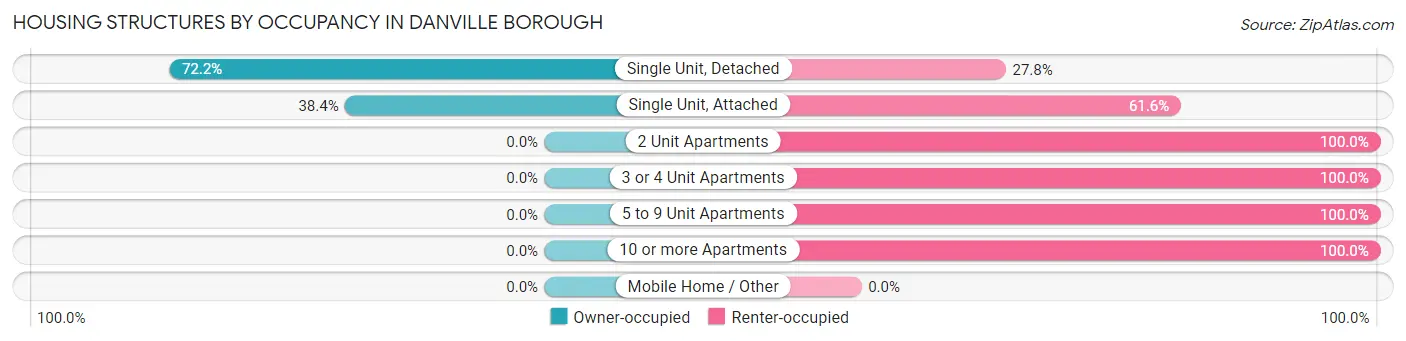
| Structure Type | Owner-occupied | Renter-occupied |
| Single Unit, Detached | 691 (72.2%) | 266 (27.8%) |
| Single Unit, Attached | 184 (38.4%) | 295 (61.6%) |
| 2 Unit Apartments | 0 (0.0%) | 194 (100.0%) |
| 3 or 4 Unit Apartments | 0 (0.0%) | 129 (100.0%) |
| 5 to 9 Unit Apartments | 0 (0.0%) | 51 (100.0%) |
| 10 or more Apartments | 0 (0.0%) | 206 (100.0%) |
| Mobile Home / Other | 0 (0.0%) | 0 (0.0%) |
| Total | 875 (43.4%) | 1,141 (56.6%) |
Housing Structures by Number of Rooms in Danville borough
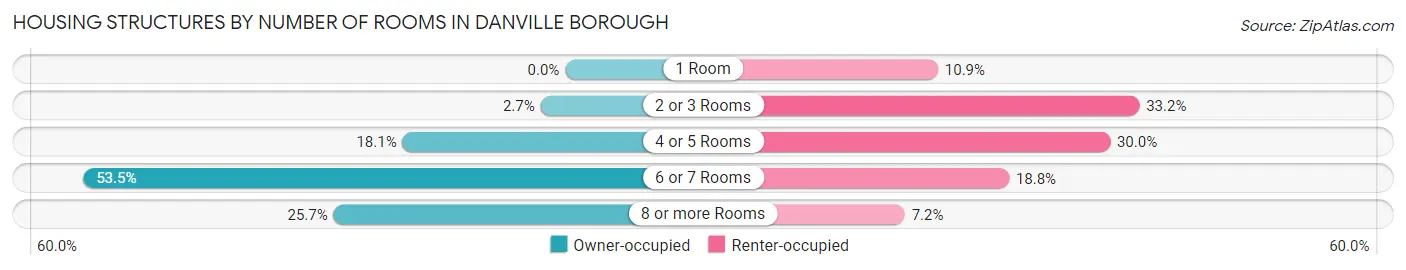
| Number of Rooms | Owner-occupied | Renter-occupied |
| 1 Room | 0 (0.0%) | 124 (10.9%) |
| 2 or 3 Rooms | 24 (2.7%) | 379 (33.2%) |
| 4 or 5 Rooms | 158 (18.1%) | 342 (30.0%) |
| 6 or 7 Rooms | 468 (53.5%) | 214 (18.8%) |
| 8 or more Rooms | 225 (25.7%) | 82 (7.2%) |
| Total | 875 (100.0%) | 1,141 (100.0%) |
Housing Structure by Heating Type in Danville borough
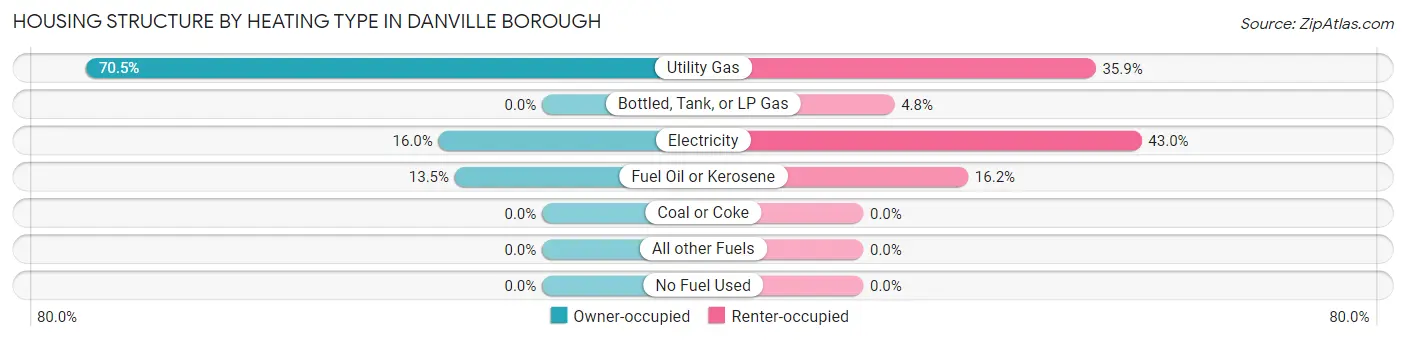
| Heating Type | Owner-occupied | Renter-occupied |
| Utility Gas | 617 (70.5%) | 410 (35.9%) |
| Bottled, Tank, or LP Gas | 0 (0.0%) | 55 (4.8%) |
| Electricity | 140 (16.0%) | 491 (43.0%) |
| Fuel Oil or Kerosene | 118 (13.5%) | 185 (16.2%) |
| Coal or Coke | 0 (0.0%) | 0 (0.0%) |
| All other Fuels | 0 (0.0%) | 0 (0.0%) |
| No Fuel Used | 0 (0.0%) | 0 (0.0%) |
| Total | 875 (100.0%) | 1,141 (100.0%) |
Household Vehicle Usage in Danville borough
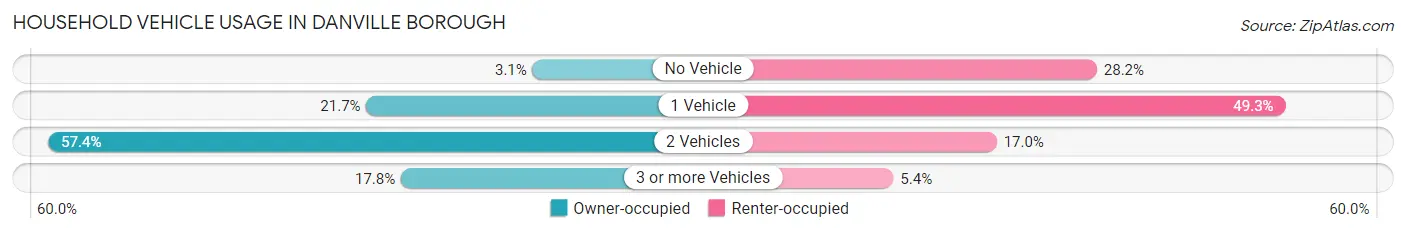
| Vehicles per Household | Owner-occupied | Renter-occupied |
| No Vehicle | 27 (3.1%) | 322 (28.2%) |
| 1 Vehicle | 190 (21.7%) | 563 (49.3%) |
| 2 Vehicles | 502 (57.4%) | 194 (17.0%) |
| 3 or more Vehicles | 156 (17.8%) | 62 (5.4%) |
| Total | 875 (100.0%) | 1,141 (100.0%) |
Real Estate & Mortgages in Danville borough
Real Estate and Mortgage Overview in Danville borough
| Characteristic | Without Mortgage | With Mortgage |
| Housing Units | 354 | 521 |
| Median Property Value | $159,700 | $177,900 |
| Median Household Income | $60,787 | $135 |
| Monthly Housing Costs | $533 | $0 |
| Real Estate Taxes | $1,886 | $0 |
Property Value by Mortgage Status in Danville borough
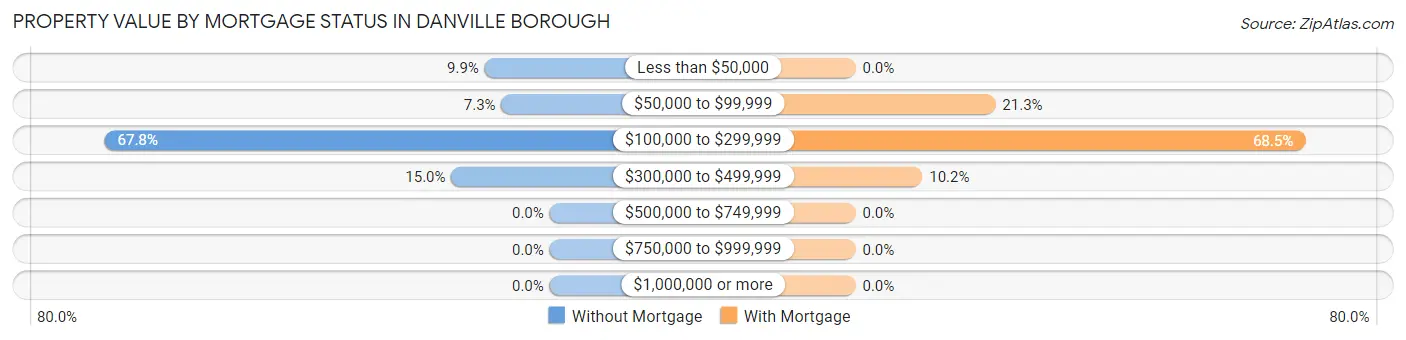
| Property Value | Without Mortgage | With Mortgage |
| Less than $50,000 | 35 (9.9%) | 0 (0.0%) |
| $50,000 to $99,999 | 26 (7.3%) | 111 (21.3%) |
| $100,000 to $299,999 | 240 (67.8%) | 357 (68.5%) |
| $300,000 to $499,999 | 53 (15.0%) | 53 (10.2%) |
| $500,000 to $749,999 | 0 (0.0%) | 0 (0.0%) |
| $750,000 to $999,999 | 0 (0.0%) | 0 (0.0%) |
| $1,000,000 or more | 0 (0.0%) | 0 (0.0%) |
| Total | 354 (100.0%) | 521 (100.0%) |
Household Income by Mortgage Status in Danville borough
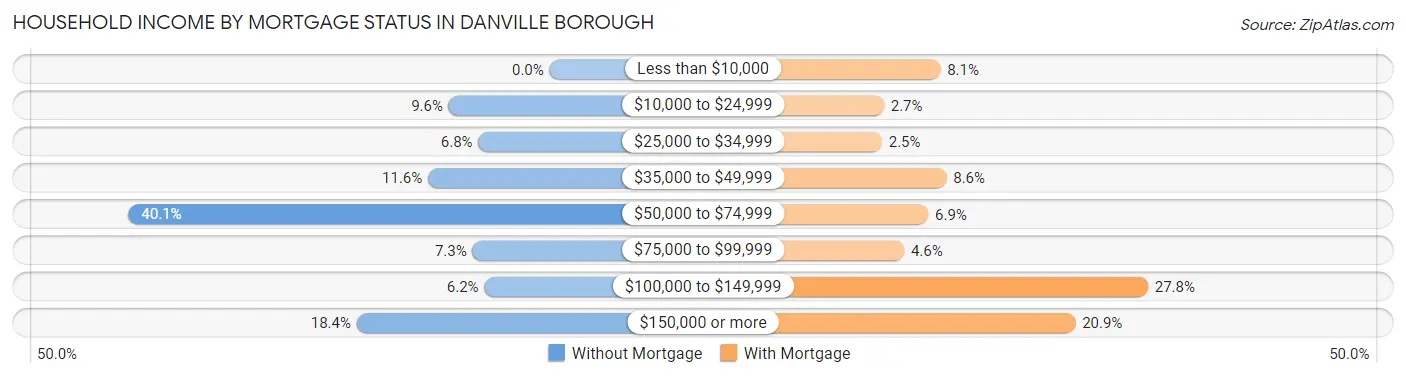
| Household Income | Without Mortgage | With Mortgage |
| Less than $10,000 | 0 (0.0%) | 42 (8.1%) |
| $10,000 to $24,999 | 34 (9.6%) | 14 (2.7%) |
| $25,000 to $34,999 | 24 (6.8%) | 13 (2.5%) |
| $35,000 to $49,999 | 41 (11.6%) | 45 (8.6%) |
| $50,000 to $74,999 | 142 (40.1%) | 36 (6.9%) |
| $75,000 to $99,999 | 26 (7.3%) | 24 (4.6%) |
| $100,000 to $149,999 | 22 (6.2%) | 145 (27.8%) |
| $150,000 or more | 65 (18.4%) | 109 (20.9%) |
| Total | 354 (100.0%) | 521 (100.0%) |
Property Value to Household Income Ratio in Danville borough
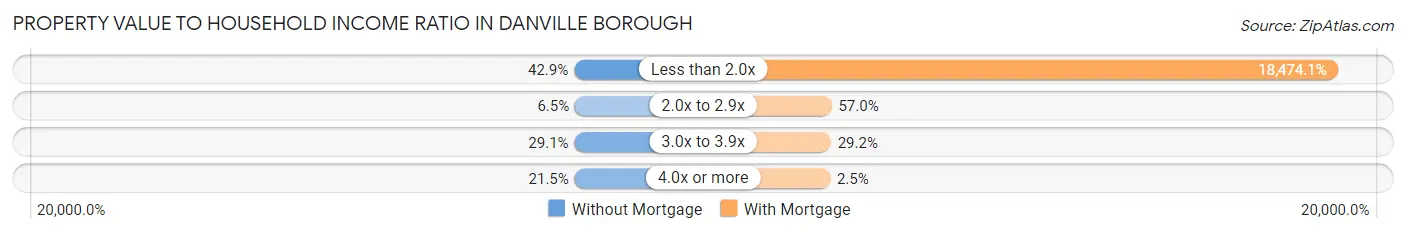
| Value-to-Income Ratio | Without Mortgage | With Mortgage |
| Less than 2.0x | 152 (42.9%) | 96,250 (18,474.1%) |
| 2.0x to 2.9x | 23 (6.5%) | 297 (57.0%) |
| 3.0x to 3.9x | 103 (29.1%) | 152 (29.2%) |
| 4.0x or more | 76 (21.5%) | 13 (2.5%) |
| Total | 354 (100.0%) | 521 (100.0%) |
Real Estate Taxes by Mortgage Status in Danville borough
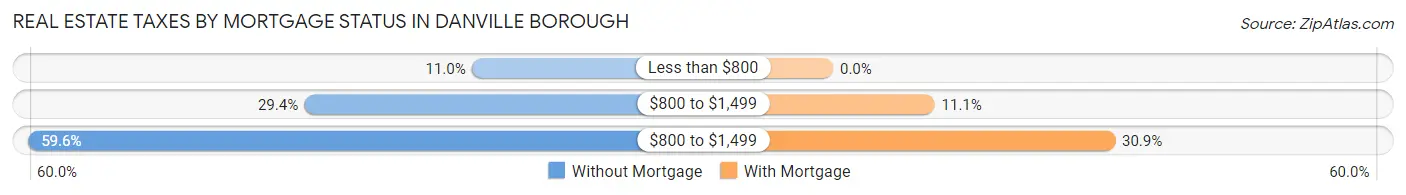
| Property Taxes | Without Mortgage | With Mortgage |
| Less than $800 | 39 (11.0%) | 0 (0.0%) |
| $800 to $1,499 | 104 (29.4%) | 58 (11.1%) |
| $800 to $1,499 | 211 (59.6%) | 161 (30.9%) |
| Total | 354 (100.0%) | 521 (100.0%) |
Health & Disability in Danville borough
Health Insurance Coverage by Age in Danville borough
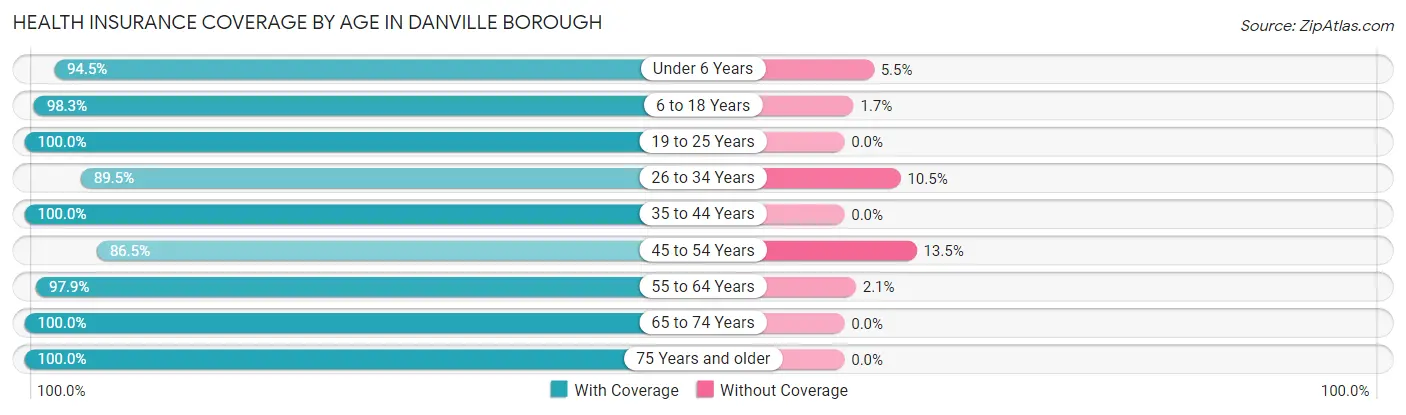
| Age Bracket | With Coverage | Without Coverage |
| Under 6 Years | 362 (94.5%) | 21 (5.5%) |
| 6 to 18 Years | 572 (98.3%) | 10 (1.7%) |
| 19 to 25 Years | 217 (100.0%) | 0 (0.0%) |
| 26 to 34 Years | 803 (89.5%) | 94 (10.5%) |
| 35 to 44 Years | 501 (100.0%) | 0 (0.0%) |
| 45 to 54 Years | 180 (86.5%) | 28 (13.5%) |
| 55 to 64 Years | 549 (97.9%) | 12 (2.1%) |
| 65 to 74 Years | 528 (100.0%) | 0 (0.0%) |
| 75 Years and older | 341 (100.0%) | 0 (0.0%) |
| Total | 4,053 (96.1%) | 165 (3.9%) |
Health Insurance Coverage by Citizenship Status in Danville borough
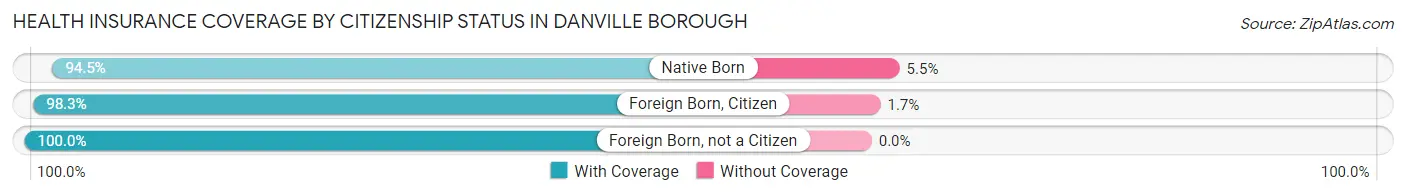
| Citizenship Status | With Coverage | Without Coverage |
| Native Born | 362 (94.5%) | 21 (5.5%) |
| Foreign Born, Citizen | 572 (98.3%) | 10 (1.7%) |
| Foreign Born, not a Citizen | 217 (100.0%) | 0 (0.0%) |
Health Insurance Coverage by Household Income in Danville borough
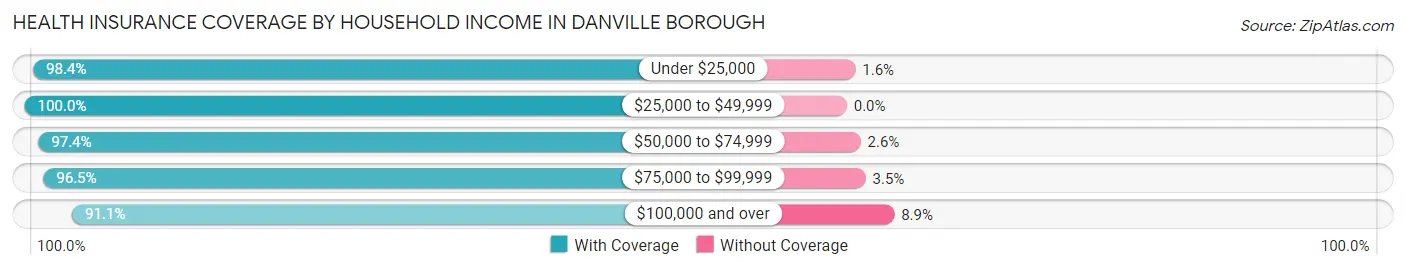
| Household Income | With Coverage | Without Coverage |
| Under $25,000 | 736 (98.4%) | 12 (1.6%) |
| $25,000 to $49,999 | 703 (100.0%) | 0 (0.0%) |
| $50,000 to $74,999 | 601 (97.4%) | 16 (2.6%) |
| $75,000 to $99,999 | 850 (96.5%) | 31 (3.5%) |
| $100,000 and over | 1,087 (91.1%) | 106 (8.9%) |
Public vs Private Health Insurance Coverage by Age in Danville borough
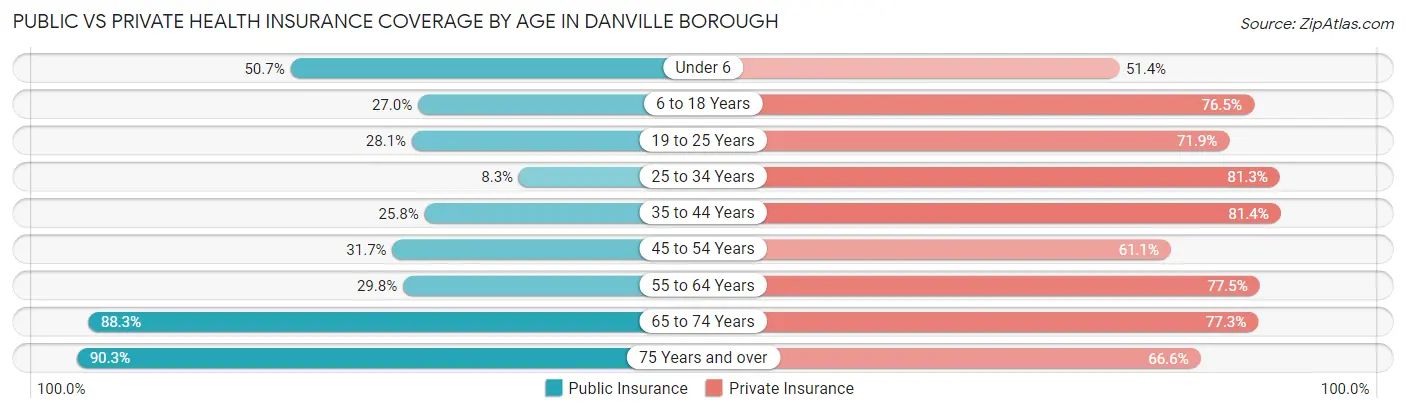
| Age Bracket | Public Insurance | Private Insurance |
| Under 6 | 194 (50.6%) | 197 (51.4%) |
| 6 to 18 Years | 157 (27.0%) | 445 (76.5%) |
| 19 to 25 Years | 61 (28.1%) | 156 (71.9%) |
| 25 to 34 Years | 74 (8.3%) | 729 (81.3%) |
| 35 to 44 Years | 129 (25.8%) | 408 (81.4%) |
| 45 to 54 Years | 66 (31.7%) | 127 (61.1%) |
| 55 to 64 Years | 167 (29.8%) | 435 (77.5%) |
| 65 to 74 Years | 466 (88.3%) | 408 (77.3%) |
| 75 Years and over | 308 (90.3%) | 227 (66.6%) |
| Total | 1,622 (38.5%) | 3,132 (74.3%) |
Disability Status by Sex by Age in Danville borough
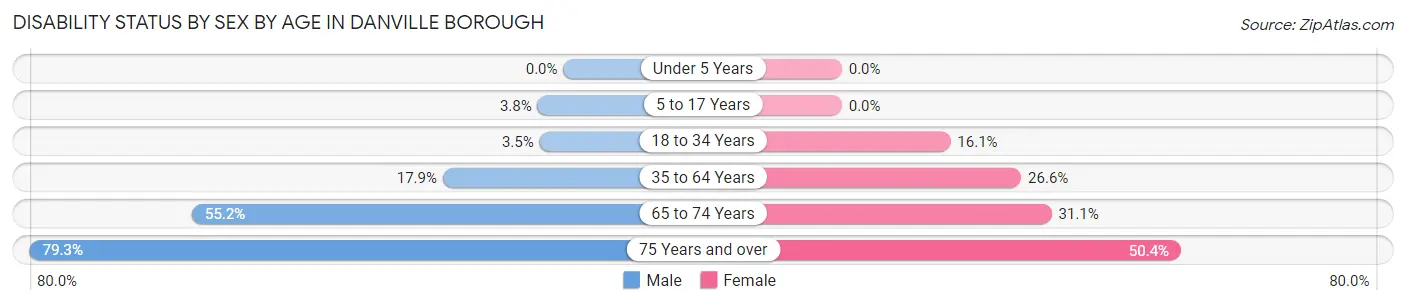
| Age Bracket | Male | Female |
| Under 5 Years | 0 (0.0%) | 0 (0.0%) |
| 5 to 17 Years | 10 (3.8%) | 0 (0.0%) |
| 18 to 34 Years | 18 (3.5%) | 101 (16.1%) |
| 35 to 64 Years | 109 (17.9%) | 176 (26.6%) |
| 65 to 74 Years | 107 (55.1%) | 104 (31.1%) |
| 75 Years and over | 42 (79.2%) | 145 (50.3%) |
Disability Class by Sex by Age in Danville borough
Disability Class: Hearing Difficulty
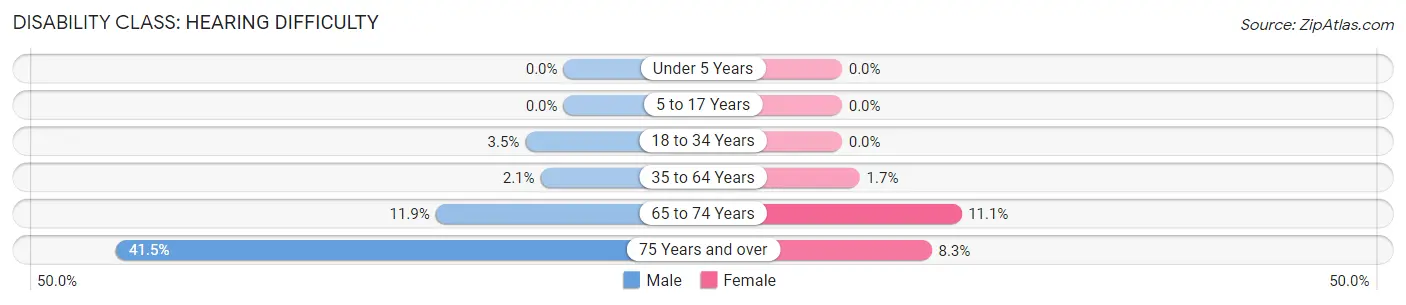
| Age Bracket | Male | Female |
| Under 5 Years | 0 (0.0%) | 0 (0.0%) |
| 5 to 17 Years | 0 (0.0%) | 0 (0.0%) |
| 18 to 34 Years | 18 (3.5%) | 0 (0.0%) |
| 35 to 64 Years | 13 (2.1%) | 11 (1.7%) |
| 65 to 74 Years | 23 (11.9%) | 37 (11.1%) |
| 75 Years and over | 22 (41.5%) | 24 (8.3%) |
Disability Class: Vision Difficulty
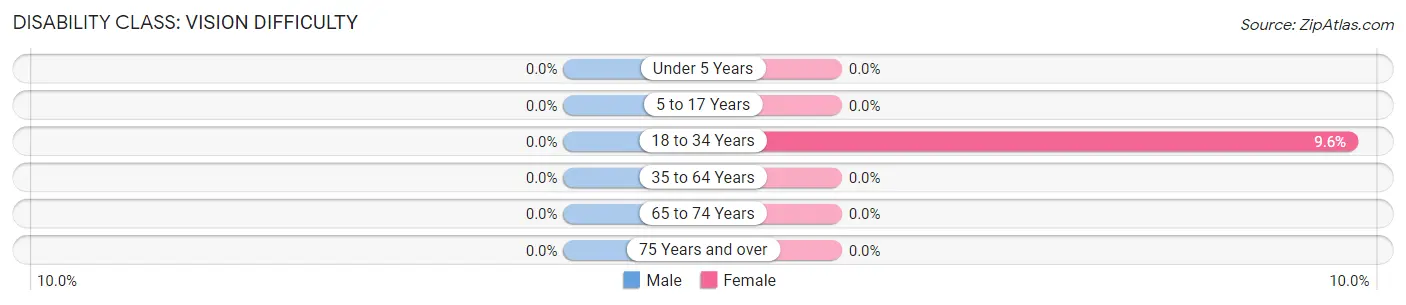
| Age Bracket | Male | Female |
| Under 5 Years | 0 (0.0%) | 0 (0.0%) |
| 5 to 17 Years | 0 (0.0%) | 0 (0.0%) |
| 18 to 34 Years | 0 (0.0%) | 60 (9.6%) |
| 35 to 64 Years | 0 (0.0%) | 0 (0.0%) |
| 65 to 74 Years | 0 (0.0%) | 0 (0.0%) |
| 75 Years and over | 0 (0.0%) | 0 (0.0%) |
Disability Class: Cognitive Difficulty
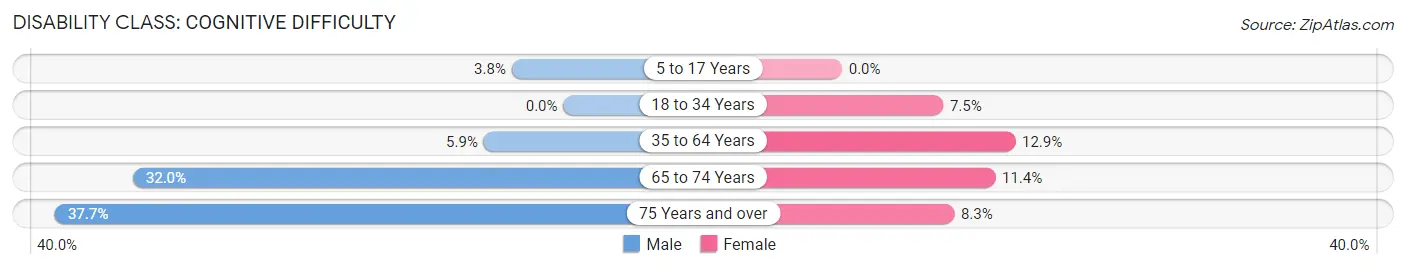
| Age Bracket | Male | Female |
| 5 to 17 Years | 10 (3.8%) | 0 (0.0%) |
| 18 to 34 Years | 0 (0.0%) | 47 (7.5%) |
| 35 to 64 Years | 36 (5.9%) | 85 (12.9%) |
| 65 to 74 Years | 62 (32.0%) | 38 (11.4%) |
| 75 Years and over | 20 (37.7%) | 24 (8.3%) |
Disability Class: Ambulatory Difficulty
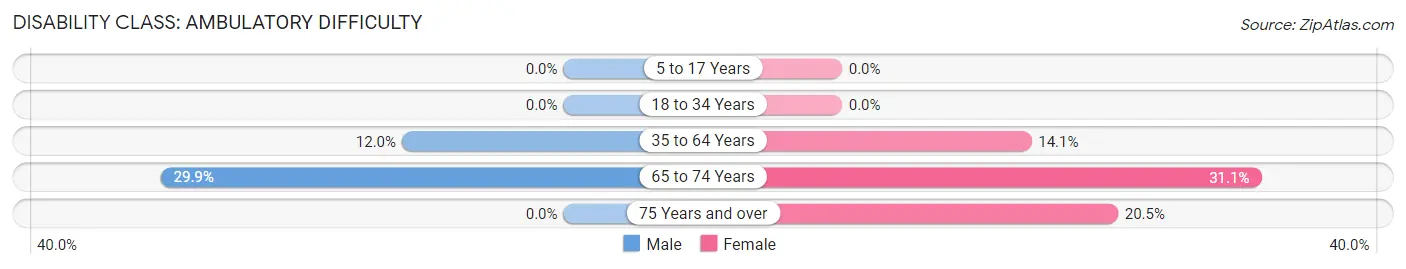
| Age Bracket | Male | Female |
| 5 to 17 Years | 0 (0.0%) | 0 (0.0%) |
| 18 to 34 Years | 0 (0.0%) | 0 (0.0%) |
| 35 to 64 Years | 73 (12.0%) | 93 (14.1%) |
| 65 to 74 Years | 58 (29.9%) | 104 (31.1%) |
| 75 Years and over | 0 (0.0%) | 59 (20.5%) |
Disability Class: Self-Care Difficulty
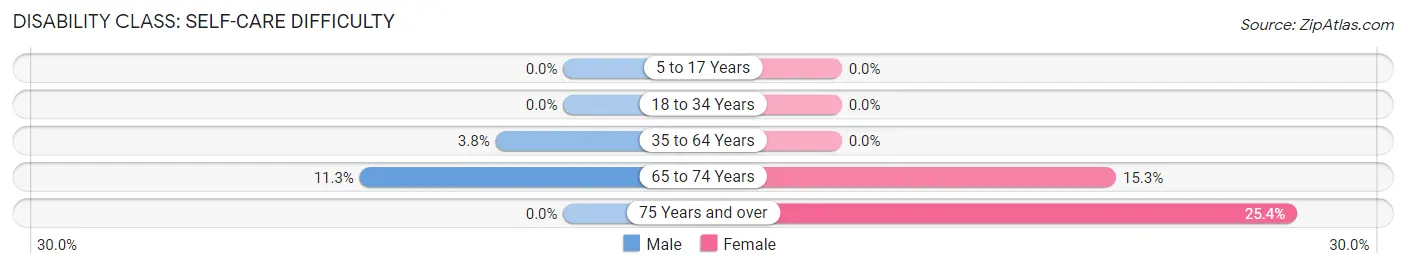
| Age Bracket | Male | Female |
| 5 to 17 Years | 0 (0.0%) | 0 (0.0%) |
| 18 to 34 Years | 0 (0.0%) | 0 (0.0%) |
| 35 to 64 Years | 23 (3.8%) | 0 (0.0%) |
| 65 to 74 Years | 22 (11.3%) | 51 (15.3%) |
| 75 Years and over | 0 (0.0%) | 73 (25.4%) |
Technology Access in Danville borough
Computing Device Access in Danville borough
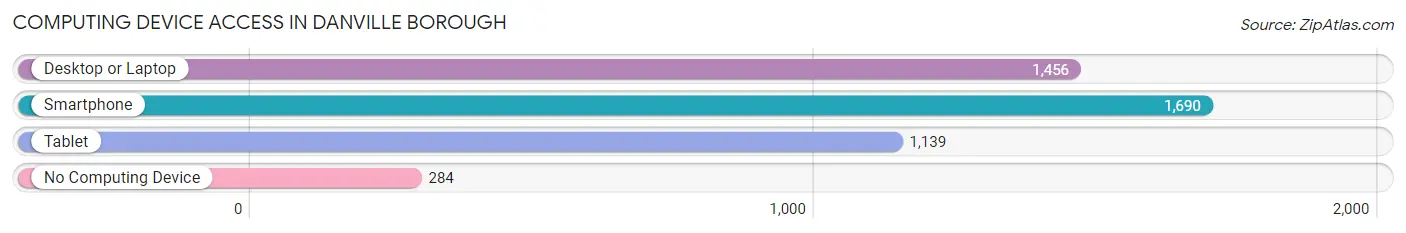
| Device Type | # Households | % Households |
| Desktop or Laptop | 1,456 | 72.2% |
| Smartphone | 1,690 | 83.8% |
| Tablet | 1,139 | 56.5% |
| No Computing Device | 284 | 14.1% |
| Total | 2,016 | 100.0% |
Internet Access in Danville borough
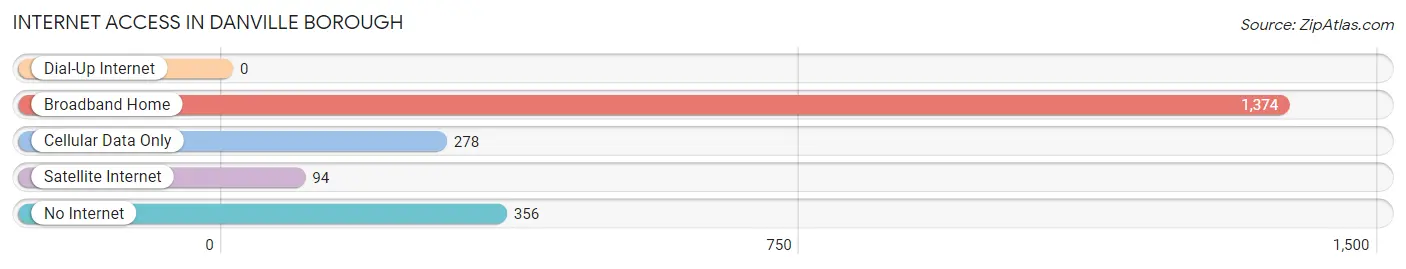
| Internet Type | # Households | % Households |
| Dial-Up Internet | 0 | 0.0% |
| Broadband Home | 1,374 | 68.1% |
| Cellular Data Only | 278 | 13.8% |
| Satellite Internet | 94 | 4.7% |
| No Internet | 356 | 17.7% |
| Total | 2,016 | 100.0% |
Danville borough Summary
Danville Borough is a small borough located in Montour County, Pennsylvania. It is situated along the Susquehanna River, approximately 10 miles northwest of the county seat of Bloomsburg. The borough is home to a population of approximately 4,500 people, and is the largest municipality in the county.
History
The area that is now Danville Borough was first settled in 1792 by a group of settlers from Connecticut. The settlers named the area “Milltown” due to the presence of a gristmill and sawmill in the area. In 1813, the name of the town was changed to Danville, in honor of Daniel Montgomery, a local landowner.
In 1814, the first post office was established in Danville, and the town was officially incorporated as a borough in 1827. During the 19th century, Danville was a major center for the production of iron and steel, and the town was home to several large iron and steel mills.
In the late 19th century, the town was also home to several large tanneries, which produced leather goods for the local market. The tanneries were eventually closed in the early 20th century, and the town’s economy shifted to focus on the production of textiles.
Geography
Danville Borough is located in the southeastern corner of Montour County, approximately 10 miles northwest of the county seat of Bloomsburg. The borough is situated along the Susquehanna River, and is bordered by the townships of Liberty, Mahoning, and Valley.
The borough has a total area of 1.3 square miles, all of which is land. The terrain of the borough is mostly flat, with some rolling hills in the northern part of the borough. The borough is located in the Appalachian Mountains, and is part of the Ridge and Valley physiographic province.
Economy
The economy of Danville Borough is largely based on manufacturing and services. The borough is home to several large manufacturing companies, including a paper mill, a plastics factory, and a metal fabrication plant. The borough is also home to several small businesses, including restaurants, retail stores, and professional services.
The borough is also home to several educational institutions, including a community college and a technical school. The borough is also home to a hospital, which provides medical services to the local community.
Demographics
As of the 2010 census, the population of Danville Borough was 4,541. The racial makeup of the borough was 95.3% White, 1.2% African American, 0.3% Native American, 0.7% Asian, 0.1% Pacific Islander, 0.7% from other races, and 1.7% from two or more races. Hispanic or Latino of any race were 2.2% of the population.
The median household income in Danville Borough was $41,944, and the median family income was $50,917. The per capita income for the borough was $20,945. About 11.2% of families and 14.2% of the population were below the poverty line, including 19.2% of those under age 18 and 8.2% of those age 65 or over.
Common Questions
What is Per Capita Income in Danville borough?
Per Capita income in Danville borough is $34,962.
What is the Median Family Income in Danville borough?
Median Family Income in Danville borough is $73,634.
What is the Median Household income in Danville borough?
Median Household Income in Danville borough is $58,910.
What is Income or Wage Gap in Danville borough?
Income or Wage Gap in Danville borough is 43.6%.
Women in Danville borough earn 56.4 cents for every dollar earned by a man.
What is Inequality or Gini Index in Danville borough?
Inequality or Gini Index in Danville borough is 0.48.
What is the Total Population of Danville borough?
Total Population of Danville borough is 4,265.
What is the Total Male Population of Danville borough?
Total Male Population of Danville borough is 1,821.
What is the Total Female Population of Danville borough?
Total Female Population of Danville borough is 2,444.
What is the Ratio of Males per 100 Females in Danville borough?
There are 74.51 Males per 100 Females in Danville borough.
What is the Ratio of Females per 100 Males in Danville borough?
There are 134.21 Females per 100 Males in Danville borough.
What is the Median Population Age in Danville borough?
Median Population Age in Danville borough is 36.1 Years.
What is the Average Family Size in Danville borough
Average Family Size in Danville borough is 2.6 People.
What is the Average Household Size in Danville borough
Average Household Size in Danville borough is 2.0 People.
How Large is the Labor Force in Danville borough?
There are 1,969 People in the Labor Forcein in Danville borough.
What is the Percentage of People in the Labor Force in Danville borough?
57.6% of People are in the Labor Force in Danville borough.
What is the Unemployment Rate in Danville borough?
Unemployment Rate in Danville borough is 2.4%.