Blossburg borough, PA Map & Demographics
Blossburg borough Overview
$29,659
PER CAPITA INCOME
$81,042
AVG FAMILY INCOME
$64,901
AVG HOUSEHOLD INCOME
37.2%
WAGE / INCOME GAP [ % ]
62.8¢/ $1
WAGE / INCOME GAP [ $ ]
0.40
INEQUALITY / GINI INDEX
1,835
TOTAL POPULATION
934
MALE POPULATION
901
FEMALE POPULATION
103.66
MALES / 100 FEMALES
96.47
FEMALES / 100 MALES
38.3
MEDIAN AGE
3.3
AVG FAMILY SIZE
2.8
AVG HOUSEHOLD SIZE
970
LABOR FORCE [ PEOPLE ]
64.7%
PERCENT IN LABOR FORCE
4.5%
UNEMPLOYMENT RATE
Income in Blossburg borough
Income Overview in Blossburg borough
Per Capita Income in Blossburg borough is $29,659, while median incomes of families and households are $81,042 and $64,901 respectively.
| Characteristic | Number | Measure |
| Per Capita Income | 1,835 | $29,659 |
| Median Family Income | 491 | $81,042 |
| Mean Family Income | 491 | $95,134 |
| Median Household Income | 649 | $64,901 |
| Mean Household Income | 649 | $81,914 |
| Income Deficit | 491 | $0 |
| Wage / Income Gap (%) | 1,835 | 37.18% |
| Wage / Income Gap ($) | 1,835 | 62.82¢ per $1 |
| Gini / Inequality Index | 1,835 | 0.40 |
Earnings by Sex in Blossburg borough
Average Earnings in Blossburg borough are $42,780, $47,422 for men and $29,792 for women, a difference of 37.2%.
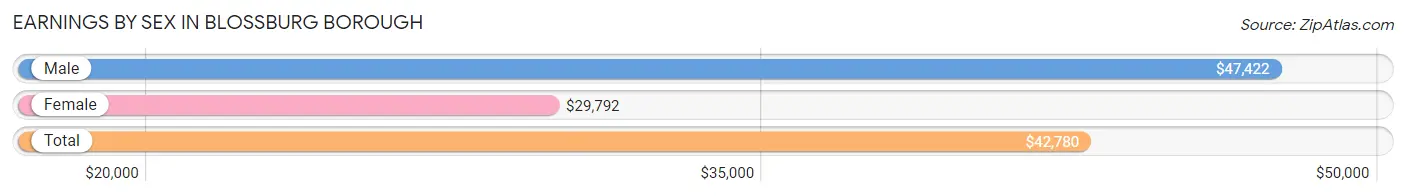
| Sex | Number | Average Earnings |
| Male | 542 (56.2%) | $47,422 |
| Female | 423 (43.8%) | $29,792 |
| Total | 965 (100.0%) | $42,780 |
Earnings by Sex by Income Bracket in Blossburg borough
The most common earnings brackets in Blossburg borough are $75,000 to $99,999 for men (123 | 22.7%) and $10,000 to $12,499 for women (56 | 13.2%).
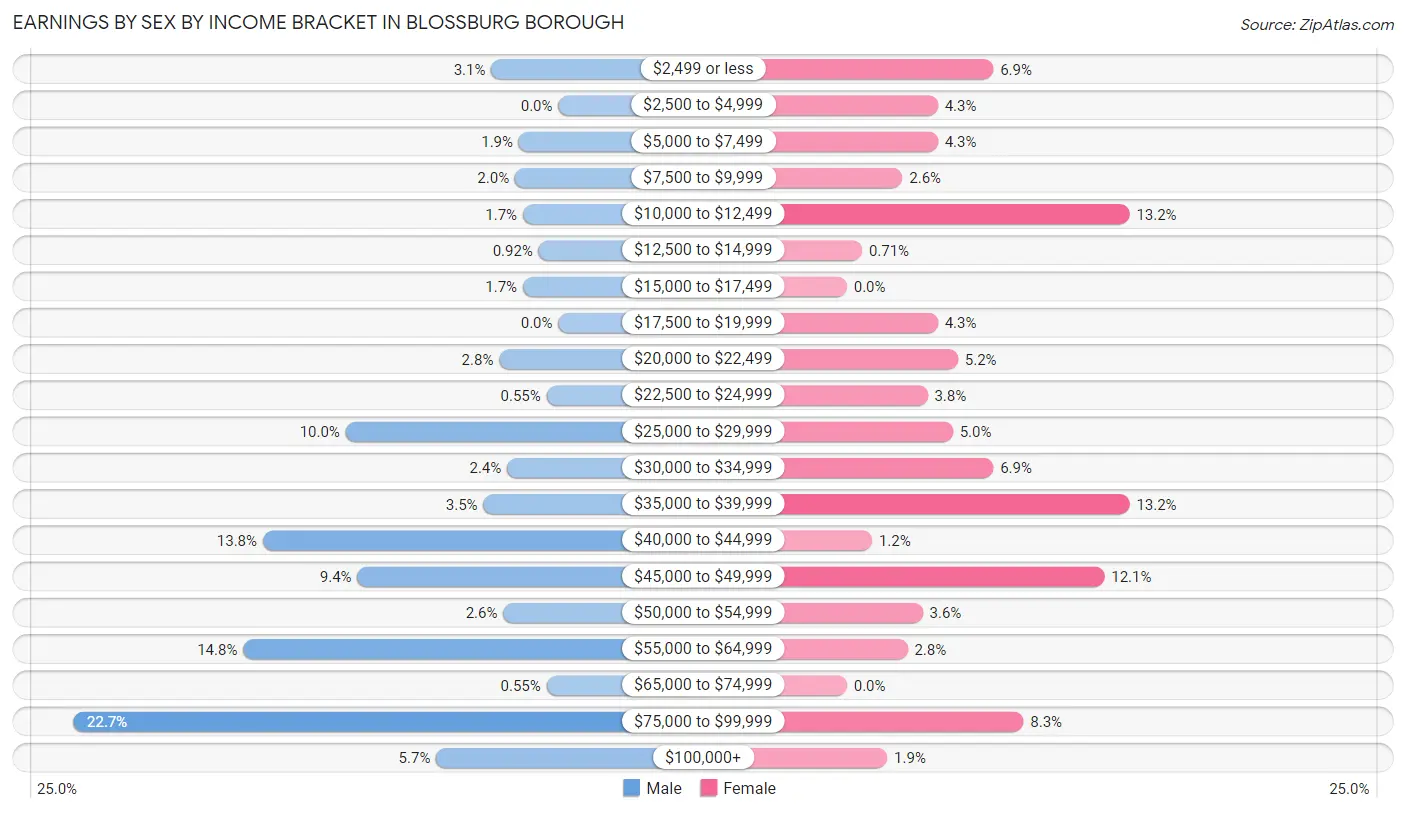
| Income | Male | Female |
| $2,499 or less | 17 (3.1%) | 29 (6.9%) |
| $2,500 to $4,999 | 0 (0.0%) | 18 (4.3%) |
| $5,000 to $7,499 | 10 (1.8%) | 18 (4.3%) |
| $7,500 to $9,999 | 11 (2.0%) | 11 (2.6%) |
| $10,000 to $12,499 | 9 (1.7%) | 56 (13.2%) |
| $12,500 to $14,999 | 5 (0.9%) | 3 (0.7%) |
| $15,000 to $17,499 | 9 (1.7%) | 0 (0.0%) |
| $17,500 to $19,999 | 0 (0.0%) | 18 (4.3%) |
| $20,000 to $22,499 | 15 (2.8%) | 22 (5.2%) |
| $22,500 to $24,999 | 3 (0.5%) | 16 (3.8%) |
| $25,000 to $29,999 | 54 (10.0%) | 21 (5.0%) |
| $30,000 to $34,999 | 13 (2.4%) | 29 (6.9%) |
| $35,000 to $39,999 | 19 (3.5%) | 56 (13.2%) |
| $40,000 to $44,999 | 75 (13.8%) | 5 (1.2%) |
| $45,000 to $49,999 | 51 (9.4%) | 51 (12.1%) |
| $50,000 to $54,999 | 14 (2.6%) | 15 (3.5%) |
| $55,000 to $64,999 | 80 (14.8%) | 12 (2.8%) |
| $65,000 to $74,999 | 3 (0.5%) | 0 (0.0%) |
| $75,000 to $99,999 | 123 (22.7%) | 35 (8.3%) |
| $100,000+ | 31 (5.7%) | 8 (1.9%) |
| Total | 542 (100.0%) | 423 (100.0%) |
Earnings by Sex by Educational Attainment in Blossburg borough
Average earnings in Blossburg borough are $54,583 for men and $30,952 for women, a difference of 43.3%. Men with an educational attainment of bachelor's degree enjoy the highest average annual earnings of $80,636, while those with high school diploma education earn the least with $43,632. Women with an educational attainment of bachelor's degree earn the most with the average annual earnings of $49,659, while those with less than high school education have the smallest earnings of $21,477.
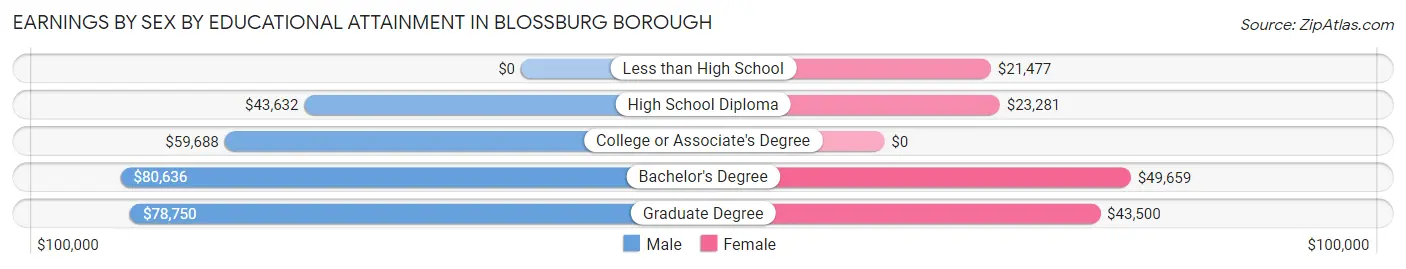
| Educational Attainment | Male Income | Female Income |
| Less than High School | - | - |
| High School Diploma | $43,632 | $23,281 |
| College or Associate's Degree | $59,688 | $0 |
| Bachelor's Degree | $80,636 | $49,659 |
| Graduate Degree | $78,750 | $43,500 |
| Total | $54,583 | $30,952 |
Family Income in Blossburg borough
Family Income Brackets in Blossburg borough
According to the Blossburg borough family income data, there are 146 families falling into the $100,000 to $149,999 income range, which is the most common income bracket and makes up 29.7% of all families. Conversely, the $10,000 to $14,999 income bracket is the least frequent group with only 8 families (1.6%) belonging to this category.
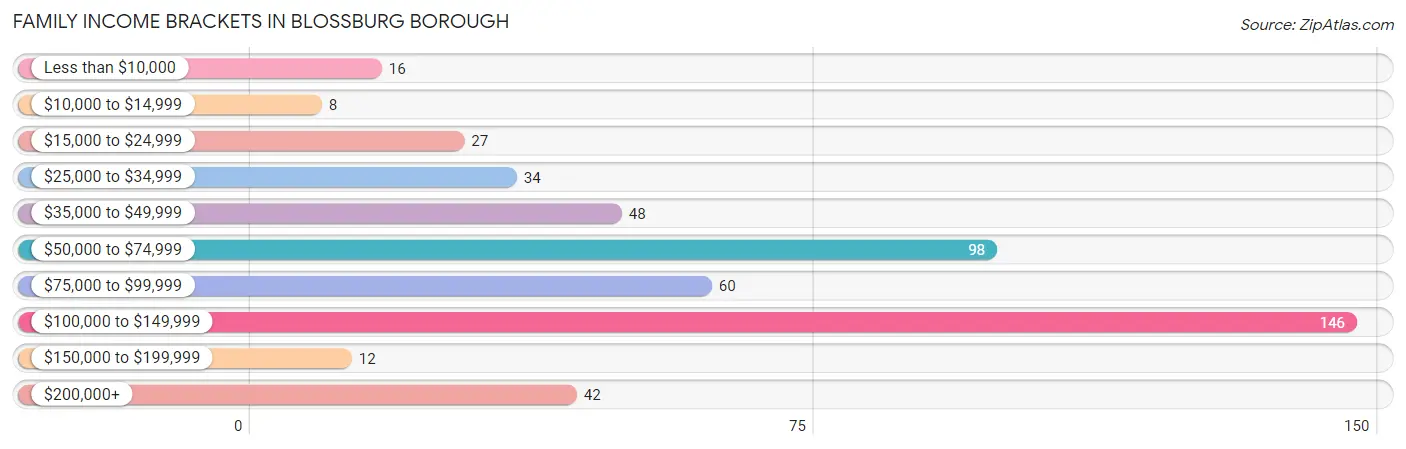
| Income Bracket | # Families | % Families |
| Less than $10,000 | 16 | 3.3% |
| $10,000 to $14,999 | 8 | 1.6% |
| $15,000 to $24,999 | 27 | 5.5% |
| $25,000 to $34,999 | 34 | 6.9% |
| $35,000 to $49,999 | 48 | 9.8% |
| $50,000 to $74,999 | 98 | 20.0% |
| $75,000 to $99,999 | 60 | 12.2% |
| $100,000 to $149,999 | 146 | 29.7% |
| $150,000 to $199,999 | 12 | 2.4% |
| $200,000+ | 42 | 8.6% |
Family Income by Famaliy Size in Blossburg borough
4-person families (101 | 20.6%) account for the highest median family income in Blossburg borough with $142,721 per family, while 4-person families (101 | 20.6%) have the highest median income of $35,680 per family member.
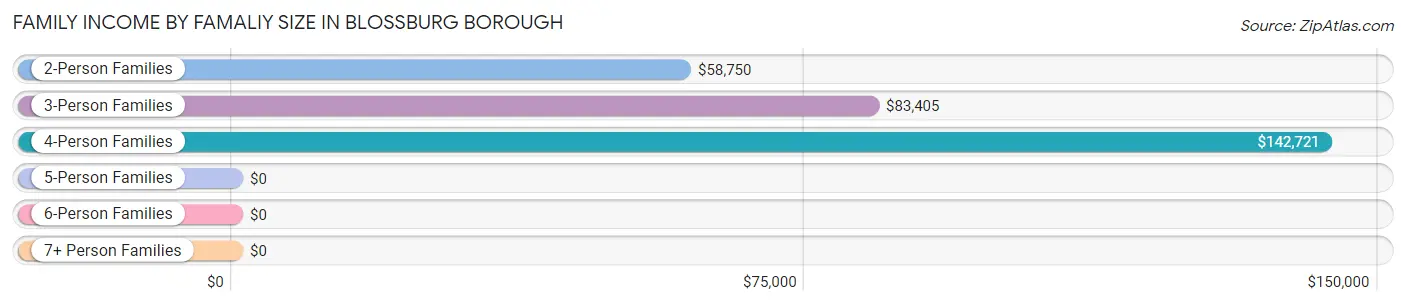
| Income Bracket | # Families | Median Income |
| 2-Person Families | 145 (29.5%) | $58,750 |
| 3-Person Families | 155 (31.6%) | $83,405 |
| 4-Person Families | 101 (20.6%) | $142,721 |
| 5-Person Families | 86 (17.5%) | $0 |
| 6-Person Families | 4 (0.8%) | $0 |
| 7+ Person Families | 0 (0.0%) | $0 |
| Total | 491 (100.0%) | $81,042 |
Family Income by Number of Earners in Blossburg borough
The median family income in Blossburg borough is $81,042, with families comprising 3+ earners (100) having the highest median family income of $146,029, while families with no earners (58) have the lowest median family income of $34,444, accounting for 20.4% and 11.8% of families, respectively.
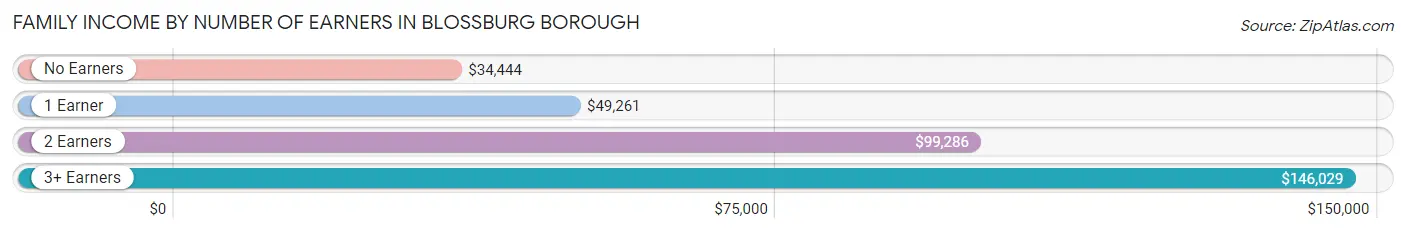
| Number of Earners | # Families | Median Income |
| No Earners | 58 (11.8%) | $34,444 |
| 1 Earner | 127 (25.9%) | $49,261 |
| 2 Earners | 206 (42.0%) | $99,286 |
| 3+ Earners | 100 (20.4%) | $146,029 |
| Total | 491 (100.0%) | $81,042 |
Household Income in Blossburg borough
Household Income Brackets in Blossburg borough
With 146 households falling in the category, the $100,000 to $149,999 income range is the most frequent in Blossburg borough, accounting for 22.5% of all households. In contrast, only 12 households (1.8%) fall into the $150,000 to $199,999 income bracket, making it the least populous group.
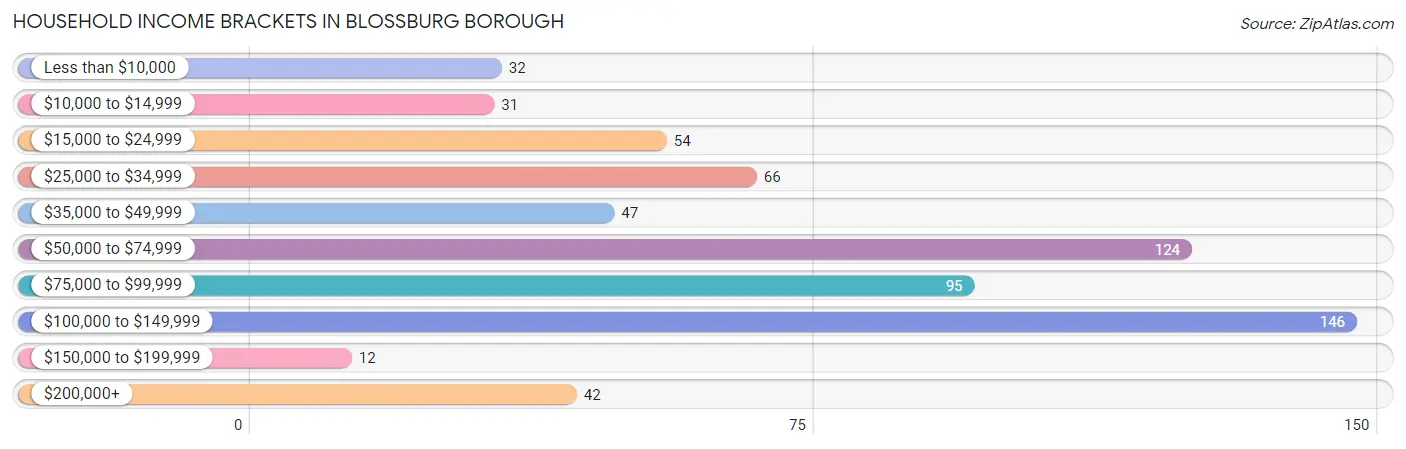
| Income Bracket | # Households | % Households |
| Less than $10,000 | 32 | 4.9% |
| $10,000 to $14,999 | 31 | 4.8% |
| $15,000 to $24,999 | 54 | 8.3% |
| $25,000 to $34,999 | 66 | 10.2% |
| $35,000 to $49,999 | 47 | 7.2% |
| $50,000 to $74,999 | 124 | 19.1% |
| $75,000 to $99,999 | 95 | 14.6% |
| $100,000 to $149,999 | 146 | 22.5% |
| $150,000 to $199,999 | 12 | 1.8% |
| $200,000+ | 42 | 6.5% |
Household Income by Householder Age in Blossburg borough
The median household income in Blossburg borough is $64,901, with the highest median household income of $80,000 found in the 45 to 64 years age bracket for the primary householder. A total of 210 households (32.4%) fall into this category. Meanwhile, the 15 to 24 years age bracket for the primary householder has the lowest median household income of $0, with 48 households (7.4%) in this group.
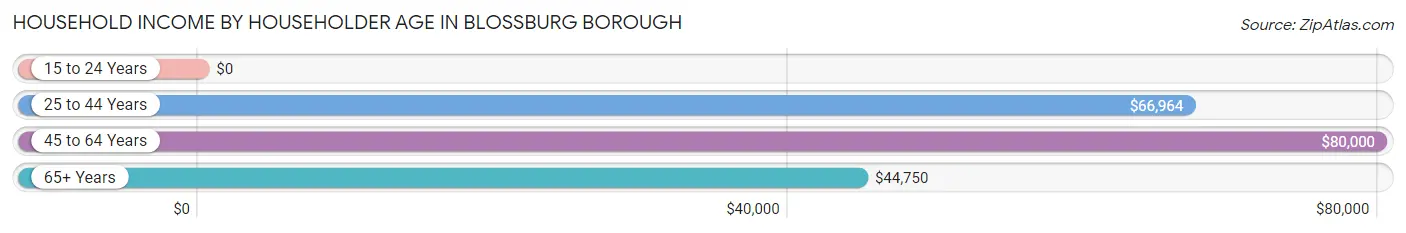
| Income Bracket | # Households | Median Income |
| 15 to 24 Years | 48 (7.4%) | $0 |
| 25 to 44 Years | 272 (41.9%) | $66,964 |
| 45 to 64 Years | 210 (32.4%) | $80,000 |
| 65+ Years | 119 (18.3%) | $44,750 |
| Total | 649 (100.0%) | $64,901 |
Poverty in Blossburg borough
Income Below Poverty by Sex and Age in Blossburg borough
With 9.0% poverty level for males and 12.1% for females among the residents of Blossburg borough, 15 year old males and 15 year old females are the most vulnerable to poverty, with 4 males (36.4%) and 4 females (100.0%) in their respective age groups living below the poverty level.
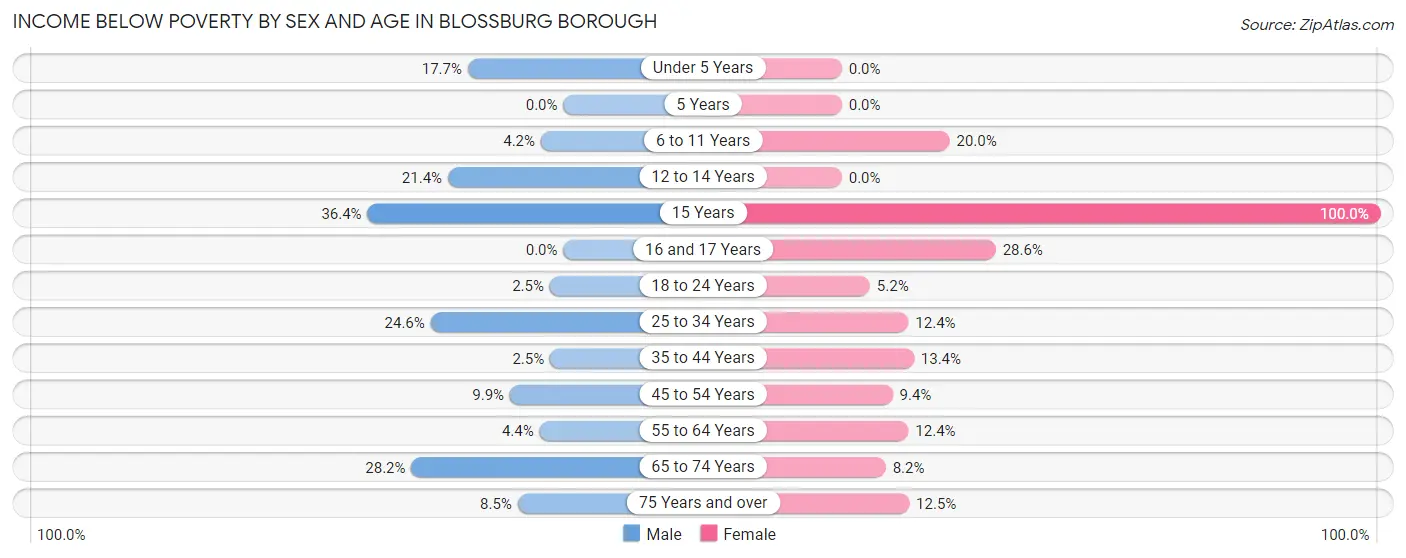
| Age Bracket | Male | Female |
| Under 5 Years | 11 (17.7%) | 0 (0.0%) |
| 5 Years | 0 (0.0%) | 0 (0.0%) |
| 6 to 11 Years | 3 (4.2%) | 16 (20.0%) |
| 12 to 14 Years | 9 (21.4%) | 0 (0.0%) |
| 15 Years | 4 (36.4%) | 4 (100.0%) |
| 16 and 17 Years | 0 (0.0%) | 14 (28.6%) |
| 18 to 24 Years | 3 (2.5%) | 6 (5.2%) |
| 25 to 34 Years | 17 (24.6%) | 11 (12.4%) |
| 35 to 44 Years | 4 (2.5%) | 21 (13.4%) |
| 45 to 54 Years | 11 (9.9%) | 15 (9.4%) |
| 55 to 64 Years | 5 (4.4%) | 11 (12.4%) |
| 65 to 74 Years | 11 (28.2%) | 4 (8.2%) |
| 75 Years and over | 5 (8.5%) | 7 (12.5%) |
| Total | 83 (9.0%) | 109 (12.1%) |
Income Above Poverty by Sex and Age in Blossburg borough
According to the poverty statistics in Blossburg borough, males aged 5 years and females aged under 5 years are the age groups that are most secure financially, with 100.0% of males and 100.0% of females in these age groups living above the poverty line.
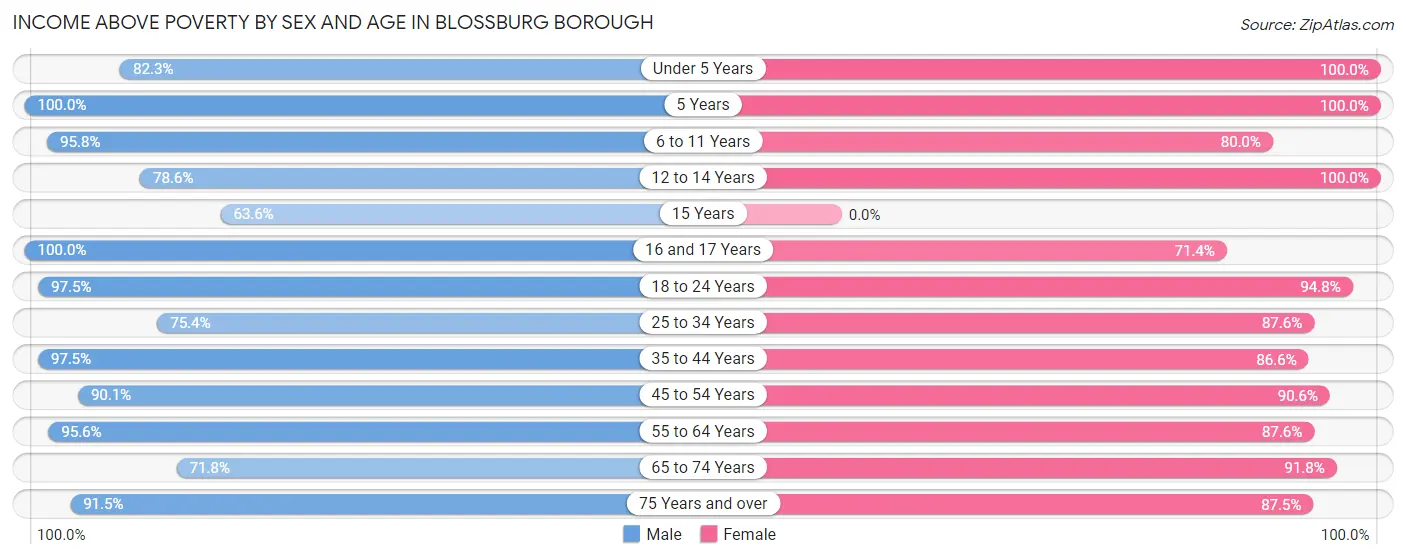
| Age Bracket | Male | Female |
| Under 5 Years | 51 (82.3%) | 34 (100.0%) |
| 5 Years | 11 (100.0%) | 4 (100.0%) |
| 6 to 11 Years | 69 (95.8%) | 64 (80.0%) |
| 12 to 14 Years | 33 (78.6%) | 16 (100.0%) |
| 15 Years | 7 (63.6%) | 0 (0.0%) |
| 16 and 17 Years | 55 (100.0%) | 35 (71.4%) |
| 18 to 24 Years | 116 (97.5%) | 109 (94.8%) |
| 25 to 34 Years | 52 (75.4%) | 78 (87.6%) |
| 35 to 44 Years | 158 (97.5%) | 136 (86.6%) |
| 45 to 54 Years | 100 (90.1%) | 144 (90.6%) |
| 55 to 64 Years | 108 (95.6%) | 78 (87.6%) |
| 65 to 74 Years | 28 (71.8%) | 45 (91.8%) |
| 75 Years and over | 54 (91.5%) | 49 (87.5%) |
| Total | 842 (91.0%) | 792 (87.9%) |
Income Below Poverty Among Married-Couple Families in Blossburg borough
The poverty statistics for married-couple families in Blossburg borough show that 4.3% or 17 of the total 393 families live below the poverty line. Families with no children have the highest poverty rate of 6.4%, comprising of 12 families. On the other hand, families with 3 or 4 children have the lowest poverty rate of 0.0%, which includes 0 families.
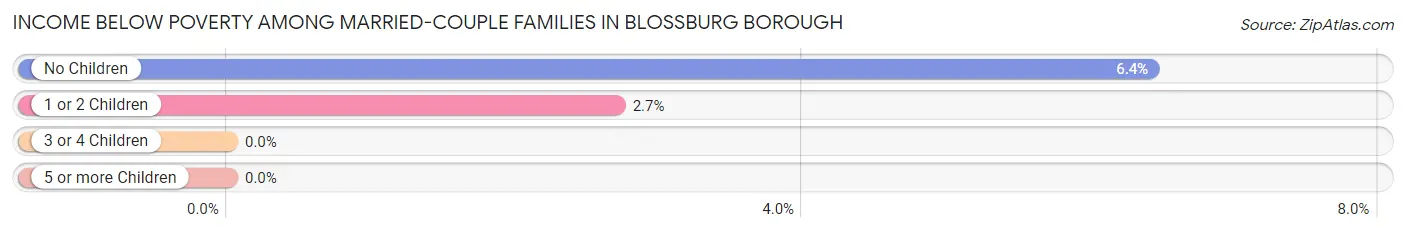
| Children | Above Poverty | Below Poverty |
| No Children | 175 (93.6%) | 12 (6.4%) |
| 1 or 2 Children | 180 (97.3%) | 5 (2.7%) |
| 3 or 4 Children | 21 (100.0%) | 0 (0.0%) |
| 5 or more Children | 0 (0.0%) | 0 (0.0%) |
| Total | 376 (95.7%) | 17 (4.3%) |
Income Below Poverty Among Single-Parent Households in Blossburg borough
According to the poverty data in Blossburg borough, 7.9% or 3 single-father households and 41.7% or 25 single-mother households are living below the poverty line. Among single-father households, those with no children have the highest poverty rate, with 3 households (100.0%) experiencing poverty. Likewise, among single-mother households, those with 3 or 4 children have the highest poverty rate, with 5 households (100.0%) falling below the poverty line.
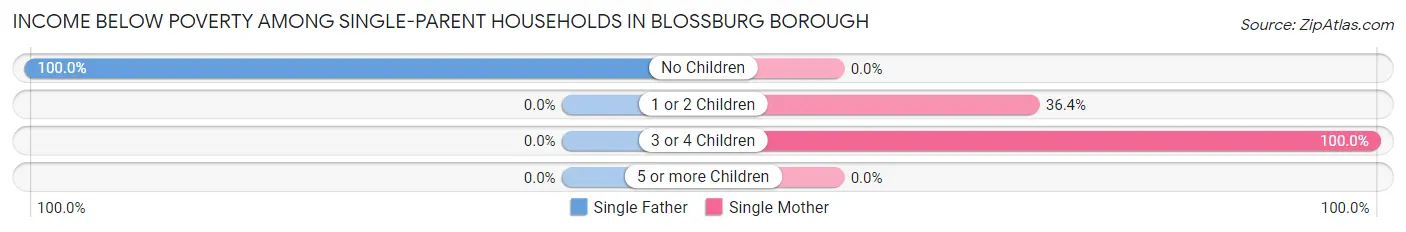
| Children | Single Father | Single Mother |
| No Children | 3 (100.0%) | 0 (0.0%) |
| 1 or 2 Children | 0 (0.0%) | 20 (36.4%) |
| 3 or 4 Children | 0 (0.0%) | 5 (100.0%) |
| 5 or more Children | 0 (0.0%) | 0 (0.0%) |
| Total | 3 (7.9%) | 25 (41.7%) |
Income Below Poverty Among Married-Couple vs Single-Parent Households in Blossburg borough
The poverty data for Blossburg borough shows that 17 of the married-couple family households (4.3%) and 28 of the single-parent households (28.6%) are living below the poverty level. Within the married-couple family households, those with no children have the highest poverty rate, with 12 households (6.4%) falling below the poverty line. Among the single-parent households, those with no children have the highest poverty rate, with 3 household (100.0%) living below poverty.
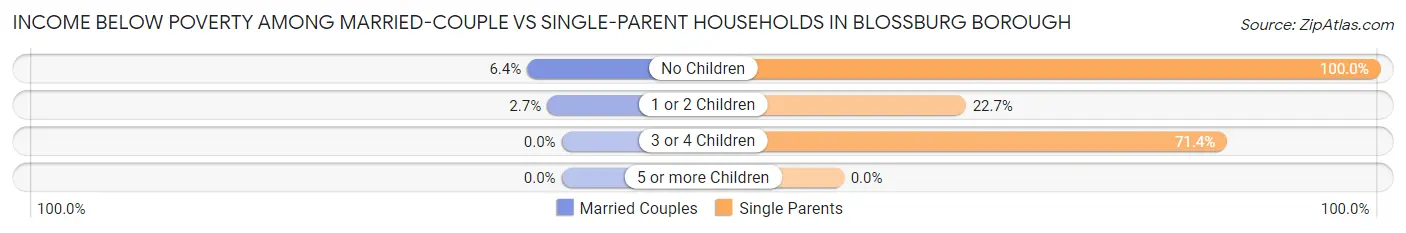
| Children | Married-Couple Families | Single-Parent Households |
| No Children | 12 (6.4%) | 3 (100.0%) |
| 1 or 2 Children | 5 (2.7%) | 20 (22.7%) |
| 3 or 4 Children | 0 (0.0%) | 5 (71.4%) |
| 5 or more Children | 0 (0.0%) | 0 (0.0%) |
| Total | 17 (4.3%) | 28 (28.6%) |
Race in Blossburg borough
The most populous races in Blossburg borough are White / Caucasian (1,698 | 92.5%), Asian (63 | 3.4%), and Hispanic or Latino (39 | 2.1%).
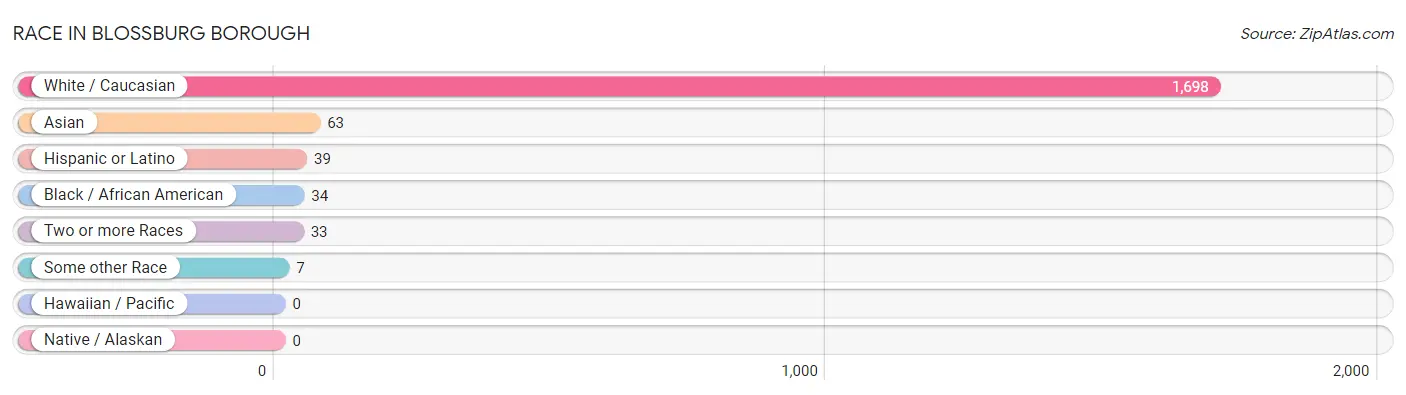
| Race | # Population | % Population |
| Asian | 63 | 3.4% |
| Black / African American | 34 | 1.8% |
| Hawaiian / Pacific | 0 | 0.0% |
| Hispanic or Latino | 39 | 2.1% |
| Native / Alaskan | 0 | 0.0% |
| White / Caucasian | 1,698 | 92.5% |
| Two or more Races | 33 | 1.8% |
| Some other Race | 7 | 0.4% |
| Total | 1,835 | 100.0% |
Ancestry in Blossburg borough
The most populous ancestries reported in Blossburg borough are Irish (379 | 20.6%), German (354 | 19.3%), American (284 | 15.5%), Polish (261 | 14.2%), and English (201 | 11.0%), together accounting for 80.6% of all Blossburg borough residents.
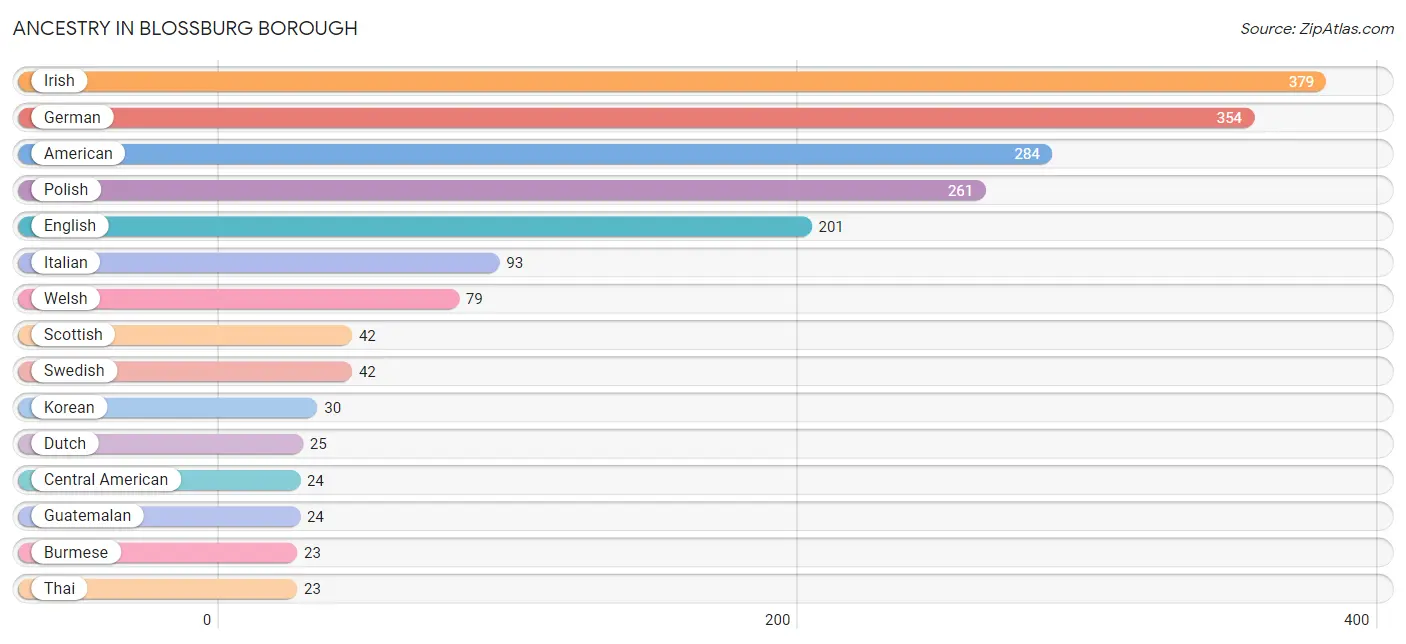
| Ancestry | # Population | % Population |
| American | 284 | 15.5% |
| Austrian | 3 | 0.2% |
| British | 3 | 0.2% |
| Burmese | 23 | 1.3% |
| Celtic | 2 | 0.1% |
| Central American | 24 | 1.3% |
| Czech | 9 | 0.5% |
| Czechoslovakian | 7 | 0.4% |
| Dutch | 25 | 1.4% |
| English | 201 | 11.0% |
| European | 16 | 0.9% |
| Finnish | 3 | 0.2% |
| French | 12 | 0.6% |
| German | 354 | 19.3% |
| Greek | 2 | 0.1% |
| Guatemalan | 24 | 1.3% |
| Guyanese | 8 | 0.4% |
| Hungarian | 7 | 0.4% |
| Irish | 379 | 20.6% |
| Italian | 93 | 5.1% |
| Korean | 30 | 1.6% |
| Lithuanian | 4 | 0.2% |
| Mexican | 6 | 0.3% |
| Northern European | 6 | 0.3% |
| Polish | 261 | 14.2% |
| Russian | 11 | 0.6% |
| Scandinavian | 3 | 0.2% |
| Scotch-Irish | 17 | 0.9% |
| Scottish | 42 | 2.3% |
| Slavic | 2 | 0.1% |
| Swedish | 42 | 2.3% |
| Swiss | 6 | 0.3% |
| Thai | 23 | 1.3% |
| Ukrainian | 4 | 0.2% |
| Welsh | 79 | 4.3% | View All 35 Rows |
Immigrants in Blossburg borough
The most numerous immigrant groups reported in Blossburg borough came from Asia (49 | 2.7%), Europe (19 | 1.0%), India (19 | 1.0%), Latin America (19 | 1.0%), and South Central Asia (19 | 1.0%), together accounting for 6.8% of all Blossburg borough residents.
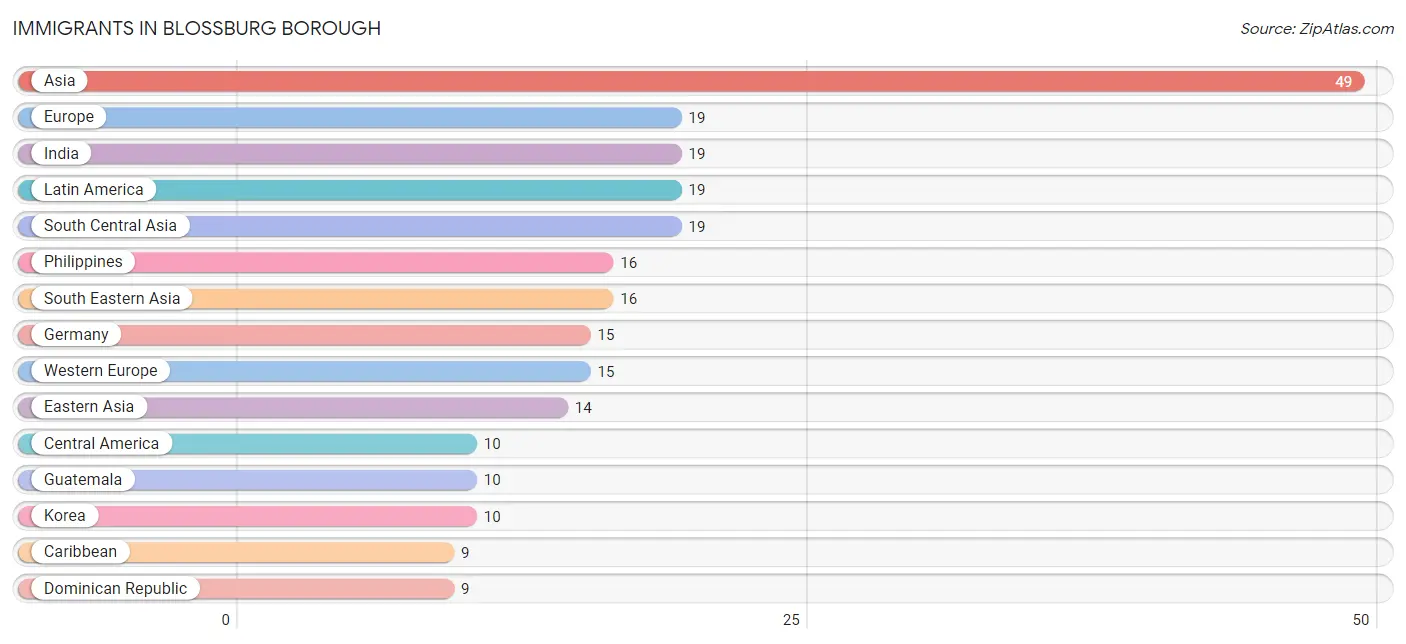
| Immigration Origin | # Population | % Population |
| Asia | 49 | 2.7% |
| Caribbean | 9 | 0.5% |
| Central America | 10 | 0.5% |
| China | 4 | 0.2% |
| Dominican Republic | 9 | 0.5% |
| Eastern Asia | 14 | 0.8% |
| England | 4 | 0.2% |
| Europe | 19 | 1.0% |
| Germany | 15 | 0.8% |
| Guatemala | 10 | 0.5% |
| India | 19 | 1.0% |
| Korea | 10 | 0.5% |
| Latin America | 19 | 1.0% |
| Northern Europe | 4 | 0.2% |
| Philippines | 16 | 0.9% |
| South Central Asia | 19 | 1.0% |
| South Eastern Asia | 16 | 0.9% |
| Western Europe | 15 | 0.8% | View All 18 Rows |
Sex and Age in Blossburg borough
Sex and Age in Blossburg borough
The most populous age groups in Blossburg borough are 40 to 44 Years (115 | 12.3%) for men and 15 to 19 Years (148 | 16.4%) for women.
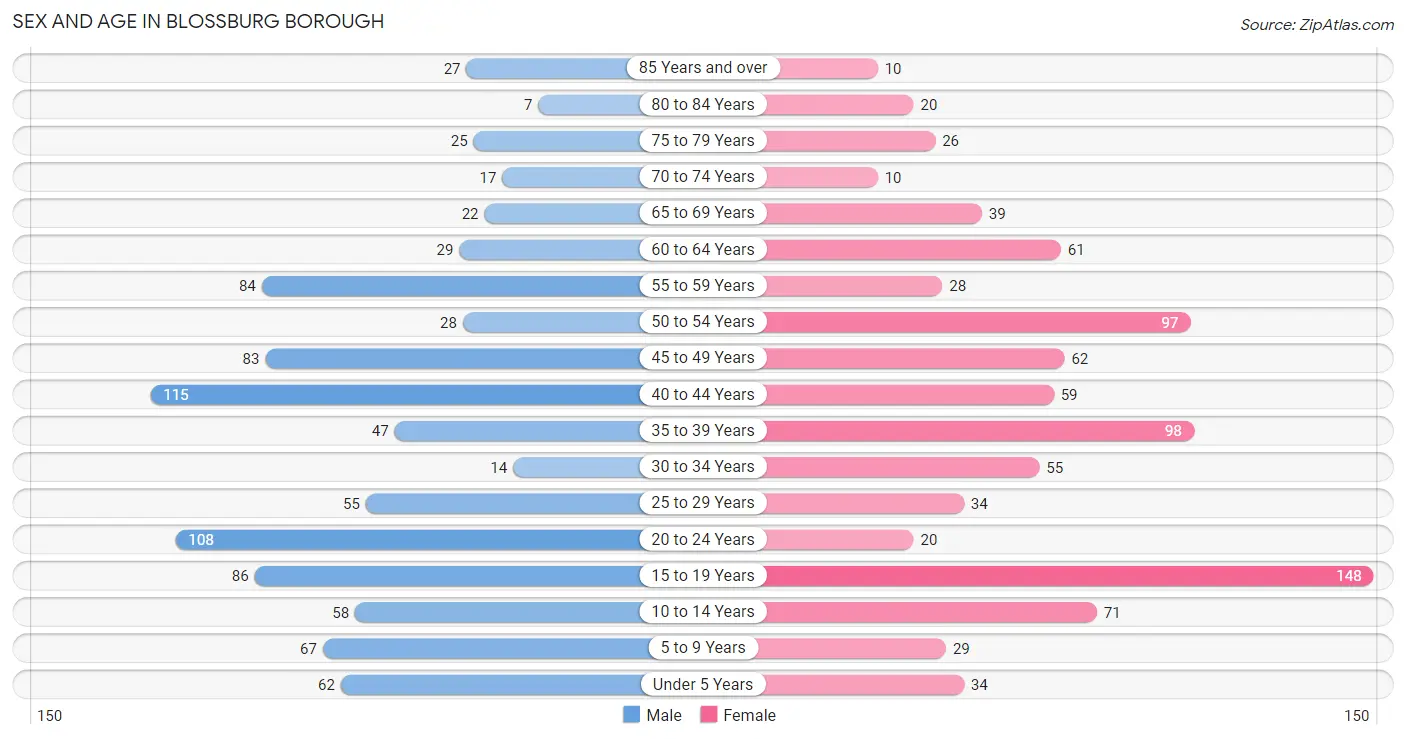
| Age Bracket | Male | Female |
| Under 5 Years | 62 (6.6%) | 34 (3.8%) |
| 5 to 9 Years | 67 (7.2%) | 29 (3.2%) |
| 10 to 14 Years | 58 (6.2%) | 71 (7.9%) |
| 15 to 19 Years | 86 (9.2%) | 148 (16.4%) |
| 20 to 24 Years | 108 (11.6%) | 20 (2.2%) |
| 25 to 29 Years | 55 (5.9%) | 34 (3.8%) |
| 30 to 34 Years | 14 (1.5%) | 55 (6.1%) |
| 35 to 39 Years | 47 (5.0%) | 98 (10.9%) |
| 40 to 44 Years | 115 (12.3%) | 59 (6.6%) |
| 45 to 49 Years | 83 (8.9%) | 62 (6.9%) |
| 50 to 54 Years | 28 (3.0%) | 97 (10.8%) |
| 55 to 59 Years | 84 (9.0%) | 28 (3.1%) |
| 60 to 64 Years | 29 (3.1%) | 61 (6.8%) |
| 65 to 69 Years | 22 (2.4%) | 39 (4.3%) |
| 70 to 74 Years | 17 (1.8%) | 10 (1.1%) |
| 75 to 79 Years | 25 (2.7%) | 26 (2.9%) |
| 80 to 84 Years | 7 (0.7%) | 20 (2.2%) |
| 85 Years and over | 27 (2.9%) | 10 (1.1%) |
| Total | 934 (100.0%) | 901 (100.0%) |
Families and Households in Blossburg borough
Median Family Size in Blossburg borough
The median family size in Blossburg borough is 3.30 persons per family, with single male/father families (38 | 7.7%) accounting for the largest median family size of 3.55 persons per family. On the other hand, single female/mother families (60 | 12.2%) represent the smallest median family size with 2.83 persons per family.
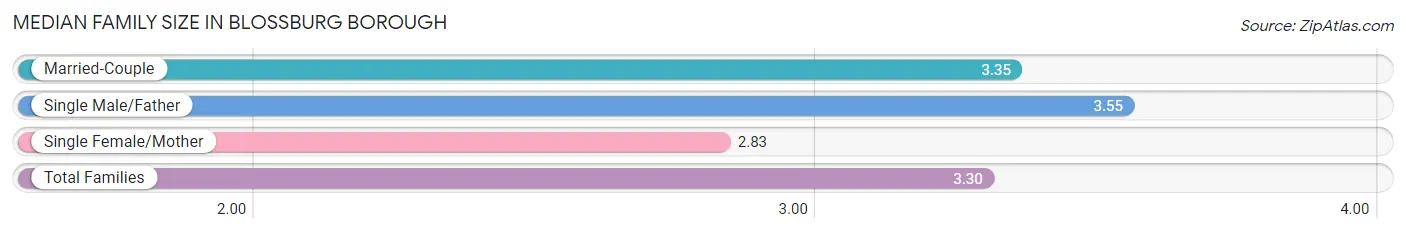
| Family Type | # Families | Family Size |
| Married-Couple | 393 (80.0%) | 3.35 |
| Single Male/Father | 38 (7.7%) | 3.55 |
| Single Female/Mother | 60 (12.2%) | 2.83 |
| Total Families | 491 (100.0%) | 3.30 |
Median Household Size in Blossburg borough
The median household size in Blossburg borough is 2.80 persons per household, with single male/father households (38 | 5.9%) accounting for the largest median household size of 4 persons per household. non-family households (158 | 24.3%) represent the smallest median household size with 1.08 persons per household.
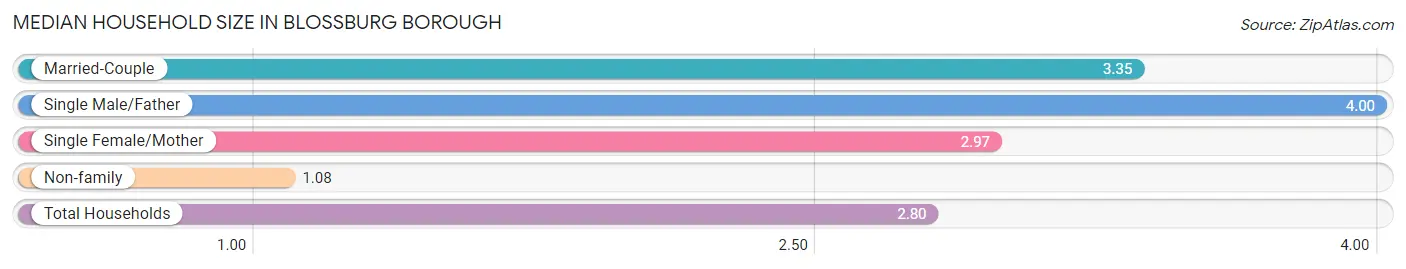
| Household Type | # Households | Household Size |
| Married-Couple | 393 (60.6%) | 3.35 |
| Single Male/Father | 38 (5.9%) | 4.00 |
| Single Female/Mother | 60 (9.2%) | 2.97 |
| Non-family | 158 (24.3%) | 1.08 |
| Total Households | 649 (100.0%) | 2.80 |
Household Size by Marriage Status in Blossburg borough
Out of a total of 649 households in Blossburg borough, 491 (75.6%) are family households, while 158 (24.3%) are nonfamily households. The most numerous type of family households are 3-person households, comprising 157, and the most common type of nonfamily households are 1-person households, comprising 147.
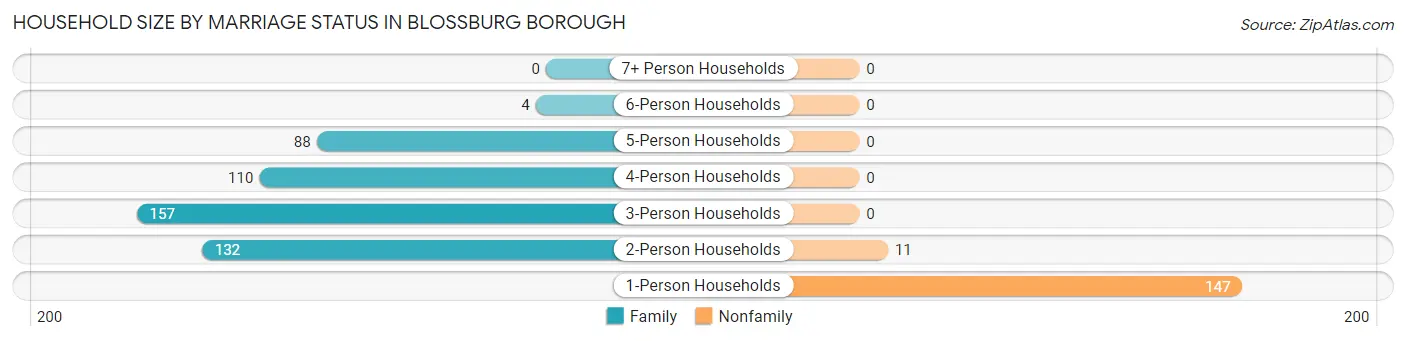
| Household Size | Family Households | Nonfamily Households |
| 1-Person Households | - | 147 (22.7%) |
| 2-Person Households | 132 (20.3%) | 11 (1.7%) |
| 3-Person Households | 157 (24.2%) | 0 (0.0%) |
| 4-Person Households | 110 (17.0%) | 0 (0.0%) |
| 5-Person Households | 88 (13.6%) | 0 (0.0%) |
| 6-Person Households | 4 (0.6%) | 0 (0.0%) |
| 7+ Person Households | 0 (0.0%) | 0 (0.0%) |
| Total | 491 (75.6%) | 158 (24.3%) |
Female Fertility in Blossburg borough
Fertility by Age in Blossburg borough
Average fertility rate in Blossburg borough is 21.0 births per 1,000 women. Women in the age bracket of 20 to 34 years have the highest fertility rate with 101.0 births per 1,000 women. Women in the age bracket of 20 to 34 years acount for 100.0% of all women with births.
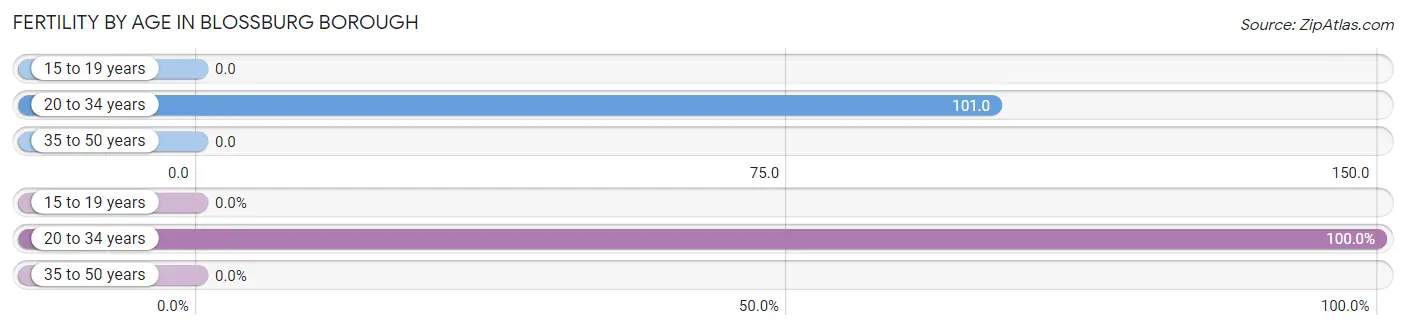
| Age Bracket | Women with Births | Births / 1,000 Women |
| 15 to 19 years | 0 (0.0%) | 0.0 |
| 20 to 34 years | 11 (100.0%) | 101.0 |
| 35 to 50 years | 0 (0.0%) | 0.0 |
| Total | 11 (100.0%) | 21.0 |
Fertility by Age by Marriage Status in Blossburg borough
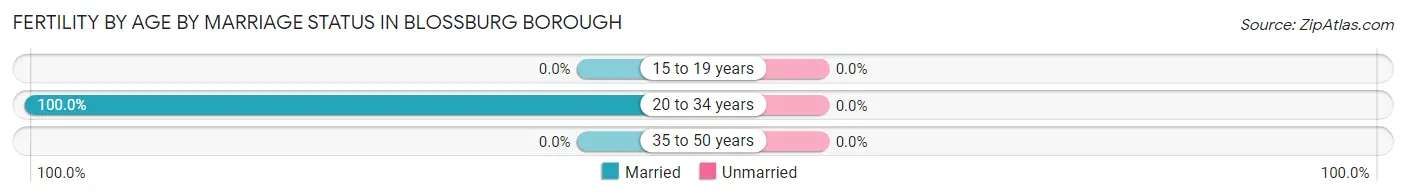
| Age Bracket | Married | Unmarried |
| 15 to 19 years | 0 (0.0%) | 0 (0.0%) |
| 20 to 34 years | 11 (100.0%) | 0 (0.0%) |
| 35 to 50 years | 0 (0.0%) | 0 (0.0%) |
| Total | 11 (100.0%) | 0 (0.0%) |
Fertility by Education in Blossburg borough
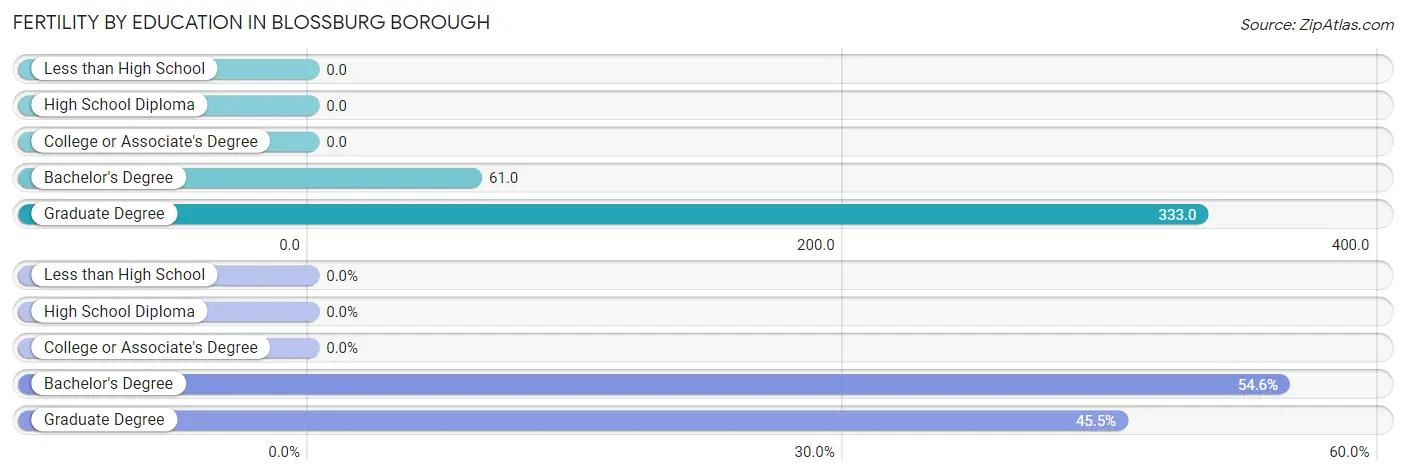
| Educational Attainment | Women with Births | Births / 1,000 Women |
| Less than High School | 0 (0.0%) | 0.0 |
| High School Diploma | 0 (0.0%) | 0.0 |
| College or Associate's Degree | 0 (0.0%) | 0.0 |
| Bachelor's Degree | 6 (54.5%) | 61.0 |
| Graduate Degree | 5 (45.5%) | 333.0 |
| Total | 11 (100.0%) | 21.0 |
Fertility by Education by Marriage Status in Blossburg borough
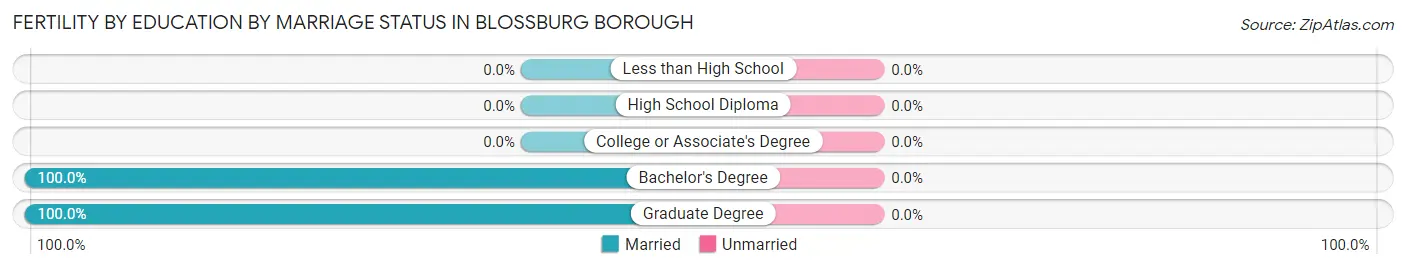
| Educational Attainment | Married | Unmarried |
| Less than High School | 0 (0.0%) | 0 (0.0%) |
| High School Diploma | 0 (0.0%) | 0 (0.0%) |
| College or Associate's Degree | 0 (0.0%) | 0 (0.0%) |
| Bachelor's Degree | 6 (100.0%) | 0 (0.0%) |
| Graduate Degree | 5 (100.0%) | 0 (0.0%) |
| Total | 11 (100.0%) | 0 (0.0%) |
Employment Characteristics in Blossburg borough
Employment by Class of Employer in Blossburg borough
Among the 911 employed individuals in Blossburg borough, private company employees (541 | 59.4%), not-for-profit organizations (173 | 19.0%), and local government employees (100 | 11.0%) make up the most common classes of employment.
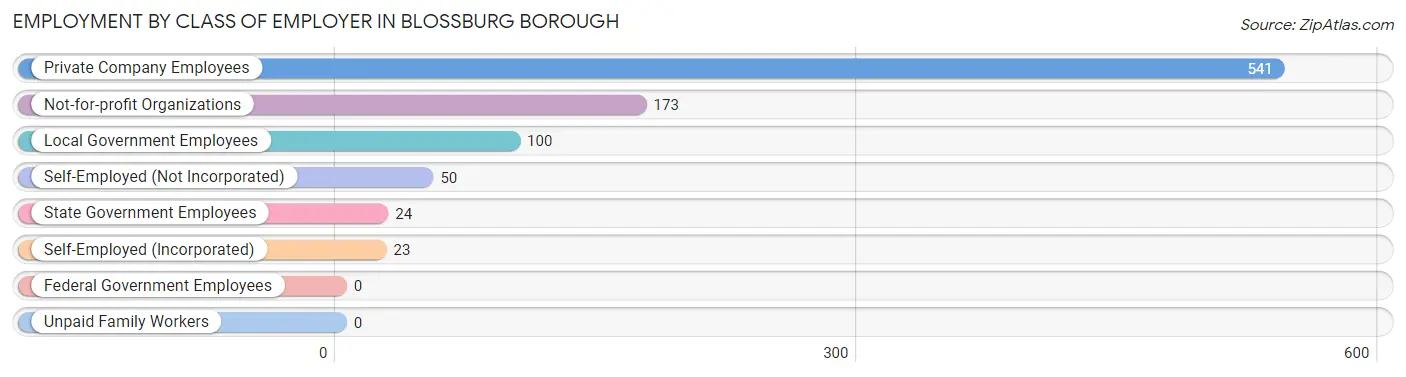
| Employer Class | # Employees | % Employees |
| Private Company Employees | 541 | 59.4% |
| Self-Employed (Incorporated) | 23 | 2.5% |
| Self-Employed (Not Incorporated) | 50 | 5.5% |
| Not-for-profit Organizations | 173 | 19.0% |
| Local Government Employees | 100 | 11.0% |
| State Government Employees | 24 | 2.6% |
| Federal Government Employees | 0 | 0.0% |
| Unpaid Family Workers | 0 | 0.0% |
| Total | 911 | 100.0% |
Employment Status by Age in Blossburg borough
According to the labor force statistics for Blossburg borough, out of the total population over 16 years of age (1,499), 64.7% or 970 individuals are in the labor force, with 4.5% or 44 of them unemployed. The age group with the highest labor force participation rate is 35 to 44 years, with 93.4% or 298 individuals in the labor force. Within the labor force, the 75 years and over age range has the highest percentage of unemployed individuals, with 33.3% or 3 of them being unemployed.
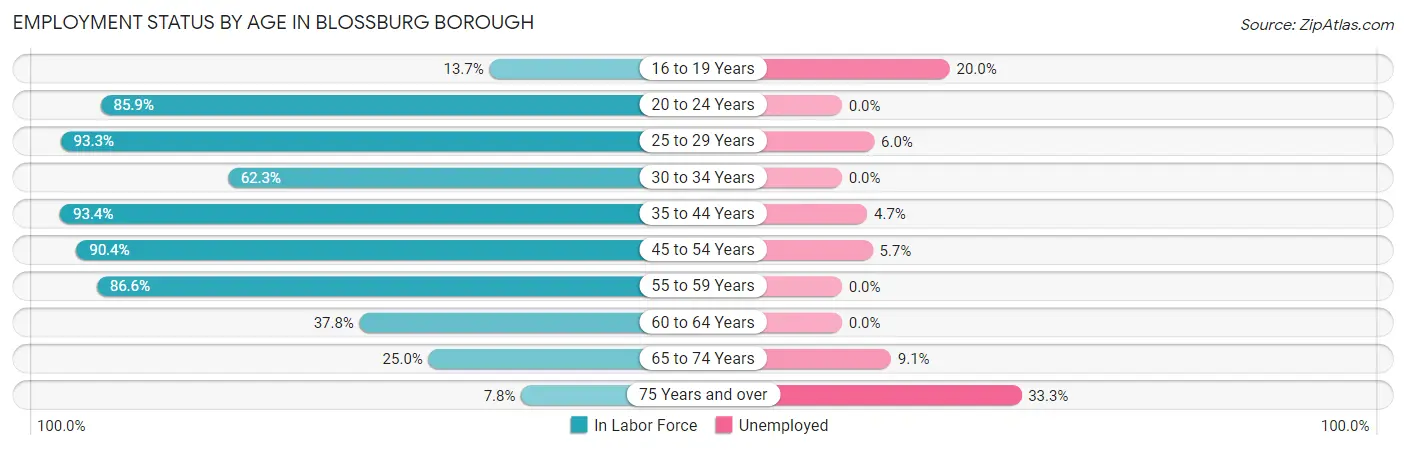
| Age Bracket | In Labor Force | Unemployed |
| 16 to 19 Years | 30 (13.7%) | 6 (20.0%) |
| 20 to 24 Years | 110 (85.9%) | 0 (0.0%) |
| 25 to 29 Years | 83 (93.3%) | 5 (6.0%) |
| 30 to 34 Years | 43 (62.3%) | 0 (0.0%) |
| 35 to 44 Years | 298 (93.4%) | 14 (4.7%) |
| 45 to 54 Years | 244 (90.4%) | 14 (5.7%) |
| 55 to 59 Years | 97 (86.6%) | 0 (0.0%) |
| 60 to 64 Years | 34 (37.8%) | 0 (0.0%) |
| 65 to 74 Years | 22 (25.0%) | 2 (9.1%) |
| 75 Years and over | 9 (7.8%) | 3 (33.3%) |
| Total | 970 (64.7%) | 44 (4.5%) |
Employment Status by Educational Attainment in Blossburg borough
According to labor force statistics for Blossburg borough, 84.2% of individuals (799) out of the total population between 25 and 64 years of age (949) are in the labor force, with 4.1% or 33 of them being unemployed. The group with the highest labor force participation rate are those with the educational attainment of bachelor's degree or higher, with 93.0% or 281 individuals in the labor force. Within the labor force, individuals with less than high school education have the highest percentage of unemployment, with 17.6% or 6 of them being unemployed.
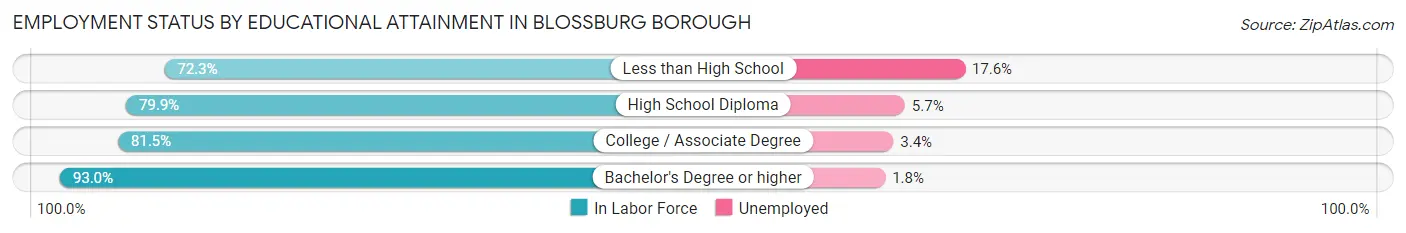
| Educational Attainment | In Labor Force | Unemployed |
| Less than High School | 34 (72.3%) | 8 (17.6%) |
| High School Diploma | 246 (79.9%) | 18 (5.7%) |
| College / Associate Degree | 238 (81.5%) | 10 (3.4%) |
| Bachelor's Degree or higher | 281 (93.0%) | 5 (1.8%) |
| Total | 799 (84.2%) | 39 (4.1%) |
Employment Occupations by Sex in Blossburg borough
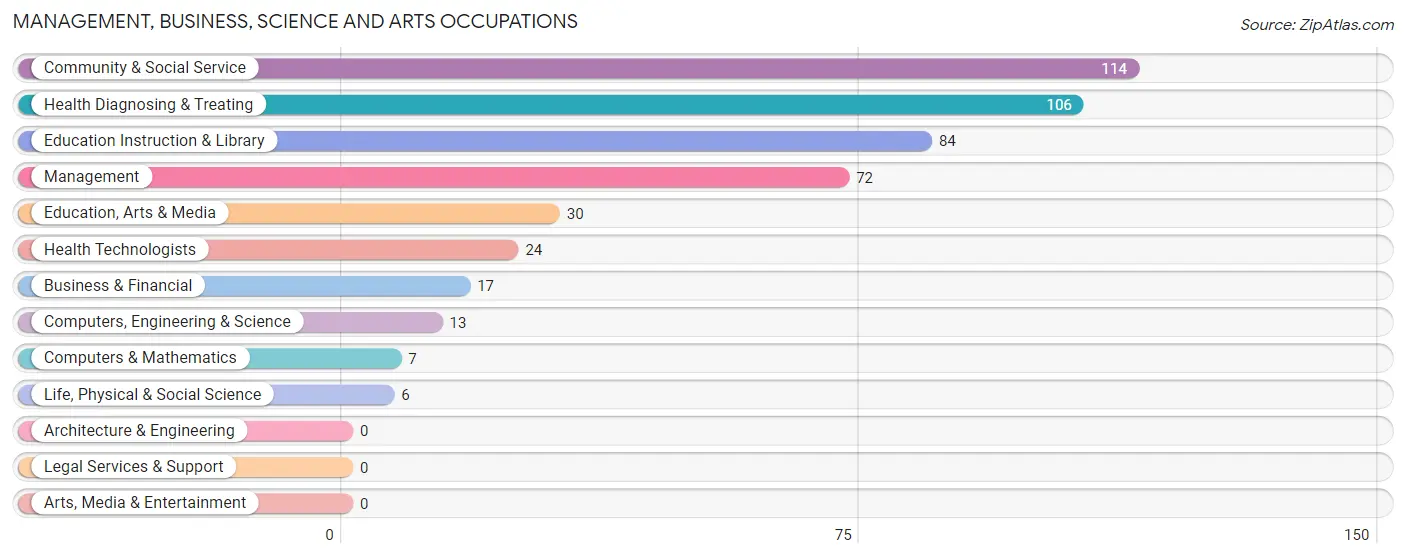
Management, Business, Science and Arts Occupations
The most common Management, Business, Science and Arts occupations in Blossburg borough are Community & Social Service (114 | 12.3%), Health Diagnosing & Treating (106 | 11.5%), Education Instruction & Library (84 | 9.1%), Management (72 | 7.8%), and Education, Arts & Media (30 | 3.2%).
Management, Business, Science and Arts Occupations by Sex
Within the Management, Business, Science and Arts occupations in Blossburg borough, the most male-oriented occupations are Computers, Engineering & Science (100.0%), Computers & Mathematics (100.0%), and Life, Physical & Social Science (100.0%), while the most female-oriented occupations are Health Technologists (87.5%), Business & Financial (82.4%), and Education, Arts & Media (63.3%).
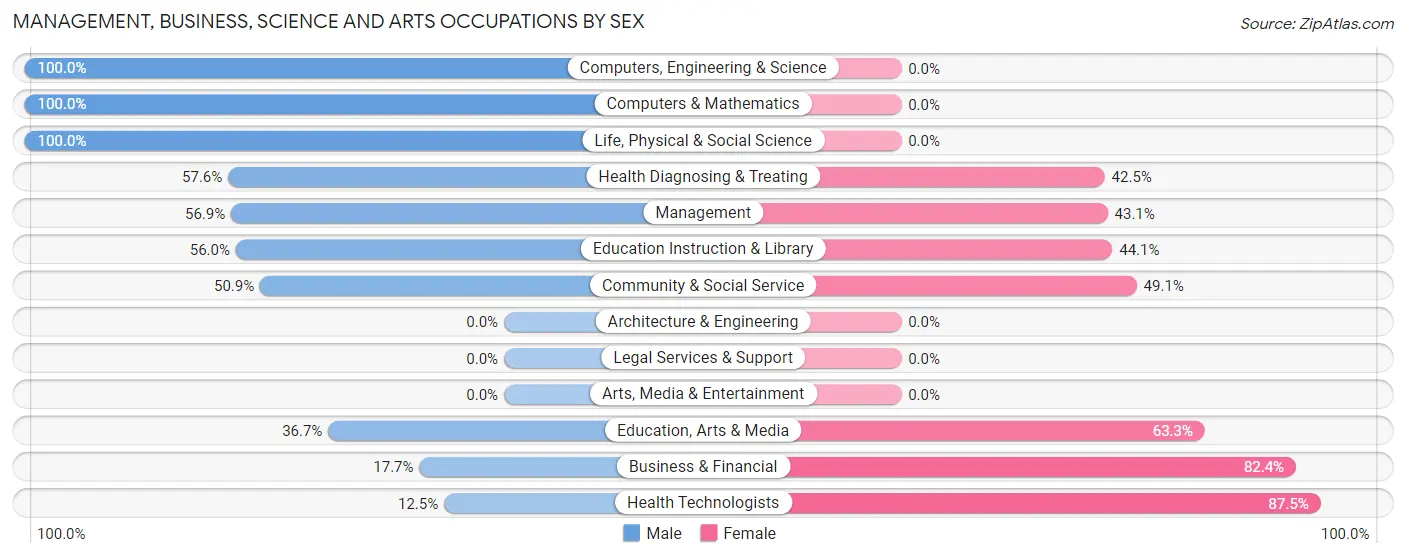
| Occupation | Male | Female |
| Management | 41 (56.9%) | 31 (43.1%) |
| Business & Financial | 3 (17.6%) | 14 (82.4%) |
| Computers, Engineering & Science | 13 (100.0%) | 0 (0.0%) |
| Computers & Mathematics | 7 (100.0%) | 0 (0.0%) |
| Architecture & Engineering | 0 (0.0%) | 0 (0.0%) |
| Life, Physical & Social Science | 6 (100.0%) | 0 (0.0%) |
| Community & Social Service | 58 (50.9%) | 56 (49.1%) |
| Education, Arts & Media | 11 (36.7%) | 19 (63.3%) |
| Legal Services & Support | 0 (0.0%) | 0 (0.0%) |
| Education Instruction & Library | 47 (55.9%) | 37 (44.1%) |
| Arts, Media & Entertainment | 0 (0.0%) | 0 (0.0%) |
| Health Diagnosing & Treating | 61 (57.6%) | 45 (42.4%) |
| Health Technologists | 3 (12.5%) | 21 (87.5%) |
| Total (Category) | 176 (54.7%) | 146 (45.3%) |
| Total (Overall) | 519 (56.0%) | 407 (44.0%) |
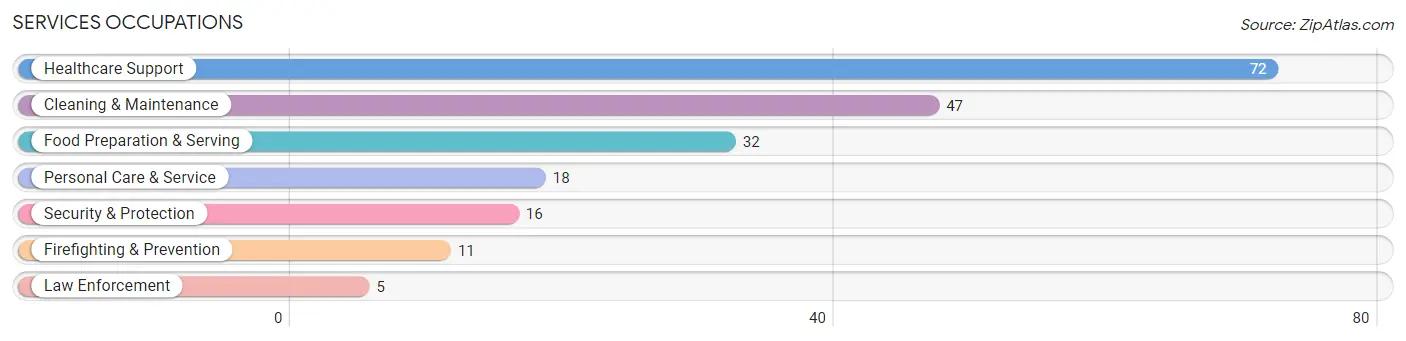
Services Occupations
The most common Services occupations in Blossburg borough are Healthcare Support (72 | 7.8%), Cleaning & Maintenance (47 | 5.1%), Food Preparation & Serving (32 | 3.5%), Personal Care & Service (18 | 1.9%), and Security & Protection (16 | 1.7%).
Services Occupations by Sex
Within the Services occupations in Blossburg borough, the most male-oriented occupations are Law Enforcement (100.0%), Security & Protection (81.2%), and Firefighting & Prevention (72.7%), while the most female-oriented occupations are Healthcare Support (100.0%), Personal Care & Service (100.0%), and Food Preparation & Serving (53.1%).
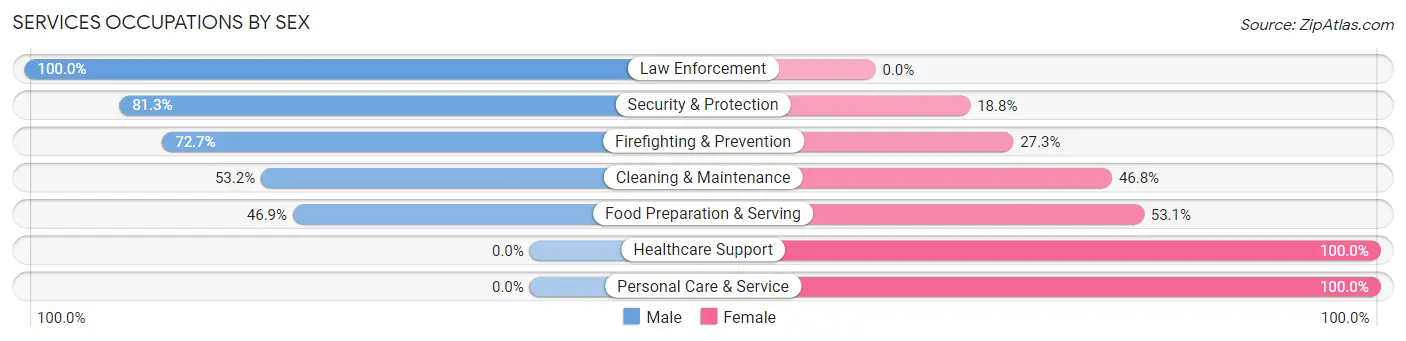
| Occupation | Male | Female |
| Healthcare Support | 0 (0.0%) | 72 (100.0%) |
| Security & Protection | 13 (81.2%) | 3 (18.8%) |
| Firefighting & Prevention | 8 (72.7%) | 3 (27.3%) |
| Law Enforcement | 5 (100.0%) | 0 (0.0%) |
| Food Preparation & Serving | 15 (46.9%) | 17 (53.1%) |
| Cleaning & Maintenance | 25 (53.2%) | 22 (46.8%) |
| Personal Care & Service | 0 (0.0%) | 18 (100.0%) |
| Total (Category) | 53 (28.6%) | 132 (71.4%) |
| Total (Overall) | 519 (56.0%) | 407 (44.0%) |
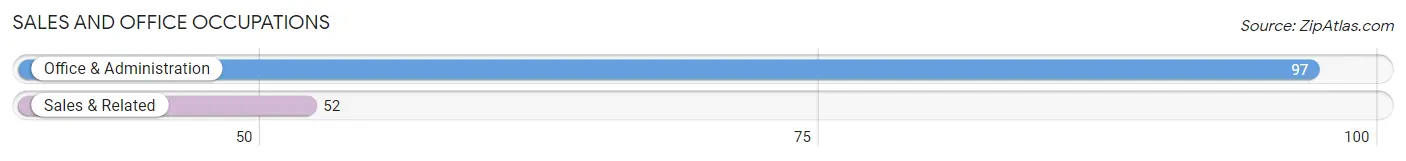
Sales and Office Occupations
The most common Sales and Office occupations in Blossburg borough are Office & Administration (97 | 10.5%), and Sales & Related (52 | 5.6%).
Sales and Office Occupations by Sex
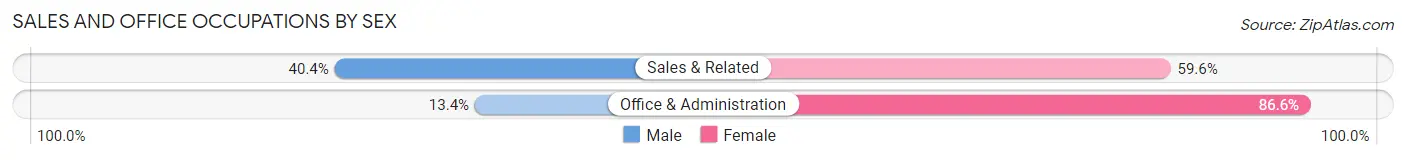
| Occupation | Male | Female |
| Sales & Related | 21 (40.4%) | 31 (59.6%) |
| Office & Administration | 13 (13.4%) | 84 (86.6%) |
| Total (Category) | 34 (22.8%) | 115 (77.2%) |
| Total (Overall) | 519 (56.0%) | 407 (44.0%) |
Natural Resources, Construction and Maintenance Occupations
The most common Natural Resources, Construction and Maintenance occupations in Blossburg borough are Construction & Extraction (96 | 10.4%), Installation, Maintenance & Repair (25 | 2.7%), and Farming, Fishing & Forestry (5 | 0.5%).
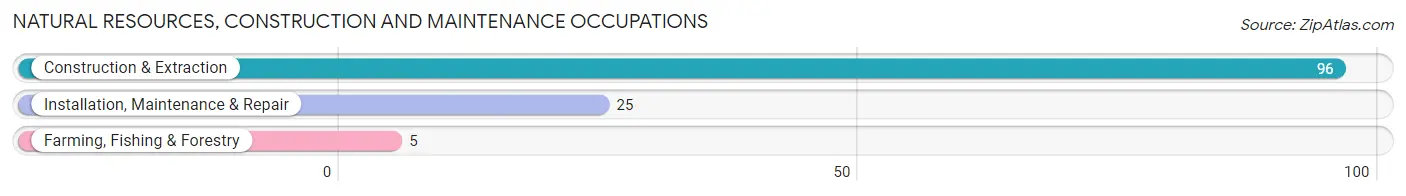
Natural Resources, Construction and Maintenance Occupations by Sex
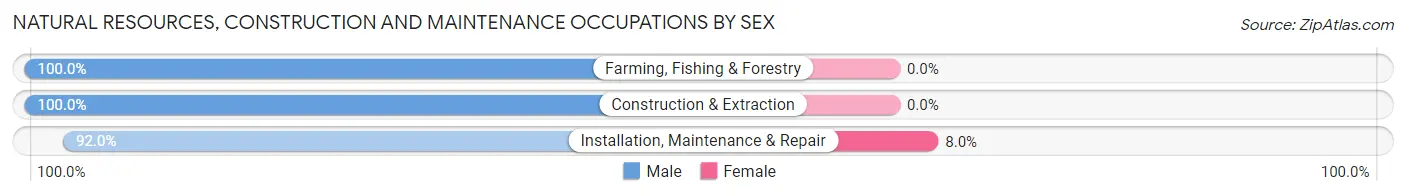
| Occupation | Male | Female |
| Farming, Fishing & Forestry | 5 (100.0%) | 0 (0.0%) |
| Construction & Extraction | 96 (100.0%) | 0 (0.0%) |
| Installation, Maintenance & Repair | 23 (92.0%) | 2 (8.0%) |
| Total (Category) | 124 (98.4%) | 2 (1.6%) |
| Total (Overall) | 519 (56.0%) | 407 (44.0%) |
Production, Transportation and Moving Occupations
The most common Production, Transportation and Moving occupations in Blossburg borough are Material Moving (77 | 8.3%), Transportation (36 | 3.9%), and Production (31 | 3.4%).
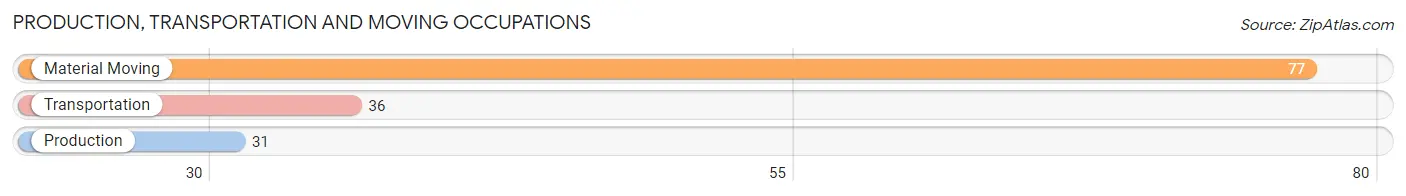
Production, Transportation and Moving Occupations by Sex
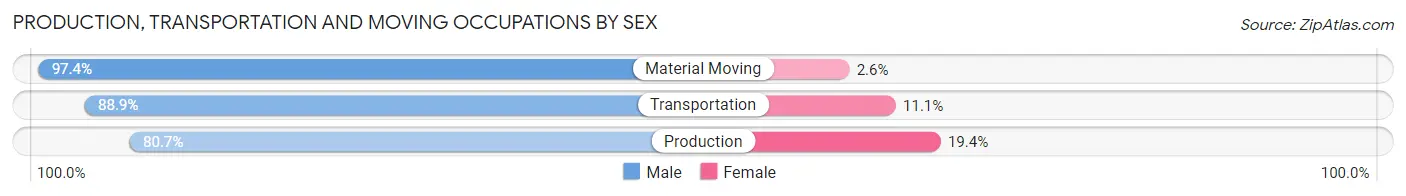
| Occupation | Male | Female |
| Production | 25 (80.6%) | 6 (19.4%) |
| Transportation | 32 (88.9%) | 4 (11.1%) |
| Material Moving | 75 (97.4%) | 2 (2.6%) |
| Total (Category) | 132 (91.7%) | 12 (8.3%) |
| Total (Overall) | 519 (56.0%) | 407 (44.0%) |
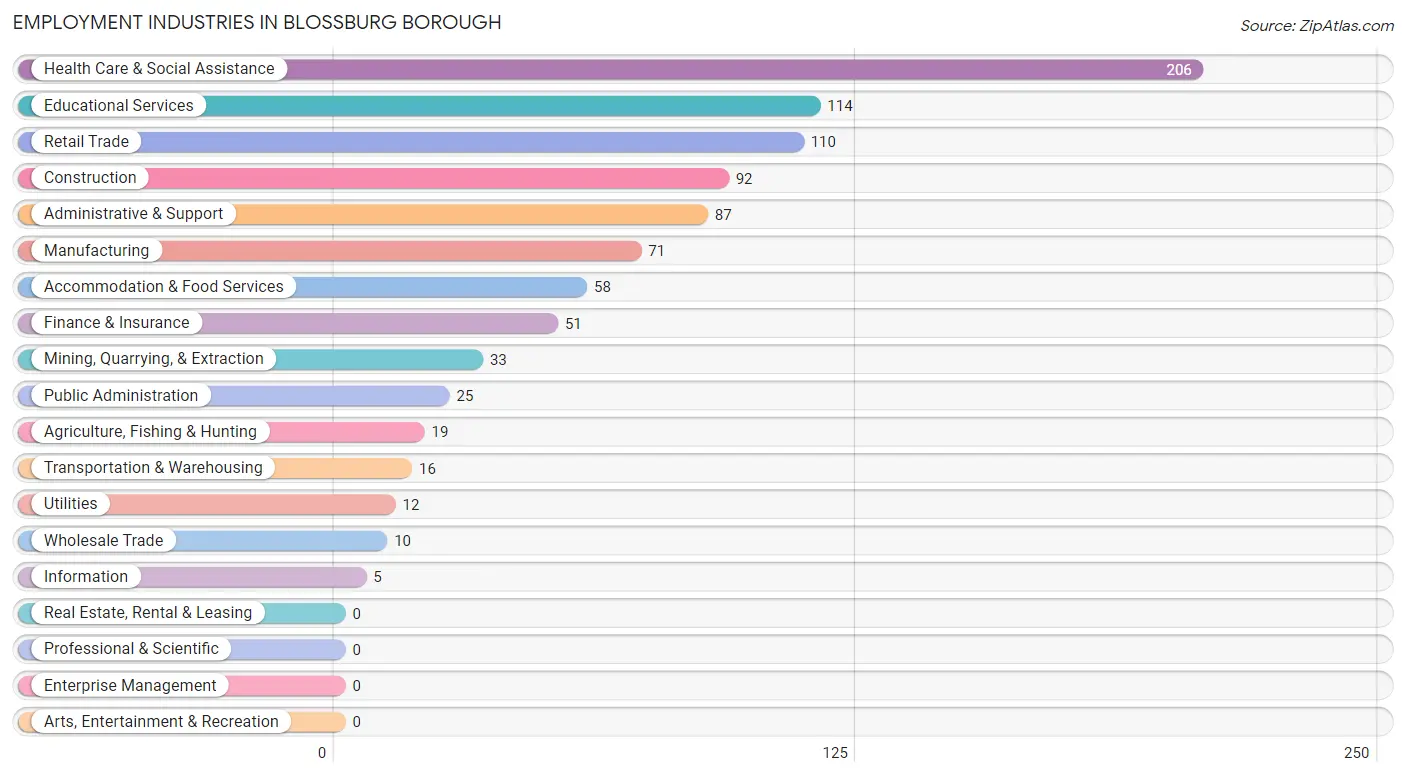
Employment Industries by Sex in Blossburg borough
Employment Industries in Blossburg borough
The major employment industries in Blossburg borough include Health Care & Social Assistance (206 | 22.3%), Educational Services (114 | 12.3%), Retail Trade (110 | 11.9%), Construction (92 | 9.9%), and Administrative & Support (87 | 9.4%).
Employment Industries by Sex in Blossburg borough
The Blossburg borough industries that see more men than women are Agriculture, Fishing & Hunting (100.0%), Mining, Quarrying, & Extraction (100.0%), and Wholesale Trade (100.0%), whereas the industries that tend to have a higher number of women are Information (100.0%), Retail Trade (86.4%), and Accommodation & Food Services (74.1%).
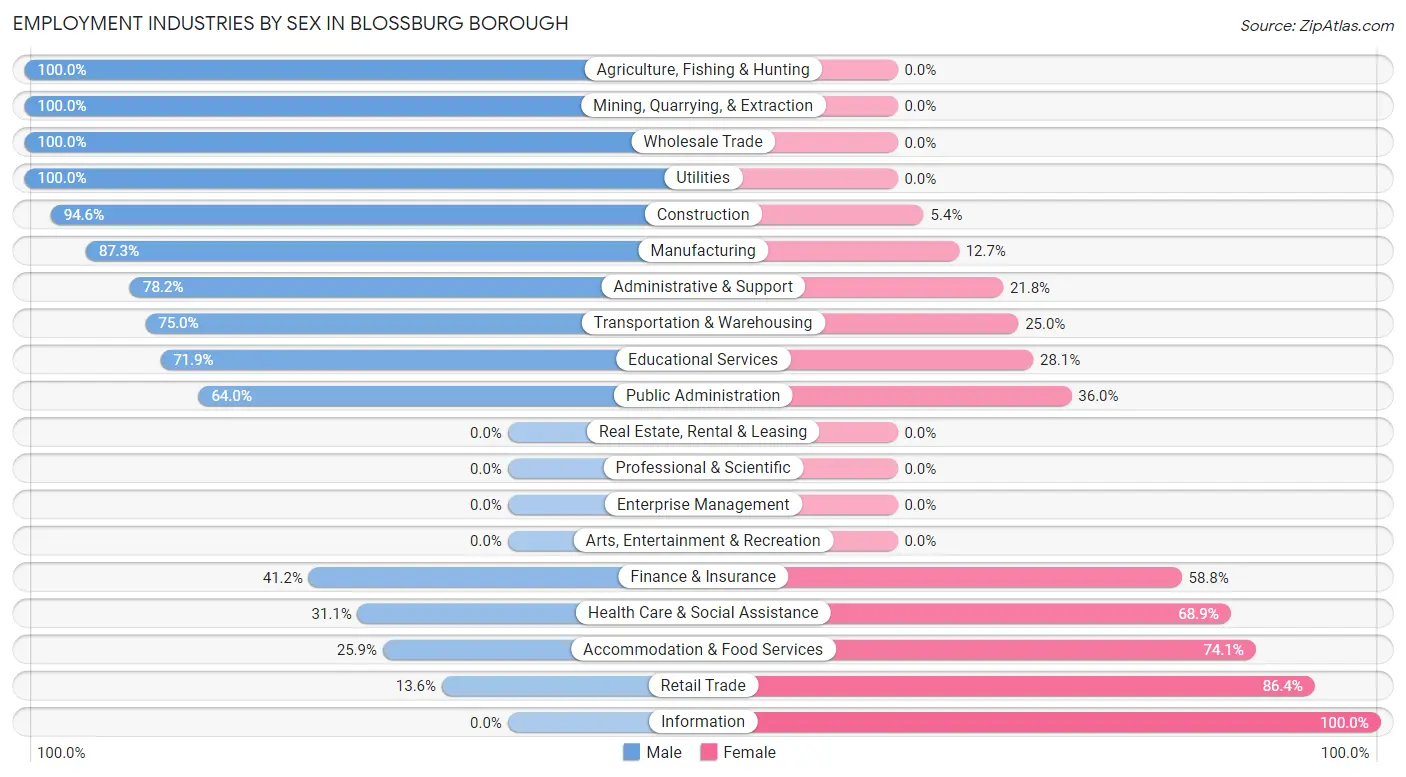
| Industry | Male | Female |
| Agriculture, Fishing & Hunting | 19 (100.0%) | 0 (0.0%) |
| Mining, Quarrying, & Extraction | 33 (100.0%) | 0 (0.0%) |
| Construction | 87 (94.6%) | 5 (5.4%) |
| Manufacturing | 62 (87.3%) | 9 (12.7%) |
| Wholesale Trade | 10 (100.0%) | 0 (0.0%) |
| Retail Trade | 15 (13.6%) | 95 (86.4%) |
| Transportation & Warehousing | 12 (75.0%) | 4 (25.0%) |
| Utilities | 12 (100.0%) | 0 (0.0%) |
| Information | 0 (0.0%) | 5 (100.0%) |
| Finance & Insurance | 21 (41.2%) | 30 (58.8%) |
| Real Estate, Rental & Leasing | 0 (0.0%) | 0 (0.0%) |
| Professional & Scientific | 0 (0.0%) | 0 (0.0%) |
| Enterprise Management | 0 (0.0%) | 0 (0.0%) |
| Administrative & Support | 68 (78.2%) | 19 (21.8%) |
| Educational Services | 82 (71.9%) | 32 (28.1%) |
| Health Care & Social Assistance | 64 (31.1%) | 142 (68.9%) |
| Arts, Entertainment & Recreation | 0 (0.0%) | 0 (0.0%) |
| Accommodation & Food Services | 15 (25.9%) | 43 (74.1%) |
| Public Administration | 16 (64.0%) | 9 (36.0%) |
| Total | 519 (56.0%) | 407 (44.0%) |
Education in Blossburg borough
School Enrollment in Blossburg borough
The most common levels of schooling among the 487 students in Blossburg borough are high school (213 | 43.7%), middle school (104 | 21.4%), and elementary school (77 | 15.8%).
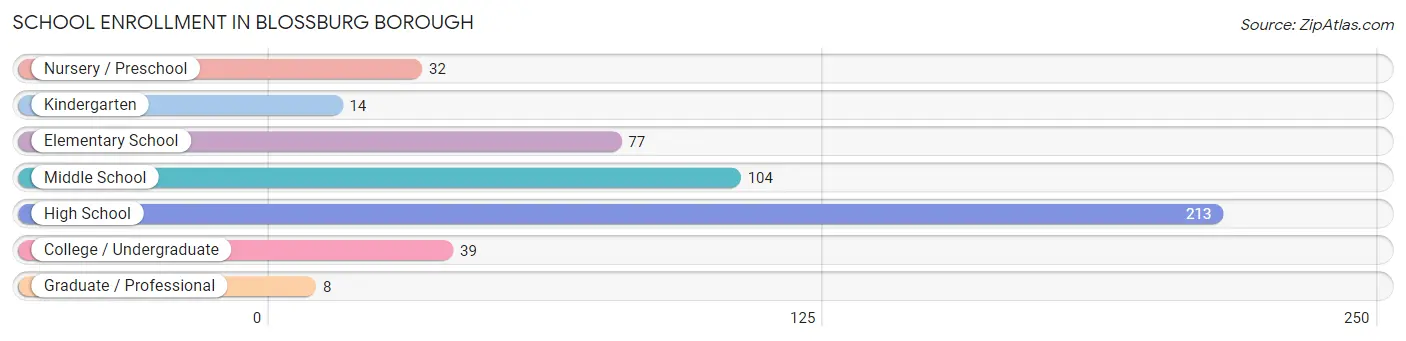
| School Level | # Students | % Students |
| Nursery / Preschool | 32 | 6.6% |
| Kindergarten | 14 | 2.9% |
| Elementary School | 77 | 15.8% |
| Middle School | 104 | 21.4% |
| High School | 213 | 43.7% |
| College / Undergraduate | 39 | 8.0% |
| Graduate / Professional | 8 | 1.6% |
| Total | 487 | 100.0% |
School Enrollment by Age by Funding Source in Blossburg borough
Out of a total of 487 students who are enrolled in schools in Blossburg borough, 58 (11.9%) attend a private institution, while the remaining 429 (88.1%) are enrolled in public schools. The age group of 25 to 34 year olds has the highest likelihood of being enrolled in private schools, with 14 (82.4% in the age bracket) enrolled. Conversely, the age group of 3 to 4 year olds has the lowest likelihood of being enrolled in a private school, with 24 (100.0% in the age bracket) attending a public institution.
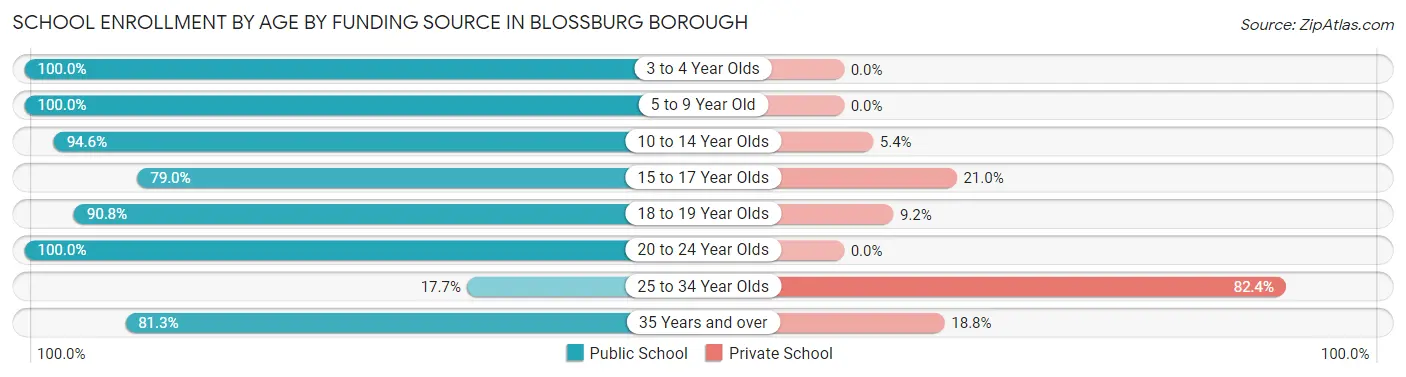
| Age Bracket | Public School | Private School |
| 3 to 4 Year Olds | 24 (100.0%) | 0 (0.0%) |
| 5 to 9 Year Old | 79 (100.0%) | 0 (0.0%) |
| 10 to 14 Year Olds | 122 (94.6%) | 7 (5.4%) |
| 15 to 17 Year Olds | 94 (79.0%) | 25 (21.0%) |
| 18 to 19 Year Olds | 89 (90.8%) | 9 (9.2%) |
| 20 to 24 Year Olds | 5 (100.0%) | 0 (0.0%) |
| 25 to 34 Year Olds | 3 (17.6%) | 14 (82.4%) |
| 35 Years and over | 13 (81.2%) | 3 (18.8%) |
| Total | 429 (88.1%) | 58 (11.9%) |
Educational Attainment by Field of Study in Blossburg borough
Science & technology (75 | 20.3%), education (57 | 15.4%), business (50 | 13.6%), arts & humanities (39 | 10.6%), and liberal arts & history (33 | 8.9%) are the most common fields of study among 369 individuals in Blossburg borough who have obtained a bachelor's degree or higher.
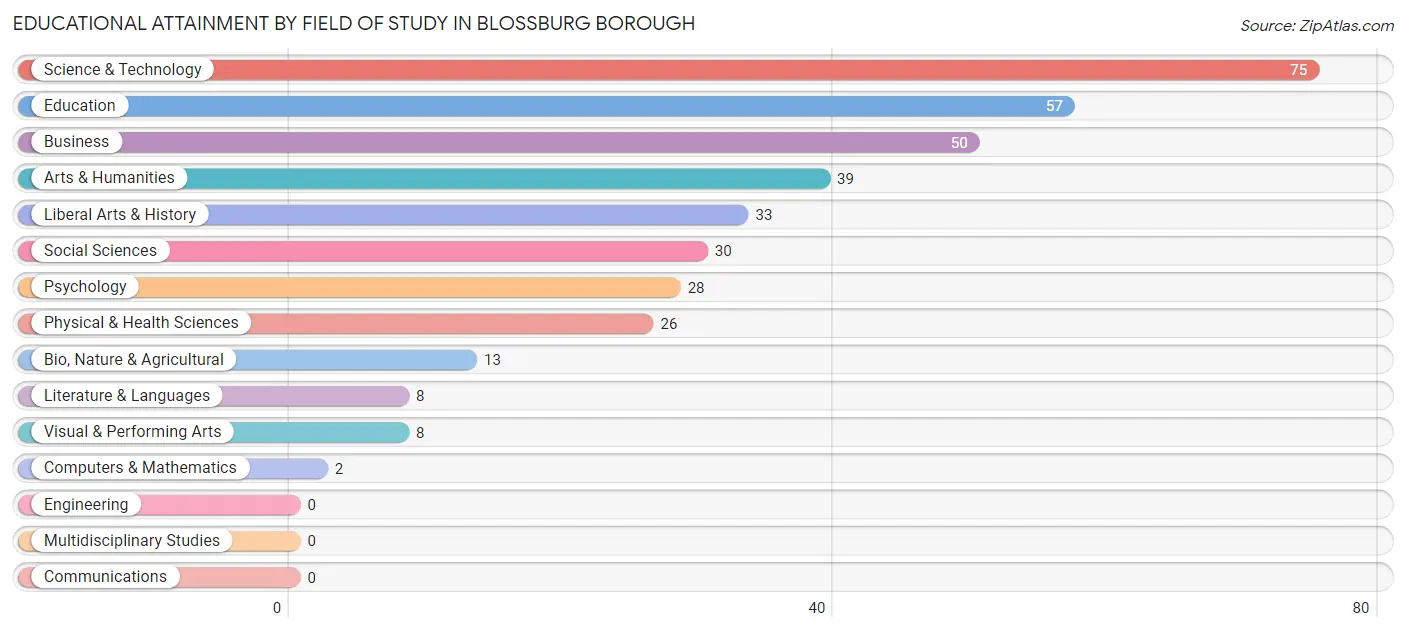
| Field of Study | # Graduates | % Graduates |
| Computers & Mathematics | 2 | 0.5% |
| Bio, Nature & Agricultural | 13 | 3.5% |
| Physical & Health Sciences | 26 | 7.0% |
| Psychology | 28 | 7.6% |
| Social Sciences | 30 | 8.1% |
| Engineering | 0 | 0.0% |
| Multidisciplinary Studies | 0 | 0.0% |
| Science & Technology | 75 | 20.3% |
| Business | 50 | 13.6% |
| Education | 57 | 15.4% |
| Literature & Languages | 8 | 2.2% |
| Liberal Arts & History | 33 | 8.9% |
| Visual & Performing Arts | 8 | 2.2% |
| Communications | 0 | 0.0% |
| Arts & Humanities | 39 | 10.6% |
| Total | 369 | 100.0% |
Transportation & Commute in Blossburg borough
Vehicle Availability by Sex in Blossburg borough
The most prevalent vehicle ownership categories in Blossburg borough are males with 2 vehicles (218, accounting for 42.0%) and females with 2 vehicles (184, making up 55.6%).
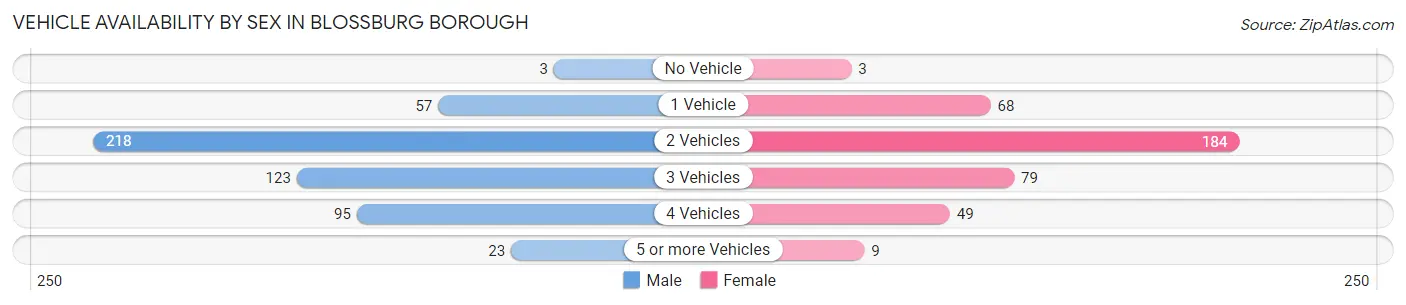
| Vehicles Available | Male | Female |
| No Vehicle | 3 (0.6%) | 3 (0.8%) |
| 1 Vehicle | 57 (11.0%) | 68 (17.3%) |
| 2 Vehicles | 218 (42.0%) | 184 (46.9%) |
| 3 Vehicles | 123 (23.7%) | 79 (20.2%) |
| 4 Vehicles | 95 (18.3%) | 49 (12.5%) |
| 5 or more Vehicles | 23 (4.4%) | 9 (2.3%) |
| Total | 519 (100.0%) | 392 (100.0%) |
Commute Time in Blossburg borough
The most frequently occuring commute durations in Blossburg borough are 10 to 14 minutes (216 commuters, 24.0%), 30 to 34 minutes (129 commuters, 14.3%), and 20 to 24 minutes (117 commuters, 13.0%).
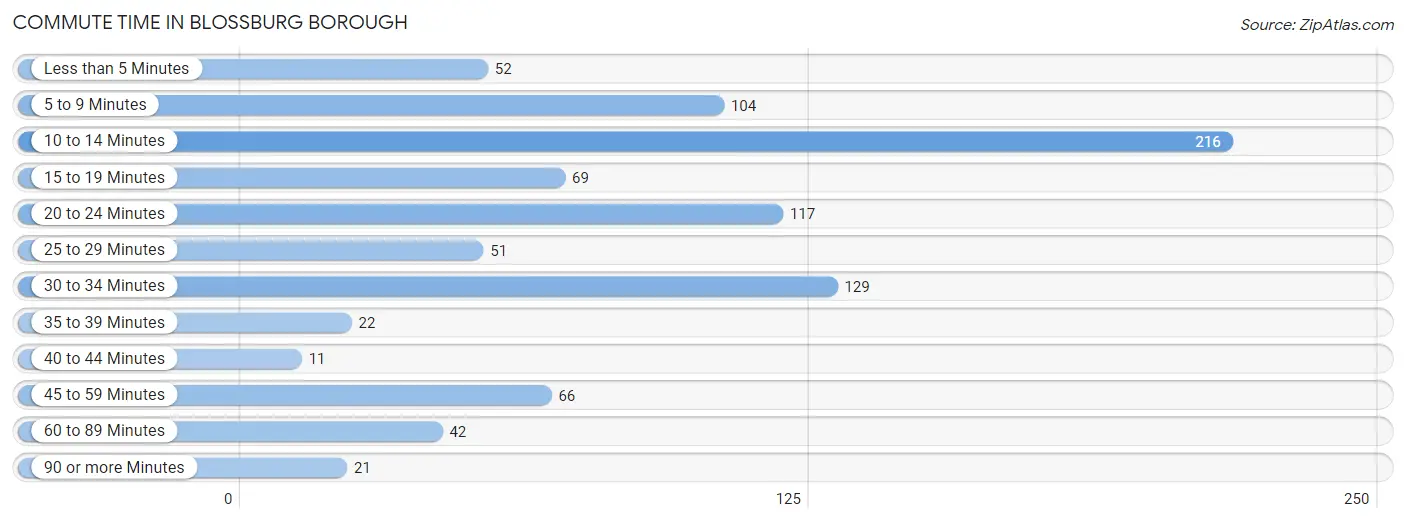
| Commute Time | # Commuters | % Commuters |
| Less than 5 Minutes | 52 | 5.8% |
| 5 to 9 Minutes | 104 | 11.6% |
| 10 to 14 Minutes | 216 | 24.0% |
| 15 to 19 Minutes | 69 | 7.7% |
| 20 to 24 Minutes | 117 | 13.0% |
| 25 to 29 Minutes | 51 | 5.7% |
| 30 to 34 Minutes | 129 | 14.3% |
| 35 to 39 Minutes | 22 | 2.4% |
| 40 to 44 Minutes | 11 | 1.2% |
| 45 to 59 Minutes | 66 | 7.3% |
| 60 to 89 Minutes | 42 | 4.7% |
| 90 or more Minutes | 21 | 2.3% |
Commute Time by Sex in Blossburg borough
The most common commute times in Blossburg borough are 10 to 14 minutes (125 commuters, 24.1%) for males and 10 to 14 minutes (91 commuters, 23.9%) for females.
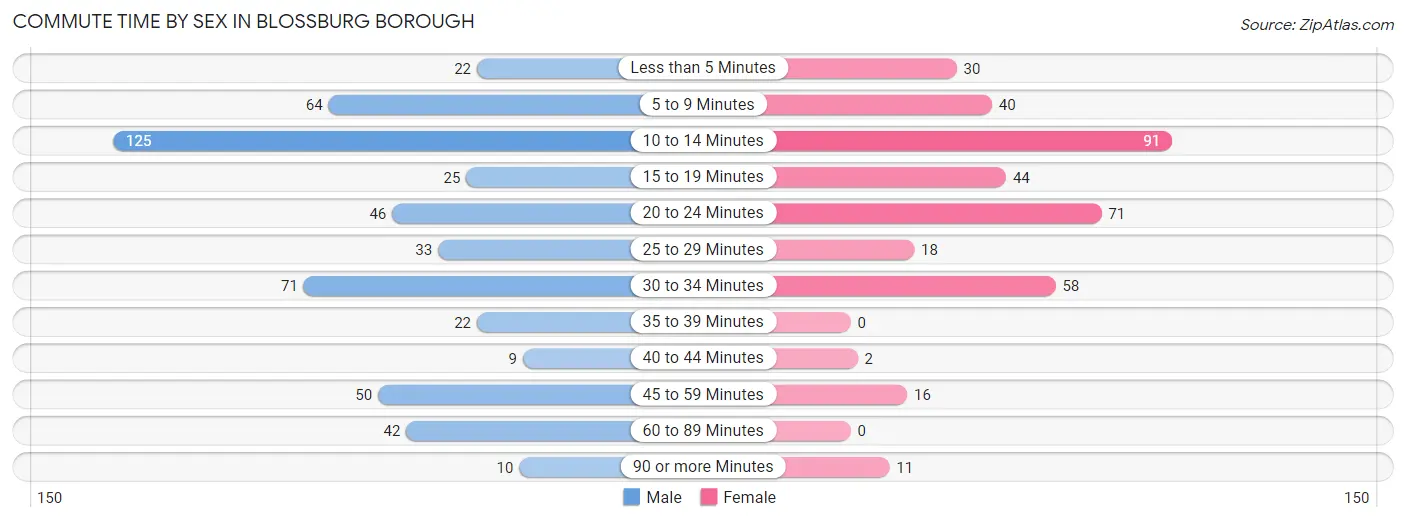
| Commute Time | Male | Female |
| Less than 5 Minutes | 22 (4.2%) | 30 (7.9%) |
| 5 to 9 Minutes | 64 (12.3%) | 40 (10.5%) |
| 10 to 14 Minutes | 125 (24.1%) | 91 (23.9%) |
| 15 to 19 Minutes | 25 (4.8%) | 44 (11.6%) |
| 20 to 24 Minutes | 46 (8.9%) | 71 (18.6%) |
| 25 to 29 Minutes | 33 (6.4%) | 18 (4.7%) |
| 30 to 34 Minutes | 71 (13.7%) | 58 (15.2%) |
| 35 to 39 Minutes | 22 (4.2%) | 0 (0.0%) |
| 40 to 44 Minutes | 9 (1.7%) | 2 (0.5%) |
| 45 to 59 Minutes | 50 (9.6%) | 16 (4.2%) |
| 60 to 89 Minutes | 42 (8.1%) | 0 (0.0%) |
| 90 or more Minutes | 10 (1.9%) | 11 (2.9%) |
Time of Departure to Work by Sex in Blossburg borough
The most frequent times of departure to work in Blossburg borough are 5:00 AM to 5:29 AM (106, 20.4%) for males and 7:30 AM to 7:59 AM (96, 25.2%) for females.
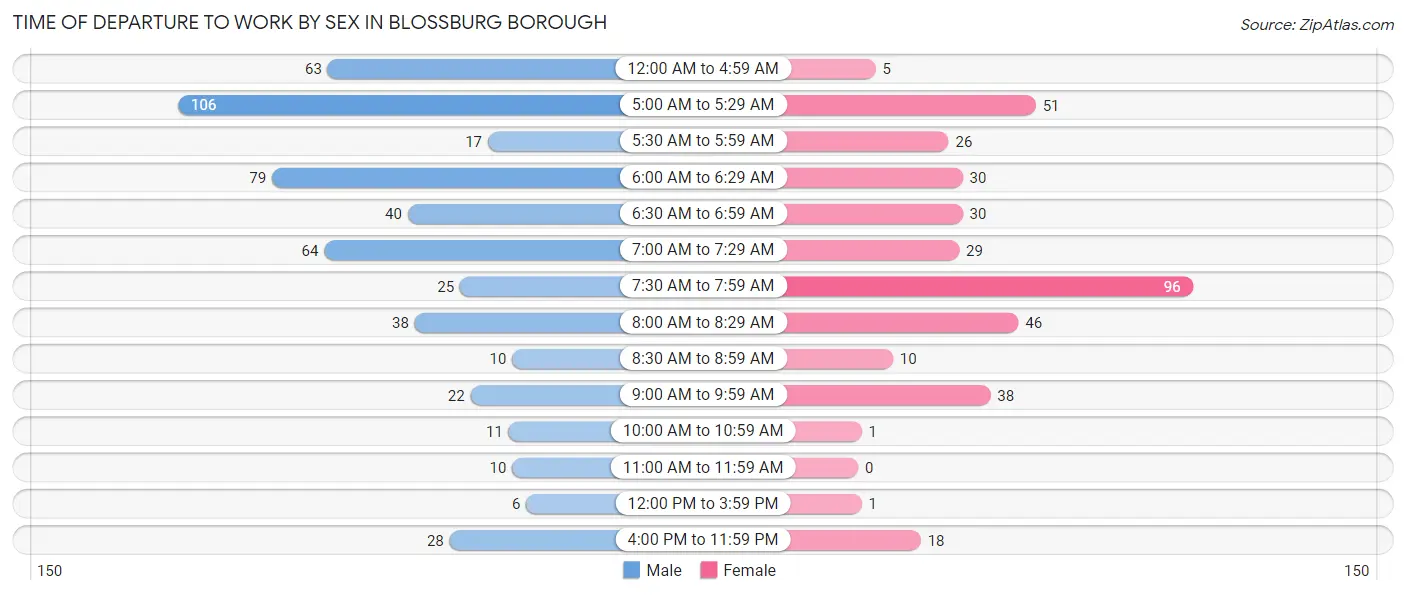
| Time of Departure | Male | Female |
| 12:00 AM to 4:59 AM | 63 (12.1%) | 5 (1.3%) |
| 5:00 AM to 5:29 AM | 106 (20.4%) | 51 (13.4%) |
| 5:30 AM to 5:59 AM | 17 (3.3%) | 26 (6.8%) |
| 6:00 AM to 6:29 AM | 79 (15.2%) | 30 (7.9%) |
| 6:30 AM to 6:59 AM | 40 (7.7%) | 30 (7.9%) |
| 7:00 AM to 7:29 AM | 64 (12.3%) | 29 (7.6%) |
| 7:30 AM to 7:59 AM | 25 (4.8%) | 96 (25.2%) |
| 8:00 AM to 8:29 AM | 38 (7.3%) | 46 (12.1%) |
| 8:30 AM to 8:59 AM | 10 (1.9%) | 10 (2.6%) |
| 9:00 AM to 9:59 AM | 22 (4.2%) | 38 (10.0%) |
| 10:00 AM to 10:59 AM | 11 (2.1%) | 1 (0.3%) |
| 11:00 AM to 11:59 AM | 10 (1.9%) | 0 (0.0%) |
| 12:00 PM to 3:59 PM | 6 (1.2%) | 1 (0.3%) |
| 4:00 PM to 11:59 PM | 28 (5.4%) | 18 (4.7%) |
| Total | 519 (100.0%) | 381 (100.0%) |
Housing Occupancy in Blossburg borough
Occupancy by Ownership in Blossburg borough
Of the total 649 dwellings in Blossburg borough, owner-occupied units account for 451 (69.5%), while renter-occupied units make up 198 (30.5%).
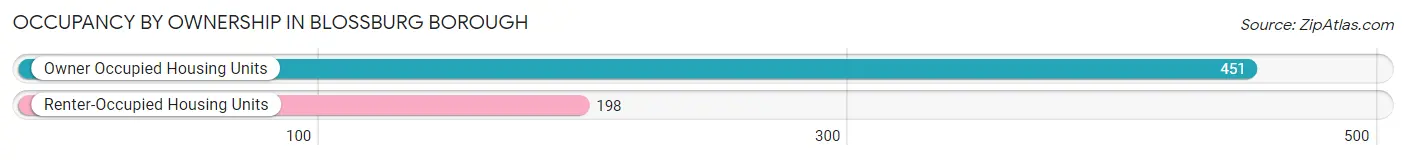
| Occupancy | # Housing Units | % Housing Units |
| Owner Occupied Housing Units | 451 | 69.5% |
| Renter-Occupied Housing Units | 198 | 30.5% |
| Total Occupied Housing Units | 649 | 100.0% |
Occupancy by Household Size in Blossburg borough
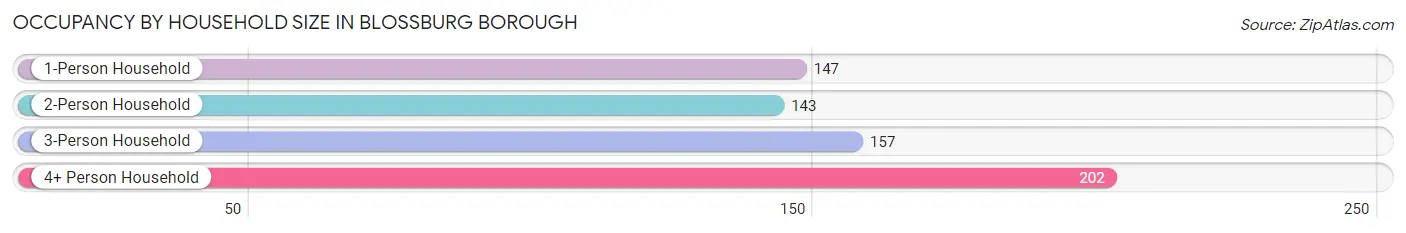
| Household Size | # Housing Units | % Housing Units |
| 1-Person Household | 147 | 22.7% |
| 2-Person Household | 143 | 22.0% |
| 3-Person Household | 157 | 24.2% |
| 4+ Person Household | 202 | 31.1% |
| Total Housing Units | 649 | 100.0% |
Occupancy by Ownership by Household Size in Blossburg borough
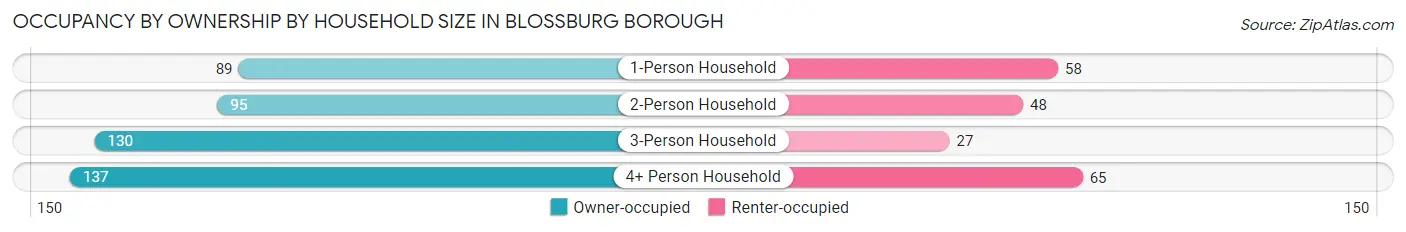
| Household Size | Owner-occupied | Renter-occupied |
| 1-Person Household | 89 (60.5%) | 58 (39.5%) |
| 2-Person Household | 95 (66.4%) | 48 (33.6%) |
| 3-Person Household | 130 (82.8%) | 27 (17.2%) |
| 4+ Person Household | 137 (67.8%) | 65 (32.2%) |
| Total Housing Units | 451 (69.5%) | 198 (30.5%) |
Occupancy by Educational Attainment in Blossburg borough
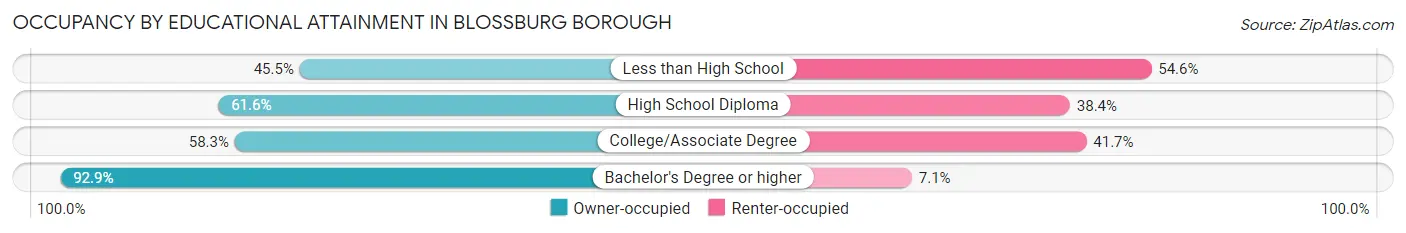
| Household Size | Owner-occupied | Renter-occupied |
| Less than High School | 15 (45.5%) | 18 (54.5%) |
| High School Diploma | 154 (61.6%) | 96 (38.4%) |
| College/Associate Degree | 98 (58.3%) | 70 (41.7%) |
| Bachelor's Degree or higher | 184 (92.9%) | 14 (7.1%) |
Occupancy by Age of Householder in Blossburg borough
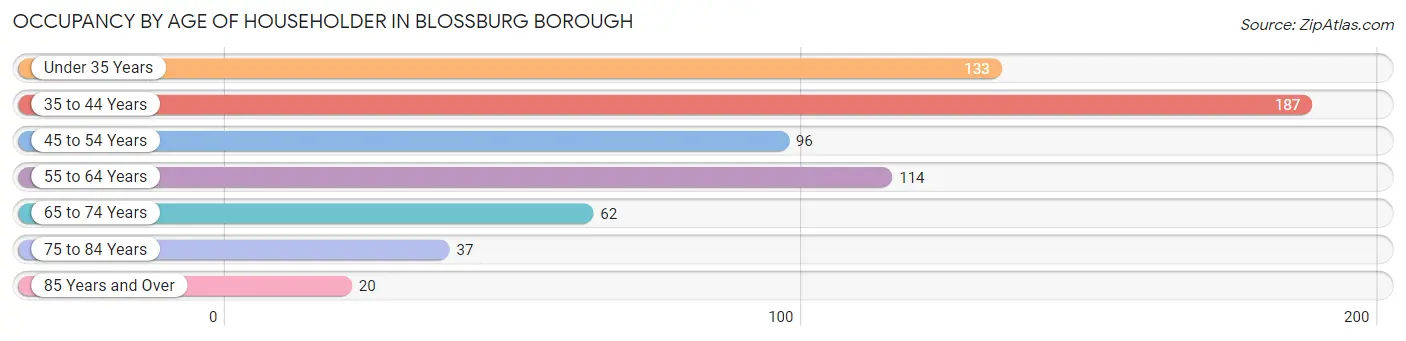
| Age Bracket | # Households | % Households |
| Under 35 Years | 133 | 20.5% |
| 35 to 44 Years | 187 | 28.8% |
| 45 to 54 Years | 96 | 14.8% |
| 55 to 64 Years | 114 | 17.6% |
| 65 to 74 Years | 62 | 9.6% |
| 75 to 84 Years | 37 | 5.7% |
| 85 Years and Over | 20 | 3.1% |
| Total | 649 | 100.0% |
Housing Finances in Blossburg borough
Median Income by Occupancy in Blossburg borough
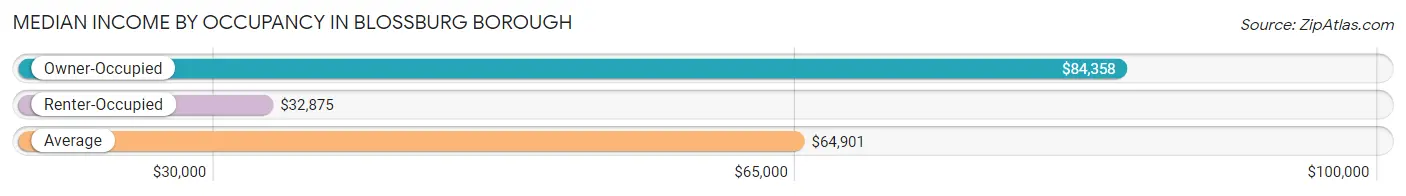
| Occupancy Type | # Households | Median Income |
| Owner-Occupied | 451 (69.5%) | $84,358 |
| Renter-Occupied | 198 (30.5%) | $32,875 |
| Average | 649 (100.0%) | $64,901 |
Occupancy by Householder Income Bracket in Blossburg borough
| Income Bracket | Owner-occupied | Renter-occupied |
| Less than $5,000 | 0 (0.0%) | 0 (0.0%) |
| $5,000 to $9,999 | 15 (3.3%) | 17 (8.6%) |
| $10,000 to $14,999 | 14 (3.1%) | 17 (8.6%) |
| $15,000 to $19,999 | 20 (4.4%) | 16 (8.1%) |
| $20,000 to $24,999 | 2 (0.4%) | 16 (8.1%) |
| $25,000 to $34,999 | 16 (3.5%) | 50 (25.3%) |
| $35,000 to $49,999 | 40 (8.9%) | 7 (3.5%) |
| $50,000 to $74,999 | 69 (15.3%) | 55 (27.8%) |
| $75,000 to $99,999 | 88 (19.5%) | 7 (3.5%) |
| $100,000 to $149,999 | 133 (29.5%) | 13 (6.6%) |
| $150,000 or more | 54 (12.0%) | 0 (0.0%) |
| Total | 451 (100.0%) | 198 (100.0%) |
Monthly Housing Cost Tiers in Blossburg borough
| Monthly Cost | Owner-occupied | Renter-occupied |
| Less than $300 | 9 (2.0%) | 28 (14.1%) |
| $300 to $499 | 58 (12.9%) | 13 (6.6%) |
| $500 to $799 | 84 (18.6%) | 30 (15.1%) |
| $800 to $999 | 40 (8.9%) | 52 (26.3%) |
| $1,000 to $1,499 | 204 (45.2%) | 64 (32.3%) |
| $1,500 to $1,999 | 28 (6.2%) | 9 (4.5%) |
| $2,000 to $2,499 | 13 (2.9%) | 0 (0.0%) |
| $2,500 to $2,999 | 7 (1.5%) | 0 (0.0%) |
| $3,000 or more | 8 (1.8%) | 0 (0.0%) |
| Total | 451 (100.0%) | 198 (100.0%) |
Physical Housing Characteristics in Blossburg borough
Housing Structures in Blossburg borough
| Structure Type | # Housing Units | % Housing Units |
| Single Unit, Detached | 497 | 76.6% |
| Single Unit, Attached | 0 | 0.0% |
| 2 Unit Apartments | 55 | 8.5% |
| 3 or 4 Unit Apartments | 23 | 3.5% |
| 5 to 9 Unit Apartments | 26 | 4.0% |
| 10 or more Apartments | 10 | 1.5% |
| Mobile Home / Other | 38 | 5.9% |
| Total | 649 | 100.0% |
Housing Structures by Occupancy in Blossburg borough
| Structure Type | Owner-occupied | Renter-occupied |
| Single Unit, Detached | 411 (82.7%) | 86 (17.3%) |
| Single Unit, Attached | 0 (0.0%) | 0 (0.0%) |
| 2 Unit Apartments | 6 (10.9%) | 49 (89.1%) |
| 3 or 4 Unit Apartments | 0 (0.0%) | 23 (100.0%) |
| 5 to 9 Unit Apartments | 0 (0.0%) | 26 (100.0%) |
| 10 or more Apartments | 0 (0.0%) | 10 (100.0%) |
| Mobile Home / Other | 34 (89.5%) | 4 (10.5%) |
| Total | 451 (69.5%) | 198 (30.5%) |
Housing Structures by Number of Rooms in Blossburg borough
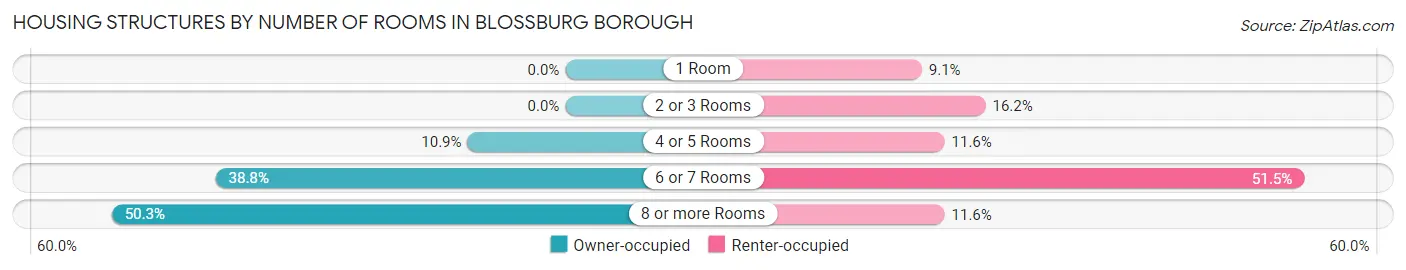
| Number of Rooms | Owner-occupied | Renter-occupied |
| 1 Room | 0 (0.0%) | 18 (9.1%) |
| 2 or 3 Rooms | 0 (0.0%) | 32 (16.2%) |
| 4 or 5 Rooms | 49 (10.9%) | 23 (11.6%) |
| 6 or 7 Rooms | 175 (38.8%) | 102 (51.5%) |
| 8 or more Rooms | 227 (50.3%) | 23 (11.6%) |
| Total | 451 (100.0%) | 198 (100.0%) |
Housing Structure by Heating Type in Blossburg borough
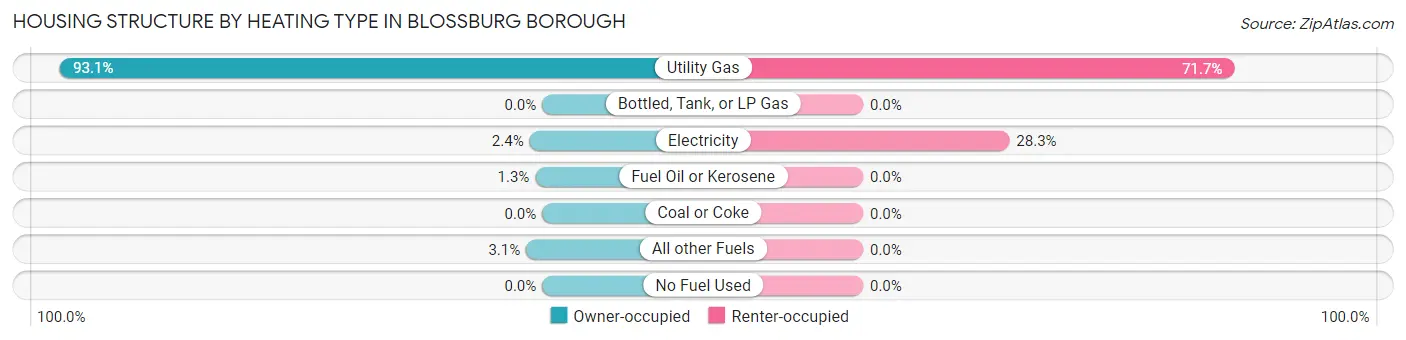
| Heating Type | Owner-occupied | Renter-occupied |
| Utility Gas | 420 (93.1%) | 142 (71.7%) |
| Bottled, Tank, or LP Gas | 0 (0.0%) | 0 (0.0%) |
| Electricity | 11 (2.4%) | 56 (28.3%) |
| Fuel Oil or Kerosene | 6 (1.3%) | 0 (0.0%) |
| Coal or Coke | 0 (0.0%) | 0 (0.0%) |
| All other Fuels | 14 (3.1%) | 0 (0.0%) |
| No Fuel Used | 0 (0.0%) | 0 (0.0%) |
| Total | 451 (100.0%) | 198 (100.0%) |
Household Vehicle Usage in Blossburg borough
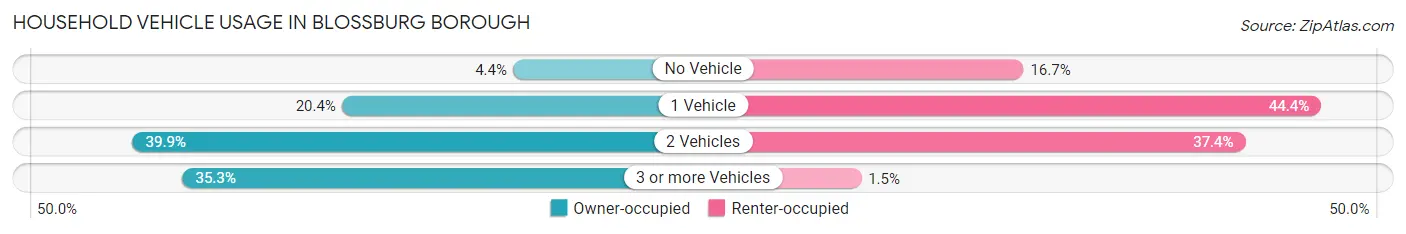
| Vehicles per Household | Owner-occupied | Renter-occupied |
| No Vehicle | 20 (4.4%) | 33 (16.7%) |
| 1 Vehicle | 92 (20.4%) | 88 (44.4%) |
| 2 Vehicles | 180 (39.9%) | 74 (37.4%) |
| 3 or more Vehicles | 159 (35.2%) | 3 (1.5%) |
| Total | 451 (100.0%) | 198 (100.0%) |
Real Estate & Mortgages in Blossburg borough
Real Estate and Mortgage Overview in Blossburg borough
| Characteristic | Without Mortgage | With Mortgage |
| Housing Units | 157 | 294 |
| Median Property Value | $131,000 | $143,800 |
| Median Household Income | $55,208 | $45 |
| Monthly Housing Costs | $529 | $8 |
| Real Estate Taxes | $1,911 | $9 |
Property Value by Mortgage Status in Blossburg borough
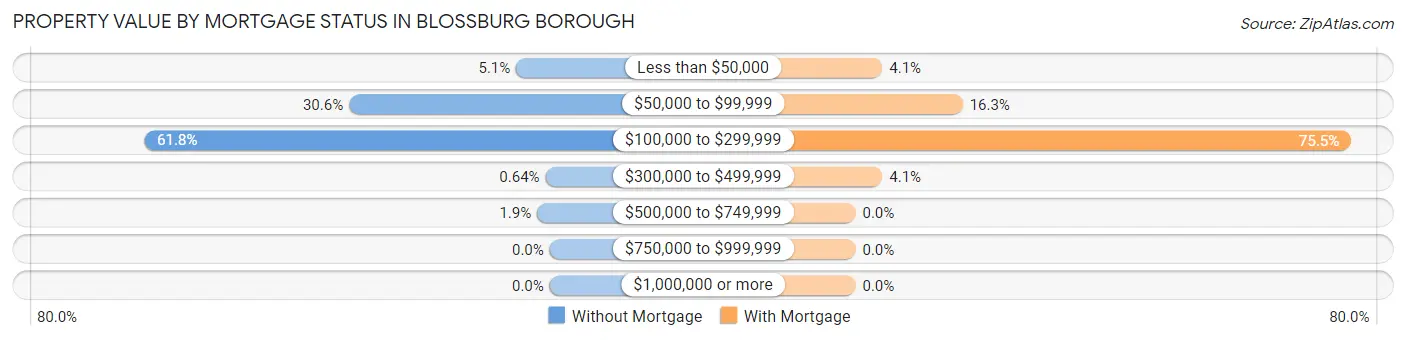
| Property Value | Without Mortgage | With Mortgage |
| Less than $50,000 | 8 (5.1%) | 12 (4.1%) |
| $50,000 to $99,999 | 48 (30.6%) | 48 (16.3%) |
| $100,000 to $299,999 | 97 (61.8%) | 222 (75.5%) |
| $300,000 to $499,999 | 1 (0.6%) | 12 (4.1%) |
| $500,000 to $749,999 | 3 (1.9%) | 0 (0.0%) |
| $750,000 to $999,999 | 0 (0.0%) | 0 (0.0%) |
| $1,000,000 or more | 0 (0.0%) | 0 (0.0%) |
| Total | 157 (100.0%) | 294 (100.0%) |
Household Income by Mortgage Status in Blossburg borough
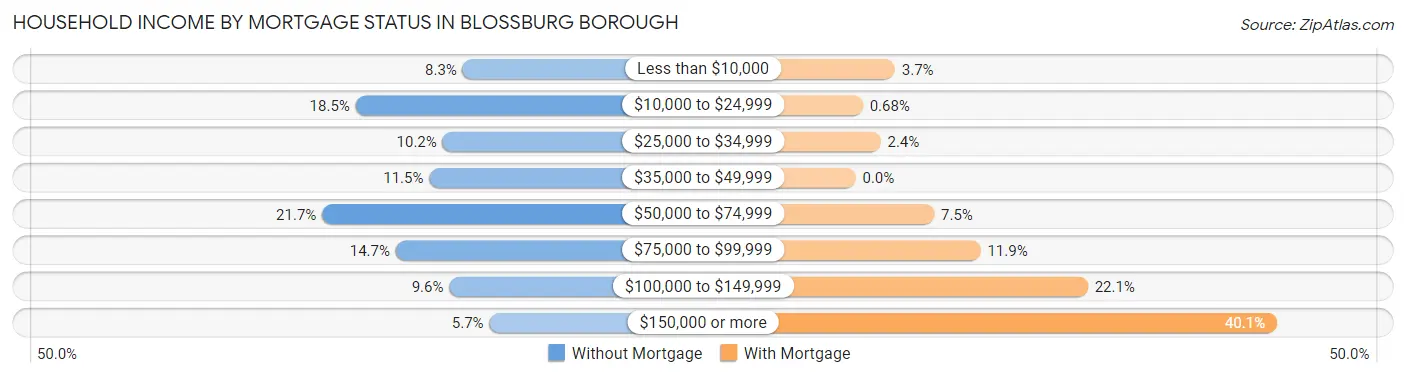
| Household Income | Without Mortgage | With Mortgage |
| Less than $10,000 | 13 (8.3%) | 11 (3.7%) |
| $10,000 to $24,999 | 29 (18.5%) | 2 (0.7%) |
| $25,000 to $34,999 | 16 (10.2%) | 7 (2.4%) |
| $35,000 to $49,999 | 18 (11.5%) | 0 (0.0%) |
| $50,000 to $74,999 | 34 (21.7%) | 22 (7.5%) |
| $75,000 to $99,999 | 23 (14.6%) | 35 (11.9%) |
| $100,000 to $149,999 | 15 (9.6%) | 65 (22.1%) |
| $150,000 or more | 9 (5.7%) | 118 (40.1%) |
| Total | 157 (100.0%) | 294 (100.0%) |
Property Value to Household Income Ratio in Blossburg borough
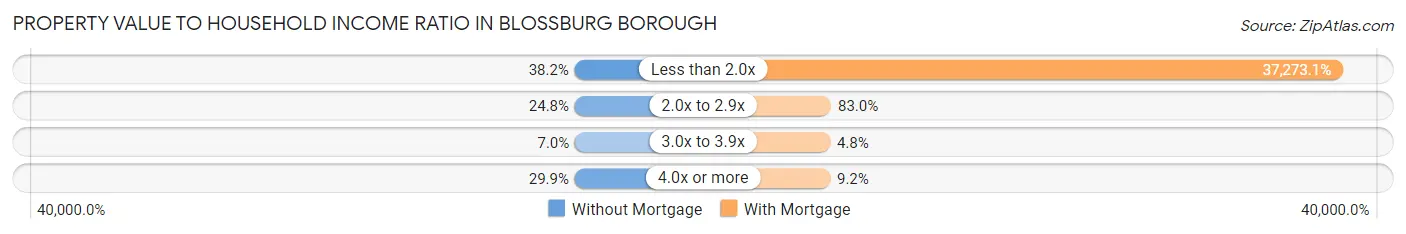
| Value-to-Income Ratio | Without Mortgage | With Mortgage |
| Less than 2.0x | 60 (38.2%) | 109,583 (37,273.1%) |
| 2.0x to 2.9x | 39 (24.8%) | 244 (83.0%) |
| 3.0x to 3.9x | 11 (7.0%) | 14 (4.8%) |
| 4.0x or more | 47 (29.9%) | 27 (9.2%) |
| Total | 157 (100.0%) | 294 (100.0%) |
Real Estate Taxes by Mortgage Status in Blossburg borough
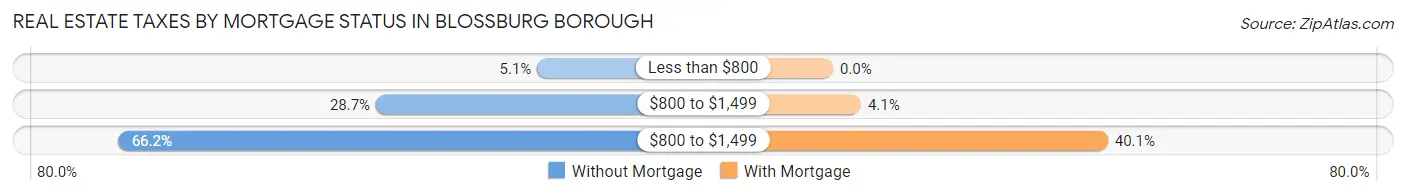
| Property Taxes | Without Mortgage | With Mortgage |
| Less than $800 | 8 (5.1%) | 0 (0.0%) |
| $800 to $1,499 | 45 (28.7%) | 12 (4.1%) |
| $800 to $1,499 | 104 (66.2%) | 118 (40.1%) |
| Total | 157 (100.0%) | 294 (100.0%) |
Health & Disability in Blossburg borough
Health Insurance Coverage by Age in Blossburg borough
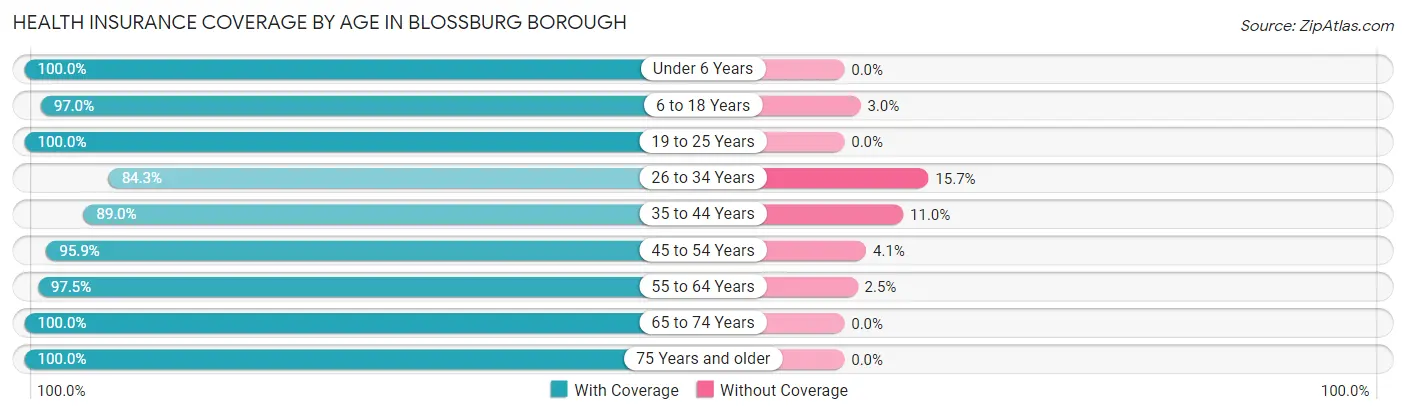
| Age Bracket | With Coverage | Without Coverage |
| Under 6 Years | 111 (100.0%) | 0 (0.0%) |
| 6 to 18 Years | 321 (97.0%) | 10 (3.0%) |
| 19 to 25 Years | 237 (100.0%) | 0 (0.0%) |
| 26 to 34 Years | 129 (84.3%) | 24 (15.7%) |
| 35 to 44 Years | 284 (89.0%) | 35 (11.0%) |
| 45 to 54 Years | 259 (95.9%) | 11 (4.1%) |
| 55 to 64 Years | 197 (97.5%) | 5 (2.5%) |
| 65 to 74 Years | 88 (100.0%) | 0 (0.0%) |
| 75 Years and older | 115 (100.0%) | 0 (0.0%) |
| Total | 1,741 (95.4%) | 85 (4.6%) |
Health Insurance Coverage by Citizenship Status in Blossburg borough
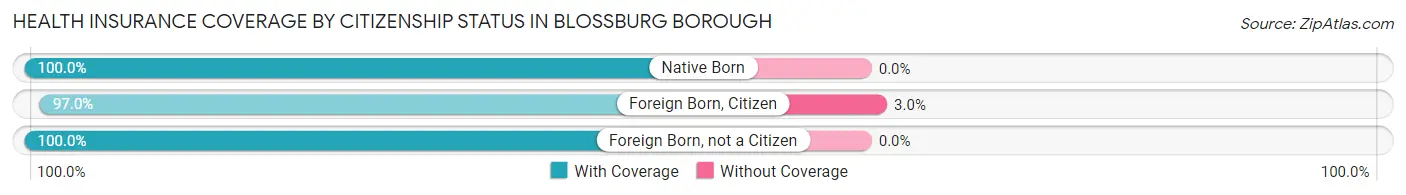
| Citizenship Status | With Coverage | Without Coverage |
| Native Born | 111 (100.0%) | 0 (0.0%) |
| Foreign Born, Citizen | 321 (97.0%) | 10 (3.0%) |
| Foreign Born, not a Citizen | 237 (100.0%) | 0 (0.0%) |
Health Insurance Coverage by Household Income in Blossburg borough
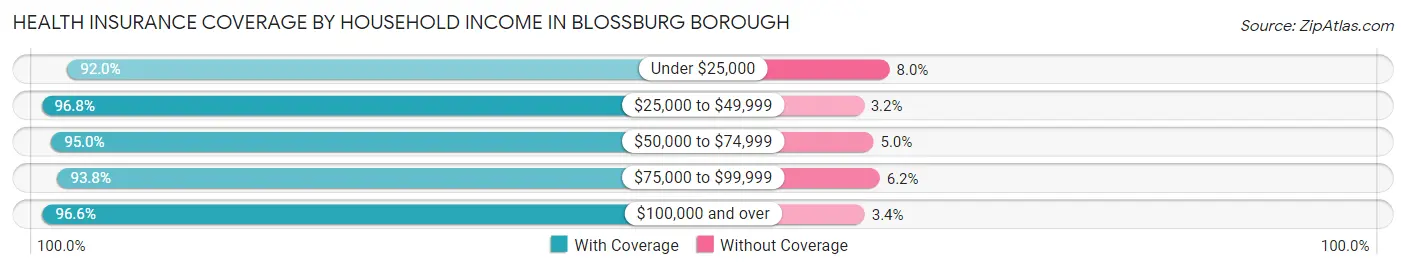
| Household Income | With Coverage | Without Coverage |
| Under $25,000 | 195 (92.0%) | 17 (8.0%) |
| $25,000 to $49,999 | 214 (96.8%) | 7 (3.2%) |
| $50,000 to $74,999 | 379 (95.0%) | 20 (5.0%) |
| $75,000 to $99,999 | 258 (93.8%) | 17 (6.2%) |
| $100,000 and over | 688 (96.6%) | 24 (3.4%) |
Public vs Private Health Insurance Coverage by Age in Blossburg borough
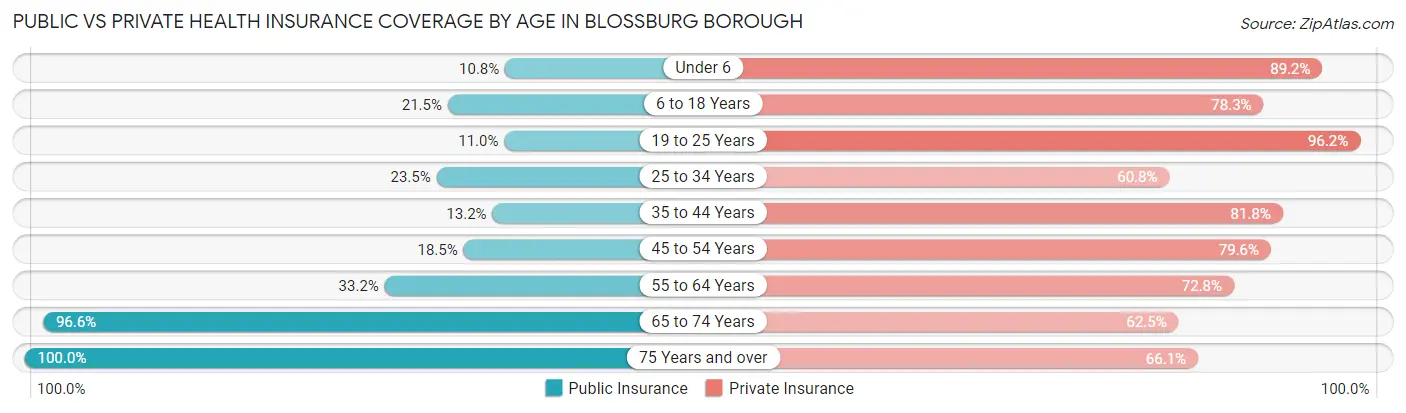
| Age Bracket | Public Insurance | Private Insurance |
| Under 6 | 12 (10.8%) | 99 (89.2%) |
| 6 to 18 Years | 71 (21.4%) | 259 (78.2%) |
| 19 to 25 Years | 26 (11.0%) | 228 (96.2%) |
| 25 to 34 Years | 36 (23.5%) | 93 (60.8%) |
| 35 to 44 Years | 42 (13.2%) | 261 (81.8%) |
| 45 to 54 Years | 50 (18.5%) | 215 (79.6%) |
| 55 to 64 Years | 67 (33.2%) | 147 (72.8%) |
| 65 to 74 Years | 85 (96.6%) | 55 (62.5%) |
| 75 Years and over | 115 (100.0%) | 76 (66.1%) |
| Total | 504 (27.6%) | 1,433 (78.5%) |
Disability Status by Sex by Age in Blossburg borough
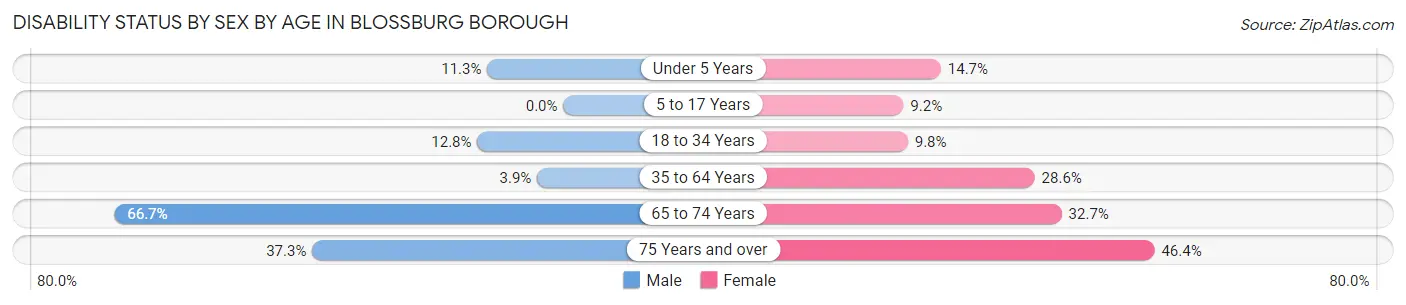
| Age Bracket | Male | Female |
| Under 5 Years | 7 (11.3%) | 5 (14.7%) |
| 5 to 17 Years | 0 (0.0%) | 14 (9.1%) |
| 18 to 34 Years | 24 (12.8%) | 20 (9.8%) |
| 35 to 64 Years | 15 (3.9%) | 116 (28.6%) |
| 65 to 74 Years | 26 (66.7%) | 16 (32.7%) |
| 75 Years and over | 22 (37.3%) | 26 (46.4%) |
Disability Class by Sex by Age in Blossburg borough
Disability Class: Hearing Difficulty
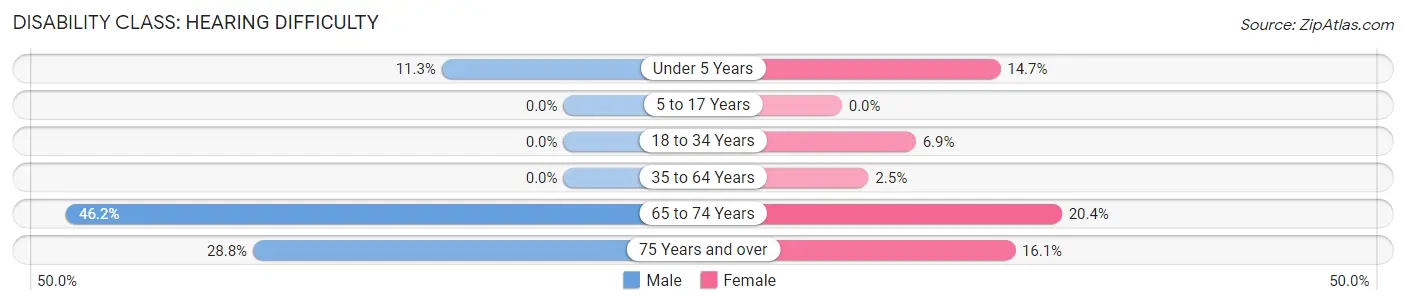
| Age Bracket | Male | Female |
| Under 5 Years | 7 (11.3%) | 5 (14.7%) |
| 5 to 17 Years | 0 (0.0%) | 0 (0.0%) |
| 18 to 34 Years | 0 (0.0%) | 14 (6.9%) |
| 35 to 64 Years | 0 (0.0%) | 10 (2.5%) |
| 65 to 74 Years | 18 (46.2%) | 10 (20.4%) |
| 75 Years and over | 17 (28.8%) | 9 (16.1%) |
Disability Class: Vision Difficulty
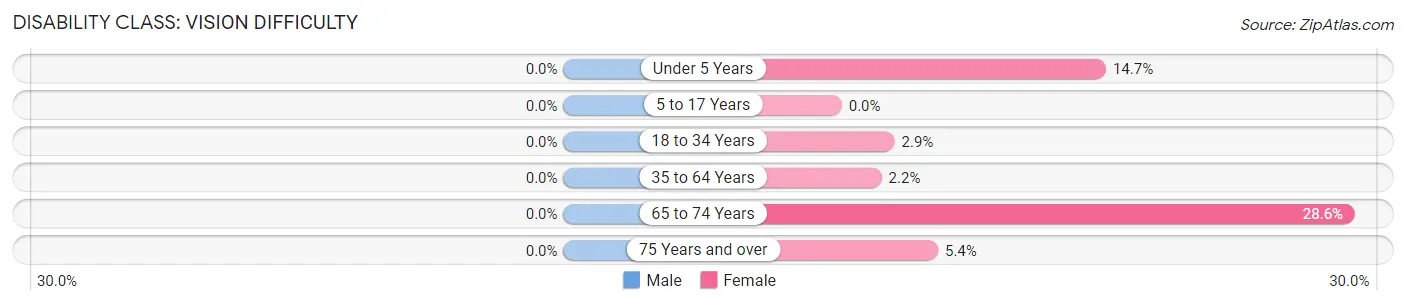
| Age Bracket | Male | Female |
| Under 5 Years | 0 (0.0%) | 5 (14.7%) |
| 5 to 17 Years | 0 (0.0%) | 0 (0.0%) |
| 18 to 34 Years | 0 (0.0%) | 6 (2.9%) |
| 35 to 64 Years | 0 (0.0%) | 9 (2.2%) |
| 65 to 74 Years | 0 (0.0%) | 14 (28.6%) |
| 75 Years and over | 0 (0.0%) | 3 (5.4%) |
Disability Class: Cognitive Difficulty
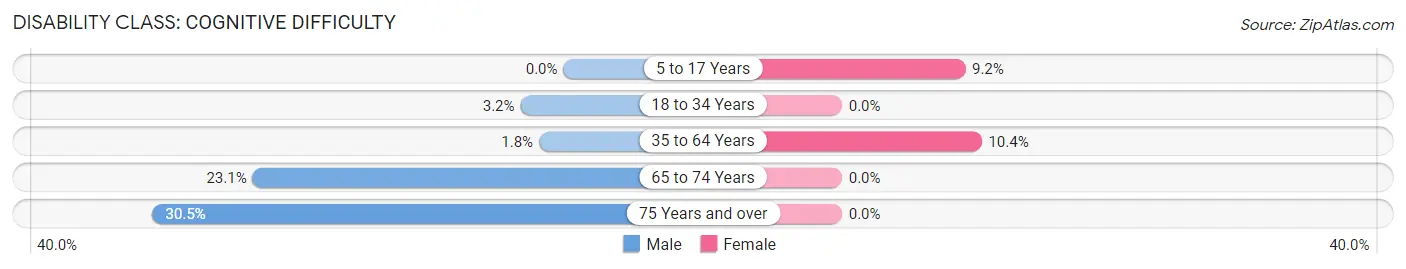
| Age Bracket | Male | Female |
| 5 to 17 Years | 0 (0.0%) | 14 (9.1%) |
| 18 to 34 Years | 6 (3.2%) | 0 (0.0%) |
| 35 to 64 Years | 7 (1.8%) | 42 (10.4%) |
| 65 to 74 Years | 9 (23.1%) | 0 (0.0%) |
| 75 Years and over | 18 (30.5%) | 0 (0.0%) |
Disability Class: Ambulatory Difficulty
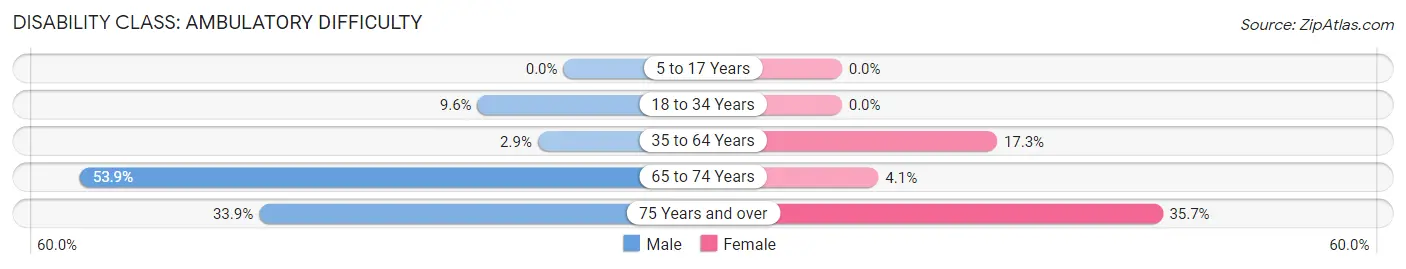
| Age Bracket | Male | Female |
| 5 to 17 Years | 0 (0.0%) | 0 (0.0%) |
| 18 to 34 Years | 18 (9.6%) | 0 (0.0%) |
| 35 to 64 Years | 11 (2.9%) | 70 (17.3%) |
| 65 to 74 Years | 21 (53.8%) | 2 (4.1%) |
| 75 Years and over | 20 (33.9%) | 20 (35.7%) |
Disability Class: Self-Care Difficulty
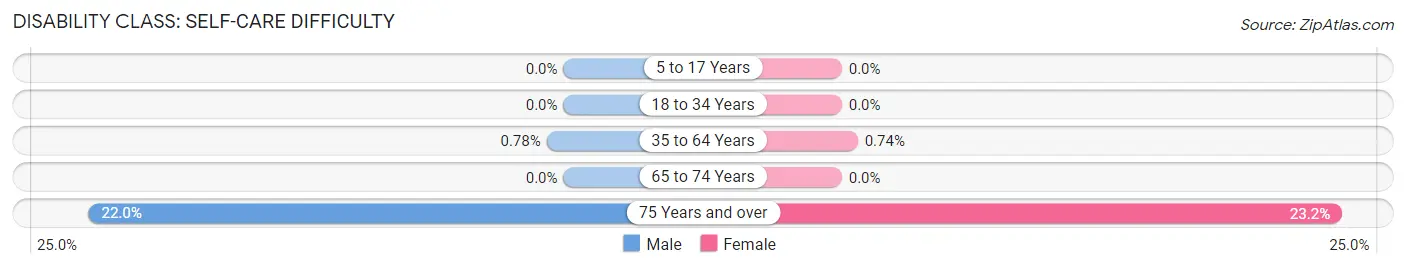
| Age Bracket | Male | Female |
| 5 to 17 Years | 0 (0.0%) | 0 (0.0%) |
| 18 to 34 Years | 0 (0.0%) | 0 (0.0%) |
| 35 to 64 Years | 3 (0.8%) | 3 (0.7%) |
| 65 to 74 Years | 0 (0.0%) | 0 (0.0%) |
| 75 Years and over | 13 (22.0%) | 13 (23.2%) |
Technology Access in Blossburg borough
Computing Device Access in Blossburg borough
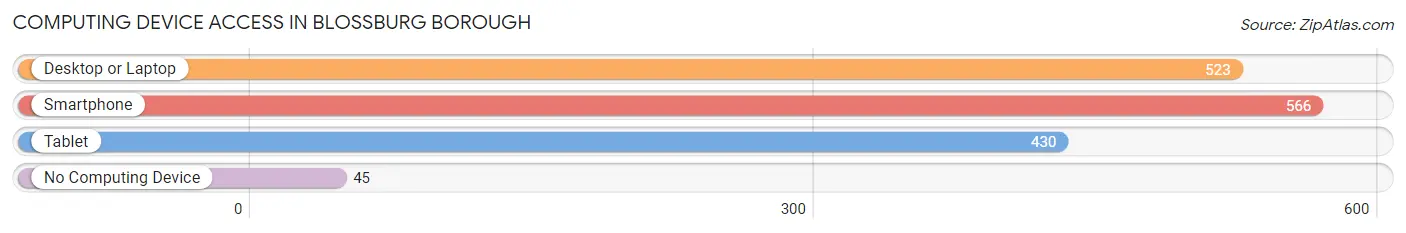
| Device Type | # Households | % Households |
| Desktop or Laptop | 523 | 80.6% |
| Smartphone | 566 | 87.2% |
| Tablet | 430 | 66.3% |
| No Computing Device | 45 | 6.9% |
| Total | 649 | 100.0% |
Internet Access in Blossburg borough
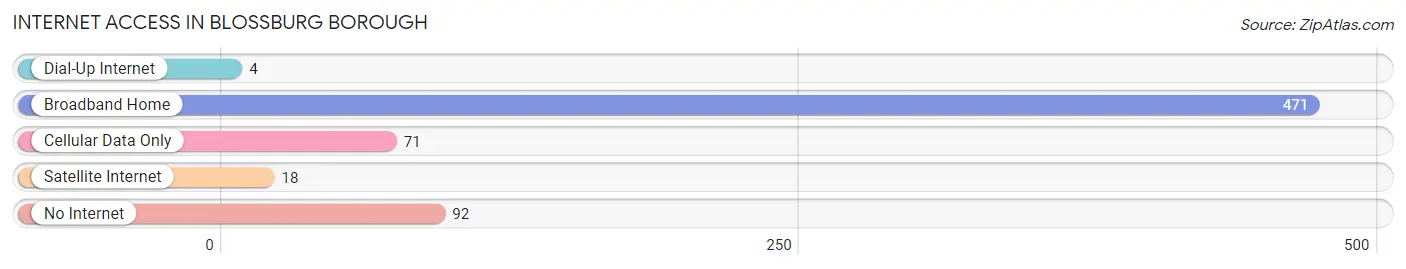
| Internet Type | # Households | % Households |
| Dial-Up Internet | 4 | 0.6% |
| Broadband Home | 471 | 72.6% |
| Cellular Data Only | 71 | 10.9% |
| Satellite Internet | 18 | 2.8% |
| No Internet | 92 | 14.2% |
| Total | 649 | 100.0% |
Blossburg borough Summary
Blossburg Borough is a small borough located in Tioga County, Pennsylvania. It is situated in the northern part of the state, approximately 20 miles from the New York border. The borough is home to a population of 1,717 people, according to the 2010 census.
History
Blossburg Borough was founded in 1837 by William Bloss, a local landowner. The borough was named after him and was incorporated in 1845. Blossburg was a major coal mining center in the 19th century, and the coal industry was the main source of employment for the town’s residents. The coal industry declined in the early 20th century, and the town’s population decreased as a result.
Geography
Blossburg Borough is located in the northern part of Tioga County, Pennsylvania. It is situated in the Appalachian Mountains, and the borough is surrounded by hills and mountains. The borough is located approximately 20 miles from the New York border. The borough is located in the Tioga River Valley, and the Tioga River runs through the borough.
The borough has a total area of 1.2 square miles, all of which is land. The borough is located at an elevation of 1,845 feet above sea level. The climate in Blossburg is classified as humid continental, with cold winters and warm summers.
Economy
The economy of Blossburg Borough is largely based on the service industry. The borough is home to several small businesses, including restaurants, retail stores, and professional services. The borough also has a few manufacturing companies, including a furniture factory and a plastics factory.
The borough is also home to a few tourist attractions, including the Blossburg Coal Mine Museum and the Tioga County Historical Society. The borough is also home to a few parks, including the Blossburg Memorial Park and the Tioga River Park.
Demographics
According to the 2010 census, the population of Blossburg Borough was 1,717. The racial makeup of the borough was 97.3% White, 0.9% African American, 0.2% Native American, 0.2% Asian, 0.1% Pacific Islander, 0.3% from other races, and 0.9% from two or more races. Hispanic or Latino of any race were 1.2% of the population.
The median household income in Blossburg Borough was $37,917, and the median family income was $45,938. The per capita income for the borough was $18,945. About 11.2% of families and 14.2% of the population were below the poverty line, including 19.2% of those under age 18 and 8.2% of those age 65 or over.
Blossburg Borough is a small borough with a rich history and a diverse economy. The borough is home to a variety of businesses, tourist attractions, and parks. The borough has a population of 1,717 people, and the median household income is $37,917. The borough is a great place to live and work, and it is a great place to visit.
Common Questions
What is Per Capita Income in Blossburg borough?
Per Capita income in Blossburg borough is $29,659.
What is the Median Family Income in Blossburg borough?
Median Family Income in Blossburg borough is $81,042.
What is the Median Household income in Blossburg borough?
Median Household Income in Blossburg borough is $64,901.
What is Income or Wage Gap in Blossburg borough?
Income or Wage Gap in Blossburg borough is 37.2%.
Women in Blossburg borough earn 62.8 cents for every dollar earned by a man.
What is Inequality or Gini Index in Blossburg borough?
Inequality or Gini Index in Blossburg borough is 0.40.
What is the Total Population of Blossburg borough?
Total Population of Blossburg borough is 1,835.
What is the Total Male Population of Blossburg borough?
Total Male Population of Blossburg borough is 934.
What is the Total Female Population of Blossburg borough?
Total Female Population of Blossburg borough is 901.
What is the Ratio of Males per 100 Females in Blossburg borough?
There are 103.66 Males per 100 Females in Blossburg borough.
What is the Ratio of Females per 100 Males in Blossburg borough?
There are 96.47 Females per 100 Males in Blossburg borough.
What is the Median Population Age in Blossburg borough?
Median Population Age in Blossburg borough is 38.3 Years.
What is the Average Family Size in Blossburg borough
Average Family Size in Blossburg borough is 3.3 People.
What is the Average Household Size in Blossburg borough
Average Household Size in Blossburg borough is 2.8 People.
How Large is the Labor Force in Blossburg borough?
There are 970 People in the Labor Forcein in Blossburg borough.
What is the Percentage of People in the Labor Force in Blossburg borough?
64.7% of People are in the Labor Force in Blossburg borough.
What is the Unemployment Rate in Blossburg borough?
Unemployment Rate in Blossburg borough is 4.5%.