Latrobe borough, PA Map & Demographics
Latrobe borough Overview
$35,379
PER CAPITA INCOME
$79,398
AVG FAMILY INCOME
$59,485
AVG HOUSEHOLD INCOME
46.9%
WAGE / INCOME GAP [ % ]
53.1¢/ $1
WAGE / INCOME GAP [ $ ]
0.44
INEQUALITY / GINI INDEX
8,047
TOTAL POPULATION
3,886
MALE POPULATION
4,161
FEMALE POPULATION
93.39
MALES / 100 FEMALES
107.08
FEMALES / 100 MALES
41.7
MEDIAN AGE
2.9
AVG FAMILY SIZE
2.2
AVG HOUSEHOLD SIZE
4,606
LABOR FORCE [ PEOPLE ]
67.8%
PERCENT IN LABOR FORCE
3.9%
UNEMPLOYMENT RATE
Income in Latrobe borough
Income Overview in Latrobe borough
Per Capita Income in Latrobe borough is $35,379, while median incomes of families and households are $79,398 and $59,485 respectively.
| Characteristic | Number | Measure |
| Per Capita Income | 8,047 | $35,379 |
| Median Family Income | 1,879 | $79,398 |
| Mean Family Income | 1,879 | $88,234 |
| Median Household Income | 3,688 | $59,485 |
| Mean Household Income | 3,688 | $77,215 |
| Income Deficit | 1,879 | $0 |
| Wage / Income Gap (%) | 8,047 | 46.92% |
| Wage / Income Gap ($) | 8,047 | 53.08¢ per $1 |
| Gini / Inequality Index | 8,047 | 0.44 |
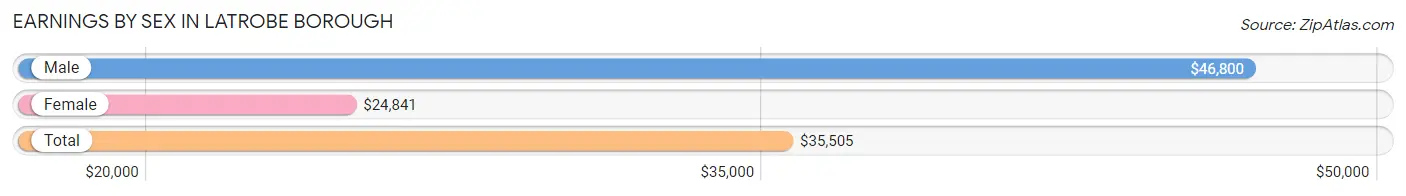
Earnings by Sex in Latrobe borough
Average Earnings in Latrobe borough are $35,505, $46,800 for men and $24,841 for women, a difference of 46.9%.
| Sex | Number | Average Earnings |
| Male | 2,556 (51.7%) | $46,800 |
| Female | 2,389 (48.3%) | $24,841 |
| Total | 4,945 (100.0%) | $35,505 |
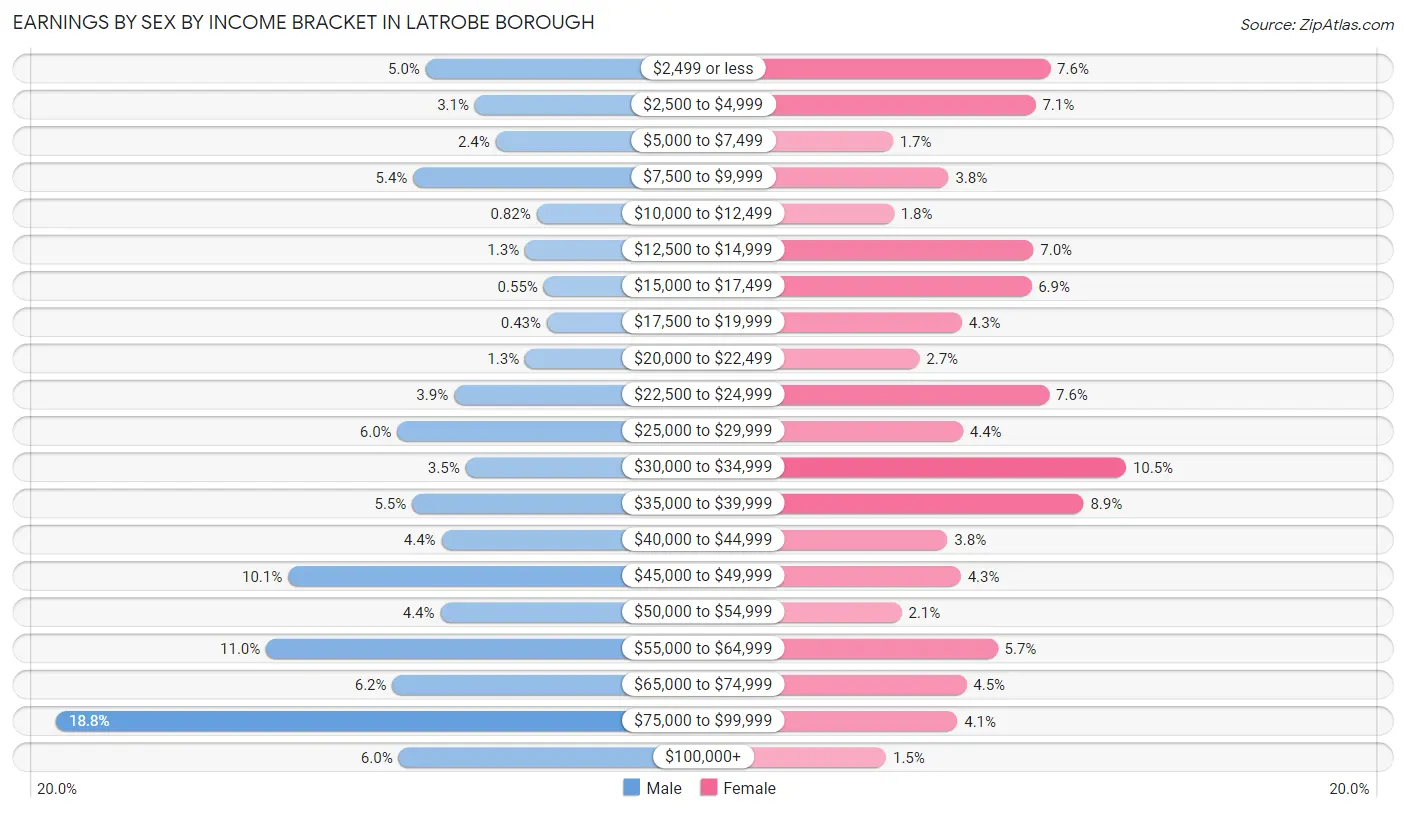
Earnings by Sex by Income Bracket in Latrobe borough
The most common earnings brackets in Latrobe borough are $75,000 to $99,999 for men (481 | 18.8%) and $30,000 to $34,999 for women (250 | 10.5%).
| Income | Male | Female |
| $2,499 or less | 127 (5.0%) | 182 (7.6%) |
| $2,500 to $4,999 | 80 (3.1%) | 169 (7.1%) |
| $5,000 to $7,499 | 60 (2.4%) | 41 (1.7%) |
| $7,500 to $9,999 | 139 (5.4%) | 91 (3.8%) |
| $10,000 to $12,499 | 21 (0.8%) | 42 (1.8%) |
| $12,500 to $14,999 | 32 (1.3%) | 167 (7.0%) |
| $15,000 to $17,499 | 14 (0.5%) | 165 (6.9%) |
| $17,500 to $19,999 | 11 (0.4%) | 103 (4.3%) |
| $20,000 to $22,499 | 32 (1.3%) | 65 (2.7%) |
| $22,500 to $24,999 | 100 (3.9%) | 181 (7.6%) |
| $25,000 to $29,999 | 154 (6.0%) | 104 (4.3%) |
| $30,000 to $34,999 | 89 (3.5%) | 250 (10.5%) |
| $35,000 to $39,999 | 140 (5.5%) | 212 (8.9%) |
| $40,000 to $44,999 | 112 (4.4%) | 90 (3.8%) |
| $45,000 to $49,999 | 259 (10.1%) | 102 (4.3%) |
| $50,000 to $54,999 | 113 (4.4%) | 49 (2.1%) |
| $55,000 to $64,999 | 280 (11.0%) | 135 (5.7%) |
| $65,000 to $74,999 | 159 (6.2%) | 107 (4.5%) |
| $75,000 to $99,999 | 481 (18.8%) | 99 (4.1%) |
| $100,000+ | 153 (6.0%) | 35 (1.5%) |
| Total | 2,556 (100.0%) | 2,389 (100.0%) |
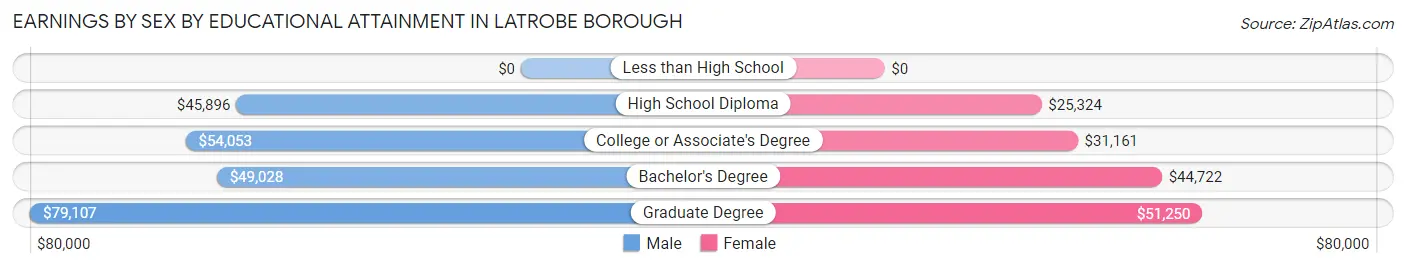
Earnings by Sex by Educational Attainment in Latrobe borough
Average earnings in Latrobe borough are $50,452 for men and $32,258 for women, a difference of 36.1%. Men with an educational attainment of graduate degree enjoy the highest average annual earnings of $79,107, while those with high school diploma education earn the least with $45,896. Women with an educational attainment of graduate degree earn the most with the average annual earnings of $51,250, while those with high school diploma education have the smallest earnings of $25,324.
| Educational Attainment | Male Income | Female Income |
| Less than High School | - | - |
| High School Diploma | $45,896 | $25,324 |
| College or Associate's Degree | $54,053 | $31,161 |
| Bachelor's Degree | $49,028 | $44,722 |
| Graduate Degree | $79,107 | $51,250 |
| Total | $50,452 | $32,258 |
Family Income in Latrobe borough
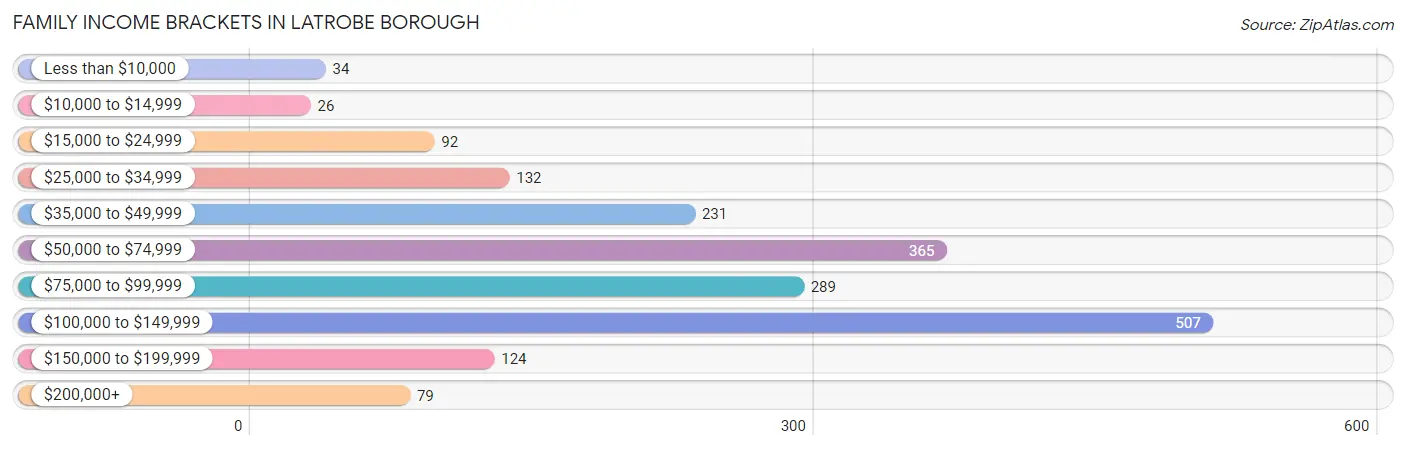
Family Income Brackets in Latrobe borough
According to the Latrobe borough family income data, there are 507 families falling into the $100,000 to $149,999 income range, which is the most common income bracket and makes up 27.0% of all families. Conversely, the $10,000 to $14,999 income bracket is the least frequent group with only 26 families (1.4%) belonging to this category.
| Income Bracket | # Families | % Families |
| Less than $10,000 | 34 | 1.8% |
| $10,000 to $14,999 | 26 | 1.4% |
| $15,000 to $24,999 | 92 | 4.9% |
| $25,000 to $34,999 | 132 | 7.0% |
| $35,000 to $49,999 | 231 | 12.3% |
| $50,000 to $74,999 | 365 | 19.4% |
| $75,000 to $99,999 | 289 | 15.4% |
| $100,000 to $149,999 | 507 | 27.0% |
| $150,000 to $199,999 | 124 | 6.6% |
| $200,000+ | 79 | 4.2% |
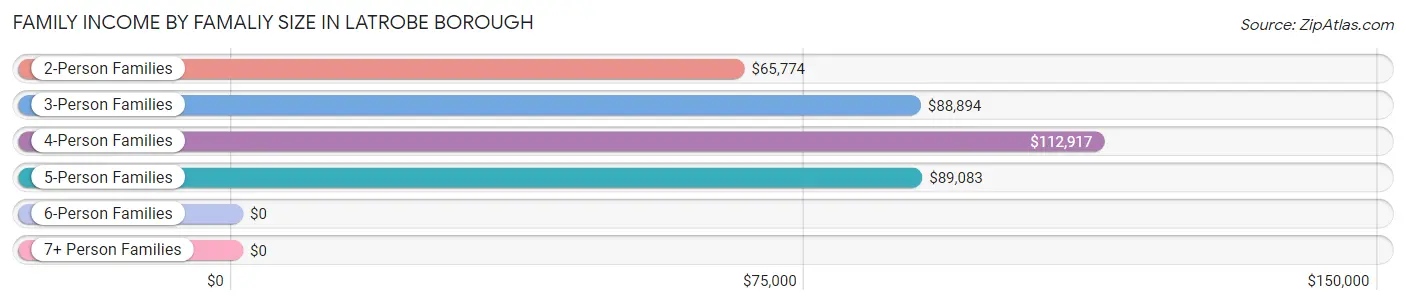
Family Income by Famaliy Size in Latrobe borough
4-person families (259 | 13.8%) account for the highest median family income in Latrobe borough with $112,917 per family, while 2-person families (1,008 | 53.6%) have the highest median income of $32,887 per family member.
| Income Bracket | # Families | Median Income |
| 2-Person Families | 1,008 (53.6%) | $65,774 |
| 3-Person Families | 441 (23.5%) | $88,894 |
| 4-Person Families | 259 (13.8%) | $112,917 |
| 5-Person Families | 87 (4.6%) | $89,083 |
| 6-Person Families | 77 (4.1%) | $0 |
| 7+ Person Families | 7 (0.4%) | $0 |
| Total | 1,879 (100.0%) | $79,398 |
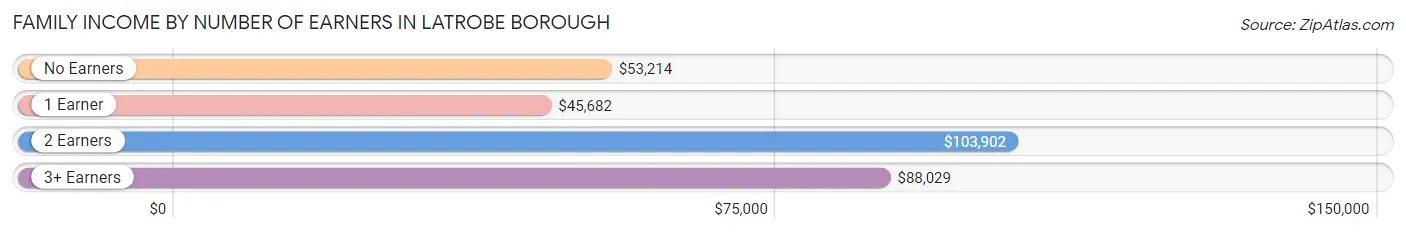
Family Income by Number of Earners in Latrobe borough
The median family income in Latrobe borough is $79,398, with families comprising 2 earners (728) having the highest median family income of $103,902, while families with 1 earner (504) have the lowest median family income of $45,682, accounting for 38.7% and 26.8% of families, respectively.
| Number of Earners | # Families | Median Income |
| No Earners | 254 (13.5%) | $53,214 |
| 1 Earner | 504 (26.8%) | $45,682 |
| 2 Earners | 728 (38.7%) | $103,902 |
| 3+ Earners | 393 (20.9%) | $88,029 |
| Total | 1,879 (100.0%) | $79,398 |
Household Income in Latrobe borough
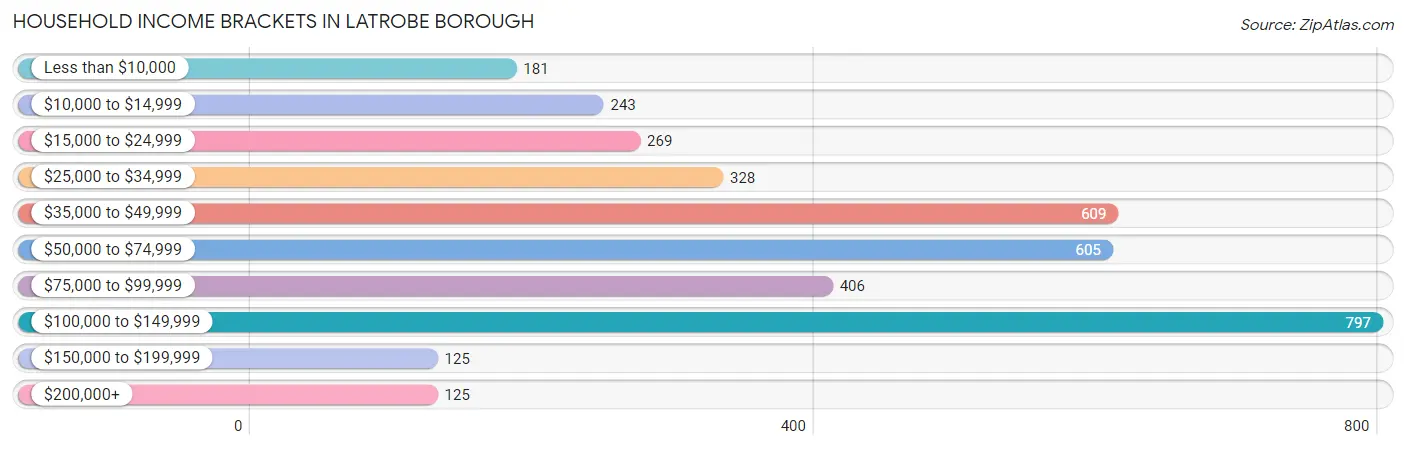
Household Income Brackets in Latrobe borough
With 797 households falling in the category, the $100,000 to $149,999 income range is the most frequent in Latrobe borough, accounting for 21.6% of all households. In contrast, only 125 households (3.4%) fall into the $150,000 to $199,999 income bracket, making it the least populous group.
| Income Bracket | # Households | % Households |
| Less than $10,000 | 181 | 4.9% |
| $10,000 to $14,999 | 243 | 6.6% |
| $15,000 to $24,999 | 269 | 7.3% |
| $25,000 to $34,999 | 328 | 8.9% |
| $35,000 to $49,999 | 609 | 16.5% |
| $50,000 to $74,999 | 605 | 16.4% |
| $75,000 to $99,999 | 406 | 11.0% |
| $100,000 to $149,999 | 797 | 21.6% |
| $150,000 to $199,999 | 125 | 3.4% |
| $200,000+ | 125 | 3.4% |
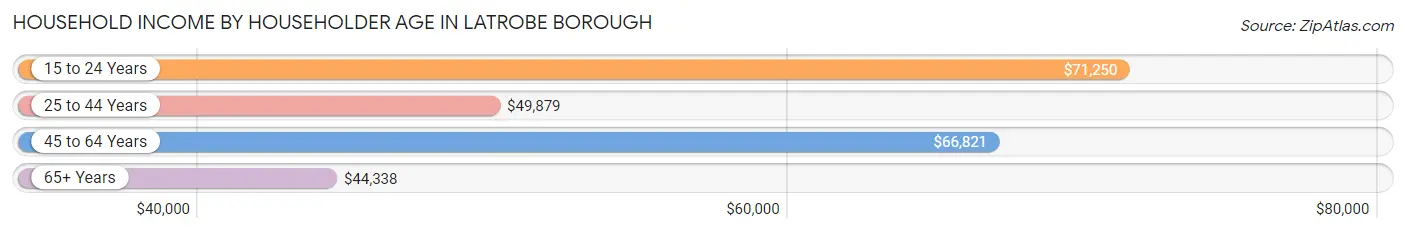
Household Income by Householder Age in Latrobe borough
The median household income in Latrobe borough is $59,485, with the highest median household income of $71,250 found in the 15 to 24 years age bracket for the primary householder. A total of 408 households (11.1%) fall into this category. Meanwhile, the 65+ years age bracket for the primary householder has the lowest median household income of $44,338, with 920 households (24.9%) in this group.
| Income Bracket | # Households | Median Income |
| 15 to 24 Years | 408 (11.1%) | $71,250 |
| 25 to 44 Years | 887 (24.0%) | $49,879 |
| 45 to 64 Years | 1,473 (39.9%) | $66,821 |
| 65+ Years | 920 (24.9%) | $44,338 |
| Total | 3,688 (100.0%) | $59,485 |
Poverty in Latrobe borough
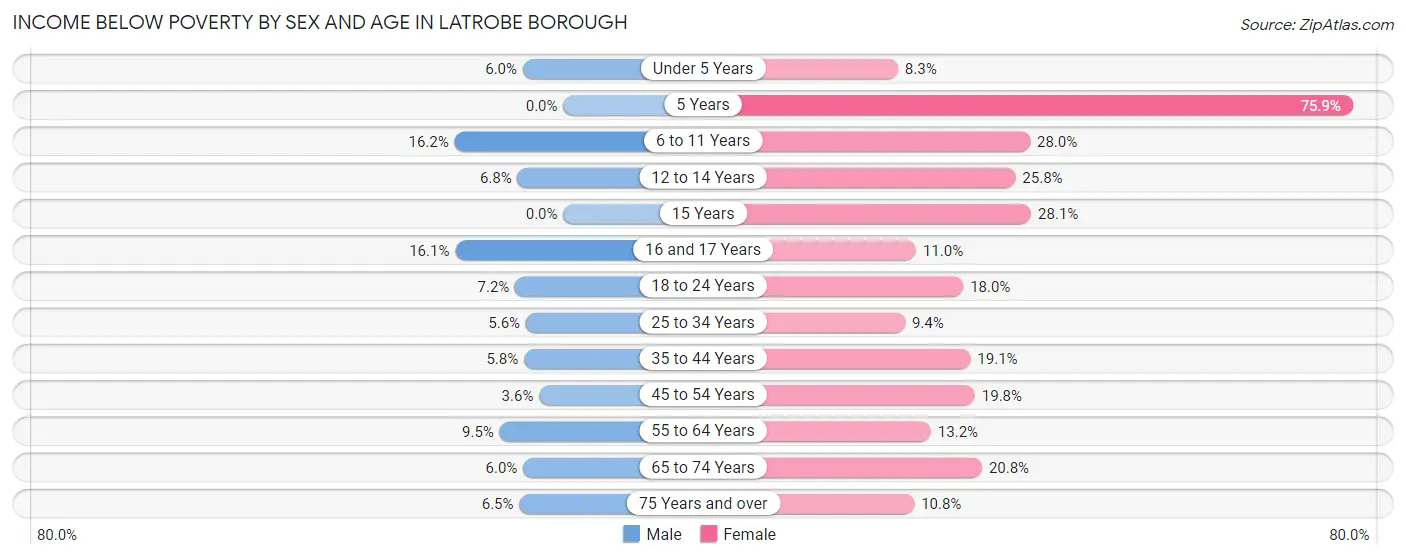
Income Below Poverty by Sex and Age in Latrobe borough
With 6.9% poverty level for males and 17.4% for females among the residents of Latrobe borough, 6 to 11 year old males and 5 year old females are the most vulnerable to poverty, with 37 males (16.2%) and 22 females (75.9%) in their respective age groups living below the poverty level.
| Age Bracket | Male | Female |
| Under 5 Years | 11 (6.0%) | 12 (8.3%) |
| 5 Years | 0 (0.0%) | 22 (75.9%) |
| 6 to 11 Years | 37 (16.2%) | 71 (28.0%) |
| 12 to 14 Years | 7 (6.8%) | 33 (25.8%) |
| 15 Years | 0 (0.0%) | 9 (28.1%) |
| 16 and 17 Years | 13 (16.1%) | 13 (11.0%) |
| 18 to 24 Years | 48 (7.1%) | 95 (18.0%) |
| 25 to 34 Years | 24 (5.6%) | 39 (9.4%) |
| 35 to 44 Years | 25 (5.8%) | 68 (19.1%) |
| 45 to 54 Years | 20 (3.6%) | 131 (19.8%) |
| 55 to 64 Years | 41 (9.5%) | 79 (13.2%) |
| 65 to 74 Years | 23 (6.0%) | 113 (20.8%) |
| 75 Years and over | 16 (6.5%) | 36 (10.7%) |
| Total | 265 (6.9%) | 721 (17.4%) |
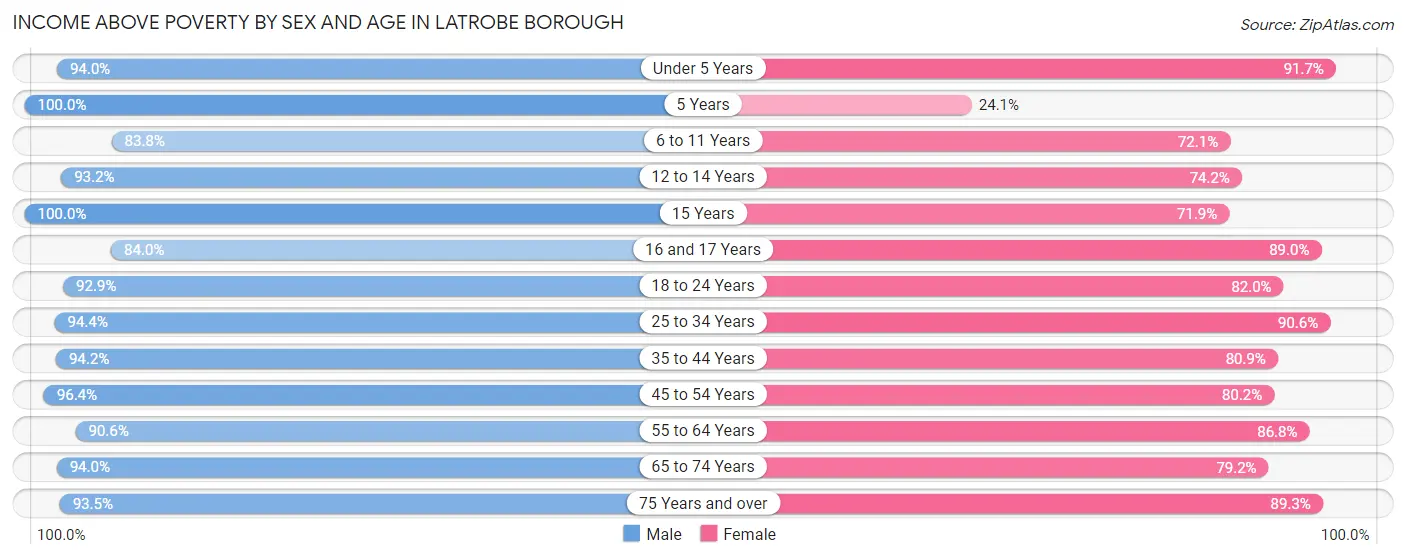
Income Above Poverty by Sex and Age in Latrobe borough
According to the poverty statistics in Latrobe borough, males aged 5 years and females aged under 5 years are the age groups that are most secure financially, with 100.0% of males and 91.7% of females in these age groups living above the poverty line.
| Age Bracket | Male | Female |
| Under 5 Years | 172 (94.0%) | 132 (91.7%) |
| 5 Years | 34 (100.0%) | 7 (24.1%) |
| 6 to 11 Years | 192 (83.8%) | 183 (72.1%) |
| 12 to 14 Years | 96 (93.2%) | 95 (74.2%) |
| 15 Years | 32 (100.0%) | 23 (71.9%) |
| 16 and 17 Years | 68 (84.0%) | 105 (89.0%) |
| 18 to 24 Years | 623 (92.8%) | 432 (82.0%) |
| 25 to 34 Years | 408 (94.4%) | 377 (90.6%) |
| 35 to 44 Years | 404 (94.2%) | 288 (80.9%) |
| 45 to 54 Years | 538 (96.4%) | 532 (80.2%) |
| 55 to 64 Years | 393 (90.5%) | 518 (86.8%) |
| 65 to 74 Years | 362 (94.0%) | 430 (79.2%) |
| 75 Years and over | 229 (93.5%) | 299 (89.2%) |
| Total | 3,551 (93.1%) | 3,421 (82.6%) |
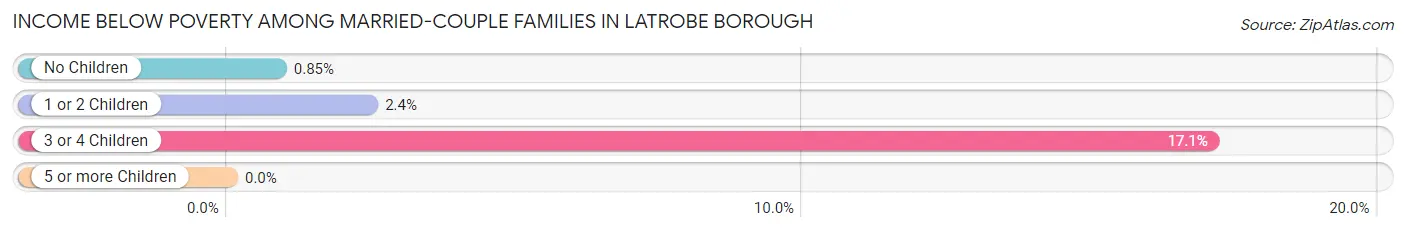
Income Below Poverty Among Married-Couple Families in Latrobe borough
The poverty statistics for married-couple families in Latrobe borough show that 2.7% or 37 of the total 1,353 families live below the poverty line. Families with 3 or 4 children have the highest poverty rate of 17.1%, comprising of 20 families. On the other hand, families with no children have the lowest poverty rate of 0.9%, which includes 7 families.
| Children | Above Poverty | Below Poverty |
| No Children | 819 (99.2%) | 7 (0.9%) |
| 1 or 2 Children | 400 (97.6%) | 10 (2.4%) |
| 3 or 4 Children | 97 (82.9%) | 20 (17.1%) |
| 5 or more Children | 0 (0.0%) | 0 (0.0%) |
| Total | 1,316 (97.3%) | 37 (2.7%) |
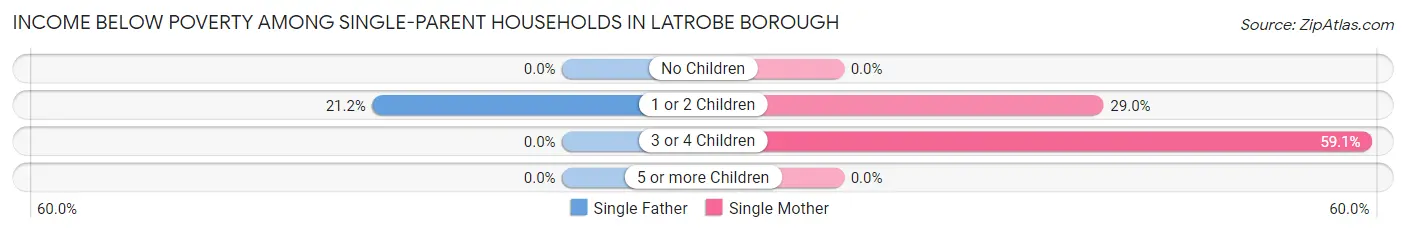
Income Below Poverty Among Single-Parent Households in Latrobe borough
According to the poverty data in Latrobe borough, 5.1% or 7 single-father households and 19.5% or 76 single-mother households are living below the poverty line. Among single-father households, those with 1 or 2 children have the highest poverty rate, with 7 households (21.2%) experiencing poverty. Likewise, among single-mother households, those with 3 or 4 children have the highest poverty rate, with 13 households (59.1%) falling below the poverty line.
| Children | Single Father | Single Mother |
| No Children | 0 (0.0%) | 0 (0.0%) |
| 1 or 2 Children | 7 (21.2%) | 63 (29.0%) |
| 3 or 4 Children | 0 (0.0%) | 13 (59.1%) |
| 5 or more Children | 0 (0.0%) | 0 (0.0%) |
| Total | 7 (5.1%) | 76 (19.5%) |
Income Below Poverty Among Married-Couple vs Single-Parent Households in Latrobe borough
The poverty data for Latrobe borough shows that 37 of the married-couple family households (2.7%) and 83 of the single-parent households (15.8%) are living below the poverty level. Within the married-couple family households, those with 3 or 4 children have the highest poverty rate, with 20 households (17.1%) falling below the poverty line. Among the single-parent households, those with 3 or 4 children have the highest poverty rate, with 13 household (59.1%) living below poverty.
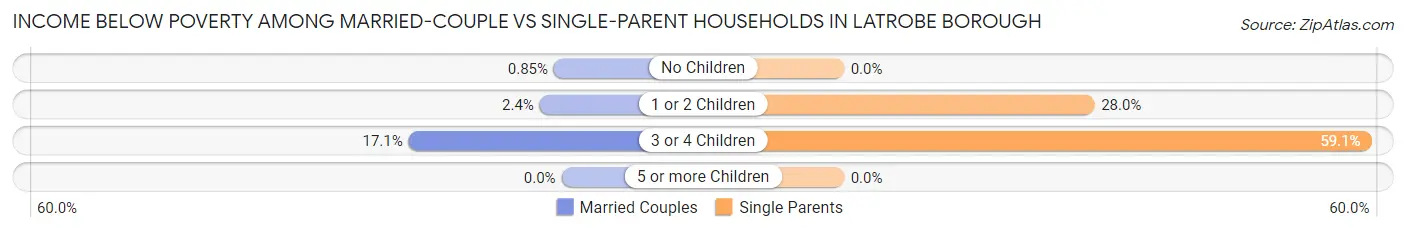
| Children | Married-Couple Families | Single-Parent Households |
| No Children | 7 (0.9%) | 0 (0.0%) |
| 1 or 2 Children | 10 (2.4%) | 70 (28.0%) |
| 3 or 4 Children | 20 (17.1%) | 13 (59.1%) |
| 5 or more Children | 0 (0.0%) | 0 (0.0%) |
| Total | 37 (2.7%) | 83 (15.8%) |
Race in Latrobe borough
The most populous races in Latrobe borough are White / Caucasian (7,508 | 93.3%), Two or more Races (429 | 5.3%), and Black / African American (100 | 1.2%).
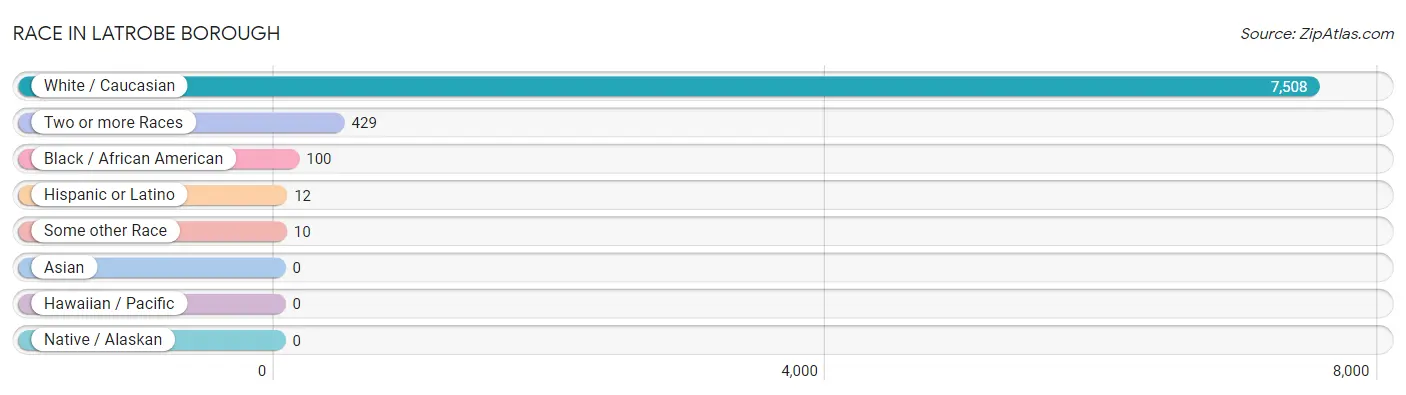
| Race | # Population | % Population |
| Asian | 0 | 0.0% |
| Black / African American | 100 | 1.2% |
| Hawaiian / Pacific | 0 | 0.0% |
| Hispanic or Latino | 12 | 0.2% |
| Native / Alaskan | 0 | 0.0% |
| White / Caucasian | 7,508 | 93.3% |
| Two or more Races | 429 | 5.3% |
| Some other Race | 10 | 0.1% |
| Total | 8,047 | 100.0% |
Ancestry in Latrobe borough
The most populous ancestries reported in Latrobe borough are German (2,119 | 26.3%), Irish (1,487 | 18.5%), Italian (1,166 | 14.5%), English (737 | 9.2%), and Polish (593 | 7.4%), together accounting for 75.8% of all Latrobe borough residents.
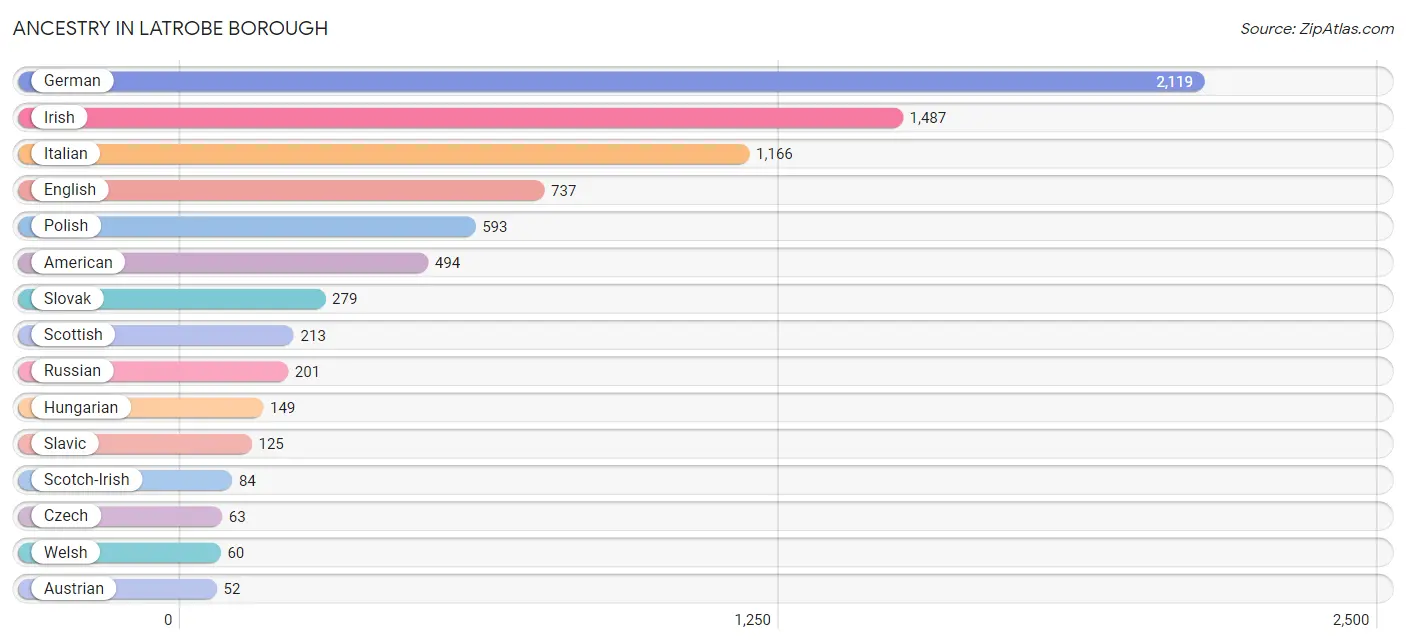
| Ancestry | # Population | % Population |
| African | 13 | 0.2% |
| American | 494 | 6.1% |
| Arab | 13 | 0.2% |
| Austrian | 52 | 0.6% |
| British | 21 | 0.3% |
| Burmese | 15 | 0.2% |
| Croatian | 34 | 0.4% |
| Czech | 63 | 0.8% |
| Czechoslovakian | 22 | 0.3% |
| Danish | 9 | 0.1% |
| Dutch | 43 | 0.5% |
| Eastern European | 10 | 0.1% |
| English | 737 | 9.2% |
| French | 5 | 0.1% |
| French Canadian | 17 | 0.2% |
| German | 2,119 | 26.3% |
| Hungarian | 149 | 1.8% |
| Irish | 1,487 | 18.5% |
| Italian | 1,166 | 14.5% |
| Lebanese | 13 | 0.2% |
| Mexican | 12 | 0.2% |
| Northern European | 19 | 0.2% |
| Norwegian | 17 | 0.2% |
| Pennsylvania German | 15 | 0.2% |
| Polish | 593 | 7.4% |
| Russian | 201 | 2.5% |
| Scandinavian | 13 | 0.2% |
| Scotch-Irish | 84 | 1.0% |
| Scottish | 213 | 2.6% |
| Serbian | 7 | 0.1% |
| Slavic | 125 | 1.5% |
| Slovak | 279 | 3.5% |
| Subsaharan African | 13 | 0.2% |
| Swedish | 17 | 0.2% |
| Swiss | 9 | 0.1% |
| Ukrainian | 8 | 0.1% |
| Welsh | 60 | 0.7% |
| Yugoslavian | 11 | 0.1% | View All 38 Rows |
Immigrants in Latrobe borough
The most numerous immigrant groups reported in Latrobe borough came from Asia (31 | 0.4%), India (31 | 0.4%), South Central Asia (31 | 0.4%), Europe (24 | 0.3%), and Eastern Europe (10 | 0.1%), together accounting for 1.6% of all Latrobe borough residents.
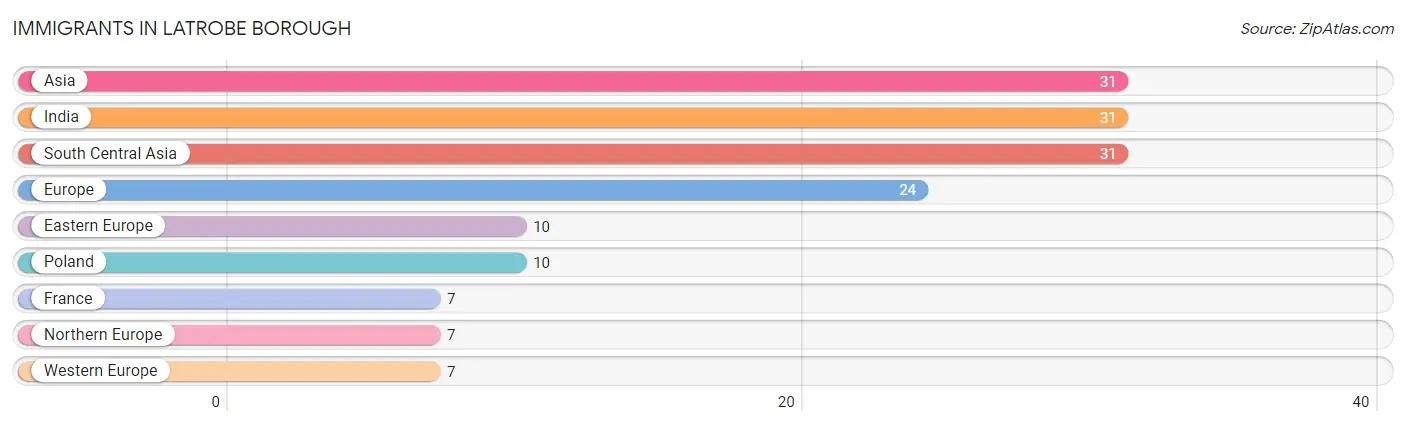
| Immigration Origin | # Population | % Population |
| Asia | 31 | 0.4% |
| Eastern Europe | 10 | 0.1% |
| Europe | 24 | 0.3% |
| France | 7 | 0.1% |
| India | 31 | 0.4% |
| Northern Europe | 7 | 0.1% |
| Poland | 10 | 0.1% |
| South Central Asia | 31 | 0.4% |
| Western Europe | 7 | 0.1% | View All 9 Rows |
Sex and Age in Latrobe borough
Sex and Age in Latrobe borough
The most populous age groups in Latrobe borough are 20 to 24 Years (620 | 16.0%) for men and 20 to 24 Years (468 | 11.3%) for women.
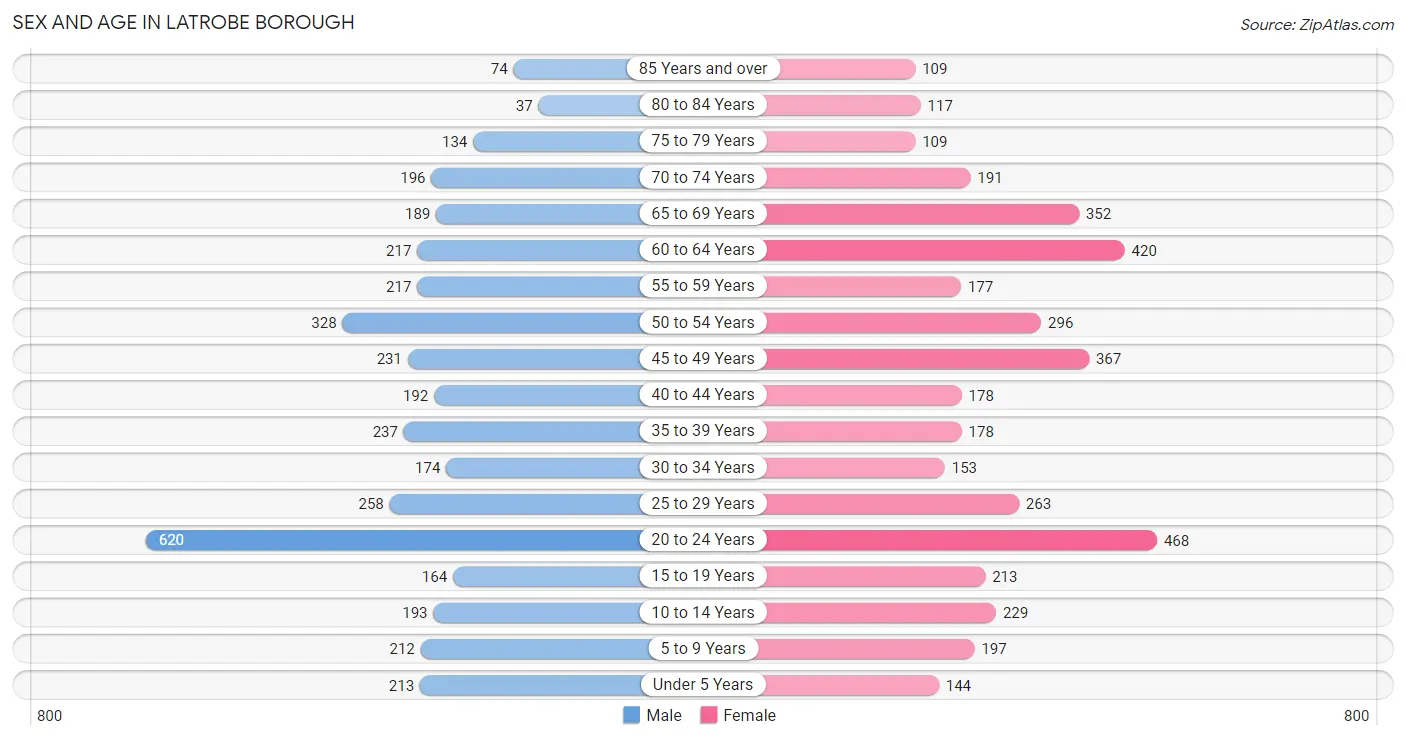
| Age Bracket | Male | Female |
| Under 5 Years | 213 (5.5%) | 144 (3.5%) |
| 5 to 9 Years | 212 (5.5%) | 197 (4.7%) |
| 10 to 14 Years | 193 (5.0%) | 229 (5.5%) |
| 15 to 19 Years | 164 (4.2%) | 213 (5.1%) |
| 20 to 24 Years | 620 (16.0%) | 468 (11.3%) |
| 25 to 29 Years | 258 (6.6%) | 263 (6.3%) |
| 30 to 34 Years | 174 (4.5%) | 153 (3.7%) |
| 35 to 39 Years | 237 (6.1%) | 178 (4.3%) |
| 40 to 44 Years | 192 (4.9%) | 178 (4.3%) |
| 45 to 49 Years | 231 (5.9%) | 367 (8.8%) |
| 50 to 54 Years | 328 (8.4%) | 296 (7.1%) |
| 55 to 59 Years | 217 (5.6%) | 177 (4.3%) |
| 60 to 64 Years | 217 (5.6%) | 420 (10.1%) |
| 65 to 69 Years | 189 (4.9%) | 352 (8.5%) |
| 70 to 74 Years | 196 (5.0%) | 191 (4.6%) |
| 75 to 79 Years | 134 (3.5%) | 109 (2.6%) |
| 80 to 84 Years | 37 (0.9%) | 117 (2.8%) |
| 85 Years and over | 74 (1.9%) | 109 (2.6%) |
| Total | 3,886 (100.0%) | 4,161 (100.0%) |
Families and Households in Latrobe borough
Median Family Size in Latrobe borough
The median family size in Latrobe borough is 2.92 persons per family, with married-couple families (1,353 | 72.0%) accounting for the largest median family size of 3.09 persons per family. On the other hand, single female/mother families (390 | 20.8%) represent the smallest median family size with 2.44 persons per family.
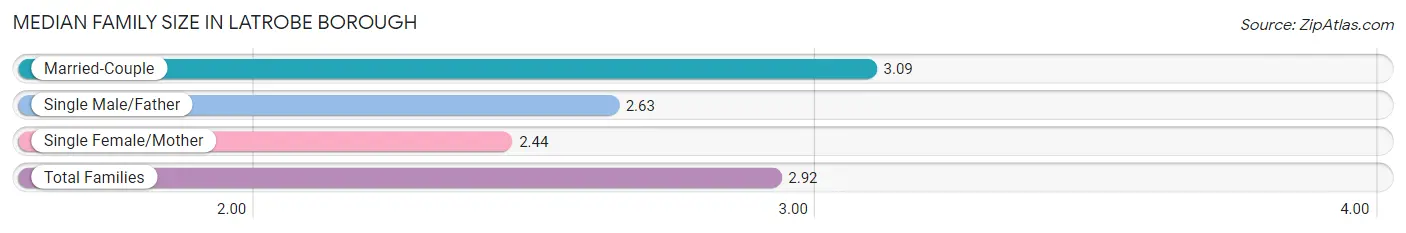
| Family Type | # Families | Family Size |
| Married-Couple | 1,353 (72.0%) | 3.09 |
| Single Male/Father | 136 (7.2%) | 2.63 |
| Single Female/Mother | 390 (20.8%) | 2.44 |
| Total Families | 1,879 (100.0%) | 2.92 |
Median Household Size in Latrobe borough
The median household size in Latrobe borough is 2.18 persons per household, with married-couple households (1,353 | 36.7%) accounting for the largest median household size of 3.17 persons per household. non-family households (1,809 | 49.0%) represent the smallest median household size with 1.30 persons per household.
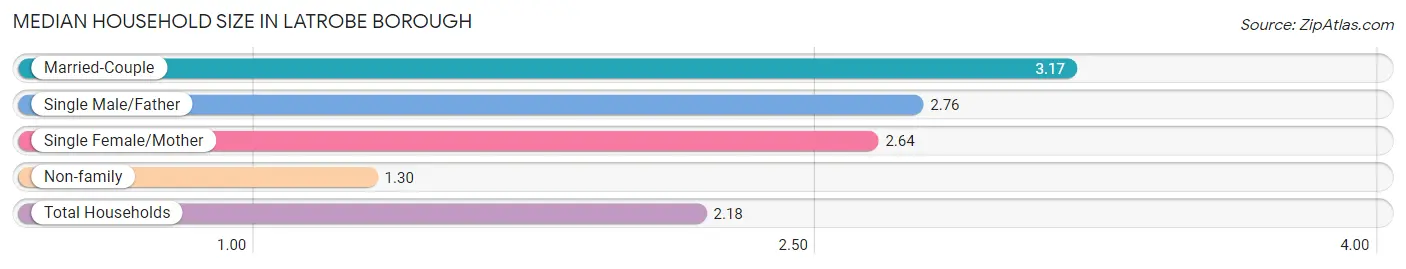
| Household Type | # Households | Household Size |
| Married-Couple | 1,353 (36.7%) | 3.17 |
| Single Male/Father | 136 (3.7%) | 2.76 |
| Single Female/Mother | 390 (10.6%) | 2.64 |
| Non-family | 1,809 (49.0%) | 1.30 |
| Total Households | 3,688 (100.0%) | 2.18 |
Household Size by Marriage Status in Latrobe borough
Out of a total of 3,688 households in Latrobe borough, 1,879 (50.9%) are family households, while 1,809 (49.0%) are nonfamily households. The most numerous type of family households are 2-person households, comprising 940, and the most common type of nonfamily households are 1-person households, comprising 1,383.
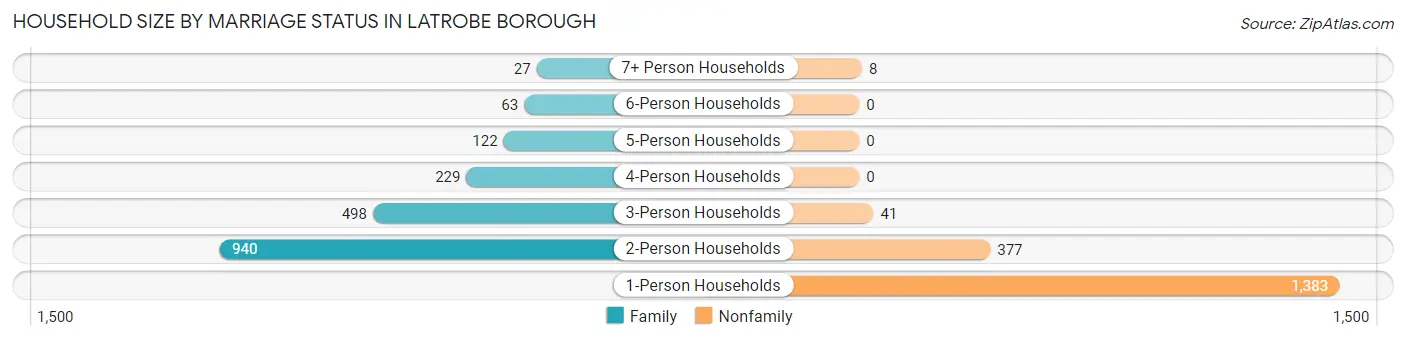
| Household Size | Family Households | Nonfamily Households |
| 1-Person Households | - | 1,383 (37.5%) |
| 2-Person Households | 940 (25.5%) | 377 (10.2%) |
| 3-Person Households | 498 (13.5%) | 41 (1.1%) |
| 4-Person Households | 229 (6.2%) | 0 (0.0%) |
| 5-Person Households | 122 (3.3%) | 0 (0.0%) |
| 6-Person Households | 63 (1.7%) | 0 (0.0%) |
| 7+ Person Households | 27 (0.7%) | 8 (0.2%) |
| Total | 1,879 (50.9%) | 1,809 (49.0%) |
Female Fertility in Latrobe borough
Fertility by Age in Latrobe borough
Average fertility rate in Latrobe borough is 37.0 births per 1,000 women. Women in the age bracket of 20 to 34 years have the highest fertility rate with 63.0 births per 1,000 women. Women in the age bracket of 20 to 34 years acount for 80.0% of all women with births.
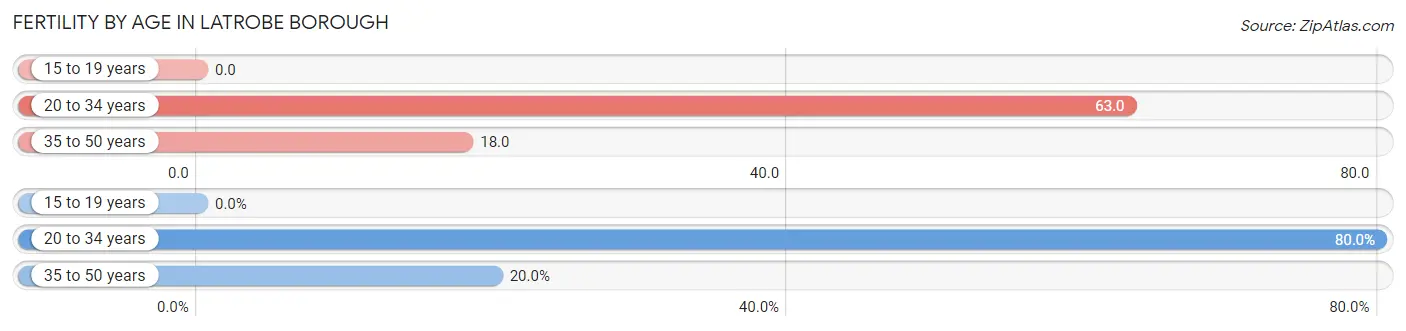
| Age Bracket | Women with Births | Births / 1,000 Women |
| 15 to 19 years | 0 (0.0%) | 0.0 |
| 20 to 34 years | 56 (80.0%) | 63.0 |
| 35 to 50 years | 14 (20.0%) | 18.0 |
| Total | 70 (100.0%) | 37.0 |
Fertility by Age by Marriage Status in Latrobe borough
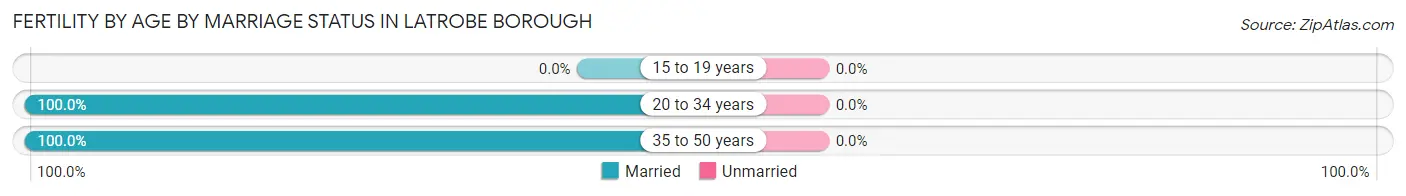
| Age Bracket | Married | Unmarried |
| 15 to 19 years | 0 (0.0%) | 0 (0.0%) |
| 20 to 34 years | 56 (100.0%) | 0 (0.0%) |
| 35 to 50 years | 14 (100.0%) | 0 (0.0%) |
| Total | 70 (100.0%) | 0 (0.0%) |
Fertility by Education in Latrobe borough
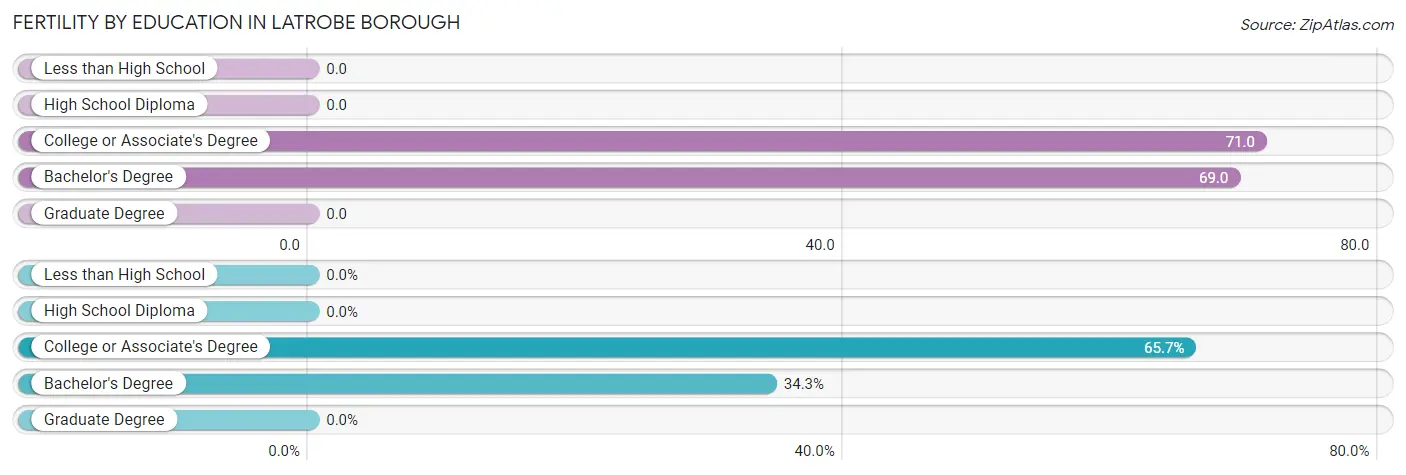
| Educational Attainment | Women with Births | Births / 1,000 Women |
| Less than High School | 0 (0.0%) | 0.0 |
| High School Diploma | 0 (0.0%) | 0.0 |
| College or Associate's Degree | 46 (65.7%) | 71.0 |
| Bachelor's Degree | 24 (34.3%) | 69.0 |
| Graduate Degree | 0 (0.0%) | 0.0 |
| Total | 70 (100.0%) | 37.0 |
Fertility by Education by Marriage Status in Latrobe borough
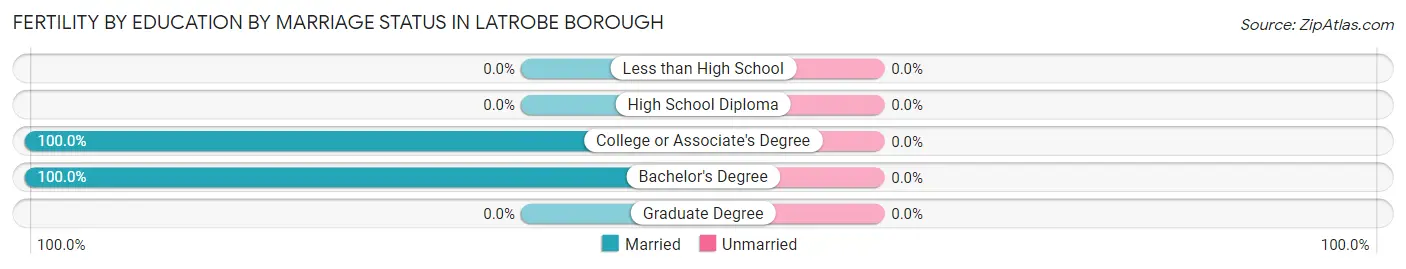
| Educational Attainment | Married | Unmarried |
| Less than High School | 0 (0.0%) | 0 (0.0%) |
| High School Diploma | 0 (0.0%) | 0 (0.0%) |
| College or Associate's Degree | 46 (100.0%) | 0 (0.0%) |
| Bachelor's Degree | 24 (100.0%) | 0 (0.0%) |
| Graduate Degree | 0 (0.0%) | 0 (0.0%) |
| Total | 70 (100.0%) | 0 (0.0%) |
Employment Characteristics in Latrobe borough
Employment by Class of Employer in Latrobe borough
Among the 4,290 employed individuals in Latrobe borough, private company employees (3,130 | 73.0%), not-for-profit organizations (519 | 12.1%), and self-employed (not incorporated) (237 | 5.5%) make up the most common classes of employment.
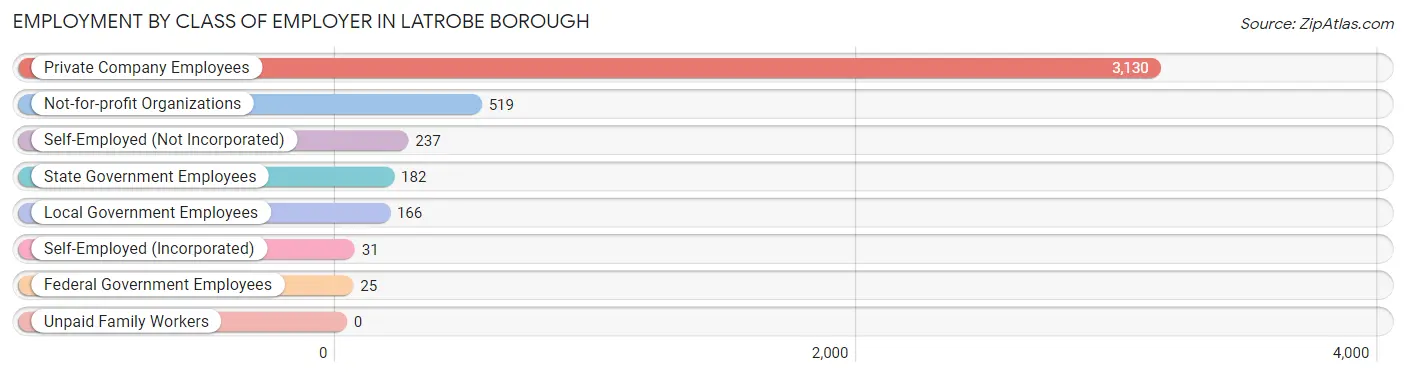
| Employer Class | # Employees | % Employees |
| Private Company Employees | 3,130 | 73.0% |
| Self-Employed (Incorporated) | 31 | 0.7% |
| Self-Employed (Not Incorporated) | 237 | 5.5% |
| Not-for-profit Organizations | 519 | 12.1% |
| Local Government Employees | 166 | 3.9% |
| State Government Employees | 182 | 4.2% |
| Federal Government Employees | 25 | 0.6% |
| Unpaid Family Workers | 0 | 0.0% |
| Total | 4,290 | 100.0% |
Employment Status by Age in Latrobe borough
According to the labor force statistics for Latrobe borough, out of the total population over 16 years of age (6,794), 67.8% or 4,606 individuals are in the labor force, with 3.9% or 180 of them unemployed. The age group with the highest labor force participation rate is 55 to 59 years, with 94.4% or 372 individuals in the labor force. Within the labor force, the 20 to 24 years age range has the highest percentage of unemployed individuals, with 6.8% or 68 of them being unemployed.
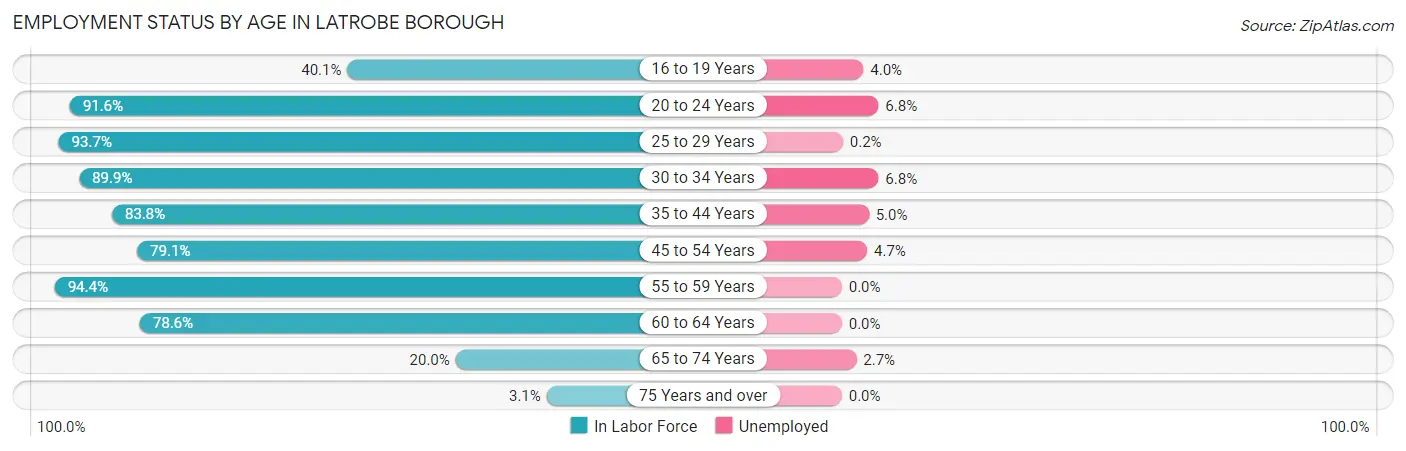
| Age Bracket | In Labor Force | Unemployed |
| 16 to 19 Years | 125 (40.1%) | 5 (4.0%) |
| 20 to 24 Years | 997 (91.6%) | 68 (6.8%) |
| 25 to 29 Years | 488 (93.7%) | 1 (0.2%) |
| 30 to 34 Years | 294 (89.9%) | 20 (6.8%) |
| 35 to 44 Years | 658 (83.8%) | 33 (5.0%) |
| 45 to 54 Years | 967 (79.1%) | 45 (4.7%) |
| 55 to 59 Years | 372 (94.4%) | 0 (0.0%) |
| 60 to 64 Years | 501 (78.6%) | 0 (0.0%) |
| 65 to 74 Years | 186 (20.0%) | 5 (2.7%) |
| 75 Years and over | 18 (3.1%) | 0 (0.0%) |
| Total | 4,606 (67.8%) | 180 (3.9%) |
Employment Status by Educational Attainment in Latrobe borough
According to labor force statistics for Latrobe borough, 84.4% of individuals (3,280) out of the total population between 25 and 64 years of age (3,886) are in the labor force, with 3.0% or 98 of them being unemployed. The group with the highest labor force participation rate are those with the educational attainment of bachelor's degree or higher, with 91.7% or 1,036 individuals in the labor force. Within the labor force, individuals with college / associate degree education have the highest percentage of unemployment, with 4.8% or 50 of them being unemployed.

| Educational Attainment | In Labor Force | Unemployed |
| Less than High School | 64 (64.6%) | 0 (0.0%) |
| High School Diploma | 1,137 (80.5%) | 23 (1.6%) |
| College / Associate Degree | 1,041 (83.7%) | 60 (4.8%) |
| Bachelor's Degree or higher | 1,036 (91.7%) | 34 (3.0%) |
| Total | 3,280 (84.4%) | 117 (3.0%) |
Employment Occupations by Sex in Latrobe borough
Management, Business, Science and Arts Occupations
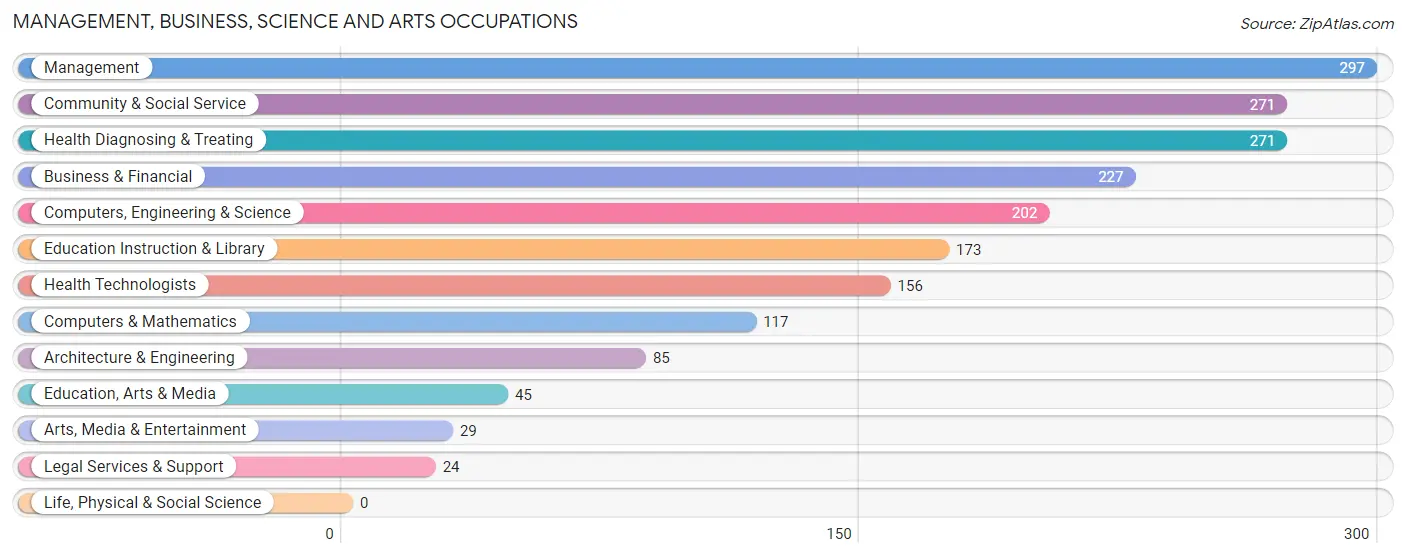
The most common Management, Business, Science and Arts occupations in Latrobe borough are Management (297 | 6.7%), Community & Social Service (271 | 6.1%), Health Diagnosing & Treating (271 | 6.1%), Business & Financial (227 | 5.1%), and Computers, Engineering & Science (202 | 4.6%).
Management, Business, Science and Arts Occupations by Sex
Within the Management, Business, Science and Arts occupations in Latrobe borough, the most male-oriented occupations are Architecture & Engineering (81.2%), Arts, Media & Entertainment (69.0%), and Computers, Engineering & Science (58.4%), while the most female-oriented occupations are Education Instruction & Library (83.2%), Business & Financial (78.4%), and Health Technologists (68.6%).
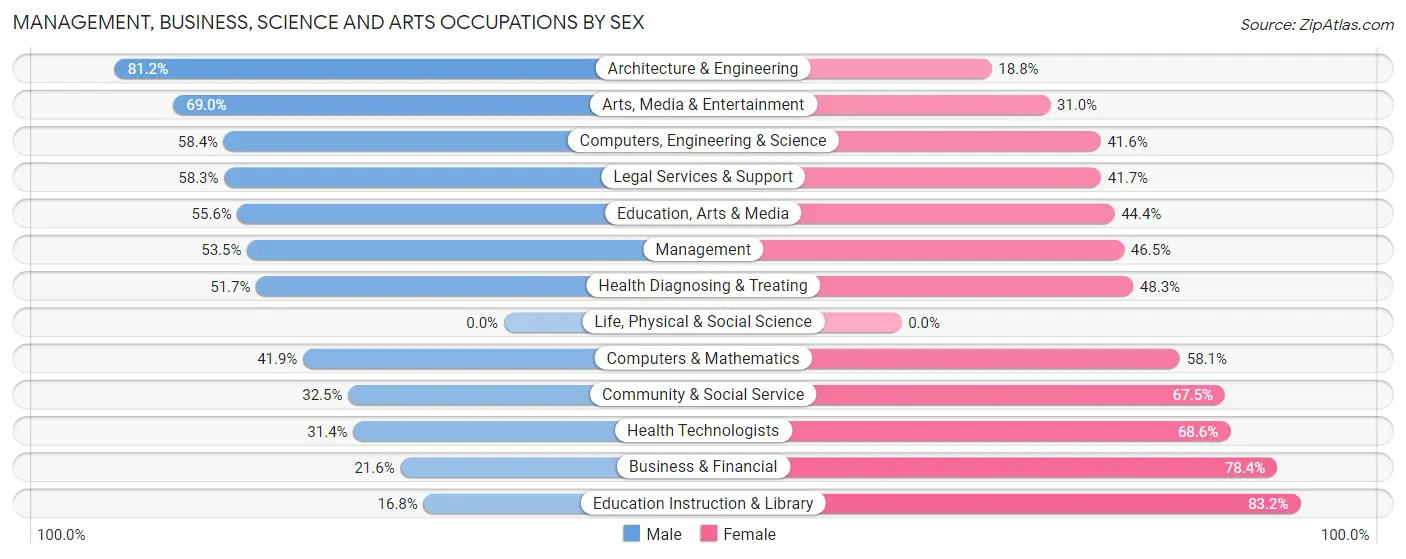
| Occupation | Male | Female |
| Management | 159 (53.5%) | 138 (46.5%) |
| Business & Financial | 49 (21.6%) | 178 (78.4%) |
| Computers, Engineering & Science | 118 (58.4%) | 84 (41.6%) |
| Computers & Mathematics | 49 (41.9%) | 68 (58.1%) |
| Architecture & Engineering | 69 (81.2%) | 16 (18.8%) |
| Life, Physical & Social Science | 0 (0.0%) | 0 (0.0%) |
| Community & Social Service | 88 (32.5%) | 183 (67.5%) |
| Education, Arts & Media | 25 (55.6%) | 20 (44.4%) |
| Legal Services & Support | 14 (58.3%) | 10 (41.7%) |
| Education Instruction & Library | 29 (16.8%) | 144 (83.2%) |
| Arts, Media & Entertainment | 20 (69.0%) | 9 (31.0%) |
| Health Diagnosing & Treating | 140 (51.7%) | 131 (48.3%) |
| Health Technologists | 49 (31.4%) | 107 (68.6%) |
| Total (Category) | 554 (43.7%) | 714 (56.3%) |
| Total (Overall) | 2,290 (51.8%) | 2,130 (48.2%) |
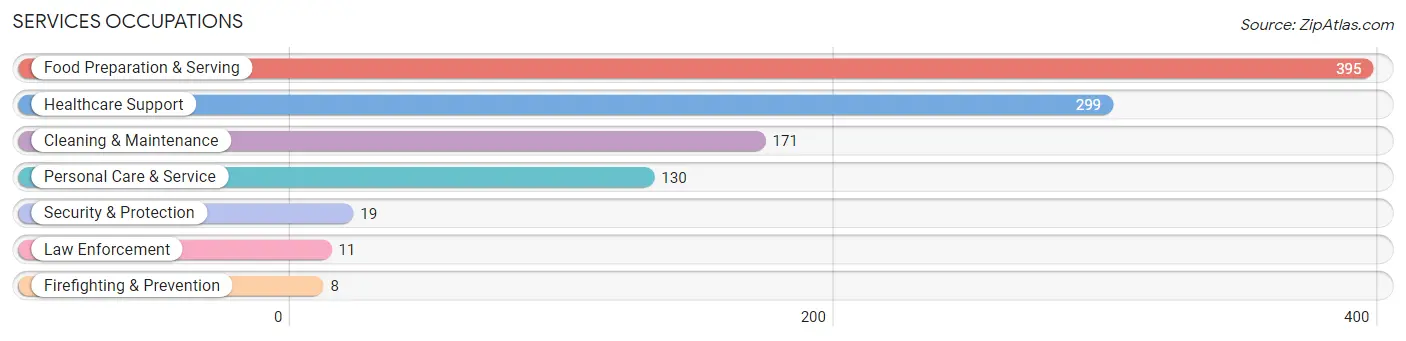
Services Occupations
The most common Services occupations in Latrobe borough are Food Preparation & Serving (395 | 8.9%), Healthcare Support (299 | 6.8%), Cleaning & Maintenance (171 | 3.9%), Personal Care & Service (130 | 2.9%), and Security & Protection (19 | 0.4%).
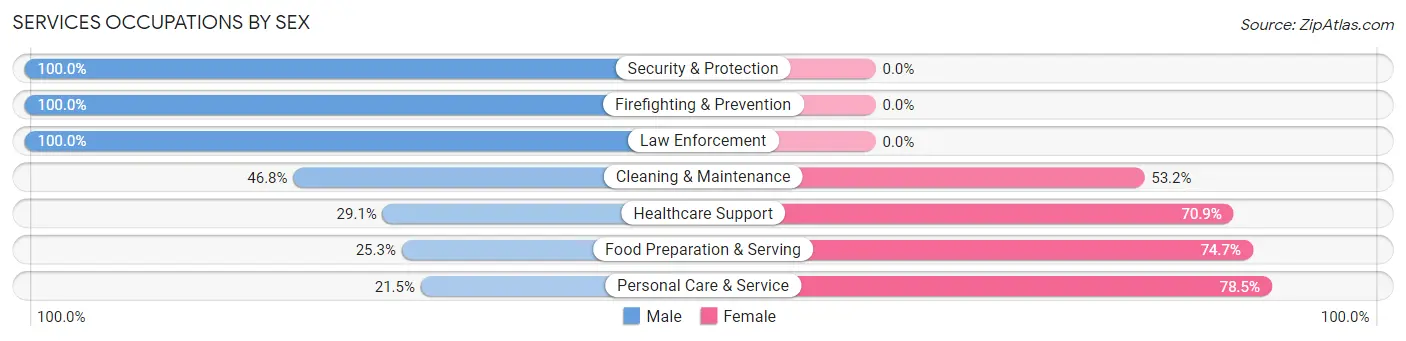
Services Occupations by Sex
Within the Services occupations in Latrobe borough, the most male-oriented occupations are Security & Protection (100.0%), Firefighting & Prevention (100.0%), and Law Enforcement (100.0%), while the most female-oriented occupations are Personal Care & Service (78.5%), Food Preparation & Serving (74.7%), and Healthcare Support (70.9%).
| Occupation | Male | Female |
| Healthcare Support | 87 (29.1%) | 212 (70.9%) |
| Security & Protection | 19 (100.0%) | 0 (0.0%) |
| Firefighting & Prevention | 8 (100.0%) | 0 (0.0%) |
| Law Enforcement | 11 (100.0%) | 0 (0.0%) |
| Food Preparation & Serving | 100 (25.3%) | 295 (74.7%) |
| Cleaning & Maintenance | 80 (46.8%) | 91 (53.2%) |
| Personal Care & Service | 28 (21.5%) | 102 (78.5%) |
| Total (Category) | 314 (31.0%) | 700 (69.0%) |
| Total (Overall) | 2,290 (51.8%) | 2,130 (48.2%) |
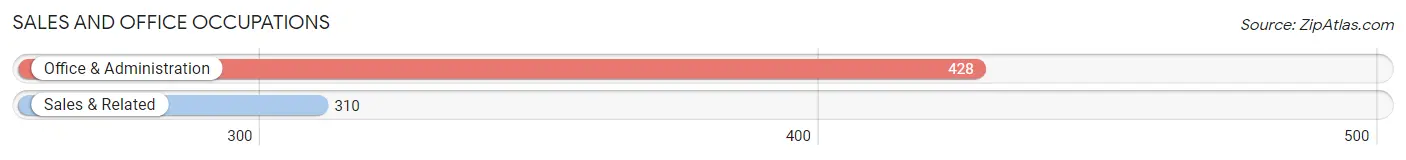
Sales and Office Occupations
The most common Sales and Office occupations in Latrobe borough are Office & Administration (428 | 9.7%), and Sales & Related (310 | 7.0%).
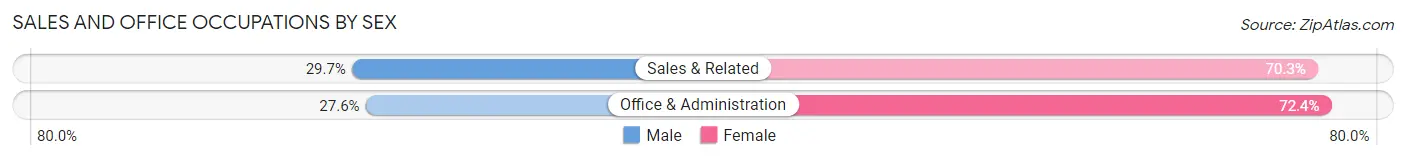
Sales and Office Occupations by Sex
| Occupation | Male | Female |
| Sales & Related | 92 (29.7%) | 218 (70.3%) |
| Office & Administration | 118 (27.6%) | 310 (72.4%) |
| Total (Category) | 210 (28.5%) | 528 (71.5%) |
| Total (Overall) | 2,290 (51.8%) | 2,130 (48.2%) |
Natural Resources, Construction and Maintenance Occupations
The most common Natural Resources, Construction and Maintenance occupations in Latrobe borough are Construction & Extraction (459 | 10.4%), Installation, Maintenance & Repair (130 | 2.9%), and Farming, Fishing & Forestry (9 | 0.2%).
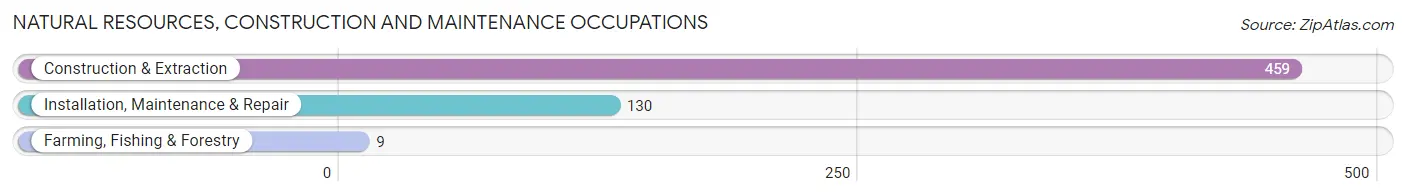
Natural Resources, Construction and Maintenance Occupations by Sex
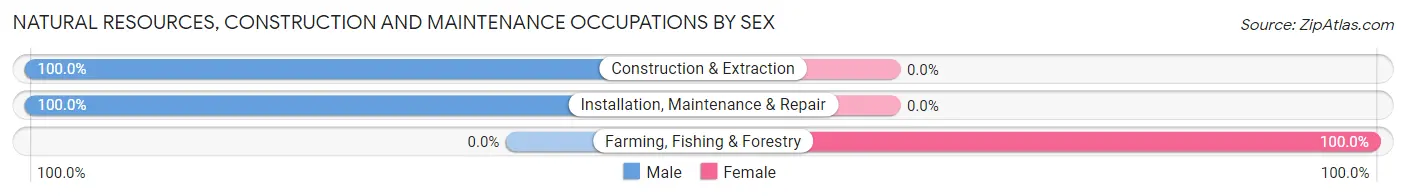
| Occupation | Male | Female |
| Farming, Fishing & Forestry | 0 (0.0%) | 9 (100.0%) |
| Construction & Extraction | 459 (100.0%) | 0 (0.0%) |
| Installation, Maintenance & Repair | 130 (100.0%) | 0 (0.0%) |
| Total (Category) | 589 (98.5%) | 9 (1.5%) |
| Total (Overall) | 2,290 (51.8%) | 2,130 (48.2%) |
Production, Transportation and Moving Occupations
The most common Production, Transportation and Moving occupations in Latrobe borough are Production (538 | 12.2%), Material Moving (148 | 3.4%), and Transportation (116 | 2.6%).
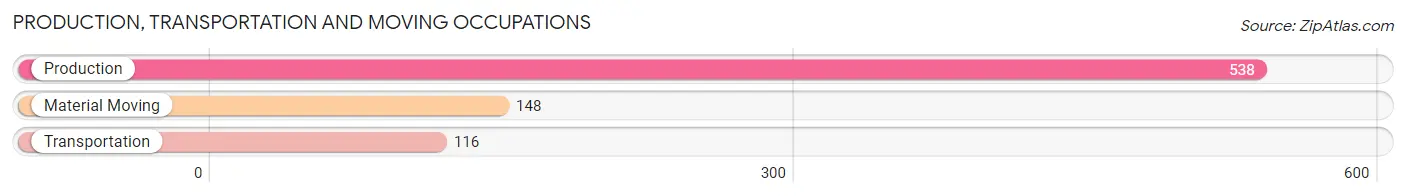
Production, Transportation and Moving Occupations by Sex
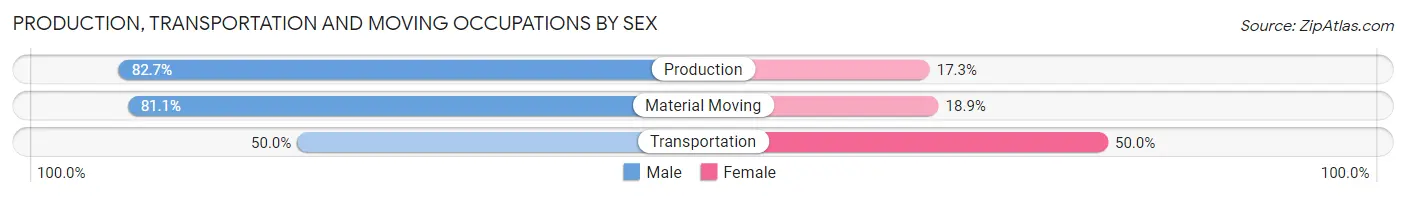
| Occupation | Male | Female |
| Production | 445 (82.7%) | 93 (17.3%) |
| Transportation | 58 (50.0%) | 58 (50.0%) |
| Material Moving | 120 (81.1%) | 28 (18.9%) |
| Total (Category) | 623 (77.7%) | 179 (22.3%) |
| Total (Overall) | 2,290 (51.8%) | 2,130 (48.2%) |
Employment Industries by Sex in Latrobe borough
Employment Industries in Latrobe borough
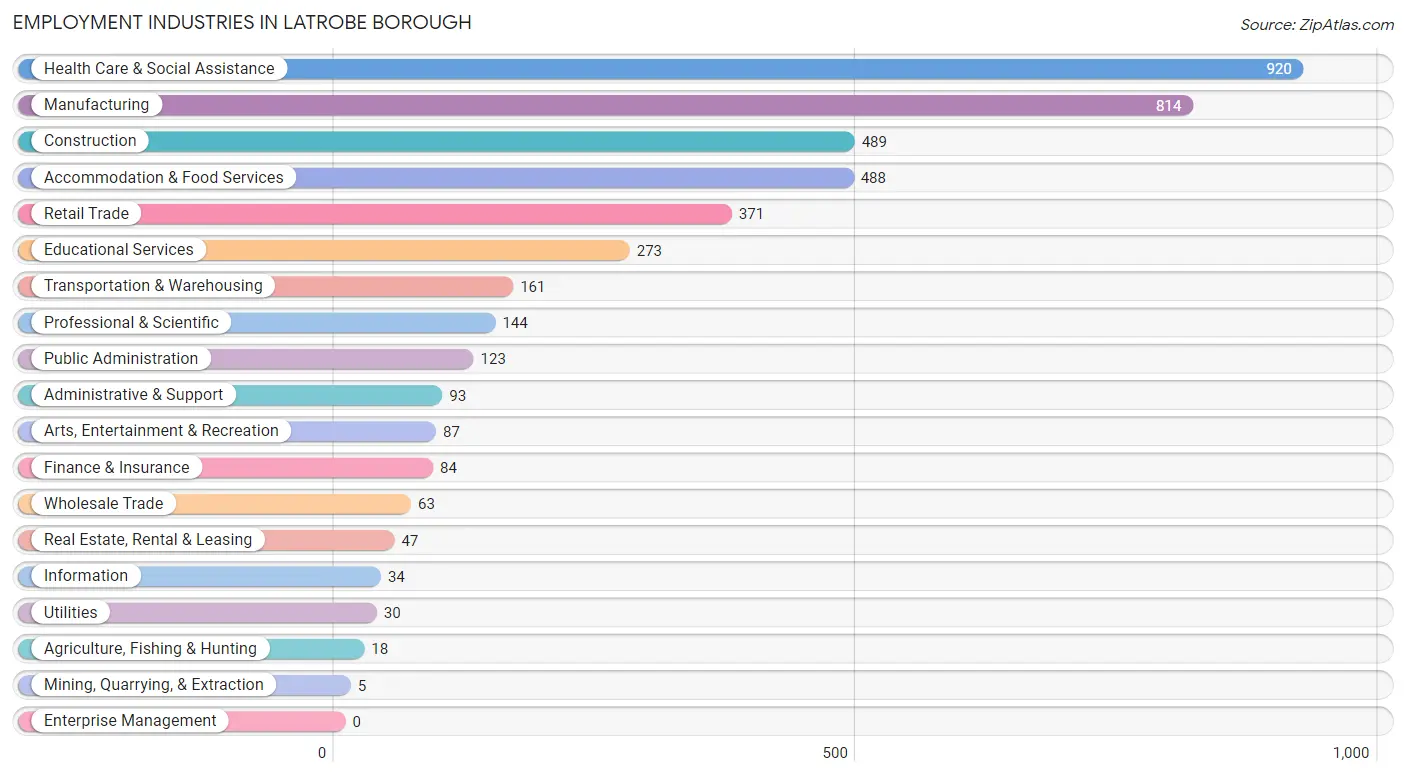
The major employment industries in Latrobe borough include Health Care & Social Assistance (920 | 20.8%), Manufacturing (814 | 18.4%), Construction (489 | 11.1%), Accommodation & Food Services (488 | 11.0%), and Retail Trade (371 | 8.4%).
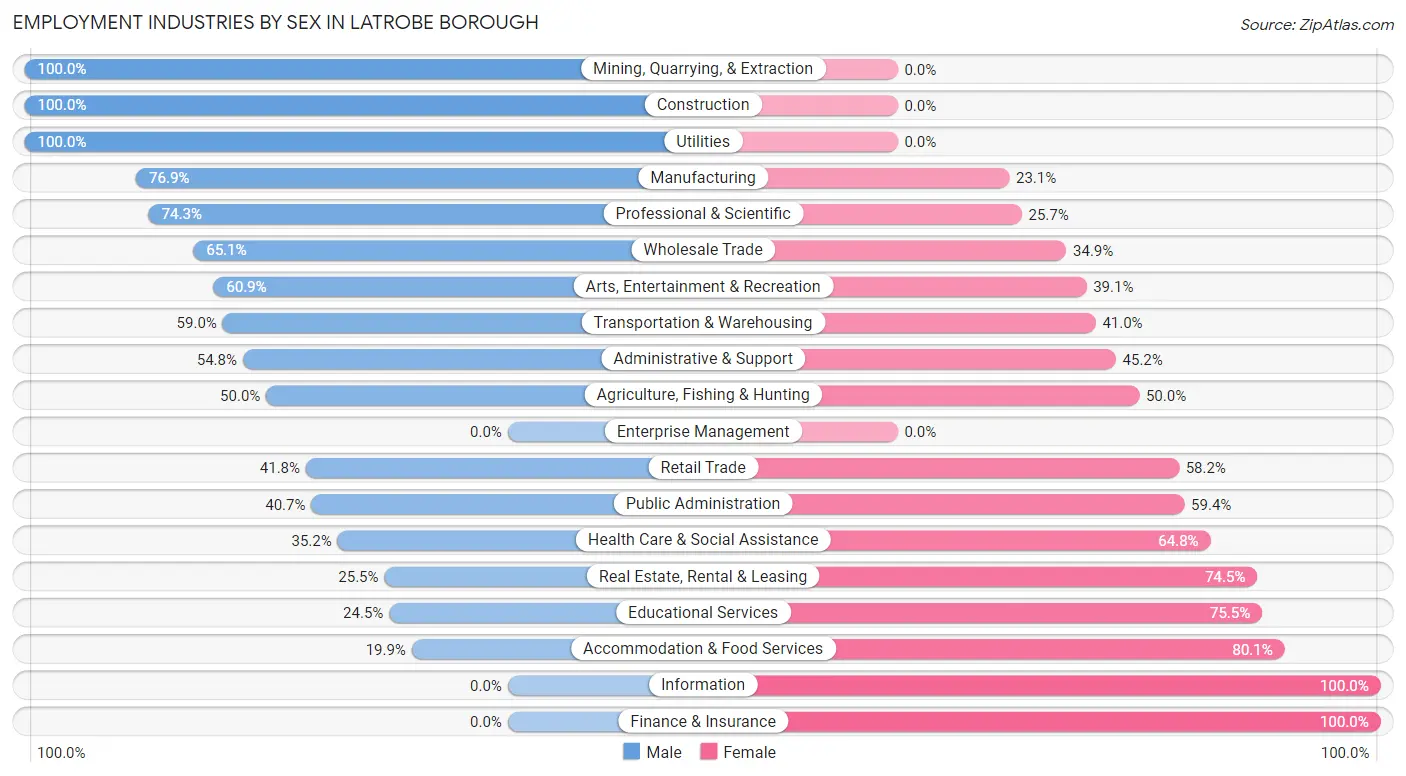
Employment Industries by Sex in Latrobe borough
The Latrobe borough industries that see more men than women are Mining, Quarrying, & Extraction (100.0%), Construction (100.0%), and Utilities (100.0%), whereas the industries that tend to have a higher number of women are Information (100.0%), Finance & Insurance (100.0%), and Accommodation & Food Services (80.1%).
| Industry | Male | Female |
| Agriculture, Fishing & Hunting | 9 (50.0%) | 9 (50.0%) |
| Mining, Quarrying, & Extraction | 5 (100.0%) | 0 (0.0%) |
| Construction | 489 (100.0%) | 0 (0.0%) |
| Manufacturing | 626 (76.9%) | 188 (23.1%) |
| Wholesale Trade | 41 (65.1%) | 22 (34.9%) |
| Retail Trade | 155 (41.8%) | 216 (58.2%) |
| Transportation & Warehousing | 95 (59.0%) | 66 (41.0%) |
| Utilities | 30 (100.0%) | 0 (0.0%) |
| Information | 0 (0.0%) | 34 (100.0%) |
| Finance & Insurance | 0 (0.0%) | 84 (100.0%) |
| Real Estate, Rental & Leasing | 12 (25.5%) | 35 (74.5%) |
| Professional & Scientific | 107 (74.3%) | 37 (25.7%) |
| Enterprise Management | 0 (0.0%) | 0 (0.0%) |
| Administrative & Support | 51 (54.8%) | 42 (45.2%) |
| Educational Services | 67 (24.5%) | 206 (75.5%) |
| Health Care & Social Assistance | 324 (35.2%) | 596 (64.8%) |
| Arts, Entertainment & Recreation | 53 (60.9%) | 34 (39.1%) |
| Accommodation & Food Services | 97 (19.9%) | 391 (80.1%) |
| Public Administration | 50 (40.6%) | 73 (59.4%) |
| Total | 2,290 (51.8%) | 2,130 (48.2%) |
Education in Latrobe borough
School Enrollment in Latrobe borough
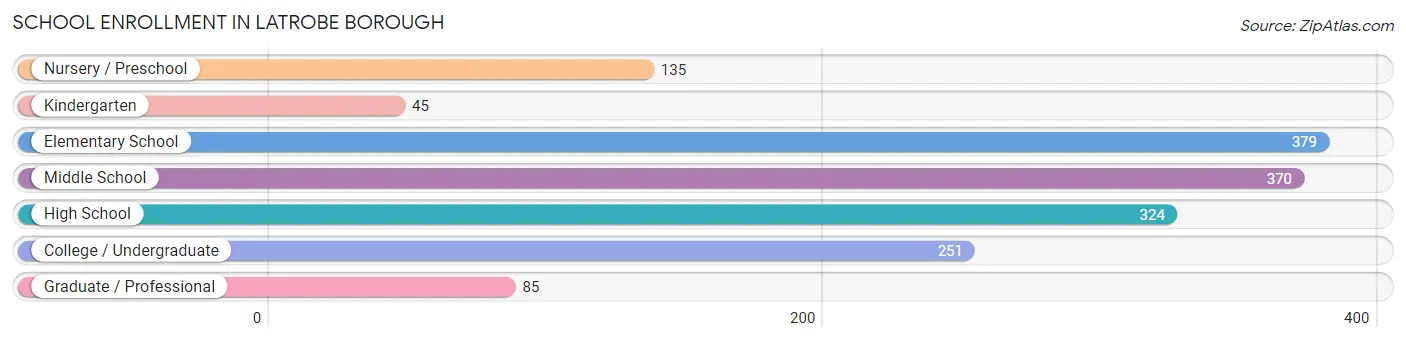
The most common levels of schooling among the 1,589 students in Latrobe borough are elementary school (379 | 23.8%), middle school (370 | 23.3%), and high school (324 | 20.4%).
| School Level | # Students | % Students |
| Nursery / Preschool | 135 | 8.5% |
| Kindergarten | 45 | 2.8% |
| Elementary School | 379 | 23.8% |
| Middle School | 370 | 23.3% |
| High School | 324 | 20.4% |
| College / Undergraduate | 251 | 15.8% |
| Graduate / Professional | 85 | 5.3% |
| Total | 1,589 | 100.0% |
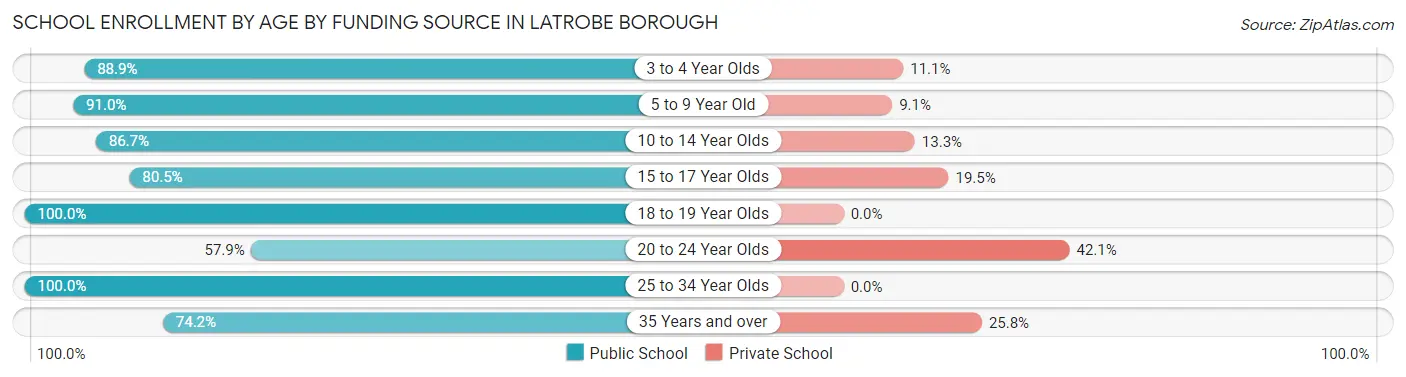
School Enrollment by Age by Funding Source in Latrobe borough
Out of a total of 1,589 students who are enrolled in schools in Latrobe borough, 256 (16.1%) attend a private institution, while the remaining 1,333 (83.9%) are enrolled in public schools. The age group of 20 to 24 year olds has the highest likelihood of being enrolled in private schools, with 85 (42.1% in the age bracket) enrolled. Conversely, the age group of 18 to 19 year olds has the lowest likelihood of being enrolled in a private school, with 78 (100.0% in the age bracket) attending a public institution.
| Age Bracket | Public School | Private School |
| 3 to 4 Year Olds | 88 (88.9%) | 11 (11.1%) |
| 5 to 9 Year Old | 372 (90.9%) | 37 (9.0%) |
| 10 to 14 Year Olds | 366 (86.7%) | 56 (13.3%) |
| 15 to 17 Year Olds | 206 (80.5%) | 50 (19.5%) |
| 18 to 19 Year Olds | 78 (100.0%) | 0 (0.0%) |
| 20 to 24 Year Olds | 117 (57.9%) | 85 (42.1%) |
| 25 to 34 Year Olds | 57 (100.0%) | 0 (0.0%) |
| 35 Years and over | 49 (74.2%) | 17 (25.8%) |
| Total | 1,333 (83.9%) | 256 (16.1%) |
Educational Attainment by Field of Study in Latrobe borough
Business (430 | 29.1%), education (205 | 13.9%), communications (162 | 11.0%), science & technology (123 | 8.3%), and liberal arts & history (106 | 7.2%) are the most common fields of study among 1,475 individuals in Latrobe borough who have obtained a bachelor's degree or higher.
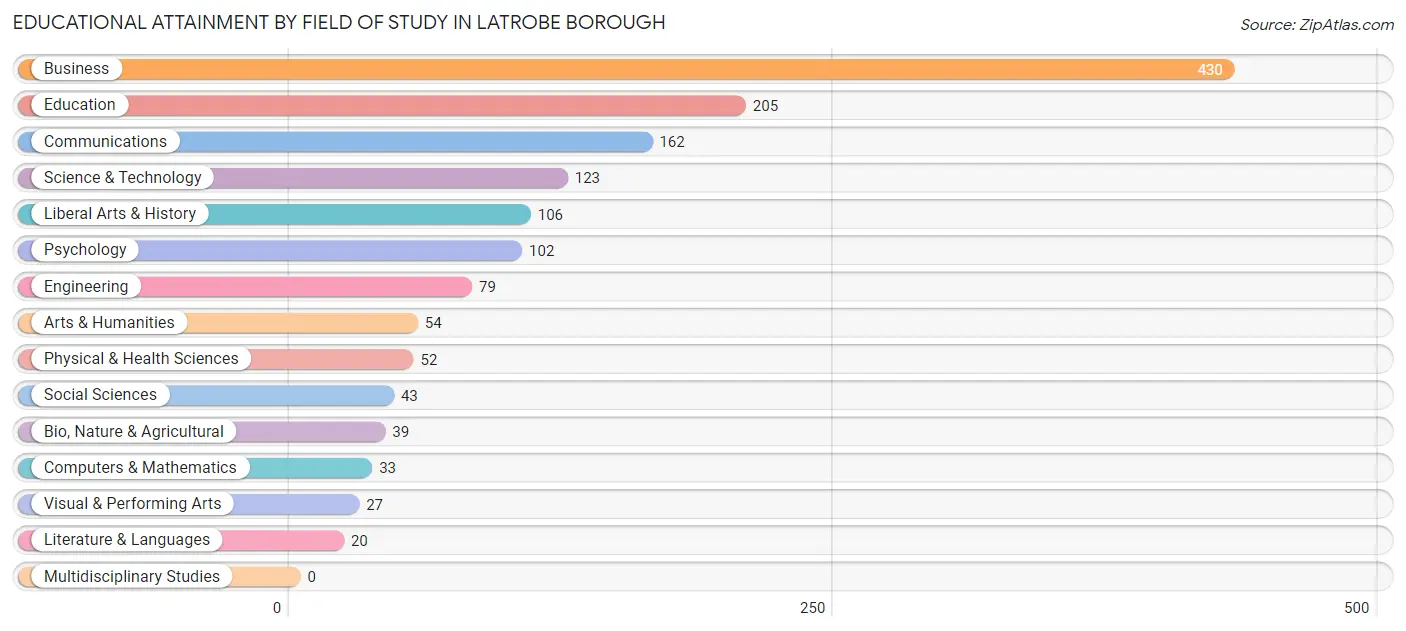
| Field of Study | # Graduates | % Graduates |
| Computers & Mathematics | 33 | 2.2% |
| Bio, Nature & Agricultural | 39 | 2.6% |
| Physical & Health Sciences | 52 | 3.5% |
| Psychology | 102 | 6.9% |
| Social Sciences | 43 | 2.9% |
| Engineering | 79 | 5.4% |
| Multidisciplinary Studies | 0 | 0.0% |
| Science & Technology | 123 | 8.3% |
| Business | 430 | 29.1% |
| Education | 205 | 13.9% |
| Literature & Languages | 20 | 1.4% |
| Liberal Arts & History | 106 | 7.2% |
| Visual & Performing Arts | 27 | 1.8% |
| Communications | 162 | 11.0% |
| Arts & Humanities | 54 | 3.7% |
| Total | 1,475 | 100.0% |
Transportation & Commute in Latrobe borough
Vehicle Availability by Sex in Latrobe borough
The most prevalent vehicle ownership categories in Latrobe borough are males with 2 vehicles (742, accounting for 32.7%) and females with 2 vehicles (779, making up 36.7%).
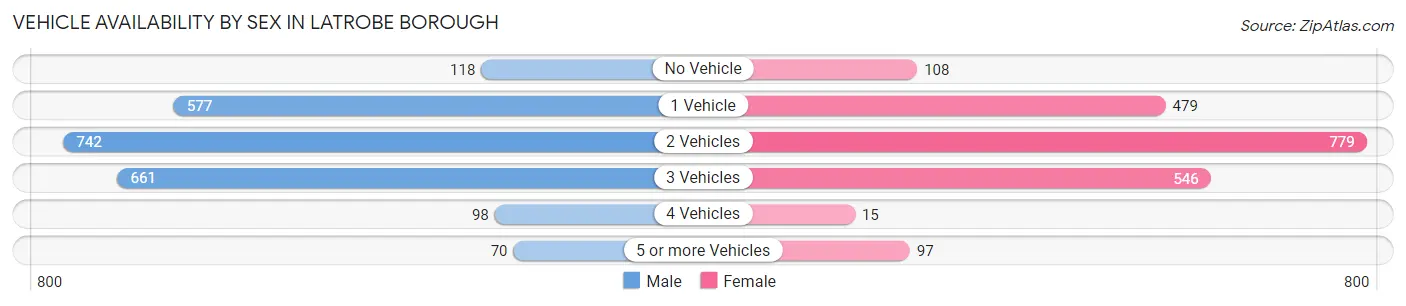
| Vehicles Available | Male | Female |
| No Vehicle | 118 (5.2%) | 108 (5.3%) |
| 1 Vehicle | 577 (25.5%) | 479 (23.7%) |
| 2 Vehicles | 742 (32.7%) | 779 (38.5%) |
| 3 Vehicles | 661 (29.2%) | 546 (27.0%) |
| 4 Vehicles | 98 (4.3%) | 15 (0.7%) |
| 5 or more Vehicles | 70 (3.1%) | 97 (4.8%) |
| Total | 2,266 (100.0%) | 2,024 (100.0%) |
Commute Time in Latrobe borough
The most frequently occuring commute durations in Latrobe borough are 5 to 9 minutes (824 commuters, 19.9%), 10 to 14 minutes (664 commuters, 16.0%), and 15 to 19 minutes (663 commuters, 16.0%).
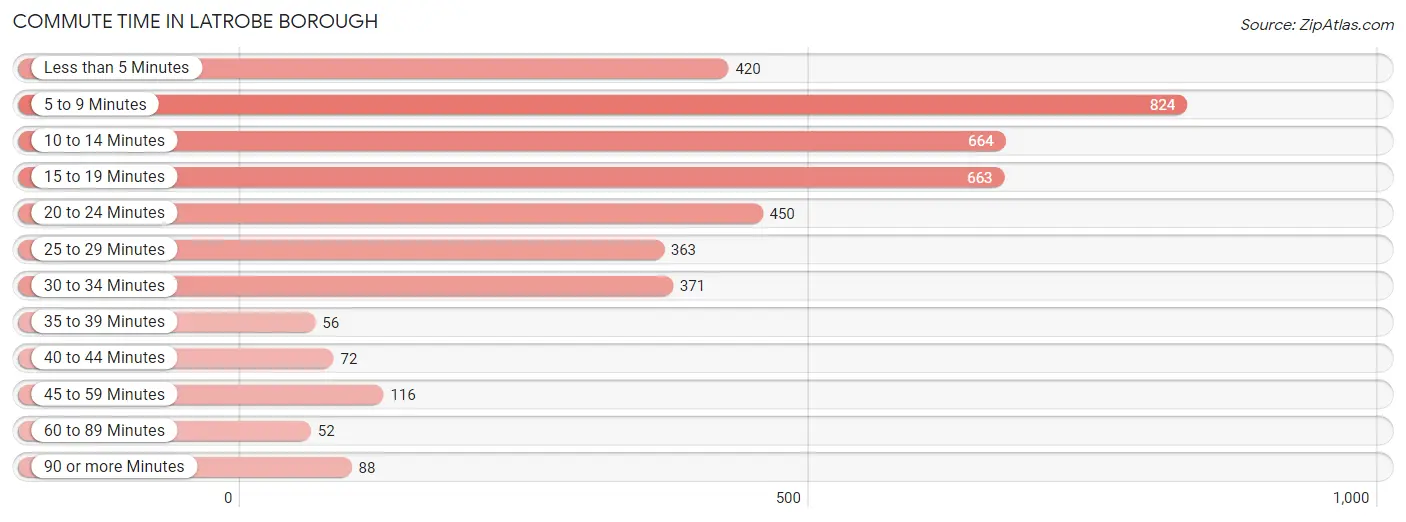
| Commute Time | # Commuters | % Commuters |
| Less than 5 Minutes | 420 | 10.2% |
| 5 to 9 Minutes | 824 | 19.9% |
| 10 to 14 Minutes | 664 | 16.0% |
| 15 to 19 Minutes | 663 | 16.0% |
| 20 to 24 Minutes | 450 | 10.9% |
| 25 to 29 Minutes | 363 | 8.8% |
| 30 to 34 Minutes | 371 | 9.0% |
| 35 to 39 Minutes | 56 | 1.3% |
| 40 to 44 Minutes | 72 | 1.7% |
| 45 to 59 Minutes | 116 | 2.8% |
| 60 to 89 Minutes | 52 | 1.3% |
| 90 or more Minutes | 88 | 2.1% |
Commute Time by Sex in Latrobe borough
The most common commute times in Latrobe borough are 5 to 9 minutes (449 commuters, 20.3%) for males and 5 to 9 minutes (375 commuters, 19.4%) for females.
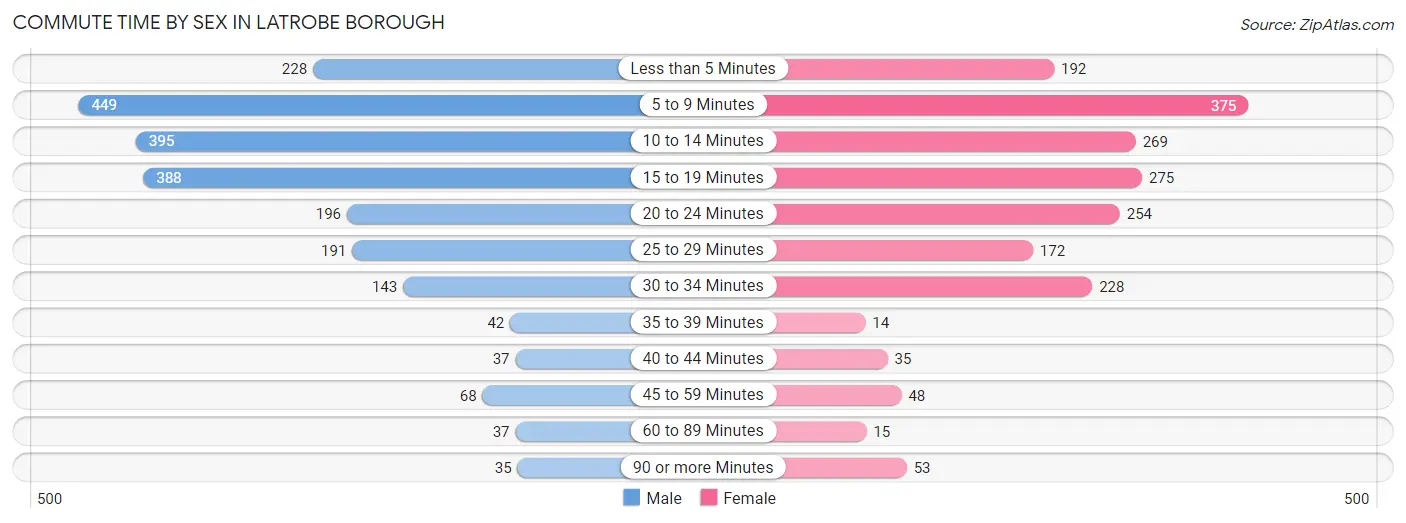
| Commute Time | Male | Female |
| Less than 5 Minutes | 228 (10.3%) | 192 (10.0%) |
| 5 to 9 Minutes | 449 (20.3%) | 375 (19.4%) |
| 10 to 14 Minutes | 395 (17.9%) | 269 (13.9%) |
| 15 to 19 Minutes | 388 (17.6%) | 275 (14.2%) |
| 20 to 24 Minutes | 196 (8.9%) | 254 (13.2%) |
| 25 to 29 Minutes | 191 (8.6%) | 172 (8.9%) |
| 30 to 34 Minutes | 143 (6.5%) | 228 (11.8%) |
| 35 to 39 Minutes | 42 (1.9%) | 14 (0.7%) |
| 40 to 44 Minutes | 37 (1.7%) | 35 (1.8%) |
| 45 to 59 Minutes | 68 (3.1%) | 48 (2.5%) |
| 60 to 89 Minutes | 37 (1.7%) | 15 (0.8%) |
| 90 or more Minutes | 35 (1.6%) | 53 (2.8%) |
Time of Departure to Work by Sex in Latrobe borough
The most frequent times of departure to work in Latrobe borough are 7:00 AM to 7:29 AM (378, 17.1%) for males and 7:30 AM to 7:59 AM (279, 14.5%) for females.
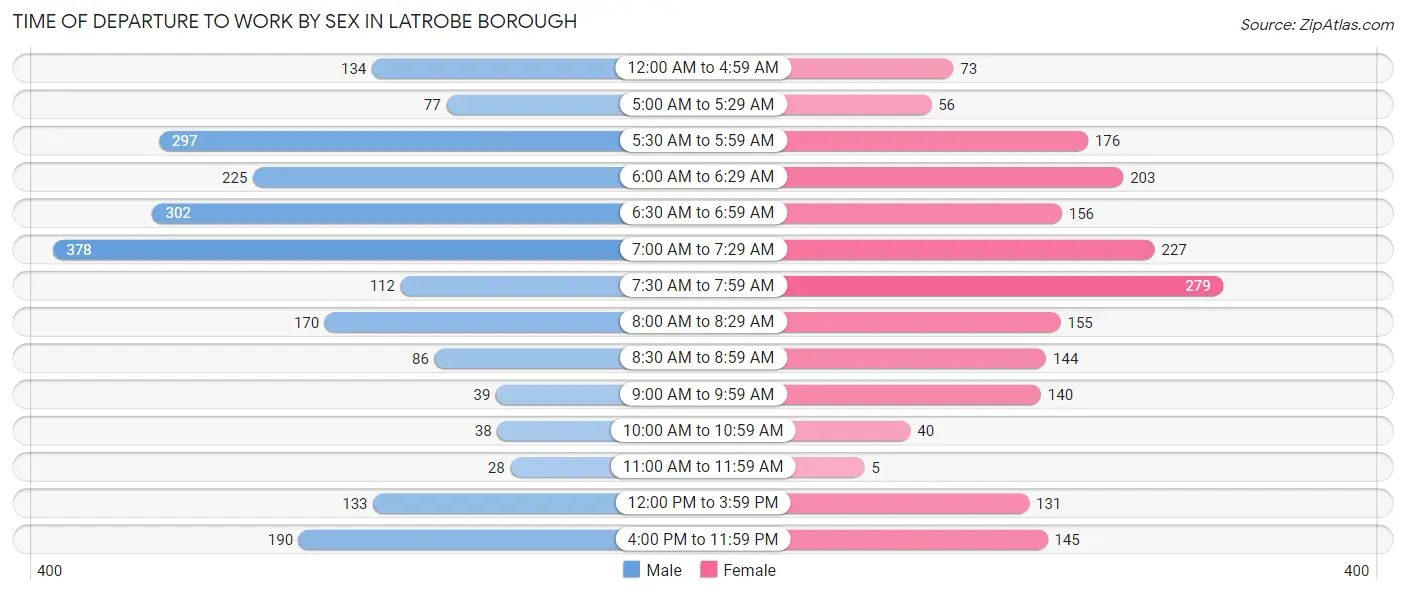
| Time of Departure | Male | Female |
| 12:00 AM to 4:59 AM | 134 (6.1%) | 73 (3.8%) |
| 5:00 AM to 5:29 AM | 77 (3.5%) | 56 (2.9%) |
| 5:30 AM to 5:59 AM | 297 (13.4%) | 176 (9.1%) |
| 6:00 AM to 6:29 AM | 225 (10.2%) | 203 (10.5%) |
| 6:30 AM to 6:59 AM | 302 (13.7%) | 156 (8.1%) |
| 7:00 AM to 7:29 AM | 378 (17.1%) | 227 (11.8%) |
| 7:30 AM to 7:59 AM | 112 (5.1%) | 279 (14.5%) |
| 8:00 AM to 8:29 AM | 170 (7.7%) | 155 (8.0%) |
| 8:30 AM to 8:59 AM | 86 (3.9%) | 144 (7.5%) |
| 9:00 AM to 9:59 AM | 39 (1.8%) | 140 (7.2%) |
| 10:00 AM to 10:59 AM | 38 (1.7%) | 40 (2.1%) |
| 11:00 AM to 11:59 AM | 28 (1.3%) | 5 (0.3%) |
| 12:00 PM to 3:59 PM | 133 (6.0%) | 131 (6.8%) |
| 4:00 PM to 11:59 PM | 190 (8.6%) | 145 (7.5%) |
| Total | 2,209 (100.0%) | 1,930 (100.0%) |
Housing Occupancy in Latrobe borough
Occupancy by Ownership in Latrobe borough
Of the total 3,688 dwellings in Latrobe borough, owner-occupied units account for 2,516 (68.2%), while renter-occupied units make up 1,172 (31.8%).
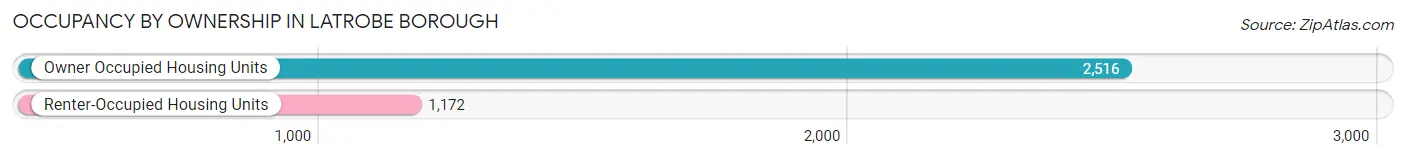
| Occupancy | # Housing Units | % Housing Units |
| Owner Occupied Housing Units | 2,516 | 68.2% |
| Renter-Occupied Housing Units | 1,172 | 31.8% |
| Total Occupied Housing Units | 3,688 | 100.0% |
Occupancy by Household Size in Latrobe borough
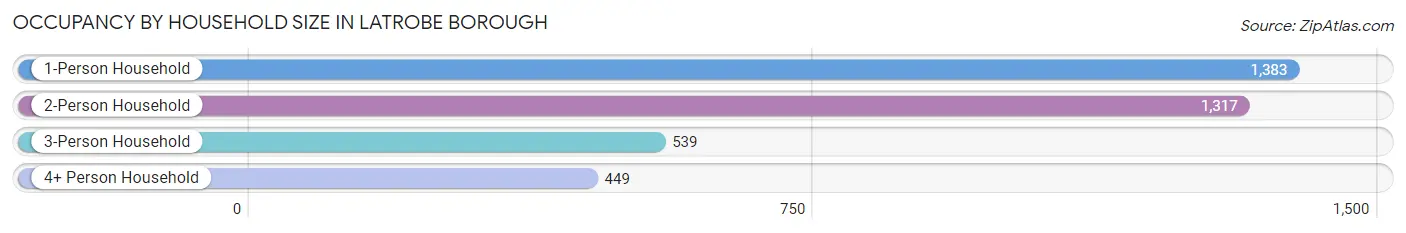
| Household Size | # Housing Units | % Housing Units |
| 1-Person Household | 1,383 | 37.5% |
| 2-Person Household | 1,317 | 35.7% |
| 3-Person Household | 539 | 14.6% |
| 4+ Person Household | 449 | 12.2% |
| Total Housing Units | 3,688 | 100.0% |
Occupancy by Ownership by Household Size in Latrobe borough
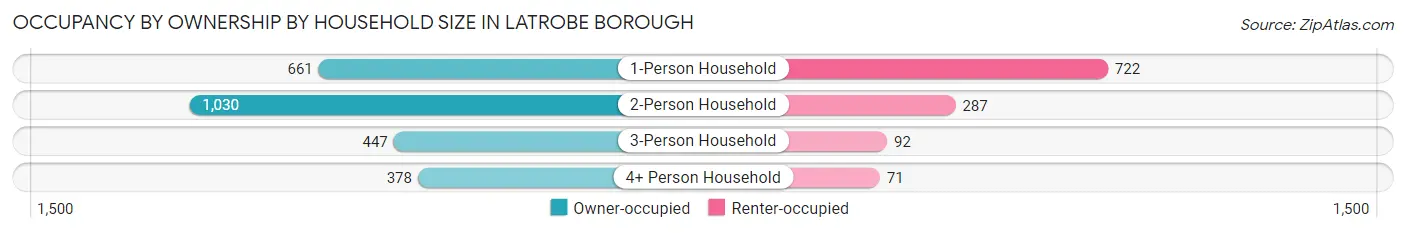
| Household Size | Owner-occupied | Renter-occupied |
| 1-Person Household | 661 (47.8%) | 722 (52.2%) |
| 2-Person Household | 1,030 (78.2%) | 287 (21.8%) |
| 3-Person Household | 447 (82.9%) | 92 (17.1%) |
| 4+ Person Household | 378 (84.2%) | 71 (15.8%) |
| Total Housing Units | 2,516 (68.2%) | 1,172 (31.8%) |
Occupancy by Educational Attainment in Latrobe borough
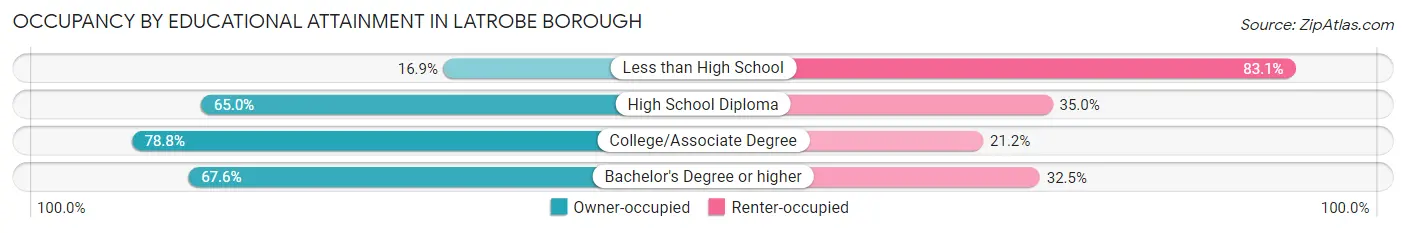
| Household Size | Owner-occupied | Renter-occupied |
| Less than High School | 25 (16.9%) | 123 (83.1%) |
| High School Diploma | 949 (65.0%) | 510 (35.0%) |
| College/Associate Degree | 955 (78.8%) | 257 (21.2%) |
| Bachelor's Degree or higher | 587 (67.5%) | 282 (32.5%) |
Occupancy by Age of Householder in Latrobe borough
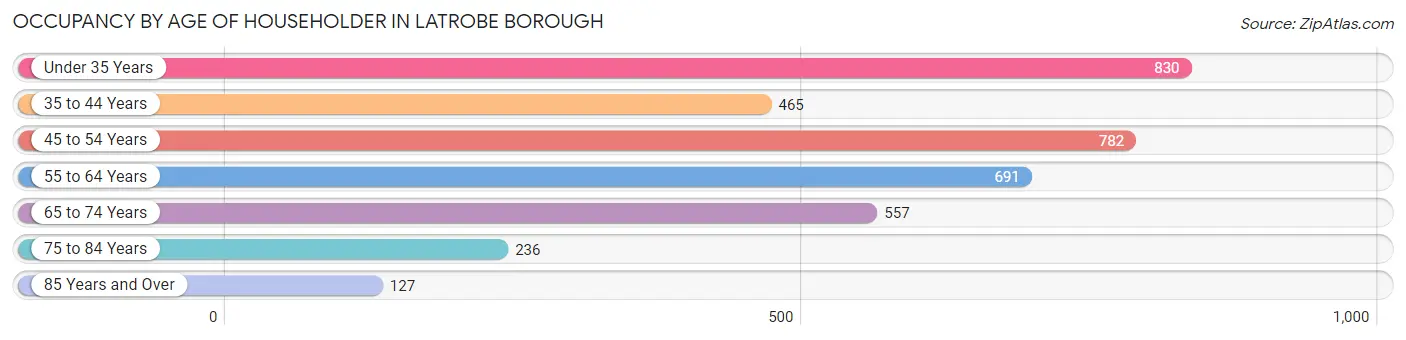
| Age Bracket | # Households | % Households |
| Under 35 Years | 830 | 22.5% |
| 35 to 44 Years | 465 | 12.6% |
| 45 to 54 Years | 782 | 21.2% |
| 55 to 64 Years | 691 | 18.7% |
| 65 to 74 Years | 557 | 15.1% |
| 75 to 84 Years | 236 | 6.4% |
| 85 Years and Over | 127 | 3.4% |
| Total | 3,688 | 100.0% |
Housing Finances in Latrobe borough
Median Income by Occupancy in Latrobe borough
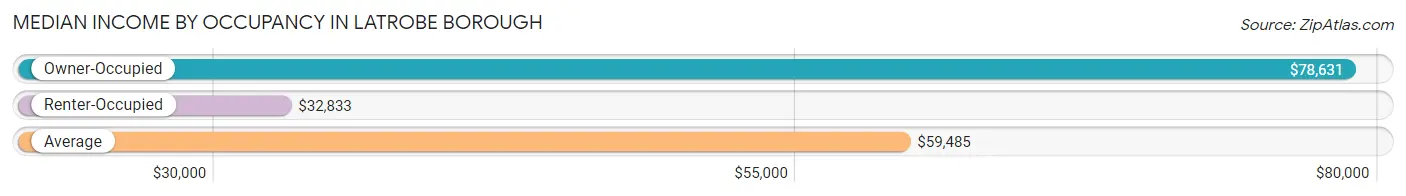
| Occupancy Type | # Households | Median Income |
| Owner-Occupied | 2,516 (68.2%) | $78,631 |
| Renter-Occupied | 1,172 (31.8%) | $32,833 |
| Average | 3,688 (100.0%) | $59,485 |
Occupancy by Householder Income Bracket in Latrobe borough
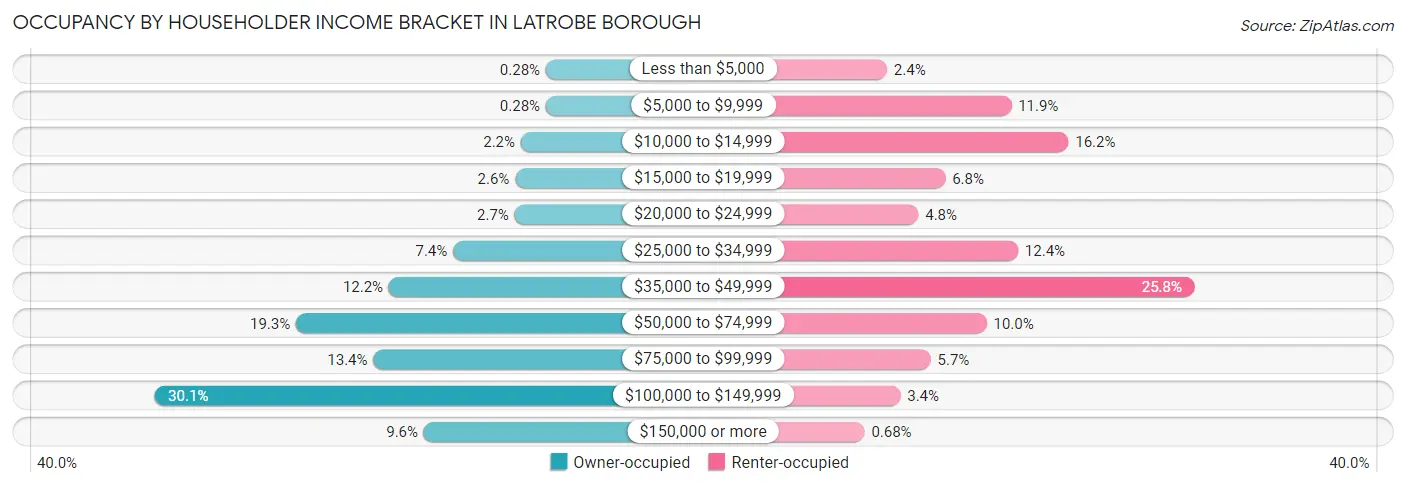
| Income Bracket | Owner-occupied | Renter-occupied |
| Less than $5,000 | 7 (0.3%) | 28 (2.4%) |
| $5,000 to $9,999 | 7 (0.3%) | 139 (11.9%) |
| $10,000 to $14,999 | 55 (2.2%) | 190 (16.2%) |
| $15,000 to $19,999 | 66 (2.6%) | 80 (6.8%) |
| $20,000 to $24,999 | 67 (2.7%) | 56 (4.8%) |
| $25,000 to $34,999 | 185 (7.3%) | 145 (12.4%) |
| $35,000 to $49,999 | 308 (12.2%) | 302 (25.8%) |
| $50,000 to $74,999 | 486 (19.3%) | 117 (10.0%) |
| $75,000 to $99,999 | 338 (13.4%) | 67 (5.7%) |
| $100,000 to $149,999 | 756 (30.0%) | 40 (3.4%) |
| $150,000 or more | 241 (9.6%) | 8 (0.7%) |
| Total | 2,516 (100.0%) | 1,172 (100.0%) |
Monthly Housing Cost Tiers in Latrobe borough
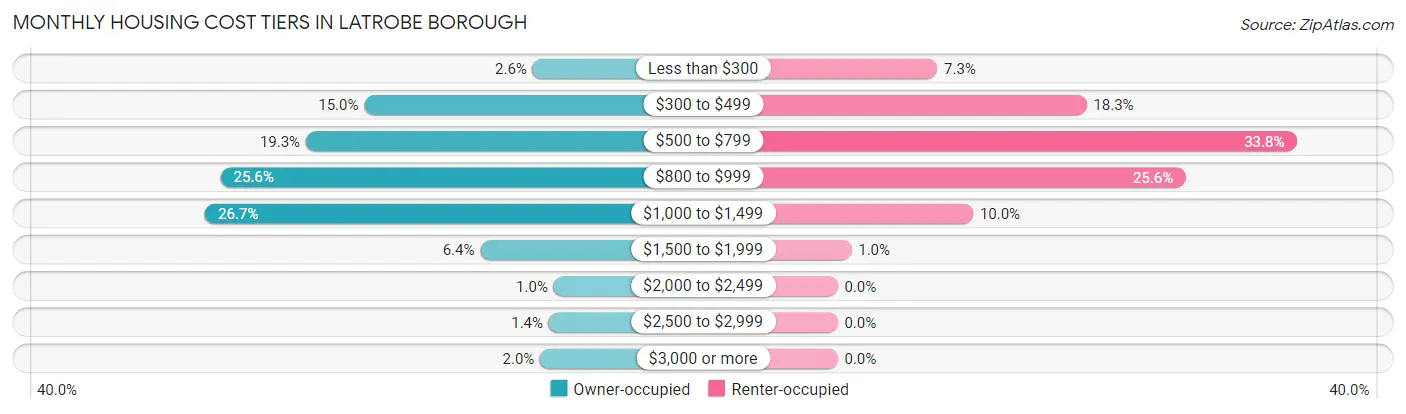
| Monthly Cost | Owner-occupied | Renter-occupied |
| Less than $300 | 65 (2.6%) | 86 (7.3%) |
| $300 to $499 | 377 (15.0%) | 215 (18.3%) |
| $500 to $799 | 485 (19.3%) | 396 (33.8%) |
| $800 to $999 | 643 (25.6%) | 300 (25.6%) |
| $1,000 to $1,499 | 672 (26.7%) | 117 (10.0%) |
| $1,500 to $1,999 | 162 (6.4%) | 12 (1.0%) |
| $2,000 to $2,499 | 26 (1.0%) | 0 (0.0%) |
| $2,500 to $2,999 | 35 (1.4%) | 0 (0.0%) |
| $3,000 or more | 51 (2.0%) | 0 (0.0%) |
| Total | 2,516 (100.0%) | 1,172 (100.0%) |
Physical Housing Characteristics in Latrobe borough
Housing Structures in Latrobe borough
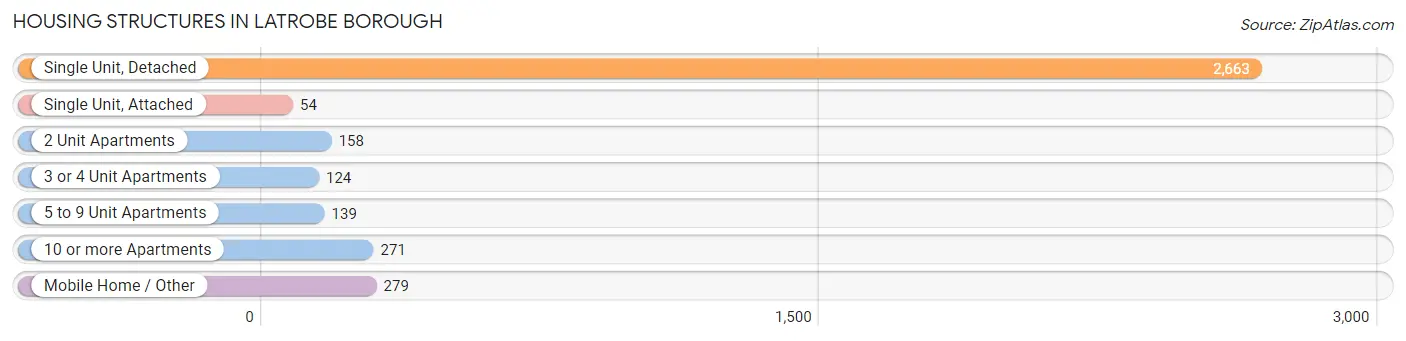
| Structure Type | # Housing Units | % Housing Units |
| Single Unit, Detached | 2,663 | 72.2% |
| Single Unit, Attached | 54 | 1.5% |
| 2 Unit Apartments | 158 | 4.3% |
| 3 or 4 Unit Apartments | 124 | 3.4% |
| 5 to 9 Unit Apartments | 139 | 3.8% |
| 10 or more Apartments | 271 | 7.3% |
| Mobile Home / Other | 279 | 7.6% |
| Total | 3,688 | 100.0% |
Housing Structures by Occupancy in Latrobe borough
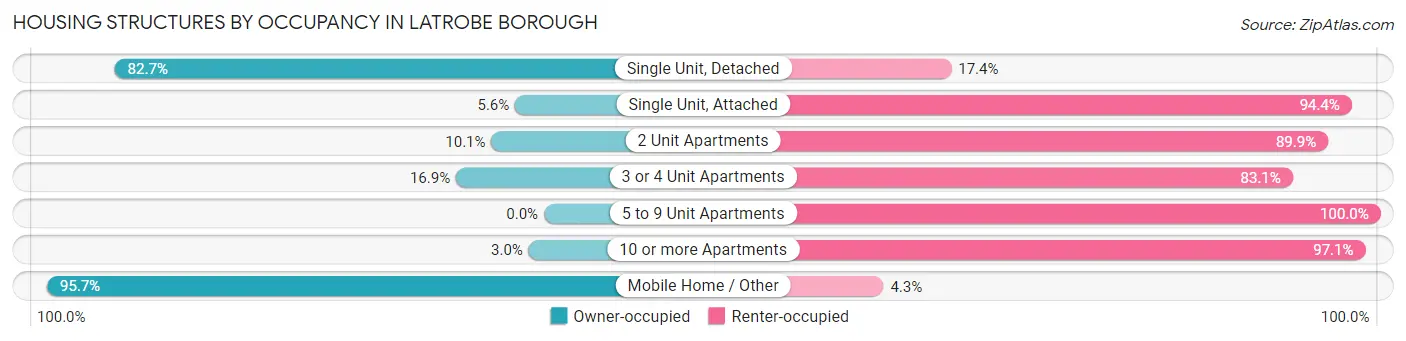
| Structure Type | Owner-occupied | Renter-occupied |
| Single Unit, Detached | 2,201 (82.7%) | 462 (17.3%) |
| Single Unit, Attached | 3 (5.6%) | 51 (94.4%) |
| 2 Unit Apartments | 16 (10.1%) | 142 (89.9%) |
| 3 or 4 Unit Apartments | 21 (16.9%) | 103 (83.1%) |
| 5 to 9 Unit Apartments | 0 (0.0%) | 139 (100.0%) |
| 10 or more Apartments | 8 (2.9%) | 263 (97.1%) |
| Mobile Home / Other | 267 (95.7%) | 12 (4.3%) |
| Total | 2,516 (68.2%) | 1,172 (31.8%) |
Housing Structures by Number of Rooms in Latrobe borough
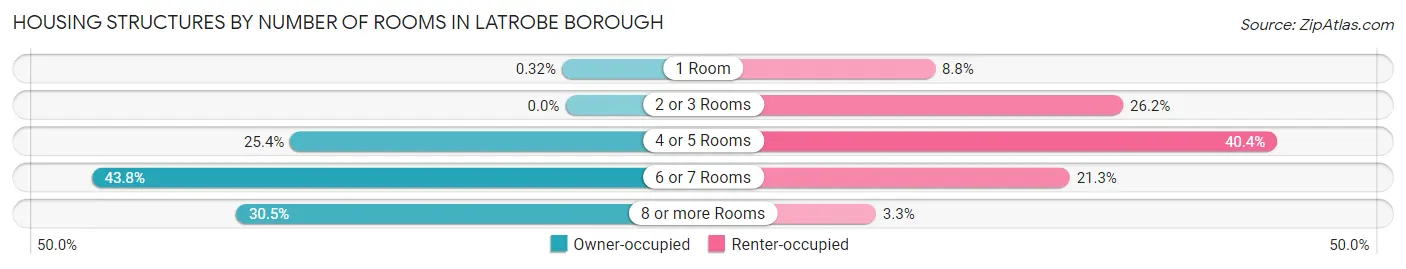
| Number of Rooms | Owner-occupied | Renter-occupied |
| 1 Room | 8 (0.3%) | 103 (8.8%) |
| 2 or 3 Rooms | 0 (0.0%) | 307 (26.2%) |
| 4 or 5 Rooms | 640 (25.4%) | 474 (40.4%) |
| 6 or 7 Rooms | 1,102 (43.8%) | 249 (21.2%) |
| 8 or more Rooms | 766 (30.4%) | 39 (3.3%) |
| Total | 2,516 (100.0%) | 1,172 (100.0%) |
Housing Structure by Heating Type in Latrobe borough
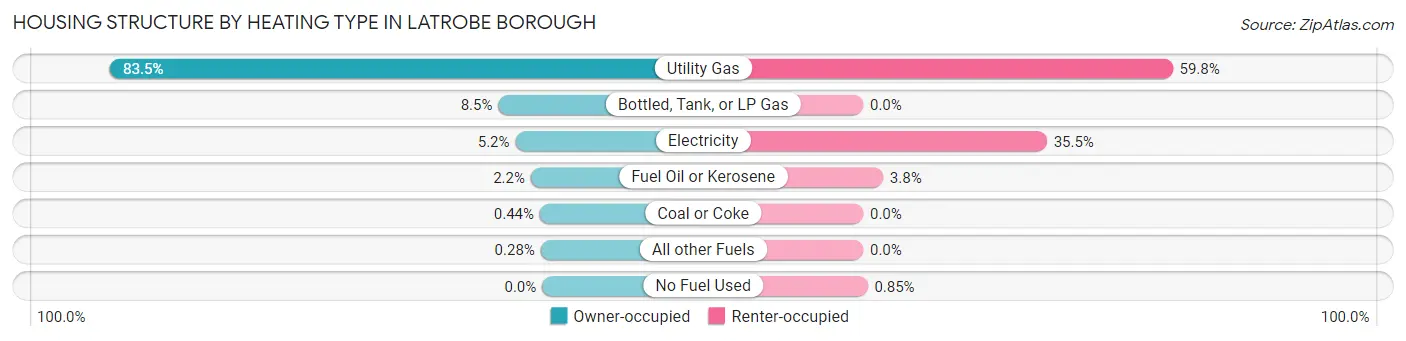
| Heating Type | Owner-occupied | Renter-occupied |
| Utility Gas | 2,100 (83.5%) | 701 (59.8%) |
| Bottled, Tank, or LP Gas | 213 (8.5%) | 0 (0.0%) |
| Electricity | 130 (5.2%) | 416 (35.5%) |
| Fuel Oil or Kerosene | 55 (2.2%) | 45 (3.8%) |
| Coal or Coke | 11 (0.4%) | 0 (0.0%) |
| All other Fuels | 7 (0.3%) | 0 (0.0%) |
| No Fuel Used | 0 (0.0%) | 10 (0.9%) |
| Total | 2,516 (100.0%) | 1,172 (100.0%) |
Household Vehicle Usage in Latrobe borough
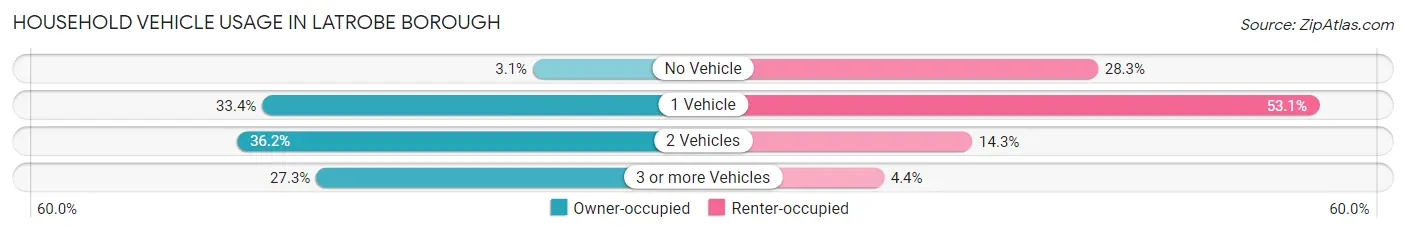
| Vehicles per Household | Owner-occupied | Renter-occupied |
| No Vehicle | 77 (3.1%) | 332 (28.3%) |
| 1 Vehicle | 840 (33.4%) | 622 (53.1%) |
| 2 Vehicles | 911 (36.2%) | 167 (14.2%) |
| 3 or more Vehicles | 688 (27.3%) | 51 (4.3%) |
| Total | 2,516 (100.0%) | 1,172 (100.0%) |
Real Estate & Mortgages in Latrobe borough
Real Estate and Mortgage Overview in Latrobe borough
| Characteristic | Without Mortgage | With Mortgage |
| Housing Units | 801 | 1,715 |
| Median Property Value | $149,500 | $125,300 |
| Median Household Income | $55,063 | $213 |
| Monthly Housing Costs | $485 | $51 |
| Real Estate Taxes | $2,056 | $11 |
Property Value by Mortgage Status in Latrobe borough
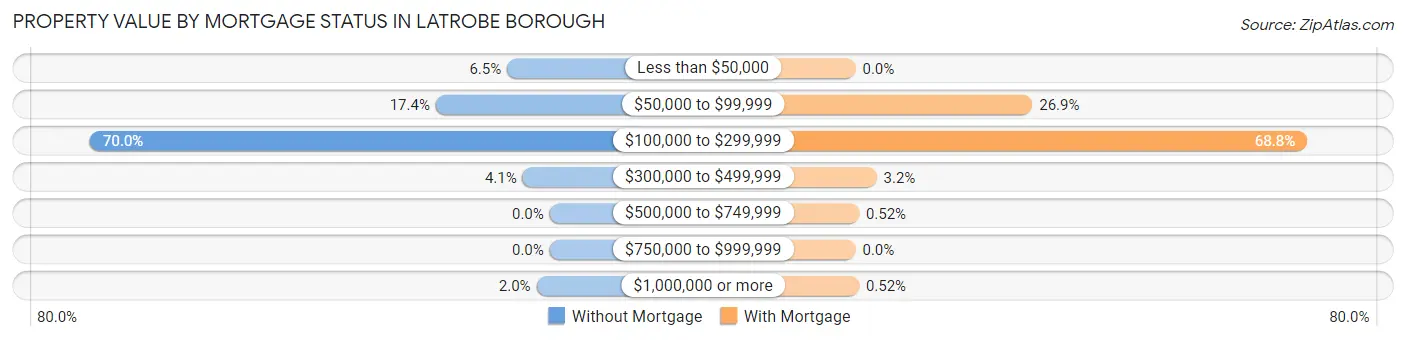
| Property Value | Without Mortgage | With Mortgage |
| Less than $50,000 | 52 (6.5%) | 0 (0.0%) |
| $50,000 to $99,999 | 139 (17.3%) | 462 (26.9%) |
| $100,000 to $299,999 | 561 (70.0%) | 1,180 (68.8%) |
| $300,000 to $499,999 | 33 (4.1%) | 55 (3.2%) |
| $500,000 to $749,999 | 0 (0.0%) | 9 (0.5%) |
| $750,000 to $999,999 | 0 (0.0%) | 0 (0.0%) |
| $1,000,000 or more | 16 (2.0%) | 9 (0.5%) |
| Total | 801 (100.0%) | 1,715 (100.0%) |
Household Income by Mortgage Status in Latrobe borough
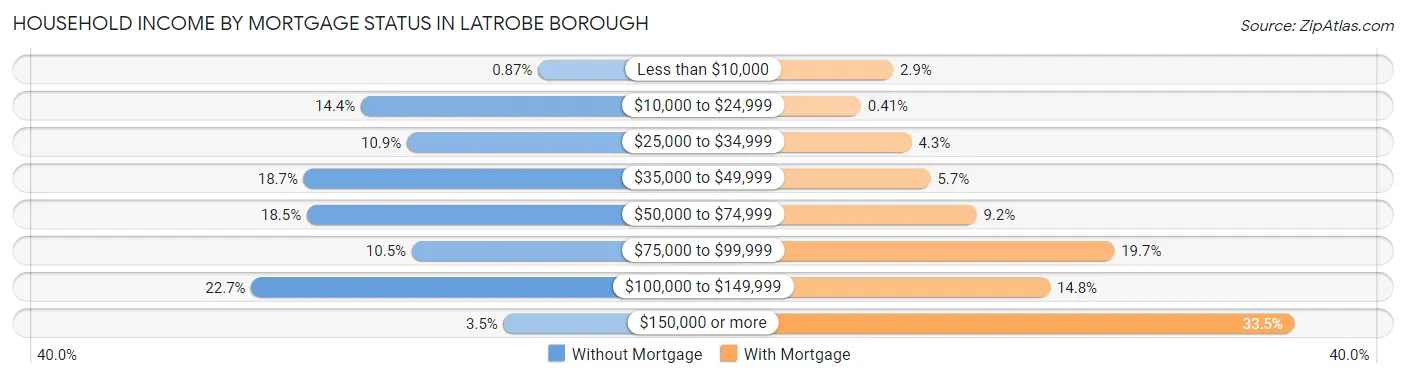
| Household Income | Without Mortgage | With Mortgage |
| Less than $10,000 | 7 (0.9%) | 49 (2.9%) |
| $10,000 to $24,999 | 115 (14.4%) | 7 (0.4%) |
| $25,000 to $34,999 | 87 (10.9%) | 73 (4.3%) |
| $35,000 to $49,999 | 150 (18.7%) | 98 (5.7%) |
| $50,000 to $74,999 | 148 (18.5%) | 158 (9.2%) |
| $75,000 to $99,999 | 84 (10.5%) | 338 (19.7%) |
| $100,000 to $149,999 | 182 (22.7%) | 254 (14.8%) |
| $150,000 or more | 28 (3.5%) | 574 (33.5%) |
| Total | 801 (100.0%) | 1,715 (100.0%) |
Property Value to Household Income Ratio in Latrobe borough
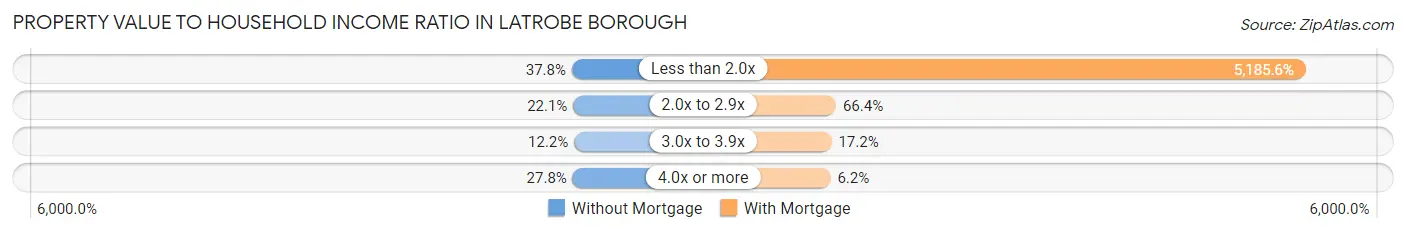
| Value-to-Income Ratio | Without Mortgage | With Mortgage |
| Less than 2.0x | 303 (37.8%) | 88,933 (5,185.6%) |
| 2.0x to 2.9x | 177 (22.1%) | 1,138 (66.4%) |
| 3.0x to 3.9x | 98 (12.2%) | 295 (17.2%) |
| 4.0x or more | 223 (27.8%) | 107 (6.2%) |
| Total | 801 (100.0%) | 1,715 (100.0%) |
Real Estate Taxes by Mortgage Status in Latrobe borough
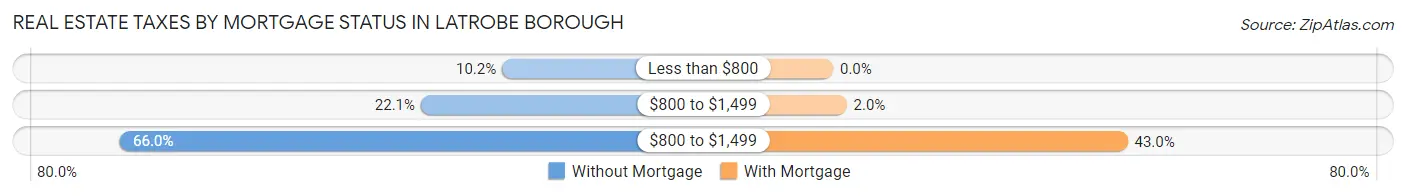
| Property Taxes | Without Mortgage | With Mortgage |
| Less than $800 | 82 (10.2%) | 0 (0.0%) |
| $800 to $1,499 | 177 (22.1%) | 34 (2.0%) |
| $800 to $1,499 | 529 (66.0%) | 738 (43.0%) |
| Total | 801 (100.0%) | 1,715 (100.0%) |
Health & Disability in Latrobe borough
Health Insurance Coverage by Age in Latrobe borough
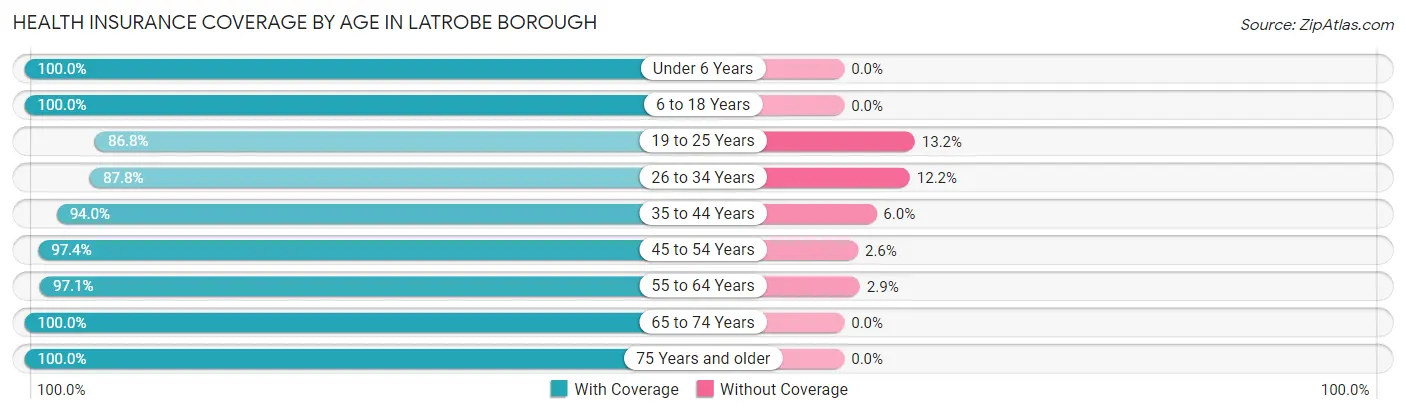
| Age Bracket | With Coverage | Without Coverage |
| Under 6 Years | 420 (100.0%) | 0 (0.0%) |
| 6 to 18 Years | 1,105 (100.0%) | 0 (0.0%) |
| 19 to 25 Years | 1,142 (86.8%) | 173 (13.2%) |
| 26 to 34 Years | 574 (87.8%) | 80 (12.2%) |
| 35 to 44 Years | 738 (94.0%) | 47 (6.0%) |
| 45 to 54 Years | 1,182 (97.4%) | 31 (2.6%) |
| 55 to 64 Years | 1,001 (97.1%) | 30 (2.9%) |
| 65 to 74 Years | 928 (100.0%) | 0 (0.0%) |
| 75 Years and older | 580 (100.0%) | 0 (0.0%) |
| Total | 7,670 (95.5%) | 361 (4.5%) |
Health Insurance Coverage by Citizenship Status in Latrobe borough
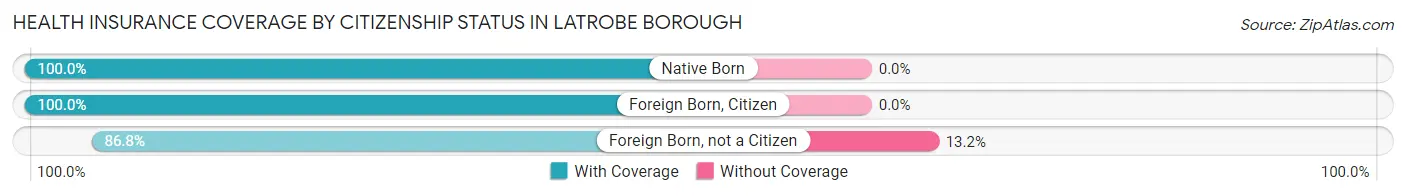
| Citizenship Status | With Coverage | Without Coverage |
| Native Born | 420 (100.0%) | 0 (0.0%) |
| Foreign Born, Citizen | 1,105 (100.0%) | 0 (0.0%) |
| Foreign Born, not a Citizen | 1,142 (86.8%) | 173 (13.2%) |
Health Insurance Coverage by Household Income in Latrobe borough
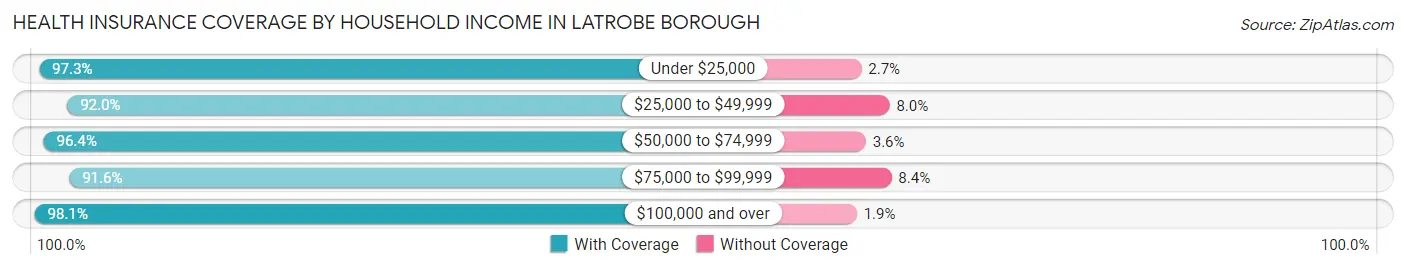
| Household Income | With Coverage | Without Coverage |
| Under $25,000 | 963 (97.3%) | 27 (2.7%) |
| $25,000 to $49,999 | 1,600 (92.0%) | 139 (8.0%) |
| $50,000 to $74,999 | 1,275 (96.4%) | 47 (3.6%) |
| $75,000 to $99,999 | 1,042 (91.6%) | 95 (8.4%) |
| $100,000 and over | 2,790 (98.1%) | 53 (1.9%) |
Public vs Private Health Insurance Coverage by Age in Latrobe borough
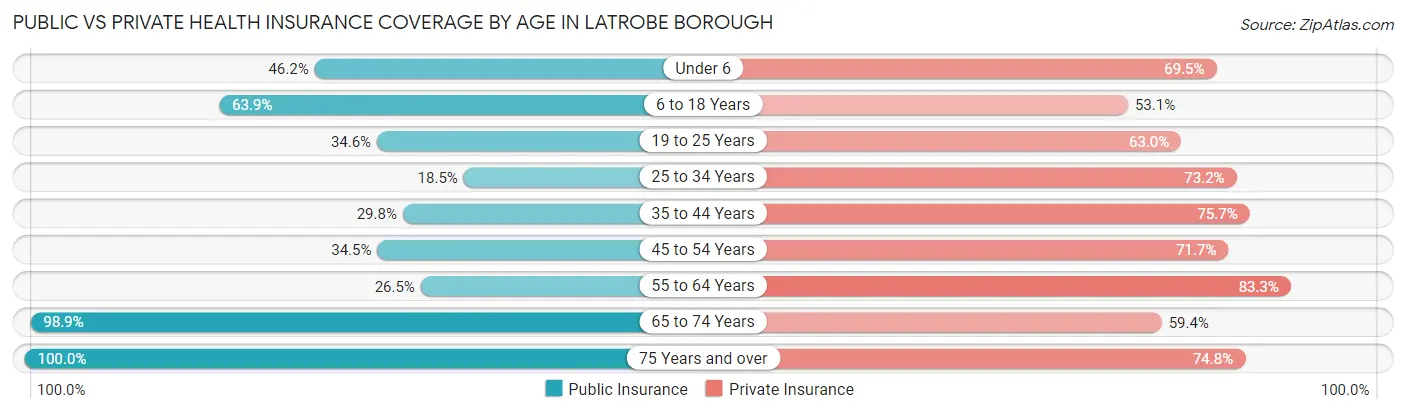
| Age Bracket | Public Insurance | Private Insurance |
| Under 6 | 194 (46.2%) | 292 (69.5%) |
| 6 to 18 Years | 706 (63.9%) | 587 (53.1%) |
| 19 to 25 Years | 455 (34.6%) | 828 (63.0%) |
| 25 to 34 Years | 121 (18.5%) | 479 (73.2%) |
| 35 to 44 Years | 234 (29.8%) | 594 (75.7%) |
| 45 to 54 Years | 419 (34.5%) | 870 (71.7%) |
| 55 to 64 Years | 273 (26.5%) | 859 (83.3%) |
| 65 to 74 Years | 918 (98.9%) | 551 (59.4%) |
| 75 Years and over | 580 (100.0%) | 434 (74.8%) |
| Total | 3,900 (48.6%) | 5,494 (68.4%) |
Disability Status by Sex by Age in Latrobe borough
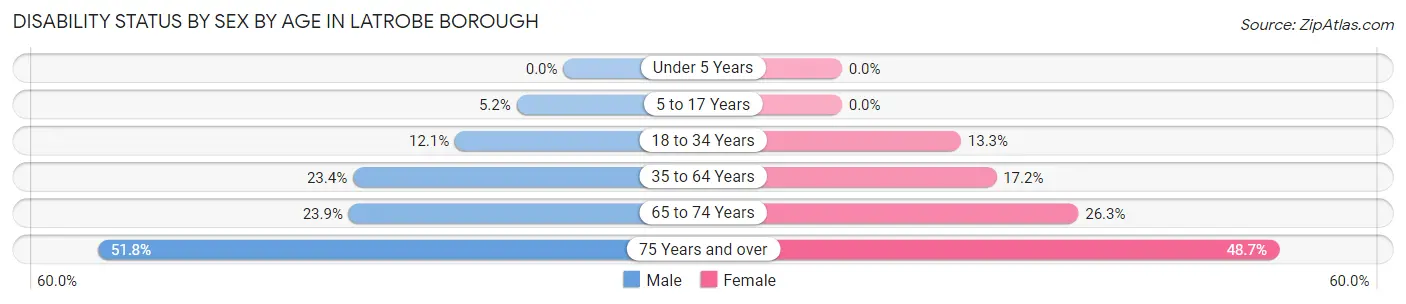
| Age Bracket | Male | Female |
| Under 5 Years | 0 (0.0%) | 0 (0.0%) |
| 5 to 17 Years | 27 (5.2%) | 0 (0.0%) |
| 18 to 34 Years | 133 (12.1%) | 125 (13.3%) |
| 35 to 64 Years | 331 (23.4%) | 278 (17.2%) |
| 65 to 74 Years | 92 (23.9%) | 143 (26.3%) |
| 75 Years and over | 127 (51.8%) | 163 (48.7%) |
Disability Class by Sex by Age in Latrobe borough
Disability Class: Hearing Difficulty
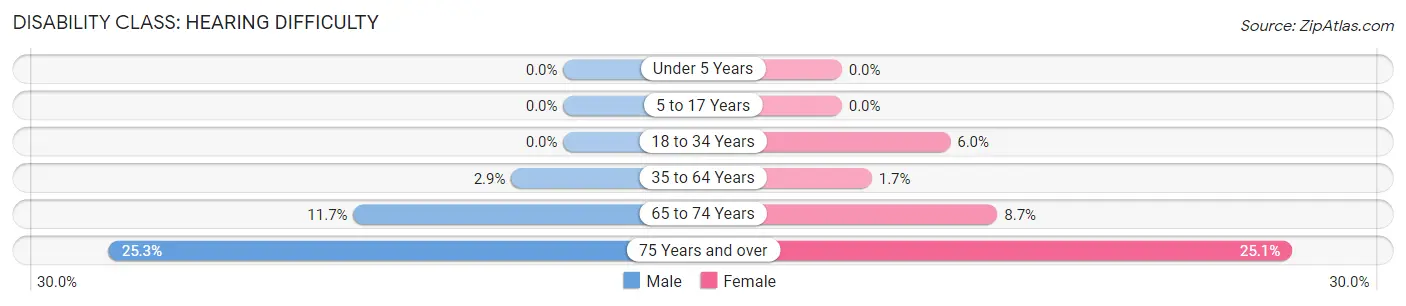
| Age Bracket | Male | Female |
| Under 5 Years | 0 (0.0%) | 0 (0.0%) |
| 5 to 17 Years | 0 (0.0%) | 0 (0.0%) |
| 18 to 34 Years | 0 (0.0%) | 57 (6.0%) |
| 35 to 64 Years | 41 (2.9%) | 27 (1.7%) |
| 65 to 74 Years | 45 (11.7%) | 47 (8.7%) |
| 75 Years and over | 62 (25.3%) | 84 (25.1%) |
Disability Class: Vision Difficulty
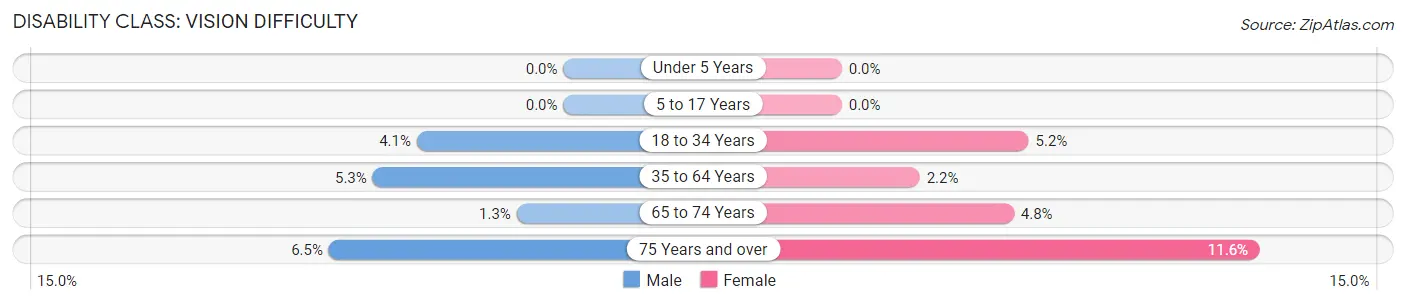
| Age Bracket | Male | Female |
| Under 5 Years | 0 (0.0%) | 0 (0.0%) |
| 5 to 17 Years | 0 (0.0%) | 0 (0.0%) |
| 18 to 34 Years | 45 (4.1%) | 49 (5.2%) |
| 35 to 64 Years | 75 (5.3%) | 35 (2.2%) |
| 65 to 74 Years | 5 (1.3%) | 26 (4.8%) |
| 75 Years and over | 16 (6.5%) | 39 (11.6%) |
Disability Class: Cognitive Difficulty
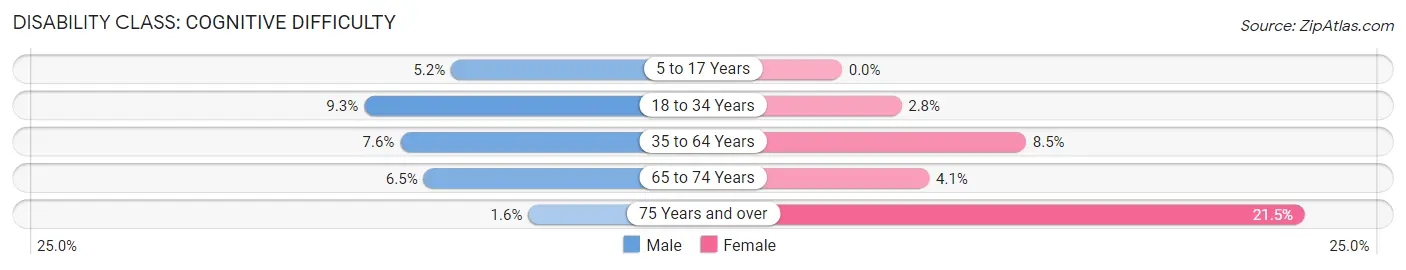
| Age Bracket | Male | Female |
| 5 to 17 Years | 27 (5.2%) | 0 (0.0%) |
| 18 to 34 Years | 102 (9.2%) | 26 (2.8%) |
| 35 to 64 Years | 107 (7.6%) | 138 (8.5%) |
| 65 to 74 Years | 25 (6.5%) | 22 (4.1%) |
| 75 Years and over | 4 (1.6%) | 72 (21.5%) |
Disability Class: Ambulatory Difficulty
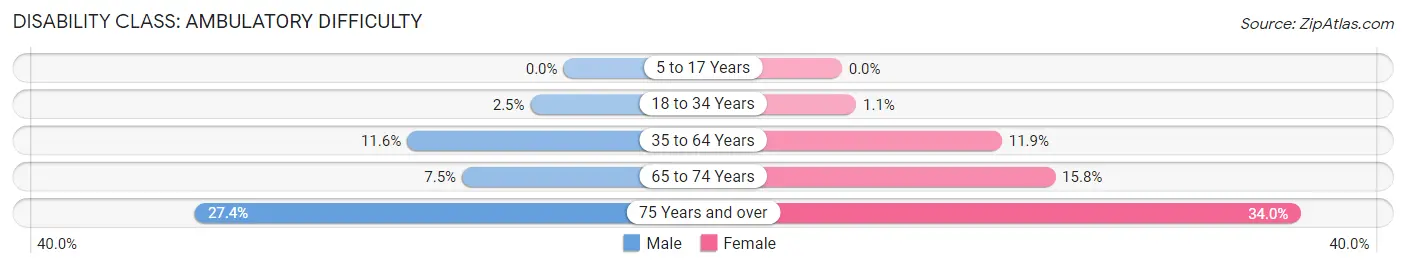
| Age Bracket | Male | Female |
| 5 to 17 Years | 0 (0.0%) | 0 (0.0%) |
| 18 to 34 Years | 27 (2.5%) | 10 (1.1%) |
| 35 to 64 Years | 164 (11.6%) | 192 (11.9%) |
| 65 to 74 Years | 29 (7.5%) | 86 (15.8%) |
| 75 Years and over | 67 (27.4%) | 114 (34.0%) |
Disability Class: Self-Care Difficulty
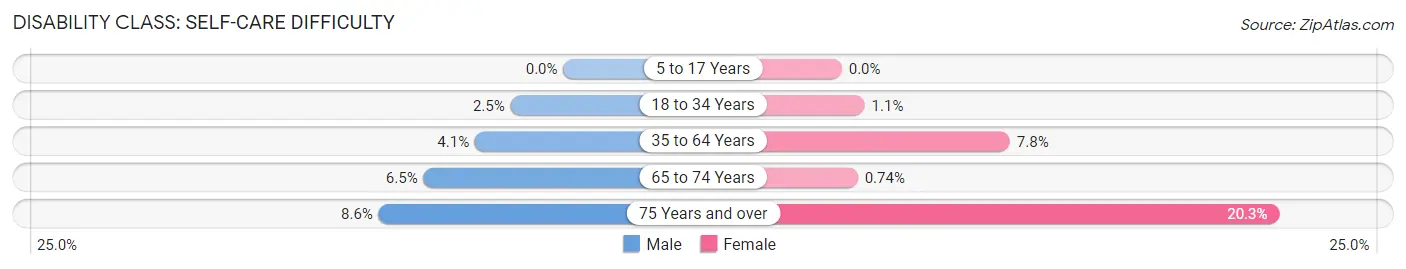
| Age Bracket | Male | Female |
| 5 to 17 Years | 0 (0.0%) | 0 (0.0%) |
| 18 to 34 Years | 27 (2.5%) | 10 (1.1%) |
| 35 to 64 Years | 58 (4.1%) | 126 (7.8%) |
| 65 to 74 Years | 25 (6.5%) | 4 (0.7%) |
| 75 Years and over | 21 (8.6%) | 68 (20.3%) |
Technology Access in Latrobe borough
Computing Device Access in Latrobe borough
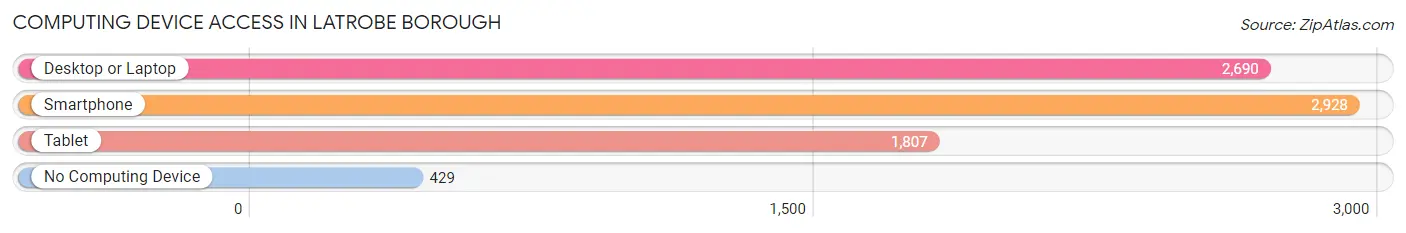
| Device Type | # Households | % Households |
| Desktop or Laptop | 2,690 | 72.9% |
| Smartphone | 2,928 | 79.4% |
| Tablet | 1,807 | 49.0% |
| No Computing Device | 429 | 11.6% |
| Total | 3,688 | 100.0% |
Internet Access in Latrobe borough
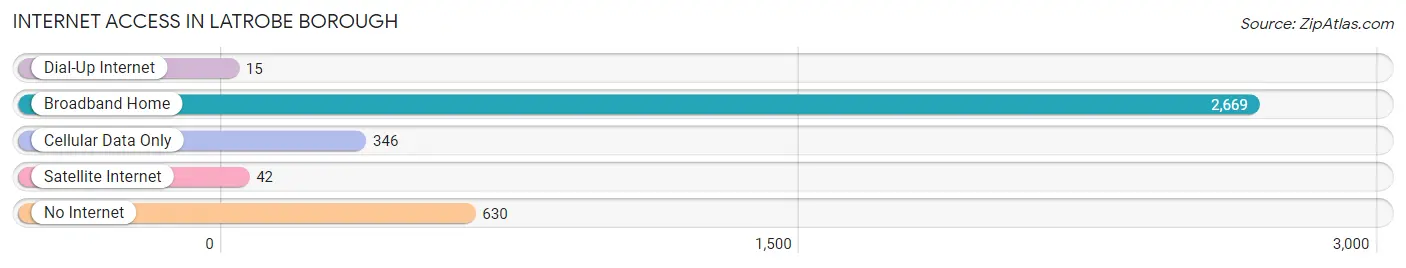
| Internet Type | # Households | % Households |
| Dial-Up Internet | 15 | 0.4% |
| Broadband Home | 2,669 | 72.4% |
| Cellular Data Only | 346 | 9.4% |
| Satellite Internet | 42 | 1.1% |
| No Internet | 630 | 17.1% |
| Total | 3,688 | 100.0% |
Latrobe borough Summary
Latrobe Borough is a borough located in Westmoreland County, Pennsylvania. It is situated in the Laurel Highlands region of the state, approximately 40 miles east of Pittsburgh. The borough is home to approximately 8,000 people and is the birthplace of the late golf legend Arnold Palmer.
History
Latrobe Borough was founded in 1854 by Colonel Abraham Overholt, a prominent local distiller. The borough was named after his daughter, Charlotte, who was nicknamed “Latrobe”. The borough was incorporated in 1868 and was the first municipality in Westmoreland County to be incorporated.
The borough was an important industrial center in the late 19th and early 20th centuries. It was home to the Latrobe Steel Company, which was founded in 1852 and was the first steel mill in the United States. The steel mill was the largest employer in the borough and was the primary source of employment for many of the borough’s residents. The steel mill closed in the late 1970s and the borough has since shifted to a more service-based economy.
Geography
Latrobe Borough is located in the Laurel Highlands region of Pennsylvania. It is situated in the Allegheny Mountains and is approximately 40 miles east of Pittsburgh. The borough is bordered by Unity Township to the north, Derry Township to the east, Ligonier Township to the south, and St. Clair Township to the west.
The borough is located in a hilly region and is home to several small streams, including the Loyalhanna Creek, which flows through the borough. The borough is also home to several parks, including Latrobe Memorial Park, which is located in the center of the borough.
Economy
Latrobe Borough’s economy is primarily service-based. The largest employers in the borough are the Latrobe Area Hospital, the Latrobe School District, and the Latrobe Country Club. The borough is also home to several small businesses, including restaurants, retail stores, and professional services.
The borough is also home to several manufacturing companies, including the Latrobe Foundry and Machine Company, which produces industrial machinery, and the Latrobe Brewing Company, which produces beer.
Demographics
As of the 2010 census, the population of Latrobe Borough was 8,338. The racial makeup of the borough was 95.3% White, 1.7% African American, 0.2% Native American, 0.7% Asian, 0.1% Pacific Islander, 0.7% from other races, and 1.2% from two or more races. Hispanic or Latino of any race were 1.7% of the population.
The median household income in the borough was $41,945 and the median family income was $50,945. The per capita income for the borough was $20,945. About 8.3% of families and 10.2% of the population were below the poverty line, including 14.2% of those under age 18 and 6.2% of those age 65 or over.
Common Questions
What is Per Capita Income in Latrobe borough?
Per Capita income in Latrobe borough is $35,379.
What is the Median Family Income in Latrobe borough?
Median Family Income in Latrobe borough is $79,398.
What is the Median Household income in Latrobe borough?
Median Household Income in Latrobe borough is $59,485.
What is Income or Wage Gap in Latrobe borough?
Income or Wage Gap in Latrobe borough is 46.9%.
Women in Latrobe borough earn 53.1 cents for every dollar earned by a man.
What is Inequality or Gini Index in Latrobe borough?
Inequality or Gini Index in Latrobe borough is 0.44.
What is the Total Population of Latrobe borough?
Total Population of Latrobe borough is 8,047.
What is the Total Male Population of Latrobe borough?
Total Male Population of Latrobe borough is 3,886.
What is the Total Female Population of Latrobe borough?
Total Female Population of Latrobe borough is 4,161.
What is the Ratio of Males per 100 Females in Latrobe borough?
There are 93.39 Males per 100 Females in Latrobe borough.
What is the Ratio of Females per 100 Males in Latrobe borough?
There are 107.08 Females per 100 Males in Latrobe borough.
What is the Median Population Age in Latrobe borough?
Median Population Age in Latrobe borough is 41.7 Years.
What is the Average Family Size in Latrobe borough
Average Family Size in Latrobe borough is 2.9 People.
What is the Average Household Size in Latrobe borough
Average Household Size in Latrobe borough is 2.2 People.
How Large is the Labor Force in Latrobe borough?
There are 4,606 People in the Labor Forcein in Latrobe borough.
What is the Percentage of People in the Labor Force in Latrobe borough?
67.8% of People are in the Labor Force in Latrobe borough.
What is the Unemployment Rate in Latrobe borough?
Unemployment Rate in Latrobe borough is 3.9%.