Curwensville borough, PA Map & Demographics
Curwensville borough Overview
$25,860
PER CAPITA INCOME
$57,926
AVG FAMILY INCOME
$46,726
AVG HOUSEHOLD INCOME
30.0%
WAGE / INCOME GAP [ % ]
70.0¢/ $1
WAGE / INCOME GAP [ $ ]
0.43
INEQUALITY / GINI INDEX
2,559
TOTAL POPULATION
1,129
MALE POPULATION
1,430
FEMALE POPULATION
78.95
MALES / 100 FEMALES
126.66
FEMALES / 100 MALES
38.9
MEDIAN AGE
2.9
AVG FAMILY SIZE
2.3
AVG HOUSEHOLD SIZE
1,204
LABOR FORCE [ PEOPLE ]
60.3%
PERCENT IN LABOR FORCE
9.0%
UNEMPLOYMENT RATE
Income in Curwensville borough
Income Overview in Curwensville borough
Per Capita Income in Curwensville borough is $25,860, while median incomes of families and households are $57,926 and $46,726 respectively.
| Characteristic | Number | Measure |
| Per Capita Income | 2,559 | $25,860 |
| Median Family Income | 665 | $57,926 |
| Mean Family Income | 665 | $68,154 |
| Median Household Income | 1,079 | $46,726 |
| Mean Household Income | 1,079 | $58,404 |
| Income Deficit | 665 | $0 |
| Wage / Income Gap (%) | 2,559 | 29.96% |
| Wage / Income Gap ($) | 2,559 | 70.04¢ per $1 |
| Gini / Inequality Index | 2,559 | 0.43 |
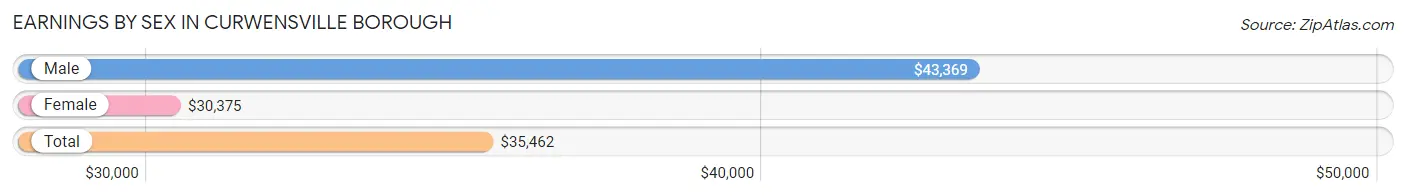
Earnings by Sex in Curwensville borough
Average Earnings in Curwensville borough are $35,462, $43,369 for men and $30,375 for women, a difference of 30.0%.
| Sex | Number | Average Earnings |
| Male | 617 (49.8%) | $43,369 |
| Female | 622 (50.2%) | $30,375 |
| Total | 1,239 (100.0%) | $35,462 |
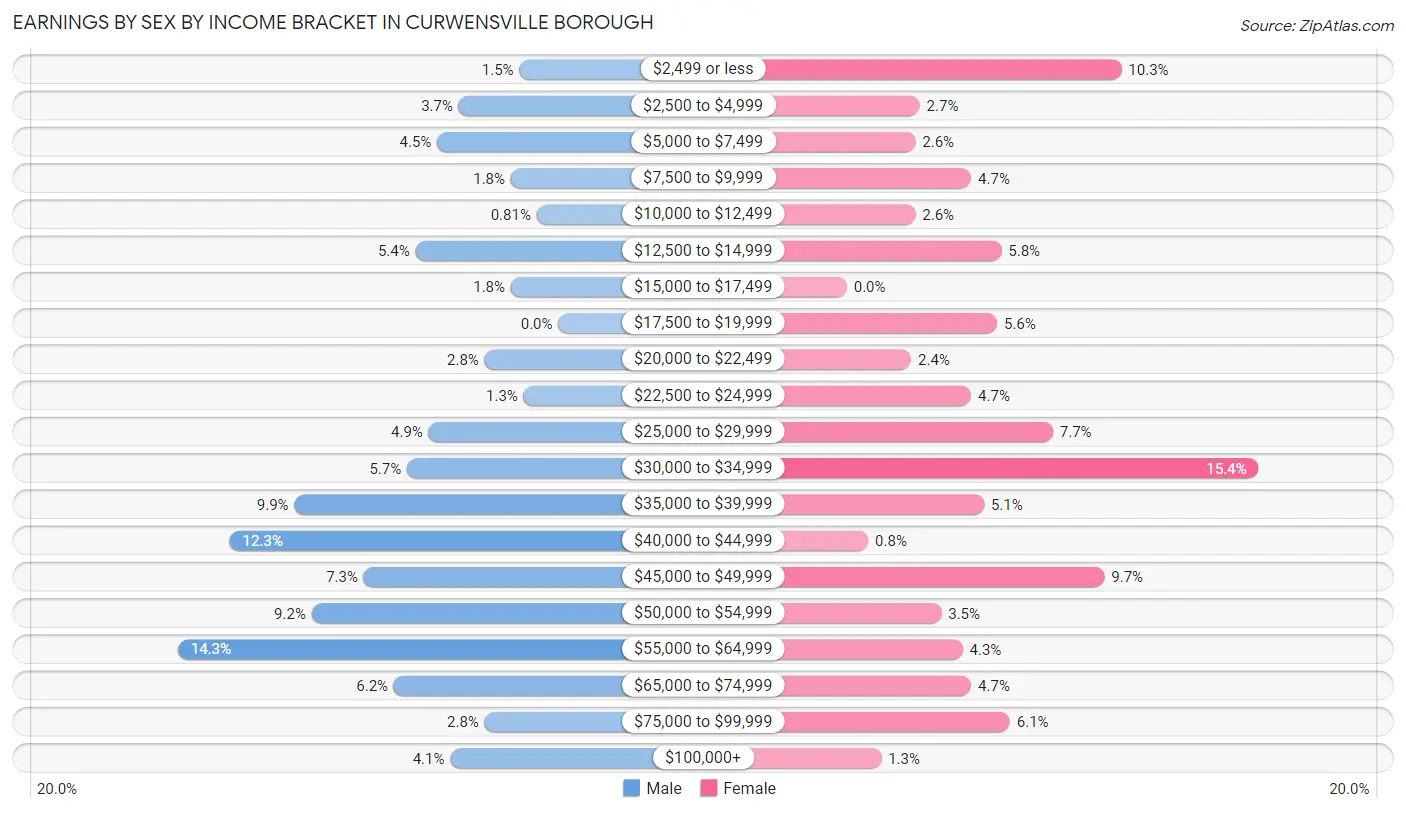
Earnings by Sex by Income Bracket in Curwensville borough
The most common earnings brackets in Curwensville borough are $55,000 to $64,999 for men (88 | 14.3%) and $30,000 to $34,999 for women (96 | 15.4%).
| Income | Male | Female |
| $2,499 or less | 9 (1.5%) | 64 (10.3%) |
| $2,500 to $4,999 | 23 (3.7%) | 17 (2.7%) |
| $5,000 to $7,499 | 28 (4.5%) | 16 (2.6%) |
| $7,500 to $9,999 | 11 (1.8%) | 29 (4.7%) |
| $10,000 to $12,499 | 5 (0.8%) | 16 (2.6%) |
| $12,500 to $14,999 | 33 (5.3%) | 36 (5.8%) |
| $15,000 to $17,499 | 11 (1.8%) | 0 (0.0%) |
| $17,500 to $19,999 | 0 (0.0%) | 35 (5.6%) |
| $20,000 to $22,499 | 17 (2.8%) | 15 (2.4%) |
| $22,500 to $24,999 | 8 (1.3%) | 29 (4.7%) |
| $25,000 to $29,999 | 30 (4.9%) | 48 (7.7%) |
| $30,000 to $34,999 | 35 (5.7%) | 96 (15.4%) |
| $35,000 to $39,999 | 61 (9.9%) | 32 (5.1%) |
| $40,000 to $44,999 | 76 (12.3%) | 5 (0.8%) |
| $45,000 to $49,999 | 45 (7.3%) | 60 (9.7%) |
| $50,000 to $54,999 | 57 (9.2%) | 22 (3.5%) |
| $55,000 to $64,999 | 88 (14.3%) | 27 (4.3%) |
| $65,000 to $74,999 | 38 (6.2%) | 29 (4.7%) |
| $75,000 to $99,999 | 17 (2.8%) | 38 (6.1%) |
| $100,000+ | 25 (4.1%) | 8 (1.3%) |
| Total | 617 (100.0%) | 622 (100.0%) |
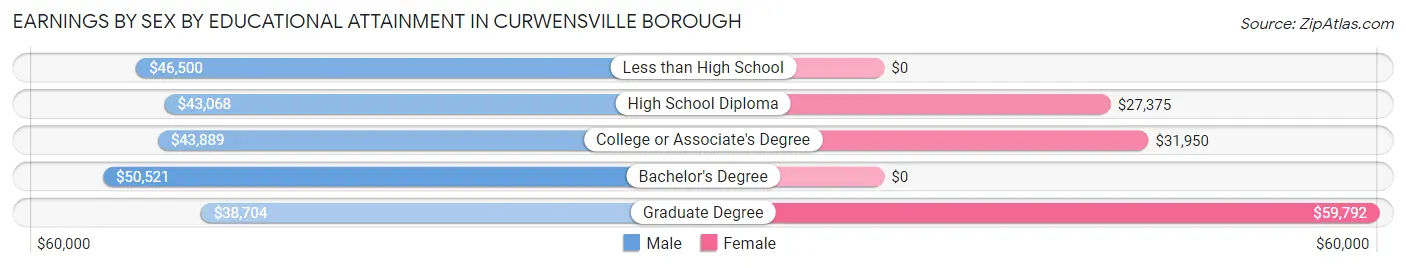
Earnings by Sex by Educational Attainment in Curwensville borough
Average earnings in Curwensville borough are $43,969 for men and $30,750 for women, a difference of 30.1%. Men with an educational attainment of bachelor's degree enjoy the highest average annual earnings of $50,521, while those with graduate degree education earn the least with $38,704. Women with an educational attainment of graduate degree earn the most with the average annual earnings of $59,792, while those with high school diploma education have the smallest earnings of $27,375.
| Educational Attainment | Male Income | Female Income |
| Less than High School | $46,500 | $0 |
| High School Diploma | $43,068 | $27,375 |
| College or Associate's Degree | $43,889 | $31,950 |
| Bachelor's Degree | $50,521 | $0 |
| Graduate Degree | $38,704 | $59,792 |
| Total | $43,969 | $30,750 |
Family Income in Curwensville borough
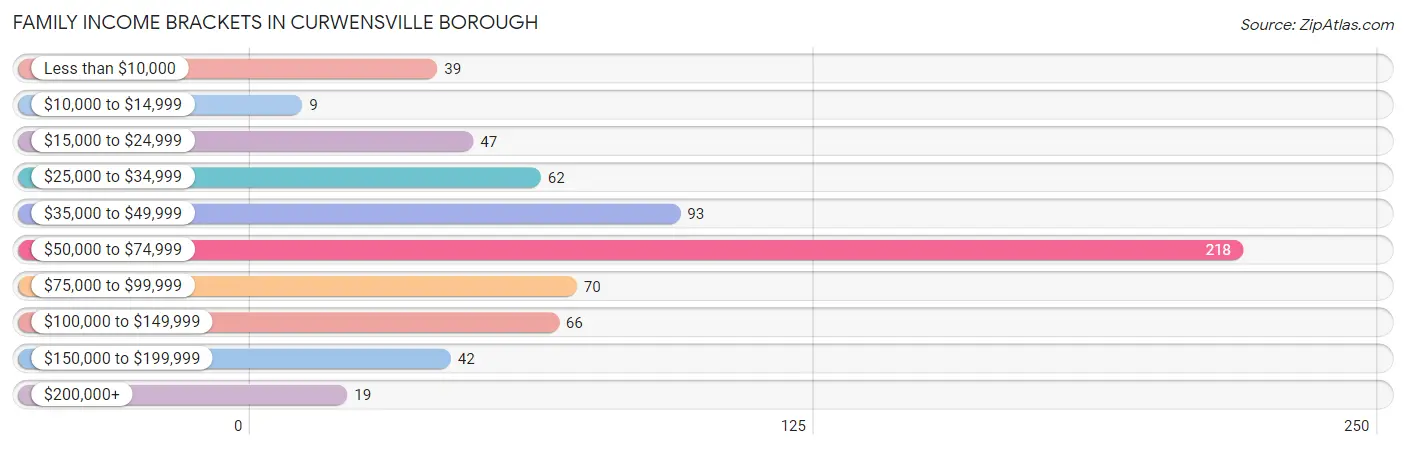
Family Income Brackets in Curwensville borough
According to the Curwensville borough family income data, there are 218 families falling into the $50,000 to $74,999 income range, which is the most common income bracket and makes up 32.8% of all families. Conversely, the $10,000 to $14,999 income bracket is the least frequent group with only 9 families (1.3%) belonging to this category.
| Income Bracket | # Families | % Families |
| Less than $10,000 | 39 | 5.9% |
| $10,000 to $14,999 | 9 | 1.4% |
| $15,000 to $24,999 | 47 | 7.1% |
| $25,000 to $34,999 | 62 | 9.3% |
| $35,000 to $49,999 | 93 | 14.0% |
| $50,000 to $74,999 | 218 | 32.8% |
| $75,000 to $99,999 | 70 | 10.5% |
| $100,000 to $149,999 | 66 | 9.9% |
| $150,000 to $199,999 | 42 | 6.3% |
| $200,000+ | 19 | 2.9% |
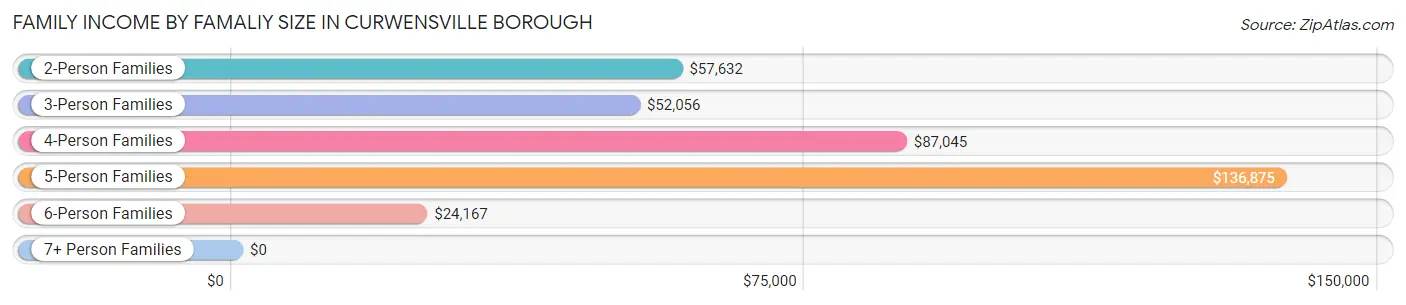
Family Income by Famaliy Size in Curwensville borough
5-person families (21 | 3.2%) account for the highest median family income in Curwensville borough with $136,875 per family, while 2-person families (350 | 52.6%) have the highest median income of $28,816 per family member.
| Income Bracket | # Families | Median Income |
| 2-Person Families | 350 (52.6%) | $57,632 |
| 3-Person Families | 199 (29.9%) | $52,056 |
| 4-Person Families | 78 (11.7%) | $87,045 |
| 5-Person Families | 21 (3.2%) | $136,875 |
| 6-Person Families | 12 (1.8%) | $24,167 |
| 7+ Person Families | 5 (0.7%) | $0 |
| Total | 665 (100.0%) | $57,926 |
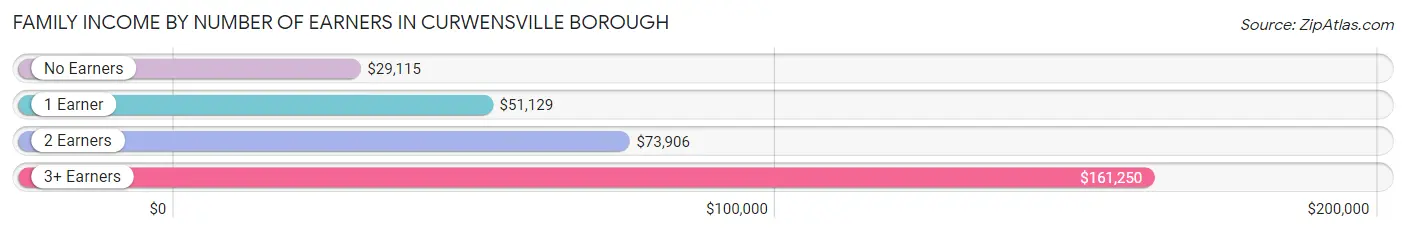
Family Income by Number of Earners in Curwensville borough
The median family income in Curwensville borough is $57,926, with families comprising 3+ earners (28) having the highest median family income of $161,250, while families with no earners (115) have the lowest median family income of $29,115, accounting for 4.2% and 17.3% of families, respectively.
| Number of Earners | # Families | Median Income |
| No Earners | 115 (17.3%) | $29,115 |
| 1 Earner | 266 (40.0%) | $51,129 |
| 2 Earners | 256 (38.5%) | $73,906 |
| 3+ Earners | 28 (4.2%) | $161,250 |
| Total | 665 (100.0%) | $57,926 |
Household Income in Curwensville borough
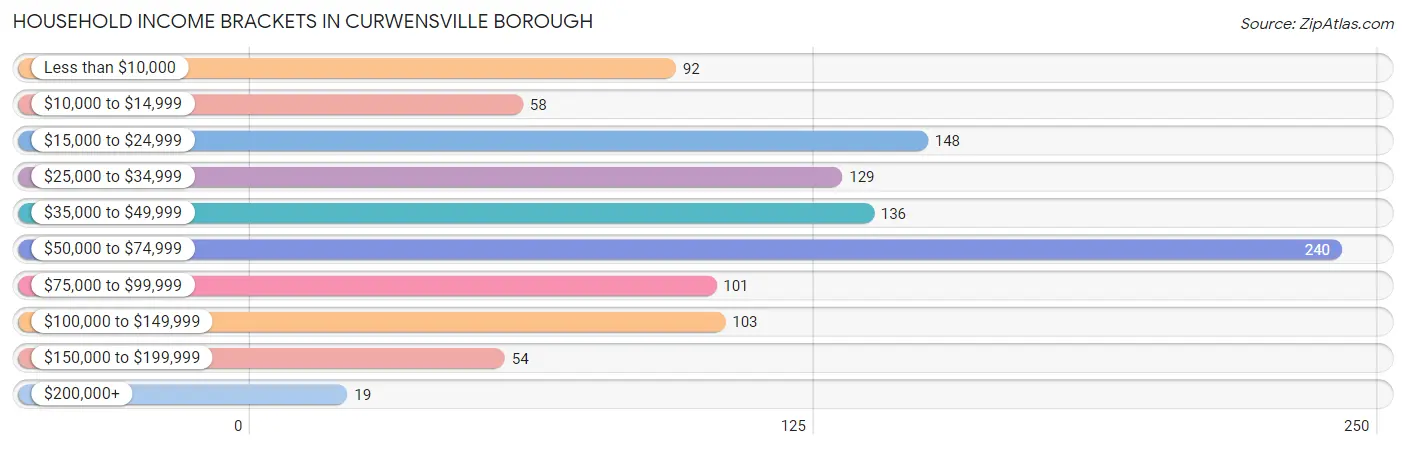
Household Income Brackets in Curwensville borough
With 240 households falling in the category, the $50,000 to $74,999 income range is the most frequent in Curwensville borough, accounting for 22.2% of all households. In contrast, only 19 households (1.8%) fall into the $200,000+ income bracket, making it the least populous group.
| Income Bracket | # Households | % Households |
| Less than $10,000 | 92 | 8.5% |
| $10,000 to $14,999 | 58 | 5.4% |
| $15,000 to $24,999 | 148 | 13.7% |
| $25,000 to $34,999 | 129 | 12.0% |
| $35,000 to $49,999 | 136 | 12.6% |
| $50,000 to $74,999 | 240 | 22.2% |
| $75,000 to $99,999 | 101 | 9.4% |
| $100,000 to $149,999 | 103 | 9.5% |
| $150,000 to $199,999 | 54 | 5.0% |
| $200,000+ | 19 | 1.8% |
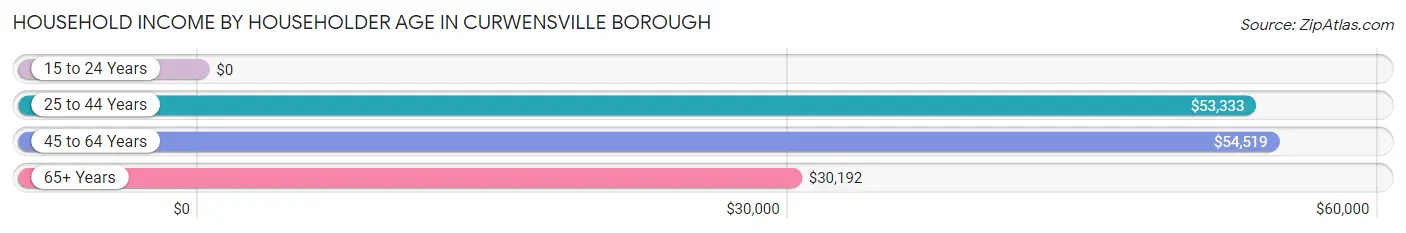
Household Income by Householder Age in Curwensville borough
The median household income in Curwensville borough is $46,726, with the highest median household income of $54,519 found in the 45 to 64 years age bracket for the primary householder. A total of 353 households (32.7%) fall into this category. Meanwhile, the 15 to 24 years age bracket for the primary householder has the lowest median household income of $0, with 24 households (2.2%) in this group.
| Income Bracket | # Households | Median Income |
| 15 to 24 Years | 24 (2.2%) | $0 |
| 25 to 44 Years | 346 (32.1%) | $53,333 |
| 45 to 64 Years | 353 (32.7%) | $54,519 |
| 65+ Years | 356 (33.0%) | $30,192 |
| Total | 1,079 (100.0%) | $46,726 |
Poverty in Curwensville borough
Income Below Poverty by Sex and Age in Curwensville borough
With 16.8% poverty level for males and 14.8% for females among the residents of Curwensville borough, 6 to 11 year old males and 75 year old and over females are the most vulnerable to poverty, with 29 males (54.7%) and 34 females (33.0%) in their respective age groups living below the poverty level.
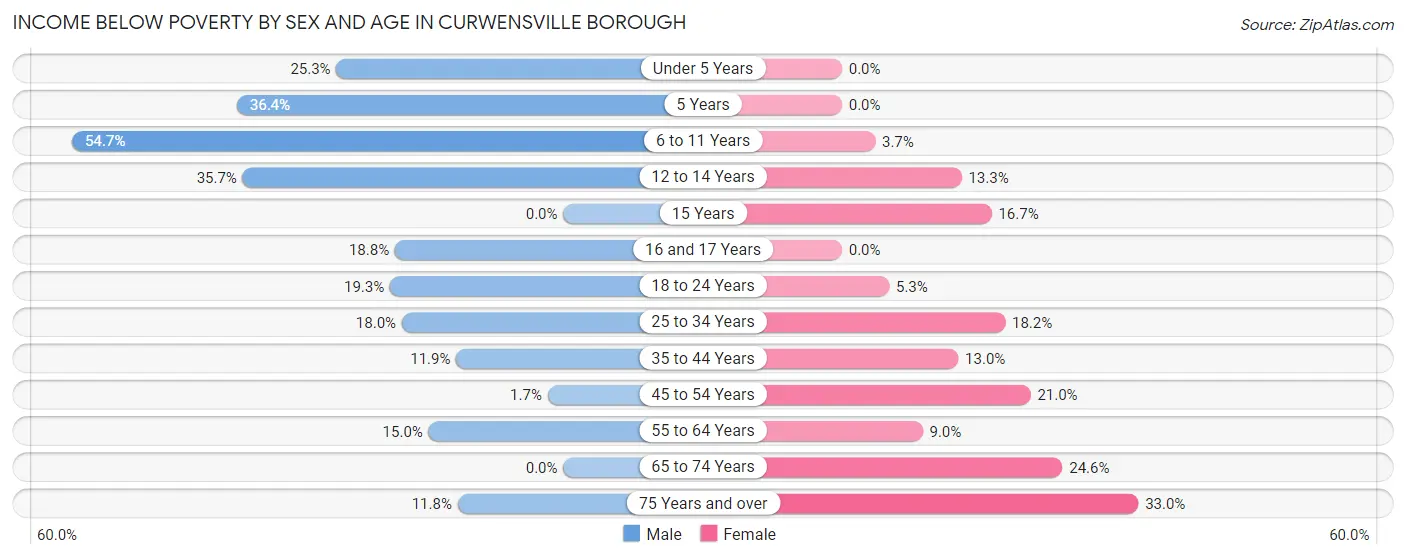
| Age Bracket | Male | Female |
| Under 5 Years | 23 (25.3%) | 0 (0.0%) |
| 5 Years | 8 (36.4%) | 0 (0.0%) |
| 6 to 11 Years | 29 (54.7%) | 5 (3.7%) |
| 12 to 14 Years | 35 (35.7%) | 2 (13.3%) |
| 15 Years | 0 (0.0%) | 8 (16.7%) |
| 16 and 17 Years | 3 (18.8%) | 0 (0.0%) |
| 18 to 24 Years | 11 (19.3%) | 5 (5.3%) |
| 25 to 34 Years | 32 (18.0%) | 36 (18.2%) |
| 35 to 44 Years | 18 (11.9%) | 21 (13.0%) |
| 45 to 54 Years | 2 (1.7%) | 29 (21.0%) |
| 55 to 64 Years | 21 (15.0%) | 16 (9.0%) |
| 65 to 74 Years | 0 (0.0%) | 42 (24.6%) |
| 75 Years and over | 6 (11.8%) | 34 (33.0%) |
| Total | 188 (16.8%) | 198 (14.8%) |
Income Above Poverty by Sex and Age in Curwensville borough
According to the poverty statistics in Curwensville borough, males aged 15 years and females aged under 5 years are the age groups that are most secure financially, with 100.0% of males and 100.0% of females in these age groups living above the poverty line.
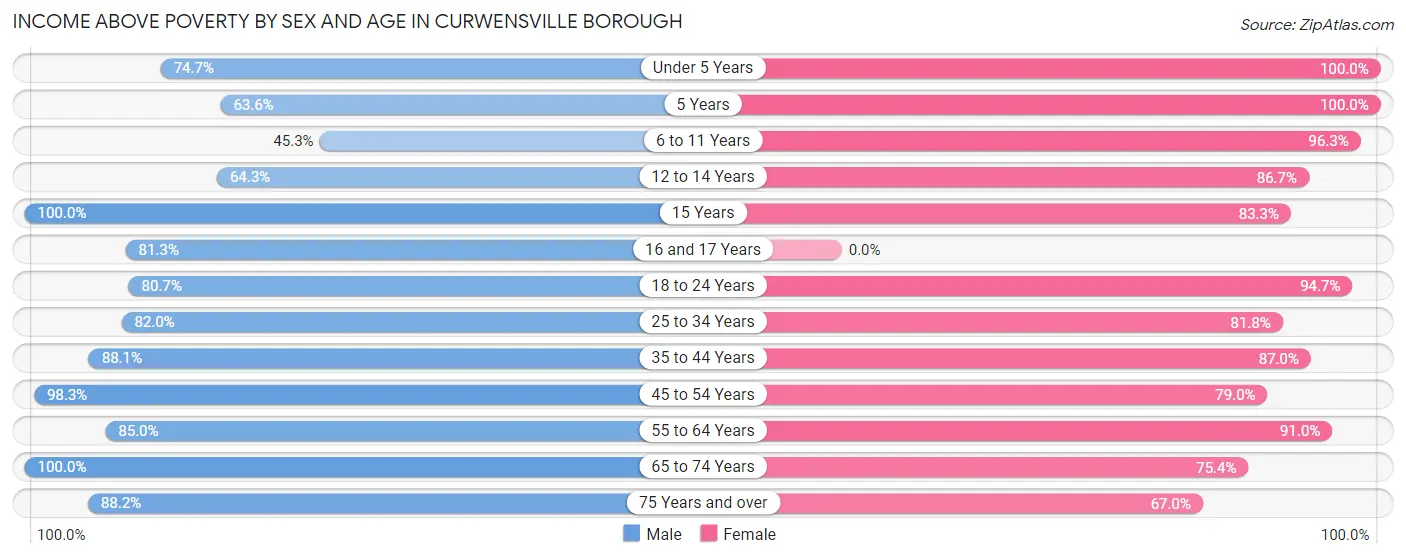
| Age Bracket | Male | Female |
| Under 5 Years | 68 (74.7%) | 81 (100.0%) |
| 5 Years | 14 (63.6%) | 15 (100.0%) |
| 6 to 11 Years | 24 (45.3%) | 130 (96.3%) |
| 12 to 14 Years | 63 (64.3%) | 13 (86.7%) |
| 15 Years | 4 (100.0%) | 40 (83.3%) |
| 16 and 17 Years | 13 (81.2%) | 0 (0.0%) |
| 18 to 24 Years | 46 (80.7%) | 90 (94.7%) |
| 25 to 34 Years | 146 (82.0%) | 162 (81.8%) |
| 35 to 44 Years | 133 (88.1%) | 141 (87.0%) |
| 45 to 54 Years | 113 (98.3%) | 109 (79.0%) |
| 55 to 64 Years | 119 (85.0%) | 162 (91.0%) |
| 65 to 74 Years | 141 (100.0%) | 129 (75.4%) |
| 75 Years and over | 45 (88.2%) | 69 (67.0%) |
| Total | 929 (83.2%) | 1,141 (85.2%) |
Income Below Poverty Among Married-Couple Families in Curwensville borough
The poverty statistics for married-couple families in Curwensville borough show that 6.7% or 27 of the total 405 families live below the poverty line. Families with 1 or 2 children have the highest poverty rate of 11.6%, comprising of 18 families. On the other hand, families with no children have the lowest poverty rate of 3.0%, which includes 7 families.
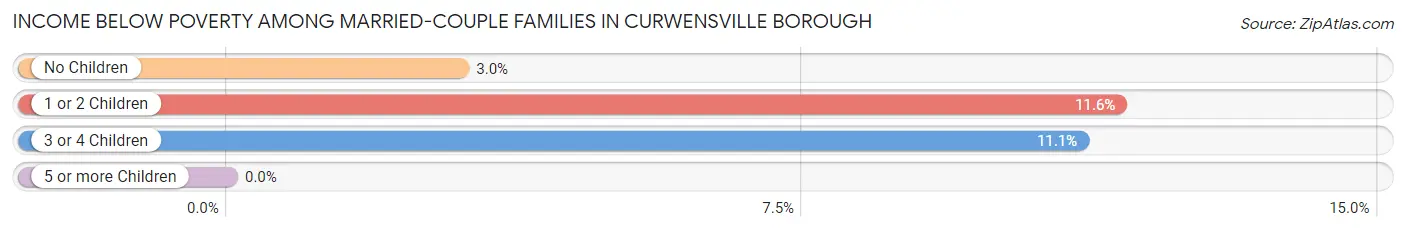
| Children | Above Poverty | Below Poverty |
| No Children | 225 (97.0%) | 7 (3.0%) |
| 1 or 2 Children | 137 (88.4%) | 18 (11.6%) |
| 3 or 4 Children | 16 (88.9%) | 2 (11.1%) |
| 5 or more Children | 0 (0.0%) | 0 (0.0%) |
| Total | 378 (93.3%) | 27 (6.7%) |
Income Below Poverty Among Single-Parent Households in Curwensville borough
According to the poverty data in Curwensville borough, 7.6% or 7 single-father households and 20.2% or 34 single-mother households are living below the poverty line. Among single-father households, those with 1 or 2 children have the highest poverty rate, with 7 households (15.6%) experiencing poverty. Likewise, among single-mother households, those with 3 or 4 children have the highest poverty rate, with 6 households (100.0%) falling below the poverty line.
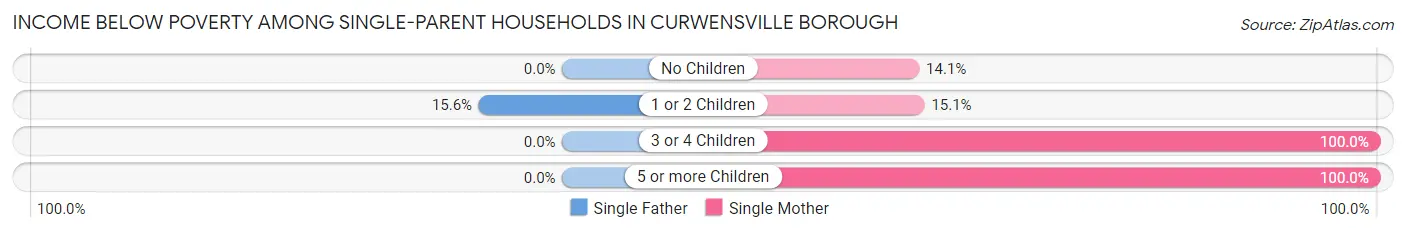
| Children | Single Father | Single Mother |
| No Children | 0 (0.0%) | 9 (14.1%) |
| 1 or 2 Children | 7 (15.6%) | 14 (15.0%) |
| 3 or 4 Children | 0 (0.0%) | 6 (100.0%) |
| 5 or more Children | 0 (0.0%) | 5 (100.0%) |
| Total | 7 (7.6%) | 34 (20.2%) |
Income Below Poverty Among Married-Couple vs Single-Parent Households in Curwensville borough
The poverty data for Curwensville borough shows that 27 of the married-couple family households (6.7%) and 41 of the single-parent households (15.8%) are living below the poverty level. Within the married-couple family households, those with 1 or 2 children have the highest poverty rate, with 18 households (11.6%) falling below the poverty line. Among the single-parent households, those with 3 or 4 children have the highest poverty rate, with 6 household (100.0%) living below poverty.
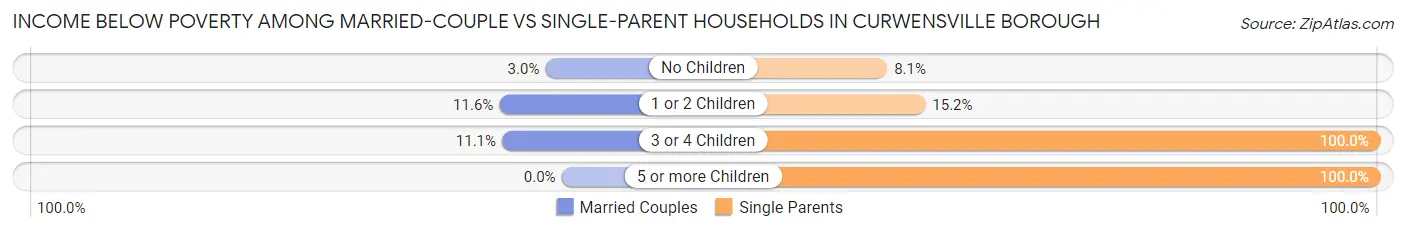
| Children | Married-Couple Families | Single-Parent Households |
| No Children | 7 (3.0%) | 9 (8.1%) |
| 1 or 2 Children | 18 (11.6%) | 21 (15.2%) |
| 3 or 4 Children | 2 (11.1%) | 6 (100.0%) |
| 5 or more Children | 0 (0.0%) | 5 (100.0%) |
| Total | 27 (6.7%) | 41 (15.8%) |
Race in Curwensville borough
The most populous races in Curwensville borough are White / Caucasian (2,380 | 93.0%), Two or more Races (83 | 3.2%), and Some other Race (69 | 2.7%).
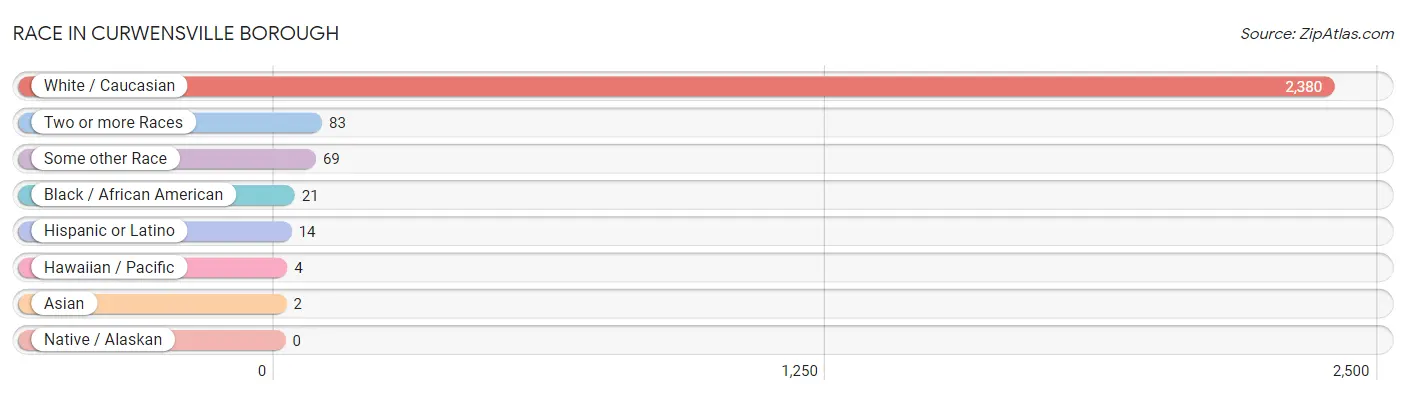
| Race | # Population | % Population |
| Asian | 2 | 0.1% |
| Black / African American | 21 | 0.8% |
| Hawaiian / Pacific | 4 | 0.2% |
| Hispanic or Latino | 14 | 0.5% |
| Native / Alaskan | 0 | 0.0% |
| White / Caucasian | 2,380 | 93.0% |
| Two or more Races | 83 | 3.2% |
| Some other Race | 69 | 2.7% |
| Total | 2,559 | 100.0% |
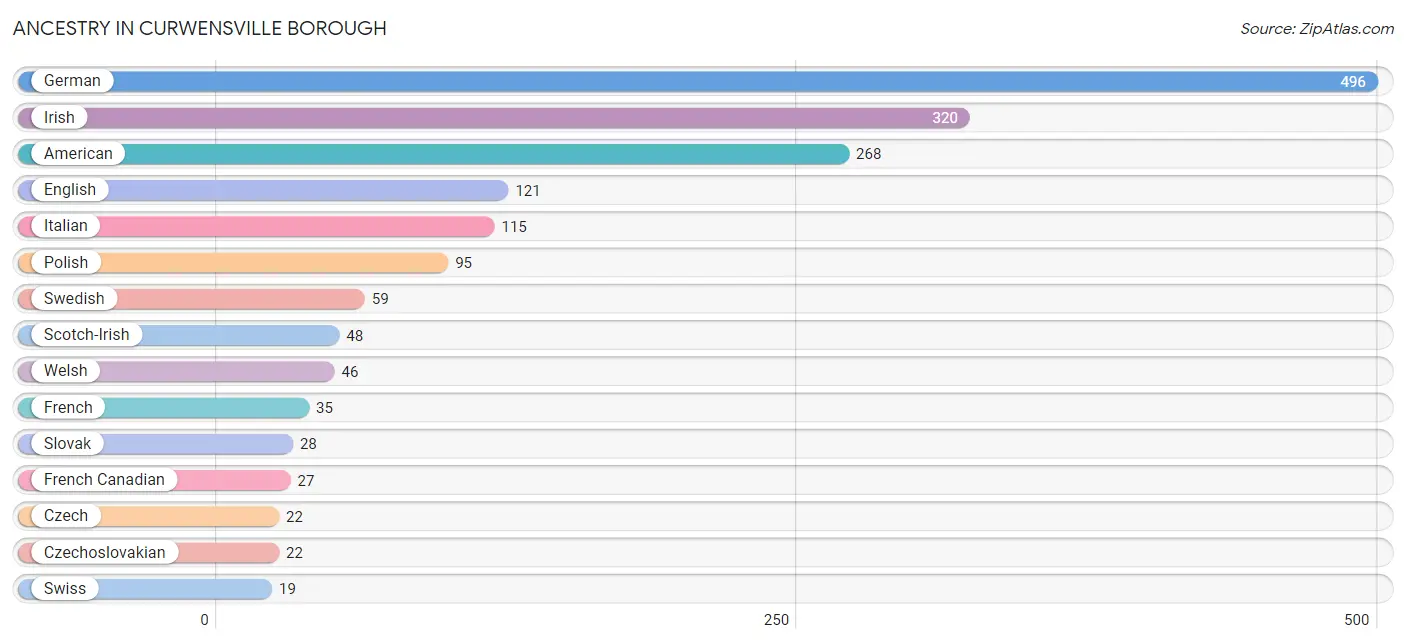
Ancestry in Curwensville borough
The most populous ancestries reported in Curwensville borough are German (496 | 19.4%), Irish (320 | 12.5%), American (268 | 10.5%), English (121 | 4.7%), and Italian (115 | 4.5%), together accounting for 51.6% of all Curwensville borough residents.
| Ancestry | # Population | % Population |
| American | 268 | 10.5% |
| Austrian | 7 | 0.3% |
| Bulgarian | 5 | 0.2% |
| Burmese | 10 | 0.4% |
| Cuban | 5 | 0.2% |
| Czech | 22 | 0.9% |
| Czechoslovakian | 22 | 0.9% |
| English | 121 | 4.7% |
| European | 13 | 0.5% |
| French | 35 | 1.4% |
| French Canadian | 27 | 1.1% |
| German | 496 | 19.4% |
| Irish | 320 | 12.5% |
| Iroquois | 2 | 0.1% |
| Italian | 115 | 4.5% |
| Mexican | 9 | 0.4% |
| Pennsylvania German | 14 | 0.5% |
| Polish | 95 | 3.7% |
| Scotch-Irish | 48 | 1.9% |
| Scottish | 7 | 0.3% |
| Slavic | 8 | 0.3% |
| Slovak | 28 | 1.1% |
| Swedish | 59 | 2.3% |
| Swiss | 19 | 0.7% |
| Tongan | 9 | 0.4% |
| Welsh | 46 | 1.8% | View All 26 Rows |
Immigrants in Curwensville borough
The most numerous immigrant groups reported in Curwensville borough came from Europe (11 | 0.4%), Germany (6 | 0.2%), Western Europe (6 | 0.2%), Bulgaria (5 | 0.2%), and Eastern Europe (5 | 0.2%), together accounting for 1.3% of all Curwensville borough residents.
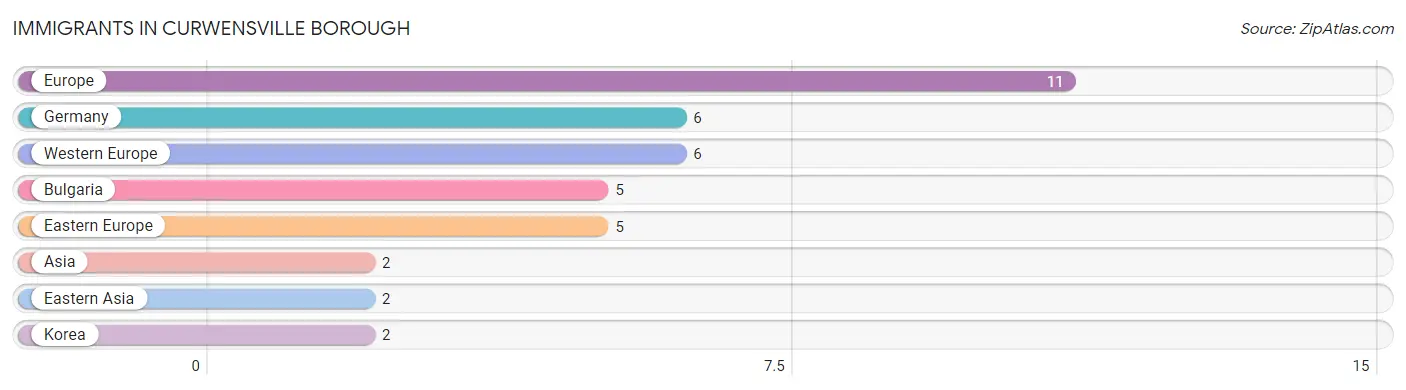
| Immigration Origin | # Population | % Population |
| Asia | 2 | 0.1% |
| Bulgaria | 5 | 0.2% |
| Eastern Asia | 2 | 0.1% |
| Eastern Europe | 5 | 0.2% |
| Europe | 11 | 0.4% |
| Germany | 6 | 0.2% |
| Korea | 2 | 0.1% |
| Western Europe | 6 | 0.2% | View All 8 Rows |
Sex and Age in Curwensville borough
Sex and Age in Curwensville borough
The most populous age groups in Curwensville borough are 25 to 29 Years (142 | 12.6%) for men and 60 to 64 Years (153 | 10.7%) for women.
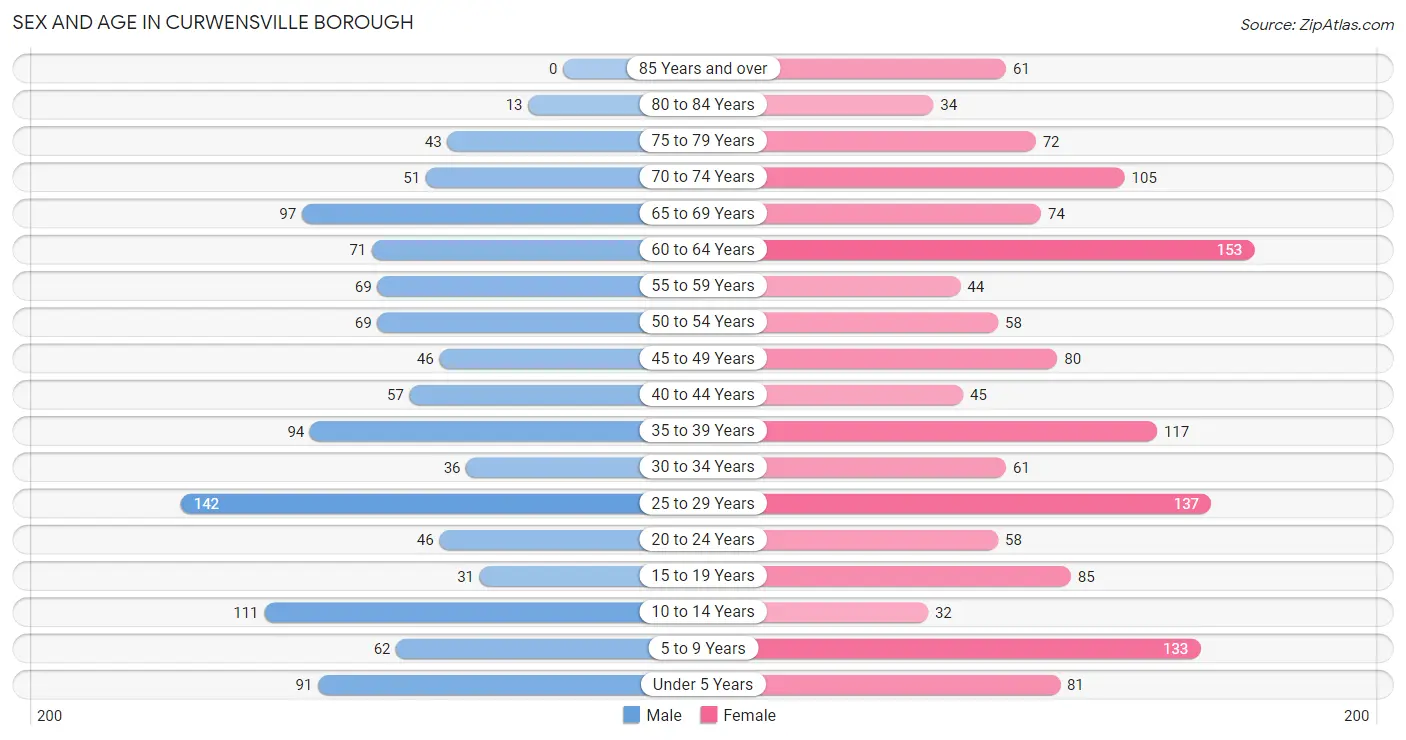
| Age Bracket | Male | Female |
| Under 5 Years | 91 (8.1%) | 81 (5.7%) |
| 5 to 9 Years | 62 (5.5%) | 133 (9.3%) |
| 10 to 14 Years | 111 (9.8%) | 32 (2.2%) |
| 15 to 19 Years | 31 (2.8%) | 85 (5.9%) |
| 20 to 24 Years | 46 (4.1%) | 58 (4.1%) |
| 25 to 29 Years | 142 (12.6%) | 137 (9.6%) |
| 30 to 34 Years | 36 (3.2%) | 61 (4.3%) |
| 35 to 39 Years | 94 (8.3%) | 117 (8.2%) |
| 40 to 44 Years | 57 (5.1%) | 45 (3.2%) |
| 45 to 49 Years | 46 (4.1%) | 80 (5.6%) |
| 50 to 54 Years | 69 (6.1%) | 58 (4.1%) |
| 55 to 59 Years | 69 (6.1%) | 44 (3.1%) |
| 60 to 64 Years | 71 (6.3%) | 153 (10.7%) |
| 65 to 69 Years | 97 (8.6%) | 74 (5.2%) |
| 70 to 74 Years | 51 (4.5%) | 105 (7.3%) |
| 75 to 79 Years | 43 (3.8%) | 72 (5.0%) |
| 80 to 84 Years | 13 (1.1%) | 34 (2.4%) |
| 85 Years and over | 0 (0.0%) | 61 (4.3%) |
| Total | 1,129 (100.0%) | 1,430 (100.0%) |
Families and Households in Curwensville borough
Median Family Size in Curwensville borough
The median family size in Curwensville borough is 2.86 persons per family, with married-couple families (405 | 60.9%) accounting for the largest median family size of 2.92 persons per family. On the other hand, single male/father families (92 | 13.8%) represent the smallest median family size with 2.51 persons per family.
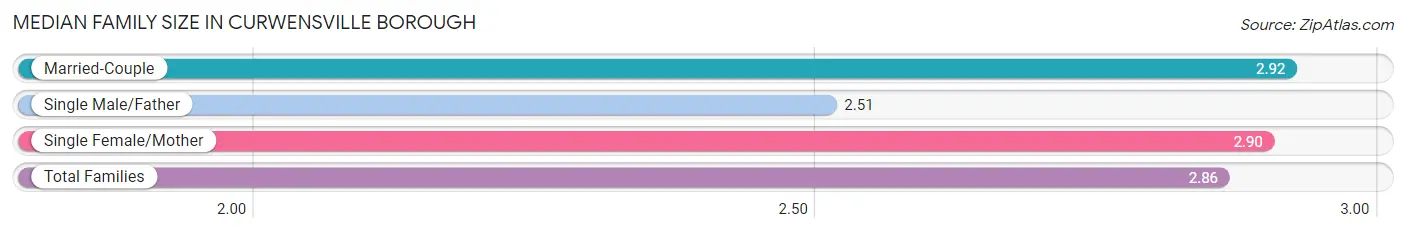
| Family Type | # Families | Family Size |
| Married-Couple | 405 (60.9%) | 2.92 |
| Single Male/Father | 92 (13.8%) | 2.51 |
| Single Female/Mother | 168 (25.3%) | 2.90 |
| Total Families | 665 (100.0%) | 2.86 |
Median Household Size in Curwensville borough
The median household size in Curwensville borough is 2.28 persons per household, with single female/mother households (168 | 15.6%) accounting for the largest median household size of 3.1 persons per household. non-family households (414 | 38.4%) represent the smallest median household size with 1.19 persons per household.
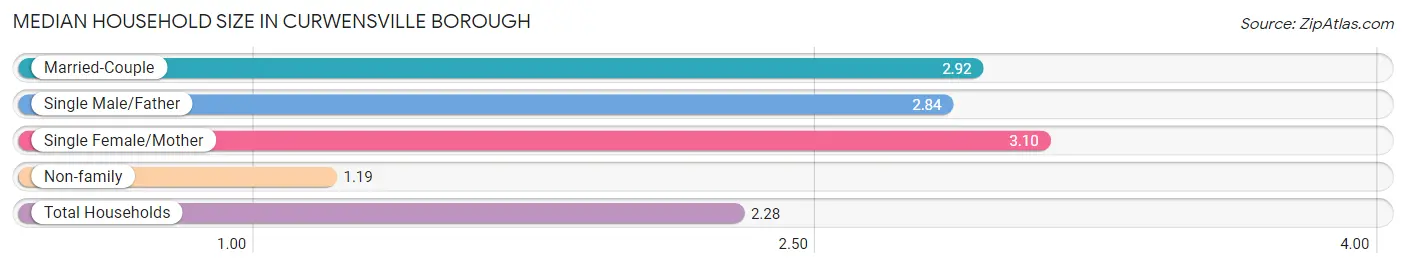
| Household Type | # Households | Household Size |
| Married-Couple | 405 (37.5%) | 2.92 |
| Single Male/Father | 92 (8.5%) | 2.84 |
| Single Female/Mother | 168 (15.6%) | 3.10 |
| Non-family | 414 (38.4%) | 1.19 |
| Total Households | 1,079 (100.0%) | 2.28 |
Household Size by Marriage Status in Curwensville borough
Out of a total of 1,079 households in Curwensville borough, 665 (61.6%) are family households, while 414 (38.4%) are nonfamily households. The most numerous type of family households are 2-person households, comprising 302, and the most common type of nonfamily households are 1-person households, comprising 340.
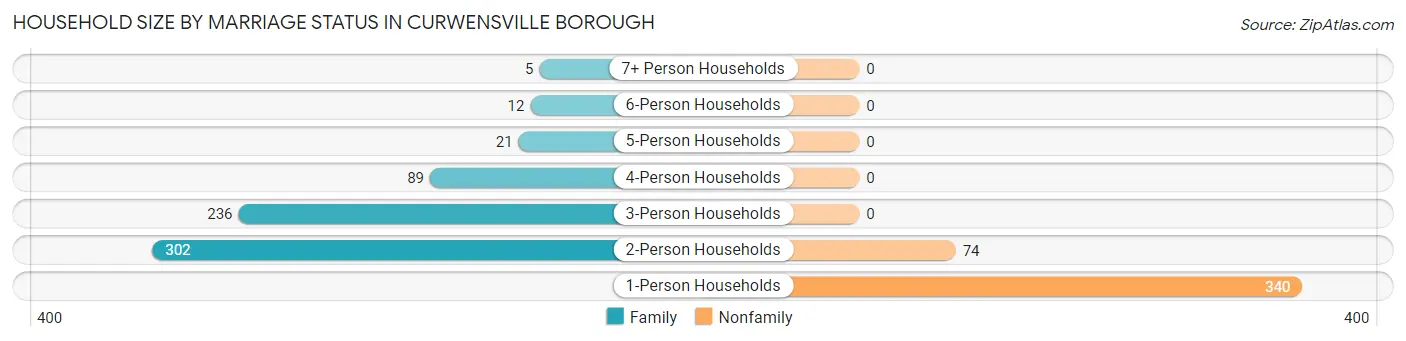
| Household Size | Family Households | Nonfamily Households |
| 1-Person Households | - | 340 (31.5%) |
| 2-Person Households | 302 (28.0%) | 74 (6.9%) |
| 3-Person Households | 236 (21.9%) | 0 (0.0%) |
| 4-Person Households | 89 (8.3%) | 0 (0.0%) |
| 5-Person Households | 21 (1.9%) | 0 (0.0%) |
| 6-Person Households | 12 (1.1%) | 0 (0.0%) |
| 7+ Person Households | 5 (0.5%) | 0 (0.0%) |
| Total | 665 (61.6%) | 414 (38.4%) |
Female Fertility in Curwensville borough
Fertility by Age in Curwensville borough
Average fertility rate in Curwensville borough is 30.0 births per 1,000 women. Women in the age bracket of 20 to 34 years have the highest fertility rate with 51.0 births per 1,000 women. Women in the age bracket of 20 to 34 years acount for 72.2% of all women with births.
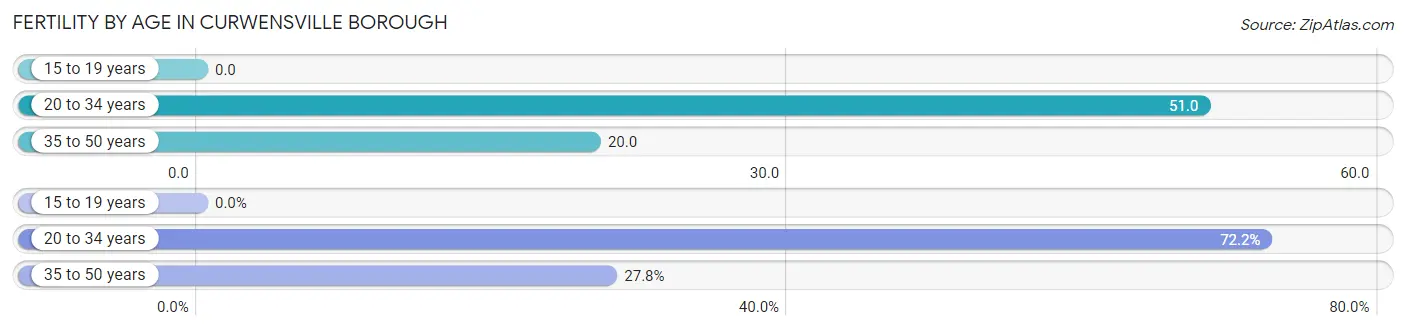
| Age Bracket | Women with Births | Births / 1,000 Women |
| 15 to 19 years | 0 (0.0%) | 0.0 |
| 20 to 34 years | 13 (72.2%) | 51.0 |
| 35 to 50 years | 5 (27.8%) | 20.0 |
| Total | 18 (100.0%) | 30.0 |
Fertility by Age by Marriage Status in Curwensville borough
72.2% of women with births (18) in Curwensville borough are married. The highest percentage of unmarried women with births falls into 35 to 50 years age bracket with 100.0% of them unmarried at the time of birth, while the lowest percentage of unmarried women with births belong to 20 to 34 years age bracket with 0.0% of them unmarried.
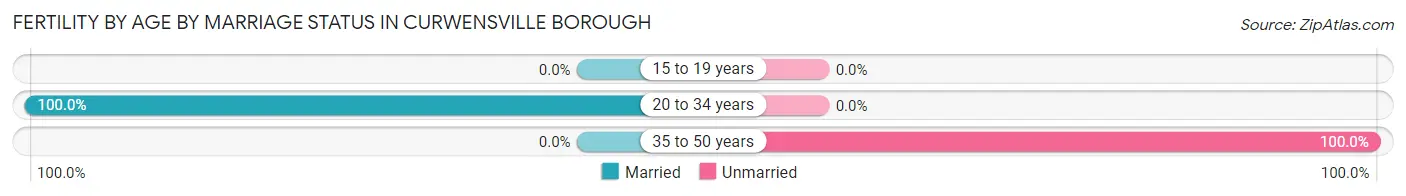
| Age Bracket | Married | Unmarried |
| 15 to 19 years | 0 (0.0%) | 0 (0.0%) |
| 20 to 34 years | 13 (100.0%) | 0 (0.0%) |
| 35 to 50 years | 0 (0.0%) | 5 (100.0%) |
| Total | 13 (72.2%) | 5 (27.8%) |
Fertility by Education in Curwensville borough
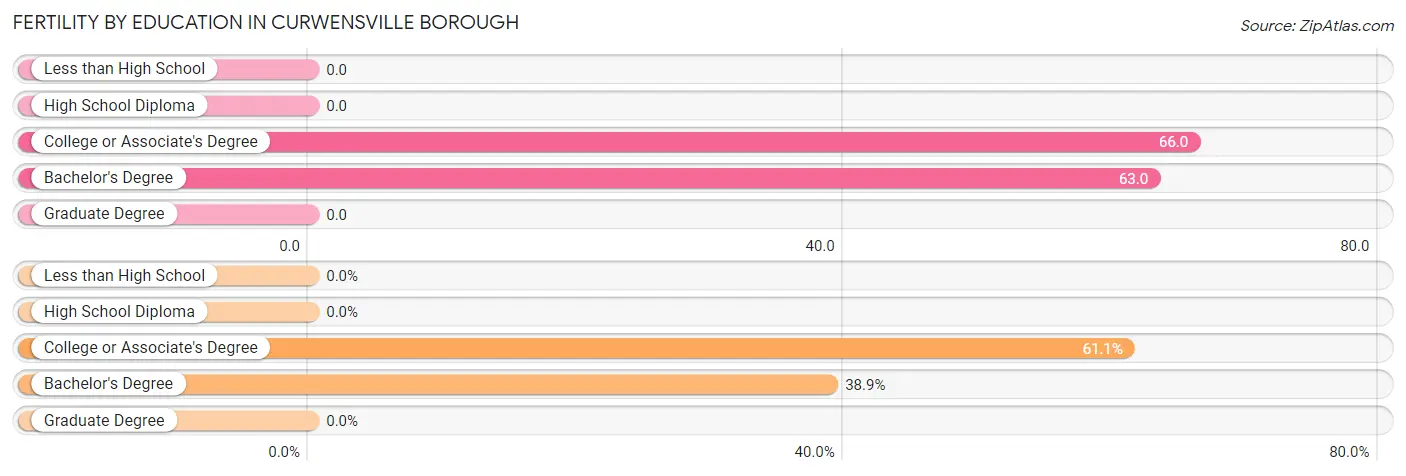
| Educational Attainment | Women with Births | Births / 1,000 Women |
| Less than High School | 0 (0.0%) | 0.0 |
| High School Diploma | 0 (0.0%) | 0.0 |
| College or Associate's Degree | 11 (61.1%) | 66.0 |
| Bachelor's Degree | 7 (38.9%) | 63.0 |
| Graduate Degree | 0 (0.0%) | 0.0 |
| Total | 18 (100.0%) | 30.0 |
Fertility by Education by Marriage Status in Curwensville borough
27.8% of women with births in Curwensville borough are unmarried. Women with the educational attainment of bachelor's degree are most likely to be married with 100.0% of them married at childbirth, while women with the educational attainment of college or associate's degree are least likely to be married with 45.5% of them unmarried at childbirth.
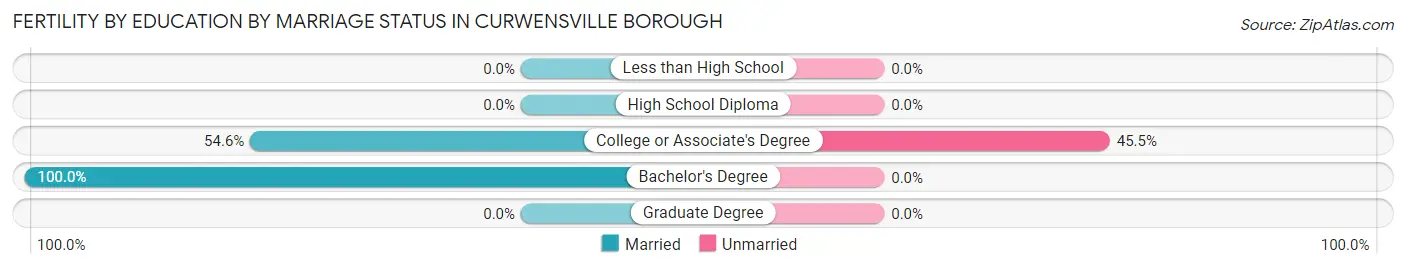
| Educational Attainment | Married | Unmarried |
| Less than High School | 0 (0.0%) | 0 (0.0%) |
| High School Diploma | 0 (0.0%) | 0 (0.0%) |
| College or Associate's Degree | 6 (54.5%) | 5 (45.5%) |
| Bachelor's Degree | 7 (100.0%) | 0 (0.0%) |
| Graduate Degree | 0 (0.0%) | 0 (0.0%) |
| Total | 13 (72.2%) | 5 (27.8%) |
Employment Characteristics in Curwensville borough
Employment by Class of Employer in Curwensville borough
Among the 1,070 employed individuals in Curwensville borough, private company employees (582 | 54.4%), not-for-profit organizations (157 | 14.7%), and local government employees (110 | 10.3%) make up the most common classes of employment.
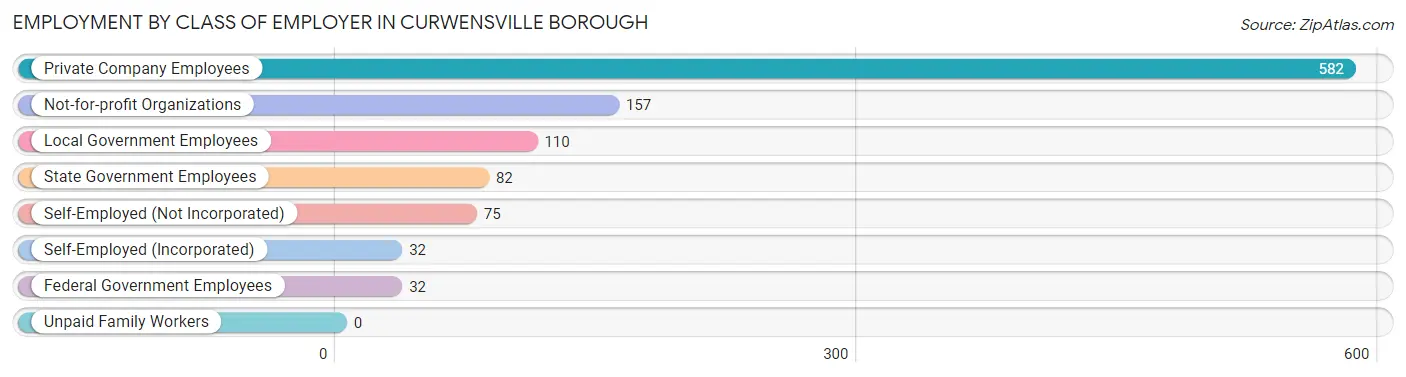
| Employer Class | # Employees | % Employees |
| Private Company Employees | 582 | 54.4% |
| Self-Employed (Incorporated) | 32 | 3.0% |
| Self-Employed (Not Incorporated) | 75 | 7.0% |
| Not-for-profit Organizations | 157 | 14.7% |
| Local Government Employees | 110 | 10.3% |
| State Government Employees | 82 | 7.7% |
| Federal Government Employees | 32 | 3.0% |
| Unpaid Family Workers | 0 | 0.0% |
| Total | 1,070 | 100.0% |
Employment Status by Age in Curwensville borough
According to the labor force statistics for Curwensville borough, out of the total population over 16 years of age (1,997), 60.3% or 1,204 individuals are in the labor force, with 9.0% or 108 of them unemployed. The age group with the highest labor force participation rate is 35 to 44 years, with 91.7% or 287 individuals in the labor force. Within the labor force, the 16 to 19 years age range has the highest percentage of unemployed individuals, with 39.3% or 22 of them being unemployed.
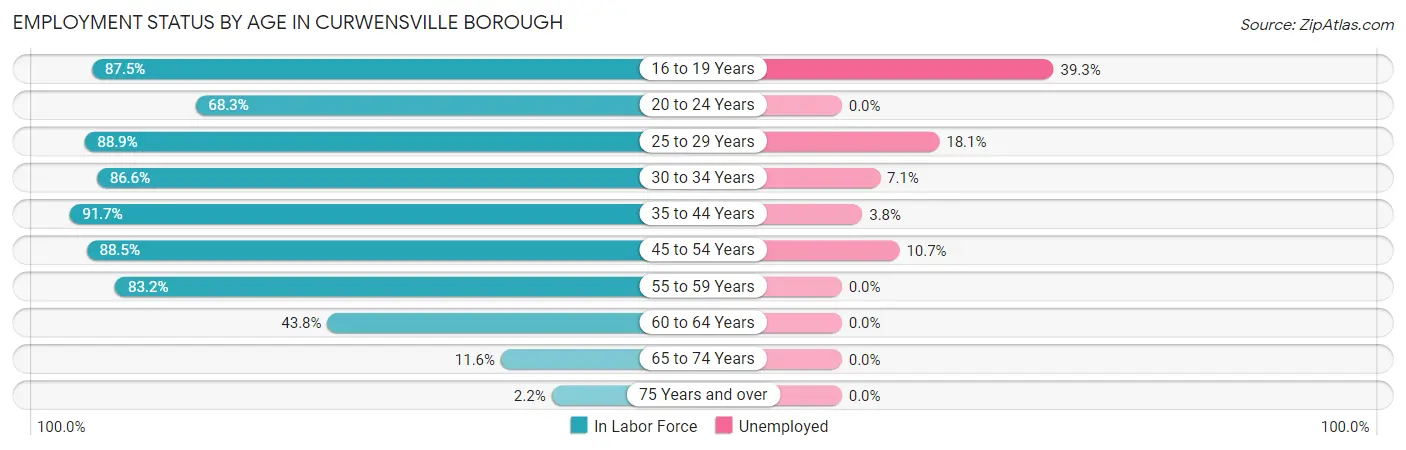
| Age Bracket | In Labor Force | Unemployed |
| 16 to 19 Years | 56 (87.5%) | 22 (39.3%) |
| 20 to 24 Years | 71 (68.3%) | 0 (0.0%) |
| 25 to 29 Years | 248 (88.9%) | 45 (18.1%) |
| 30 to 34 Years | 84 (86.6%) | 6 (7.1%) |
| 35 to 44 Years | 287 (91.7%) | 11 (3.8%) |
| 45 to 54 Years | 224 (88.5%) | 24 (10.7%) |
| 55 to 59 Years | 94 (83.2%) | 0 (0.0%) |
| 60 to 64 Years | 98 (43.8%) | 0 (0.0%) |
| 65 to 74 Years | 38 (11.6%) | 0 (0.0%) |
| 75 Years and over | 5 (2.2%) | 0 (0.0%) |
| Total | 1,204 (60.3%) | 108 (9.0%) |
Employment Status by Educational Attainment in Curwensville borough
According to labor force statistics for Curwensville borough, 80.9% of individuals (1,035) out of the total population between 25 and 64 years of age (1,279) are in the labor force, with 8.3% or 86 of them being unemployed. The group with the highest labor force participation rate are those with the educational attainment of college / associate degree, with 90.0% or 378 individuals in the labor force. Within the labor force, individuals with college / associate degree education have the highest percentage of unemployment, with 10.1% or 38 of them being unemployed.
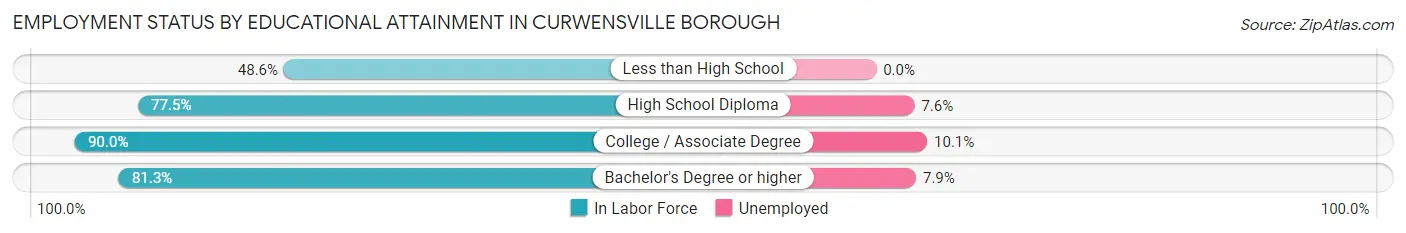
| Educational Attainment | In Labor Force | Unemployed |
| Less than High School | 36 (48.6%) | 0 (0.0%) |
| High School Diploma | 355 (77.5%) | 35 (7.6%) |
| College / Associate Degree | 378 (90.0%) | 42 (10.1%) |
| Bachelor's Degree or higher | 266 (81.3%) | 26 (7.9%) |
| Total | 1,035 (80.9%) | 106 (8.3%) |
Employment Occupations by Sex in Curwensville borough
Management, Business, Science and Arts Occupations
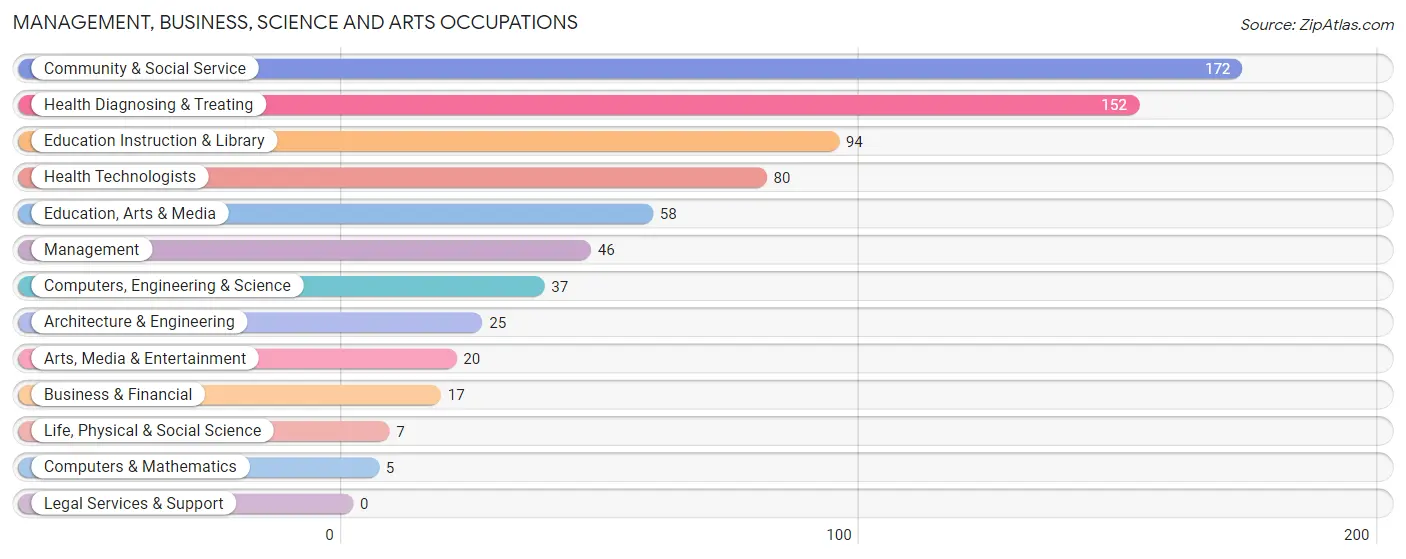
The most common Management, Business, Science and Arts occupations in Curwensville borough are Community & Social Service (172 | 15.7%), Health Diagnosing & Treating (152 | 13.9%), Education Instruction & Library (94 | 8.6%), Health Technologists (80 | 7.3%), and Education, Arts & Media (58 | 5.3%).
Management, Business, Science and Arts Occupations by Sex
Within the Management, Business, Science and Arts occupations in Curwensville borough, the most male-oriented occupations are Computers, Engineering & Science (100.0%), Computers & Mathematics (100.0%), and Architecture & Engineering (100.0%), while the most female-oriented occupations are Health Technologists (91.2%), Health Diagnosing & Treating (80.9%), and Education Instruction & Library (79.8%).
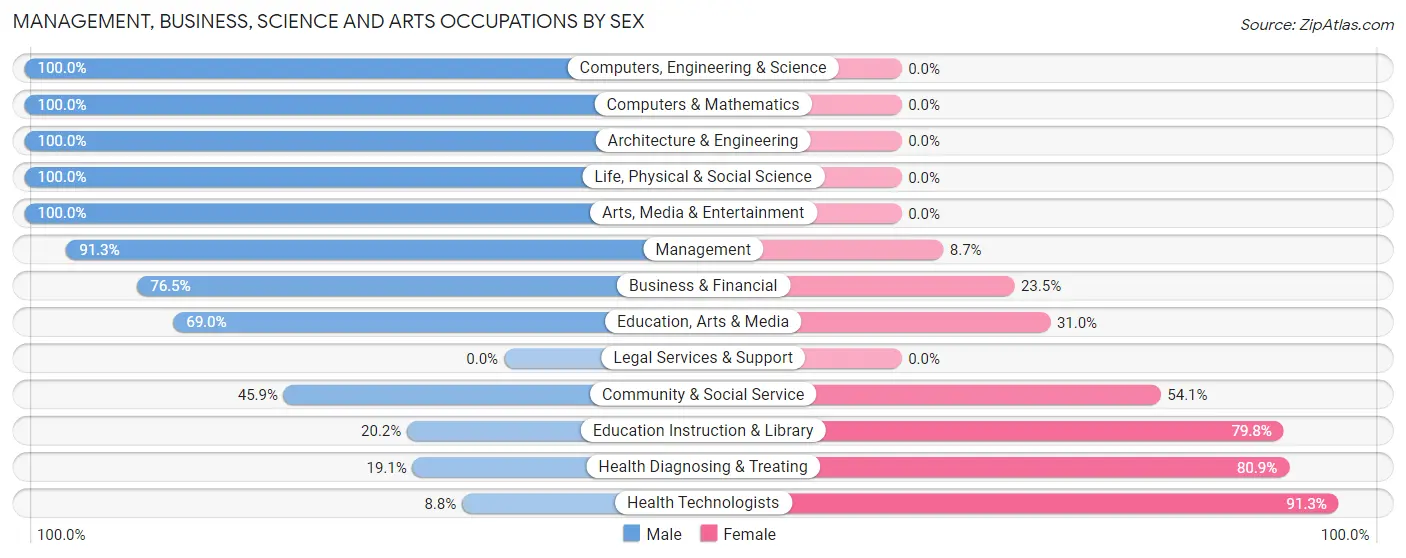
| Occupation | Male | Female |
| Management | 42 (91.3%) | 4 (8.7%) |
| Business & Financial | 13 (76.5%) | 4 (23.5%) |
| Computers, Engineering & Science | 37 (100.0%) | 0 (0.0%) |
| Computers & Mathematics | 5 (100.0%) | 0 (0.0%) |
| Architecture & Engineering | 25 (100.0%) | 0 (0.0%) |
| Life, Physical & Social Science | 7 (100.0%) | 0 (0.0%) |
| Community & Social Service | 79 (45.9%) | 93 (54.1%) |
| Education, Arts & Media | 40 (69.0%) | 18 (31.0%) |
| Legal Services & Support | 0 (0.0%) | 0 (0.0%) |
| Education Instruction & Library | 19 (20.2%) | 75 (79.8%) |
| Arts, Media & Entertainment | 20 (100.0%) | 0 (0.0%) |
| Health Diagnosing & Treating | 29 (19.1%) | 123 (80.9%) |
| Health Technologists | 7 (8.7%) | 73 (91.2%) |
| Total (Category) | 200 (47.2%) | 224 (52.8%) |
| Total (Overall) | 556 (50.7%) | 541 (49.3%) |
Services Occupations
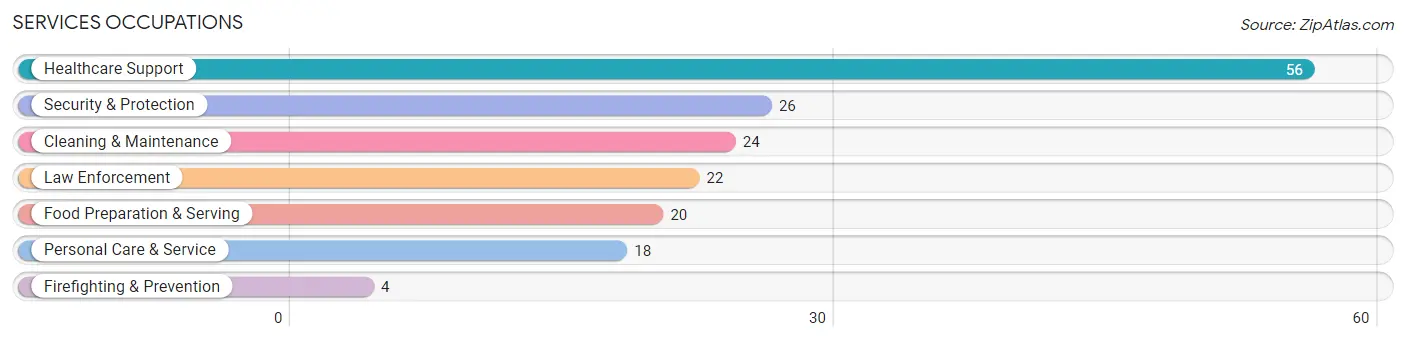
The most common Services occupations in Curwensville borough are Healthcare Support (56 | 5.1%), Security & Protection (26 | 2.4%), Cleaning & Maintenance (24 | 2.2%), Law Enforcement (22 | 2.0%), and Food Preparation & Serving (20 | 1.8%).
Services Occupations by Sex
Within the Services occupations in Curwensville borough, the most male-oriented occupations are Security & Protection (100.0%), Firefighting & Prevention (100.0%), and Law Enforcement (100.0%), while the most female-oriented occupations are Healthcare Support (100.0%), Personal Care & Service (100.0%), and Food Preparation & Serving (65.0%).
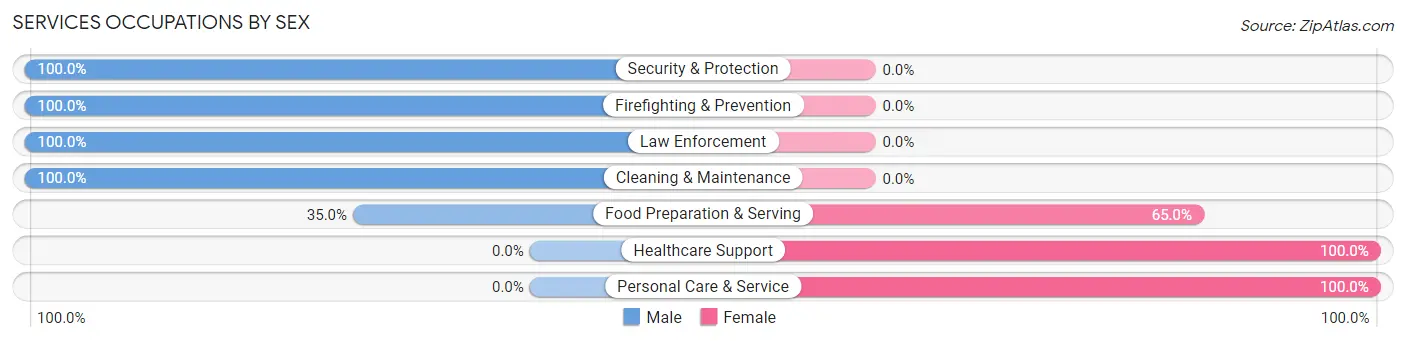
| Occupation | Male | Female |
| Healthcare Support | 0 (0.0%) | 56 (100.0%) |
| Security & Protection | 26 (100.0%) | 0 (0.0%) |
| Firefighting & Prevention | 4 (100.0%) | 0 (0.0%) |
| Law Enforcement | 22 (100.0%) | 0 (0.0%) |
| Food Preparation & Serving | 7 (35.0%) | 13 (65.0%) |
| Cleaning & Maintenance | 24 (100.0%) | 0 (0.0%) |
| Personal Care & Service | 0 (0.0%) | 18 (100.0%) |
| Total (Category) | 57 (39.6%) | 87 (60.4%) |
| Total (Overall) | 556 (50.7%) | 541 (49.3%) |
Sales and Office Occupations
The most common Sales and Office occupations in Curwensville borough are Office & Administration (140 | 12.8%), and Sales & Related (108 | 9.9%).
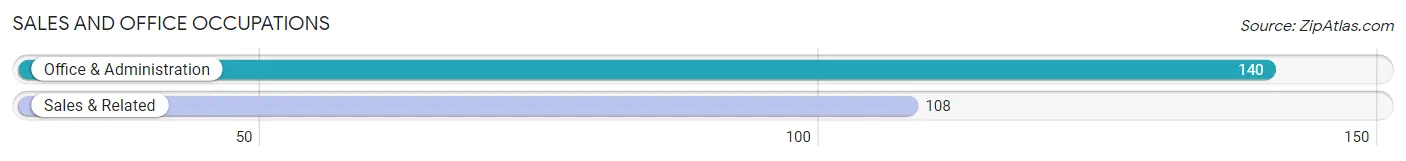
Sales and Office Occupations by Sex
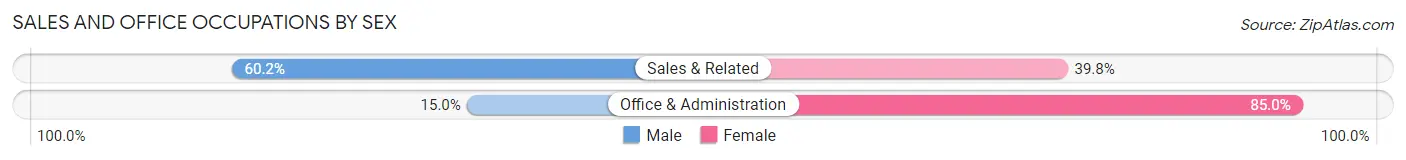
| Occupation | Male | Female |
| Sales & Related | 65 (60.2%) | 43 (39.8%) |
| Office & Administration | 21 (15.0%) | 119 (85.0%) |
| Total (Category) | 86 (34.7%) | 162 (65.3%) |
| Total (Overall) | 556 (50.7%) | 541 (49.3%) |
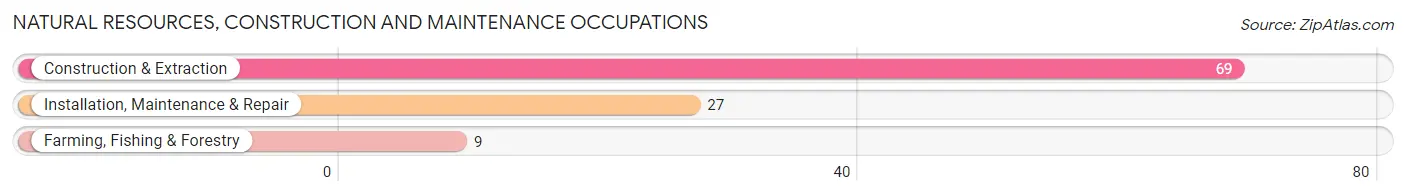
Natural Resources, Construction and Maintenance Occupations
The most common Natural Resources, Construction and Maintenance occupations in Curwensville borough are Construction & Extraction (69 | 6.3%), Installation, Maintenance & Repair (27 | 2.5%), and Farming, Fishing & Forestry (9 | 0.8%).
Natural Resources, Construction and Maintenance Occupations by Sex
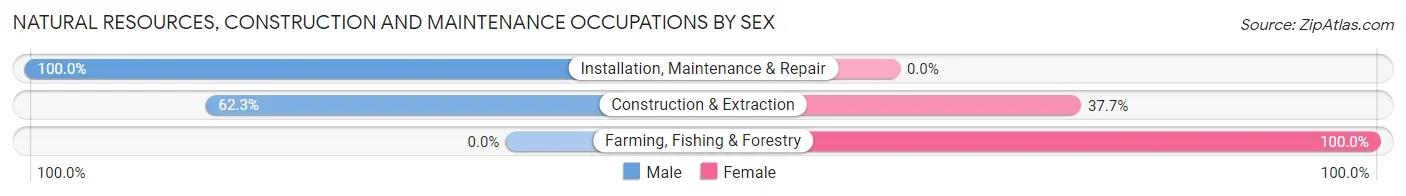
| Occupation | Male | Female |
| Farming, Fishing & Forestry | 0 (0.0%) | 9 (100.0%) |
| Construction & Extraction | 43 (62.3%) | 26 (37.7%) |
| Installation, Maintenance & Repair | 27 (100.0%) | 0 (0.0%) |
| Total (Category) | 70 (66.7%) | 35 (33.3%) |
| Total (Overall) | 556 (50.7%) | 541 (49.3%) |
Production, Transportation and Moving Occupations
The most common Production, Transportation and Moving occupations in Curwensville borough are Material Moving (96 | 8.7%), Production (44 | 4.0%), and Transportation (36 | 3.3%).
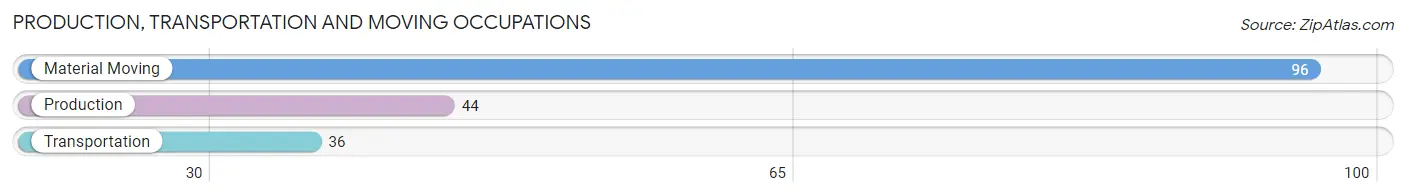
Production, Transportation and Moving Occupations by Sex
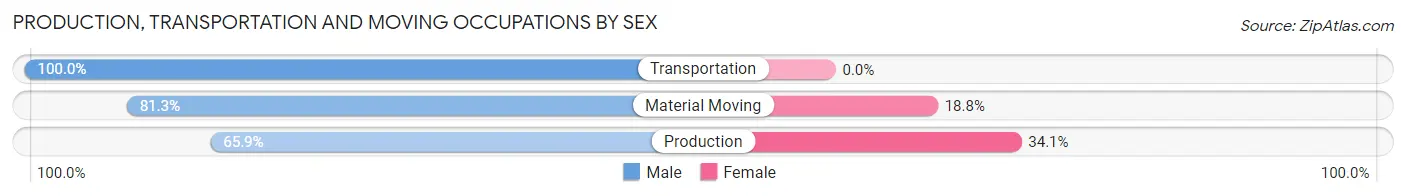
| Occupation | Male | Female |
| Production | 29 (65.9%) | 15 (34.1%) |
| Transportation | 36 (100.0%) | 0 (0.0%) |
| Material Moving | 78 (81.2%) | 18 (18.8%) |
| Total (Category) | 143 (81.2%) | 33 (18.8%) |
| Total (Overall) | 556 (50.7%) | 541 (49.3%) |
Employment Industries by Sex in Curwensville borough
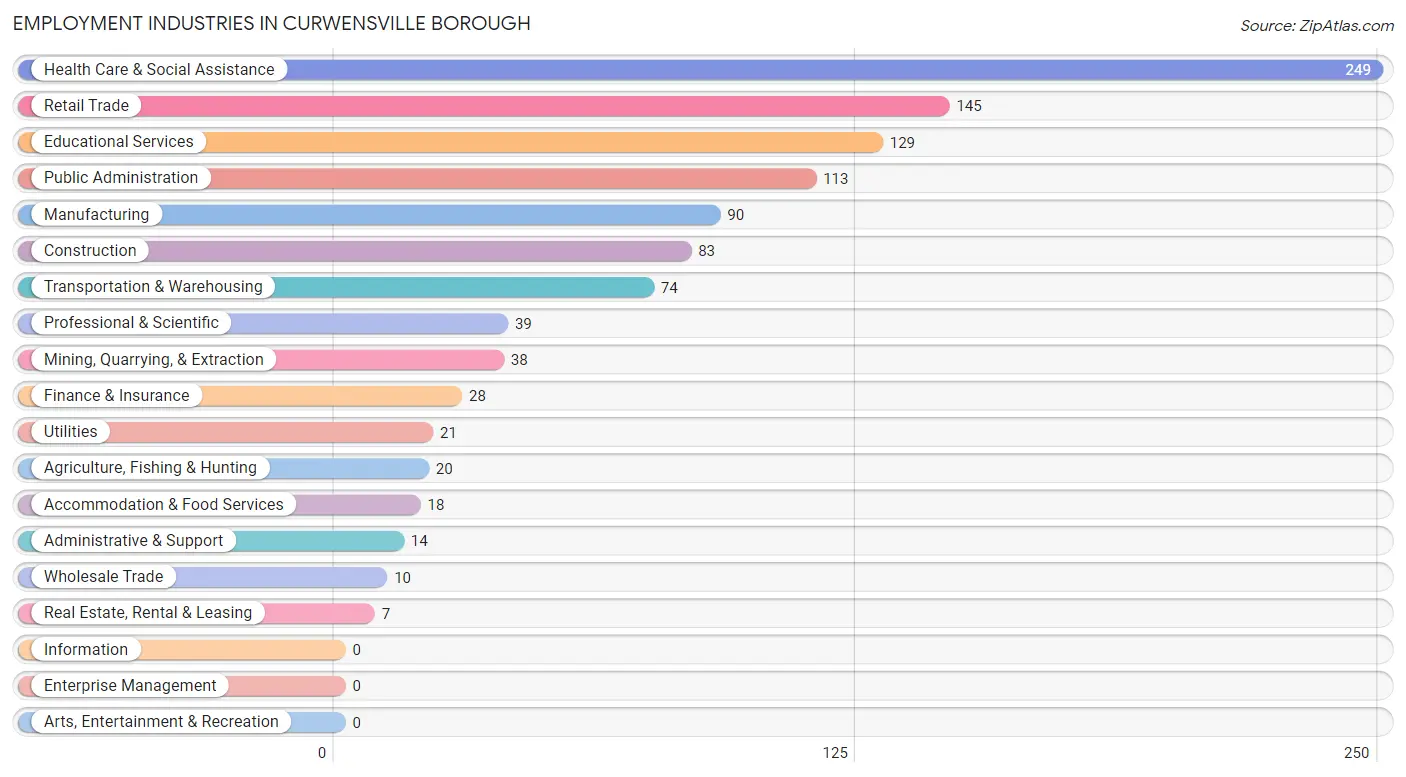
Employment Industries in Curwensville borough
The major employment industries in Curwensville borough include Health Care & Social Assistance (249 | 22.7%), Retail Trade (145 | 13.2%), Educational Services (129 | 11.8%), Public Administration (113 | 10.3%), and Manufacturing (90 | 8.2%).
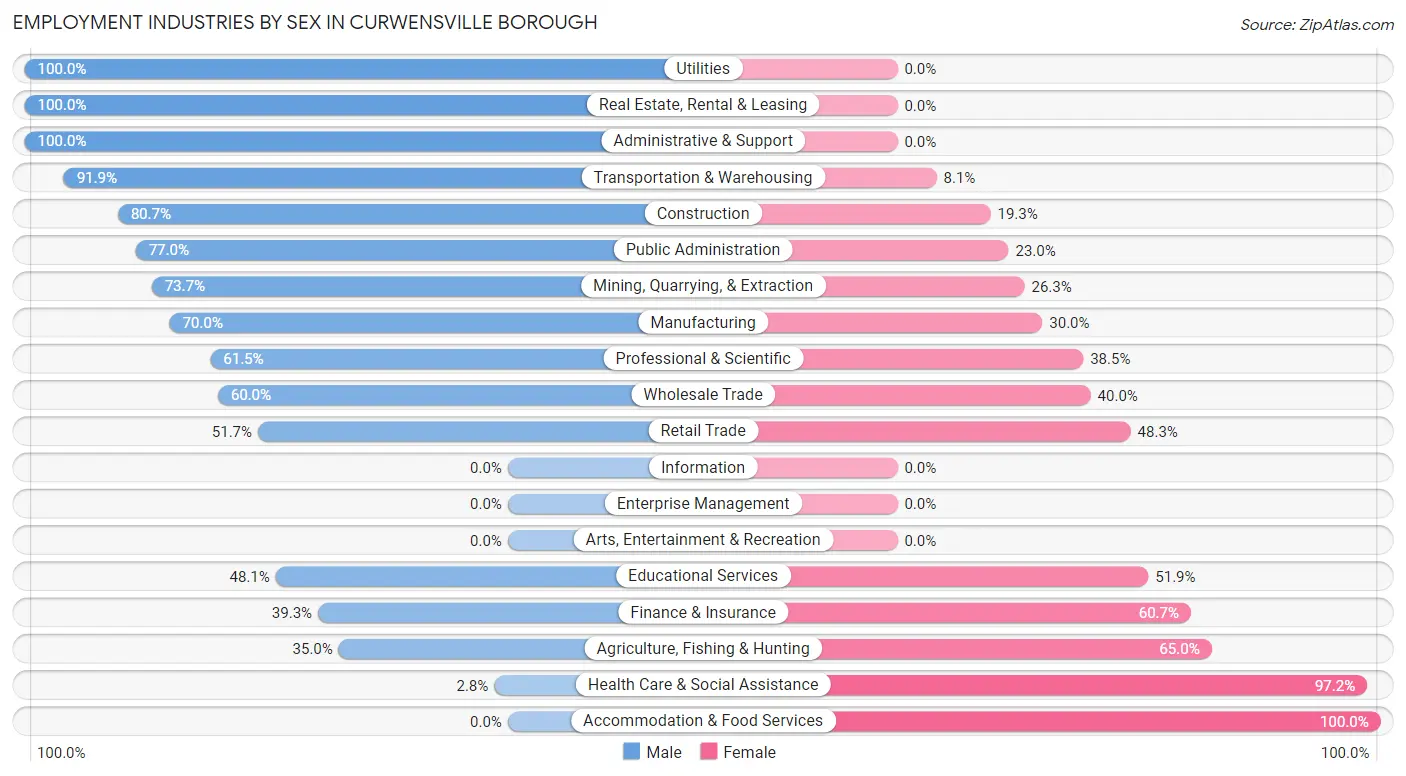
Employment Industries by Sex in Curwensville borough
The Curwensville borough industries that see more men than women are Utilities (100.0%), Real Estate, Rental & Leasing (100.0%), and Administrative & Support (100.0%), whereas the industries that tend to have a higher number of women are Accommodation & Food Services (100.0%), Health Care & Social Assistance (97.2%), and Agriculture, Fishing & Hunting (65.0%).
| Industry | Male | Female |
| Agriculture, Fishing & Hunting | 7 (35.0%) | 13 (65.0%) |
| Mining, Quarrying, & Extraction | 28 (73.7%) | 10 (26.3%) |
| Construction | 67 (80.7%) | 16 (19.3%) |
| Manufacturing | 63 (70.0%) | 27 (30.0%) |
| Wholesale Trade | 6 (60.0%) | 4 (40.0%) |
| Retail Trade | 75 (51.7%) | 70 (48.3%) |
| Transportation & Warehousing | 68 (91.9%) | 6 (8.1%) |
| Utilities | 21 (100.0%) | 0 (0.0%) |
| Information | 0 (0.0%) | 0 (0.0%) |
| Finance & Insurance | 11 (39.3%) | 17 (60.7%) |
| Real Estate, Rental & Leasing | 7 (100.0%) | 0 (0.0%) |
| Professional & Scientific | 24 (61.5%) | 15 (38.5%) |
| Enterprise Management | 0 (0.0%) | 0 (0.0%) |
| Administrative & Support | 14 (100.0%) | 0 (0.0%) |
| Educational Services | 62 (48.1%) | 67 (51.9%) |
| Health Care & Social Assistance | 7 (2.8%) | 242 (97.2%) |
| Arts, Entertainment & Recreation | 0 (0.0%) | 0 (0.0%) |
| Accommodation & Food Services | 0 (0.0%) | 18 (100.0%) |
| Public Administration | 87 (77.0%) | 26 (23.0%) |
| Total | 556 (50.7%) | 541 (49.3%) |
Education in Curwensville borough
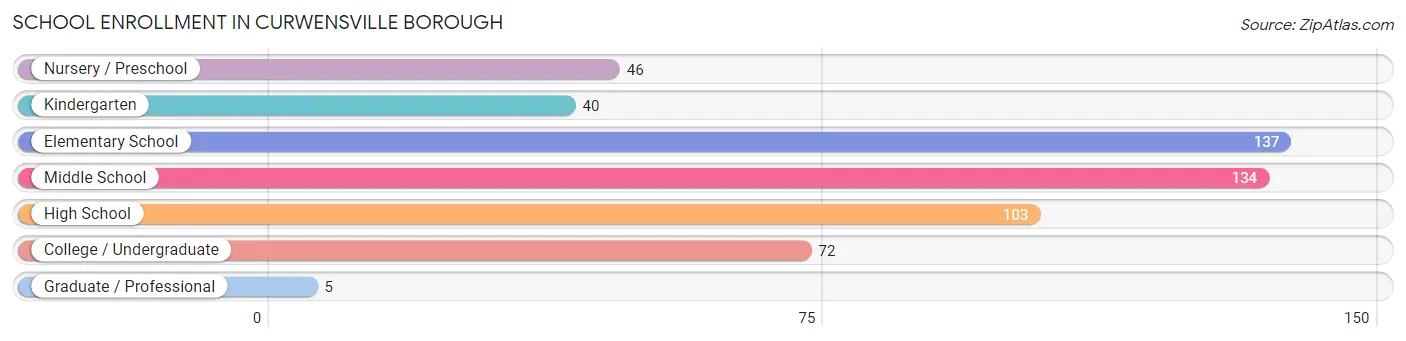
School Enrollment in Curwensville borough
The most common levels of schooling among the 537 students in Curwensville borough are elementary school (137 | 25.5%), middle school (134 | 24.9%), and high school (103 | 19.2%).
| School Level | # Students | % Students |
| Nursery / Preschool | 46 | 8.6% |
| Kindergarten | 40 | 7.4% |
| Elementary School | 137 | 25.5% |
| Middle School | 134 | 24.9% |
| High School | 103 | 19.2% |
| College / Undergraduate | 72 | 13.4% |
| Graduate / Professional | 5 | 0.9% |
| Total | 537 | 100.0% |
School Enrollment by Age by Funding Source in Curwensville borough
Out of a total of 537 students who are enrolled in schools in Curwensville borough, 11 (2.0%) attend a private institution, while the remaining 526 (98.0%) are enrolled in public schools. The age group of 35 years and over has the highest likelihood of being enrolled in private schools, with 6 (15.4% in the age bracket) enrolled. Conversely, the age group of 3 to 4 year olds has the lowest likelihood of being enrolled in a private school, with 40 (100.0% in the age bracket) attending a public institution.
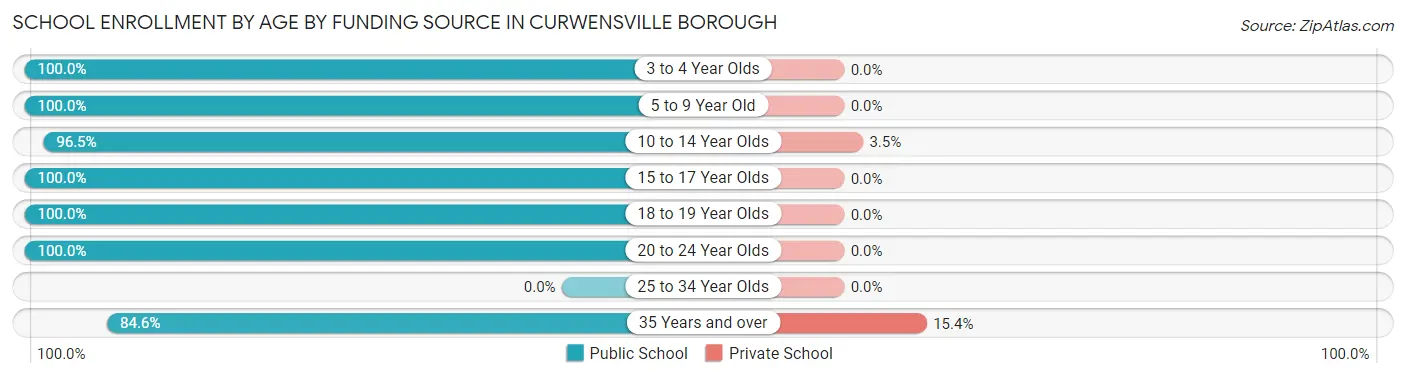
| Age Bracket | Public School | Private School |
| 3 to 4 Year Olds | 40 (100.0%) | 0 (0.0%) |
| 5 to 9 Year Old | 179 (100.0%) | 0 (0.0%) |
| 10 to 14 Year Olds | 138 (96.5%) | 5 (3.5%) |
| 15 to 17 Year Olds | 68 (100.0%) | 0 (0.0%) |
| 18 to 19 Year Olds | 33 (100.0%) | 0 (0.0%) |
| 20 to 24 Year Olds | 35 (100.0%) | 0 (0.0%) |
| 25 to 34 Year Olds | 0 (0.0%) | 0 (0.0%) |
| 35 Years and over | 33 (84.6%) | 6 (15.4%) |
| Total | 526 (98.0%) | 11 (2.0%) |
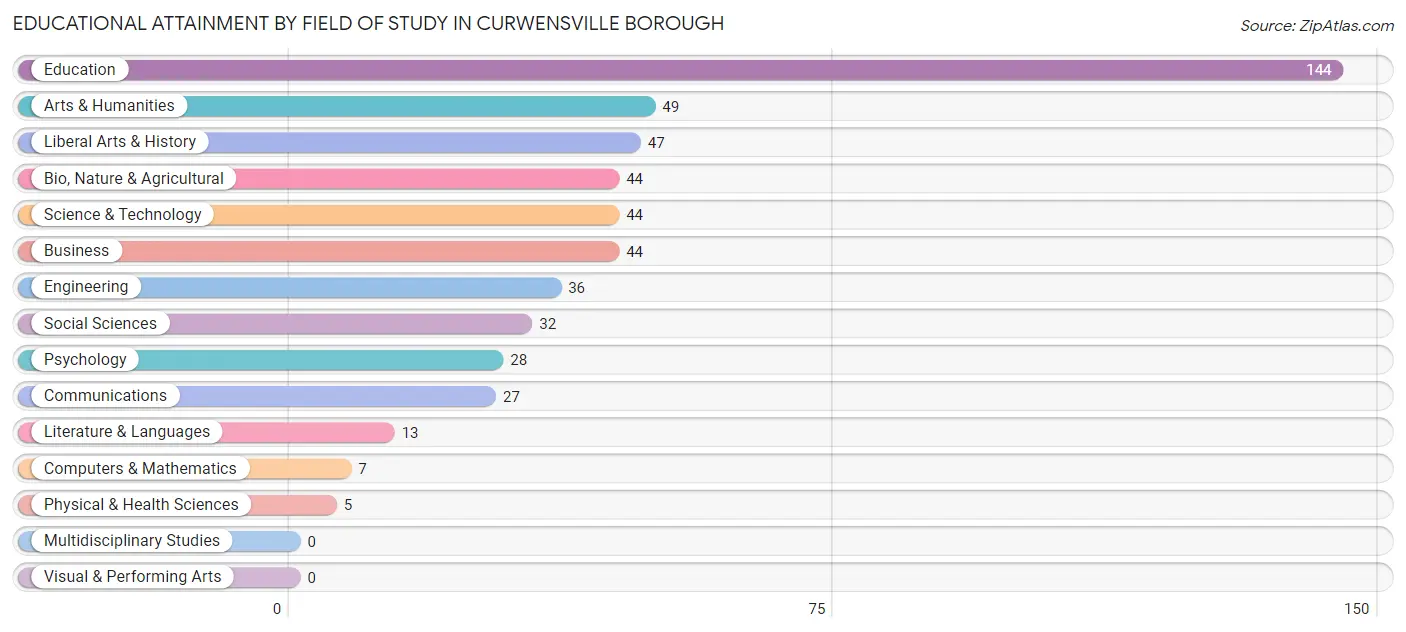
Educational Attainment by Field of Study in Curwensville borough
Education (144 | 27.7%), arts & humanities (49 | 9.4%), liberal arts & history (47 | 9.0%), bio, nature & agricultural (44 | 8.5%), and science & technology (44 | 8.5%) are the most common fields of study among 520 individuals in Curwensville borough who have obtained a bachelor's degree or higher.
| Field of Study | # Graduates | % Graduates |
| Computers & Mathematics | 7 | 1.3% |
| Bio, Nature & Agricultural | 44 | 8.5% |
| Physical & Health Sciences | 5 | 1.0% |
| Psychology | 28 | 5.4% |
| Social Sciences | 32 | 6.1% |
| Engineering | 36 | 6.9% |
| Multidisciplinary Studies | 0 | 0.0% |
| Science & Technology | 44 | 8.5% |
| Business | 44 | 8.5% |
| Education | 144 | 27.7% |
| Literature & Languages | 13 | 2.5% |
| Liberal Arts & History | 47 | 9.0% |
| Visual & Performing Arts | 0 | 0.0% |
| Communications | 27 | 5.2% |
| Arts & Humanities | 49 | 9.4% |
| Total | 520 | 100.0% |
Transportation & Commute in Curwensville borough
Vehicle Availability by Sex in Curwensville borough
The most prevalent vehicle ownership categories in Curwensville borough are males with 2 vehicles (209, accounting for 38.1%) and females with 2 vehicles (246, making up 40.1%).
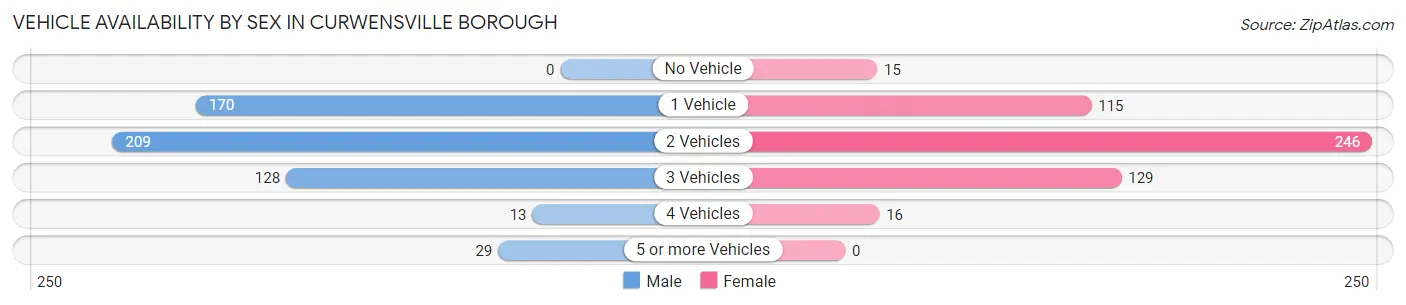
| Vehicles Available | Male | Female |
| No Vehicle | 0 (0.0%) | 15 (2.9%) |
| 1 Vehicle | 170 (31.0%) | 115 (22.1%) |
| 2 Vehicles | 209 (38.1%) | 246 (47.2%) |
| 3 Vehicles | 128 (23.3%) | 129 (24.8%) |
| 4 Vehicles | 13 (2.4%) | 16 (3.1%) |
| 5 or more Vehicles | 29 (5.3%) | 0 (0.0%) |
| Total | 549 (100.0%) | 521 (100.0%) |
Commute Time in Curwensville borough
The most frequently occuring commute durations in Curwensville borough are 15 to 19 minutes (180 commuters, 17.7%), 30 to 34 minutes (143 commuters, 14.0%), and 5 to 9 minutes (129 commuters, 12.7%).
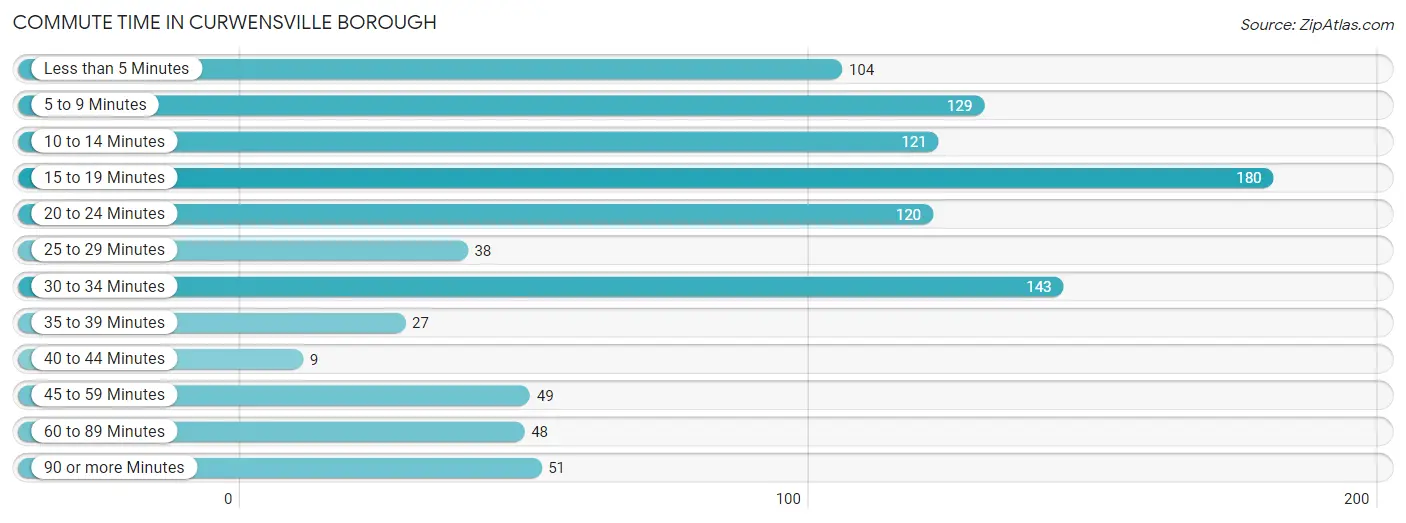
| Commute Time | # Commuters | % Commuters |
| Less than 5 Minutes | 104 | 10.2% |
| 5 to 9 Minutes | 129 | 12.7% |
| 10 to 14 Minutes | 121 | 11.9% |
| 15 to 19 Minutes | 180 | 17.7% |
| 20 to 24 Minutes | 120 | 11.8% |
| 25 to 29 Minutes | 38 | 3.7% |
| 30 to 34 Minutes | 143 | 14.0% |
| 35 to 39 Minutes | 27 | 2.6% |
| 40 to 44 Minutes | 9 | 0.9% |
| 45 to 59 Minutes | 49 | 4.8% |
| 60 to 89 Minutes | 48 | 4.7% |
| 90 or more Minutes | 51 | 5.0% |
Commute Time by Sex in Curwensville borough
The most common commute times in Curwensville borough are 15 to 19 minutes (95 commuters, 18.6%) for males and 30 to 34 minutes (103 commuters, 20.2%) for females.
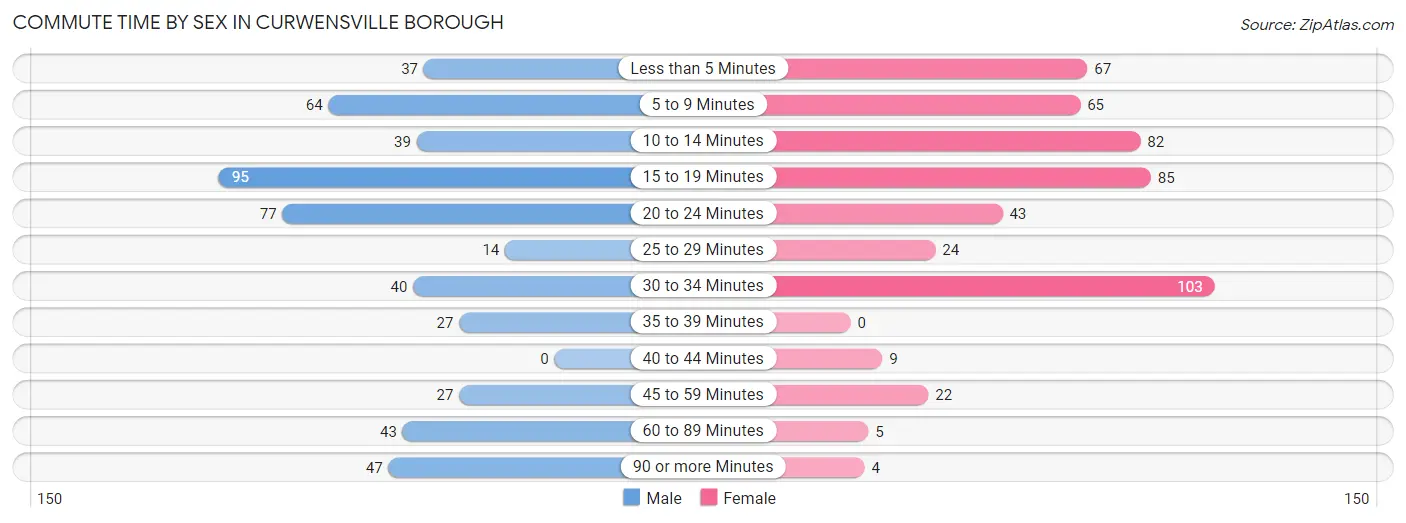
| Commute Time | Male | Female |
| Less than 5 Minutes | 37 (7.2%) | 67 (13.2%) |
| 5 to 9 Minutes | 64 (12.6%) | 65 (12.8%) |
| 10 to 14 Minutes | 39 (7.6%) | 82 (16.1%) |
| 15 to 19 Minutes | 95 (18.6%) | 85 (16.7%) |
| 20 to 24 Minutes | 77 (15.1%) | 43 (8.5%) |
| 25 to 29 Minutes | 14 (2.8%) | 24 (4.7%) |
| 30 to 34 Minutes | 40 (7.8%) | 103 (20.2%) |
| 35 to 39 Minutes | 27 (5.3%) | 0 (0.0%) |
| 40 to 44 Minutes | 0 (0.0%) | 9 (1.8%) |
| 45 to 59 Minutes | 27 (5.3%) | 22 (4.3%) |
| 60 to 89 Minutes | 43 (8.4%) | 5 (1.0%) |
| 90 or more Minutes | 47 (9.2%) | 4 (0.8%) |
Time of Departure to Work by Sex in Curwensville borough
The most frequent times of departure to work in Curwensville borough are 12:00 AM to 4:59 AM (105, 20.6%) for males and 7:30 AM to 7:59 AM (105, 20.6%) for females.
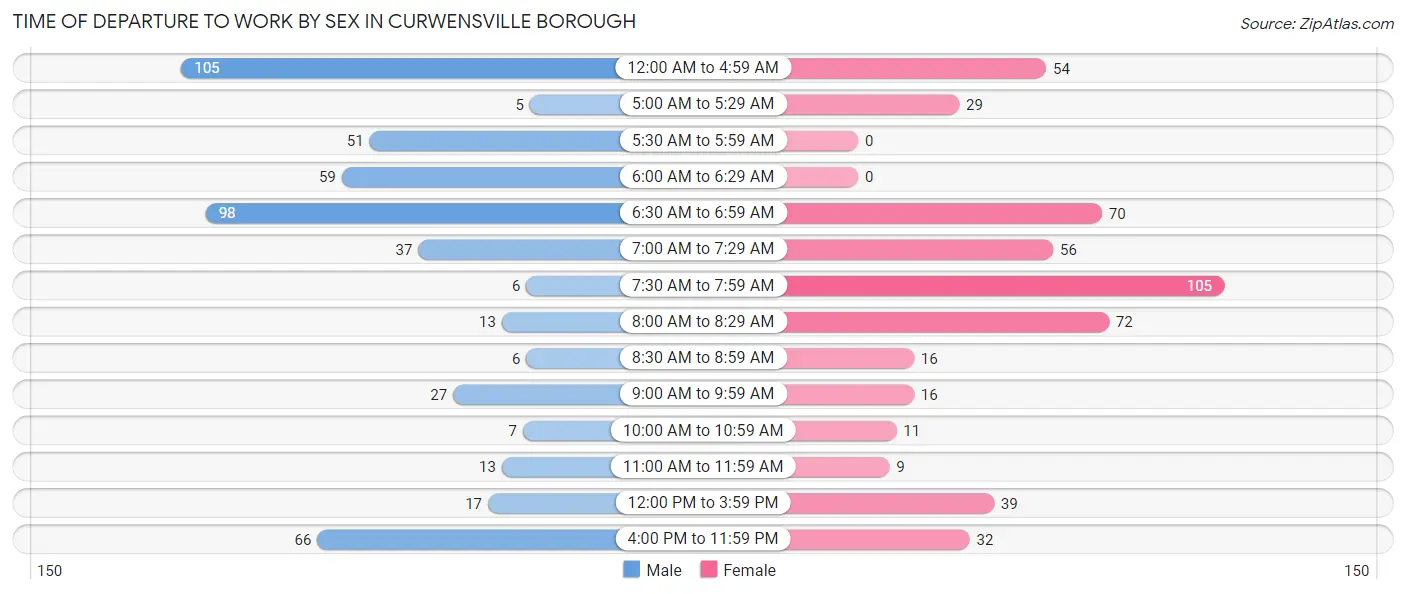
| Time of Departure | Male | Female |
| 12:00 AM to 4:59 AM | 105 (20.6%) | 54 (10.6%) |
| 5:00 AM to 5:29 AM | 5 (1.0%) | 29 (5.7%) |
| 5:30 AM to 5:59 AM | 51 (10.0%) | 0 (0.0%) |
| 6:00 AM to 6:29 AM | 59 (11.6%) | 0 (0.0%) |
| 6:30 AM to 6:59 AM | 98 (19.2%) | 70 (13.8%) |
| 7:00 AM to 7:29 AM | 37 (7.2%) | 56 (11.0%) |
| 7:30 AM to 7:59 AM | 6 (1.2%) | 105 (20.6%) |
| 8:00 AM to 8:29 AM | 13 (2.5%) | 72 (14.1%) |
| 8:30 AM to 8:59 AM | 6 (1.2%) | 16 (3.1%) |
| 9:00 AM to 9:59 AM | 27 (5.3%) | 16 (3.1%) |
| 10:00 AM to 10:59 AM | 7 (1.4%) | 11 (2.2%) |
| 11:00 AM to 11:59 AM | 13 (2.5%) | 9 (1.8%) |
| 12:00 PM to 3:59 PM | 17 (3.3%) | 39 (7.7%) |
| 4:00 PM to 11:59 PM | 66 (12.9%) | 32 (6.3%) |
| Total | 510 (100.0%) | 509 (100.0%) |
Housing Occupancy in Curwensville borough
Occupancy by Ownership in Curwensville borough
Of the total 1,079 dwellings in Curwensville borough, owner-occupied units account for 743 (68.9%), while renter-occupied units make up 336 (31.1%).
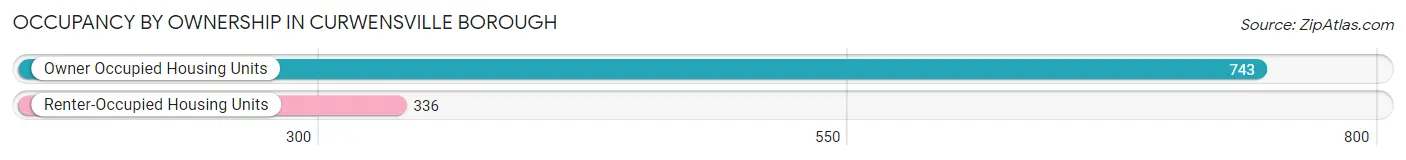
| Occupancy | # Housing Units | % Housing Units |
| Owner Occupied Housing Units | 743 | 68.9% |
| Renter-Occupied Housing Units | 336 | 31.1% |
| Total Occupied Housing Units | 1,079 | 100.0% |
Occupancy by Household Size in Curwensville borough
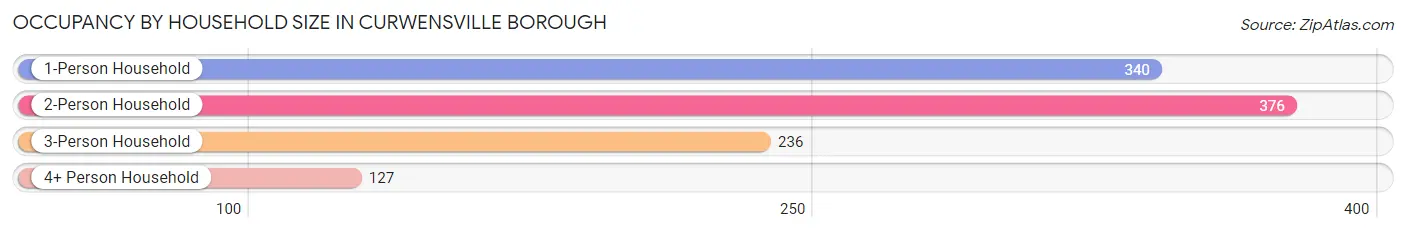
| Household Size | # Housing Units | % Housing Units |
| 1-Person Household | 340 | 31.5% |
| 2-Person Household | 376 | 34.8% |
| 3-Person Household | 236 | 21.9% |
| 4+ Person Household | 127 | 11.8% |
| Total Housing Units | 1,079 | 100.0% |
Occupancy by Ownership by Household Size in Curwensville borough
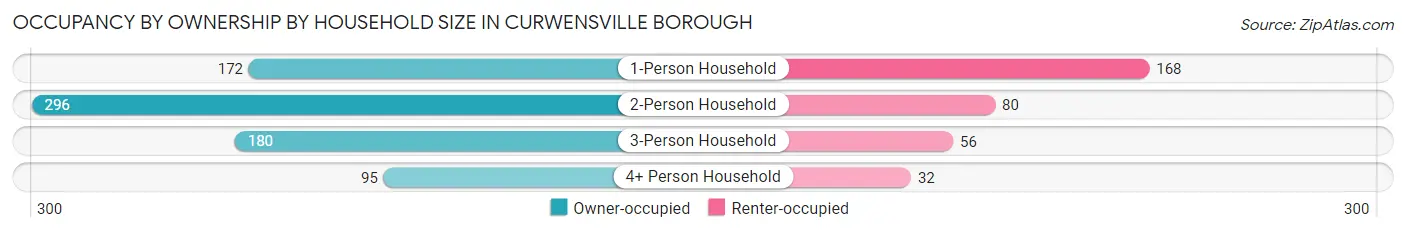
| Household Size | Owner-occupied | Renter-occupied |
| 1-Person Household | 172 (50.6%) | 168 (49.4%) |
| 2-Person Household | 296 (78.7%) | 80 (21.3%) |
| 3-Person Household | 180 (76.3%) | 56 (23.7%) |
| 4+ Person Household | 95 (74.8%) | 32 (25.2%) |
| Total Housing Units | 743 (68.9%) | 336 (31.1%) |
Occupancy by Educational Attainment in Curwensville borough
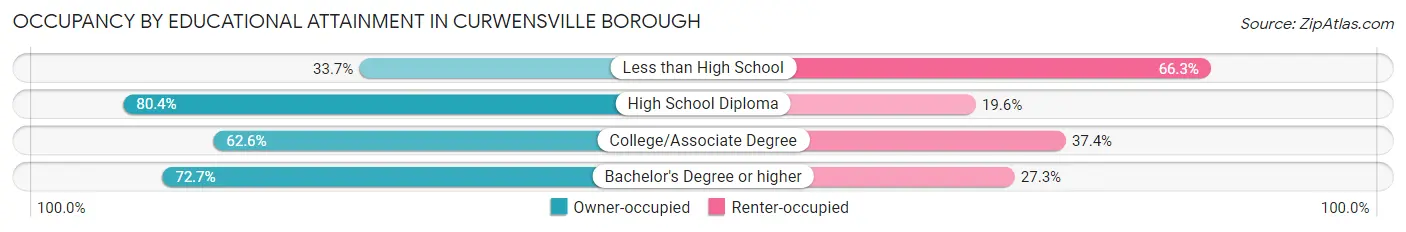
| Household Size | Owner-occupied | Renter-occupied |
| Less than High School | 32 (33.7%) | 63 (66.3%) |
| High School Diploma | 316 (80.4%) | 77 (19.6%) |
| College/Associate Degree | 214 (62.6%) | 128 (37.4%) |
| Bachelor's Degree or higher | 181 (72.7%) | 68 (27.3%) |
Occupancy by Age of Householder in Curwensville borough
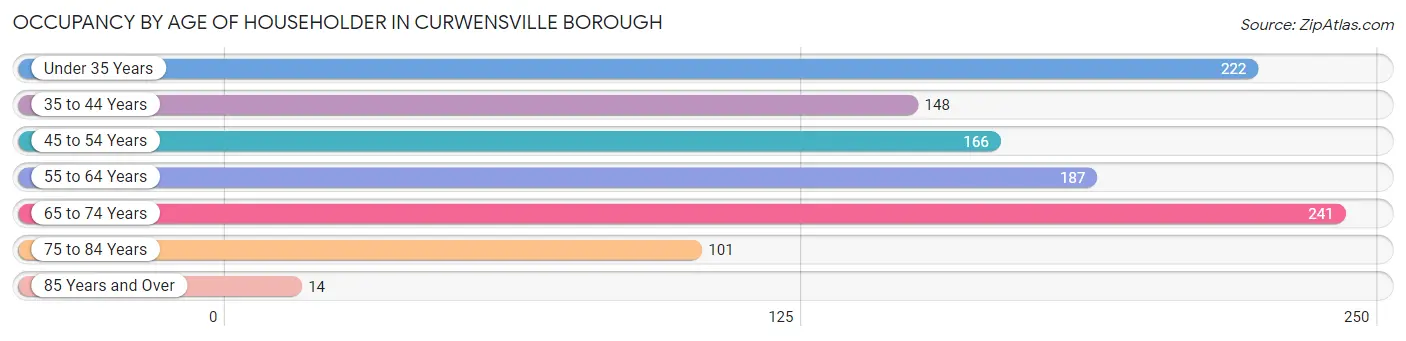
| Age Bracket | # Households | % Households |
| Under 35 Years | 222 | 20.6% |
| 35 to 44 Years | 148 | 13.7% |
| 45 to 54 Years | 166 | 15.4% |
| 55 to 64 Years | 187 | 17.3% |
| 65 to 74 Years | 241 | 22.3% |
| 75 to 84 Years | 101 | 9.4% |
| 85 Years and Over | 14 | 1.3% |
| Total | 1,079 | 100.0% |
Housing Finances in Curwensville borough
Median Income by Occupancy in Curwensville borough
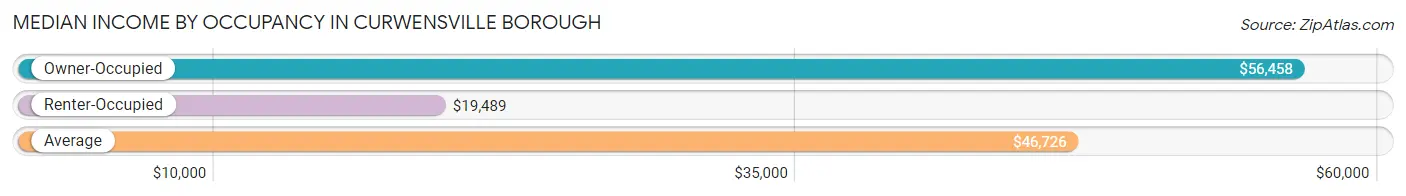
| Occupancy Type | # Households | Median Income |
| Owner-Occupied | 743 (68.9%) | $56,458 |
| Renter-Occupied | 336 (31.1%) | $19,489 |
| Average | 1,079 (100.0%) | $46,726 |
Occupancy by Householder Income Bracket in Curwensville borough
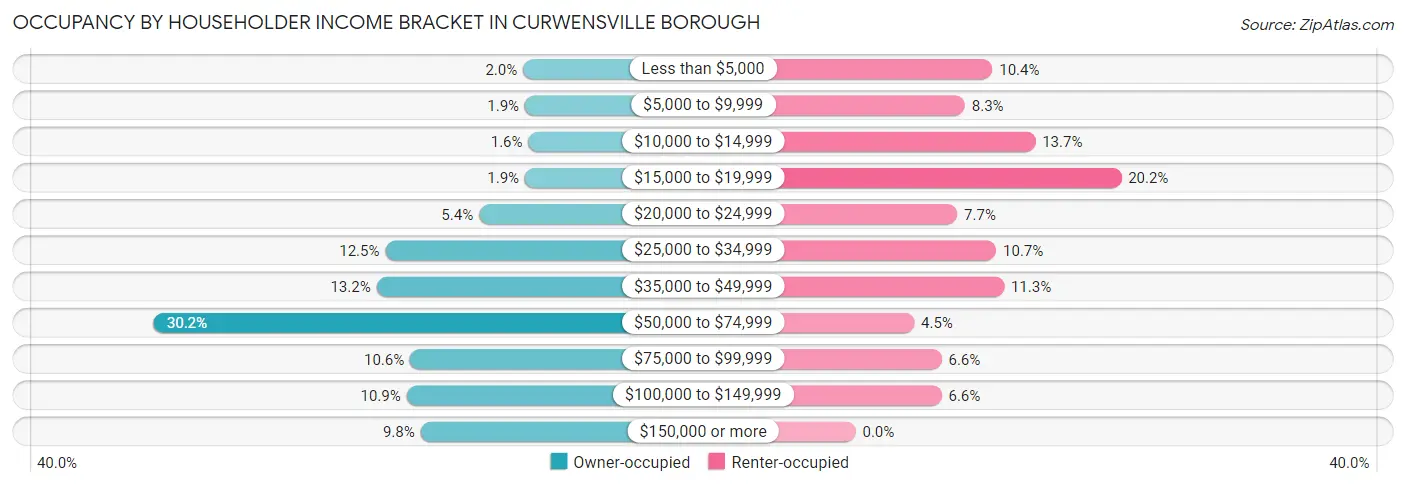
| Income Bracket | Owner-occupied | Renter-occupied |
| Less than $5,000 | 15 (2.0%) | 35 (10.4%) |
| $5,000 to $9,999 | 14 (1.9%) | 28 (8.3%) |
| $10,000 to $14,999 | 12 (1.6%) | 46 (13.7%) |
| $15,000 to $19,999 | 14 (1.9%) | 68 (20.2%) |
| $20,000 to $24,999 | 40 (5.4%) | 26 (7.7%) |
| $25,000 to $34,999 | 93 (12.5%) | 36 (10.7%) |
| $35,000 to $49,999 | 98 (13.2%) | 38 (11.3%) |
| $50,000 to $74,999 | 224 (30.1%) | 15 (4.5%) |
| $75,000 to $99,999 | 79 (10.6%) | 22 (6.6%) |
| $100,000 to $149,999 | 81 (10.9%) | 22 (6.6%) |
| $150,000 or more | 73 (9.8%) | 0 (0.0%) |
| Total | 743 (100.0%) | 336 (100.0%) |
Monthly Housing Cost Tiers in Curwensville borough
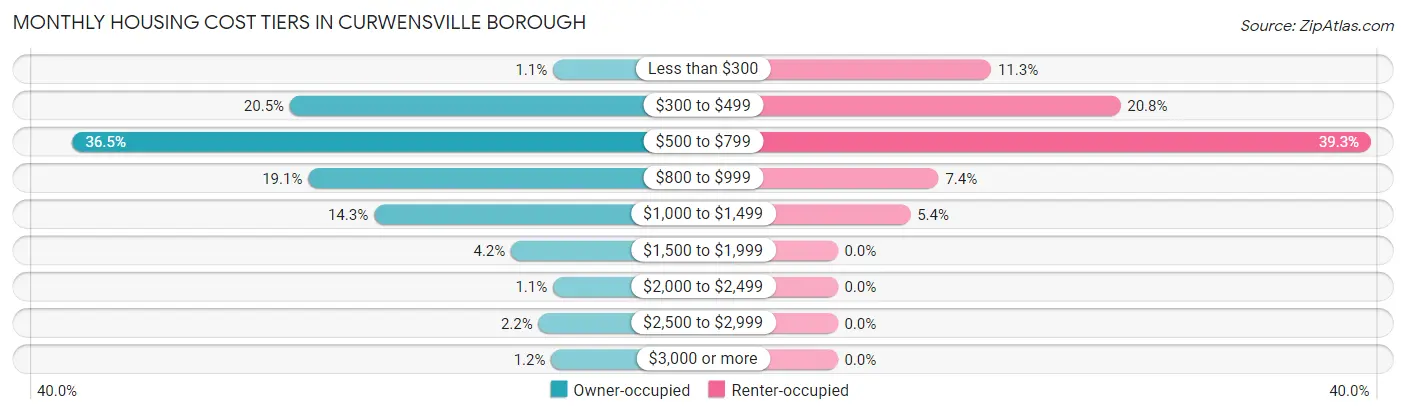
| Monthly Cost | Owner-occupied | Renter-occupied |
| Less than $300 | 8 (1.1%) | 38 (11.3%) |
| $300 to $499 | 152 (20.5%) | 70 (20.8%) |
| $500 to $799 | 271 (36.5%) | 132 (39.3%) |
| $800 to $999 | 142 (19.1%) | 25 (7.4%) |
| $1,000 to $1,499 | 106 (14.3%) | 18 (5.4%) |
| $1,500 to $1,999 | 31 (4.2%) | 0 (0.0%) |
| $2,000 to $2,499 | 8 (1.1%) | 0 (0.0%) |
| $2,500 to $2,999 | 16 (2.1%) | 0 (0.0%) |
| $3,000 or more | 9 (1.2%) | 0 (0.0%) |
| Total | 743 (100.0%) | 336 (100.0%) |
Physical Housing Characteristics in Curwensville borough
Housing Structures in Curwensville borough
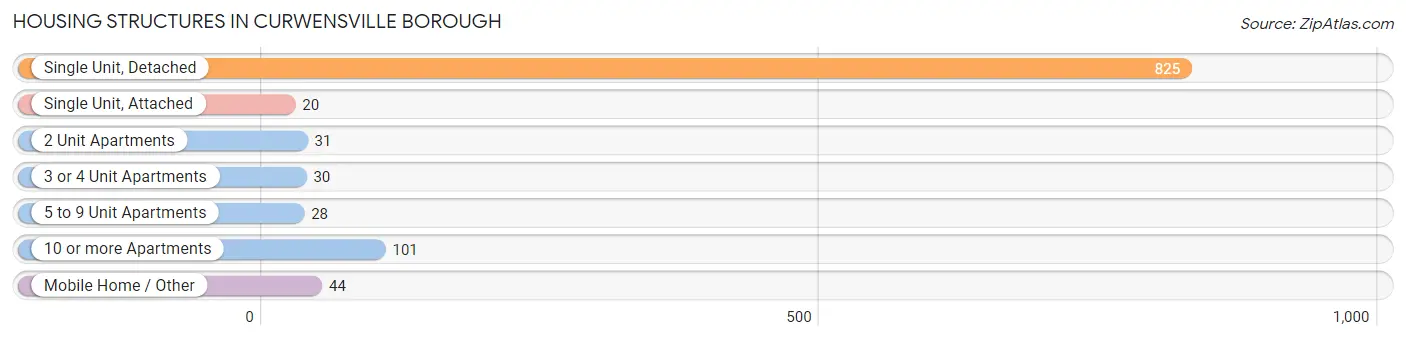
| Structure Type | # Housing Units | % Housing Units |
| Single Unit, Detached | 825 | 76.5% |
| Single Unit, Attached | 20 | 1.8% |
| 2 Unit Apartments | 31 | 2.9% |
| 3 or 4 Unit Apartments | 30 | 2.8% |
| 5 to 9 Unit Apartments | 28 | 2.6% |
| 10 or more Apartments | 101 | 9.4% |
| Mobile Home / Other | 44 | 4.1% |
| Total | 1,079 | 100.0% |
Housing Structures by Occupancy in Curwensville borough
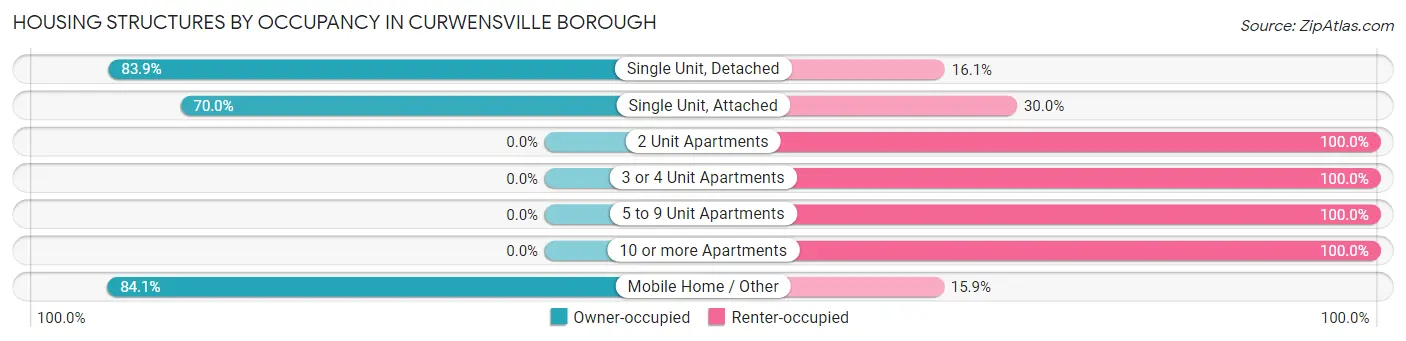
| Structure Type | Owner-occupied | Renter-occupied |
| Single Unit, Detached | 692 (83.9%) | 133 (16.1%) |
| Single Unit, Attached | 14 (70.0%) | 6 (30.0%) |
| 2 Unit Apartments | 0 (0.0%) | 31 (100.0%) |
| 3 or 4 Unit Apartments | 0 (0.0%) | 30 (100.0%) |
| 5 to 9 Unit Apartments | 0 (0.0%) | 28 (100.0%) |
| 10 or more Apartments | 0 (0.0%) | 101 (100.0%) |
| Mobile Home / Other | 37 (84.1%) | 7 (15.9%) |
| Total | 743 (68.9%) | 336 (31.1%) |
Housing Structures by Number of Rooms in Curwensville borough
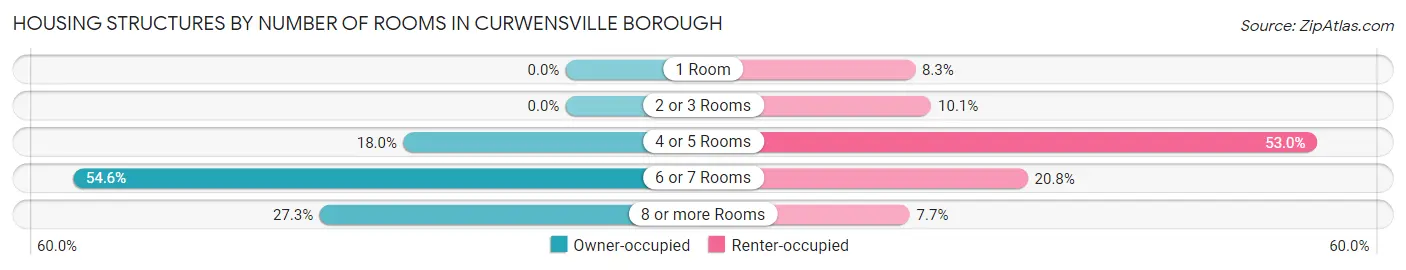
| Number of Rooms | Owner-occupied | Renter-occupied |
| 1 Room | 0 (0.0%) | 28 (8.3%) |
| 2 or 3 Rooms | 0 (0.0%) | 34 (10.1%) |
| 4 or 5 Rooms | 134 (18.0%) | 178 (53.0%) |
| 6 or 7 Rooms | 406 (54.6%) | 70 (20.8%) |
| 8 or more Rooms | 203 (27.3%) | 26 (7.7%) |
| Total | 743 (100.0%) | 336 (100.0%) |
Housing Structure by Heating Type in Curwensville borough
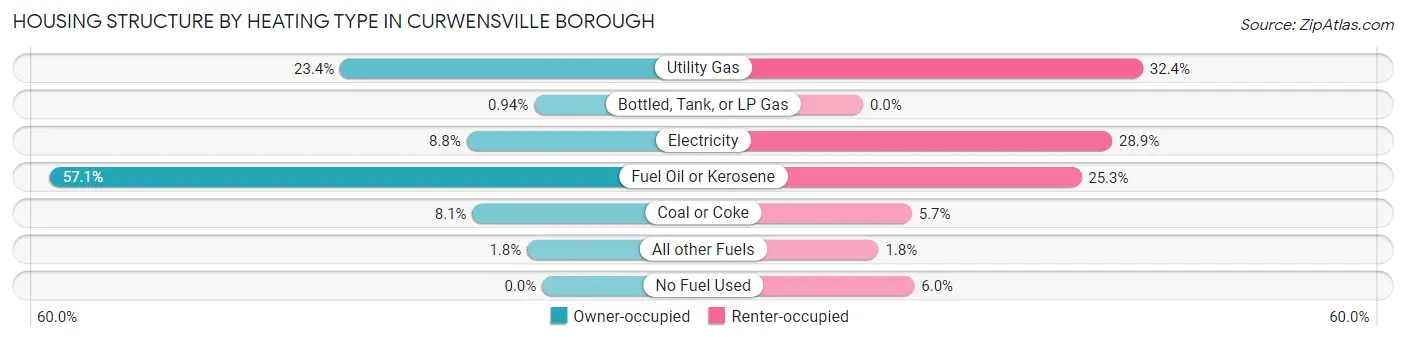
| Heating Type | Owner-occupied | Renter-occupied |
| Utility Gas | 174 (23.4%) | 109 (32.4%) |
| Bottled, Tank, or LP Gas | 7 (0.9%) | 0 (0.0%) |
| Electricity | 65 (8.7%) | 97 (28.9%) |
| Fuel Oil or Kerosene | 424 (57.1%) | 85 (25.3%) |
| Coal or Coke | 60 (8.1%) | 19 (5.7%) |
| All other Fuels | 13 (1.8%) | 6 (1.8%) |
| No Fuel Used | 0 (0.0%) | 20 (5.9%) |
| Total | 743 (100.0%) | 336 (100.0%) |
Household Vehicle Usage in Curwensville borough
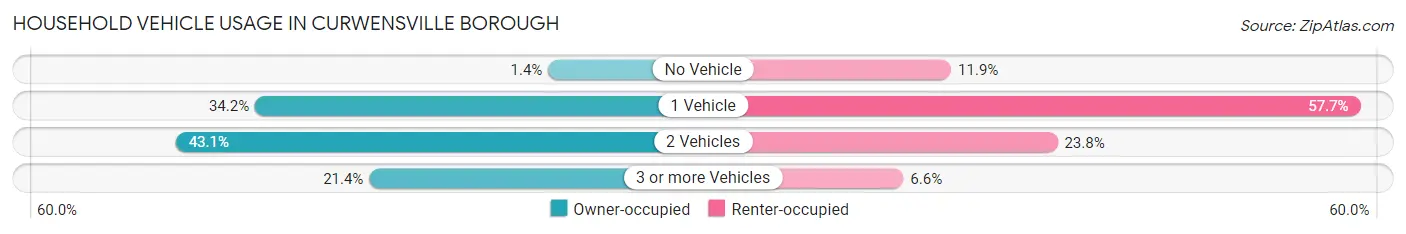
| Vehicles per Household | Owner-occupied | Renter-occupied |
| No Vehicle | 10 (1.3%) | 40 (11.9%) |
| 1 Vehicle | 254 (34.2%) | 194 (57.7%) |
| 2 Vehicles | 320 (43.1%) | 80 (23.8%) |
| 3 or more Vehicles | 159 (21.4%) | 22 (6.6%) |
| Total | 743 (100.0%) | 336 (100.0%) |
Real Estate & Mortgages in Curwensville borough
Real Estate and Mortgage Overview in Curwensville borough
| Characteristic | Without Mortgage | With Mortgage |
| Housing Units | 388 | 355 |
| Median Property Value | $107,500 | $94,000 |
| Median Household Income | $52,500 | $52 |
| Monthly Housing Costs | $564 | $0 |
| Real Estate Taxes | $1,380 | $0 |
Property Value by Mortgage Status in Curwensville borough
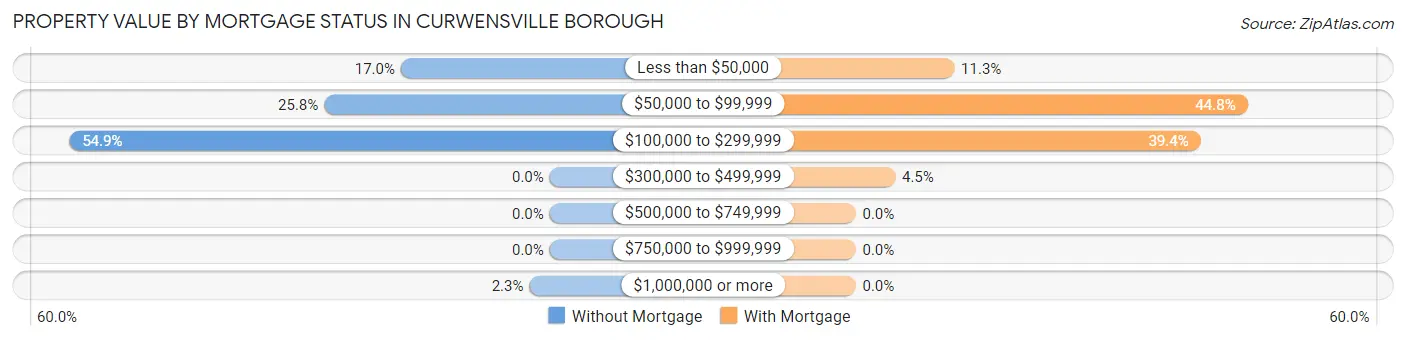
| Property Value | Without Mortgage | With Mortgage |
| Less than $50,000 | 66 (17.0%) | 40 (11.3%) |
| $50,000 to $99,999 | 100 (25.8%) | 159 (44.8%) |
| $100,000 to $299,999 | 213 (54.9%) | 140 (39.4%) |
| $300,000 to $499,999 | 0 (0.0%) | 16 (4.5%) |
| $500,000 to $749,999 | 0 (0.0%) | 0 (0.0%) |
| $750,000 to $999,999 | 0 (0.0%) | 0 (0.0%) |
| $1,000,000 or more | 9 (2.3%) | 0 (0.0%) |
| Total | 388 (100.0%) | 355 (100.0%) |
Household Income by Mortgage Status in Curwensville borough
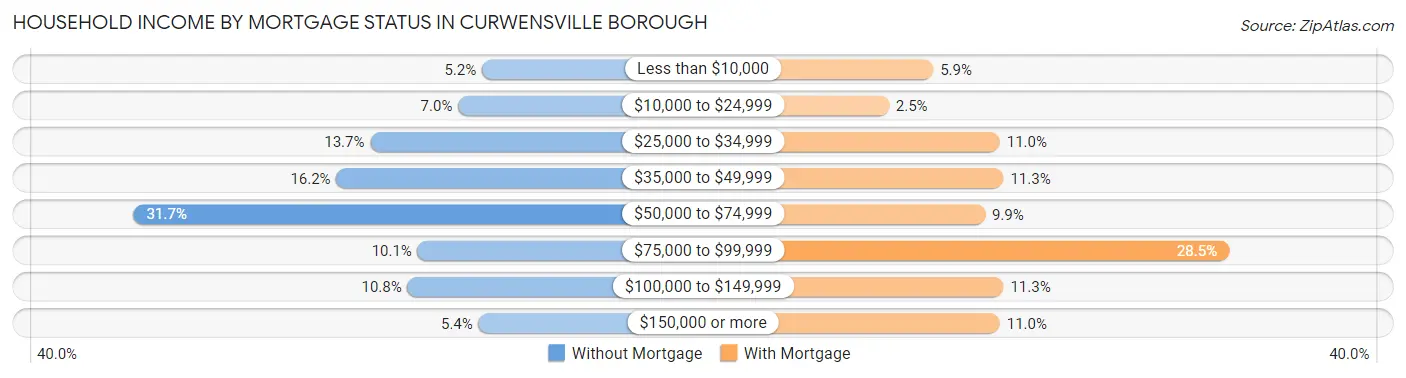
| Household Income | Without Mortgage | With Mortgage |
| Less than $10,000 | 20 (5.1%) | 21 (5.9%) |
| $10,000 to $24,999 | 27 (7.0%) | 9 (2.5%) |
| $25,000 to $34,999 | 53 (13.7%) | 39 (11.0%) |
| $35,000 to $49,999 | 63 (16.2%) | 40 (11.3%) |
| $50,000 to $74,999 | 123 (31.7%) | 35 (9.9%) |
| $75,000 to $99,999 | 39 (10.1%) | 101 (28.4%) |
| $100,000 to $149,999 | 42 (10.8%) | 40 (11.3%) |
| $150,000 or more | 21 (5.4%) | 39 (11.0%) |
| Total | 388 (100.0%) | 355 (100.0%) |
Property Value to Household Income Ratio in Curwensville borough
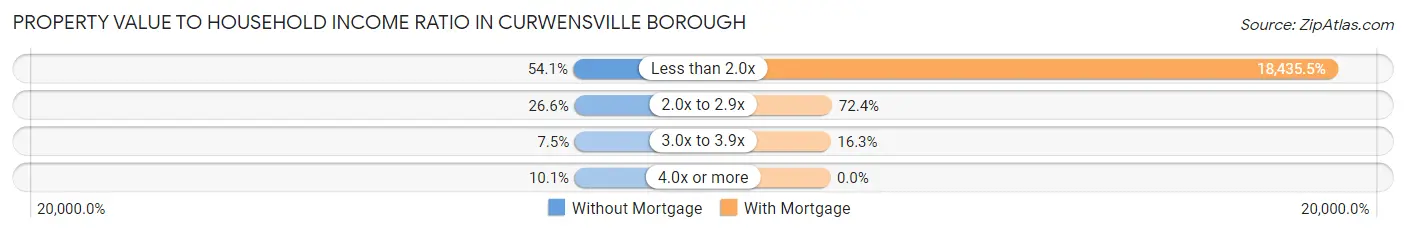
| Value-to-Income Ratio | Without Mortgage | With Mortgage |
| Less than 2.0x | 210 (54.1%) | 65,446 (18,435.5%) |
| 2.0x to 2.9x | 103 (26.6%) | 257 (72.4%) |
| 3.0x to 3.9x | 29 (7.5%) | 58 (16.3%) |
| 4.0x or more | 39 (10.1%) | 0 (0.0%) |
| Total | 388 (100.0%) | 355 (100.0%) |
Real Estate Taxes by Mortgage Status in Curwensville borough
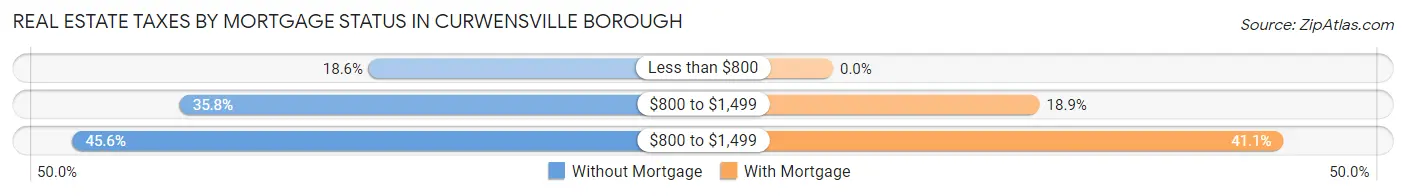
| Property Taxes | Without Mortgage | With Mortgage |
| Less than $800 | 72 (18.6%) | 0 (0.0%) |
| $800 to $1,499 | 139 (35.8%) | 67 (18.9%) |
| $800 to $1,499 | 177 (45.6%) | 146 (41.1%) |
| Total | 388 (100.0%) | 355 (100.0%) |
Health & Disability in Curwensville borough
Health Insurance Coverage by Age in Curwensville borough
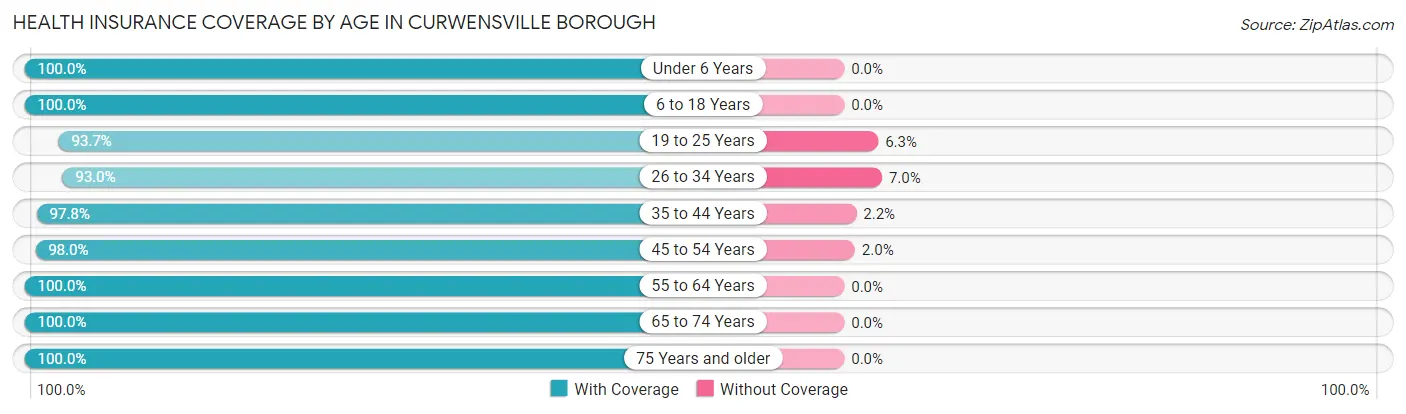
| Age Bracket | With Coverage | Without Coverage |
| Under 6 Years | 209 (100.0%) | 0 (0.0%) |
| 6 to 18 Years | 396 (100.0%) | 0 (0.0%) |
| 19 to 25 Years | 163 (93.7%) | 11 (6.3%) |
| 26 to 34 Years | 304 (93.0%) | 23 (7.0%) |
| 35 to 44 Years | 306 (97.8%) | 7 (2.2%) |
| 45 to 54 Years | 248 (98.0%) | 5 (2.0%) |
| 55 to 64 Years | 318 (100.0%) | 0 (0.0%) |
| 65 to 74 Years | 312 (100.0%) | 0 (0.0%) |
| 75 Years and older | 154 (100.0%) | 0 (0.0%) |
| Total | 2,410 (98.1%) | 46 (1.9%) |
Health Insurance Coverage by Citizenship Status in Curwensville borough
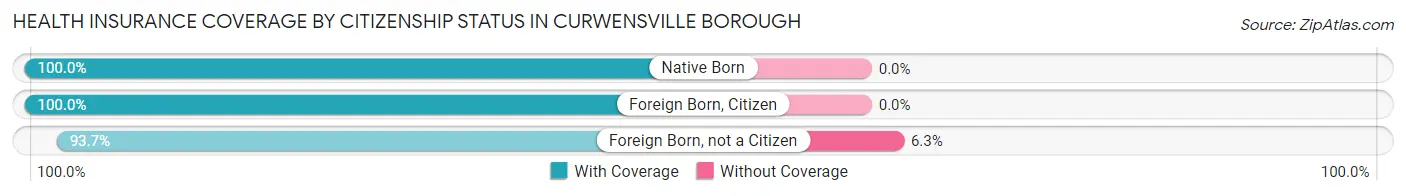
| Citizenship Status | With Coverage | Without Coverage |
| Native Born | 209 (100.0%) | 0 (0.0%) |
| Foreign Born, Citizen | 396 (100.0%) | 0 (0.0%) |
| Foreign Born, not a Citizen | 163 (93.7%) | 11 (6.3%) |
Health Insurance Coverage by Household Income in Curwensville borough
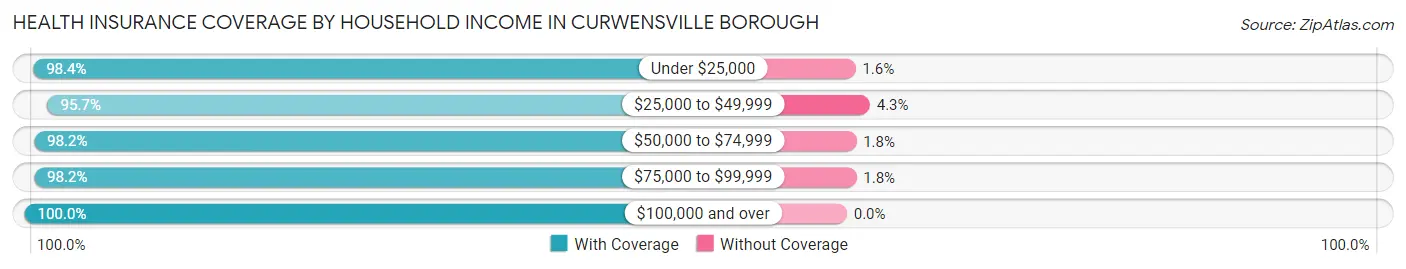
| Household Income | With Coverage | Without Coverage |
| Under $25,000 | 486 (98.4%) | 8 (1.6%) |
| $25,000 to $49,999 | 489 (95.7%) | 22 (4.3%) |
| $50,000 to $74,999 | 609 (98.2%) | 11 (1.8%) |
| $75,000 to $99,999 | 274 (98.2%) | 5 (1.8%) |
| $100,000 and over | 552 (100.0%) | 0 (0.0%) |
Public vs Private Health Insurance Coverage by Age in Curwensville borough
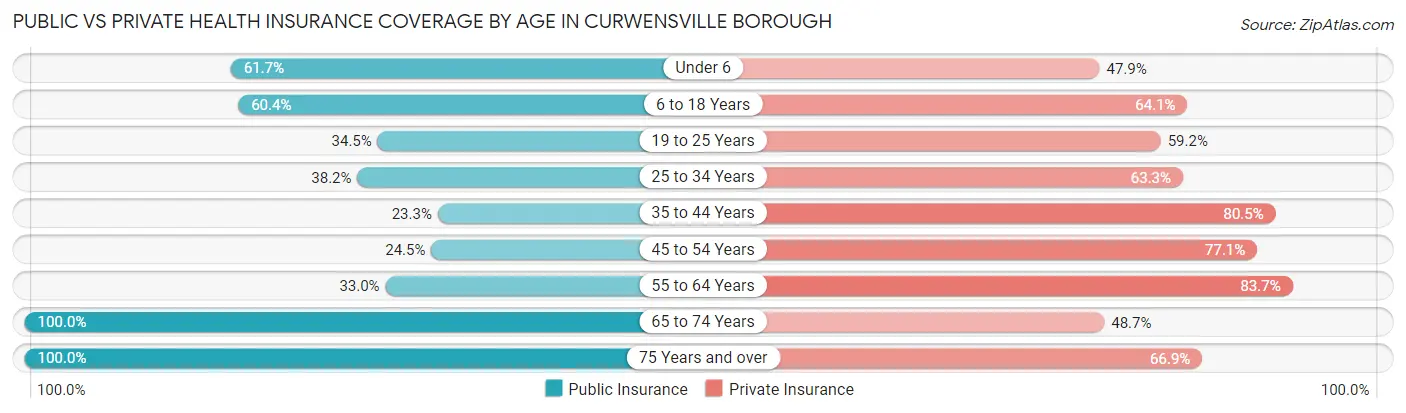
| Age Bracket | Public Insurance | Private Insurance |
| Under 6 | 129 (61.7%) | 100 (47.8%) |
| 6 to 18 Years | 239 (60.4%) | 254 (64.1%) |
| 19 to 25 Years | 60 (34.5%) | 103 (59.2%) |
| 25 to 34 Years | 125 (38.2%) | 207 (63.3%) |
| 35 to 44 Years | 73 (23.3%) | 252 (80.5%) |
| 45 to 54 Years | 62 (24.5%) | 195 (77.1%) |
| 55 to 64 Years | 105 (33.0%) | 266 (83.7%) |
| 65 to 74 Years | 312 (100.0%) | 152 (48.7%) |
| 75 Years and over | 154 (100.0%) | 103 (66.9%) |
| Total | 1,259 (51.3%) | 1,632 (66.4%) |
Disability Status by Sex by Age in Curwensville borough
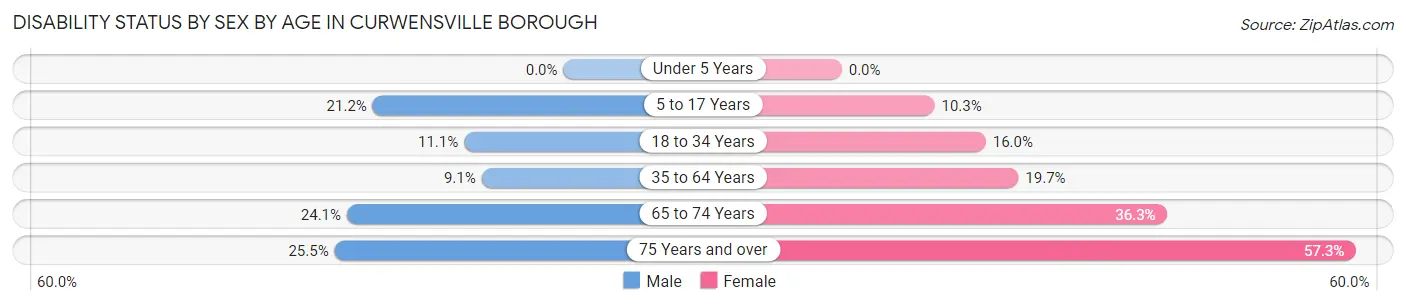
| Age Bracket | Male | Female |
| Under 5 Years | 0 (0.0%) | 0 (0.0%) |
| 5 to 17 Years | 41 (21.2%) | 22 (10.3%) |
| 18 to 34 Years | 26 (11.1%) | 47 (16.0%) |
| 35 to 64 Years | 37 (9.1%) | 94 (19.7%) |
| 65 to 74 Years | 34 (24.1%) | 62 (36.3%) |
| 75 Years and over | 13 (25.5%) | 59 (57.3%) |
Disability Class by Sex by Age in Curwensville borough
Disability Class: Hearing Difficulty
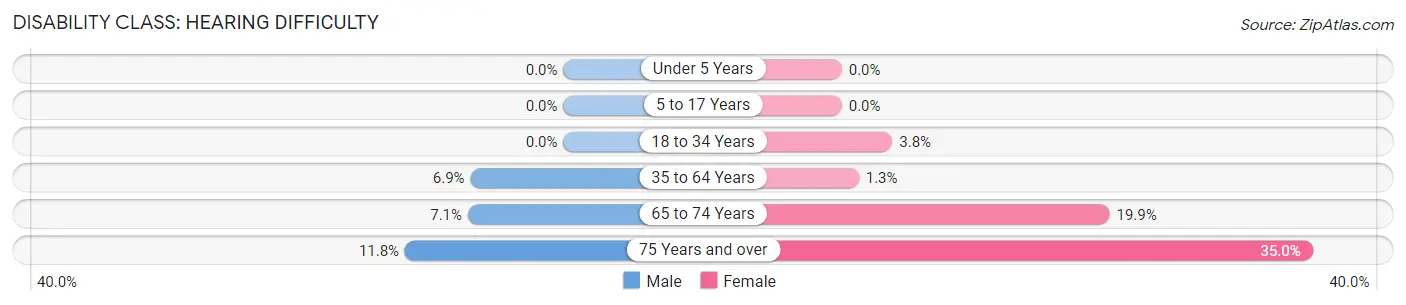
| Age Bracket | Male | Female |
| Under 5 Years | 0 (0.0%) | 0 (0.0%) |
| 5 to 17 Years | 0 (0.0%) | 0 (0.0%) |
| 18 to 34 Years | 0 (0.0%) | 11 (3.7%) |
| 35 to 64 Years | 28 (6.9%) | 6 (1.3%) |
| 65 to 74 Years | 10 (7.1%) | 34 (19.9%) |
| 75 Years and over | 6 (11.8%) | 36 (34.9%) |
Disability Class: Vision Difficulty
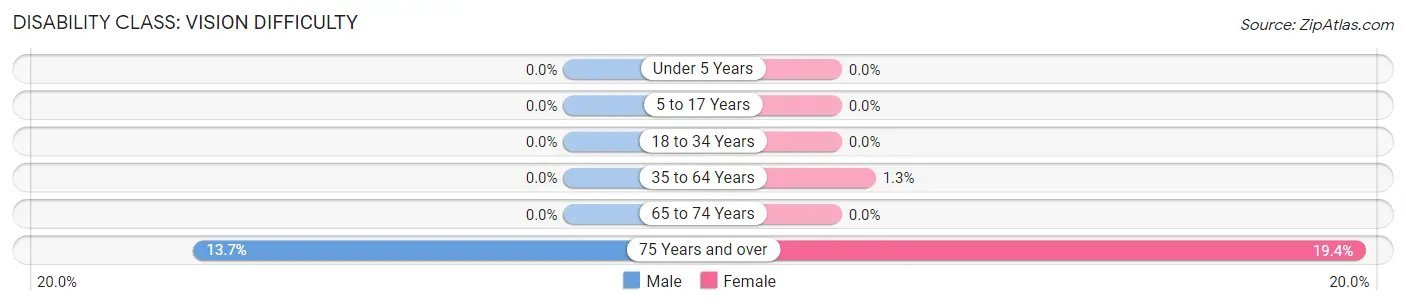
| Age Bracket | Male | Female |
| Under 5 Years | 0 (0.0%) | 0 (0.0%) |
| 5 to 17 Years | 0 (0.0%) | 0 (0.0%) |
| 18 to 34 Years | 0 (0.0%) | 0 (0.0%) |
| 35 to 64 Years | 0 (0.0%) | 6 (1.3%) |
| 65 to 74 Years | 0 (0.0%) | 0 (0.0%) |
| 75 Years and over | 7 (13.7%) | 20 (19.4%) |
Disability Class: Cognitive Difficulty
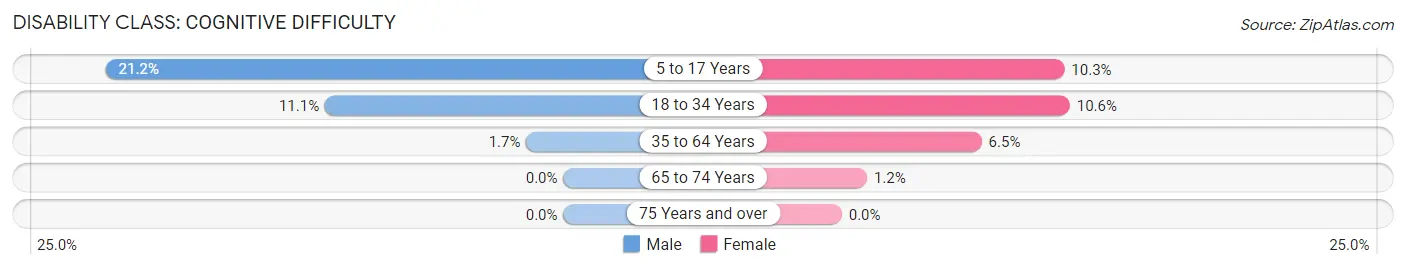
| Age Bracket | Male | Female |
| 5 to 17 Years | 41 (21.2%) | 22 (10.3%) |
| 18 to 34 Years | 26 (11.1%) | 31 (10.6%) |
| 35 to 64 Years | 7 (1.7%) | 31 (6.5%) |
| 65 to 74 Years | 0 (0.0%) | 2 (1.2%) |
| 75 Years and over | 0 (0.0%) | 0 (0.0%) |
Disability Class: Ambulatory Difficulty
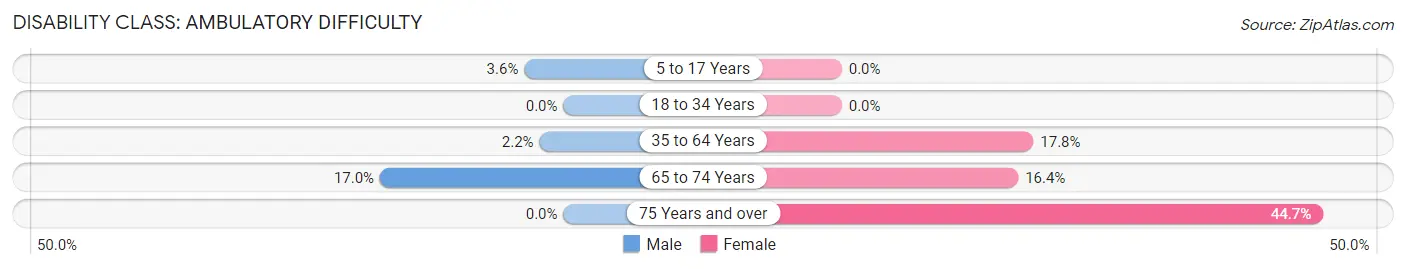
| Age Bracket | Male | Female |
| 5 to 17 Years | 7 (3.6%) | 0 (0.0%) |
| 18 to 34 Years | 0 (0.0%) | 0 (0.0%) |
| 35 to 64 Years | 9 (2.2%) | 85 (17.8%) |
| 65 to 74 Years | 24 (17.0%) | 28 (16.4%) |
| 75 Years and over | 0 (0.0%) | 46 (44.7%) |
Disability Class: Self-Care Difficulty
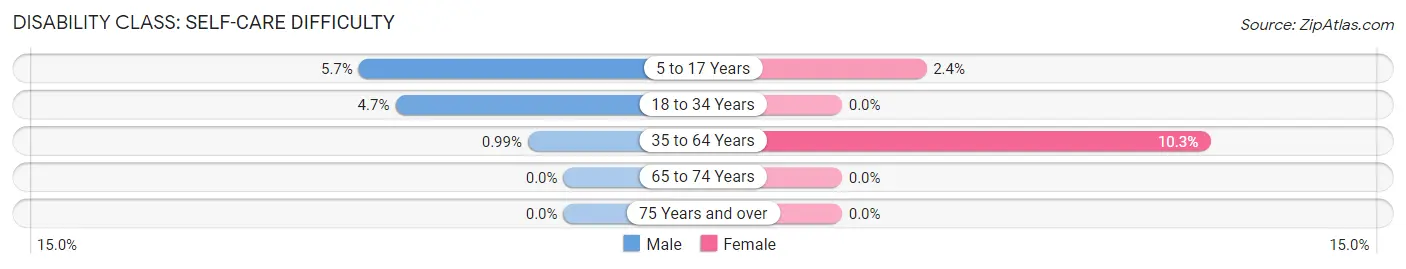
| Age Bracket | Male | Female |
| 5 to 17 Years | 11 (5.7%) | 5 (2.4%) |
| 18 to 34 Years | 11 (4.7%) | 0 (0.0%) |
| 35 to 64 Years | 4 (1.0%) | 49 (10.2%) |
| 65 to 74 Years | 0 (0.0%) | 0 (0.0%) |
| 75 Years and over | 0 (0.0%) | 0 (0.0%) |
Technology Access in Curwensville borough
Computing Device Access in Curwensville borough
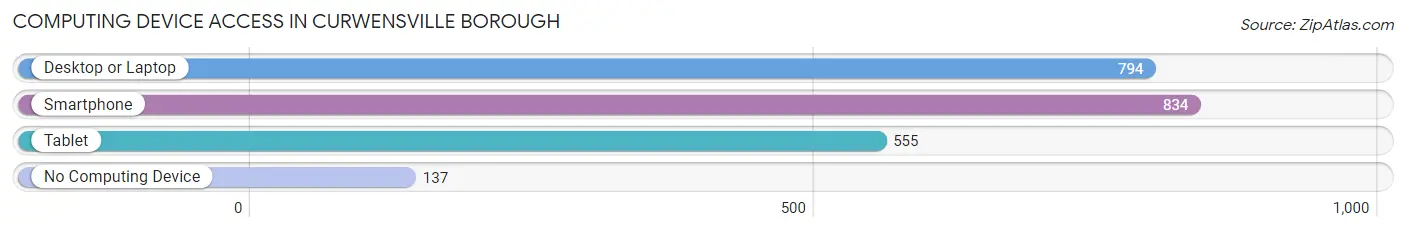
| Device Type | # Households | % Households |
| Desktop or Laptop | 794 | 73.6% |
| Smartphone | 834 | 77.3% |
| Tablet | 555 | 51.4% |
| No Computing Device | 137 | 12.7% |
| Total | 1,079 | 100.0% |
Internet Access in Curwensville borough
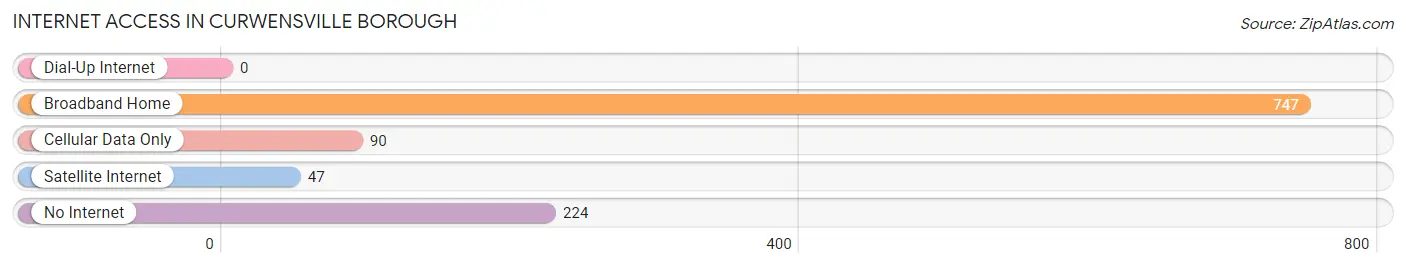
| Internet Type | # Households | % Households |
| Dial-Up Internet | 0 | 0.0% |
| Broadband Home | 747 | 69.2% |
| Cellular Data Only | 90 | 8.3% |
| Satellite Internet | 47 | 4.4% |
| No Internet | 224 | 20.8% |
| Total | 1,079 | 100.0% |
Curwensville borough Summary
Curwensville Borough is a small borough located in Clearfield County, Pennsylvania. It is situated in the western part of the state, approximately 70 miles northeast of Pittsburgh. The borough is bordered by the townships of Pike, Greenwood, and Penn. As of the 2010 census, the population of Curwensville was 2,719.
History
The area that is now Curwensville was first settled in the late 1700s by a group of Scots-Irish immigrants. The town was originally known as “Curwen’s Town” after the family of William Curwen, who was one of the first settlers. The town was officially incorporated as a borough in 1851.
In the late 1800s, Curwensville was a thriving industrial center. The town was home to several coal mines, a tannery, a sawmill, and a brickyard. The town also had a thriving lumber industry, which was centered around the Curwensville Lumber Company.
In the early 1900s, Curwensville experienced a period of growth and prosperity. The town was home to several banks, a movie theater, and a variety of stores and businesses. The town also had a thriving tourism industry, with many visitors coming to the area to enjoy the nearby lakes and rivers.
Geography
Curwensville is located in western Pennsylvania, approximately 70 miles northeast of Pittsburgh. The borough is situated in the foothills of the Allegheny Mountains, and is bordered by the townships of Pike, Greenwood, and Penn. The borough is situated along the West Branch Susquehanna River, and is home to several small lakes and streams.
The borough has a total area of 1.2 square miles, all of which is land. The borough has a humid continental climate, with cold winters and hot, humid summers.
Economy
The economy of Curwensville is largely based on agriculture and tourism. The borough is home to several farms, which produce a variety of crops, including corn, soybeans, and hay. The borough is also home to several tourist attractions, including the Curwensville Lake and the West Branch Susquehanna River.
The borough is also home to several small businesses, including restaurants, retail stores, and service providers. The borough is also home to several manufacturing companies, including a plastics manufacturer and a metal fabrication company.
Demographics
As of the 2010 census, the population of Curwensville was 2,719. The racial makeup of the borough was 97.3% White, 0.7% African American, 0.2% Native American, 0.3% Asian, 0.1% Pacific Islander, 0.3% from other races, and 1.2% from two or more races. Hispanic or Latino of any race were 1.2% of the population.
The median household income in Curwensville was $37,917, and the median family income was $45,938. The per capita income for the borough was $18,945. About 11.2% of families and 14.2% of the population were below the poverty line, including 19.2% of those under age 18 and 8.2% of those age 65 or over.
Common Questions
What is Per Capita Income in Curwensville borough?
Per Capita income in Curwensville borough is $25,860.
What is the Median Family Income in Curwensville borough?
Median Family Income in Curwensville borough is $57,926.
What is the Median Household income in Curwensville borough?
Median Household Income in Curwensville borough is $46,726.
What is Income or Wage Gap in Curwensville borough?
Income or Wage Gap in Curwensville borough is 30.0%.
Women in Curwensville borough earn 70.0 cents for every dollar earned by a man.
What is Inequality or Gini Index in Curwensville borough?
Inequality or Gini Index in Curwensville borough is 0.43.
What is the Total Population of Curwensville borough?
Total Population of Curwensville borough is 2,559.
What is the Total Male Population of Curwensville borough?
Total Male Population of Curwensville borough is 1,129.
What is the Total Female Population of Curwensville borough?
Total Female Population of Curwensville borough is 1,430.
What is the Ratio of Males per 100 Females in Curwensville borough?
There are 78.95 Males per 100 Females in Curwensville borough.
What is the Ratio of Females per 100 Males in Curwensville borough?
There are 126.66 Females per 100 Males in Curwensville borough.
What is the Median Population Age in Curwensville borough?
Median Population Age in Curwensville borough is 38.9 Years.
What is the Average Family Size in Curwensville borough
Average Family Size in Curwensville borough is 2.9 People.
What is the Average Household Size in Curwensville borough
Average Household Size in Curwensville borough is 2.3 People.
How Large is the Labor Force in Curwensville borough?
There are 1,204 People in the Labor Forcein in Curwensville borough.
What is the Percentage of People in the Labor Force in Curwensville borough?
60.3% of People are in the Labor Force in Curwensville borough.
What is the Unemployment Rate in Curwensville borough?
Unemployment Rate in Curwensville borough is 9.0%.