New Eagle borough, PA Map & Demographics
New Eagle borough Overview
$31,790
PER CAPITA INCOME
$67,727
AVG FAMILY INCOME
$50,158
AVG HOUSEHOLD INCOME
35.4%
WAGE / INCOME GAP [ % ]
64.6¢/ $1
WAGE / INCOME GAP [ $ ]
0.45
INEQUALITY / GINI INDEX
2,164
TOTAL POPULATION
1,130
MALE POPULATION
1,034
FEMALE POPULATION
109.28
MALES / 100 FEMALES
91.50
FEMALES / 100 MALES
48.9
MEDIAN AGE
2.7
AVG FAMILY SIZE
2.0
AVG HOUSEHOLD SIZE
1,005
LABOR FORCE [ PEOPLE ]
54.1%
PERCENT IN LABOR FORCE
14.1%
UNEMPLOYMENT RATE
Income in New Eagle borough
Income Overview in New Eagle borough
Per Capita Income in New Eagle borough is $31,790, while median incomes of families and households are $67,727 and $50,158 respectively.
| Characteristic | Number | Measure |
| Per Capita Income | 2,164 | $31,790 |
| Median Family Income | 624 | $67,727 |
| Mean Family Income | 624 | $82,194 |
| Median Household Income | 1,053 | $50,158 |
| Mean Household Income | 1,053 | $65,159 |
| Income Deficit | 624 | $0 |
| Wage / Income Gap (%) | 2,164 | 35.44% |
| Wage / Income Gap ($) | 2,164 | 64.56¢ per $1 |
| Gini / Inequality Index | 2,164 | 0.45 |
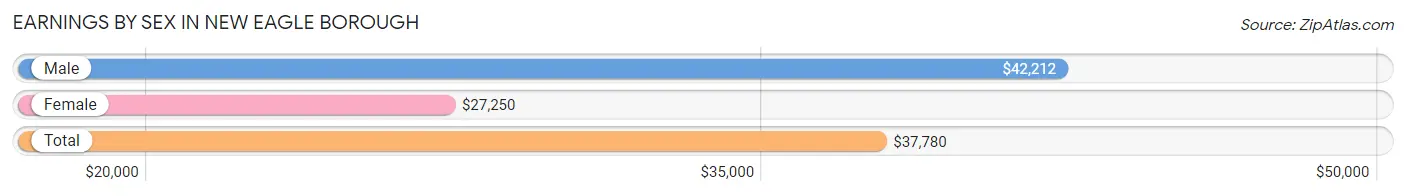
Earnings by Sex in New Eagle borough
Average Earnings in New Eagle borough are $37,780, $42,212 for men and $27,250 for women, a difference of 35.4%.
| Sex | Number | Average Earnings |
| Male | 539 (51.7%) | $42,212 |
| Female | 504 (48.3%) | $27,250 |
| Total | 1,043 (100.0%) | $37,780 |
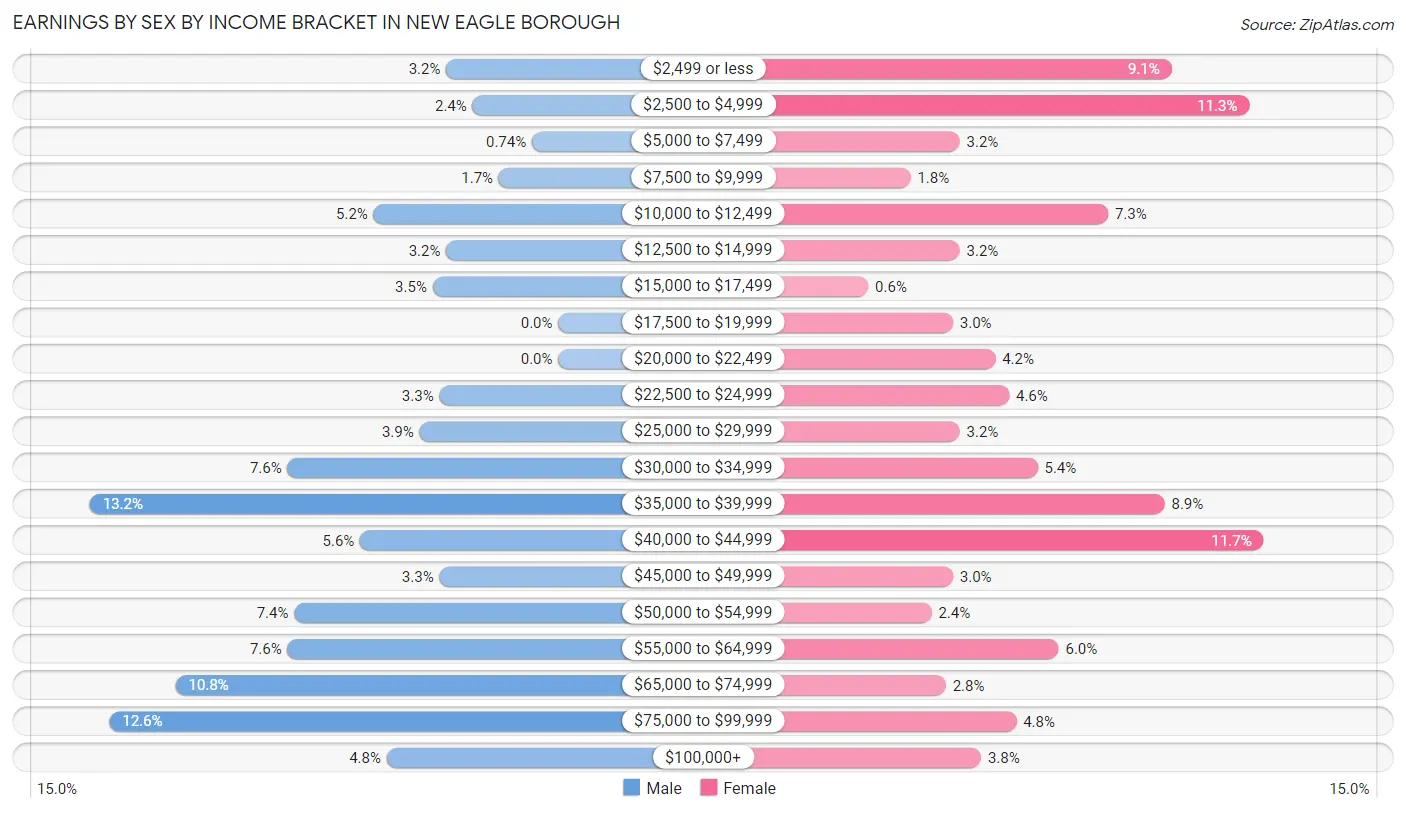
Earnings by Sex by Income Bracket in New Eagle borough
The most common earnings brackets in New Eagle borough are $35,000 to $39,999 for men (71 | 13.2%) and $40,000 to $44,999 for women (59 | 11.7%).
| Income | Male | Female |
| $2,499 or less | 17 (3.2%) | 46 (9.1%) |
| $2,500 to $4,999 | 13 (2.4%) | 57 (11.3%) |
| $5,000 to $7,499 | 4 (0.7%) | 16 (3.2%) |
| $7,500 to $9,999 | 9 (1.7%) | 9 (1.8%) |
| $10,000 to $12,499 | 28 (5.2%) | 37 (7.3%) |
| $12,500 to $14,999 | 17 (3.2%) | 16 (3.2%) |
| $15,000 to $17,499 | 19 (3.5%) | 3 (0.6%) |
| $17,500 to $19,999 | 0 (0.0%) | 15 (3.0%) |
| $20,000 to $22,499 | 0 (0.0%) | 21 (4.2%) |
| $22,500 to $24,999 | 18 (3.3%) | 23 (4.6%) |
| $25,000 to $29,999 | 21 (3.9%) | 16 (3.2%) |
| $30,000 to $34,999 | 41 (7.6%) | 27 (5.4%) |
| $35,000 to $39,999 | 71 (13.2%) | 45 (8.9%) |
| $40,000 to $44,999 | 30 (5.6%) | 59 (11.7%) |
| $45,000 to $49,999 | 18 (3.3%) | 15 (3.0%) |
| $50,000 to $54,999 | 40 (7.4%) | 12 (2.4%) |
| $55,000 to $64,999 | 41 (7.6%) | 30 (5.9%) |
| $65,000 to $74,999 | 58 (10.8%) | 14 (2.8%) |
| $75,000 to $99,999 | 68 (12.6%) | 24 (4.8%) |
| $100,000+ | 26 (4.8%) | 19 (3.8%) |
| Total | 539 (100.0%) | 504 (100.0%) |
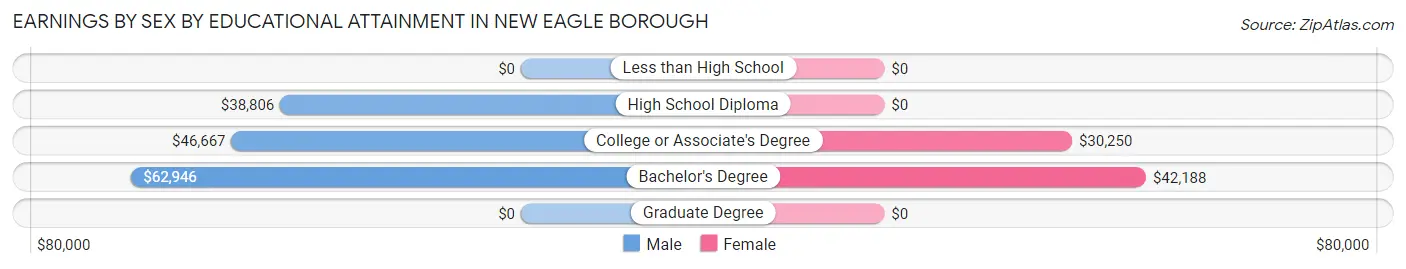
Earnings by Sex by Educational Attainment in New Eagle borough
Average earnings in New Eagle borough are $50,000 for men and $31,759 for women, a difference of 36.5%. Men with an educational attainment of bachelor's degree enjoy the highest average annual earnings of $62,946, while those with high school diploma education earn the least with $38,806. Women with an educational attainment of bachelor's degree earn the most with the average annual earnings of $42,188, while those with college or associate's degree education have the smallest earnings of $30,250.
| Educational Attainment | Male Income | Female Income |
| Less than High School | - | - |
| High School Diploma | $38,806 | $0 |
| College or Associate's Degree | $46,667 | $30,250 |
| Bachelor's Degree | $62,946 | $42,188 |
| Graduate Degree | - | - |
| Total | $50,000 | $31,759 |
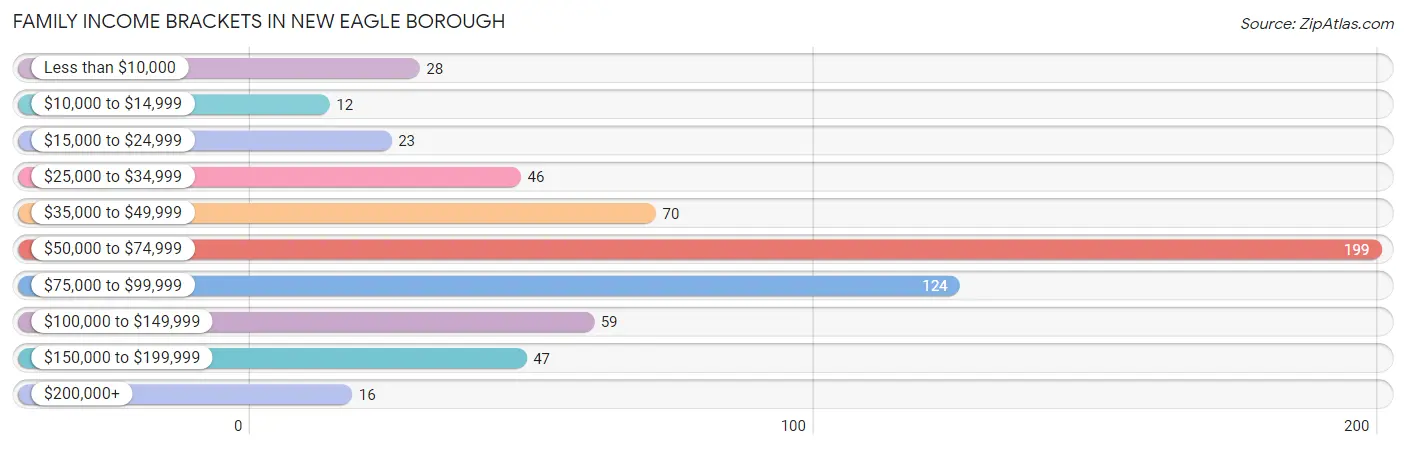
Family Income in New Eagle borough
Family Income Brackets in New Eagle borough
According to the New Eagle borough family income data, there are 199 families falling into the $50,000 to $74,999 income range, which is the most common income bracket and makes up 31.9% of all families. Conversely, the $10,000 to $14,999 income bracket is the least frequent group with only 12 families (1.9%) belonging to this category.
| Income Bracket | # Families | % Families |
| Less than $10,000 | 28 | 4.5% |
| $10,000 to $14,999 | 12 | 1.9% |
| $15,000 to $24,999 | 23 | 3.7% |
| $25,000 to $34,999 | 46 | 7.4% |
| $35,000 to $49,999 | 70 | 11.2% |
| $50,000 to $74,999 | 199 | 31.9% |
| $75,000 to $99,999 | 124 | 19.9% |
| $100,000 to $149,999 | 59 | 9.5% |
| $150,000 to $199,999 | 47 | 7.5% |
| $200,000+ | 16 | 2.6% |
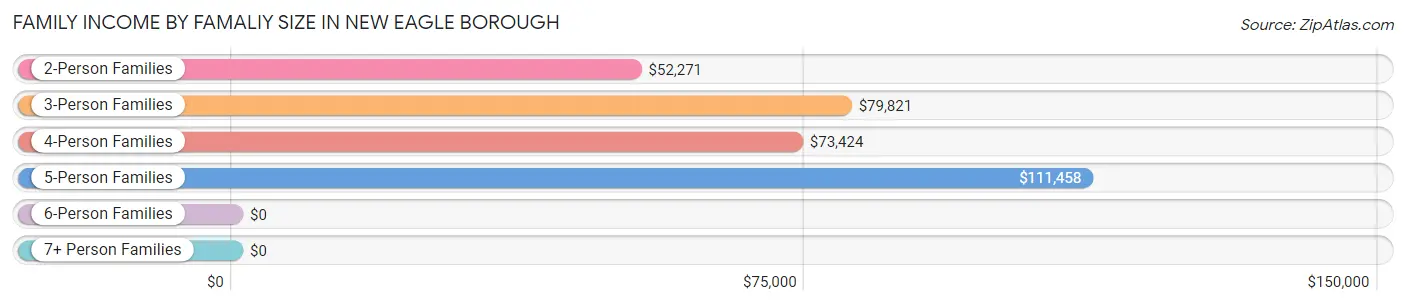
Family Income by Famaliy Size in New Eagle borough
5-person families (23 | 3.7%) account for the highest median family income in New Eagle borough with $111,458 per family, while 3-person families (73 | 11.7%) have the highest median income of $26,607 per family member.
| Income Bracket | # Families | Median Income |
| 2-Person Families | 421 (67.5%) | $52,271 |
| 3-Person Families | 73 (11.7%) | $79,821 |
| 4-Person Families | 93 (14.9%) | $73,424 |
| 5-Person Families | 23 (3.7%) | $111,458 |
| 6-Person Families | 14 (2.2%) | $0 |
| 7+ Person Families | 0 (0.0%) | $0 |
| Total | 624 (100.0%) | $67,727 |
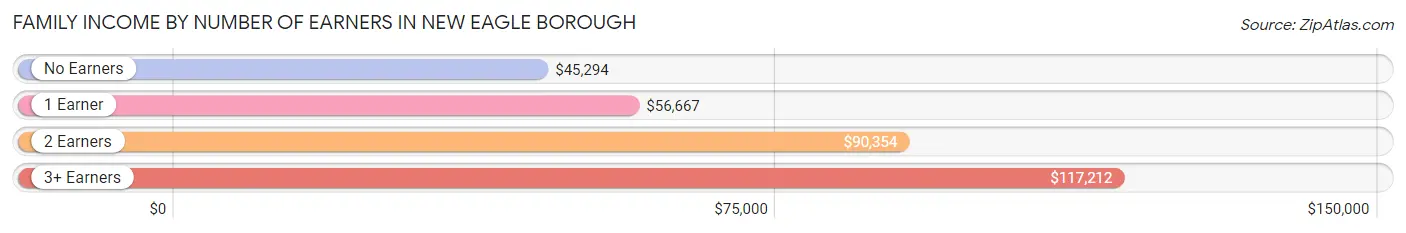
Family Income by Number of Earners in New Eagle borough
The median family income in New Eagle borough is $67,727, with families comprising 3+ earners (65) having the highest median family income of $117,212, while families with no earners (216) have the lowest median family income of $45,294, accounting for 10.4% and 34.6% of families, respectively.
| Number of Earners | # Families | Median Income |
| No Earners | 216 (34.6%) | $45,294 |
| 1 Earner | 156 (25.0%) | $56,667 |
| 2 Earners | 187 (30.0%) | $90,354 |
| 3+ Earners | 65 (10.4%) | $117,212 |
| Total | 624 (100.0%) | $67,727 |
Household Income in New Eagle borough
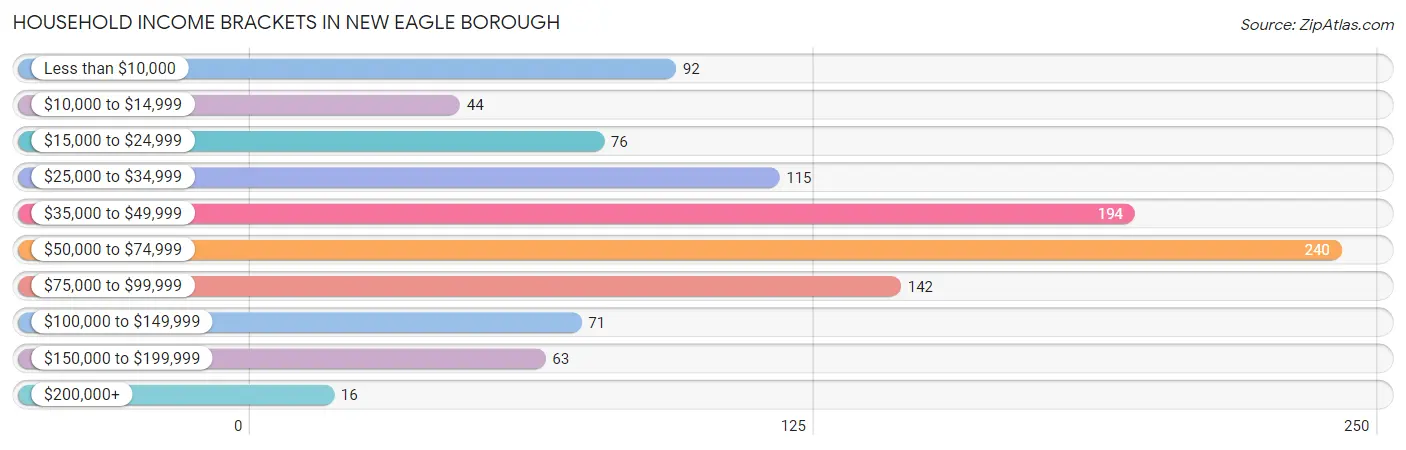
Household Income Brackets in New Eagle borough
With 240 households falling in the category, the $50,000 to $74,999 income range is the most frequent in New Eagle borough, accounting for 22.8% of all households. In contrast, only 16 households (1.5%) fall into the $200,000+ income bracket, making it the least populous group.
| Income Bracket | # Households | % Households |
| Less than $10,000 | 92 | 8.7% |
| $10,000 to $14,999 | 44 | 4.2% |
| $15,000 to $24,999 | 76 | 7.2% |
| $25,000 to $34,999 | 115 | 10.9% |
| $35,000 to $49,999 | 194 | 18.4% |
| $50,000 to $74,999 | 240 | 22.8% |
| $75,000 to $99,999 | 142 | 13.5% |
| $100,000 to $149,999 | 71 | 6.7% |
| $150,000 to $199,999 | 63 | 6.0% |
| $200,000+ | 16 | 1.5% |
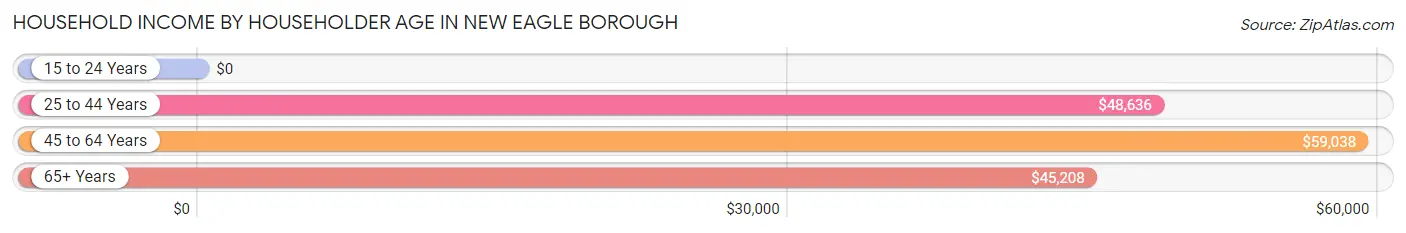
Household Income by Householder Age in New Eagle borough
The median household income in New Eagle borough is $50,158, with the highest median household income of $59,038 found in the 45 to 64 years age bracket for the primary householder. A total of 386 households (36.7%) fall into this category. Meanwhile, the 15 to 24 years age bracket for the primary householder has the lowest median household income of $0, with 8 households (0.8%) in this group.
| Income Bracket | # Households | Median Income |
| 15 to 24 Years | 8 (0.8%) | $0 |
| 25 to 44 Years | 300 (28.5%) | $48,636 |
| 45 to 64 Years | 386 (36.7%) | $59,038 |
| 65+ Years | 359 (34.1%) | $45,208 |
| Total | 1,053 (100.0%) | $50,158 |
Poverty in New Eagle borough
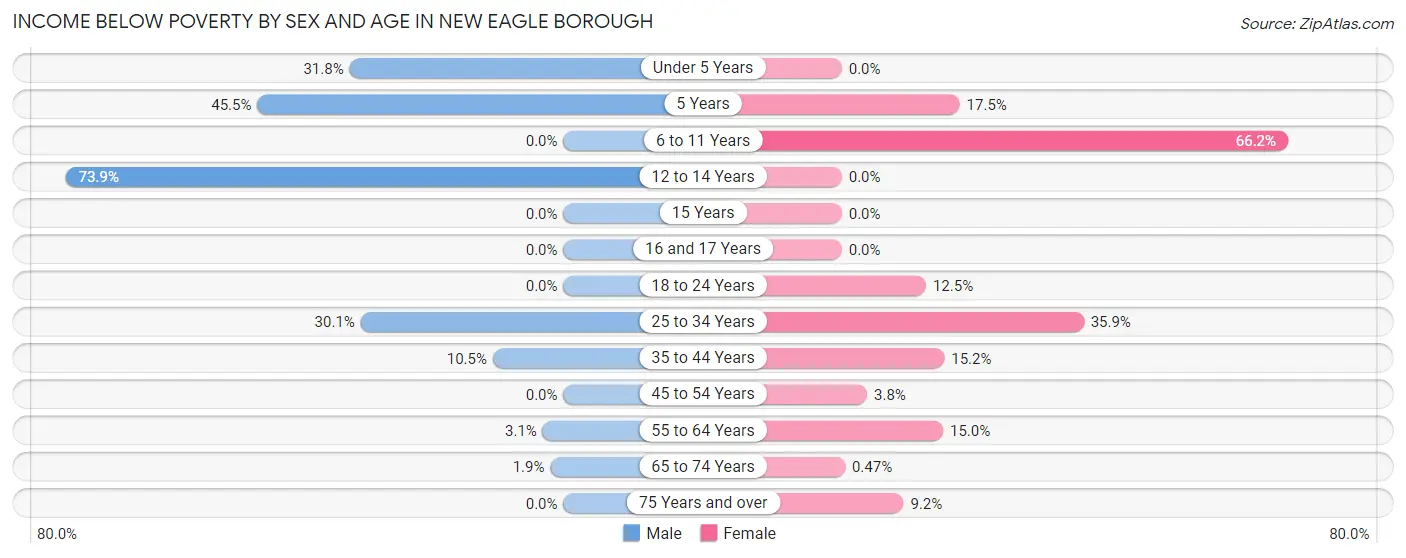
Income Below Poverty by Sex and Age in New Eagle borough
With 11.5% poverty level for males and 16.3% for females among the residents of New Eagle borough, 12 to 14 year old males and 6 to 11 year old females are the most vulnerable to poverty, with 17 males (73.9%) and 51 females (66.2%) in their respective age groups living below the poverty level.
| Age Bracket | Male | Female |
| Under 5 Years | 27 (31.8%) | 0 (0.0%) |
| 5 Years | 5 (45.5%) | 7 (17.5%) |
| 6 to 11 Years | 0 (0.0%) | 51 (66.2%) |
| 12 to 14 Years | 17 (73.9%) | 0 (0.0%) |
| 15 Years | 0 (0.0%) | 0 (0.0%) |
| 16 and 17 Years | 0 (0.0%) | 0 (0.0%) |
| 18 to 24 Years | 0 (0.0%) | 7 (12.5%) |
| 25 to 34 Years | 59 (30.1%) | 51 (35.9%) |
| 35 to 44 Years | 13 (10.5%) | 14 (15.2%) |
| 45 to 54 Years | 0 (0.0%) | 5 (3.8%) |
| 55 to 64 Years | 5 (3.1%) | 23 (15.0%) |
| 65 to 74 Years | 4 (1.9%) | 1 (0.5%) |
| 75 Years and over | 0 (0.0%) | 10 (9.2%) |
| Total | 130 (11.5%) | 169 (16.3%) |
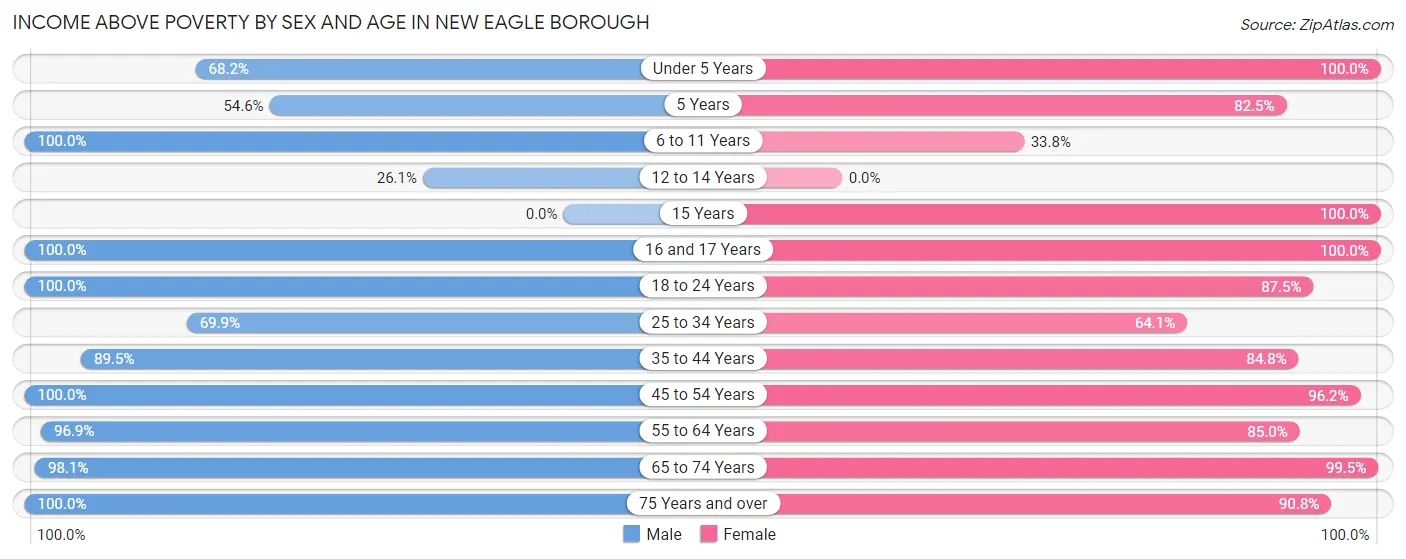
Income Above Poverty by Sex and Age in New Eagle borough
According to the poverty statistics in New Eagle borough, males aged 6 to 11 years and females aged under 5 years are the age groups that are most secure financially, with 100.0% of males and 100.0% of females in these age groups living above the poverty line.
| Age Bracket | Male | Female |
| Under 5 Years | 58 (68.2%) | 6 (100.0%) |
| 5 Years | 6 (54.5%) | 33 (82.5%) |
| 6 to 11 Years | 59 (100.0%) | 26 (33.8%) |
| 12 to 14 Years | 6 (26.1%) | 0 (0.0%) |
| 15 Years | 0 (0.0%) | 6 (100.0%) |
| 16 and 17 Years | 5 (100.0%) | 9 (100.0%) |
| 18 to 24 Years | 87 (100.0%) | 49 (87.5%) |
| 25 to 34 Years | 137 (69.9%) | 91 (64.1%) |
| 35 to 44 Years | 111 (89.5%) | 78 (84.8%) |
| 45 to 54 Years | 118 (100.0%) | 128 (96.2%) |
| 55 to 64 Years | 158 (96.9%) | 130 (85.0%) |
| 65 to 74 Years | 202 (98.1%) | 210 (99.5%) |
| 75 Years and over | 53 (100.0%) | 99 (90.8%) |
| Total | 1,000 (88.5%) | 865 (83.7%) |
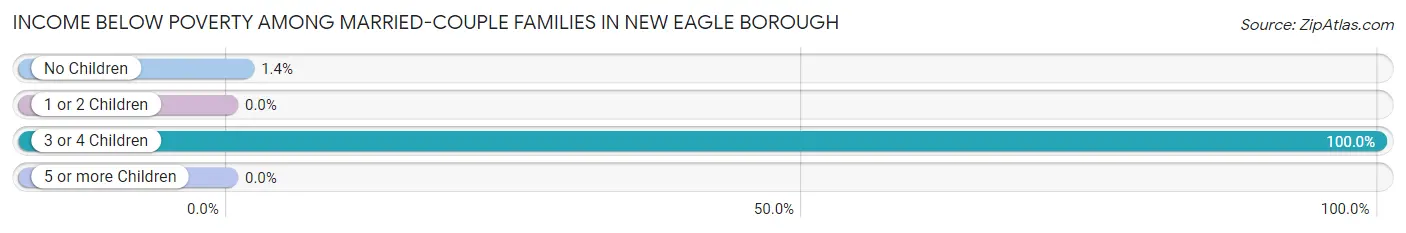
Income Below Poverty Among Married-Couple Families in New Eagle borough
The poverty statistics for married-couple families in New Eagle borough show that 3.2% or 13 of the total 406 families live below the poverty line. Families with 3 or 4 children have the highest poverty rate of 100.0%, comprising of 8 families. On the other hand, families with 1 or 2 children have the lowest poverty rate of 0.0%, which includes 0 families.
| Children | Above Poverty | Below Poverty |
| No Children | 349 (98.6%) | 5 (1.4%) |
| 1 or 2 Children | 44 (100.0%) | 0 (0.0%) |
| 3 or 4 Children | 0 (0.0%) | 8 (100.0%) |
| 5 or more Children | 0 (0.0%) | 0 (0.0%) |
| Total | 393 (96.8%) | 13 (3.2%) |
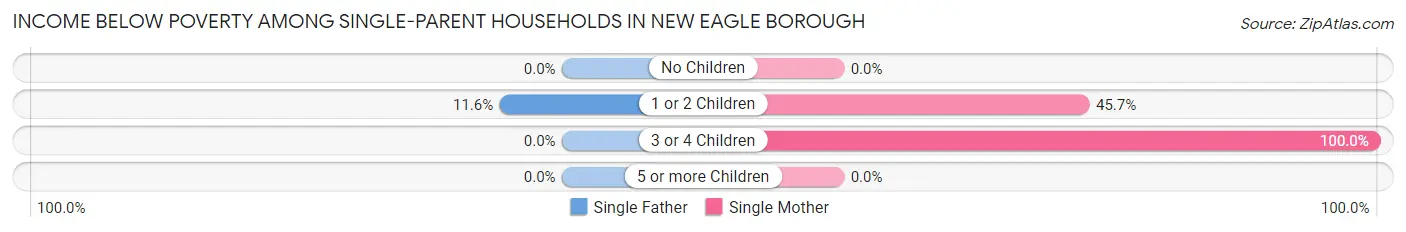
Income Below Poverty Among Single-Parent Households in New Eagle borough
According to the poverty data in New Eagle borough, 5.0% or 5 single-father households and 29.9% or 35 single-mother households are living below the poverty line. Among single-father households, those with 1 or 2 children have the highest poverty rate, with 5 households (11.6%) experiencing poverty. Likewise, among single-mother households, those with 3 or 4 children have the highest poverty rate, with 19 households (100.0%) falling below the poverty line.
| Children | Single Father | Single Mother |
| No Children | 0 (0.0%) | 0 (0.0%) |
| 1 or 2 Children | 5 (11.6%) | 16 (45.7%) |
| 3 or 4 Children | 0 (0.0%) | 19 (100.0%) |
| 5 or more Children | 0 (0.0%) | 0 (0.0%) |
| Total | 5 (5.0%) | 35 (29.9%) |
Income Below Poverty Among Married-Couple vs Single-Parent Households in New Eagle borough
The poverty data for New Eagle borough shows that 13 of the married-couple family households (3.2%) and 40 of the single-parent households (18.3%) are living below the poverty level. Within the married-couple family households, those with 3 or 4 children have the highest poverty rate, with 8 households (100.0%) falling below the poverty line. Among the single-parent households, those with 3 or 4 children have the highest poverty rate, with 19 household (45.2%) living below poverty.
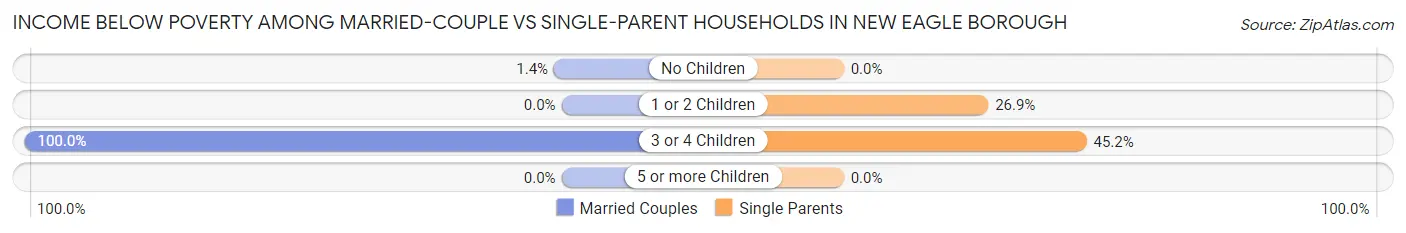
| Children | Married-Couple Families | Single-Parent Households |
| No Children | 5 (1.4%) | 0 (0.0%) |
| 1 or 2 Children | 0 (0.0%) | 21 (26.9%) |
| 3 or 4 Children | 8 (100.0%) | 19 (45.2%) |
| 5 or more Children | 0 (0.0%) | 0 (0.0%) |
| Total | 13 (3.2%) | 40 (18.3%) |
Race in New Eagle borough
The most populous races in New Eagle borough are White / Caucasian (2,052 | 94.8%), Two or more Races (76 | 3.5%), and Asian (29 | 1.3%).
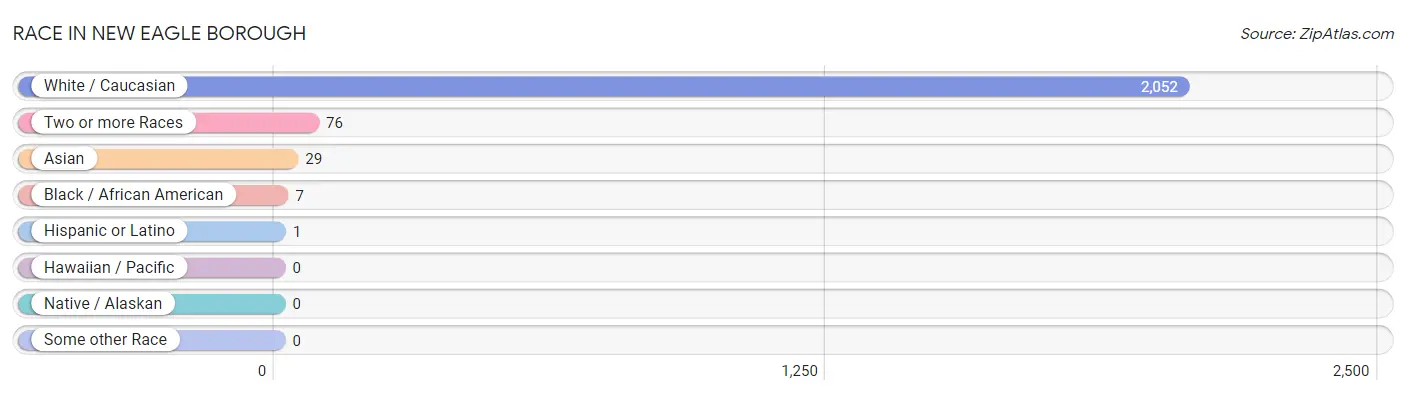
| Race | # Population | % Population |
| Asian | 29 | 1.3% |
| Black / African American | 7 | 0.3% |
| Hawaiian / Pacific | 0 | 0.0% |
| Hispanic or Latino | 1 | 0.1% |
| Native / Alaskan | 0 | 0.0% |
| White / Caucasian | 2,052 | 94.8% |
| Two or more Races | 76 | 3.5% |
| Some other Race | 0 | 0.0% |
| Total | 2,164 | 100.0% |
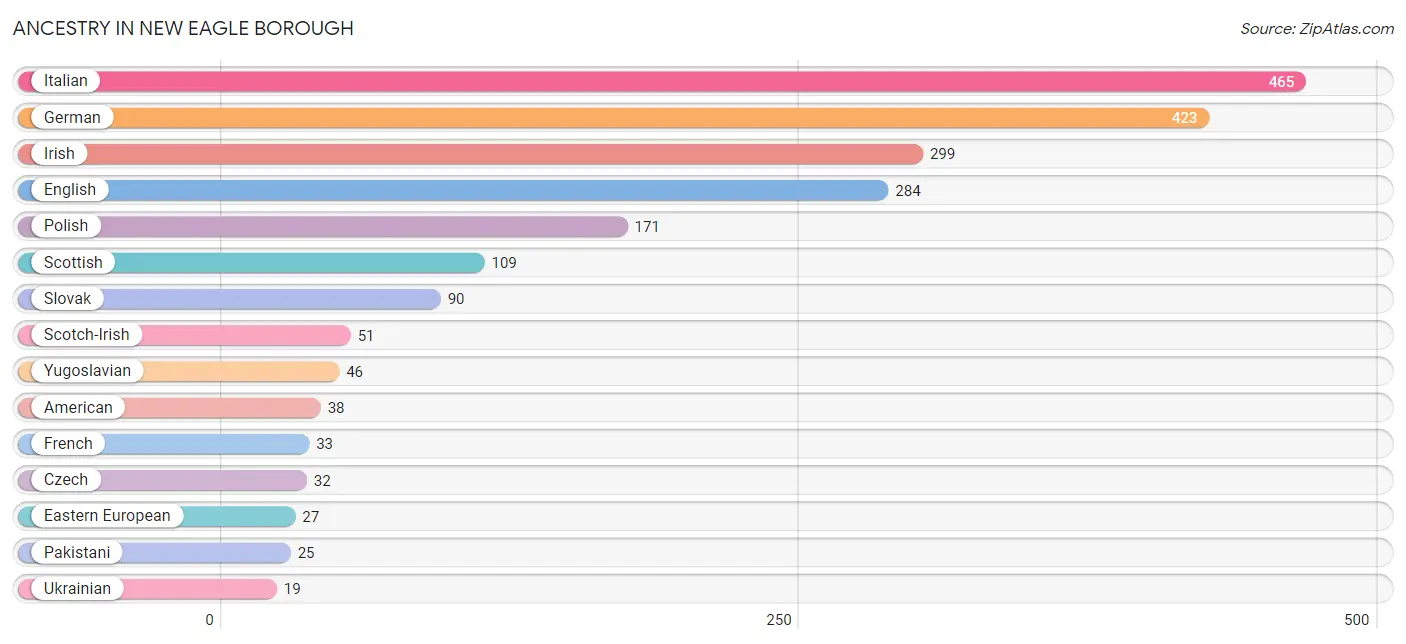
Ancestry in New Eagle borough
The most populous ancestries reported in New Eagle borough are Italian (465 | 21.5%), German (423 | 19.6%), Irish (299 | 13.8%), English (284 | 13.1%), and Polish (171 | 7.9%), together accounting for 75.9% of all New Eagle borough residents.
| Ancestry | # Population | % Population |
| African | 5 | 0.2% |
| American | 38 | 1.8% |
| Arab | 10 | 0.5% |
| Austrian | 8 | 0.4% |
| Cherokee | 2 | 0.1% |
| Czech | 32 | 1.5% |
| Czechoslovakian | 6 | 0.3% |
| Dutch | 11 | 0.5% |
| Eastern European | 27 | 1.3% |
| English | 284 | 13.1% |
| European | 9 | 0.4% |
| French | 33 | 1.5% |
| German | 423 | 19.6% |
| Greek | 3 | 0.1% |
| Hungarian | 14 | 0.6% |
| Indian (Asian) | 4 | 0.2% |
| Irish | 299 | 13.8% |
| Italian | 465 | 21.5% |
| Lithuanian | 4 | 0.2% |
| Norwegian | 5 | 0.2% |
| Pakistani | 25 | 1.2% |
| Pennsylvania German | 5 | 0.2% |
| Polish | 171 | 7.9% |
| Russian | 18 | 0.8% |
| Scandinavian | 6 | 0.3% |
| Scotch-Irish | 51 | 2.4% |
| Scottish | 109 | 5.0% |
| Serbian | 6 | 0.3% |
| Slavic | 5 | 0.2% |
| Slovak | 90 | 4.2% |
| Subsaharan African | 5 | 0.2% |
| Swedish | 5 | 0.2% |
| Syrian | 6 | 0.3% |
| Ukrainian | 19 | 0.9% |
| Welsh | 10 | 0.5% |
| Yugoslavian | 46 | 2.1% | View All 36 Rows |
Immigrants in New Eagle borough
The most numerous immigrant groups reported in New Eagle borough came from Asia (8 | 0.4%), South Eastern Asia (8 | 0.4%), Thailand (8 | 0.4%), Europe (5 | 0.2%), and Italy (5 | 0.2%), together accounting for 1.6% of all New Eagle borough residents.
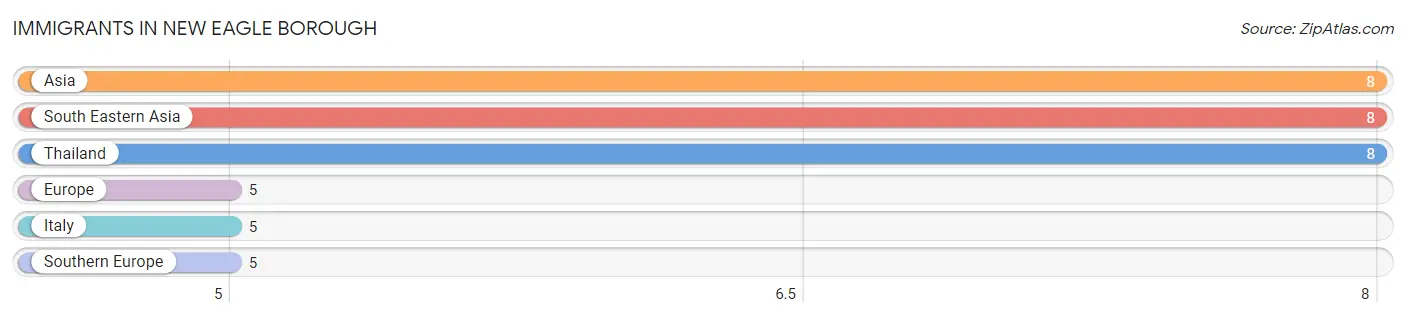
| Immigration Origin | # Population | % Population |
| Asia | 8 | 0.4% |
| Europe | 5 | 0.2% |
| Italy | 5 | 0.2% |
| South Eastern Asia | 8 | 0.4% |
| Southern Europe | 5 | 0.2% |
| Thailand | 8 | 0.4% | View All 6 Rows |
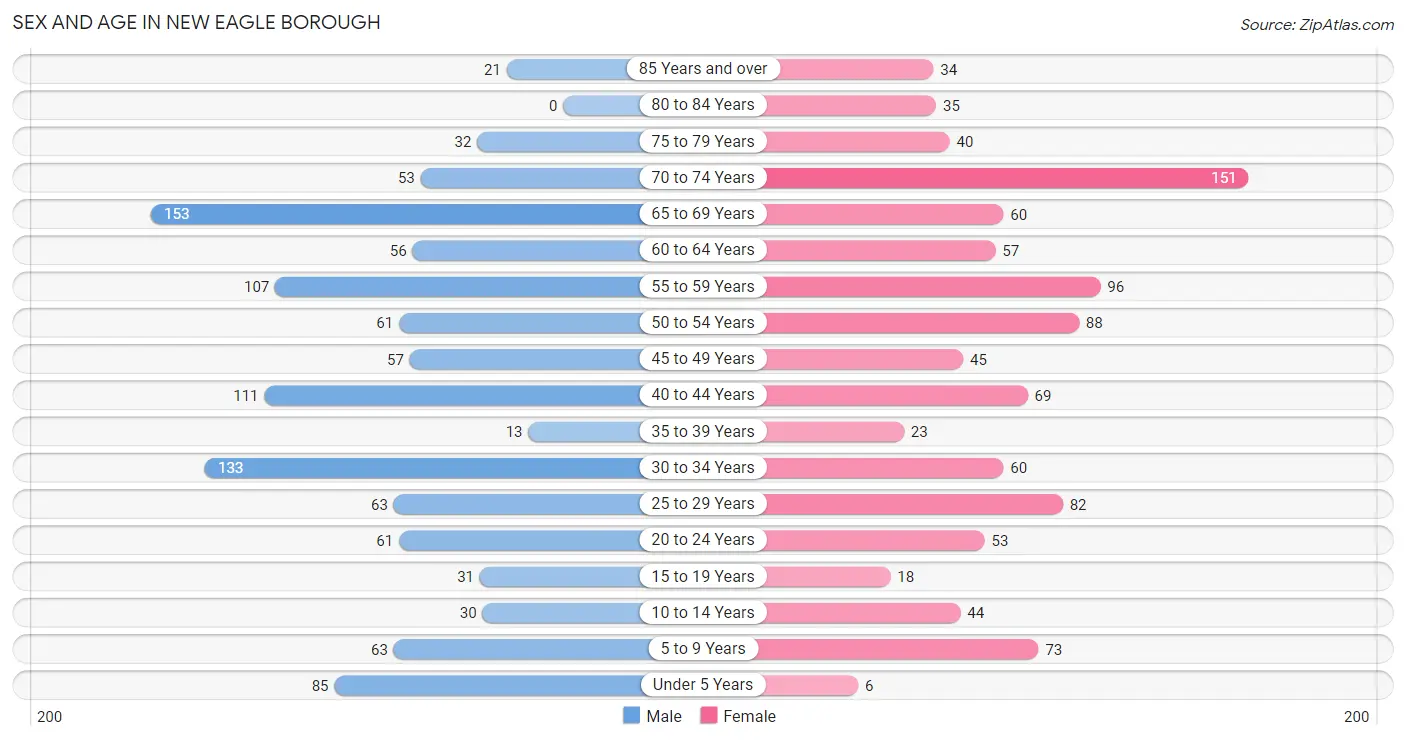
Sex and Age in New Eagle borough
Sex and Age in New Eagle borough
The most populous age groups in New Eagle borough are 65 to 69 Years (153 | 13.5%) for men and 70 to 74 Years (151 | 14.6%) for women.
| Age Bracket | Male | Female |
| Under 5 Years | 85 (7.5%) | 6 (0.6%) |
| 5 to 9 Years | 63 (5.6%) | 73 (7.1%) |
| 10 to 14 Years | 30 (2.6%) | 44 (4.3%) |
| 15 to 19 Years | 31 (2.7%) | 18 (1.7%) |
| 20 to 24 Years | 61 (5.4%) | 53 (5.1%) |
| 25 to 29 Years | 63 (5.6%) | 82 (7.9%) |
| 30 to 34 Years | 133 (11.8%) | 60 (5.8%) |
| 35 to 39 Years | 13 (1.1%) | 23 (2.2%) |
| 40 to 44 Years | 111 (9.8%) | 69 (6.7%) |
| 45 to 49 Years | 57 (5.0%) | 45 (4.3%) |
| 50 to 54 Years | 61 (5.4%) | 88 (8.5%) |
| 55 to 59 Years | 107 (9.5%) | 96 (9.3%) |
| 60 to 64 Years | 56 (5.0%) | 57 (5.5%) |
| 65 to 69 Years | 153 (13.5%) | 60 (5.8%) |
| 70 to 74 Years | 53 (4.7%) | 151 (14.6%) |
| 75 to 79 Years | 32 (2.8%) | 40 (3.9%) |
| 80 to 84 Years | 0 (0.0%) | 35 (3.4%) |
| 85 Years and over | 21 (1.9%) | 34 (3.3%) |
| Total | 1,130 (100.0%) | 1,034 (100.0%) |
Families and Households in New Eagle borough
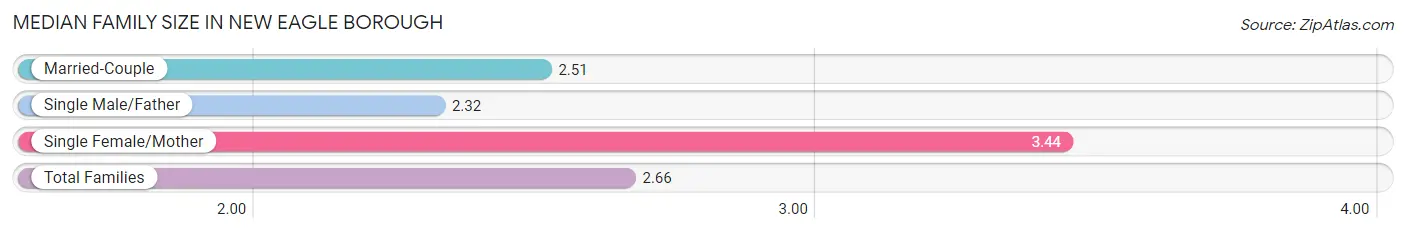
Median Family Size in New Eagle borough
The median family size in New Eagle borough is 2.66 persons per family, with single female/mother families (117 | 18.8%) accounting for the largest median family size of 3.44 persons per family. On the other hand, single male/father families (101 | 16.2%) represent the smallest median family size with 2.32 persons per family.
| Family Type | # Families | Family Size |
| Married-Couple | 406 (65.1%) | 2.51 |
| Single Male/Father | 101 (16.2%) | 2.32 |
| Single Female/Mother | 117 (18.8%) | 3.44 |
| Total Families | 624 (100.0%) | 2.66 |
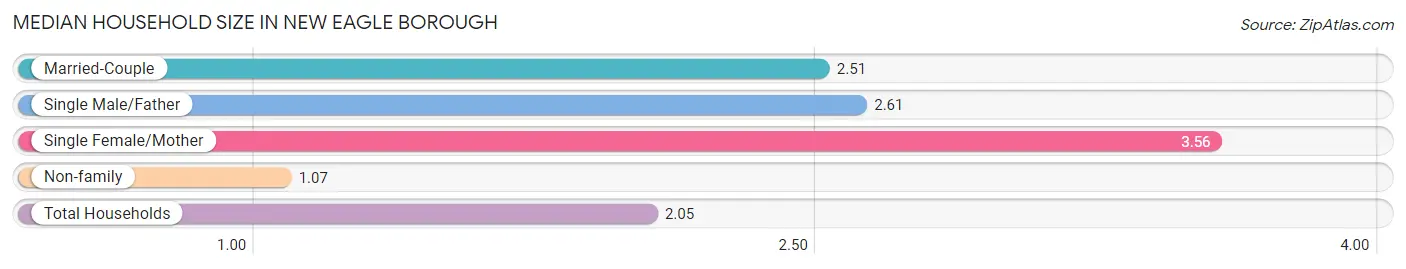
Median Household Size in New Eagle borough
The median household size in New Eagle borough is 2.05 persons per household, with single female/mother households (117 | 11.1%) accounting for the largest median household size of 3.56 persons per household. non-family households (429 | 40.7%) represent the smallest median household size with 1.07 persons per household.
| Household Type | # Households | Household Size |
| Married-Couple | 406 (38.6%) | 2.51 |
| Single Male/Father | 101 (9.6%) | 2.61 |
| Single Female/Mother | 117 (11.1%) | 3.56 |
| Non-family | 429 (40.7%) | 1.07 |
| Total Households | 1,053 (100.0%) | 2.05 |
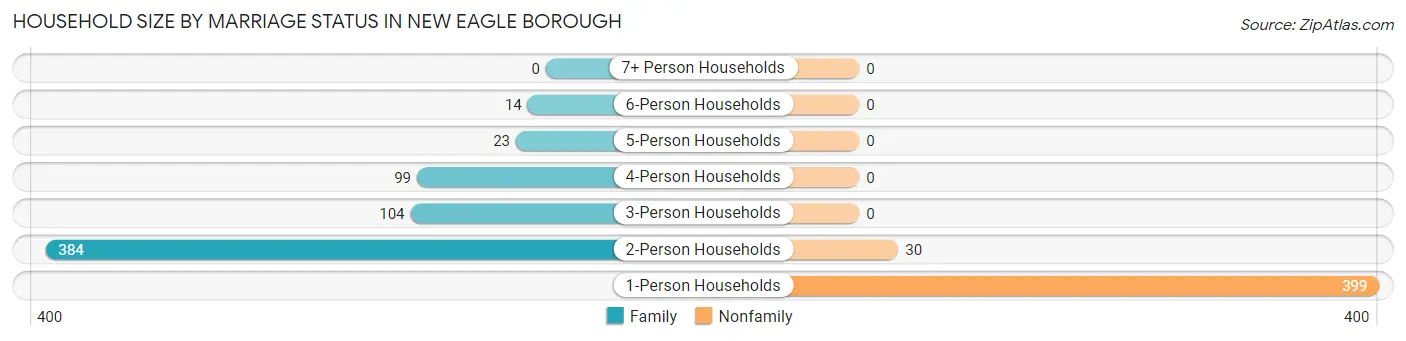
Household Size by Marriage Status in New Eagle borough
Out of a total of 1,053 households in New Eagle borough, 624 (59.3%) are family households, while 429 (40.7%) are nonfamily households. The most numerous type of family households are 2-person households, comprising 384, and the most common type of nonfamily households are 1-person households, comprising 399.
| Household Size | Family Households | Nonfamily Households |
| 1-Person Households | - | 399 (37.9%) |
| 2-Person Households | 384 (36.5%) | 30 (2.9%) |
| 3-Person Households | 104 (9.9%) | 0 (0.0%) |
| 4-Person Households | 99 (9.4%) | 0 (0.0%) |
| 5-Person Households | 23 (2.2%) | 0 (0.0%) |
| 6-Person Households | 14 (1.3%) | 0 (0.0%) |
| 7+ Person Households | 0 (0.0%) | 0 (0.0%) |
| Total | 624 (59.3%) | 429 (40.7%) |
Female Fertility in New Eagle borough
Fertility by Age in New Eagle borough
Average fertility rate in New Eagle borough is 76.0 births per 1,000 women. Women in the age bracket of 20 to 34 years have the highest fertility rate with 138.0 births per 1,000 women. Women in the age bracket of 20 to 34 years acount for 100.0% of all women with births.
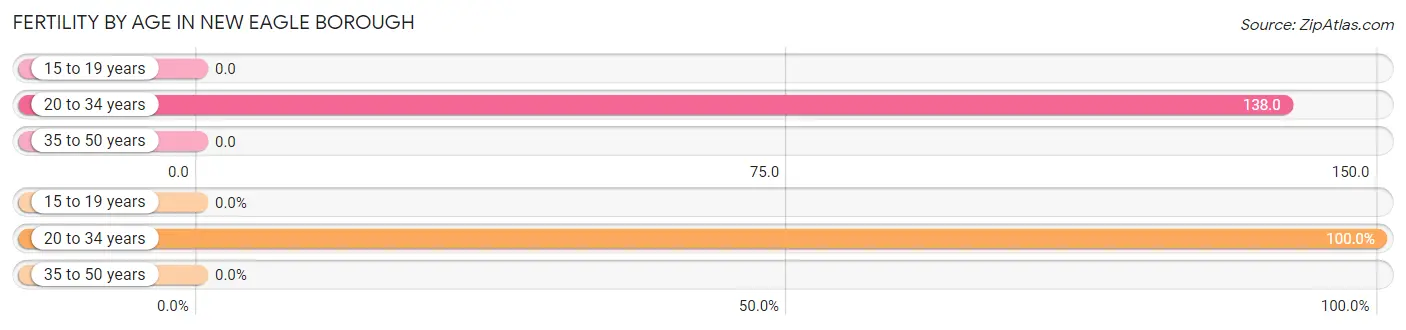
| Age Bracket | Women with Births | Births / 1,000 Women |
| 15 to 19 years | 0 (0.0%) | 0.0 |
| 20 to 34 years | 27 (100.0%) | 138.0 |
| 35 to 50 years | 0 (0.0%) | 0.0 |
| Total | 27 (100.0%) | 76.0 |
Fertility by Age by Marriage Status in New Eagle borough
74.1% of women with births (27) in New Eagle borough are married. The highest percentage of unmarried women with births falls into 20 to 34 years age bracket with 25.9% of them unmarried at the time of birth, while the lowest percentage of unmarried women with births belong to 20 to 34 years age bracket with 25.9% of them unmarried.
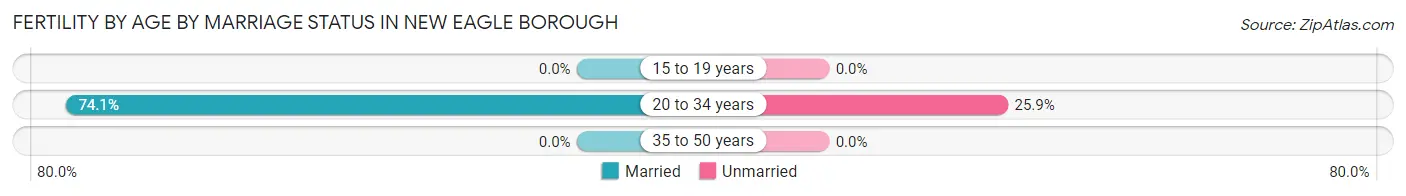
| Age Bracket | Married | Unmarried |
| 15 to 19 years | 0 (0.0%) | 0 (0.0%) |
| 20 to 34 years | 20 (74.1%) | 7 (25.9%) |
| 35 to 50 years | 0 (0.0%) | 0 (0.0%) |
| Total | 20 (74.1%) | 7 (25.9%) |
Fertility by Education in New Eagle borough
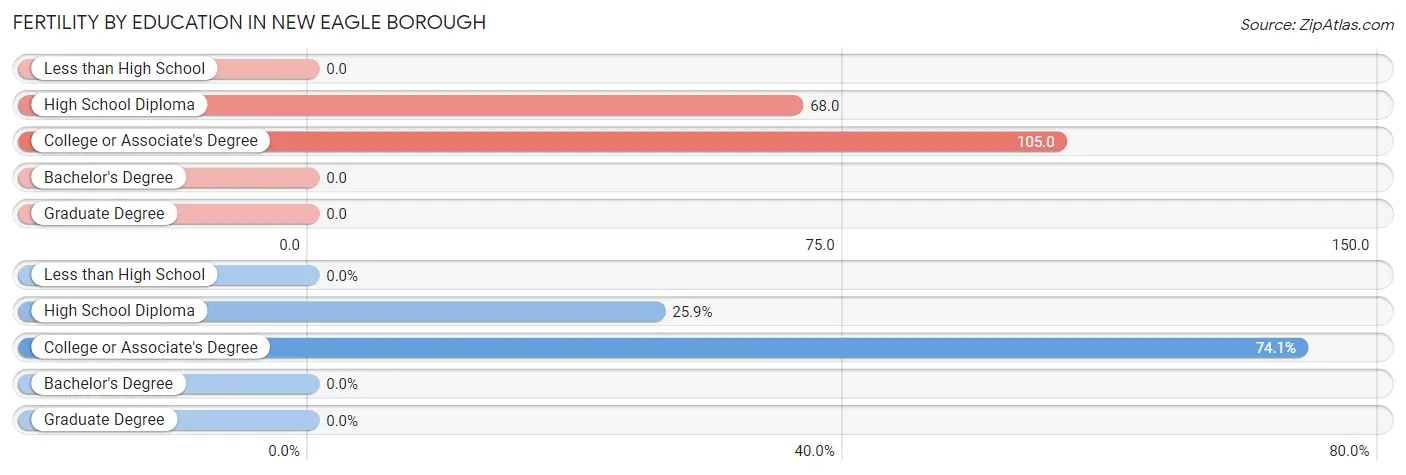
| Educational Attainment | Women with Births | Births / 1,000 Women |
| Less than High School | 0 (0.0%) | 0.0 |
| High School Diploma | 7 (25.9%) | 68.0 |
| College or Associate's Degree | 20 (74.1%) | 105.0 |
| Bachelor's Degree | 0 (0.0%) | 0.0 |
| Graduate Degree | 0 (0.0%) | 0.0 |
| Total | 27 (100.0%) | 76.0 |
Fertility by Education by Marriage Status in New Eagle borough
25.9% of women with births in New Eagle borough are unmarried. Women with the educational attainment of college or associate's degree are most likely to be married with 100.0% of them married at childbirth, while women with the educational attainment of high school diploma are least likely to be married with 100.0% of them unmarried at childbirth.
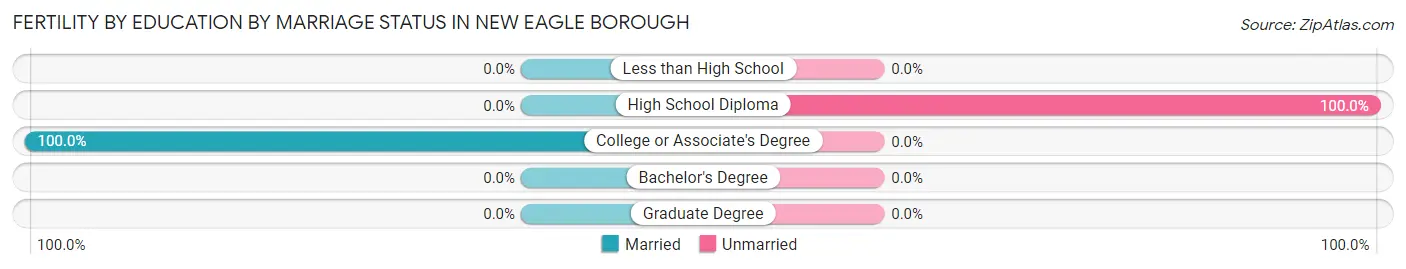
| Educational Attainment | Married | Unmarried |
| Less than High School | 0 (0.0%) | 0 (0.0%) |
| High School Diploma | 0 (0.0%) | 7 (100.0%) |
| College or Associate's Degree | 20 (100.0%) | 0 (0.0%) |
| Bachelor's Degree | 0 (0.0%) | 0 (0.0%) |
| Graduate Degree | 0 (0.0%) | 0 (0.0%) |
| Total | 20 (74.1%) | 7 (25.9%) |
Employment Characteristics in New Eagle borough
Employment by Class of Employer in New Eagle borough
Among the 835 employed individuals in New Eagle borough, private company employees (578 | 69.2%), state government employees (80 | 9.6%), and not-for-profit organizations (79 | 9.5%) make up the most common classes of employment.
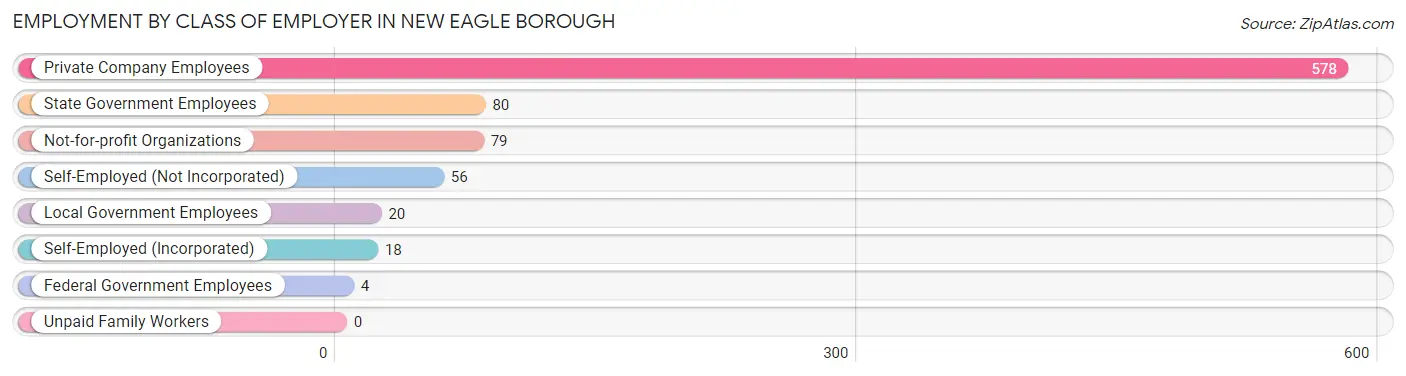
| Employer Class | # Employees | % Employees |
| Private Company Employees | 578 | 69.2% |
| Self-Employed (Incorporated) | 18 | 2.2% |
| Self-Employed (Not Incorporated) | 56 | 6.7% |
| Not-for-profit Organizations | 79 | 9.5% |
| Local Government Employees | 20 | 2.4% |
| State Government Employees | 80 | 9.6% |
| Federal Government Employees | 4 | 0.5% |
| Unpaid Family Workers | 0 | 0.0% |
| Total | 835 | 100.0% |
Employment Status by Age in New Eagle borough
According to the labor force statistics for New Eagle borough, out of the total population over 16 years of age (1,857), 54.1% or 1,005 individuals are in the labor force, with 14.1% or 142 of them unemployed. The age group with the highest labor force participation rate is 20 to 24 years, with 88.6% or 101 individuals in the labor force. Within the labor force, the 35 to 44 years age range has the highest percentage of unemployed individuals, with 34.2% or 51 of them being unemployed.
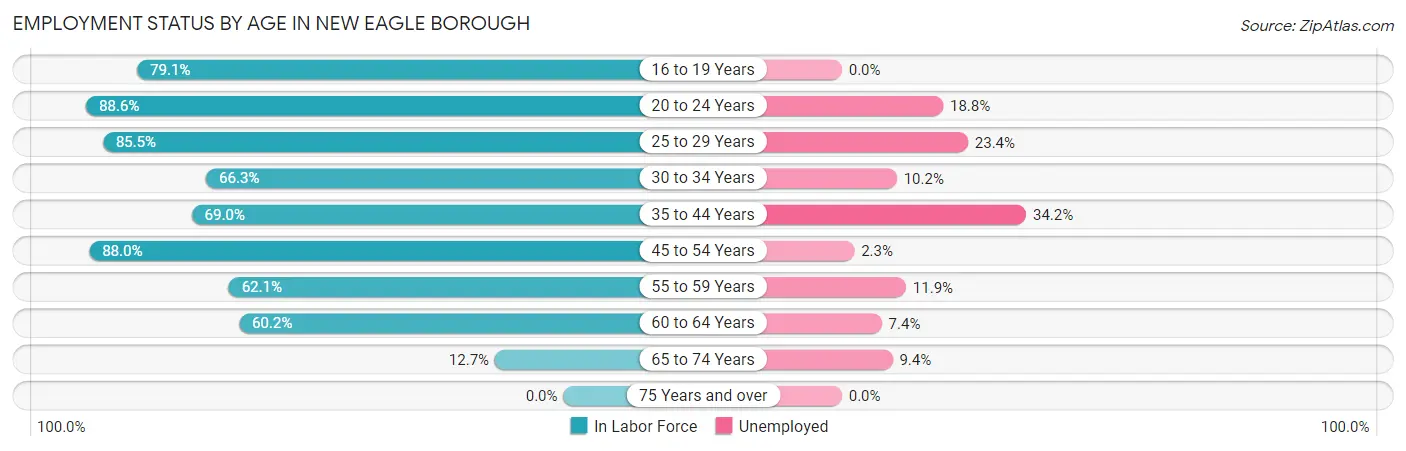
| Age Bracket | In Labor Force | Unemployed |
| 16 to 19 Years | 34 (79.1%) | 0 (0.0%) |
| 20 to 24 Years | 101 (88.6%) | 19 (18.8%) |
| 25 to 29 Years | 124 (85.5%) | 29 (23.4%) |
| 30 to 34 Years | 128 (66.3%) | 13 (10.2%) |
| 35 to 44 Years | 149 (69.0%) | 51 (34.2%) |
| 45 to 54 Years | 221 (88.0%) | 5 (2.3%) |
| 55 to 59 Years | 126 (62.1%) | 15 (11.9%) |
| 60 to 64 Years | 68 (60.2%) | 5 (7.4%) |
| 65 to 74 Years | 53 (12.7%) | 5 (9.4%) |
| 75 Years and over | 0 (0.0%) | 0 (0.0%) |
| Total | 1,005 (54.1%) | 142 (14.1%) |
Employment Status by Educational Attainment in New Eagle borough
According to labor force statistics for New Eagle borough, 72.8% of individuals (816) out of the total population between 25 and 64 years of age (1,121) are in the labor force, with 14.5% or 118 of them being unemployed. The group with the highest labor force participation rate are those with the educational attainment of bachelor's degree or higher, with 88.5% or 230 individuals in the labor force. Within the labor force, individuals with less than high school education have the highest percentage of unemployment, with 48.1% or 13 of them being unemployed.
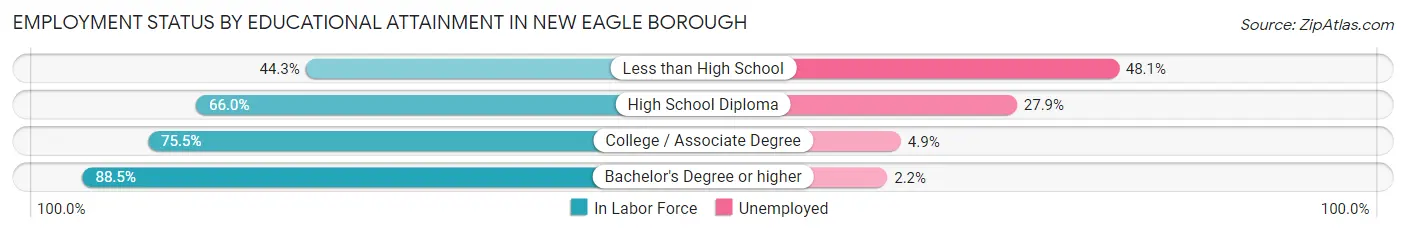
| Educational Attainment | In Labor Force | Unemployed |
| Less than High School | 27 (44.3%) | 29 (48.1%) |
| High School Diploma | 315 (66.0%) | 133 (27.9%) |
| College / Associate Degree | 244 (75.5%) | 16 (4.9%) |
| Bachelor's Degree or higher | 230 (88.5%) | 6 (2.2%) |
| Total | 816 (72.8%) | 163 (14.5%) |
Employment Occupations by Sex in New Eagle borough
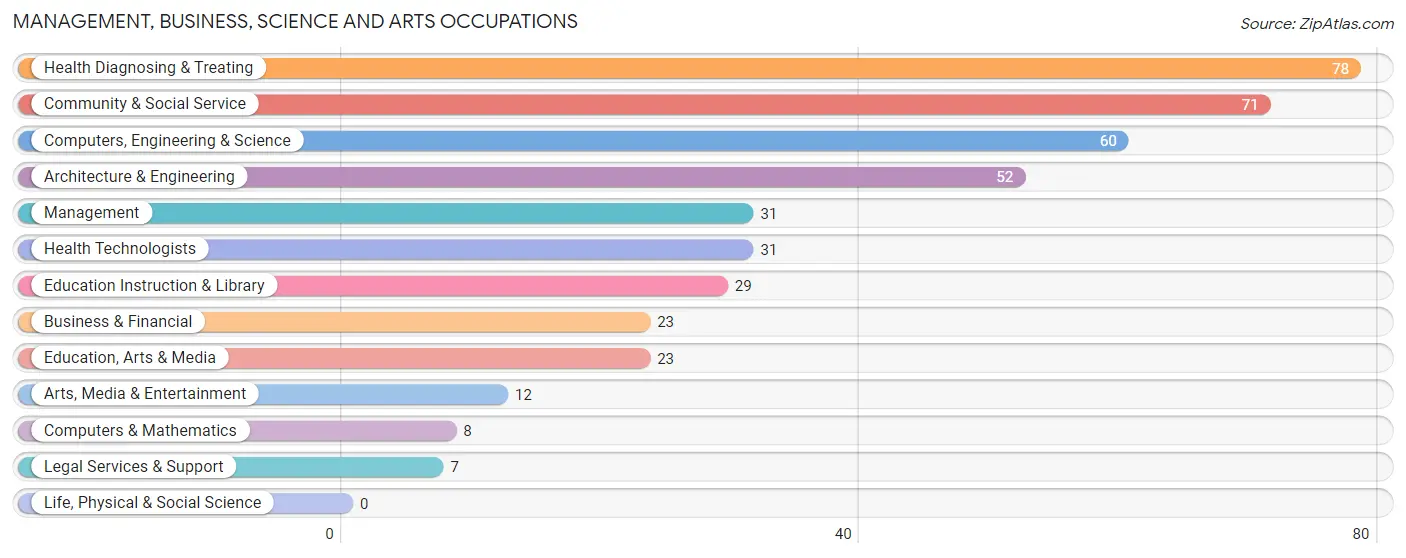
Management, Business, Science and Arts Occupations
The most common Management, Business, Science and Arts occupations in New Eagle borough are Health Diagnosing & Treating (78 | 9.0%), Community & Social Service (71 | 8.2%), Computers, Engineering & Science (60 | 7.0%), Architecture & Engineering (52 | 6.0%), and Management (31 | 3.6%).
Management, Business, Science and Arts Occupations by Sex
Within the Management, Business, Science and Arts occupations in New Eagle borough, the most male-oriented occupations are Management (100.0%), Computers & Mathematics (100.0%), and Computers, Engineering & Science (93.3%), while the most female-oriented occupations are Community & Social Service (100.0%), Education, Arts & Media (100.0%), and Legal Services & Support (100.0%).
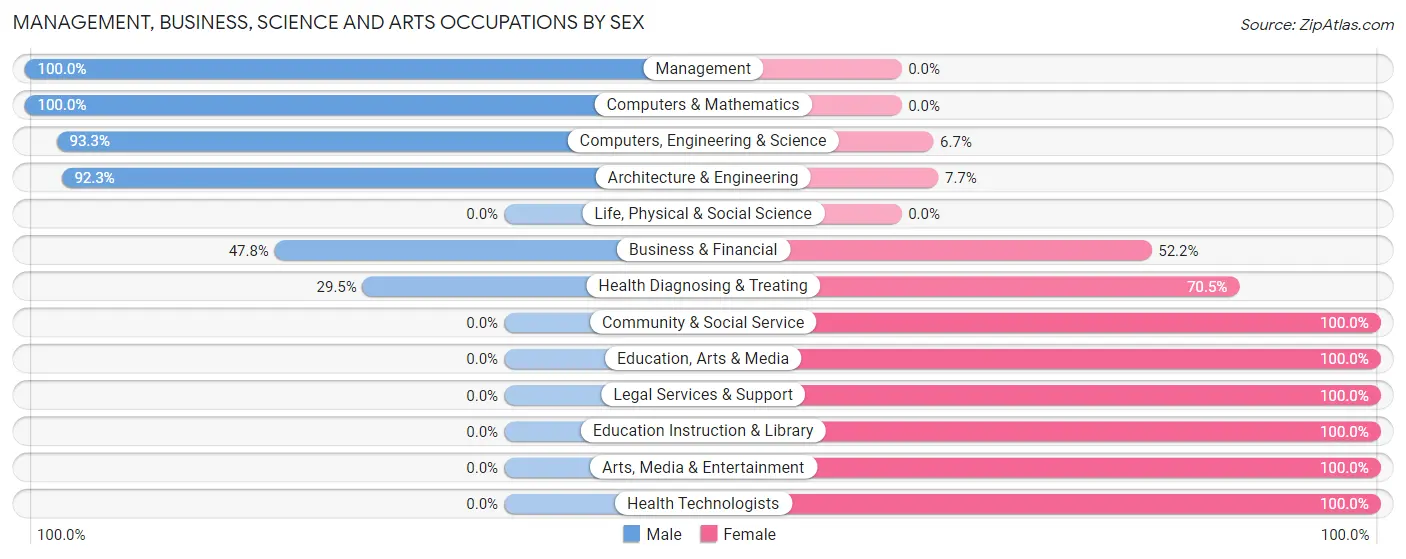
| Occupation | Male | Female |
| Management | 31 (100.0%) | 0 (0.0%) |
| Business & Financial | 11 (47.8%) | 12 (52.2%) |
| Computers, Engineering & Science | 56 (93.3%) | 4 (6.7%) |
| Computers & Mathematics | 8 (100.0%) | 0 (0.0%) |
| Architecture & Engineering | 48 (92.3%) | 4 (7.7%) |
| Life, Physical & Social Science | 0 (0.0%) | 0 (0.0%) |
| Community & Social Service | 0 (0.0%) | 71 (100.0%) |
| Education, Arts & Media | 0 (0.0%) | 23 (100.0%) |
| Legal Services & Support | 0 (0.0%) | 7 (100.0%) |
| Education Instruction & Library | 0 (0.0%) | 29 (100.0%) |
| Arts, Media & Entertainment | 0 (0.0%) | 12 (100.0%) |
| Health Diagnosing & Treating | 23 (29.5%) | 55 (70.5%) |
| Health Technologists | 0 (0.0%) | 31 (100.0%) |
| Total (Category) | 121 (46.0%) | 142 (54.0%) |
| Total (Overall) | 457 (53.0%) | 405 (47.0%) |
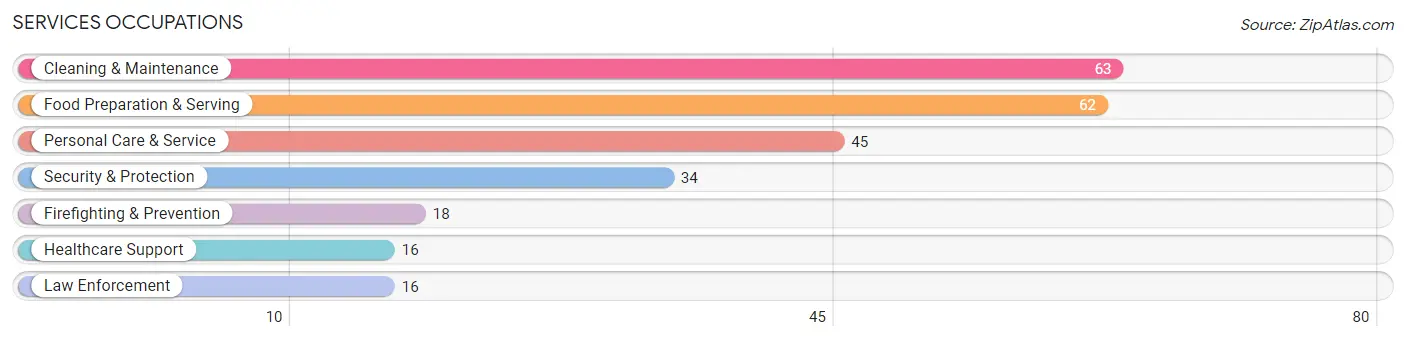
Services Occupations
The most common Services occupations in New Eagle borough are Cleaning & Maintenance (63 | 7.3%), Food Preparation & Serving (62 | 7.2%), Personal Care & Service (45 | 5.2%), Security & Protection (34 | 3.9%), and Firefighting & Prevention (18 | 2.1%).
Services Occupations by Sex
Within the Services occupations in New Eagle borough, the most male-oriented occupations are Security & Protection (100.0%), Firefighting & Prevention (100.0%), and Law Enforcement (100.0%), while the most female-oriented occupations are Healthcare Support (100.0%), Personal Care & Service (86.7%), and Cleaning & Maintenance (57.1%).
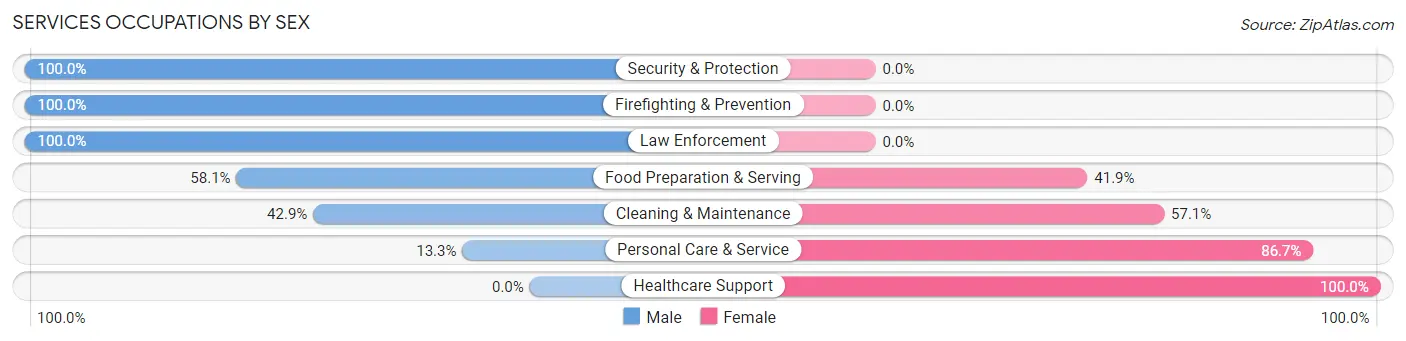
| Occupation | Male | Female |
| Healthcare Support | 0 (0.0%) | 16 (100.0%) |
| Security & Protection | 34 (100.0%) | 0 (0.0%) |
| Firefighting & Prevention | 18 (100.0%) | 0 (0.0%) |
| Law Enforcement | 16 (100.0%) | 0 (0.0%) |
| Food Preparation & Serving | 36 (58.1%) | 26 (41.9%) |
| Cleaning & Maintenance | 27 (42.9%) | 36 (57.1%) |
| Personal Care & Service | 6 (13.3%) | 39 (86.7%) |
| Total (Category) | 103 (46.8%) | 117 (53.2%) |
| Total (Overall) | 457 (53.0%) | 405 (47.0%) |
Sales and Office Occupations
The most common Sales and Office occupations in New Eagle borough are Office & Administration (100 | 11.6%), and Sales & Related (55 | 6.4%).
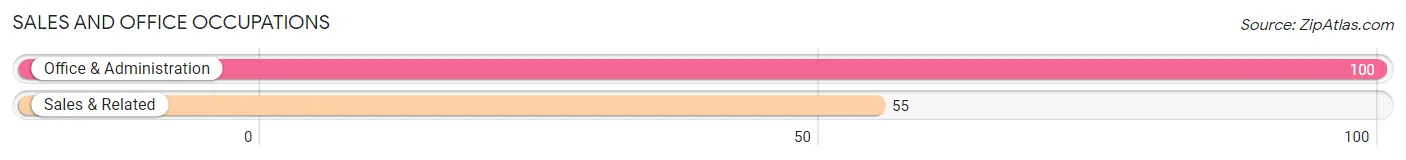
Sales and Office Occupations by Sex
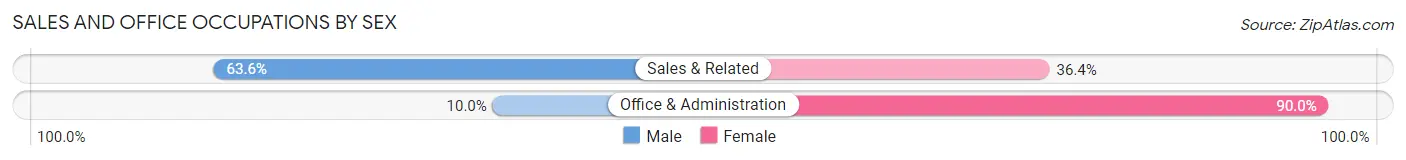
| Occupation | Male | Female |
| Sales & Related | 35 (63.6%) | 20 (36.4%) |
| Office & Administration | 10 (10.0%) | 90 (90.0%) |
| Total (Category) | 45 (29.0%) | 110 (71.0%) |
| Total (Overall) | 457 (53.0%) | 405 (47.0%) |
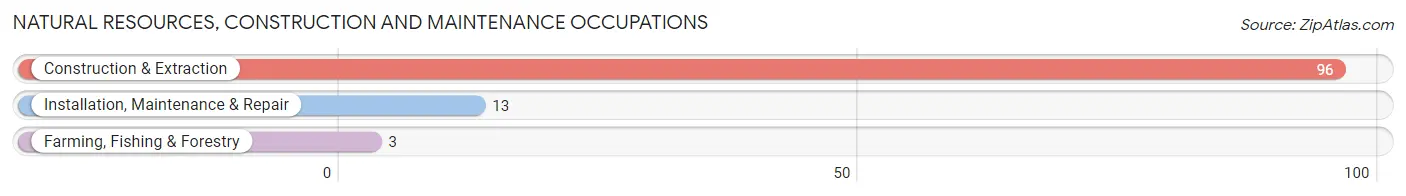
Natural Resources, Construction and Maintenance Occupations
The most common Natural Resources, Construction and Maintenance occupations in New Eagle borough are Construction & Extraction (96 | 11.1%), Installation, Maintenance & Repair (13 | 1.5%), and Farming, Fishing & Forestry (3 | 0.4%).
Natural Resources, Construction and Maintenance Occupations by Sex
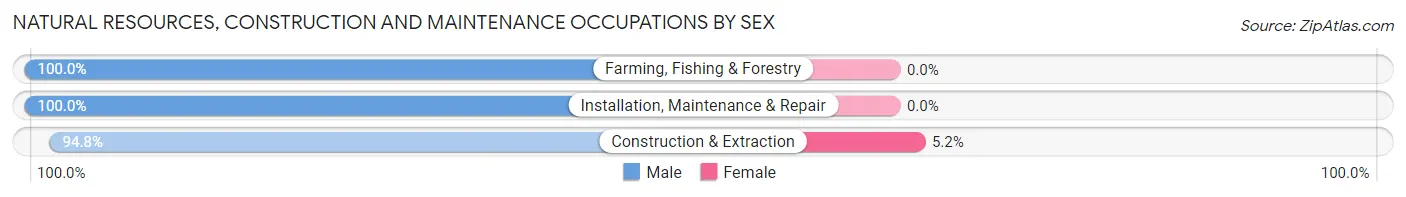
| Occupation | Male | Female |
| Farming, Fishing & Forestry | 3 (100.0%) | 0 (0.0%) |
| Construction & Extraction | 91 (94.8%) | 5 (5.2%) |
| Installation, Maintenance & Repair | 13 (100.0%) | 0 (0.0%) |
| Total (Category) | 107 (95.5%) | 5 (4.5%) |
| Total (Overall) | 457 (53.0%) | 405 (47.0%) |
Production, Transportation and Moving Occupations
The most common Production, Transportation and Moving occupations in New Eagle borough are Production (45 | 5.2%), Transportation (43 | 5.0%), and Material Moving (24 | 2.8%).
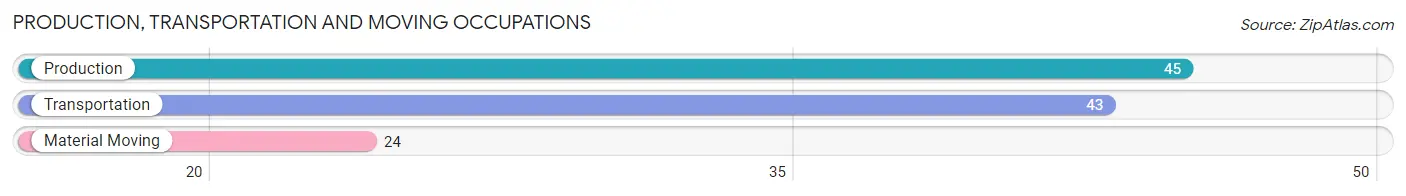
Production, Transportation and Moving Occupations by Sex
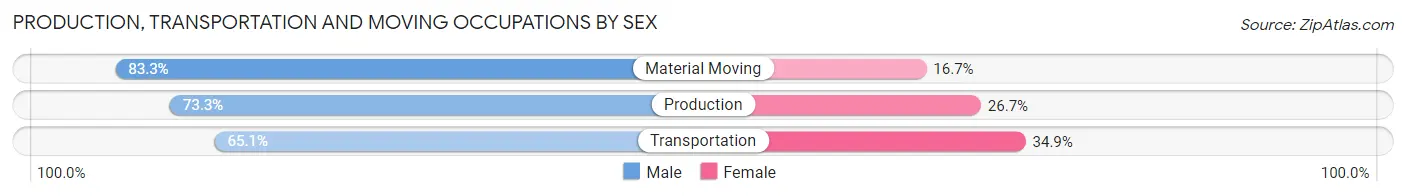
| Occupation | Male | Female |
| Production | 33 (73.3%) | 12 (26.7%) |
| Transportation | 28 (65.1%) | 15 (34.9%) |
| Material Moving | 20 (83.3%) | 4 (16.7%) |
| Total (Category) | 81 (72.3%) | 31 (27.7%) |
| Total (Overall) | 457 (53.0%) | 405 (47.0%) |
Employment Industries by Sex in New Eagle borough
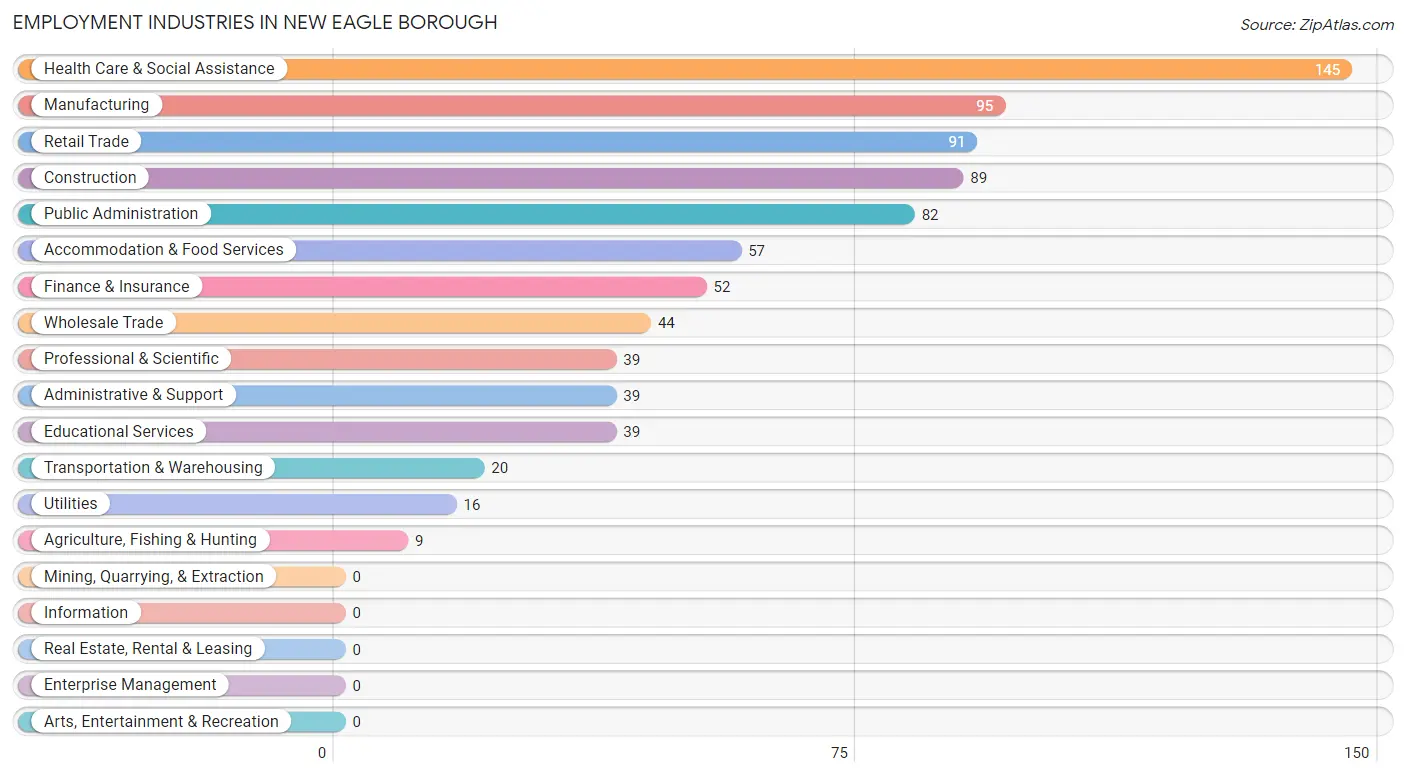
Employment Industries in New Eagle borough
The major employment industries in New Eagle borough include Health Care & Social Assistance (145 | 16.8%), Manufacturing (95 | 11.0%), Retail Trade (91 | 10.6%), Construction (89 | 10.3%), and Public Administration (82 | 9.5%).
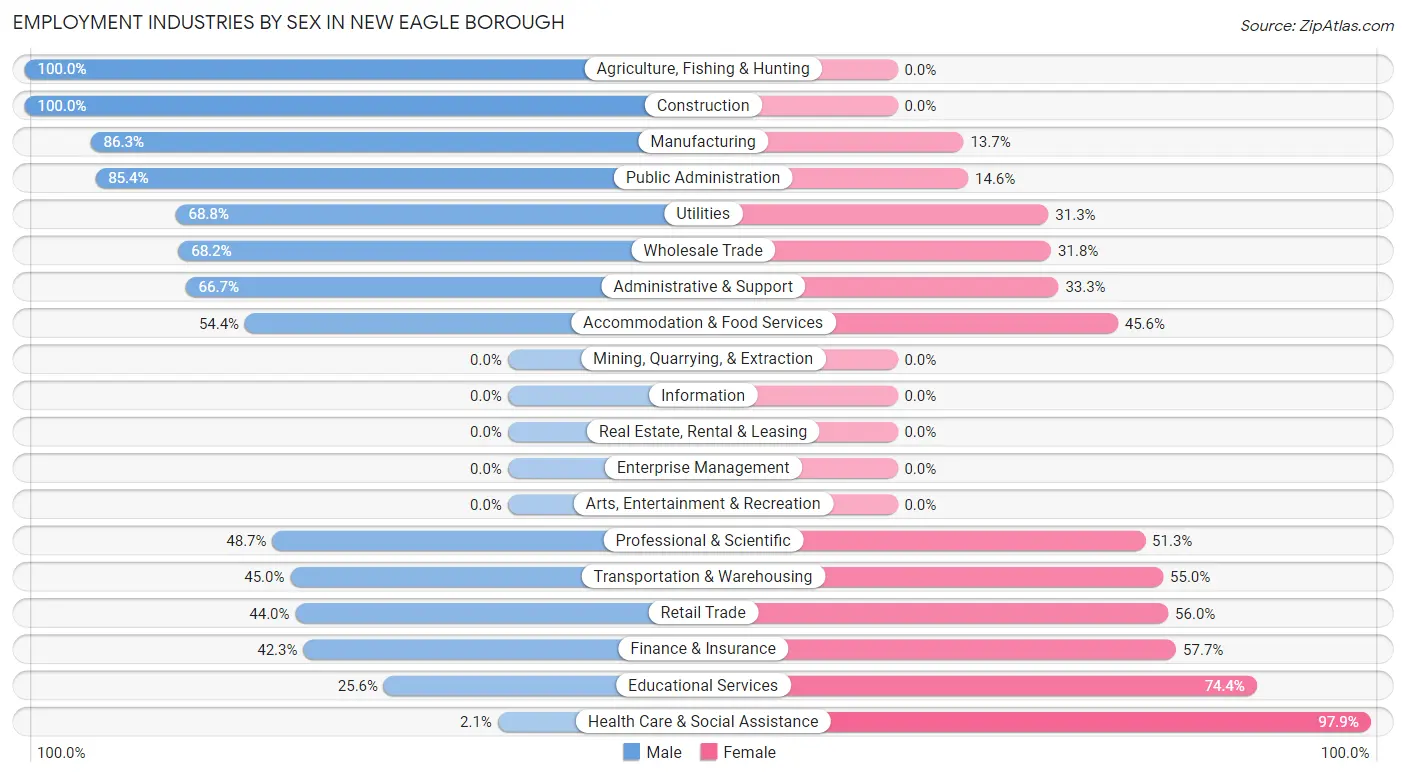
Employment Industries by Sex in New Eagle borough
The New Eagle borough industries that see more men than women are Agriculture, Fishing & Hunting (100.0%), Construction (100.0%), and Manufacturing (86.3%), whereas the industries that tend to have a higher number of women are Health Care & Social Assistance (97.9%), Educational Services (74.4%), and Finance & Insurance (57.7%).
| Industry | Male | Female |
| Agriculture, Fishing & Hunting | 9 (100.0%) | 0 (0.0%) |
| Mining, Quarrying, & Extraction | 0 (0.0%) | 0 (0.0%) |
| Construction | 89 (100.0%) | 0 (0.0%) |
| Manufacturing | 82 (86.3%) | 13 (13.7%) |
| Wholesale Trade | 30 (68.2%) | 14 (31.8%) |
| Retail Trade | 40 (44.0%) | 51 (56.0%) |
| Transportation & Warehousing | 9 (45.0%) | 11 (55.0%) |
| Utilities | 11 (68.8%) | 5 (31.2%) |
| Information | 0 (0.0%) | 0 (0.0%) |
| Finance & Insurance | 22 (42.3%) | 30 (57.7%) |
| Real Estate, Rental & Leasing | 0 (0.0%) | 0 (0.0%) |
| Professional & Scientific | 19 (48.7%) | 20 (51.3%) |
| Enterprise Management | 0 (0.0%) | 0 (0.0%) |
| Administrative & Support | 26 (66.7%) | 13 (33.3%) |
| Educational Services | 10 (25.6%) | 29 (74.4%) |
| Health Care & Social Assistance | 3 (2.1%) | 142 (97.9%) |
| Arts, Entertainment & Recreation | 0 (0.0%) | 0 (0.0%) |
| Accommodation & Food Services | 31 (54.4%) | 26 (45.6%) |
| Public Administration | 70 (85.4%) | 12 (14.6%) |
| Total | 457 (53.0%) | 405 (47.0%) |
Education in New Eagle borough
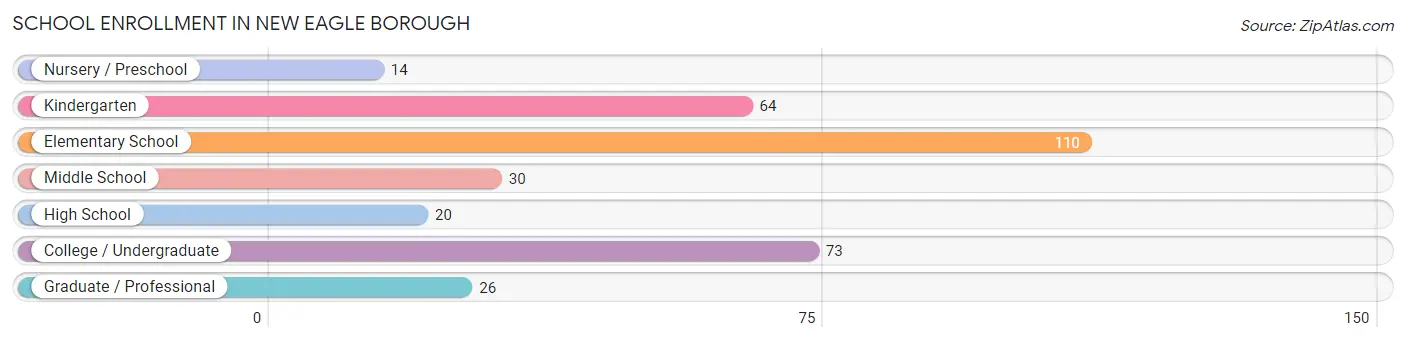
School Enrollment in New Eagle borough
The most common levels of schooling among the 337 students in New Eagle borough are elementary school (110 | 32.6%), college / undergraduate (73 | 21.7%), and kindergarten (64 | 19.0%).
| School Level | # Students | % Students |
| Nursery / Preschool | 14 | 4.2% |
| Kindergarten | 64 | 19.0% |
| Elementary School | 110 | 32.6% |
| Middle School | 30 | 8.9% |
| High School | 20 | 5.9% |
| College / Undergraduate | 73 | 21.7% |
| Graduate / Professional | 26 | 7.7% |
| Total | 337 | 100.0% |
School Enrollment by Age by Funding Source in New Eagle borough
Out of a total of 337 students who are enrolled in schools in New Eagle borough, 9 (2.7%) attend a private institution, while the remaining 328 (97.3%) are enrolled in public schools. The age group of 18 to 19 year olds has the highest likelihood of being enrolled in private schools, with 4 (100.0% in the age bracket) enrolled. Conversely, the age group of 3 to 4 year olds has the lowest likelihood of being enrolled in a private school, with 8 (100.0% in the age bracket) attending a public institution.
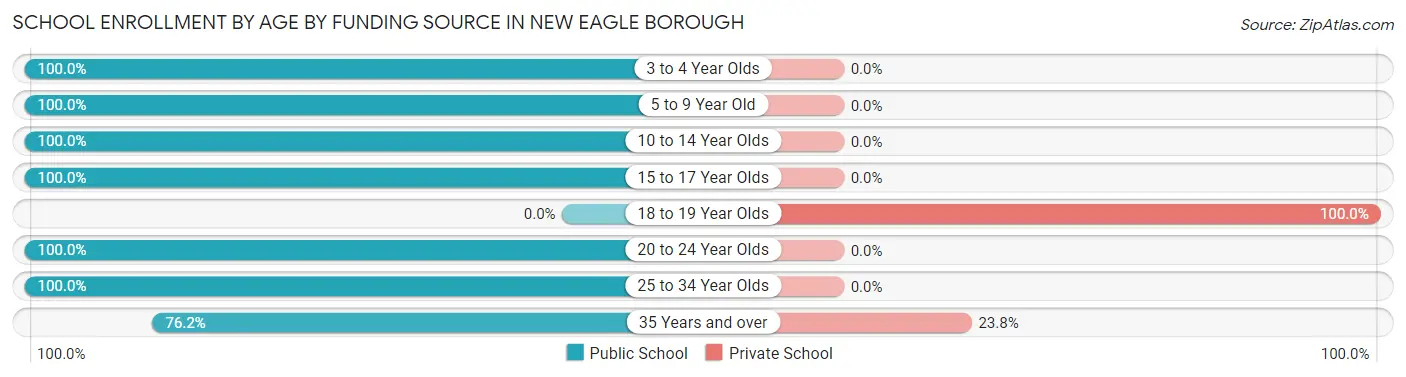
| Age Bracket | Public School | Private School |
| 3 to 4 Year Olds | 8 (100.0%) | 0 (0.0%) |
| 5 to 9 Year Old | 136 (100.0%) | 0 (0.0%) |
| 10 to 14 Year Olds | 74 (100.0%) | 0 (0.0%) |
| 15 to 17 Year Olds | 20 (100.0%) | 0 (0.0%) |
| 18 to 19 Year Olds | 0 (0.0%) | 4 (100.0%) |
| 20 to 24 Year Olds | 63 (100.0%) | 0 (0.0%) |
| 25 to 34 Year Olds | 11 (100.0%) | 0 (0.0%) |
| 35 Years and over | 16 (76.2%) | 5 (23.8%) |
| Total | 328 (97.3%) | 9 (2.7%) |
Educational Attainment by Field of Study in New Eagle borough
Education (65 | 19.0%), engineering (52 | 15.2%), arts & humanities (38 | 11.1%), literature & languages (33 | 9.7%), and computers & mathematics (30 | 8.8%) are the most common fields of study among 342 individuals in New Eagle borough who have obtained a bachelor's degree or higher.
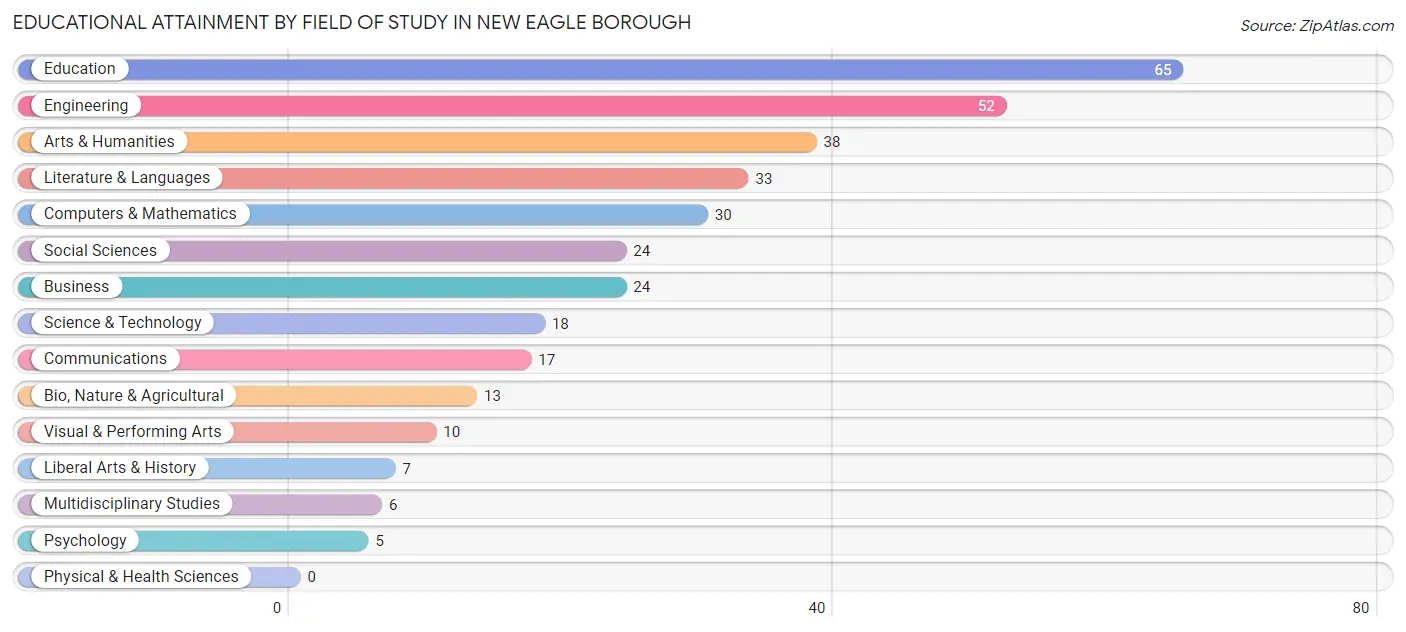
| Field of Study | # Graduates | % Graduates |
| Computers & Mathematics | 30 | 8.8% |
| Bio, Nature & Agricultural | 13 | 3.8% |
| Physical & Health Sciences | 0 | 0.0% |
| Psychology | 5 | 1.5% |
| Social Sciences | 24 | 7.0% |
| Engineering | 52 | 15.2% |
| Multidisciplinary Studies | 6 | 1.8% |
| Science & Technology | 18 | 5.3% |
| Business | 24 | 7.0% |
| Education | 65 | 19.0% |
| Literature & Languages | 33 | 9.7% |
| Liberal Arts & History | 7 | 2.1% |
| Visual & Performing Arts | 10 | 2.9% |
| Communications | 17 | 5.0% |
| Arts & Humanities | 38 | 11.1% |
| Total | 342 | 100.0% |
Transportation & Commute in New Eagle borough
Vehicle Availability by Sex in New Eagle borough
The most prevalent vehicle ownership categories in New Eagle borough are males with 2 vehicles (218, accounting for 49.9%) and females with 2 vehicles (174, making up 54.9%).
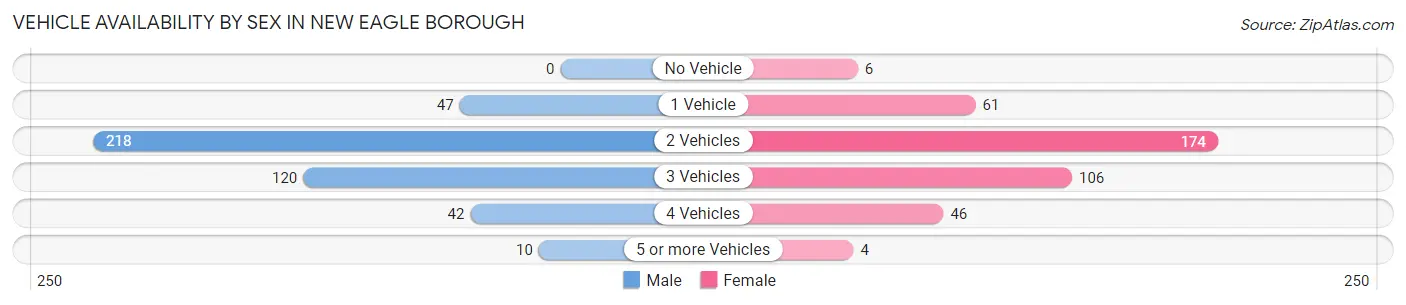
| Vehicles Available | Male | Female |
| No Vehicle | 0 (0.0%) | 6 (1.5%) |
| 1 Vehicle | 47 (10.8%) | 61 (15.4%) |
| 2 Vehicles | 218 (49.9%) | 174 (43.8%) |
| 3 Vehicles | 120 (27.5%) | 106 (26.7%) |
| 4 Vehicles | 42 (9.6%) | 46 (11.6%) |
| 5 or more Vehicles | 10 (2.3%) | 4 (1.0%) |
| Total | 437 (100.0%) | 397 (100.0%) |
Commute Time in New Eagle borough
The most frequently occuring commute durations in New Eagle borough are 30 to 34 minutes (180 commuters, 22.6%), 10 to 14 minutes (122 commuters, 15.3%), and 45 to 59 minutes (103 commuters, 12.9%).
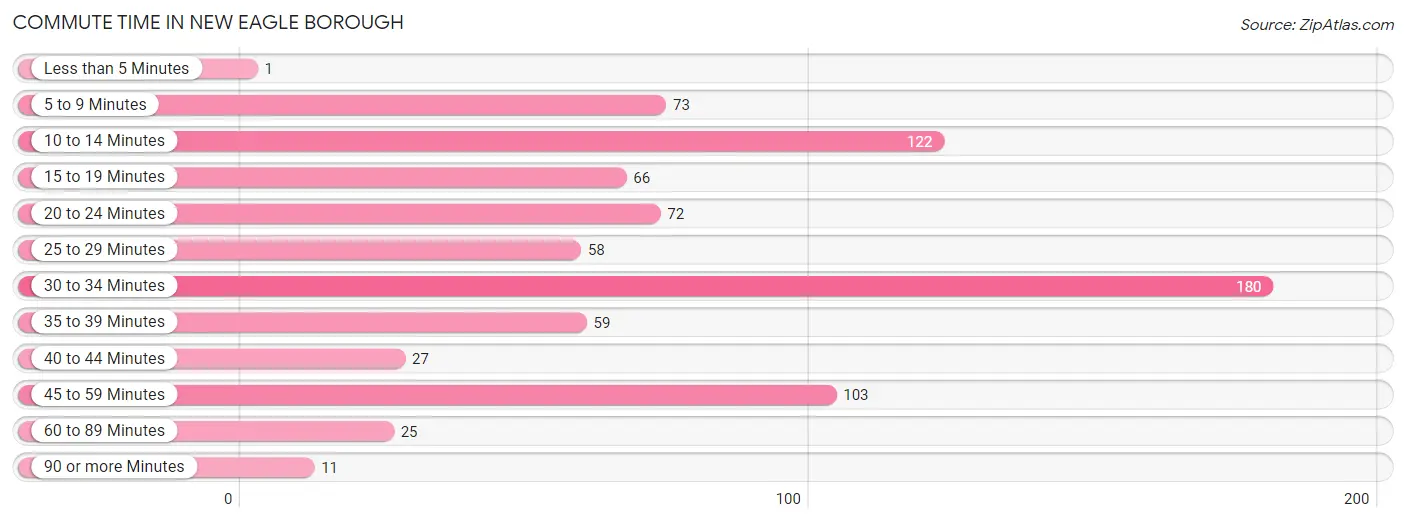
| Commute Time | # Commuters | % Commuters |
| Less than 5 Minutes | 1 | 0.1% |
| 5 to 9 Minutes | 73 | 9.2% |
| 10 to 14 Minutes | 122 | 15.3% |
| 15 to 19 Minutes | 66 | 8.3% |
| 20 to 24 Minutes | 72 | 9.0% |
| 25 to 29 Minutes | 58 | 7.3% |
| 30 to 34 Minutes | 180 | 22.6% |
| 35 to 39 Minutes | 59 | 7.4% |
| 40 to 44 Minutes | 27 | 3.4% |
| 45 to 59 Minutes | 103 | 12.9% |
| 60 to 89 Minutes | 25 | 3.1% |
| 90 or more Minutes | 11 | 1.4% |
Commute Time by Sex in New Eagle borough
The most common commute times in New Eagle borough are 10 to 14 minutes (94 commuters, 22.6%) for males and 30 to 34 minutes (101 commuters, 26.5%) for females.
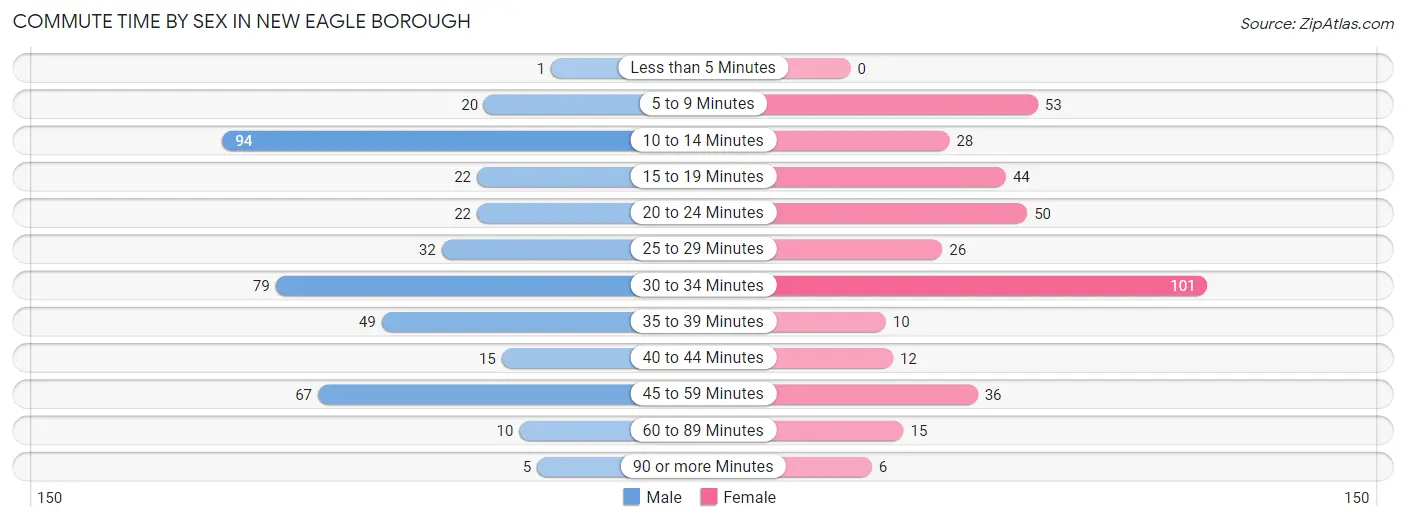
| Commute Time | Male | Female |
| Less than 5 Minutes | 1 (0.2%) | 0 (0.0%) |
| 5 to 9 Minutes | 20 (4.8%) | 53 (13.9%) |
| 10 to 14 Minutes | 94 (22.6%) | 28 (7.3%) |
| 15 to 19 Minutes | 22 (5.3%) | 44 (11.6%) |
| 20 to 24 Minutes | 22 (5.3%) | 50 (13.1%) |
| 25 to 29 Minutes | 32 (7.7%) | 26 (6.8%) |
| 30 to 34 Minutes | 79 (19.0%) | 101 (26.5%) |
| 35 to 39 Minutes | 49 (11.8%) | 10 (2.6%) |
| 40 to 44 Minutes | 15 (3.6%) | 12 (3.2%) |
| 45 to 59 Minutes | 67 (16.1%) | 36 (9.5%) |
| 60 to 89 Minutes | 10 (2.4%) | 15 (3.9%) |
| 90 or more Minutes | 5 (1.2%) | 6 (1.6%) |
Time of Departure to Work by Sex in New Eagle borough
The most frequent times of departure to work in New Eagle borough are 8:30 AM to 8:59 AM (78, 18.8%) for males and 12:00 PM to 3:59 PM (85, 22.3%) for females.
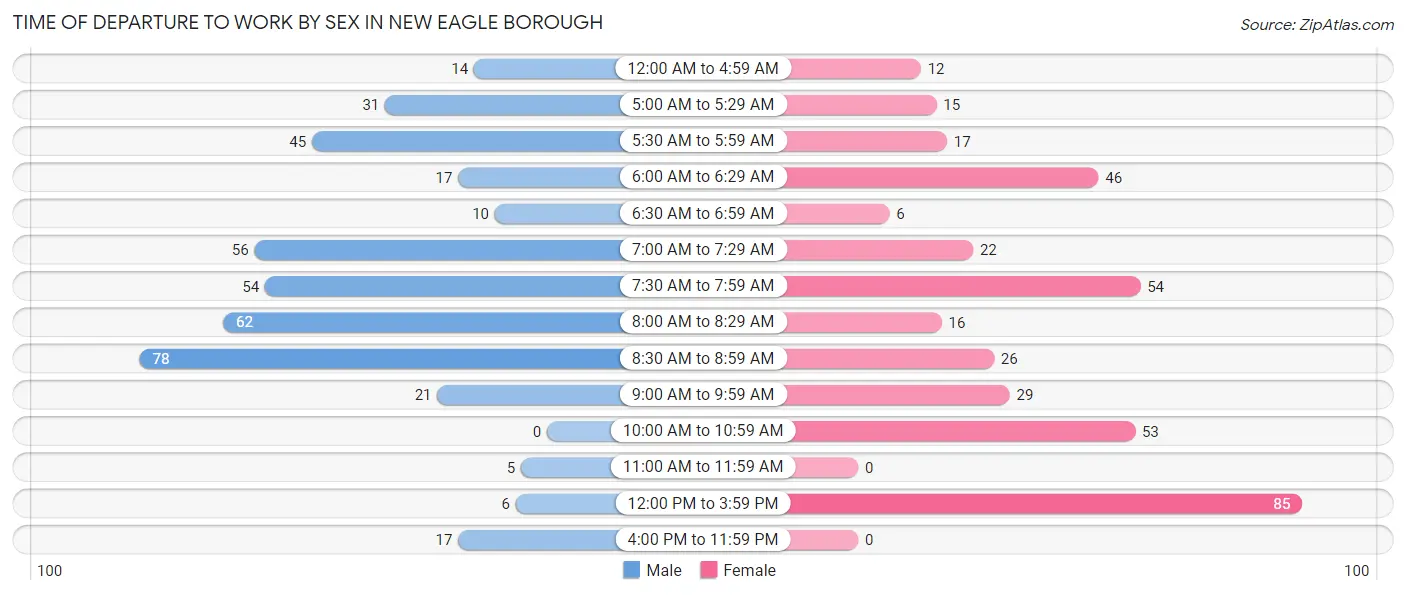
| Time of Departure | Male | Female |
| 12:00 AM to 4:59 AM | 14 (3.4%) | 12 (3.2%) |
| 5:00 AM to 5:29 AM | 31 (7.4%) | 15 (3.9%) |
| 5:30 AM to 5:59 AM | 45 (10.8%) | 17 (4.5%) |
| 6:00 AM to 6:29 AM | 17 (4.1%) | 46 (12.1%) |
| 6:30 AM to 6:59 AM | 10 (2.4%) | 6 (1.6%) |
| 7:00 AM to 7:29 AM | 56 (13.5%) | 22 (5.8%) |
| 7:30 AM to 7:59 AM | 54 (13.0%) | 54 (14.2%) |
| 8:00 AM to 8:29 AM | 62 (14.9%) | 16 (4.2%) |
| 8:30 AM to 8:59 AM | 78 (18.8%) | 26 (6.8%) |
| 9:00 AM to 9:59 AM | 21 (5.1%) | 29 (7.6%) |
| 10:00 AM to 10:59 AM | 0 (0.0%) | 53 (13.9%) |
| 11:00 AM to 11:59 AM | 5 (1.2%) | 0 (0.0%) |
| 12:00 PM to 3:59 PM | 6 (1.4%) | 85 (22.3%) |
| 4:00 PM to 11:59 PM | 17 (4.1%) | 0 (0.0%) |
| Total | 416 (100.0%) | 381 (100.0%) |
Housing Occupancy in New Eagle borough
Occupancy by Ownership in New Eagle borough
Of the total 1,053 dwellings in New Eagle borough, owner-occupied units account for 796 (75.6%), while renter-occupied units make up 257 (24.4%).
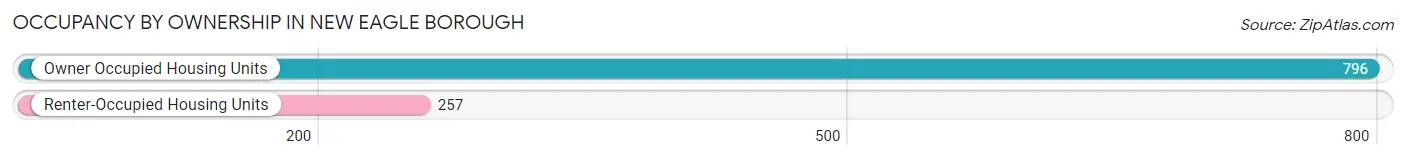
| Occupancy | # Housing Units | % Housing Units |
| Owner Occupied Housing Units | 796 | 75.6% |
| Renter-Occupied Housing Units | 257 | 24.4% |
| Total Occupied Housing Units | 1,053 | 100.0% |
Occupancy by Household Size in New Eagle borough
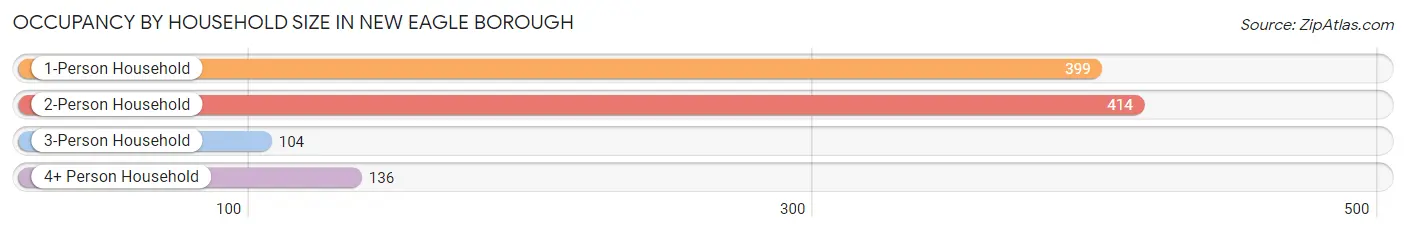
| Household Size | # Housing Units | % Housing Units |
| 1-Person Household | 399 | 37.9% |
| 2-Person Household | 414 | 39.3% |
| 3-Person Household | 104 | 9.9% |
| 4+ Person Household | 136 | 12.9% |
| Total Housing Units | 1,053 | 100.0% |
Occupancy by Ownership by Household Size in New Eagle borough
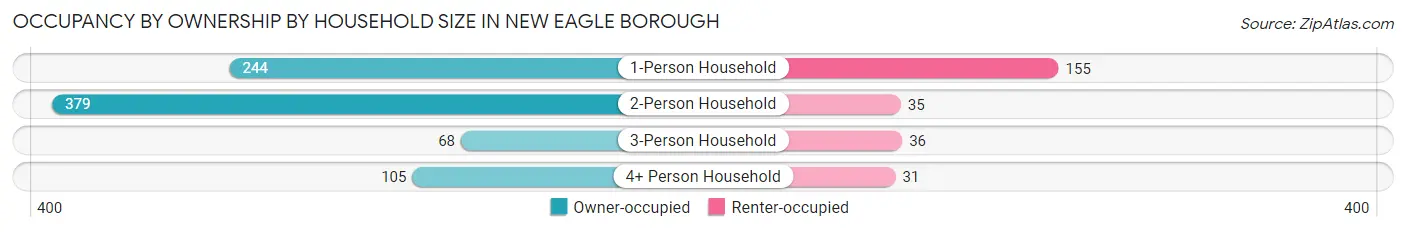
| Household Size | Owner-occupied | Renter-occupied |
| 1-Person Household | 244 (61.2%) | 155 (38.9%) |
| 2-Person Household | 379 (91.5%) | 35 (8.5%) |
| 3-Person Household | 68 (65.4%) | 36 (34.6%) |
| 4+ Person Household | 105 (77.2%) | 31 (22.8%) |
| Total Housing Units | 796 (75.6%) | 257 (24.4%) |
Occupancy by Educational Attainment in New Eagle borough
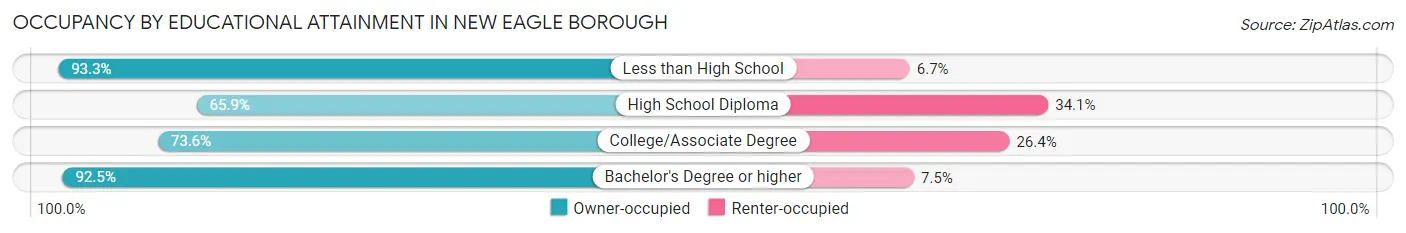
| Household Size | Owner-occupied | Renter-occupied |
| Less than High School | 84 (93.3%) | 6 (6.7%) |
| High School Diploma | 336 (65.9%) | 174 (34.1%) |
| College/Associate Degree | 167 (73.6%) | 60 (26.4%) |
| Bachelor's Degree or higher | 209 (92.5%) | 17 (7.5%) |
Occupancy by Age of Householder in New Eagle borough
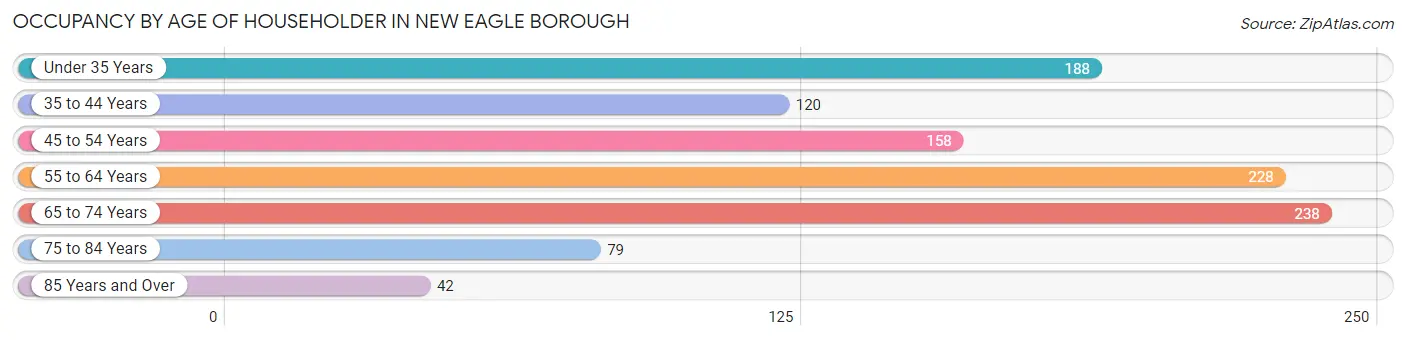
| Age Bracket | # Households | % Households |
| Under 35 Years | 188 | 17.8% |
| 35 to 44 Years | 120 | 11.4% |
| 45 to 54 Years | 158 | 15.0% |
| 55 to 64 Years | 228 | 21.6% |
| 65 to 74 Years | 238 | 22.6% |
| 75 to 84 Years | 79 | 7.5% |
| 85 Years and Over | 42 | 4.0% |
| Total | 1,053 | 100.0% |
Housing Finances in New Eagle borough
Median Income by Occupancy in New Eagle borough
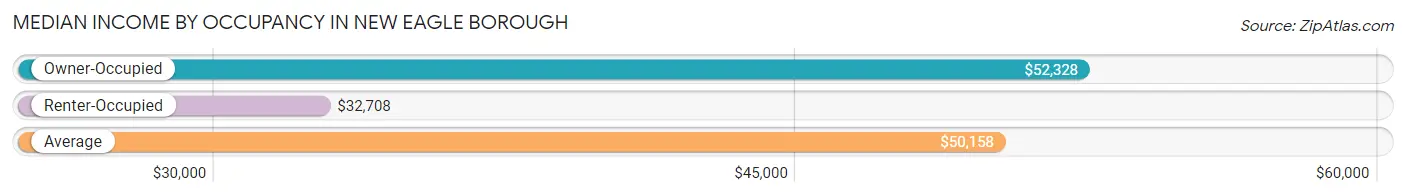
| Occupancy Type | # Households | Median Income |
| Owner-Occupied | 796 (75.6%) | $52,328 |
| Renter-Occupied | 257 (24.4%) | $32,708 |
| Average | 1,053 (100.0%) | $50,158 |
Occupancy by Householder Income Bracket in New Eagle borough
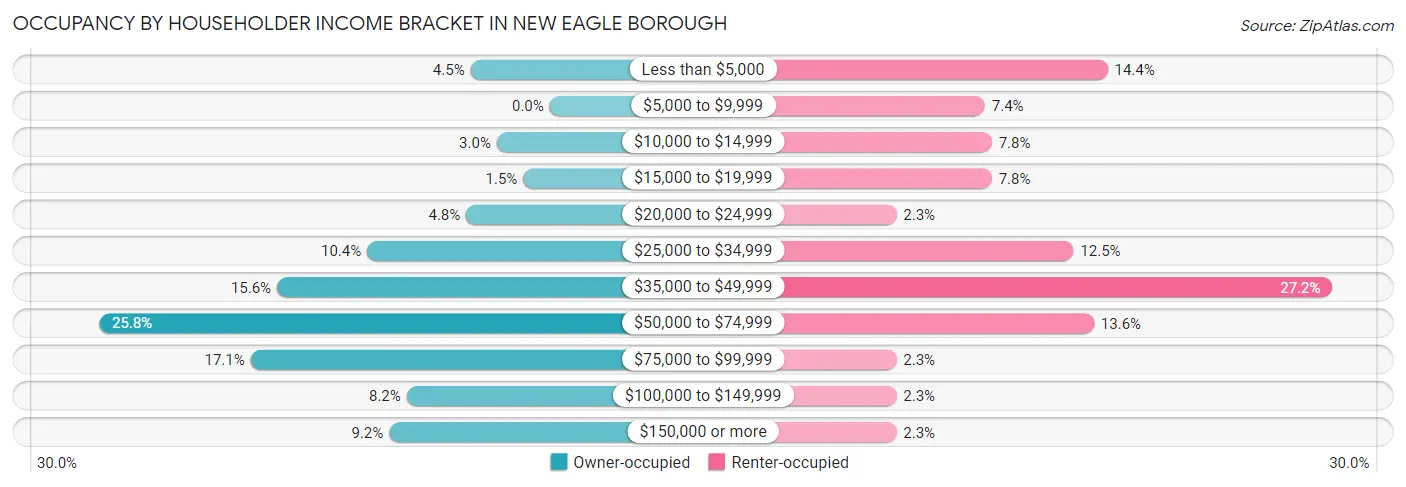
| Income Bracket | Owner-occupied | Renter-occupied |
| Less than $5,000 | 36 (4.5%) | 37 (14.4%) |
| $5,000 to $9,999 | 0 (0.0%) | 19 (7.4%) |
| $10,000 to $14,999 | 24 (3.0%) | 20 (7.8%) |
| $15,000 to $19,999 | 12 (1.5%) | 20 (7.8%) |
| $20,000 to $24,999 | 38 (4.8%) | 6 (2.3%) |
| $25,000 to $34,999 | 83 (10.4%) | 32 (12.4%) |
| $35,000 to $49,999 | 124 (15.6%) | 70 (27.2%) |
| $50,000 to $74,999 | 205 (25.8%) | 35 (13.6%) |
| $75,000 to $99,999 | 136 (17.1%) | 6 (2.3%) |
| $100,000 to $149,999 | 65 (8.2%) | 6 (2.3%) |
| $150,000 or more | 73 (9.2%) | 6 (2.3%) |
| Total | 796 (100.0%) | 257 (100.0%) |
Monthly Housing Cost Tiers in New Eagle borough
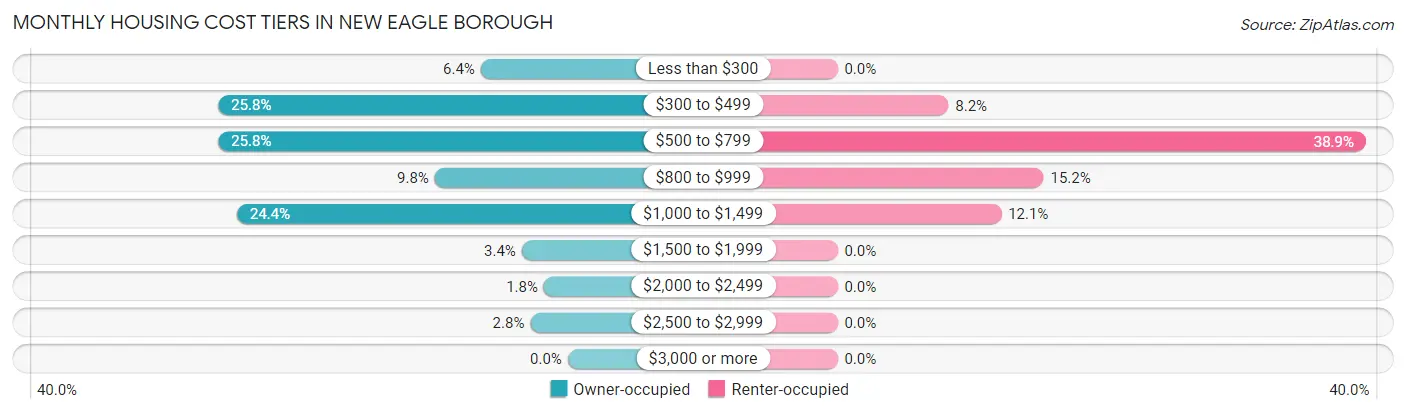
| Monthly Cost | Owner-occupied | Renter-occupied |
| Less than $300 | 51 (6.4%) | 0 (0.0%) |
| $300 to $499 | 205 (25.8%) | 21 (8.2%) |
| $500 to $799 | 205 (25.8%) | 100 (38.9%) |
| $800 to $999 | 78 (9.8%) | 39 (15.2%) |
| $1,000 to $1,499 | 194 (24.4%) | 31 (12.1%) |
| $1,500 to $1,999 | 27 (3.4%) | 0 (0.0%) |
| $2,000 to $2,499 | 14 (1.8%) | 0 (0.0%) |
| $2,500 to $2,999 | 22 (2.8%) | 0 (0.0%) |
| $3,000 or more | 0 (0.0%) | 0 (0.0%) |
| Total | 796 (100.0%) | 257 (100.0%) |
Physical Housing Characteristics in New Eagle borough
Housing Structures in New Eagle borough
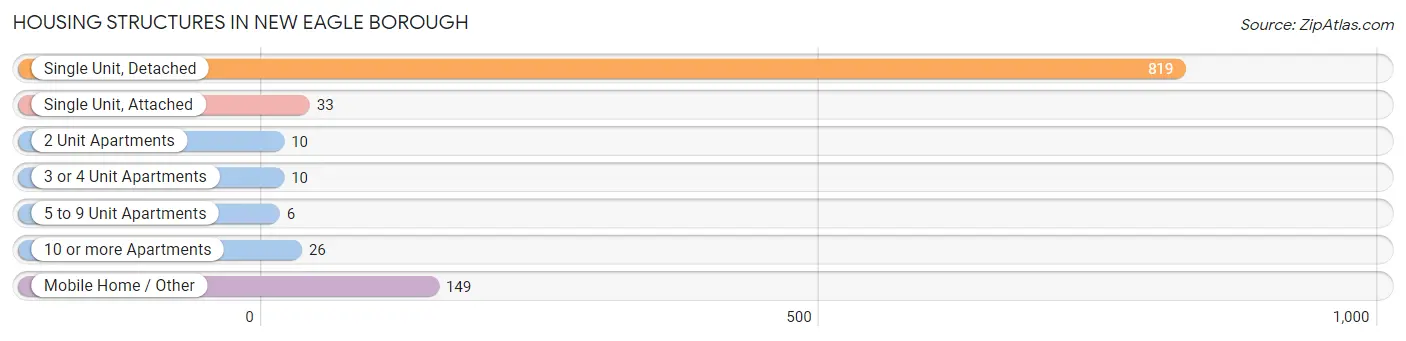
| Structure Type | # Housing Units | % Housing Units |
| Single Unit, Detached | 819 | 77.8% |
| Single Unit, Attached | 33 | 3.1% |
| 2 Unit Apartments | 10 | 0.9% |
| 3 or 4 Unit Apartments | 10 | 0.9% |
| 5 to 9 Unit Apartments | 6 | 0.6% |
| 10 or more Apartments | 26 | 2.5% |
| Mobile Home / Other | 149 | 14.1% |
| Total | 1,053 | 100.0% |
Housing Structures by Occupancy in New Eagle borough
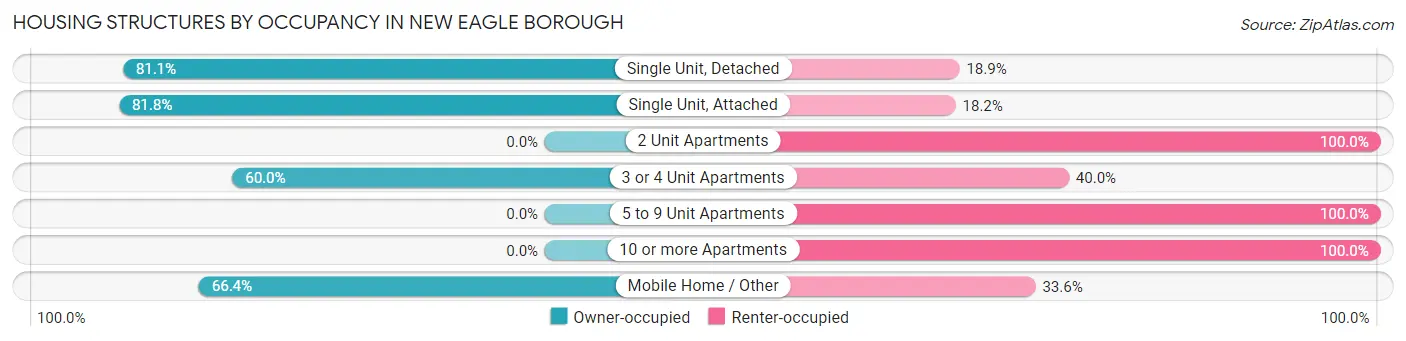
| Structure Type | Owner-occupied | Renter-occupied |
| Single Unit, Detached | 664 (81.1%) | 155 (18.9%) |
| Single Unit, Attached | 27 (81.8%) | 6 (18.2%) |
| 2 Unit Apartments | 0 (0.0%) | 10 (100.0%) |
| 3 or 4 Unit Apartments | 6 (60.0%) | 4 (40.0%) |
| 5 to 9 Unit Apartments | 0 (0.0%) | 6 (100.0%) |
| 10 or more Apartments | 0 (0.0%) | 26 (100.0%) |
| Mobile Home / Other | 99 (66.4%) | 50 (33.6%) |
| Total | 796 (75.6%) | 257 (24.4%) |
Housing Structures by Number of Rooms in New Eagle borough
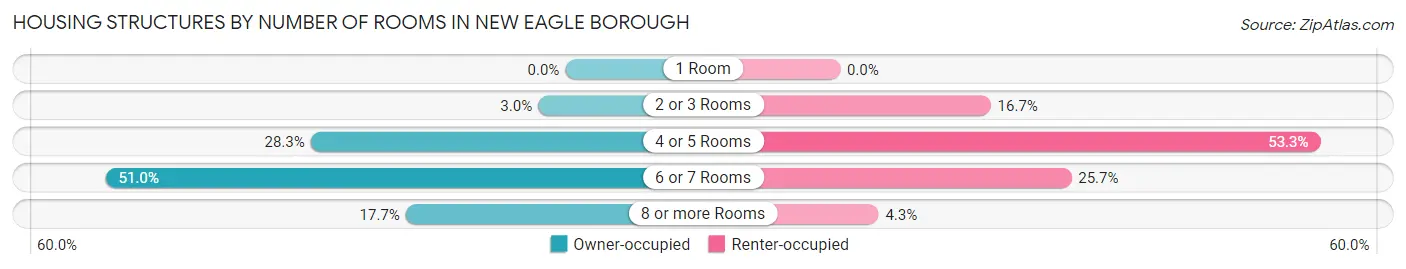
| Number of Rooms | Owner-occupied | Renter-occupied |
| 1 Room | 0 (0.0%) | 0 (0.0%) |
| 2 or 3 Rooms | 24 (3.0%) | 43 (16.7%) |
| 4 or 5 Rooms | 225 (28.3%) | 137 (53.3%) |
| 6 or 7 Rooms | 406 (51.0%) | 66 (25.7%) |
| 8 or more Rooms | 141 (17.7%) | 11 (4.3%) |
| Total | 796 (100.0%) | 257 (100.0%) |
Housing Structure by Heating Type in New Eagle borough
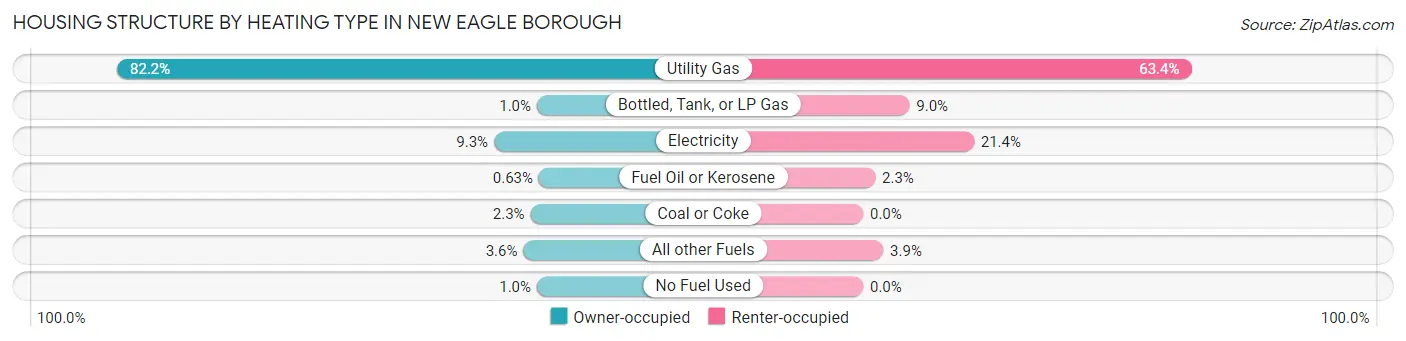
| Heating Type | Owner-occupied | Renter-occupied |
| Utility Gas | 654 (82.2%) | 163 (63.4%) |
| Bottled, Tank, or LP Gas | 8 (1.0%) | 23 (8.9%) |
| Electricity | 74 (9.3%) | 55 (21.4%) |
| Fuel Oil or Kerosene | 5 (0.6%) | 6 (2.3%) |
| Coal or Coke | 18 (2.3%) | 0 (0.0%) |
| All other Fuels | 29 (3.6%) | 10 (3.9%) |
| No Fuel Used | 8 (1.0%) | 0 (0.0%) |
| Total | 796 (100.0%) | 257 (100.0%) |
Household Vehicle Usage in New Eagle borough
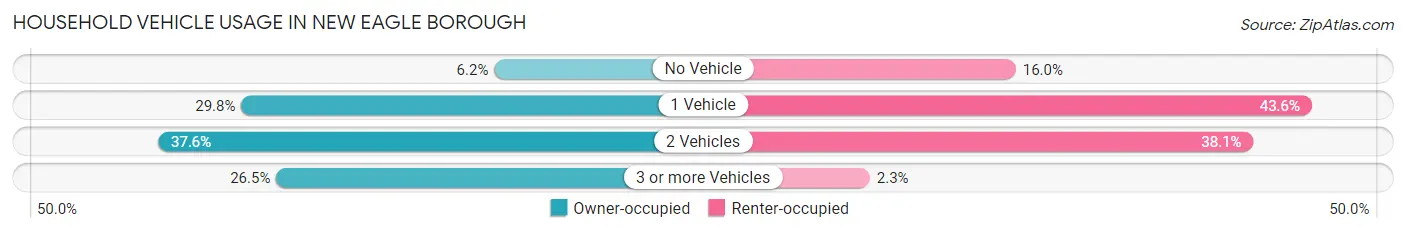
| Vehicles per Household | Owner-occupied | Renter-occupied |
| No Vehicle | 49 (6.2%) | 41 (16.0%) |
| 1 Vehicle | 237 (29.8%) | 112 (43.6%) |
| 2 Vehicles | 299 (37.6%) | 98 (38.1%) |
| 3 or more Vehicles | 211 (26.5%) | 6 (2.3%) |
| Total | 796 (100.0%) | 257 (100.0%) |
Real Estate & Mortgages in New Eagle borough
Real Estate and Mortgage Overview in New Eagle borough
| Characteristic | Without Mortgage | With Mortgage |
| Housing Units | 464 | 332 |
| Median Property Value | $93,500 | $143,200 |
| Median Household Income | $47,222 | $38 |
| Monthly Housing Costs | $484 | $0 |
| Real Estate Taxes | $1,492 | $0 |
Property Value by Mortgage Status in New Eagle borough
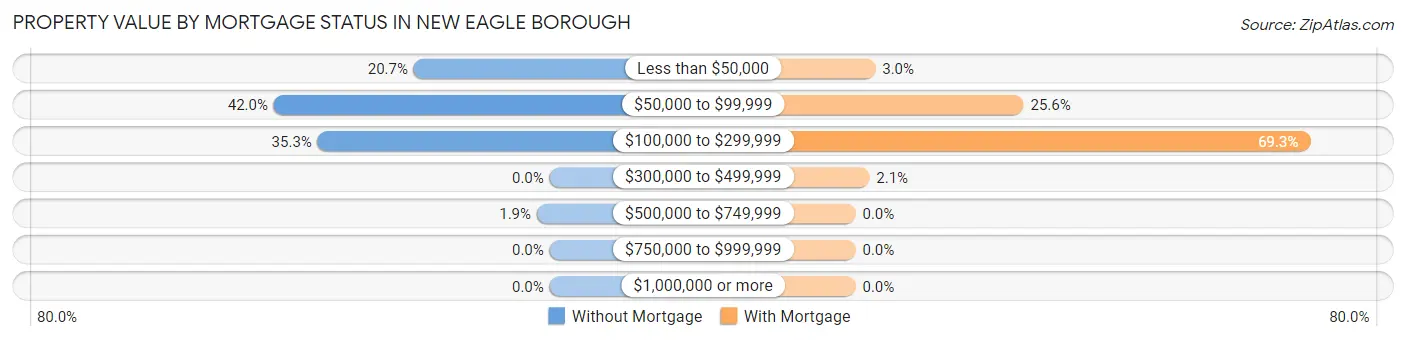
| Property Value | Without Mortgage | With Mortgage |
| Less than $50,000 | 96 (20.7%) | 10 (3.0%) |
| $50,000 to $99,999 | 195 (42.0%) | 85 (25.6%) |
| $100,000 to $299,999 | 164 (35.3%) | 230 (69.3%) |
| $300,000 to $499,999 | 0 (0.0%) | 7 (2.1%) |
| $500,000 to $749,999 | 9 (1.9%) | 0 (0.0%) |
| $750,000 to $999,999 | 0 (0.0%) | 0 (0.0%) |
| $1,000,000 or more | 0 (0.0%) | 0 (0.0%) |
| Total | 464 (100.0%) | 332 (100.0%) |
Household Income by Mortgage Status in New Eagle borough
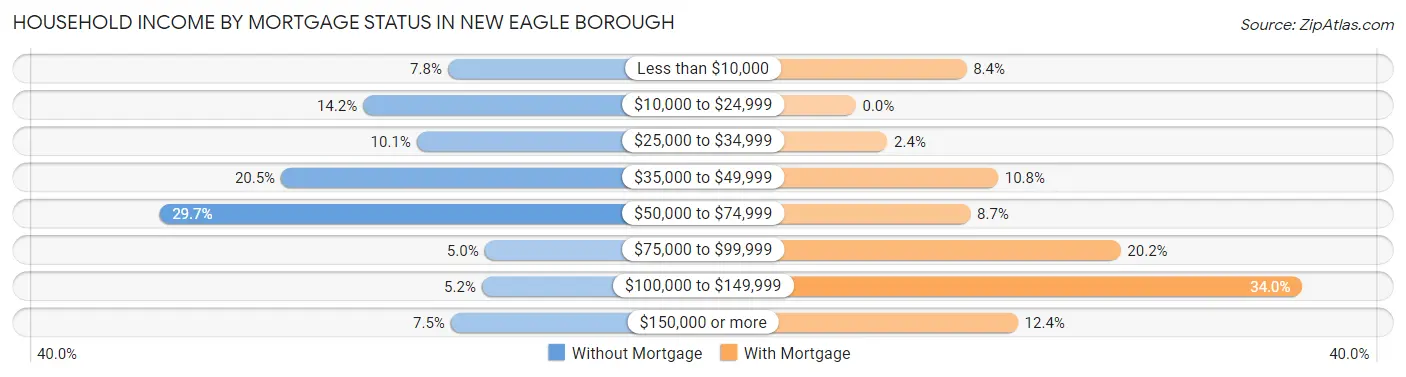
| Household Income | Without Mortgage | With Mortgage |
| Less than $10,000 | 36 (7.8%) | 28 (8.4%) |
| $10,000 to $24,999 | 66 (14.2%) | 0 (0.0%) |
| $25,000 to $34,999 | 47 (10.1%) | 8 (2.4%) |
| $35,000 to $49,999 | 95 (20.5%) | 36 (10.8%) |
| $50,000 to $74,999 | 138 (29.7%) | 29 (8.7%) |
| $75,000 to $99,999 | 23 (5.0%) | 67 (20.2%) |
| $100,000 to $149,999 | 24 (5.2%) | 113 (34.0%) |
| $150,000 or more | 35 (7.5%) | 41 (12.3%) |
| Total | 464 (100.0%) | 332 (100.0%) |
Property Value to Household Income Ratio in New Eagle borough
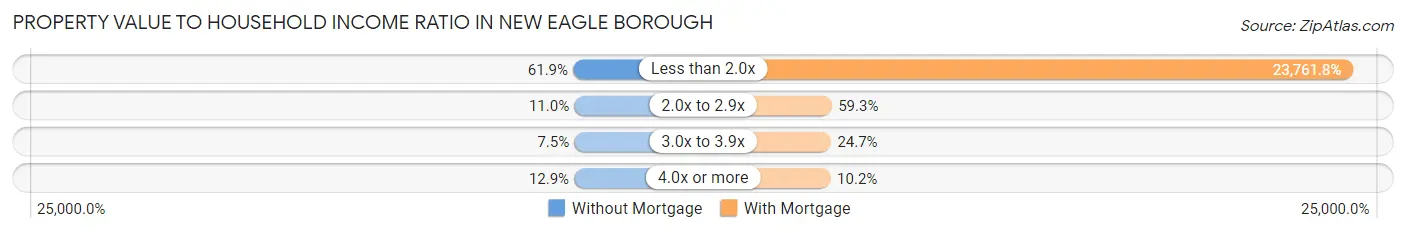
| Value-to-Income Ratio | Without Mortgage | With Mortgage |
| Less than 2.0x | 287 (61.9%) | 78,889 (23,761.8%) |
| 2.0x to 2.9x | 51 (11.0%) | 197 (59.3%) |
| 3.0x to 3.9x | 35 (7.5%) | 82 (24.7%) |
| 4.0x or more | 60 (12.9%) | 34 (10.2%) |
| Total | 464 (100.0%) | 332 (100.0%) |
Real Estate Taxes by Mortgage Status in New Eagle borough
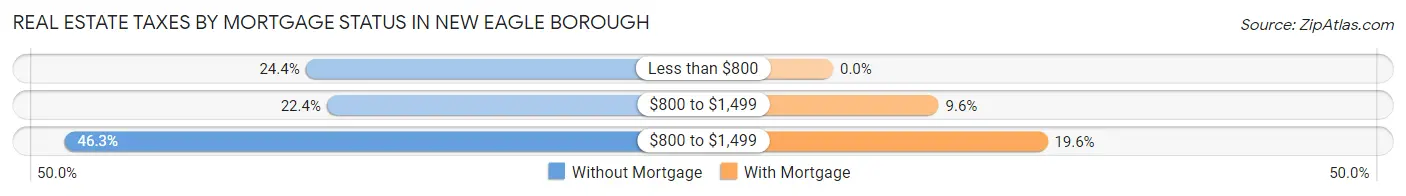
| Property Taxes | Without Mortgage | With Mortgage |
| Less than $800 | 113 (24.3%) | 0 (0.0%) |
| $800 to $1,499 | 104 (22.4%) | 32 (9.6%) |
| $800 to $1,499 | 215 (46.3%) | 65 (19.6%) |
| Total | 464 (100.0%) | 332 (100.0%) |
Health & Disability in New Eagle borough
Health Insurance Coverage by Age in New Eagle borough
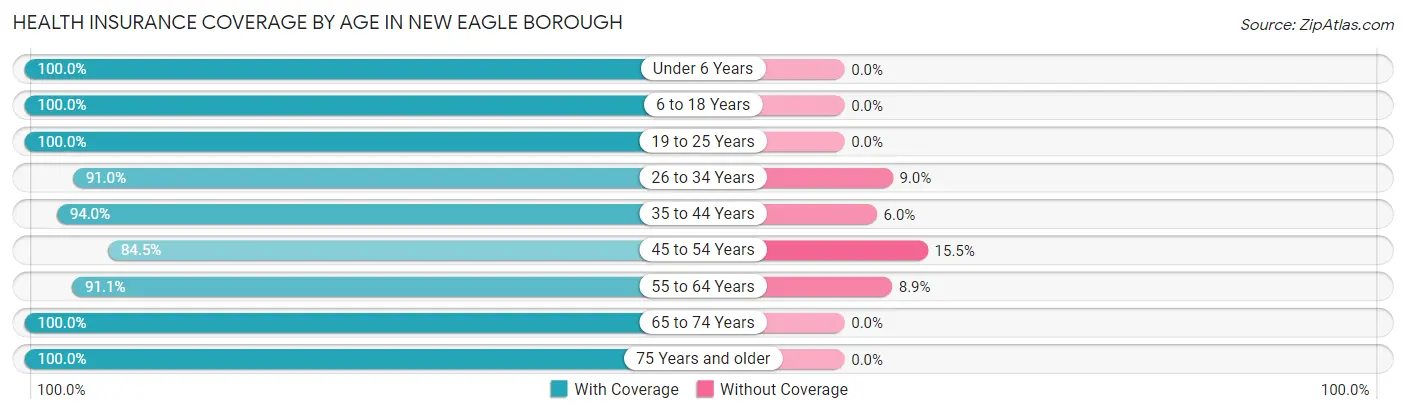
| Age Bracket | With Coverage | Without Coverage |
| Under 6 Years | 142 (100.0%) | 0 (0.0%) |
| 6 to 18 Years | 179 (100.0%) | 0 (0.0%) |
| 19 to 25 Years | 158 (100.0%) | 0 (0.0%) |
| 26 to 34 Years | 294 (91.0%) | 29 (9.0%) |
| 35 to 44 Years | 203 (94.0%) | 13 (6.0%) |
| 45 to 54 Years | 212 (84.5%) | 39 (15.5%) |
| 55 to 64 Years | 288 (91.1%) | 28 (8.9%) |
| 65 to 74 Years | 417 (100.0%) | 0 (0.0%) |
| 75 Years and older | 162 (100.0%) | 0 (0.0%) |
| Total | 2,055 (95.0%) | 109 (5.0%) |
Health Insurance Coverage by Citizenship Status in New Eagle borough
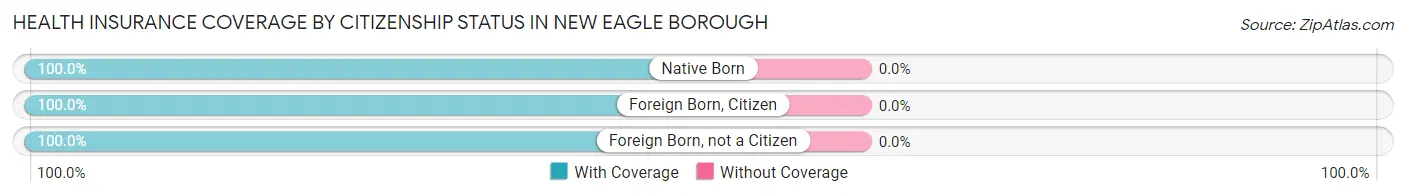
| Citizenship Status | With Coverage | Without Coverage |
| Native Born | 142 (100.0%) | 0 (0.0%) |
| Foreign Born, Citizen | 179 (100.0%) | 0 (0.0%) |
| Foreign Born, not a Citizen | 158 (100.0%) | 0 (0.0%) |
Health Insurance Coverage by Household Income in New Eagle borough
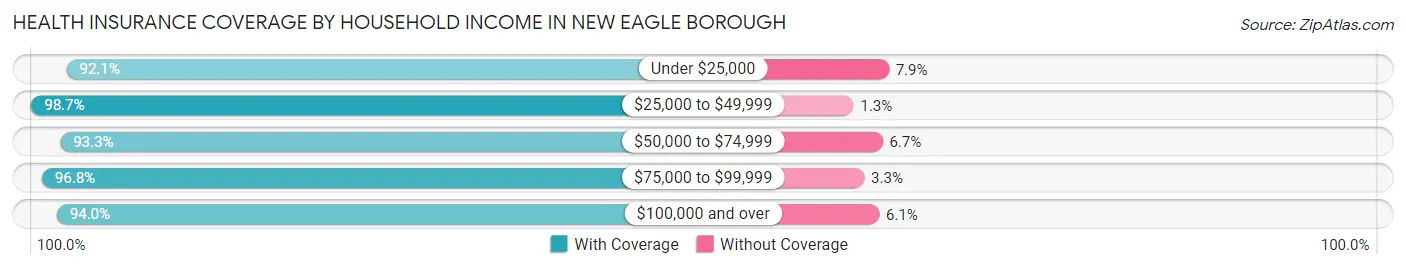
| Household Income | With Coverage | Without Coverage |
| Under $25,000 | 293 (92.1%) | 25 (7.9%) |
| $25,000 to $49,999 | 469 (98.7%) | 6 (1.3%) |
| $50,000 to $74,999 | 559 (93.3%) | 40 (6.7%) |
| $75,000 to $99,999 | 327 (96.8%) | 11 (3.3%) |
| $100,000 and over | 404 (94.0%) | 26 (6.0%) |
Public vs Private Health Insurance Coverage by Age in New Eagle borough
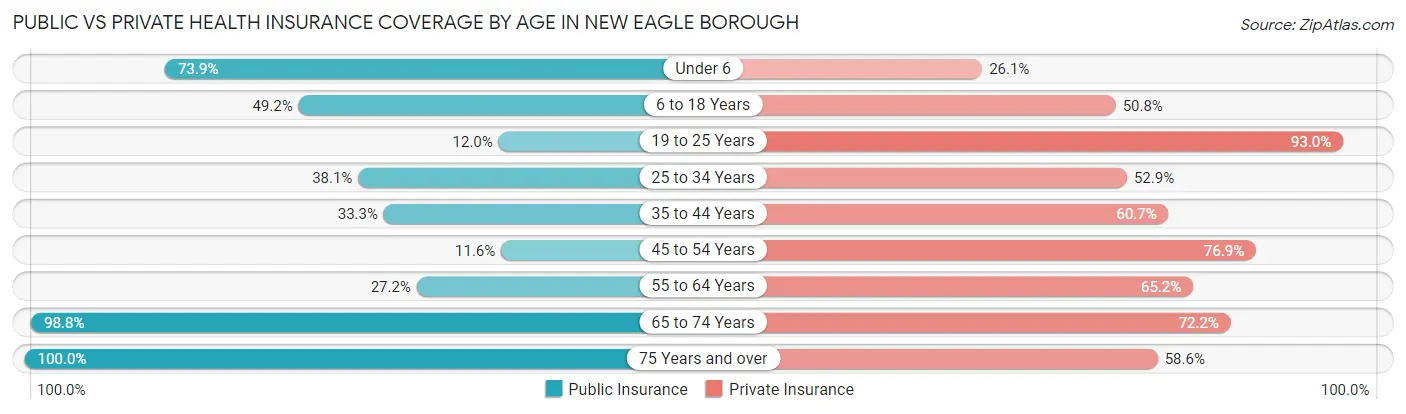
| Age Bracket | Public Insurance | Private Insurance |
| Under 6 | 105 (73.9%) | 37 (26.1%) |
| 6 to 18 Years | 88 (49.2%) | 91 (50.8%) |
| 19 to 25 Years | 19 (12.0%) | 147 (93.0%) |
| 25 to 34 Years | 123 (38.1%) | 171 (52.9%) |
| 35 to 44 Years | 72 (33.3%) | 131 (60.7%) |
| 45 to 54 Years | 29 (11.6%) | 193 (76.9%) |
| 55 to 64 Years | 86 (27.2%) | 206 (65.2%) |
| 65 to 74 Years | 412 (98.8%) | 301 (72.2%) |
| 75 Years and over | 162 (100.0%) | 95 (58.6%) |
| Total | 1,096 (50.6%) | 1,372 (63.4%) |
Disability Status by Sex by Age in New Eagle borough
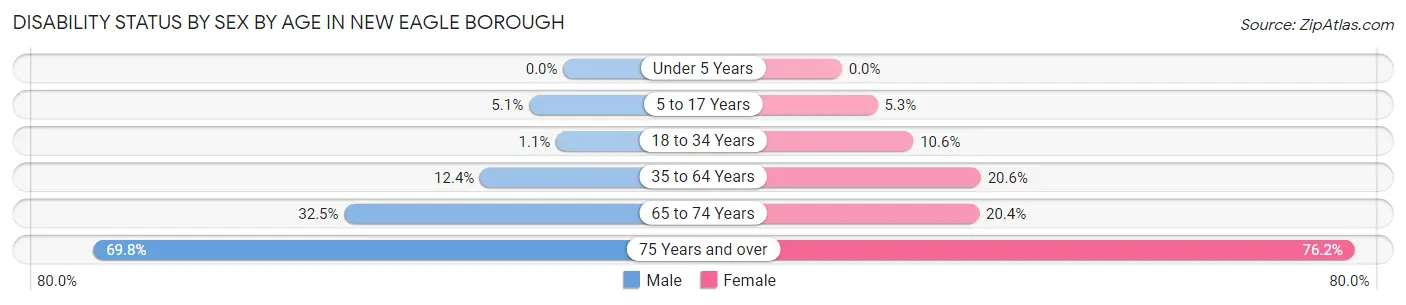
| Age Bracket | Male | Female |
| Under 5 Years | 0 (0.0%) | 0 (0.0%) |
| 5 to 17 Years | 5 (5.1%) | 7 (5.3%) |
| 18 to 34 Years | 3 (1.1%) | 21 (10.6%) |
| 35 to 64 Years | 50 (12.3%) | 78 (20.6%) |
| 65 to 74 Years | 67 (32.5%) | 43 (20.4%) |
| 75 Years and over | 37 (69.8%) | 83 (76.1%) |
Disability Class by Sex by Age in New Eagle borough
Disability Class: Hearing Difficulty
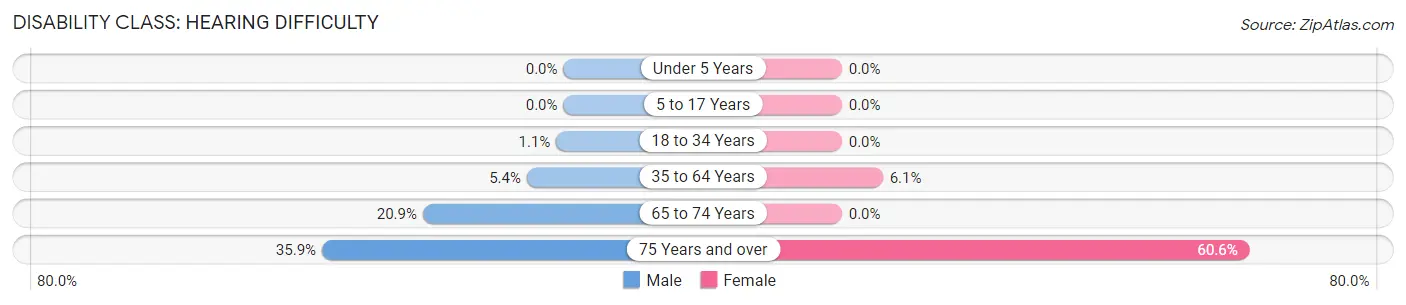
| Age Bracket | Male | Female |
| Under 5 Years | 0 (0.0%) | 0 (0.0%) |
| 5 to 17 Years | 0 (0.0%) | 0 (0.0%) |
| 18 to 34 Years | 3 (1.1%) | 0 (0.0%) |
| 35 to 64 Years | 22 (5.4%) | 23 (6.1%) |
| 65 to 74 Years | 43 (20.9%) | 0 (0.0%) |
| 75 Years and over | 19 (35.8%) | 66 (60.6%) |
Disability Class: Vision Difficulty
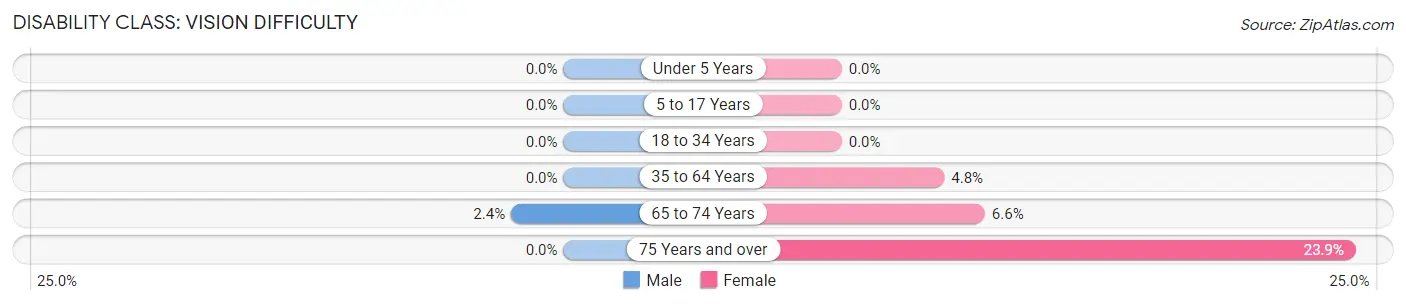
| Age Bracket | Male | Female |
| Under 5 Years | 0 (0.0%) | 0 (0.0%) |
| 5 to 17 Years | 0 (0.0%) | 0 (0.0%) |
| 18 to 34 Years | 0 (0.0%) | 0 (0.0%) |
| 35 to 64 Years | 0 (0.0%) | 18 (4.8%) |
| 65 to 74 Years | 5 (2.4%) | 14 (6.6%) |
| 75 Years and over | 0 (0.0%) | 26 (23.8%) |
Disability Class: Cognitive Difficulty
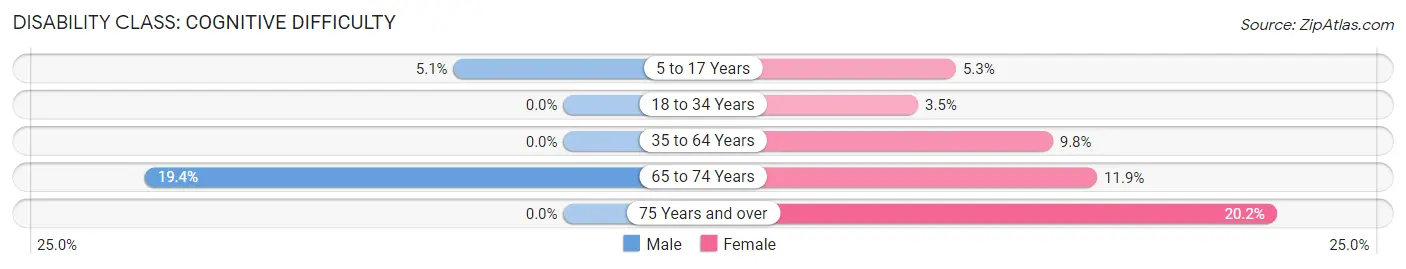
| Age Bracket | Male | Female |
| 5 to 17 Years | 5 (5.1%) | 7 (5.3%) |
| 18 to 34 Years | 0 (0.0%) | 7 (3.5%) |
| 35 to 64 Years | 0 (0.0%) | 37 (9.8%) |
| 65 to 74 Years | 40 (19.4%) | 25 (11.8%) |
| 75 Years and over | 0 (0.0%) | 22 (20.2%) |
Disability Class: Ambulatory Difficulty
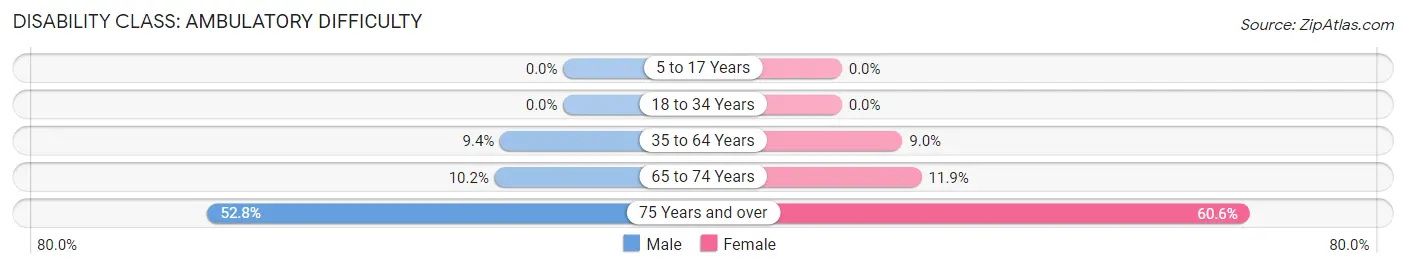
| Age Bracket | Male | Female |
| 5 to 17 Years | 0 (0.0%) | 0 (0.0%) |
| 18 to 34 Years | 0 (0.0%) | 0 (0.0%) |
| 35 to 64 Years | 38 (9.4%) | 34 (9.0%) |
| 65 to 74 Years | 21 (10.2%) | 25 (11.8%) |
| 75 Years and over | 28 (52.8%) | 66 (60.6%) |
Disability Class: Self-Care Difficulty
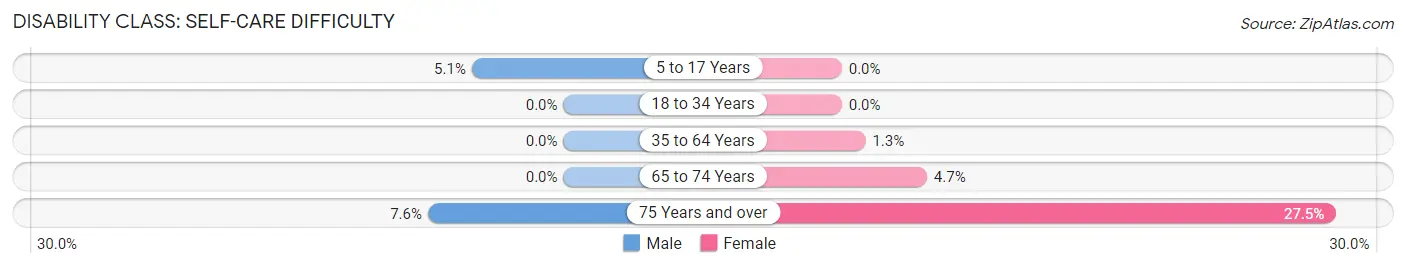
| Age Bracket | Male | Female |
| 5 to 17 Years | 5 (5.1%) | 0 (0.0%) |
| 18 to 34 Years | 0 (0.0%) | 0 (0.0%) |
| 35 to 64 Years | 0 (0.0%) | 5 (1.3%) |
| 65 to 74 Years | 0 (0.0%) | 10 (4.7%) |
| 75 Years and over | 4 (7.5%) | 30 (27.5%) |
Technology Access in New Eagle borough
Computing Device Access in New Eagle borough
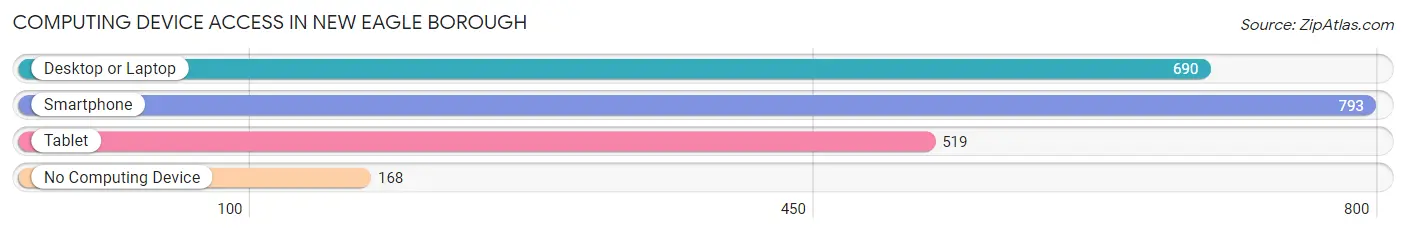
| Device Type | # Households | % Households |
| Desktop or Laptop | 690 | 65.5% |
| Smartphone | 793 | 75.3% |
| Tablet | 519 | 49.3% |
| No Computing Device | 168 | 16.0% |
| Total | 1,053 | 100.0% |
Internet Access in New Eagle borough
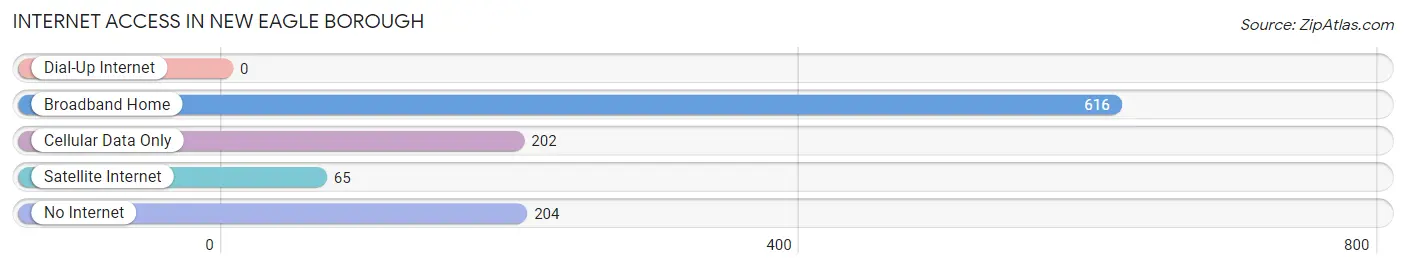
| Internet Type | # Households | % Households |
| Dial-Up Internet | 0 | 0.0% |
| Broadband Home | 616 | 58.5% |
| Cellular Data Only | 202 | 19.2% |
| Satellite Internet | 65 | 6.2% |
| No Internet | 204 | 19.4% |
| Total | 1,053 | 100.0% |
New Eagle borough Summary
Eagle Borough is a borough located in the state of Pennsylvania, in the United States of America. It is located in the southwestern corner of the state, in the county of Berks. The borough is situated in the Schuylkill Valley, a region of the state known for its rolling hills and lush farmland. The borough is home to a population of approximately 2,500 people, and is part of the Reading, PA Metropolitan Statistical Area.
History
The area that is now Eagle Borough was first settled in the late 1700s by German immigrants. The area was originally known as “Eagle Valley”, and was part of the larger township of Bern. In 1845, the area was officially incorporated as a borough, and was named after the nearby Eagle Mountain. The borough was a small farming community for much of its early history, and remained relatively isolated until the late 19th century.
In the late 1800s, the borough began to experience a period of growth and development. The Reading Railroad was extended to the borough in 1891, and the area began to attract new businesses and industries. The borough also became a popular destination for vacationers, and several resorts were built in the area.
Geography
Eagle Borough is located in the southwestern corner of the state of Pennsylvania, in the county of Berks. The borough is situated in the Schuylkill Valley, a region of the state known for its rolling hills and lush farmland. The borough is bordered to the north by the borough of Bern, to the east by the borough of Shillington, to the south by the borough of West Reading, and to the west by the borough of Wyomissing.
The borough covers an area of 1.3 square miles, and is home to a population of approximately 2,500 people. The borough is located at an elevation of approximately 500 feet above sea level. The climate of the area is classified as humid continental, with hot summers and cold winters.
Economy
The economy of Eagle Borough is largely based on agriculture and tourism. The area is home to several farms, which produce a variety of crops, including corn, soybeans, and wheat. The borough is also home to several resorts, which attract visitors from all over the region.
In addition to agriculture and tourism, the borough is also home to several small businesses, including restaurants, retail stores, and professional services. The borough is also home to several manufacturing companies, which produce a variety of products, including furniture, clothing, and electronics.
Demographics
As of the 2010 census, the population of Eagle Borough was 2,500. The racial makeup of the borough was 94.2% White, 2.2% African American, 0.4% Native American, 0.8% Asian, 0.2% Pacific Islander, and 1.4% from other races. Hispanic or Latino of any race were 2.2% of the population.
The median household income in the borough was $50,000, and the median family income was $60,000. The per capita income in the borough was $25,000. Approximately 8.5% of the population was below the poverty line.
Conclusion
Eagle Borough is a small borough located in the southwestern corner of the state of Pennsylvania. The borough is situated in the Schuylkill Valley, a region of the state known for its rolling hills and lush farmland. The borough is home to a population of approximately 2,500 people, and is part of the Reading, PA Metropolitan Statistical Area. The economy of the borough is largely based on agriculture and tourism, and the area is home to several small businesses, manufacturing companies, and resorts. The racial makeup of the borough is predominantly White, with a small percentage of African American, Native American, Asian, and Pacific Islander residents. The median household income in the borough is $50,000, and the per capita income is $25,000.
Common Questions
What is Per Capita Income in New Eagle borough?
Per Capita income in New Eagle borough is $31,790.
What is the Median Family Income in New Eagle borough?
Median Family Income in New Eagle borough is $67,727.
What is the Median Household income in New Eagle borough?
Median Household Income in New Eagle borough is $50,158.
What is Income or Wage Gap in New Eagle borough?
Income or Wage Gap in New Eagle borough is 35.4%.
Women in New Eagle borough earn 64.6 cents for every dollar earned by a man.
What is Inequality or Gini Index in New Eagle borough?
Inequality or Gini Index in New Eagle borough is 0.45.
What is the Total Population of New Eagle borough?
Total Population of New Eagle borough is 2,164.
What is the Total Male Population of New Eagle borough?
Total Male Population of New Eagle borough is 1,130.
What is the Total Female Population of New Eagle borough?
Total Female Population of New Eagle borough is 1,034.
What is the Ratio of Males per 100 Females in New Eagle borough?
There are 109.28 Males per 100 Females in New Eagle borough.
What is the Ratio of Females per 100 Males in New Eagle borough?
There are 91.50 Females per 100 Males in New Eagle borough.
What is the Median Population Age in New Eagle borough?
Median Population Age in New Eagle borough is 48.9 Years.
What is the Average Family Size in New Eagle borough
Average Family Size in New Eagle borough is 2.7 People.
What is the Average Household Size in New Eagle borough
Average Household Size in New Eagle borough is 2.0 People.
How Large is the Labor Force in New Eagle borough?
There are 1,005 People in the Labor Forcein in New Eagle borough.
What is the Percentage of People in the Labor Force in New Eagle borough?
54.1% of People are in the Labor Force in New Eagle borough.
What is the Unemployment Rate in New Eagle borough?
Unemployment Rate in New Eagle borough is 14.1%.