Jonestown borough, PA Map & Demographics
Jonestown borough Overview
$34,872
PER CAPITA INCOME
$108,882
AVG FAMILY INCOME
$95,792
AVG HOUSEHOLD INCOME
22.6%
WAGE / INCOME GAP [ % ]
77.4¢/ $1
WAGE / INCOME GAP [ $ ]
0.33
INEQUALITY / GINI INDEX
1,979
TOTAL POPULATION
1,056
MALE POPULATION
923
FEMALE POPULATION
114.41
MALES / 100 FEMALES
87.41
FEMALES / 100 MALES
32.5
MEDIAN AGE
3.2
AVG FAMILY SIZE
2.8
AVG HOUSEHOLD SIZE
1,124
LABOR FORCE [ PEOPLE ]
72.8%
PERCENT IN LABOR FORCE
4.3%
UNEMPLOYMENT RATE
Income in Jonestown borough
Income Overview in Jonestown borough
Per Capita Income in Jonestown borough is $34,872, while median incomes of families and households are $108,882 and $95,792 respectively.
| Characteristic | Number | Measure |
| Per Capita Income | 1,979 | $34,872 |
| Median Family Income | 531 | $108,882 |
| Mean Family Income | 531 | $107,143 |
| Median Household Income | 697 | $95,792 |
| Mean Household Income | 697 | $98,950 |
| Income Deficit | 531 | $0 |
| Wage / Income Gap (%) | 1,979 | 22.63% |
| Wage / Income Gap ($) | 1,979 | 77.37¢ per $1 |
| Gini / Inequality Index | 1,979 | 0.33 |
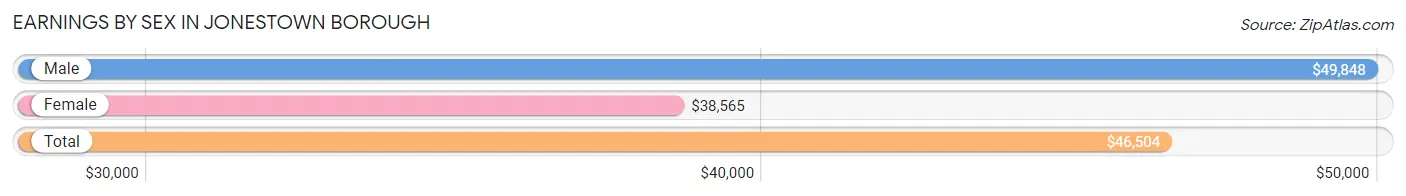
Earnings by Sex in Jonestown borough
Average Earnings in Jonestown borough are $46,504, $49,848 for men and $38,565 for women, a difference of 22.6%.
| Sex | Number | Average Earnings |
| Male | 622 (52.8%) | $49,848 |
| Female | 555 (47.1%) | $38,565 |
| Total | 1,177 (100.0%) | $46,504 |
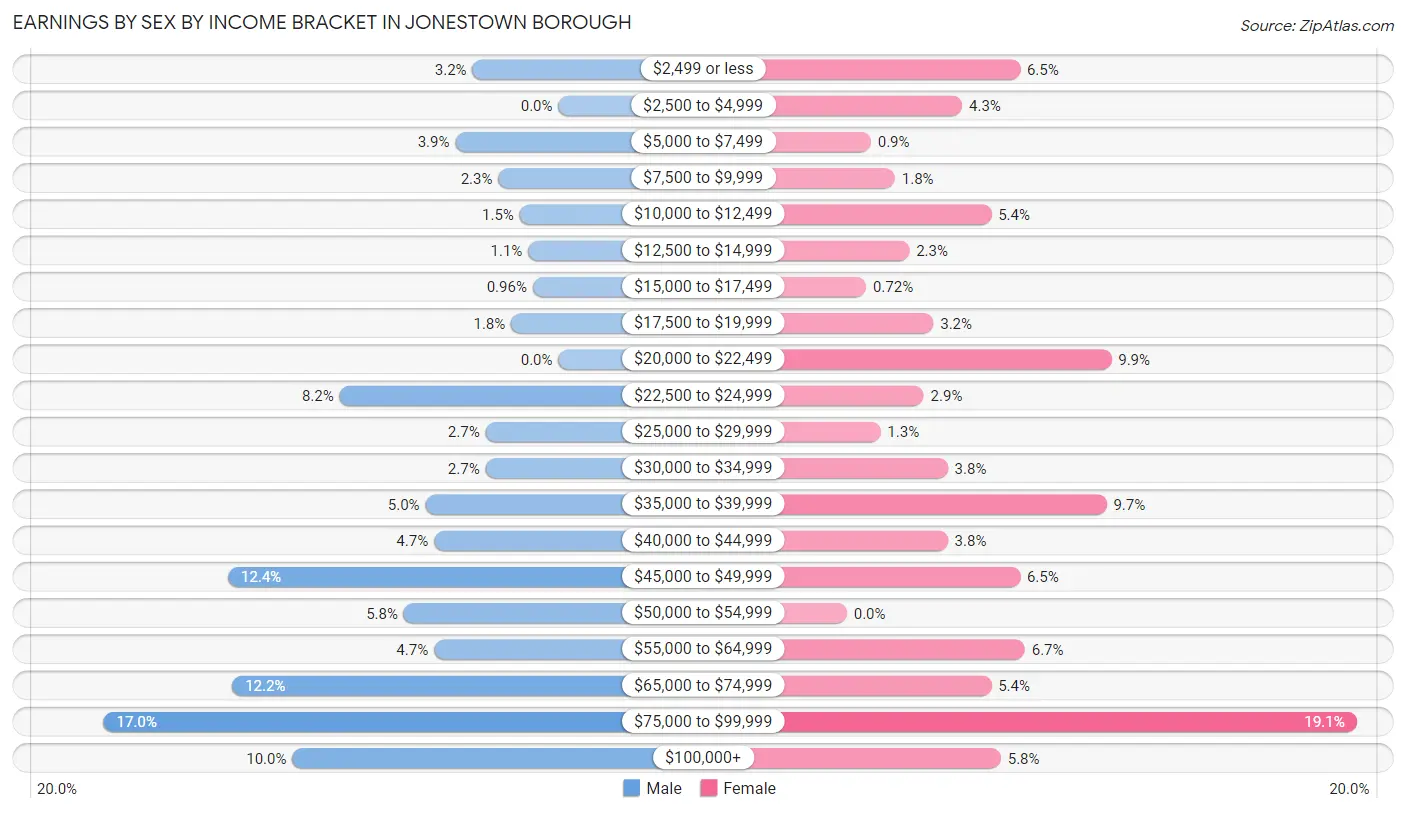
Earnings by Sex by Income Bracket in Jonestown borough
The most common earnings brackets in Jonestown borough are $75,000 to $99,999 for men (106 | 17.0%) and $75,000 to $99,999 for women (106 | 19.1%).
| Income | Male | Female |
| $2,499 or less | 20 (3.2%) | 36 (6.5%) |
| $2,500 to $4,999 | 0 (0.0%) | 24 (4.3%) |
| $5,000 to $7,499 | 24 (3.9%) | 5 (0.9%) |
| $7,500 to $9,999 | 14 (2.2%) | 10 (1.8%) |
| $10,000 to $12,499 | 9 (1.5%) | 30 (5.4%) |
| $12,500 to $14,999 | 7 (1.1%) | 13 (2.3%) |
| $15,000 to $17,499 | 6 (1.0%) | 4 (0.7%) |
| $17,500 to $19,999 | 11 (1.8%) | 18 (3.2%) |
| $20,000 to $22,499 | 0 (0.0%) | 55 (9.9%) |
| $22,500 to $24,999 | 51 (8.2%) | 16 (2.9%) |
| $25,000 to $29,999 | 17 (2.7%) | 7 (1.3%) |
| $30,000 to $34,999 | 17 (2.7%) | 21 (3.8%) |
| $35,000 to $39,999 | 31 (5.0%) | 54 (9.7%) |
| $40,000 to $44,999 | 29 (4.7%) | 21 (3.8%) |
| $45,000 to $49,999 | 77 (12.4%) | 36 (6.5%) |
| $50,000 to $54,999 | 36 (5.8%) | 0 (0.0%) |
| $55,000 to $64,999 | 29 (4.7%) | 37 (6.7%) |
| $65,000 to $74,999 | 76 (12.2%) | 30 (5.4%) |
| $75,000 to $99,999 | 106 (17.0%) | 106 (19.1%) |
| $100,000+ | 62 (10.0%) | 32 (5.8%) |
| Total | 622 (100.0%) | 555 (100.0%) |
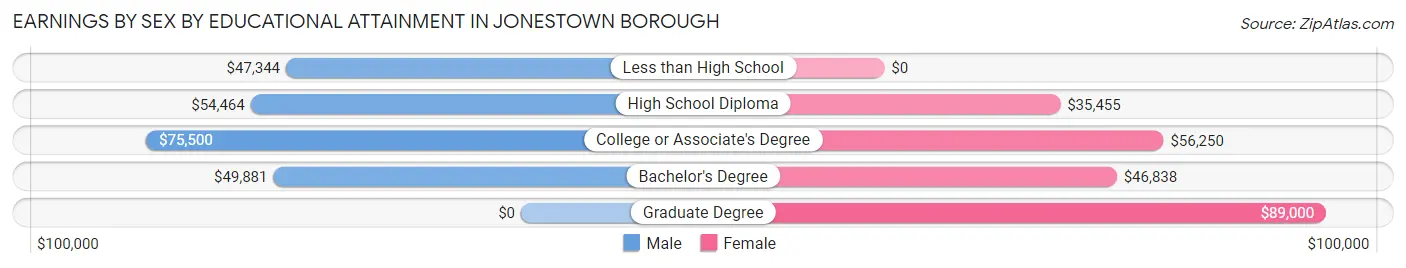
Earnings by Sex by Educational Attainment in Jonestown borough
Average earnings in Jonestown borough are $60,268 for men and $46,438 for women, a difference of 23.0%. Men with an educational attainment of college or associate's degree enjoy the highest average annual earnings of $75,500, while those with less than high school education earn the least with $47,344. Women with an educational attainment of graduate degree earn the most with the average annual earnings of $89,000, while those with high school diploma education have the smallest earnings of $35,455.
| Educational Attainment | Male Income | Female Income |
| Less than High School | $47,344 | $0 |
| High School Diploma | $54,464 | $35,455 |
| College or Associate's Degree | $75,500 | $56,250 |
| Bachelor's Degree | $49,881 | $46,838 |
| Graduate Degree | - | - |
| Total | $60,268 | $46,438 |
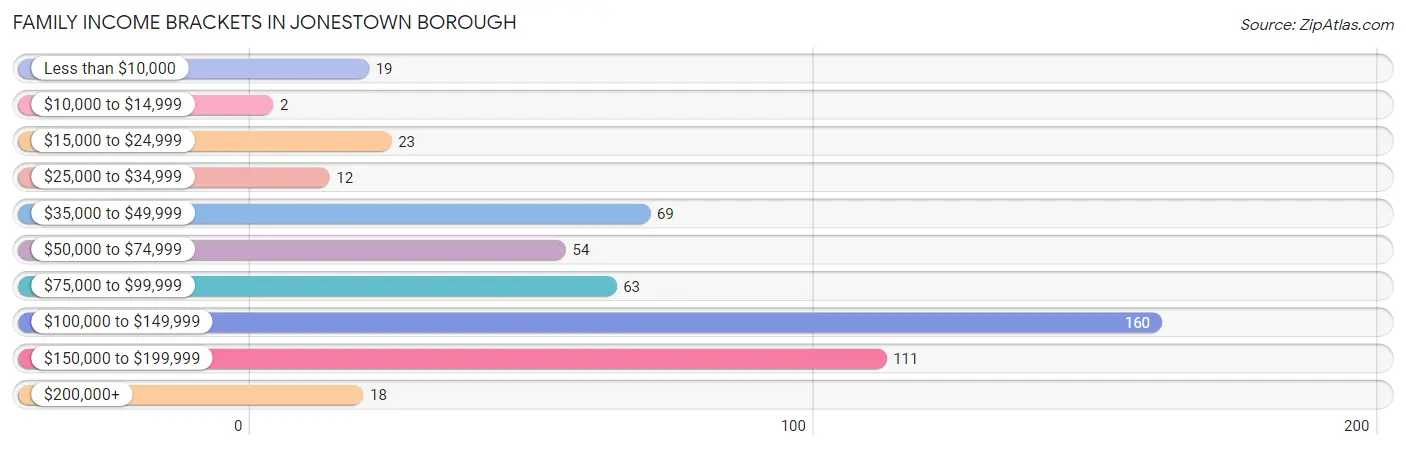
Family Income in Jonestown borough
Family Income Brackets in Jonestown borough
According to the Jonestown borough family income data, there are 160 families falling into the $100,000 to $149,999 income range, which is the most common income bracket and makes up 30.1% of all families. Conversely, the $10,000 to $14,999 income bracket is the least frequent group with only 2 families (0.4%) belonging to this category.
| Income Bracket | # Families | % Families |
| Less than $10,000 | 19 | 3.6% |
| $10,000 to $14,999 | 2 | 0.4% |
| $15,000 to $24,999 | 23 | 4.3% |
| $25,000 to $34,999 | 12 | 2.3% |
| $35,000 to $49,999 | 69 | 13.0% |
| $50,000 to $74,999 | 54 | 10.2% |
| $75,000 to $99,999 | 63 | 11.9% |
| $100,000 to $149,999 | 160 | 30.1% |
| $150,000 to $199,999 | 111 | 20.9% |
| $200,000+ | 18 | 3.4% |
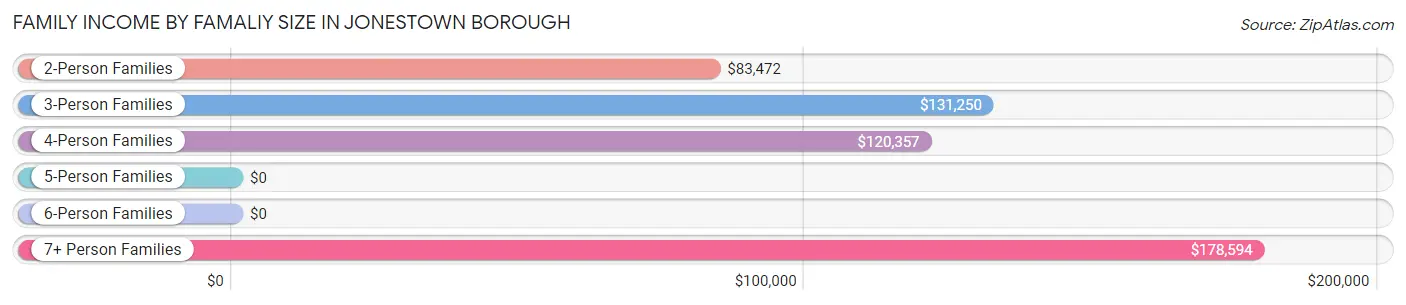
Family Income by Famaliy Size in Jonestown borough
7+ person families (39 | 7.3%) account for the highest median family income in Jonestown borough with $178,594 per family, while 3-person families (168 | 31.6%) have the highest median income of $43,750 per family member.
| Income Bracket | # Families | Median Income |
| 2-Person Families | 195 (36.7%) | $83,472 |
| 3-Person Families | 168 (31.6%) | $131,250 |
| 4-Person Families | 126 (23.7%) | $120,357 |
| 5-Person Families | 2 (0.4%) | $0 |
| 6-Person Families | 1 (0.2%) | $0 |
| 7+ Person Families | 39 (7.3%) | $178,594 |
| Total | 531 (100.0%) | $108,882 |
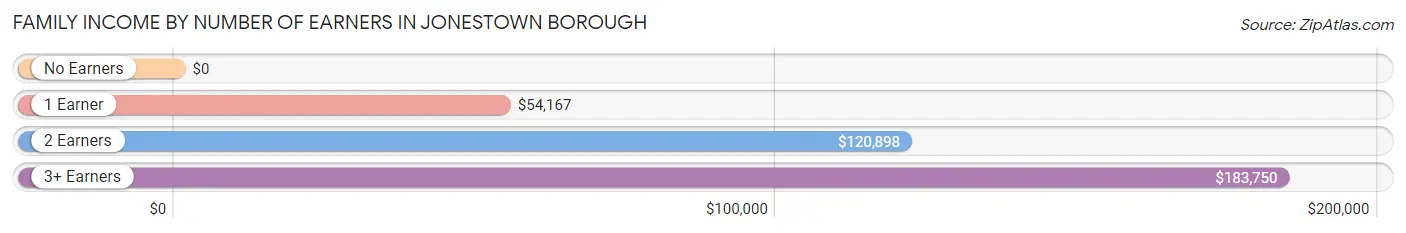
Family Income by Number of Earners in Jonestown borough
| Number of Earners | # Families | Median Income |
| No Earners | 33 (6.2%) | $0 |
| 1 Earner | 140 (26.4%) | $54,167 |
| 2 Earners | 285 (53.7%) | $120,898 |
| 3+ Earners | 73 (13.8%) | $183,750 |
| Total | 531 (100.0%) | $108,882 |
Household Income in Jonestown borough
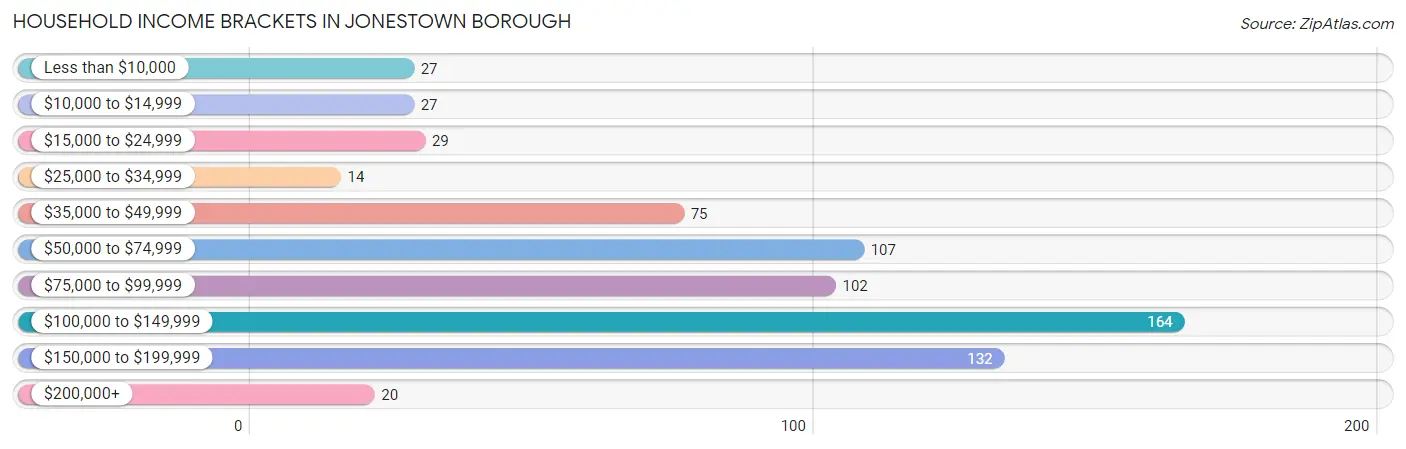
Household Income Brackets in Jonestown borough
With 164 households falling in the category, the $100,000 to $149,999 income range is the most frequent in Jonestown borough, accounting for 23.5% of all households. In contrast, only 14 households (2.0%) fall into the $25,000 to $34,999 income bracket, making it the least populous group.
| Income Bracket | # Households | % Households |
| Less than $10,000 | 27 | 3.9% |
| $10,000 to $14,999 | 27 | 3.9% |
| $15,000 to $24,999 | 29 | 4.2% |
| $25,000 to $34,999 | 14 | 2.0% |
| $35,000 to $49,999 | 75 | 10.8% |
| $50,000 to $74,999 | 107 | 15.4% |
| $75,000 to $99,999 | 102 | 14.6% |
| $100,000 to $149,999 | 164 | 23.5% |
| $150,000 to $199,999 | 132 | 18.9% |
| $200,000+ | 20 | 2.9% |
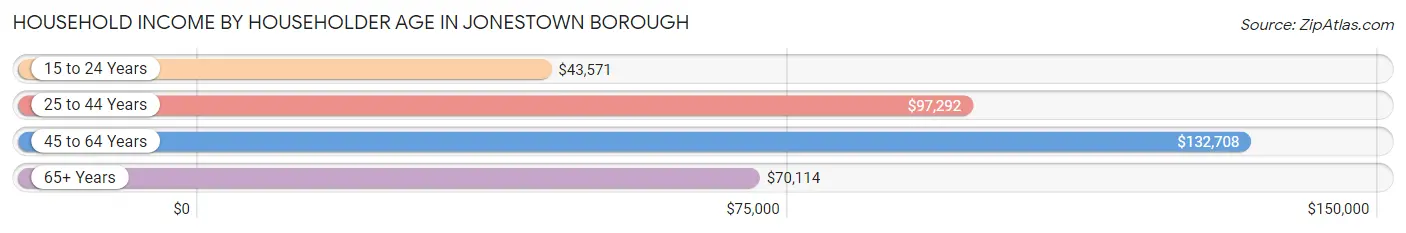
Household Income by Householder Age in Jonestown borough
The median household income in Jonestown borough is $95,792, with the highest median household income of $132,708 found in the 45 to 64 years age bracket for the primary householder. A total of 299 households (42.9%) fall into this category. Meanwhile, the 15 to 24 years age bracket for the primary householder has the lowest median household income of $43,571, with 46 households (6.6%) in this group.
| Income Bracket | # Households | Median Income |
| 15 to 24 Years | 46 (6.6%) | $43,571 |
| 25 to 44 Years | 273 (39.2%) | $97,292 |
| 45 to 64 Years | 299 (42.9%) | $132,708 |
| 65+ Years | 79 (11.3%) | $70,114 |
| Total | 697 (100.0%) | $95,792 |
Poverty in Jonestown borough
Income Below Poverty by Sex and Age in Jonestown borough
With 5.8% poverty level for males and 10.0% for females among the residents of Jonestown borough, 16 and 17 year old males and 6 to 11 year old females are the most vulnerable to poverty, with 14 males (82.4%) and 26 females (32.9%) in their respective age groups living below the poverty level.
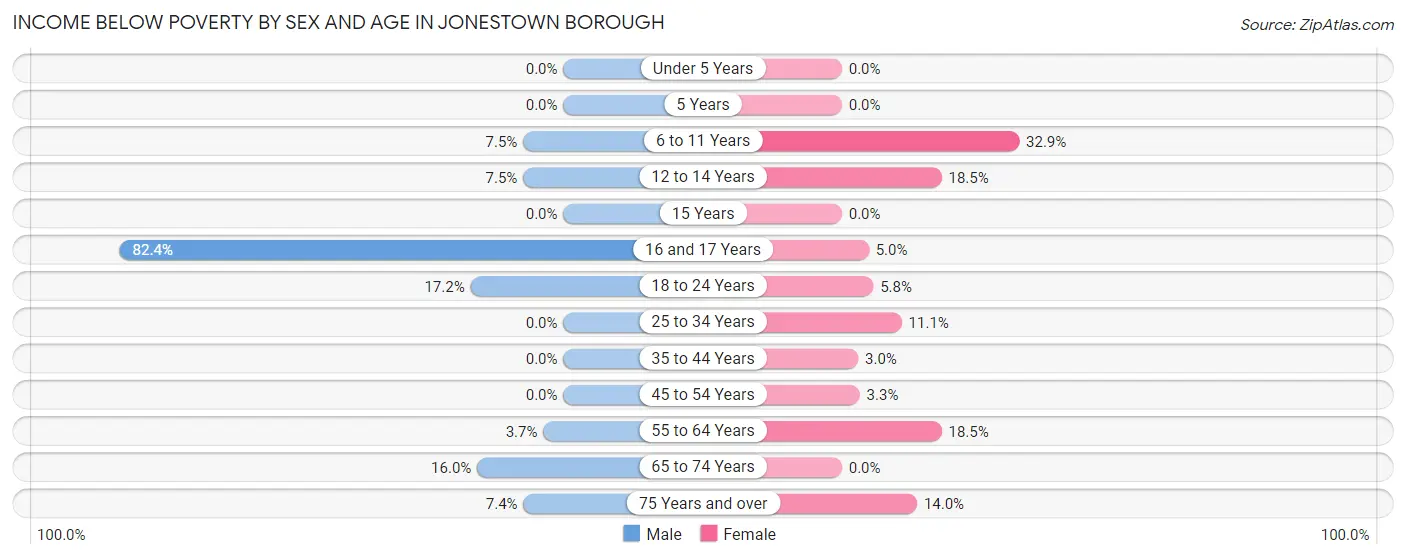
| Age Bracket | Male | Female |
| Under 5 Years | 0 (0.0%) | 0 (0.0%) |
| 5 Years | 0 (0.0%) | 0 (0.0%) |
| 6 to 11 Years | 5 (7.5%) | 26 (32.9%) |
| 12 to 14 Years | 5 (7.5%) | 5 (18.5%) |
| 15 Years | 0 (0.0%) | 0 (0.0%) |
| 16 and 17 Years | 14 (82.4%) | 1 (5.0%) |
| 18 to 24 Years | 25 (17.2%) | 6 (5.8%) |
| 25 to 34 Years | 0 (0.0%) | 14 (11.1%) |
| 35 to 44 Years | 0 (0.0%) | 4 (3.0%) |
| 45 to 54 Years | 0 (0.0%) | 5 (3.3%) |
| 55 to 64 Years | 6 (3.7%) | 25 (18.5%) |
| 65 to 74 Years | 4 (16.0%) | 0 (0.0%) |
| 75 Years and over | 2 (7.4%) | 6 (14.0%) |
| Total | 61 (5.8%) | 92 (10.0%) |
Income Above Poverty by Sex and Age in Jonestown borough
According to the poverty statistics in Jonestown borough, males aged under 5 years and females aged under 5 years are the age groups that are most secure financially, with 100.0% of males and 100.0% of females in these age groups living above the poverty line.
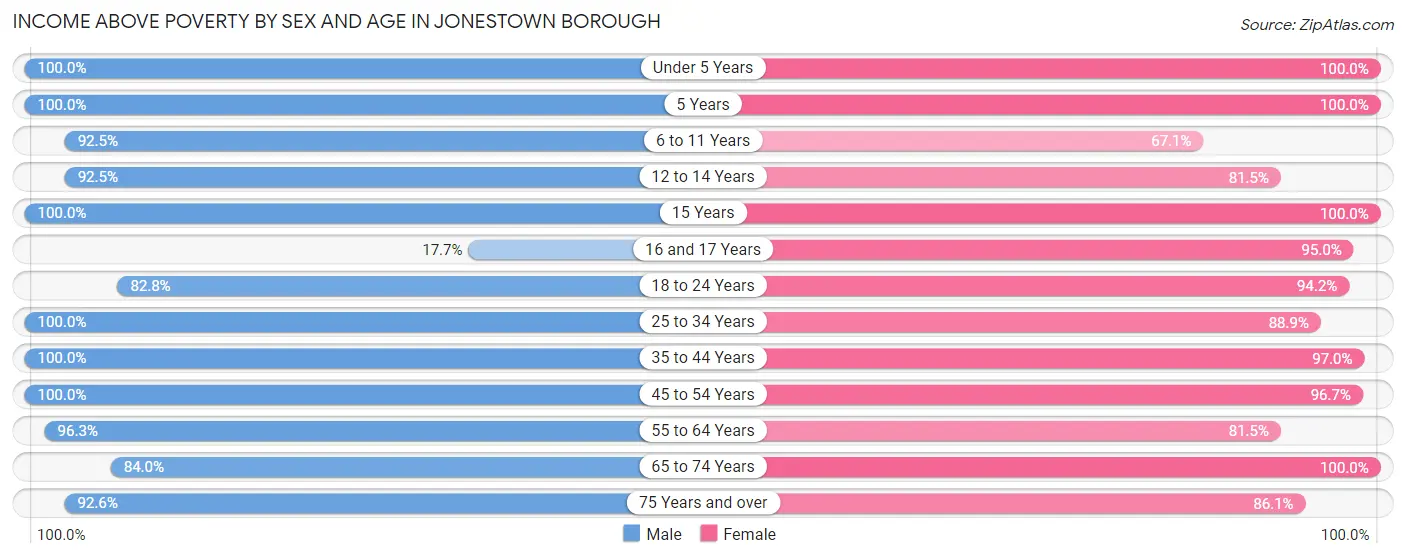
| Age Bracket | Male | Female |
| Under 5 Years | 53 (100.0%) | 75 (100.0%) |
| 5 Years | 2 (100.0%) | 2 (100.0%) |
| 6 to 11 Years | 62 (92.5%) | 53 (67.1%) |
| 12 to 14 Years | 62 (92.5%) | 22 (81.5%) |
| 15 Years | 58 (100.0%) | 3 (100.0%) |
| 16 and 17 Years | 3 (17.6%) | 19 (95.0%) |
| 18 to 24 Years | 120 (82.8%) | 97 (94.2%) |
| 25 to 34 Years | 200 (100.0%) | 112 (88.9%) |
| 35 to 44 Years | 137 (100.0%) | 128 (97.0%) |
| 45 to 54 Years | 87 (100.0%) | 146 (96.7%) |
| 55 to 64 Years | 155 (96.3%) | 110 (81.5%) |
| 65 to 74 Years | 21 (84.0%) | 27 (100.0%) |
| 75 Years and over | 25 (92.6%) | 37 (86.1%) |
| Total | 985 (94.2%) | 831 (90.0%) |
Income Below Poverty Among Married-Couple Families in Jonestown borough
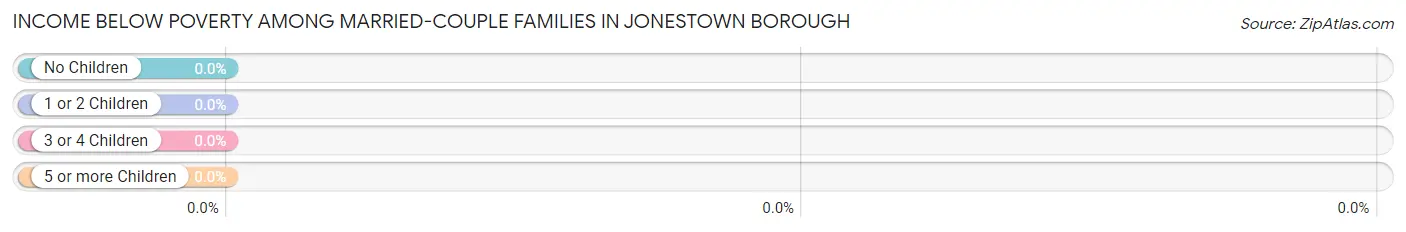
| Children | Above Poverty | Below Poverty |
| No Children | 191 (100.0%) | 0 (0.0%) |
| 1 or 2 Children | 155 (100.0%) | 0 (0.0%) |
| 3 or 4 Children | 14 (100.0%) | 0 (0.0%) |
| 5 or more Children | 3 (100.0%) | 0 (0.0%) |
| Total | 363 (100.0%) | 0 (0.0%) |
Income Below Poverty Among Single-Parent Households in Jonestown borough
According to the poverty data in Jonestown borough, 6.3% or 5 single-father households and 25.8% or 23 single-mother households are living below the poverty line. Among single-father households, those with 1 or 2 children have the highest poverty rate, with 5 households (8.6%) experiencing poverty. Likewise, among single-mother households, those with 1 or 2 children have the highest poverty rate, with 21 households (50.0%) falling below the poverty line.
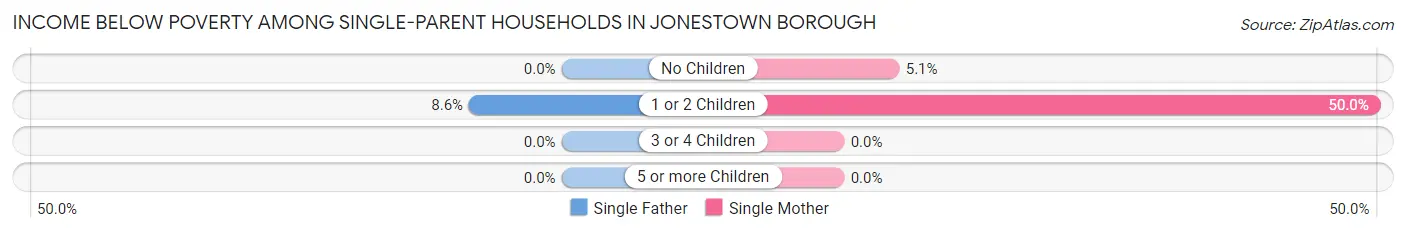
| Children | Single Father | Single Mother |
| No Children | 0 (0.0%) | 2 (5.1%) |
| 1 or 2 Children | 5 (8.6%) | 21 (50.0%) |
| 3 or 4 Children | 0 (0.0%) | 0 (0.0%) |
| 5 or more Children | 0 (0.0%) | 0 (0.0%) |
| Total | 5 (6.3%) | 23 (25.8%) |
Income Below Poverty Among Married-Couple vs Single-Parent Households in Jonestown borough
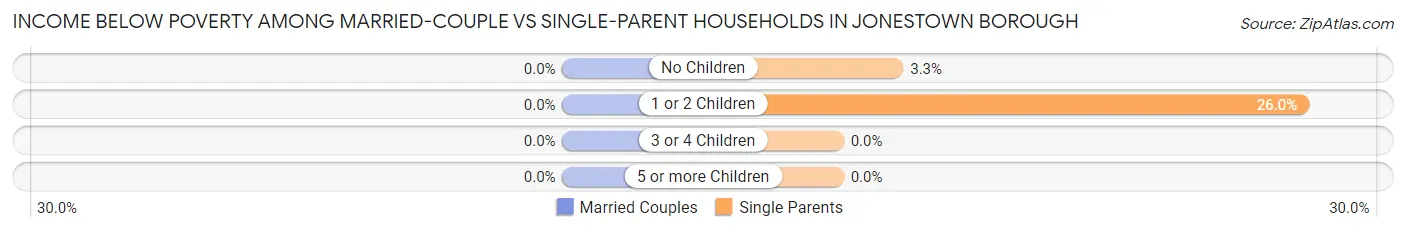
| Children | Married-Couple Families | Single-Parent Households |
| No Children | 0 (0.0%) | 2 (3.3%) |
| 1 or 2 Children | 0 (0.0%) | 26 (26.0%) |
| 3 or 4 Children | 0 (0.0%) | 0 (0.0%) |
| 5 or more Children | 0 (0.0%) | 0 (0.0%) |
| Total | 0 (0.0%) | 28 (16.7%) |
Race in Jonestown borough
The most populous races in Jonestown borough are White / Caucasian (1,758 | 88.8%), Hispanic or Latino (235 | 11.9%), and Two or more Races (184 | 9.3%).
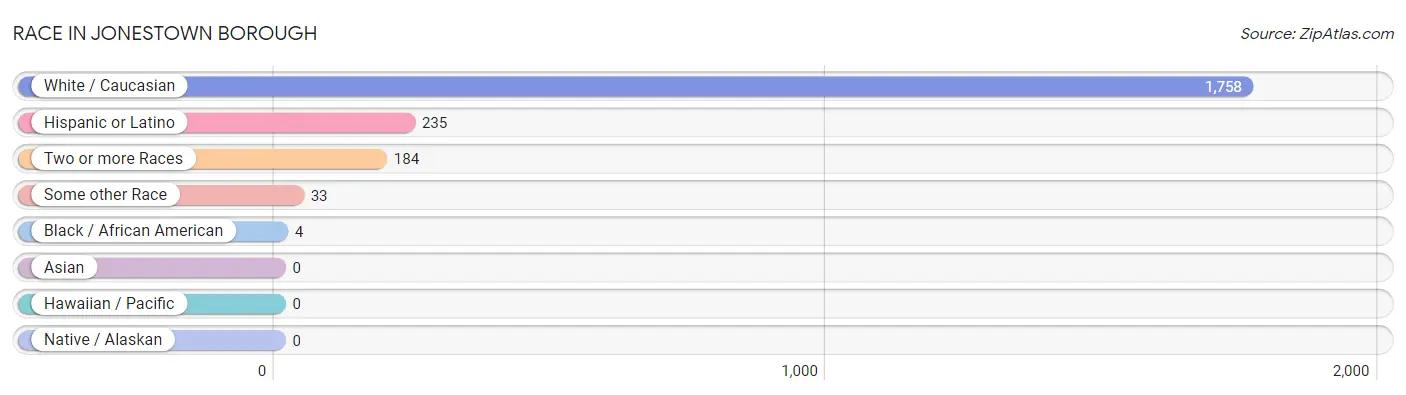
| Race | # Population | % Population |
| Asian | 0 | 0.0% |
| Black / African American | 4 | 0.2% |
| Hawaiian / Pacific | 0 | 0.0% |
| Hispanic or Latino | 235 | 11.9% |
| Native / Alaskan | 0 | 0.0% |
| White / Caucasian | 1,758 | 88.8% |
| Two or more Races | 184 | 9.3% |
| Some other Race | 33 | 1.7% |
| Total | 1,979 | 100.0% |
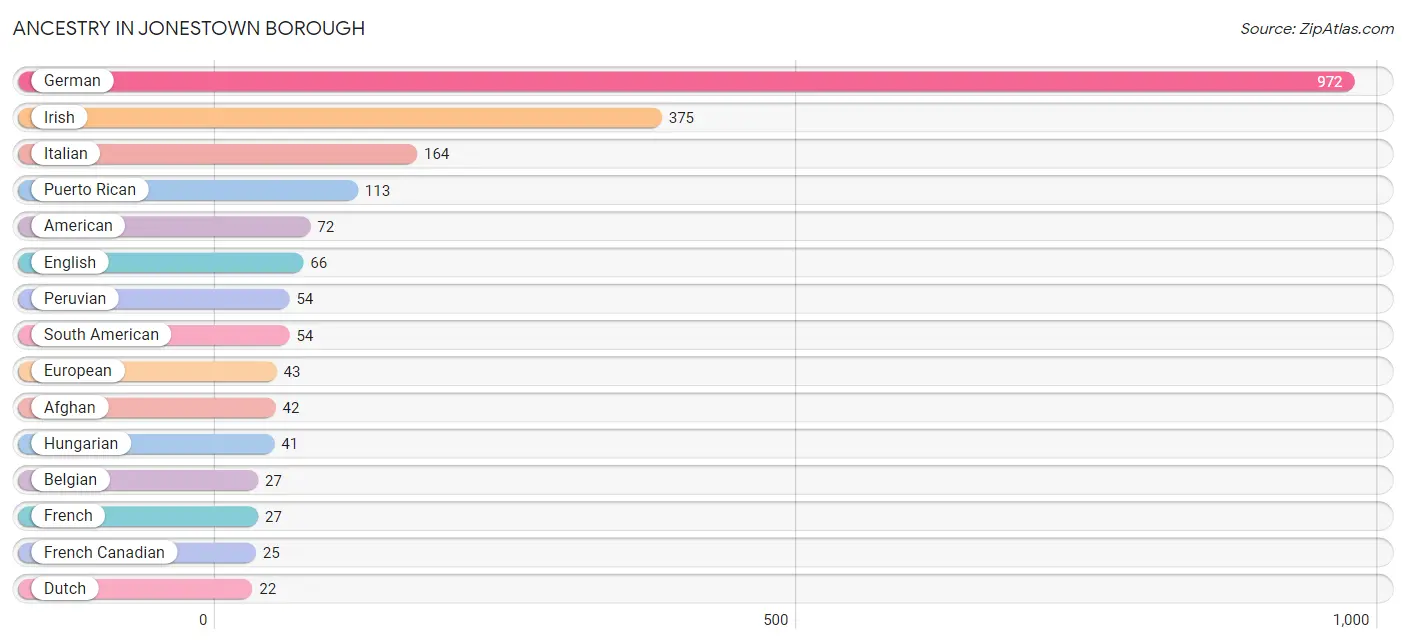
Ancestry in Jonestown borough
The most populous ancestries reported in Jonestown borough are German (972 | 49.1%), Irish (375 | 19.0%), Italian (164 | 8.3%), Puerto Rican (113 | 5.7%), and American (72 | 3.6%), together accounting for 85.7% of all Jonestown borough residents.
| Ancestry | # Population | % Population |
| Afghan | 42 | 2.1% |
| Albanian | 3 | 0.2% |
| American | 72 | 3.6% |
| Arab | 7 | 0.4% |
| Austrian | 17 | 0.9% |
| Belgian | 27 | 1.4% |
| Cherokee | 11 | 0.6% |
| Croatian | 5 | 0.3% |
| Dominican | 21 | 1.1% |
| Dutch | 22 | 1.1% |
| English | 66 | 3.3% |
| European | 43 | 2.2% |
| French | 27 | 1.4% |
| French Canadian | 25 | 1.3% |
| German | 972 | 49.1% |
| Greek | 3 | 0.2% |
| Hungarian | 41 | 2.1% |
| Irish | 375 | 19.0% |
| Italian | 164 | 8.3% |
| Lebanese | 7 | 0.4% |
| Lithuanian | 10 | 0.5% |
| Mexican | 17 | 0.9% |
| Norwegian | 5 | 0.3% |
| Pennsylvania German | 6 | 0.3% |
| Peruvian | 54 | 2.7% |
| Polish | 20 | 1.0% |
| Puerto Rican | 113 | 5.7% |
| Scotch-Irish | 9 | 0.4% |
| Scottish | 16 | 0.8% |
| South American | 54 | 2.7% |
| Swedish | 4 | 0.2% |
| Swiss | 8 | 0.4% |
| Thai | 21 | 1.1% |
| Ukrainian | 3 | 0.2% |
| Welsh | 18 | 0.9% | View All 35 Rows |
Immigrants in Jonestown borough
The most numerous immigrant groups reported in Jonestown borough came from Latin America (57 | 2.9%), Peru (54 | 2.7%), South America (54 | 2.7%), Afghanistan (29 | 1.5%), and Asia (29 | 1.5%), together accounting for 11.3% of all Jonestown borough residents.
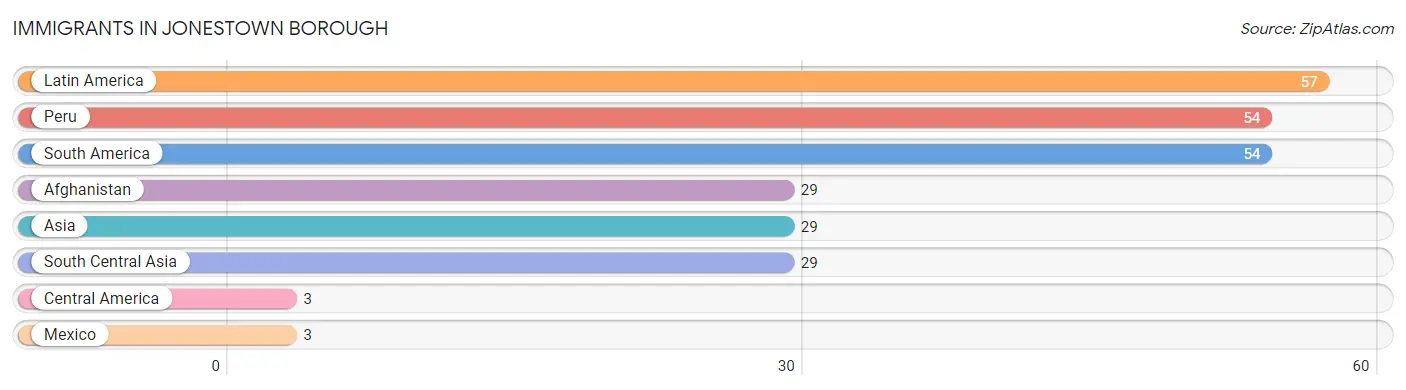
| Immigration Origin | # Population | % Population |
| Afghanistan | 29 | 1.5% |
| Asia | 29 | 1.5% |
| Central America | 3 | 0.2% |
| Latin America | 57 | 2.9% |
| Mexico | 3 | 0.2% |
| Peru | 54 | 2.7% |
| South America | 54 | 2.7% |
| South Central Asia | 29 | 1.5% | View All 8 Rows |
Sex and Age in Jonestown borough
Sex and Age in Jonestown borough
The most populous age groups in Jonestown borough are 15 to 19 Years (128 | 12.1%) for men and 35 to 39 Years (87 | 9.4%) for women.
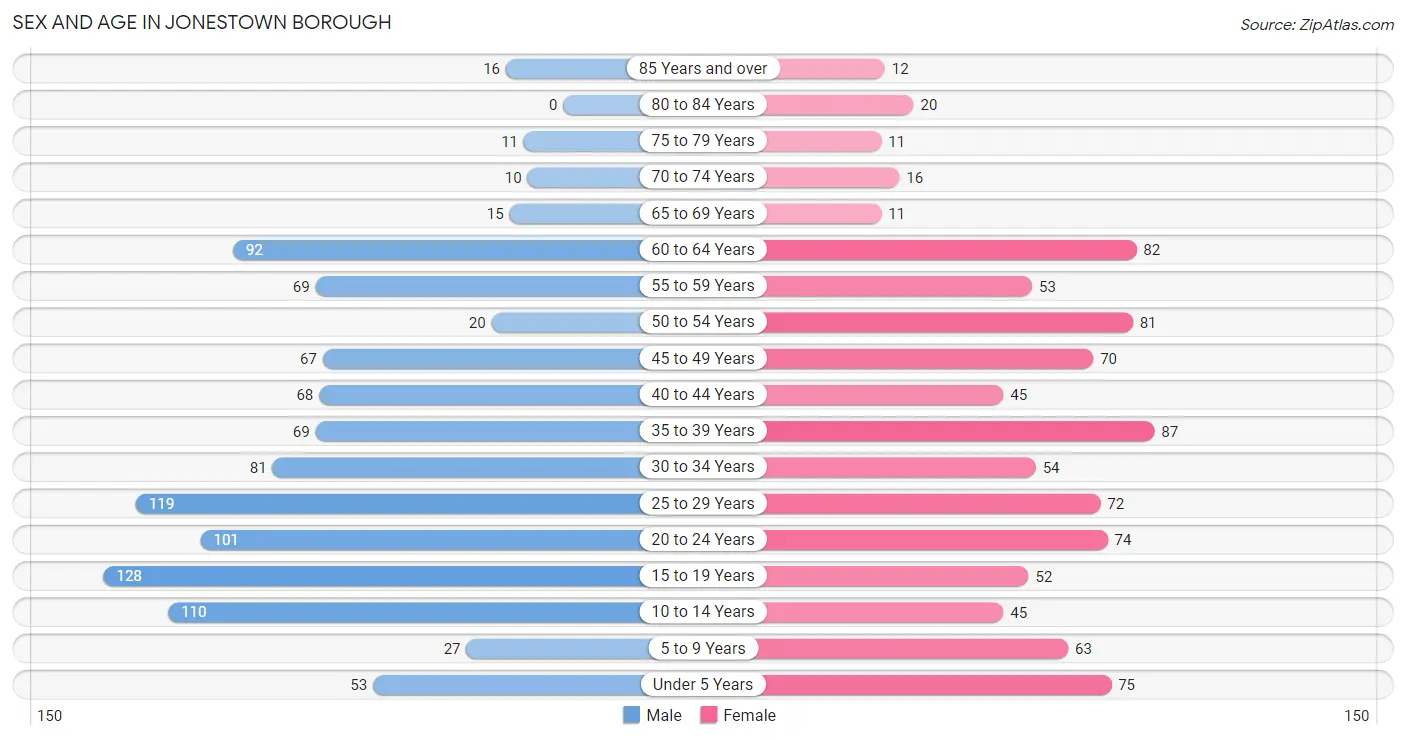
| Age Bracket | Male | Female |
| Under 5 Years | 53 (5.0%) | 75 (8.1%) |
| 5 to 9 Years | 27 (2.6%) | 63 (6.8%) |
| 10 to 14 Years | 110 (10.4%) | 45 (4.9%) |
| 15 to 19 Years | 128 (12.1%) | 52 (5.6%) |
| 20 to 24 Years | 101 (9.6%) | 74 (8.0%) |
| 25 to 29 Years | 119 (11.3%) | 72 (7.8%) |
| 30 to 34 Years | 81 (7.7%) | 54 (5.9%) |
| 35 to 39 Years | 69 (6.5%) | 87 (9.4%) |
| 40 to 44 Years | 68 (6.4%) | 45 (4.9%) |
| 45 to 49 Years | 67 (6.3%) | 70 (7.6%) |
| 50 to 54 Years | 20 (1.9%) | 81 (8.8%) |
| 55 to 59 Years | 69 (6.5%) | 53 (5.7%) |
| 60 to 64 Years | 92 (8.7%) | 82 (8.9%) |
| 65 to 69 Years | 15 (1.4%) | 11 (1.2%) |
| 70 to 74 Years | 10 (0.9%) | 16 (1.7%) |
| 75 to 79 Years | 11 (1.0%) | 11 (1.2%) |
| 80 to 84 Years | 0 (0.0%) | 20 (2.2%) |
| 85 Years and over | 16 (1.5%) | 12 (1.3%) |
| Total | 1,056 (100.0%) | 923 (100.0%) |
Families and Households in Jonestown borough
Median Family Size in Jonestown borough
The median family size in Jonestown borough is 3.19 persons per family, with married-couple families (363 | 68.4%) accounting for the largest median family size of 3.28 persons per family. On the other hand, single male/father families (79 | 14.9%) represent the smallest median family size with 2.81 persons per family.
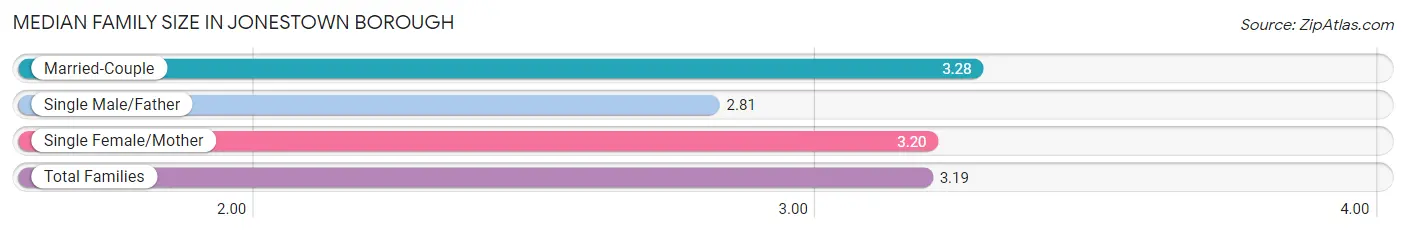
| Family Type | # Families | Family Size |
| Married-Couple | 363 (68.4%) | 3.28 |
| Single Male/Father | 79 (14.9%) | 2.81 |
| Single Female/Mother | 89 (16.8%) | 3.20 |
| Total Families | 531 (100.0%) | 3.19 |
Median Household Size in Jonestown borough
The median household size in Jonestown borough is 2.82 persons per household, with single female/mother households (89 | 12.8%) accounting for the largest median household size of 3.51 persons per household. non-family households (166 | 23.8%) represent the smallest median household size with 1.31 persons per household.
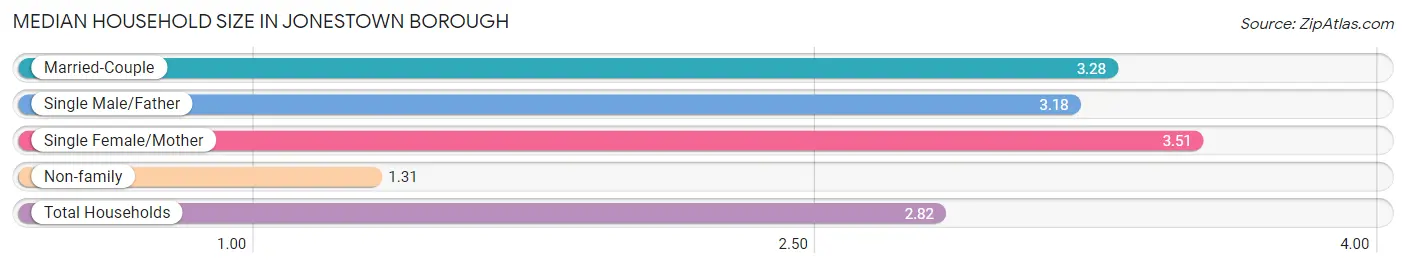
| Household Type | # Households | Household Size |
| Married-Couple | 363 (52.1%) | 3.28 |
| Single Male/Father | 79 (11.3%) | 3.18 |
| Single Female/Mother | 89 (12.8%) | 3.51 |
| Non-family | 166 (23.8%) | 1.31 |
| Total Households | 697 (100.0%) | 2.82 |
Household Size by Marriage Status in Jonestown borough
Out of a total of 697 households in Jonestown borough, 531 (76.2%) are family households, while 166 (23.8%) are nonfamily households. The most numerous type of family households are 3-person households, comprising 176, and the most common type of nonfamily households are 1-person households, comprising 133.
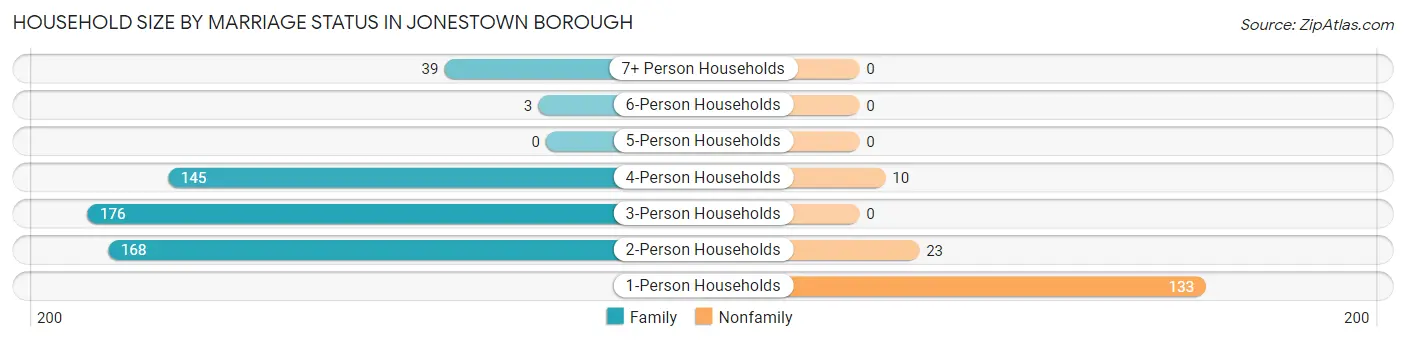
| Household Size | Family Households | Nonfamily Households |
| 1-Person Households | - | 133 (19.1%) |
| 2-Person Households | 168 (24.1%) | 23 (3.3%) |
| 3-Person Households | 176 (25.3%) | 0 (0.0%) |
| 4-Person Households | 145 (20.8%) | 10 (1.4%) |
| 5-Person Households | 0 (0.0%) | 0 (0.0%) |
| 6-Person Households | 3 (0.4%) | 0 (0.0%) |
| 7+ Person Households | 39 (5.6%) | 0 (0.0%) |
| Total | 531 (76.2%) | 166 (23.8%) |
Female Fertility in Jonestown borough
Fertility by Age in Jonestown borough
Average fertility rate in Jonestown borough is 103.0 births per 1,000 women. Women in the age bracket of 20 to 34 years have the highest fertility rate with 235.0 births per 1,000 women. Women in the age bracket of 20 to 34 years acount for 94.0% of all women with births.
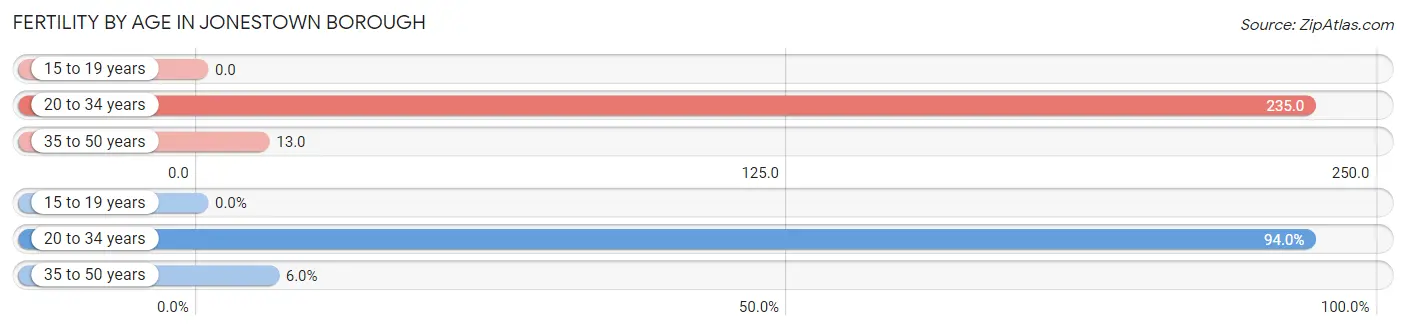
| Age Bracket | Women with Births | Births / 1,000 Women |
| 15 to 19 years | 0 (0.0%) | 0.0 |
| 20 to 34 years | 47 (94.0%) | 235.0 |
| 35 to 50 years | 3 (6.0%) | 13.0 |
| Total | 50 (100.0%) | 103.0 |
Fertility by Age by Marriage Status in Jonestown borough
66.0% of women with births (50) in Jonestown borough are married. The highest percentage of unmarried women with births falls into 20 to 34 years age bracket with 36.2% of them unmarried at the time of birth, while the lowest percentage of unmarried women with births belong to 35 to 50 years age bracket with 0.0% of them unmarried.
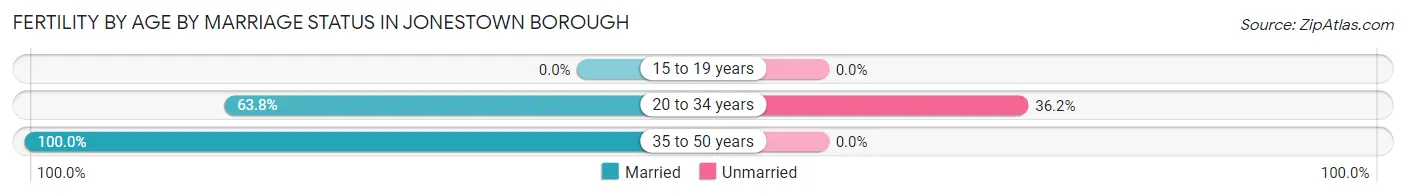
| Age Bracket | Married | Unmarried |
| 15 to 19 years | 0 (0.0%) | 0 (0.0%) |
| 20 to 34 years | 30 (63.8%) | 17 (36.2%) |
| 35 to 50 years | 3 (100.0%) | 0 (0.0%) |
| Total | 33 (66.0%) | 17 (34.0%) |
Fertility by Education in Jonestown borough
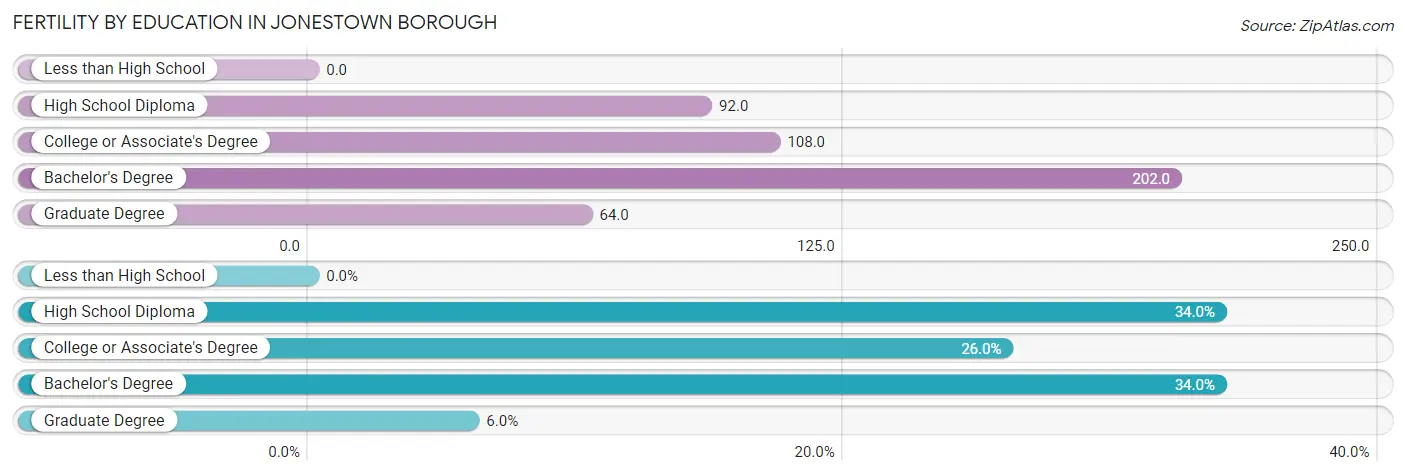
| Educational Attainment | Women with Births | Births / 1,000 Women |
| Less than High School | 0 (0.0%) | 0.0 |
| High School Diploma | 17 (34.0%) | 92.0 |
| College or Associate's Degree | 13 (26.0%) | 108.0 |
| Bachelor's Degree | 17 (34.0%) | 202.0 |
| Graduate Degree | 3 (6.0%) | 64.0 |
| Total | 50 (100.0%) | 103.0 |
Fertility by Education by Marriage Status in Jonestown borough
34.0% of women with births in Jonestown borough are unmarried. Women with the educational attainment of high school diploma are most likely to be married with 100.0% of them married at childbirth, while women with the educational attainment of bachelor's degree are least likely to be married with 100.0% of them unmarried at childbirth.
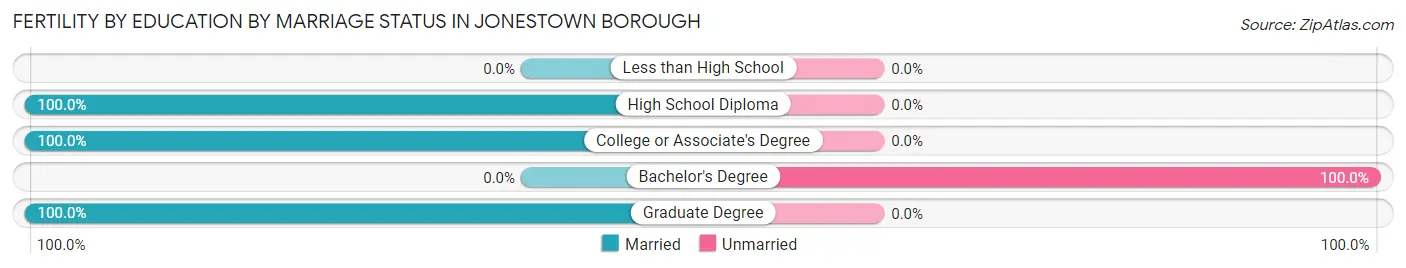
| Educational Attainment | Married | Unmarried |
| Less than High School | 0 (0.0%) | 0 (0.0%) |
| High School Diploma | 17 (100.0%) | 0 (0.0%) |
| College or Associate's Degree | 13 (100.0%) | 0 (0.0%) |
| Bachelor's Degree | 0 (0.0%) | 17 (100.0%) |
| Graduate Degree | 3 (100.0%) | 0 (0.0%) |
| Total | 33 (66.0%) | 17 (34.0%) |
Employment Characteristics in Jonestown borough
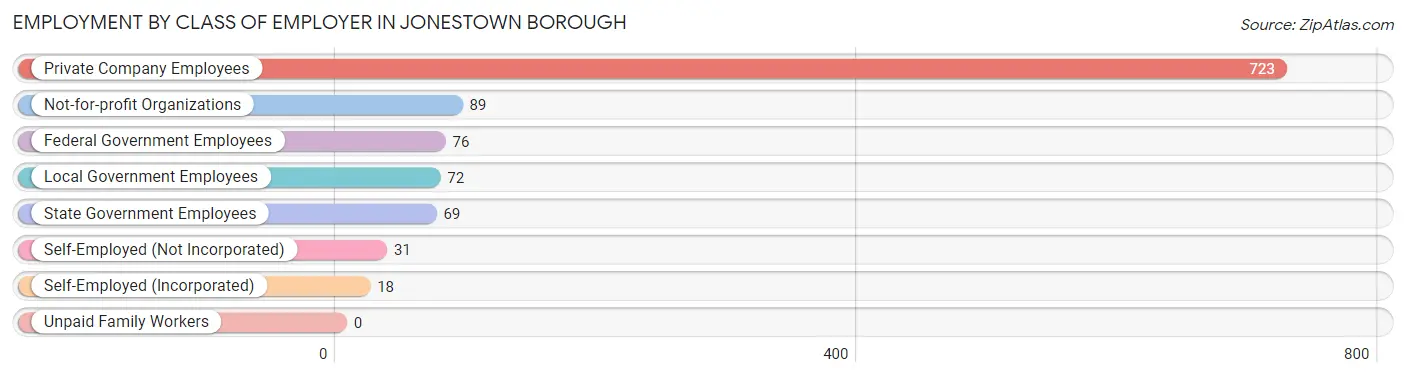
Employment by Class of Employer in Jonestown borough
Among the 1,078 employed individuals in Jonestown borough, private company employees (723 | 67.1%), not-for-profit organizations (89 | 8.3%), and federal government employees (76 | 7.0%) make up the most common classes of employment.
| Employer Class | # Employees | % Employees |
| Private Company Employees | 723 | 67.1% |
| Self-Employed (Incorporated) | 18 | 1.7% |
| Self-Employed (Not Incorporated) | 31 | 2.9% |
| Not-for-profit Organizations | 89 | 8.3% |
| Local Government Employees | 72 | 6.7% |
| State Government Employees | 69 | 6.4% |
| Federal Government Employees | 76 | 7.0% |
| Unpaid Family Workers | 0 | 0.0% |
| Total | 1,078 | 100.0% |
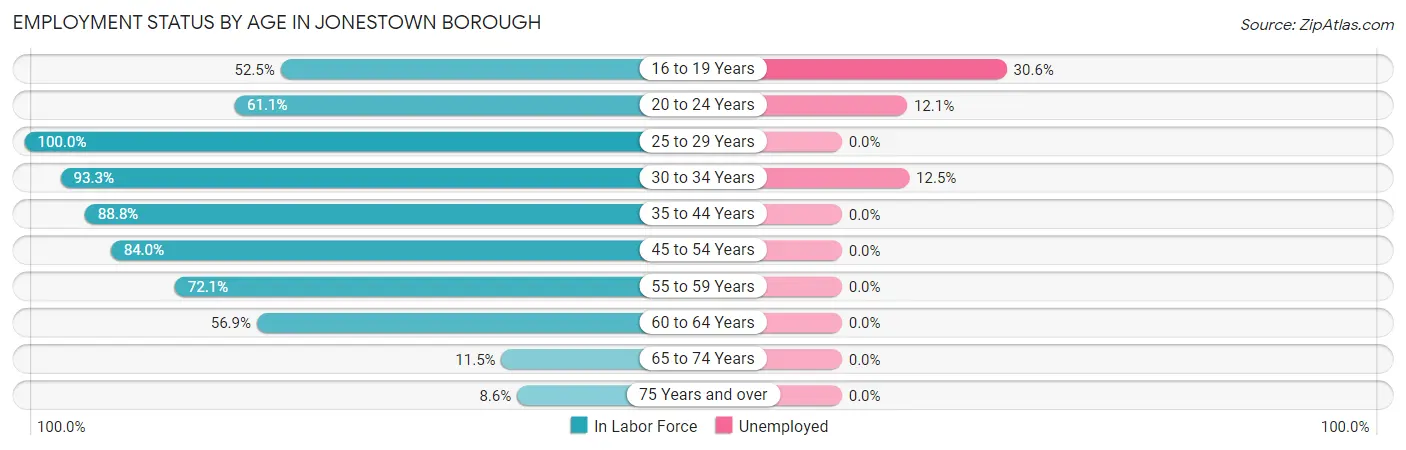
Employment Status by Age in Jonestown borough
According to the labor force statistics for Jonestown borough, out of the total population over 16 years of age (1,544), 72.8% or 1,124 individuals are in the labor force, with 4.3% or 48 of them unemployed. The age group with the highest labor force participation rate is 25 to 29 years, with 100.0% or 191 individuals in the labor force. Within the labor force, the 16 to 19 years age range has the highest percentage of unemployed individuals, with 30.6% or 19 of them being unemployed.
| Age Bracket | In Labor Force | Unemployed |
| 16 to 19 Years | 62 (52.5%) | 19 (30.6%) |
| 20 to 24 Years | 107 (61.1%) | 13 (12.1%) |
| 25 to 29 Years | 191 (100.0%) | 0 (0.0%) |
| 30 to 34 Years | 126 (93.3%) | 16 (12.5%) |
| 35 to 44 Years | 239 (88.8%) | 0 (0.0%) |
| 45 to 54 Years | 200 (84.0%) | 0 (0.0%) |
| 55 to 59 Years | 88 (72.1%) | 0 (0.0%) |
| 60 to 64 Years | 99 (56.9%) | 0 (0.0%) |
| 65 to 74 Years | 6 (11.5%) | 0 (0.0%) |
| 75 Years and over | 6 (8.6%) | 0 (0.0%) |
| Total | 1,124 (72.8%) | 48 (4.3%) |
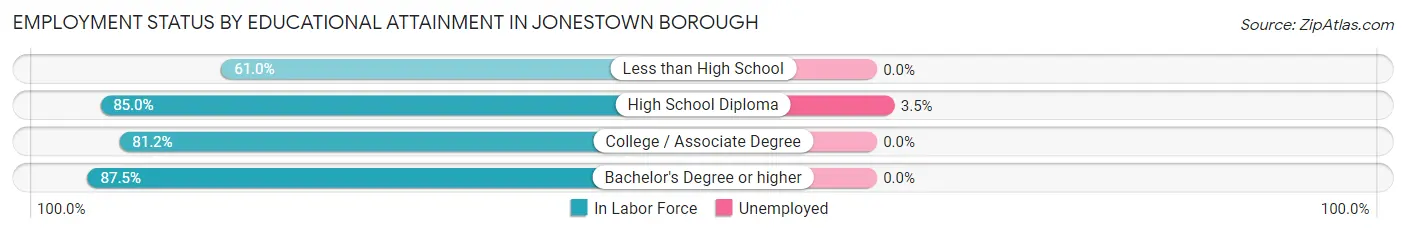
Employment Status by Educational Attainment in Jonestown borough
According to labor force statistics for Jonestown borough, 83.5% of individuals (943) out of the total population between 25 and 64 years of age (1,129) are in the labor force, with 1.6% or 15 of them being unemployed. The group with the highest labor force participation rate are those with the educational attainment of bachelor's degree or higher, with 87.5% or 224 individuals in the labor force. Within the labor force, individuals with high school diploma education have the highest percentage of unemployment, with 3.5% or 15 of them being unemployed.
| Educational Attainment | In Labor Force | Unemployed |
| Less than High School | 25 (61.0%) | 0 (0.0%) |
| High School Diploma | 418 (85.0%) | 17 (3.5%) |
| College / Associate Degree | 276 (81.2%) | 0 (0.0%) |
| Bachelor's Degree or higher | 224 (87.5%) | 0 (0.0%) |
| Total | 943 (83.5%) | 18 (1.6%) |
Employment Occupations by Sex in Jonestown borough
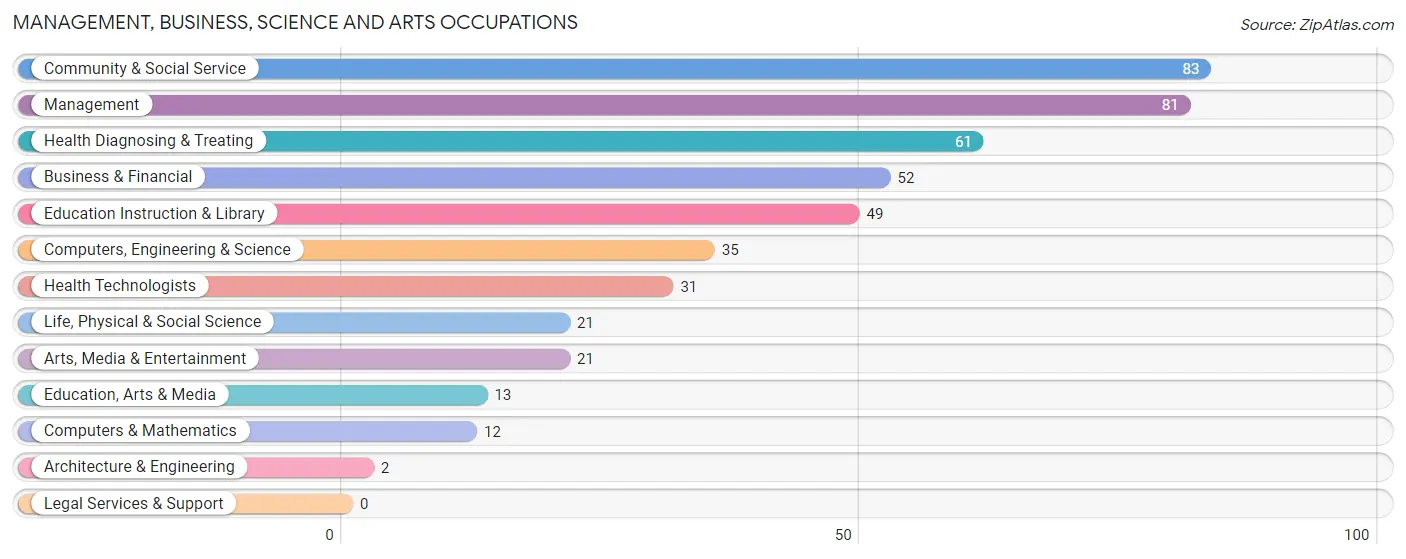
Management, Business, Science and Arts Occupations
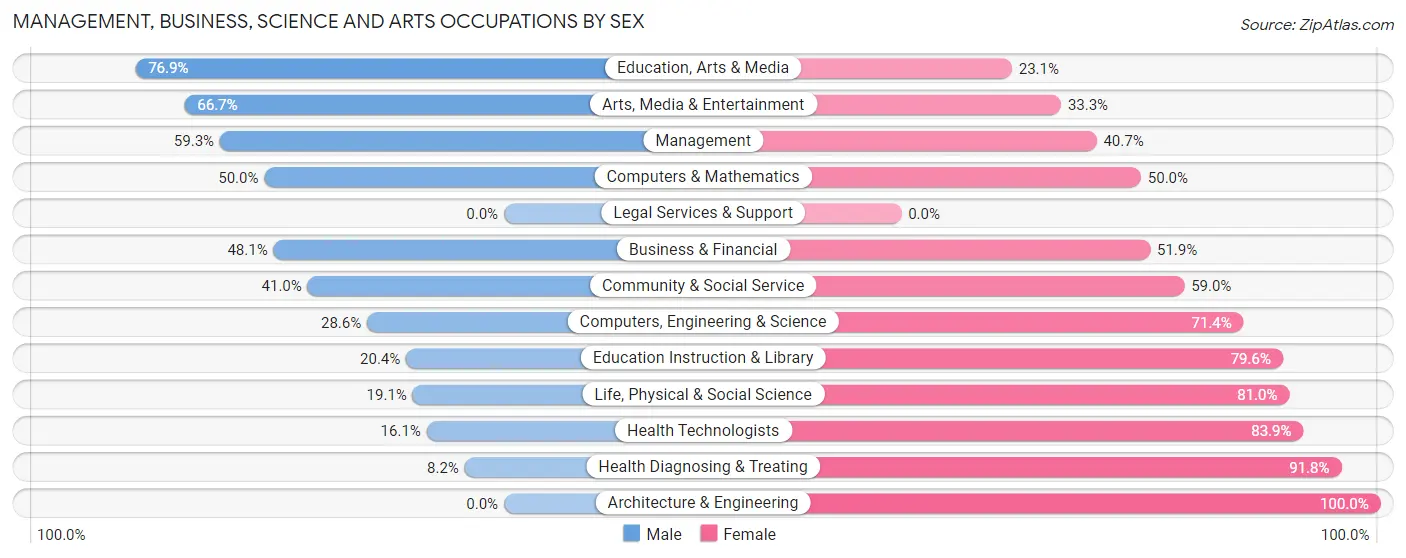
The most common Management, Business, Science and Arts occupations in Jonestown borough are Community & Social Service (83 | 8.1%), Management (81 | 7.9%), Health Diagnosing & Treating (61 | 6.0%), Business & Financial (52 | 5.1%), and Education Instruction & Library (49 | 4.8%).
Management, Business, Science and Arts Occupations by Sex
Within the Management, Business, Science and Arts occupations in Jonestown borough, the most male-oriented occupations are Education, Arts & Media (76.9%), Arts, Media & Entertainment (66.7%), and Management (59.3%), while the most female-oriented occupations are Architecture & Engineering (100.0%), Health Diagnosing & Treating (91.8%), and Health Technologists (83.9%).
| Occupation | Male | Female |
| Management | 48 (59.3%) | 33 (40.7%) |
| Business & Financial | 25 (48.1%) | 27 (51.9%) |
| Computers, Engineering & Science | 10 (28.6%) | 25 (71.4%) |
| Computers & Mathematics | 6 (50.0%) | 6 (50.0%) |
| Architecture & Engineering | 0 (0.0%) | 2 (100.0%) |
| Life, Physical & Social Science | 4 (19.1%) | 17 (80.9%) |
| Community & Social Service | 34 (41.0%) | 49 (59.0%) |
| Education, Arts & Media | 10 (76.9%) | 3 (23.1%) |
| Legal Services & Support | 0 (0.0%) | 0 (0.0%) |
| Education Instruction & Library | 10 (20.4%) | 39 (79.6%) |
| Arts, Media & Entertainment | 14 (66.7%) | 7 (33.3%) |
| Health Diagnosing & Treating | 5 (8.2%) | 56 (91.8%) |
| Health Technologists | 5 (16.1%) | 26 (83.9%) |
| Total (Category) | 122 (39.1%) | 190 (60.9%) |
| Total (Overall) | 547 (53.5%) | 476 (46.5%) |
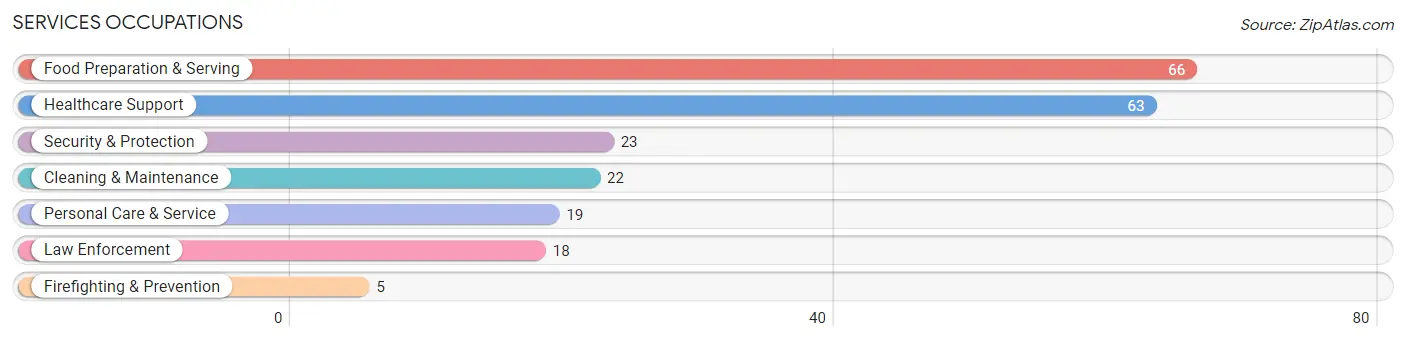
Services Occupations
The most common Services occupations in Jonestown borough are Food Preparation & Serving (66 | 6.5%), Healthcare Support (63 | 6.2%), Security & Protection (23 | 2.2%), Cleaning & Maintenance (22 | 2.1%), and Personal Care & Service (19 | 1.9%).
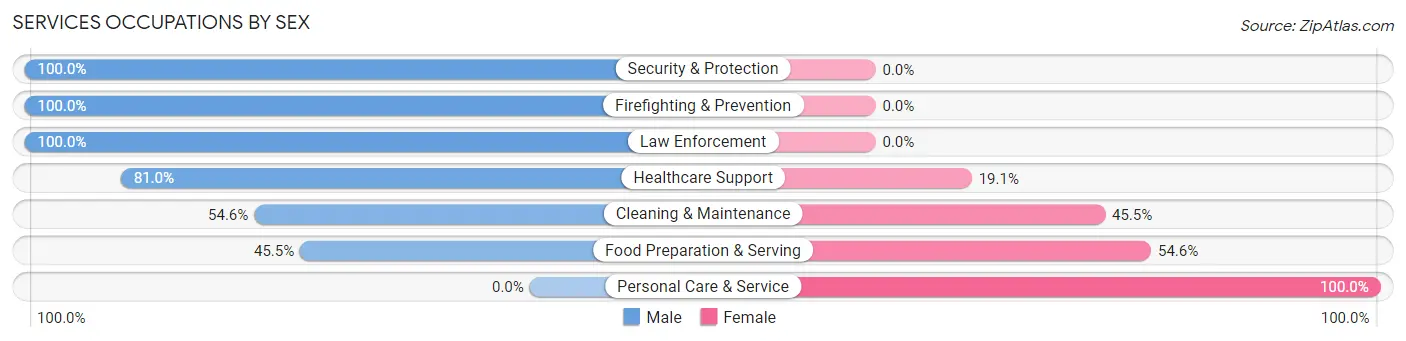
Services Occupations by Sex
Within the Services occupations in Jonestown borough, the most male-oriented occupations are Security & Protection (100.0%), Firefighting & Prevention (100.0%), and Law Enforcement (100.0%), while the most female-oriented occupations are Personal Care & Service (100.0%), Food Preparation & Serving (54.5%), and Cleaning & Maintenance (45.5%).
| Occupation | Male | Female |
| Healthcare Support | 51 (80.9%) | 12 (19.1%) |
| Security & Protection | 23 (100.0%) | 0 (0.0%) |
| Firefighting & Prevention | 5 (100.0%) | 0 (0.0%) |
| Law Enforcement | 18 (100.0%) | 0 (0.0%) |
| Food Preparation & Serving | 30 (45.5%) | 36 (54.5%) |
| Cleaning & Maintenance | 12 (54.5%) | 10 (45.5%) |
| Personal Care & Service | 0 (0.0%) | 19 (100.0%) |
| Total (Category) | 116 (60.1%) | 77 (39.9%) |
| Total (Overall) | 547 (53.5%) | 476 (46.5%) |
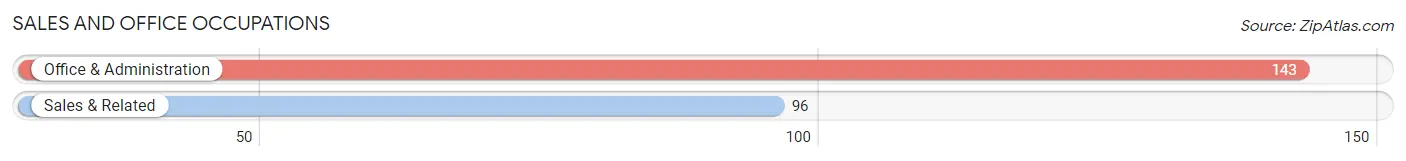
Sales and Office Occupations
The most common Sales and Office occupations in Jonestown borough are Office & Administration (143 | 14.0%), and Sales & Related (96 | 9.4%).
Sales and Office Occupations by Sex
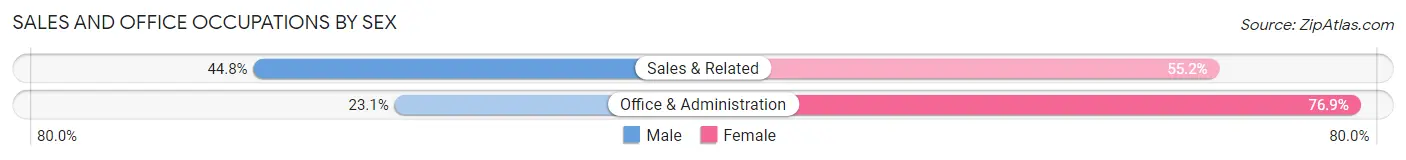
| Occupation | Male | Female |
| Sales & Related | 43 (44.8%) | 53 (55.2%) |
| Office & Administration | 33 (23.1%) | 110 (76.9%) |
| Total (Category) | 76 (31.8%) | 163 (68.2%) |
| Total (Overall) | 547 (53.5%) | 476 (46.5%) |
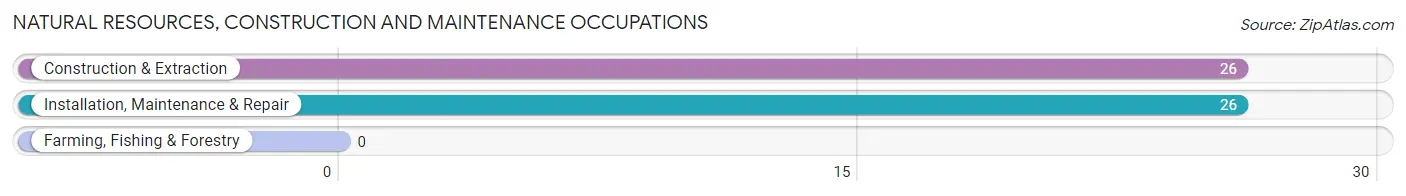
Natural Resources, Construction and Maintenance Occupations
The most common Natural Resources, Construction and Maintenance occupations in Jonestown borough are Construction & Extraction (26 | 2.5%), and Installation, Maintenance & Repair (26 | 2.5%).
Natural Resources, Construction and Maintenance Occupations by Sex
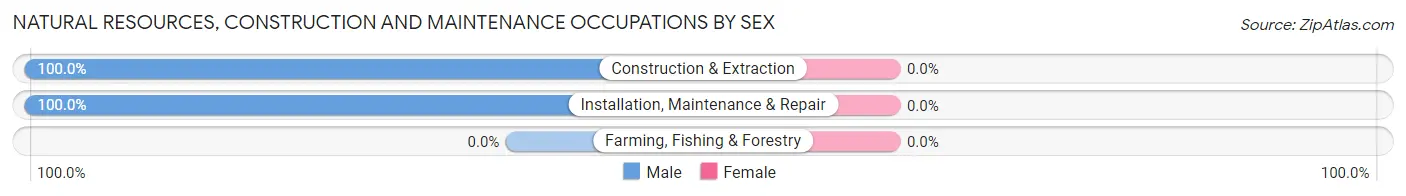
| Occupation | Male | Female |
| Farming, Fishing & Forestry | 0 (0.0%) | 0 (0.0%) |
| Construction & Extraction | 26 (100.0%) | 0 (0.0%) |
| Installation, Maintenance & Repair | 26 (100.0%) | 0 (0.0%) |
| Total (Category) | 52 (100.0%) | 0 (0.0%) |
| Total (Overall) | 547 (53.5%) | 476 (46.5%) |
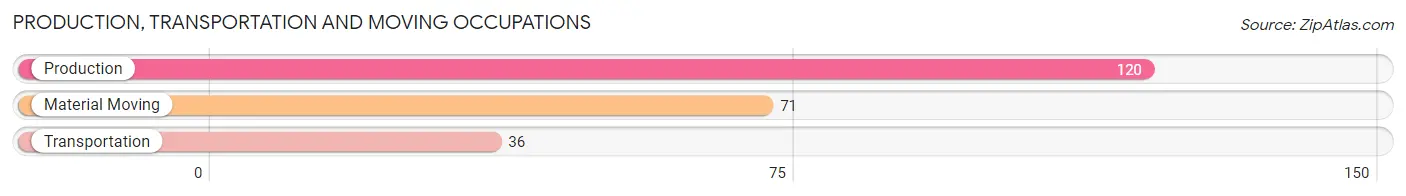
Production, Transportation and Moving Occupations
The most common Production, Transportation and Moving occupations in Jonestown borough are Production (120 | 11.7%), Material Moving (71 | 6.9%), and Transportation (36 | 3.5%).
Production, Transportation and Moving Occupations by Sex
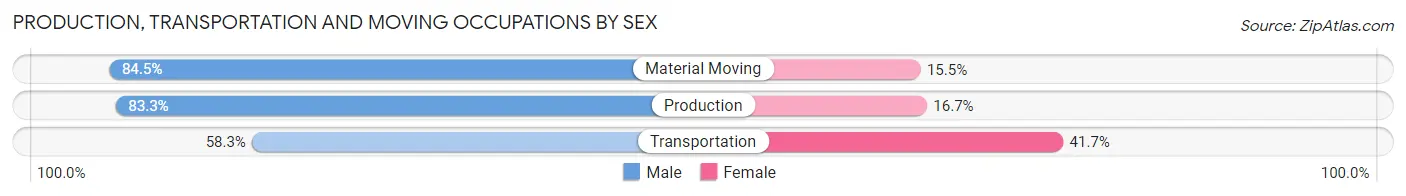
| Occupation | Male | Female |
| Production | 100 (83.3%) | 20 (16.7%) |
| Transportation | 21 (58.3%) | 15 (41.7%) |
| Material Moving | 60 (84.5%) | 11 (15.5%) |
| Total (Category) | 181 (79.7%) | 46 (20.3%) |
| Total (Overall) | 547 (53.5%) | 476 (46.5%) |
Employment Industries by Sex in Jonestown borough
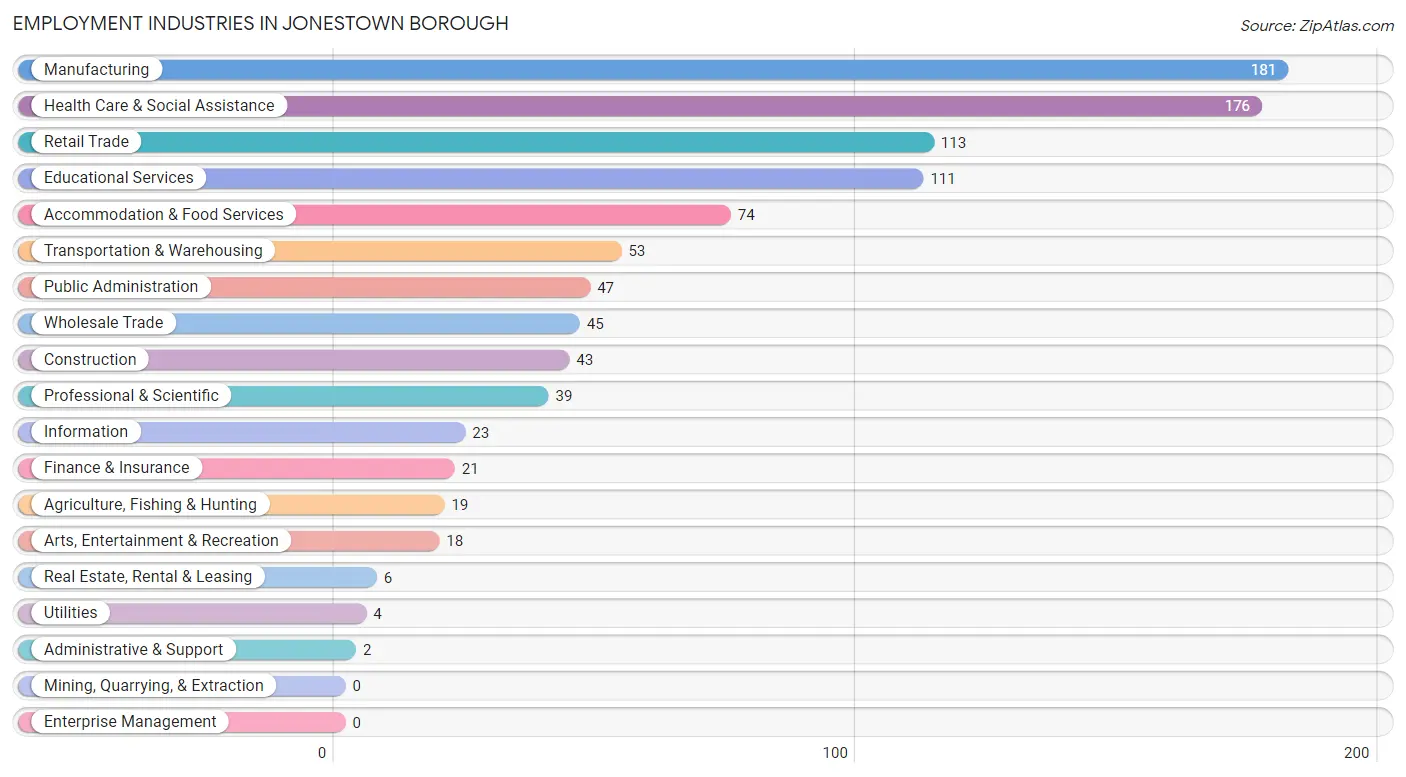
Employment Industries in Jonestown borough
The major employment industries in Jonestown borough include Manufacturing (181 | 17.7%), Health Care & Social Assistance (176 | 17.2%), Retail Trade (113 | 11.1%), Educational Services (111 | 10.8%), and Accommodation & Food Services (74 | 7.2%).
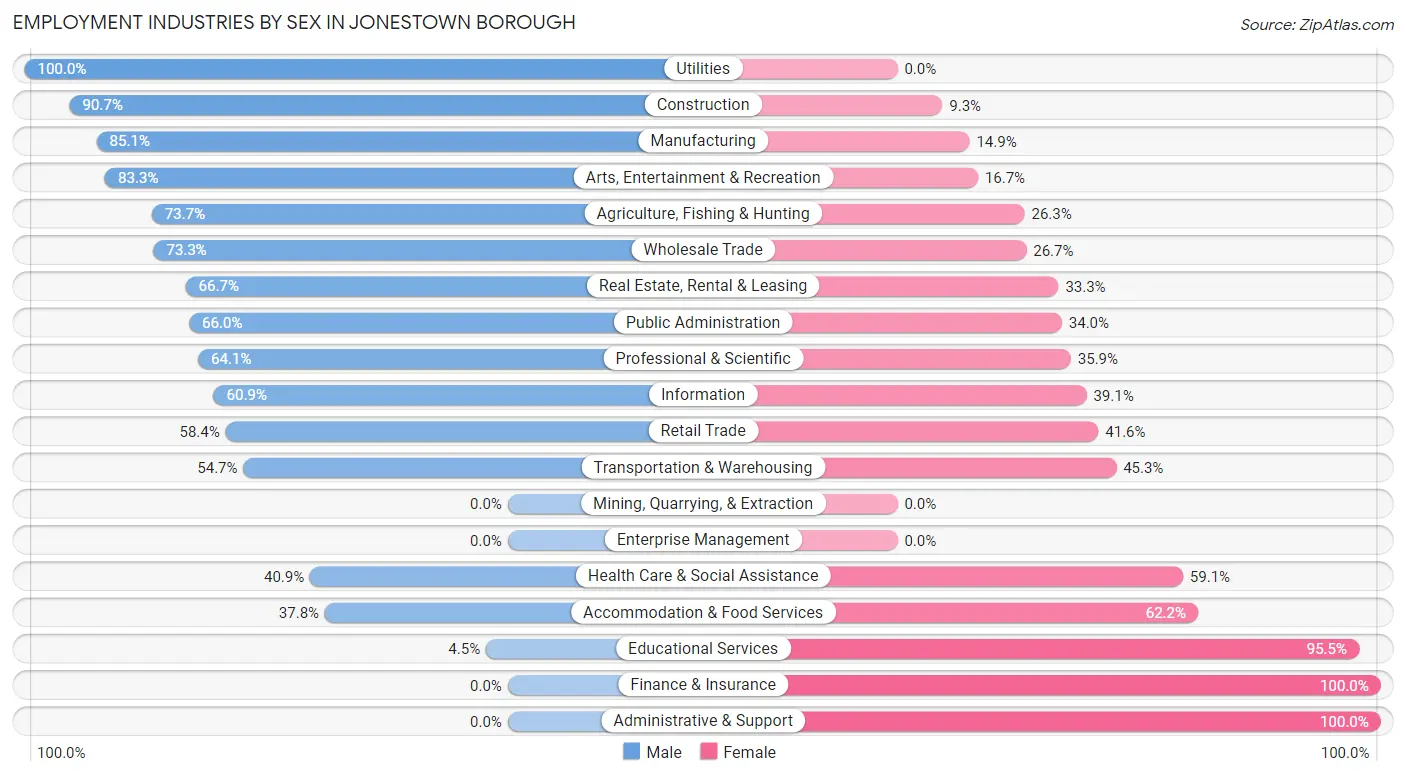
Employment Industries by Sex in Jonestown borough
The Jonestown borough industries that see more men than women are Utilities (100.0%), Construction (90.7%), and Manufacturing (85.1%), whereas the industries that tend to have a higher number of women are Finance & Insurance (100.0%), Administrative & Support (100.0%), and Educational Services (95.5%).
| Industry | Male | Female |
| Agriculture, Fishing & Hunting | 14 (73.7%) | 5 (26.3%) |
| Mining, Quarrying, & Extraction | 0 (0.0%) | 0 (0.0%) |
| Construction | 39 (90.7%) | 4 (9.3%) |
| Manufacturing | 154 (85.1%) | 27 (14.9%) |
| Wholesale Trade | 33 (73.3%) | 12 (26.7%) |
| Retail Trade | 66 (58.4%) | 47 (41.6%) |
| Transportation & Warehousing | 29 (54.7%) | 24 (45.3%) |
| Utilities | 4 (100.0%) | 0 (0.0%) |
| Information | 14 (60.9%) | 9 (39.1%) |
| Finance & Insurance | 0 (0.0%) | 21 (100.0%) |
| Real Estate, Rental & Leasing | 4 (66.7%) | 2 (33.3%) |
| Professional & Scientific | 25 (64.1%) | 14 (35.9%) |
| Enterprise Management | 0 (0.0%) | 0 (0.0%) |
| Administrative & Support | 0 (0.0%) | 2 (100.0%) |
| Educational Services | 5 (4.5%) | 106 (95.5%) |
| Health Care & Social Assistance | 72 (40.9%) | 104 (59.1%) |
| Arts, Entertainment & Recreation | 15 (83.3%) | 3 (16.7%) |
| Accommodation & Food Services | 28 (37.8%) | 46 (62.2%) |
| Public Administration | 31 (66.0%) | 16 (34.0%) |
| Total | 547 (53.5%) | 476 (46.5%) |
Education in Jonestown borough
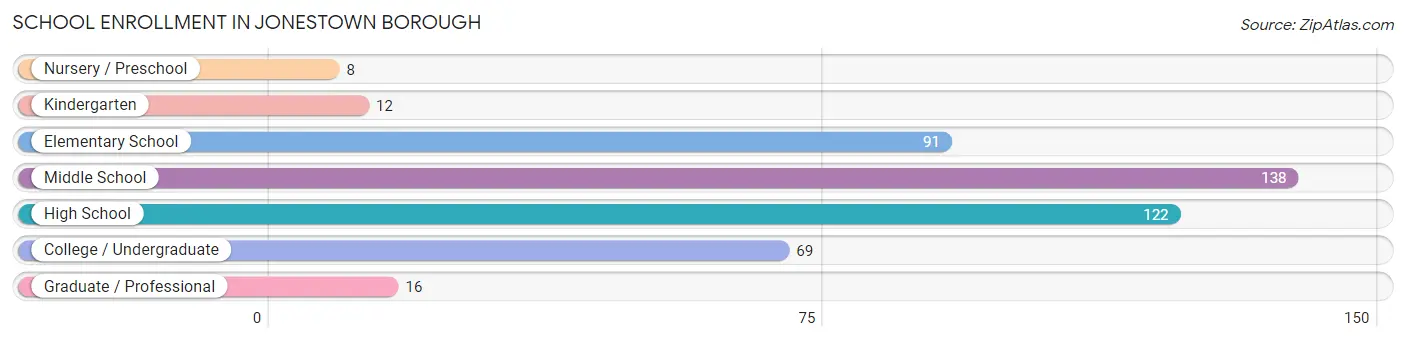
School Enrollment in Jonestown borough
The most common levels of schooling among the 456 students in Jonestown borough are middle school (138 | 30.3%), high school (122 | 26.8%), and elementary school (91 | 20.0%).
| School Level | # Students | % Students |
| Nursery / Preschool | 8 | 1.8% |
| Kindergarten | 12 | 2.6% |
| Elementary School | 91 | 20.0% |
| Middle School | 138 | 30.3% |
| High School | 122 | 26.8% |
| College / Undergraduate | 69 | 15.1% |
| Graduate / Professional | 16 | 3.5% |
| Total | 456 | 100.0% |
School Enrollment by Age by Funding Source in Jonestown borough
Out of a total of 456 students who are enrolled in schools in Jonestown borough, 84 (18.4%) attend a private institution, while the remaining 372 (81.6%) are enrolled in public schools. The age group of 3 to 4 year olds has the highest likelihood of being enrolled in private schools, with 5 (62.5% in the age bracket) enrolled. Conversely, the age group of 20 to 24 year olds has the lowest likelihood of being enrolled in a private school, with 35 (100.0% in the age bracket) attending a public institution.
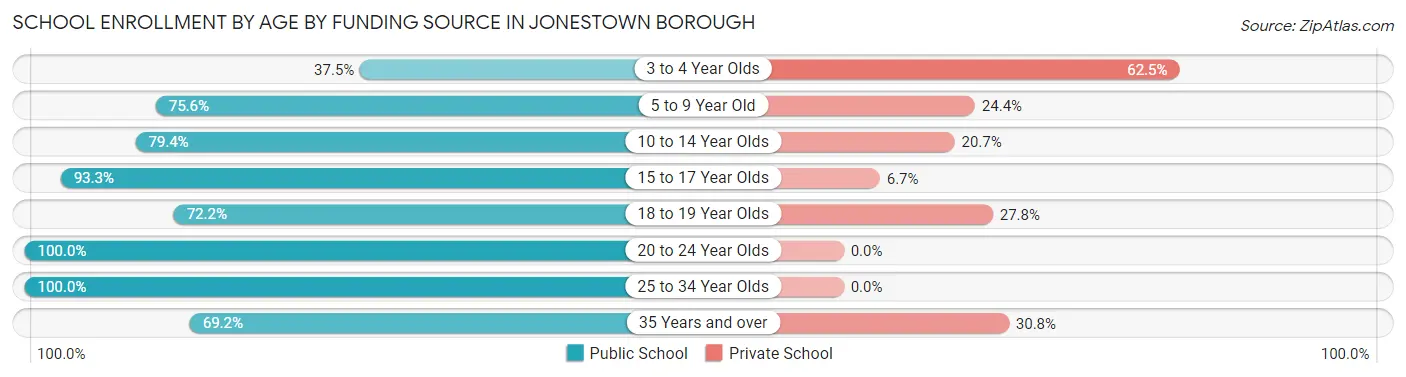
| Age Bracket | Public School | Private School |
| 3 to 4 Year Olds | 3 (37.5%) | 5 (62.5%) |
| 5 to 9 Year Old | 68 (75.6%) | 22 (24.4%) |
| 10 to 14 Year Olds | 123 (79.3%) | 32 (20.6%) |
| 15 to 17 Year Olds | 97 (93.3%) | 7 (6.7%) |
| 18 to 19 Year Olds | 26 (72.2%) | 10 (27.8%) |
| 20 to 24 Year Olds | 35 (100.0%) | 0 (0.0%) |
| 25 to 34 Year Olds | 2 (100.0%) | 0 (0.0%) |
| 35 Years and over | 18 (69.2%) | 8 (30.8%) |
| Total | 372 (81.6%) | 84 (18.4%) |
Educational Attainment by Field of Study in Jonestown borough
Business (60 | 21.0%), science & technology (44 | 15.4%), psychology (36 | 12.6%), bio, nature & agricultural (27 | 9.4%), and education (24 | 8.4%) are the most common fields of study among 286 individuals in Jonestown borough who have obtained a bachelor's degree or higher.
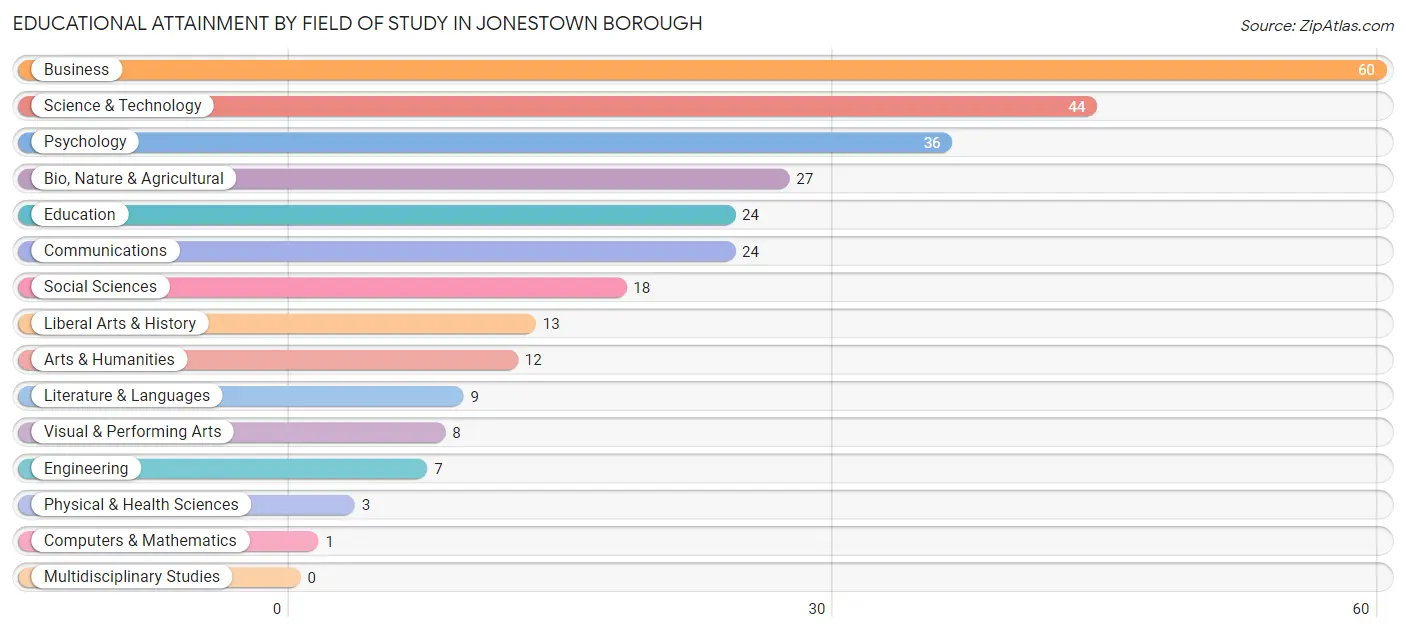
| Field of Study | # Graduates | % Graduates |
| Computers & Mathematics | 1 | 0.4% |
| Bio, Nature & Agricultural | 27 | 9.4% |
| Physical & Health Sciences | 3 | 1.1% |
| Psychology | 36 | 12.6% |
| Social Sciences | 18 | 6.3% |
| Engineering | 7 | 2.5% |
| Multidisciplinary Studies | 0 | 0.0% |
| Science & Technology | 44 | 15.4% |
| Business | 60 | 21.0% |
| Education | 24 | 8.4% |
| Literature & Languages | 9 | 3.2% |
| Liberal Arts & History | 13 | 4.5% |
| Visual & Performing Arts | 8 | 2.8% |
| Communications | 24 | 8.4% |
| Arts & Humanities | 12 | 4.2% |
| Total | 286 | 100.0% |
Transportation & Commute in Jonestown borough
Vehicle Availability by Sex in Jonestown borough
The most prevalent vehicle ownership categories in Jonestown borough are males with 2 vehicles (319, accounting for 54.8%) and females with 2 vehicles (272, making up 64.3%).
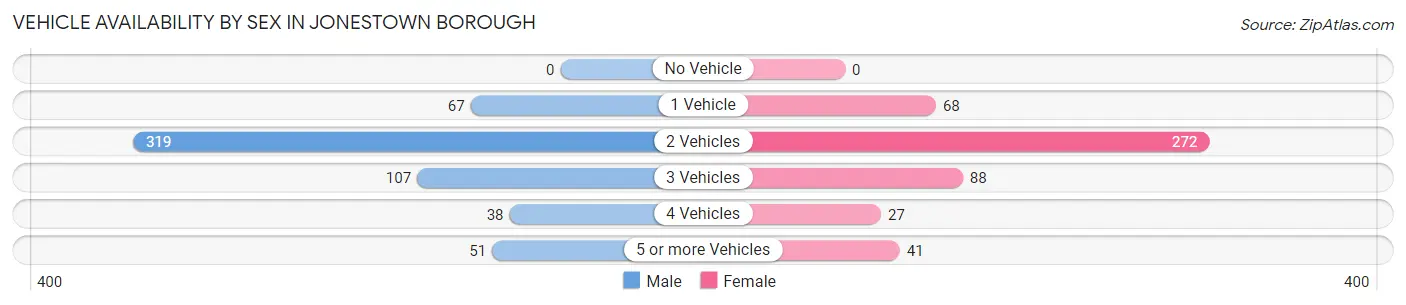
| Vehicles Available | Male | Female |
| No Vehicle | 0 (0.0%) | 0 (0.0%) |
| 1 Vehicle | 67 (11.5%) | 68 (13.7%) |
| 2 Vehicles | 319 (54.8%) | 272 (54.8%) |
| 3 Vehicles | 107 (18.4%) | 88 (17.7%) |
| 4 Vehicles | 38 (6.5%) | 27 (5.4%) |
| 5 or more Vehicles | 51 (8.8%) | 41 (8.3%) |
| Total | 582 (100.0%) | 496 (100.0%) |
Commute Time in Jonestown borough
The most frequently occuring commute durations in Jonestown borough are 20 to 24 minutes (174 commuters, 18.1%), 25 to 29 minutes (139 commuters, 14.5%), and 30 to 34 minutes (124 commuters, 12.9%).
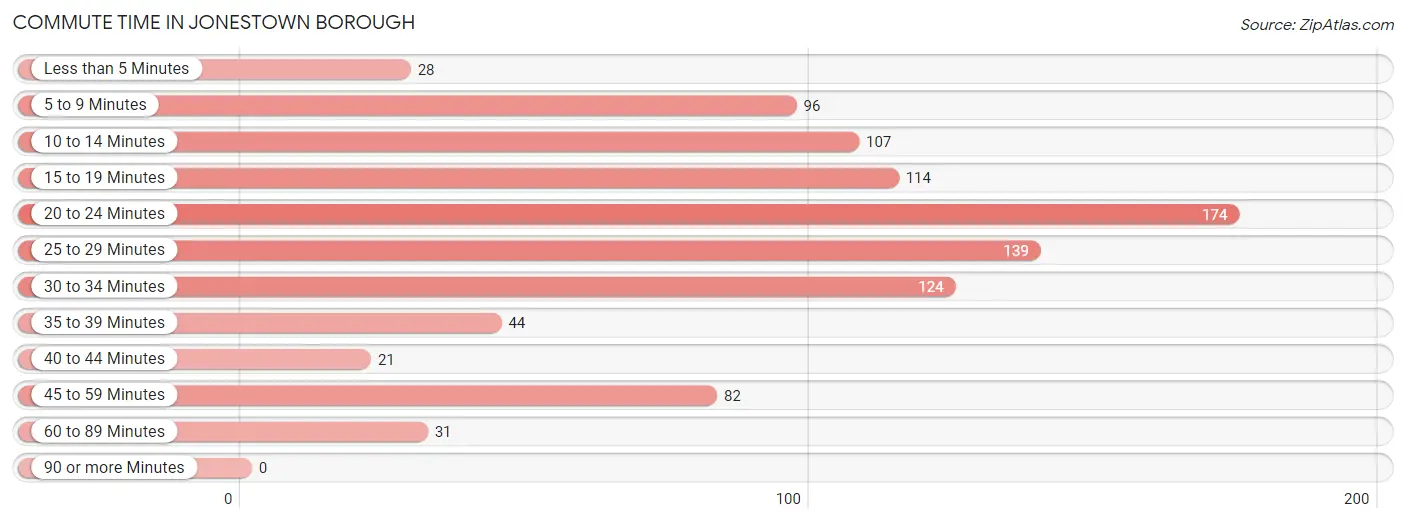
| Commute Time | # Commuters | % Commuters |
| Less than 5 Minutes | 28 | 2.9% |
| 5 to 9 Minutes | 96 | 10.0% |
| 10 to 14 Minutes | 107 | 11.2% |
| 15 to 19 Minutes | 114 | 11.9% |
| 20 to 24 Minutes | 174 | 18.1% |
| 25 to 29 Minutes | 139 | 14.5% |
| 30 to 34 Minutes | 124 | 12.9% |
| 35 to 39 Minutes | 44 | 4.6% |
| 40 to 44 Minutes | 21 | 2.2% |
| 45 to 59 Minutes | 82 | 8.5% |
| 60 to 89 Minutes | 31 | 3.2% |
| 90 or more Minutes | 0 | 0.0% |
Commute Time by Sex in Jonestown borough
The most common commute times in Jonestown borough are 20 to 24 minutes (118 commuters, 22.3%) for males and 10 to 14 minutes (75 commuters, 17.4%) for females.
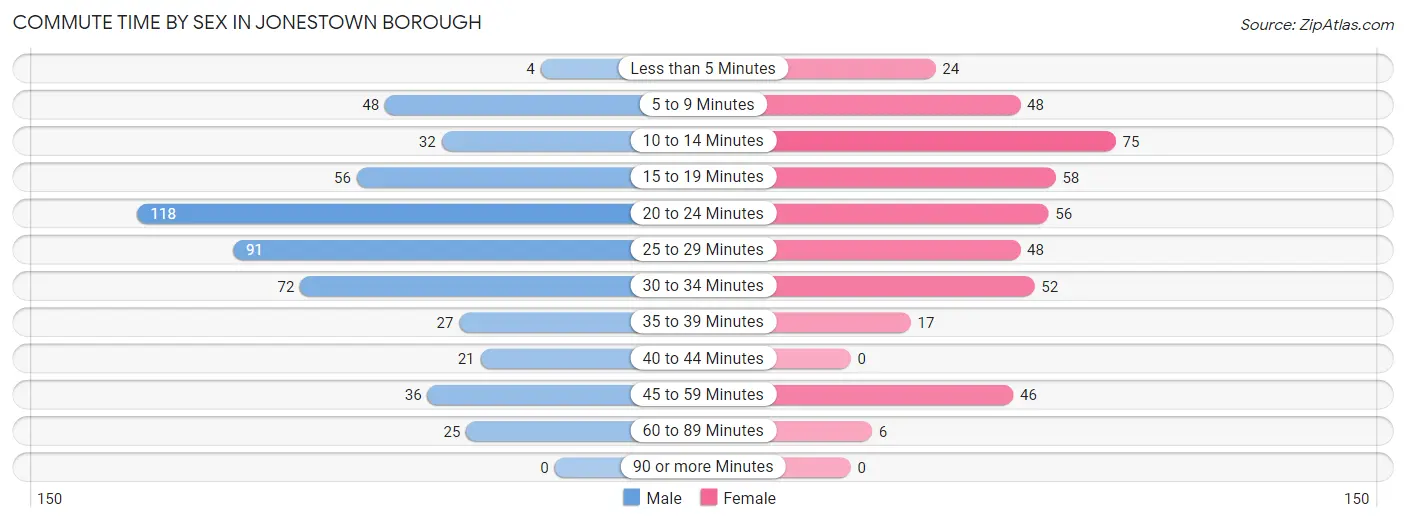
| Commute Time | Male | Female |
| Less than 5 Minutes | 4 (0.7%) | 24 (5.6%) |
| 5 to 9 Minutes | 48 (9.1%) | 48 (11.2%) |
| 10 to 14 Minutes | 32 (6.0%) | 75 (17.4%) |
| 15 to 19 Minutes | 56 (10.6%) | 58 (13.5%) |
| 20 to 24 Minutes | 118 (22.3%) | 56 (13.0%) |
| 25 to 29 Minutes | 91 (17.2%) | 48 (11.2%) |
| 30 to 34 Minutes | 72 (13.6%) | 52 (12.1%) |
| 35 to 39 Minutes | 27 (5.1%) | 17 (4.0%) |
| 40 to 44 Minutes | 21 (4.0%) | 0 (0.0%) |
| 45 to 59 Minutes | 36 (6.8%) | 46 (10.7%) |
| 60 to 89 Minutes | 25 (4.7%) | 6 (1.4%) |
| 90 or more Minutes | 0 (0.0%) | 0 (0.0%) |
Time of Departure to Work by Sex in Jonestown borough
The most frequent times of departure to work in Jonestown borough are 5:00 AM to 5:29 AM (87, 16.4%) for males and 7:00 AM to 7:29 AM (104, 24.2%) for females.
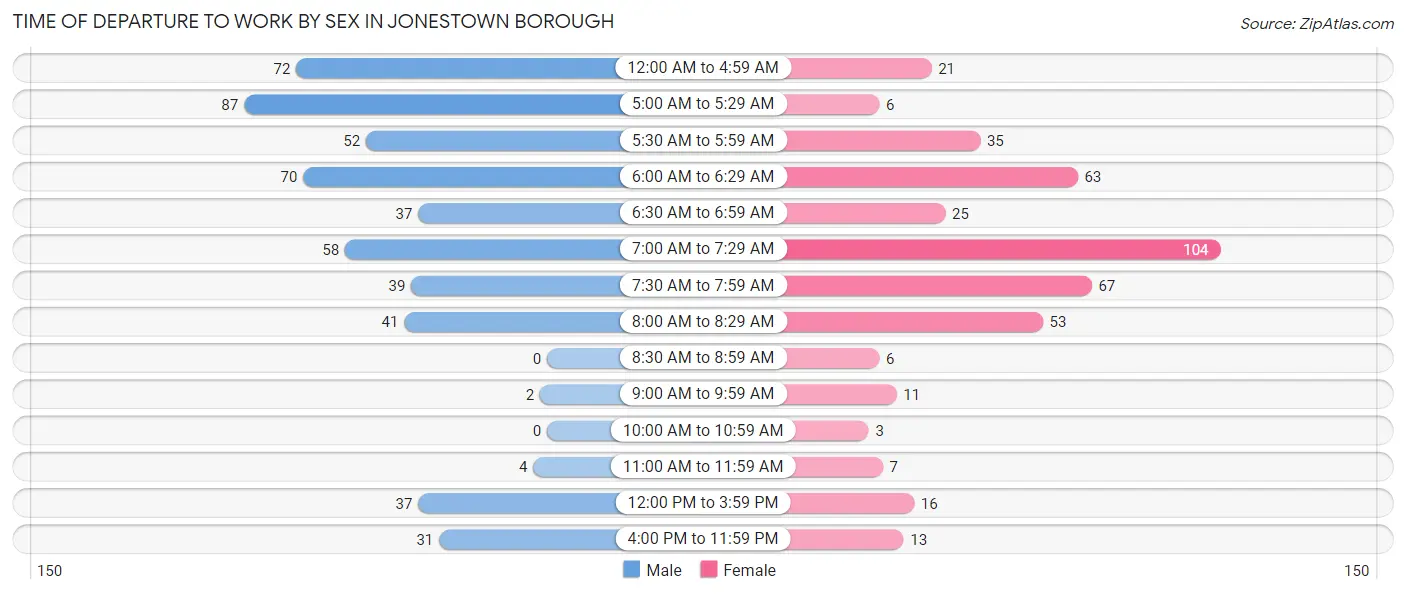
| Time of Departure | Male | Female |
| 12:00 AM to 4:59 AM | 72 (13.6%) | 21 (4.9%) |
| 5:00 AM to 5:29 AM | 87 (16.4%) | 6 (1.4%) |
| 5:30 AM to 5:59 AM | 52 (9.8%) | 35 (8.1%) |
| 6:00 AM to 6:29 AM | 70 (13.2%) | 63 (14.6%) |
| 6:30 AM to 6:59 AM | 37 (7.0%) | 25 (5.8%) |
| 7:00 AM to 7:29 AM | 58 (10.9%) | 104 (24.2%) |
| 7:30 AM to 7:59 AM | 39 (7.4%) | 67 (15.6%) |
| 8:00 AM to 8:29 AM | 41 (7.7%) | 53 (12.3%) |
| 8:30 AM to 8:59 AM | 0 (0.0%) | 6 (1.4%) |
| 9:00 AM to 9:59 AM | 2 (0.4%) | 11 (2.6%) |
| 10:00 AM to 10:59 AM | 0 (0.0%) | 3 (0.7%) |
| 11:00 AM to 11:59 AM | 4 (0.7%) | 7 (1.6%) |
| 12:00 PM to 3:59 PM | 37 (7.0%) | 16 (3.7%) |
| 4:00 PM to 11:59 PM | 31 (5.9%) | 13 (3.0%) |
| Total | 530 (100.0%) | 430 (100.0%) |
Housing Occupancy in Jonestown borough
Occupancy by Ownership in Jonestown borough
Of the total 697 dwellings in Jonestown borough, owner-occupied units account for 531 (76.2%), while renter-occupied units make up 166 (23.8%).
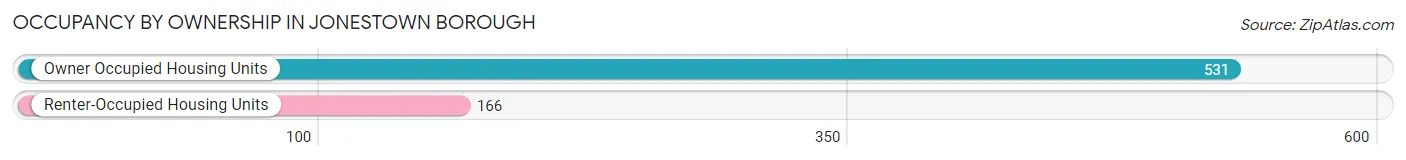
| Occupancy | # Housing Units | % Housing Units |
| Owner Occupied Housing Units | 531 | 76.2% |
| Renter-Occupied Housing Units | 166 | 23.8% |
| Total Occupied Housing Units | 697 | 100.0% |
Occupancy by Household Size in Jonestown borough
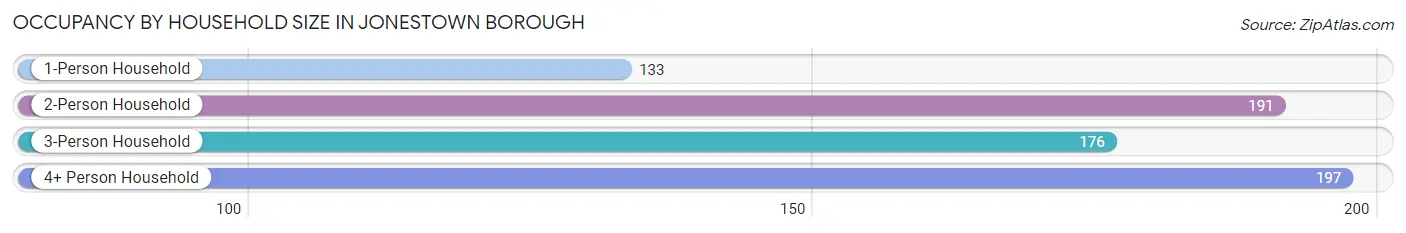
| Household Size | # Housing Units | % Housing Units |
| 1-Person Household | 133 | 19.1% |
| 2-Person Household | 191 | 27.4% |
| 3-Person Household | 176 | 25.3% |
| 4+ Person Household | 197 | 28.3% |
| Total Housing Units | 697 | 100.0% |
Occupancy by Ownership by Household Size in Jonestown borough
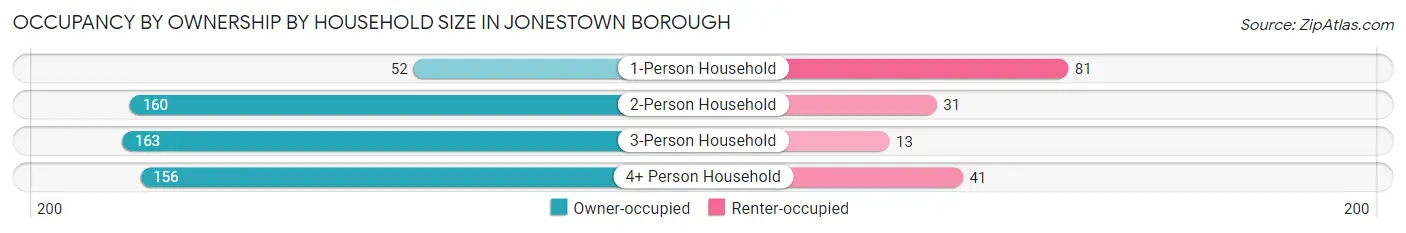
| Household Size | Owner-occupied | Renter-occupied |
| 1-Person Household | 52 (39.1%) | 81 (60.9%) |
| 2-Person Household | 160 (83.8%) | 31 (16.2%) |
| 3-Person Household | 163 (92.6%) | 13 (7.4%) |
| 4+ Person Household | 156 (79.2%) | 41 (20.8%) |
| Total Housing Units | 531 (76.2%) | 166 (23.8%) |
Occupancy by Educational Attainment in Jonestown borough
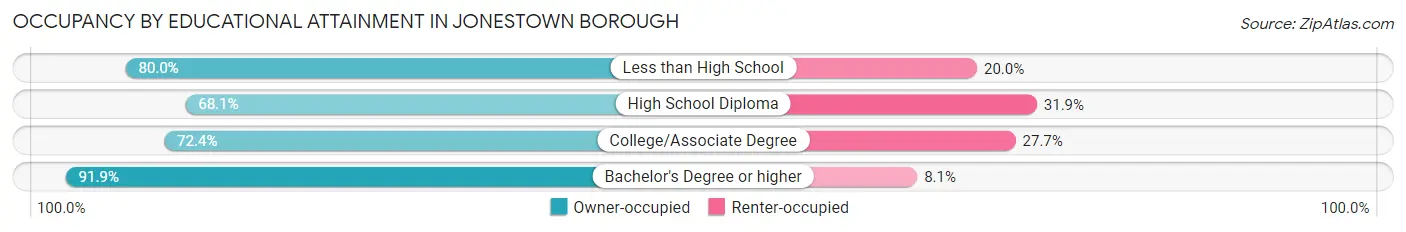
| Household Size | Owner-occupied | Renter-occupied |
| Less than High School | 28 (80.0%) | 7 (20.0%) |
| High School Diploma | 154 (68.1%) | 72 (31.9%) |
| College/Associate Degree | 191 (72.4%) | 73 (27.7%) |
| Bachelor's Degree or higher | 158 (91.9%) | 14 (8.1%) |
Occupancy by Age of Householder in Jonestown borough
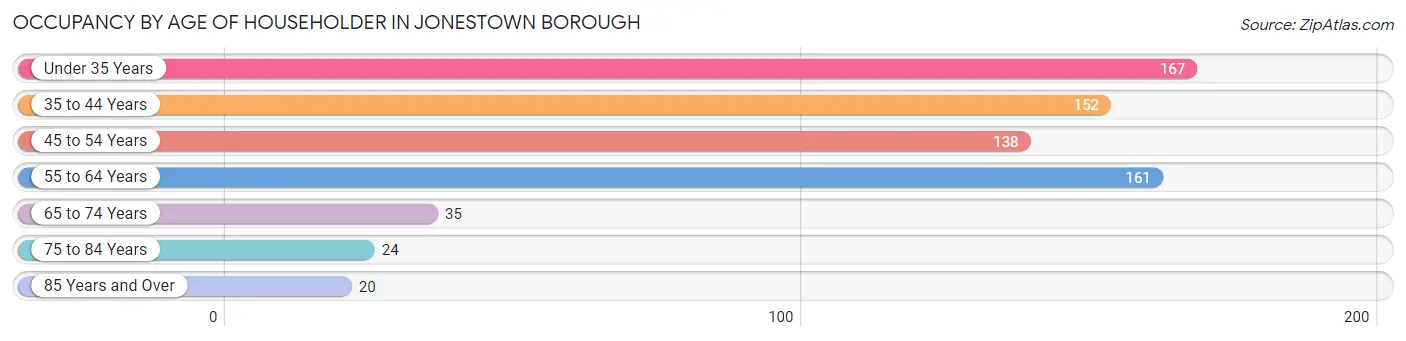
| Age Bracket | # Households | % Households |
| Under 35 Years | 167 | 24.0% |
| 35 to 44 Years | 152 | 21.8% |
| 45 to 54 Years | 138 | 19.8% |
| 55 to 64 Years | 161 | 23.1% |
| 65 to 74 Years | 35 | 5.0% |
| 75 to 84 Years | 24 | 3.4% |
| 85 Years and Over | 20 | 2.9% |
| Total | 697 | 100.0% |
Housing Finances in Jonestown borough
Median Income by Occupancy in Jonestown borough
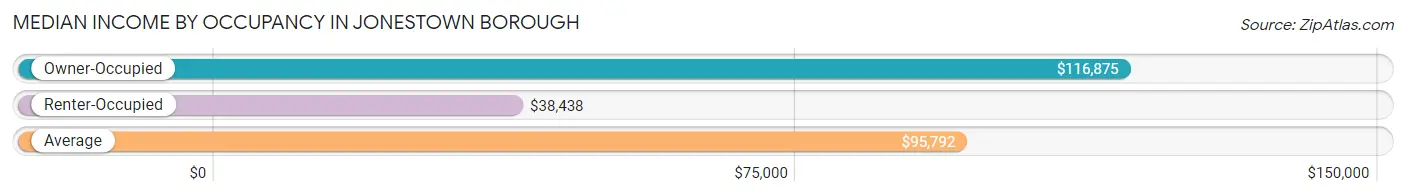
| Occupancy Type | # Households | Median Income |
| Owner-Occupied | 531 (76.2%) | $116,875 |
| Renter-Occupied | 166 (23.8%) | $38,438 |
| Average | 697 (100.0%) | $95,792 |
Occupancy by Householder Income Bracket in Jonestown borough
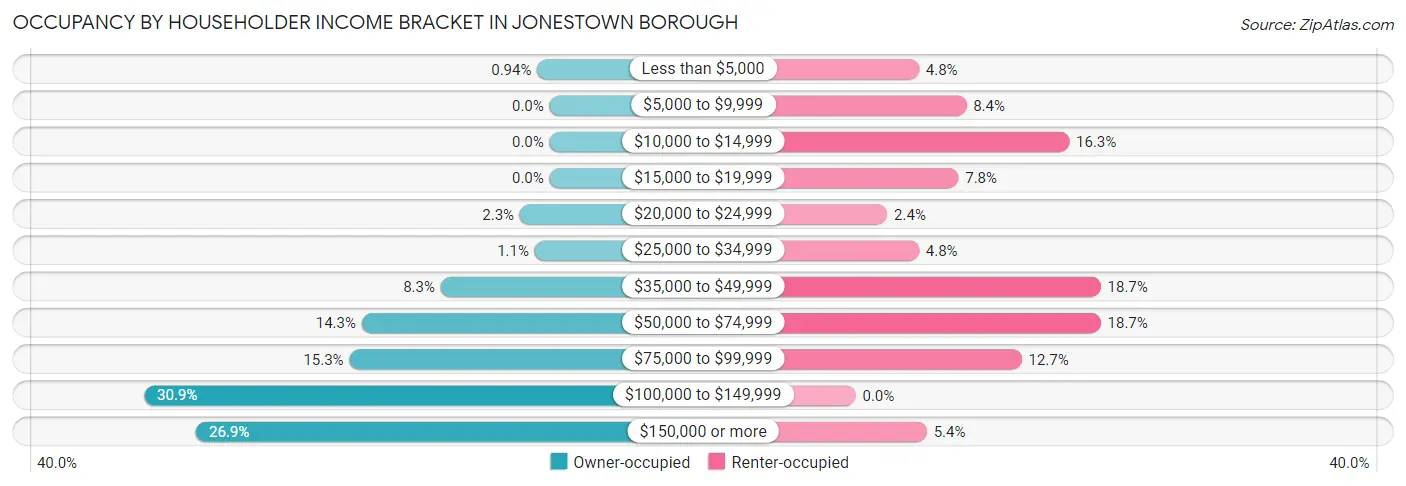
| Income Bracket | Owner-occupied | Renter-occupied |
| Less than $5,000 | 5 (0.9%) | 8 (4.8%) |
| $5,000 to $9,999 | 0 (0.0%) | 14 (8.4%) |
| $10,000 to $14,999 | 0 (0.0%) | 27 (16.3%) |
| $15,000 to $19,999 | 0 (0.0%) | 13 (7.8%) |
| $20,000 to $24,999 | 12 (2.3%) | 4 (2.4%) |
| $25,000 to $34,999 | 6 (1.1%) | 8 (4.8%) |
| $35,000 to $49,999 | 44 (8.3%) | 31 (18.7%) |
| $50,000 to $74,999 | 76 (14.3%) | 31 (18.7%) |
| $75,000 to $99,999 | 81 (15.2%) | 21 (12.7%) |
| $100,000 to $149,999 | 164 (30.9%) | 0 (0.0%) |
| $150,000 or more | 143 (26.9%) | 9 (5.4%) |
| Total | 531 (100.0%) | 166 (100.0%) |
Monthly Housing Cost Tiers in Jonestown borough
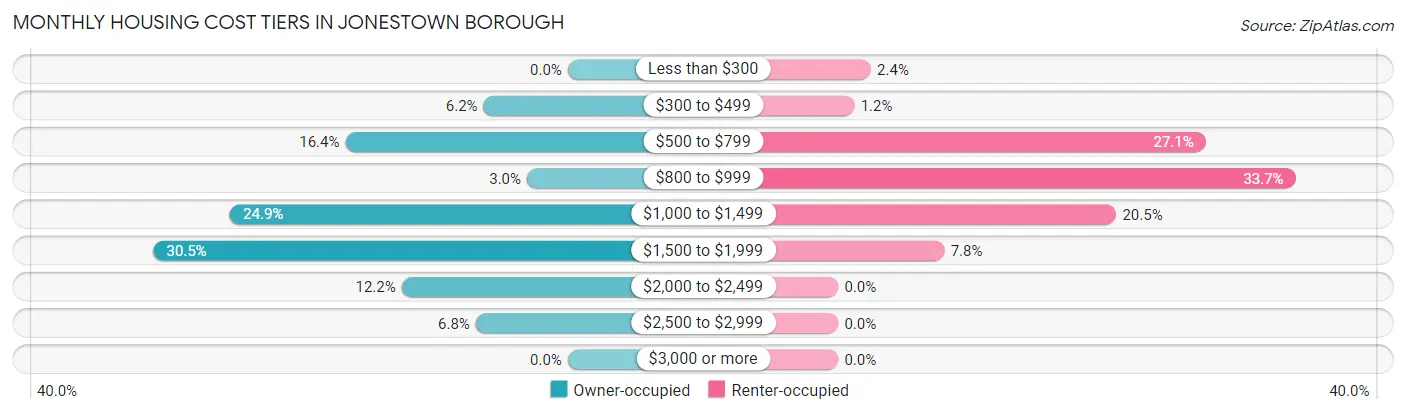
| Monthly Cost | Owner-occupied | Renter-occupied |
| Less than $300 | 0 (0.0%) | 4 (2.4%) |
| $300 to $499 | 33 (6.2%) | 2 (1.2%) |
| $500 to $799 | 87 (16.4%) | 45 (27.1%) |
| $800 to $999 | 16 (3.0%) | 56 (33.7%) |
| $1,000 to $1,499 | 132 (24.9%) | 34 (20.5%) |
| $1,500 to $1,999 | 162 (30.5%) | 13 (7.8%) |
| $2,000 to $2,499 | 65 (12.2%) | 0 (0.0%) |
| $2,500 to $2,999 | 36 (6.8%) | 0 (0.0%) |
| $3,000 or more | 0 (0.0%) | 0 (0.0%) |
| Total | 531 (100.0%) | 166 (100.0%) |
Physical Housing Characteristics in Jonestown borough
Housing Structures in Jonestown borough
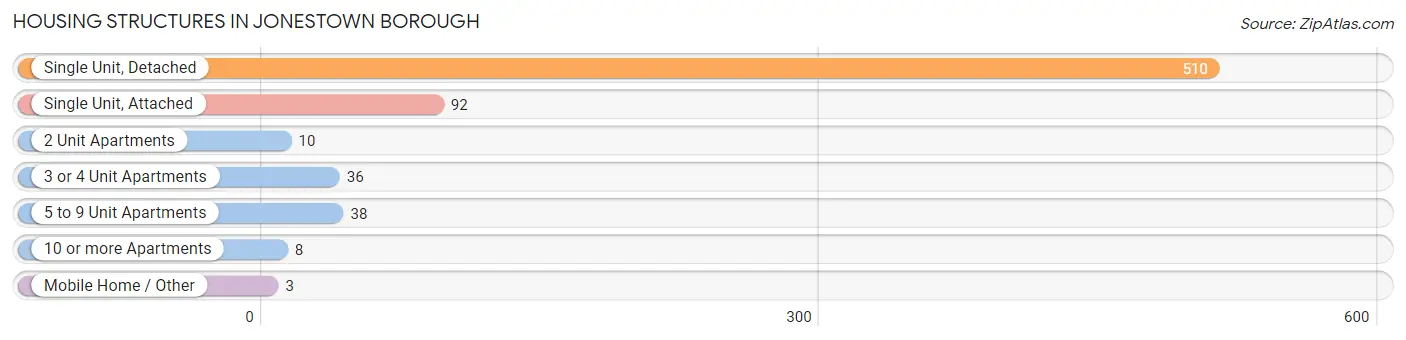
| Structure Type | # Housing Units | % Housing Units |
| Single Unit, Detached | 510 | 73.2% |
| Single Unit, Attached | 92 | 13.2% |
| 2 Unit Apartments | 10 | 1.4% |
| 3 or 4 Unit Apartments | 36 | 5.2% |
| 5 to 9 Unit Apartments | 38 | 5.4% |
| 10 or more Apartments | 8 | 1.1% |
| Mobile Home / Other | 3 | 0.4% |
| Total | 697 | 100.0% |
Housing Structures by Occupancy in Jonestown borough
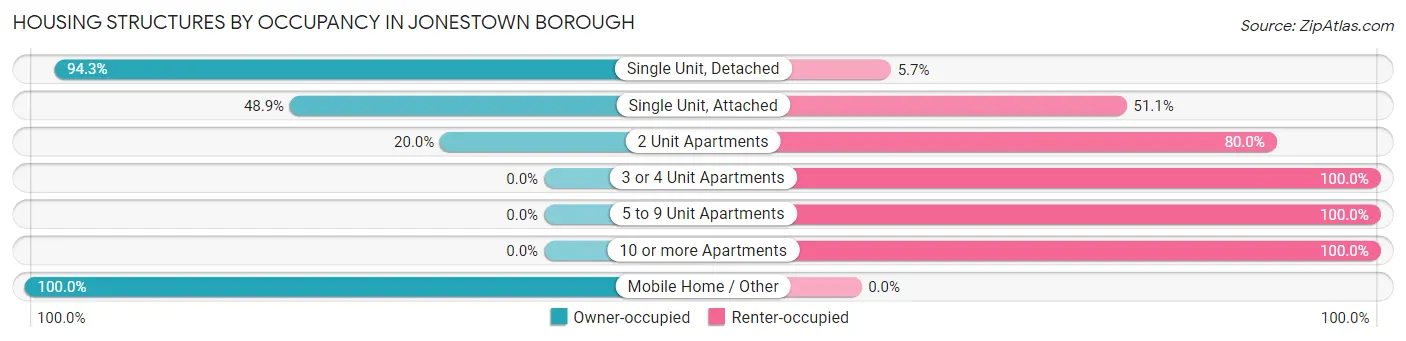
| Structure Type | Owner-occupied | Renter-occupied |
| Single Unit, Detached | 481 (94.3%) | 29 (5.7%) |
| Single Unit, Attached | 45 (48.9%) | 47 (51.1%) |
| 2 Unit Apartments | 2 (20.0%) | 8 (80.0%) |
| 3 or 4 Unit Apartments | 0 (0.0%) | 36 (100.0%) |
| 5 to 9 Unit Apartments | 0 (0.0%) | 38 (100.0%) |
| 10 or more Apartments | 0 (0.0%) | 8 (100.0%) |
| Mobile Home / Other | 3 (100.0%) | 0 (0.0%) |
| Total | 531 (76.2%) | 166 (23.8%) |
Housing Structures by Number of Rooms in Jonestown borough
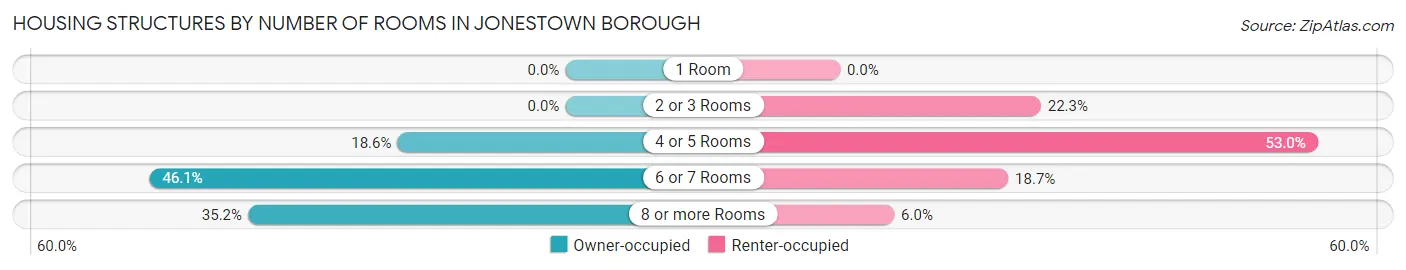
| Number of Rooms | Owner-occupied | Renter-occupied |
| 1 Room | 0 (0.0%) | 0 (0.0%) |
| 2 or 3 Rooms | 0 (0.0%) | 37 (22.3%) |
| 4 or 5 Rooms | 99 (18.6%) | 88 (53.0%) |
| 6 or 7 Rooms | 245 (46.1%) | 31 (18.7%) |
| 8 or more Rooms | 187 (35.2%) | 10 (6.0%) |
| Total | 531 (100.0%) | 166 (100.0%) |
Housing Structure by Heating Type in Jonestown borough
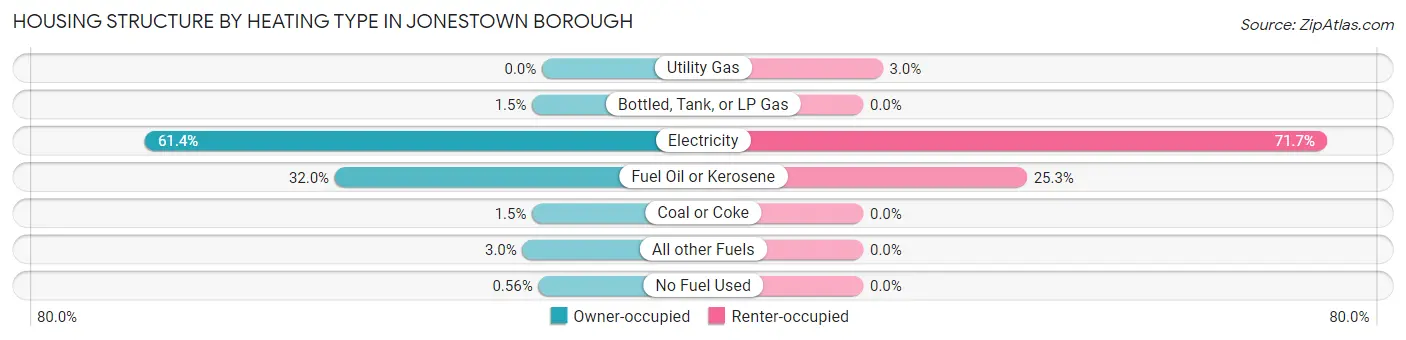
| Heating Type | Owner-occupied | Renter-occupied |
| Utility Gas | 0 (0.0%) | 5 (3.0%) |
| Bottled, Tank, or LP Gas | 8 (1.5%) | 0 (0.0%) |
| Electricity | 326 (61.4%) | 119 (71.7%) |
| Fuel Oil or Kerosene | 170 (32.0%) | 42 (25.3%) |
| Coal or Coke | 8 (1.5%) | 0 (0.0%) |
| All other Fuels | 16 (3.0%) | 0 (0.0%) |
| No Fuel Used | 3 (0.6%) | 0 (0.0%) |
| Total | 531 (100.0%) | 166 (100.0%) |
Household Vehicle Usage in Jonestown borough
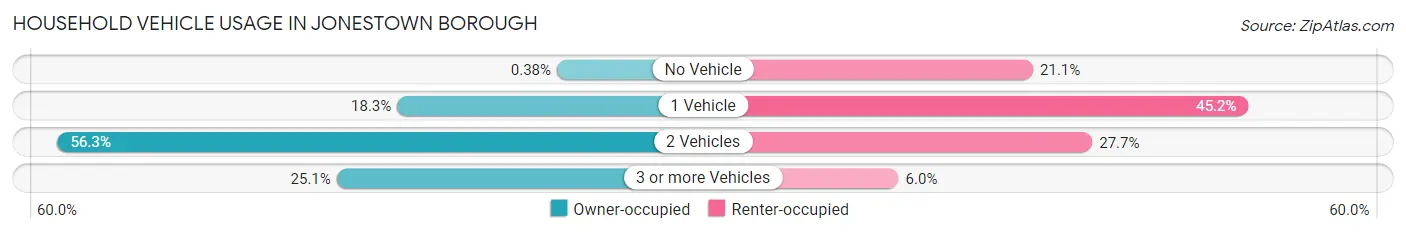
| Vehicles per Household | Owner-occupied | Renter-occupied |
| No Vehicle | 2 (0.4%) | 35 (21.1%) |
| 1 Vehicle | 97 (18.3%) | 75 (45.2%) |
| 2 Vehicles | 299 (56.3%) | 46 (27.7%) |
| 3 or more Vehicles | 133 (25.1%) | 10 (6.0%) |
| Total | 531 (100.0%) | 166 (100.0%) |
Real Estate & Mortgages in Jonestown borough
Real Estate and Mortgage Overview in Jonestown borough
| Characteristic | Without Mortgage | With Mortgage |
| Housing Units | 119 | 412 |
| Median Property Value | $249,200 | $216,000 |
| Median Household Income | $97,708 | $108 |
| Monthly Housing Costs | $565 | $0 |
| Real Estate Taxes | $2,760 | $11 |
Property Value by Mortgage Status in Jonestown borough
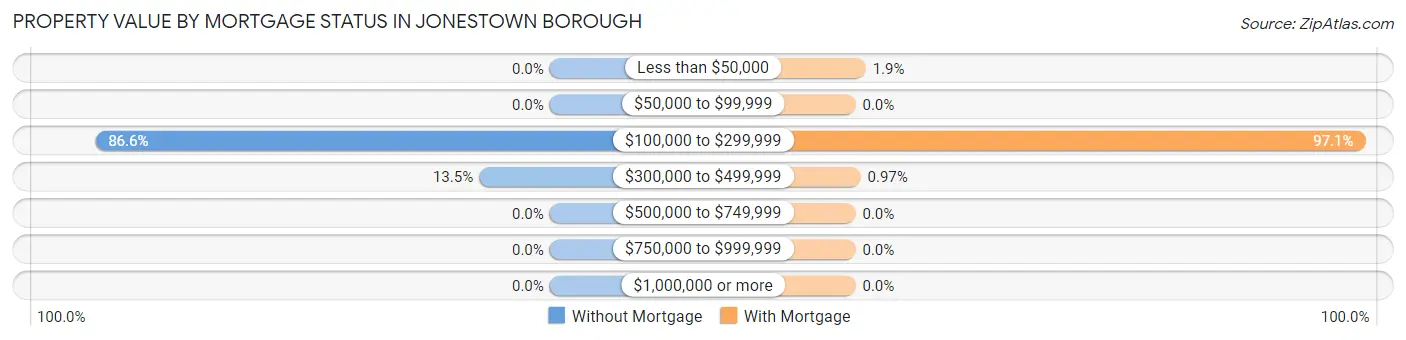
| Property Value | Without Mortgage | With Mortgage |
| Less than $50,000 | 0 (0.0%) | 8 (1.9%) |
| $50,000 to $99,999 | 0 (0.0%) | 0 (0.0%) |
| $100,000 to $299,999 | 103 (86.6%) | 400 (97.1%) |
| $300,000 to $499,999 | 16 (13.5%) | 4 (1.0%) |
| $500,000 to $749,999 | 0 (0.0%) | 0 (0.0%) |
| $750,000 to $999,999 | 0 (0.0%) | 0 (0.0%) |
| $1,000,000 or more | 0 (0.0%) | 0 (0.0%) |
| Total | 119 (100.0%) | 412 (100.0%) |
Household Income by Mortgage Status in Jonestown borough
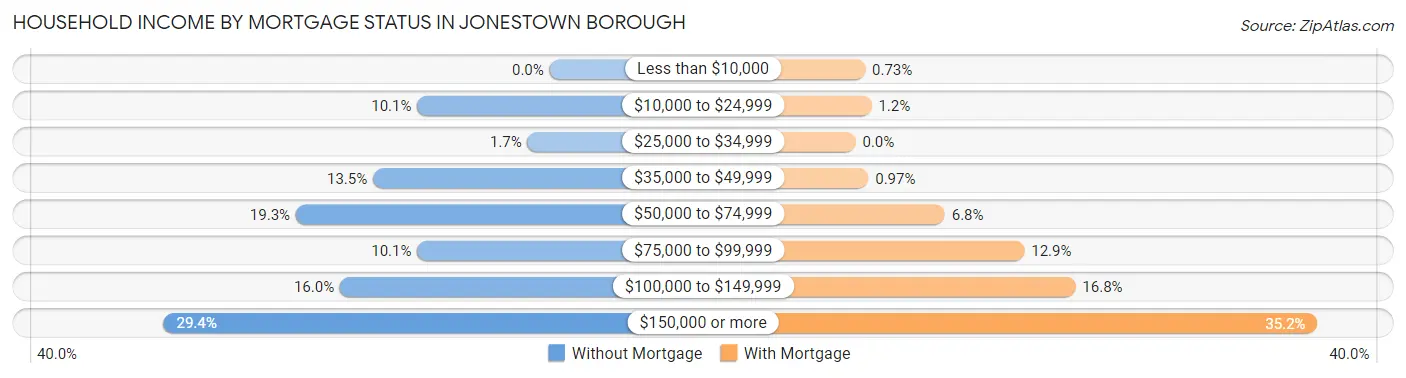
| Household Income | Without Mortgage | With Mortgage |
| Less than $10,000 | 0 (0.0%) | 3 (0.7%) |
| $10,000 to $24,999 | 12 (10.1%) | 5 (1.2%) |
| $25,000 to $34,999 | 2 (1.7%) | 0 (0.0%) |
| $35,000 to $49,999 | 16 (13.5%) | 4 (1.0%) |
| $50,000 to $74,999 | 23 (19.3%) | 28 (6.8%) |
| $75,000 to $99,999 | 12 (10.1%) | 53 (12.9%) |
| $100,000 to $149,999 | 19 (16.0%) | 69 (16.8%) |
| $150,000 or more | 35 (29.4%) | 145 (35.2%) |
| Total | 119 (100.0%) | 412 (100.0%) |
Property Value to Household Income Ratio in Jonestown borough
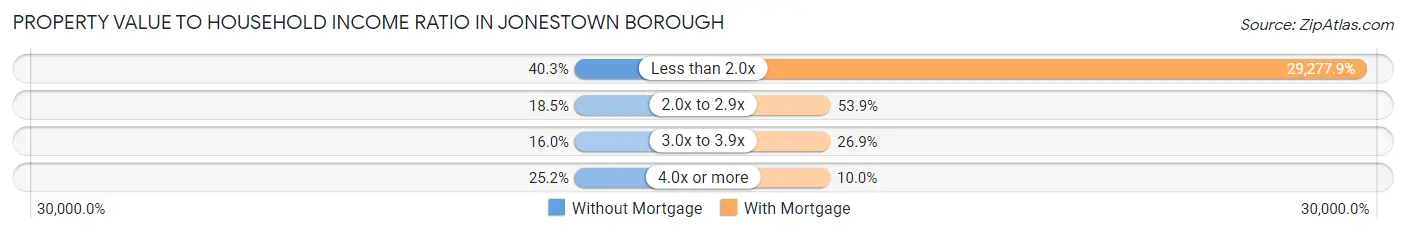
| Value-to-Income Ratio | Without Mortgage | With Mortgage |
| Less than 2.0x | 48 (40.3%) | 120,625 (29,277.9%) |
| 2.0x to 2.9x | 22 (18.5%) | 222 (53.9%) |
| 3.0x to 3.9x | 19 (16.0%) | 111 (26.9%) |
| 4.0x or more | 30 (25.2%) | 41 (10.0%) |
| Total | 119 (100.0%) | 412 (100.0%) |
Real Estate Taxes by Mortgage Status in Jonestown borough
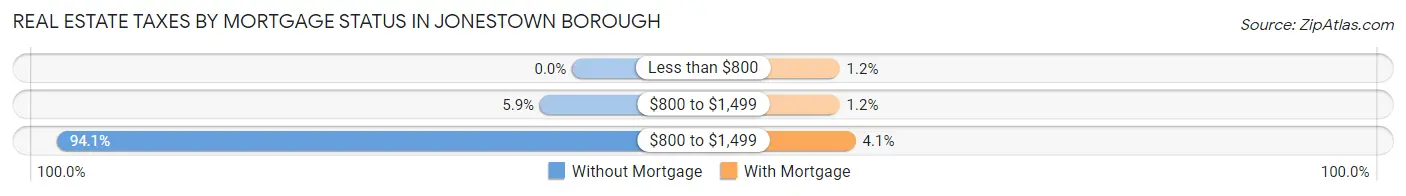
| Property Taxes | Without Mortgage | With Mortgage |
| Less than $800 | 0 (0.0%) | 5 (1.2%) |
| $800 to $1,499 | 7 (5.9%) | 5 (1.2%) |
| $800 to $1,499 | 112 (94.1%) | 17 (4.1%) |
| Total | 119 (100.0%) | 412 (100.0%) |
Health & Disability in Jonestown borough
Health Insurance Coverage by Age in Jonestown borough
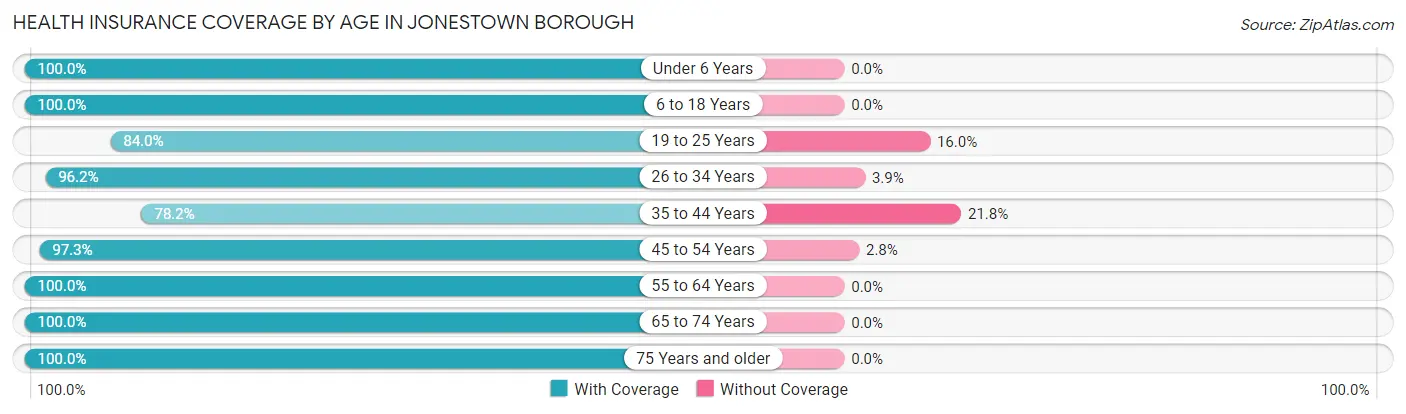
| Age Bracket | With Coverage | Without Coverage |
| Under 6 Years | 132 (100.0%) | 0 (0.0%) |
| 6 to 18 Years | 367 (100.0%) | 0 (0.0%) |
| 19 to 25 Years | 184 (84.0%) | 35 (16.0%) |
| 26 to 34 Years | 300 (96.2%) | 12 (3.8%) |
| 35 to 44 Years | 194 (78.2%) | 54 (21.8%) |
| 45 to 54 Years | 212 (97.3%) | 6 (2.8%) |
| 55 to 64 Years | 296 (100.0%) | 0 (0.0%) |
| 65 to 74 Years | 52 (100.0%) | 0 (0.0%) |
| 75 Years and older | 70 (100.0%) | 0 (0.0%) |
| Total | 1,807 (94.4%) | 107 (5.6%) |
Health Insurance Coverage by Citizenship Status in Jonestown borough
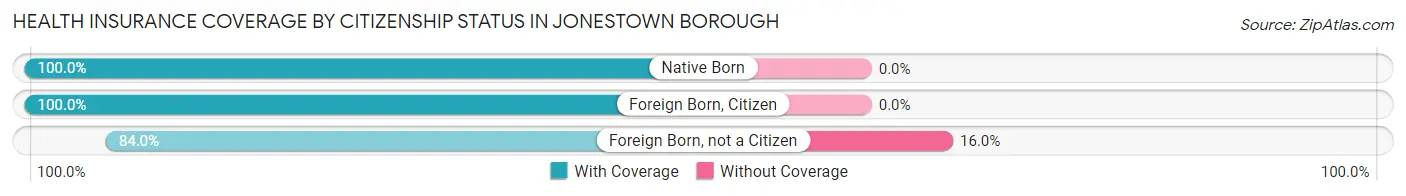
| Citizenship Status | With Coverage | Without Coverage |
| Native Born | 132 (100.0%) | 0 (0.0%) |
| Foreign Born, Citizen | 367 (100.0%) | 0 (0.0%) |
| Foreign Born, not a Citizen | 184 (84.0%) | 35 (16.0%) |
Health Insurance Coverage by Household Income in Jonestown borough
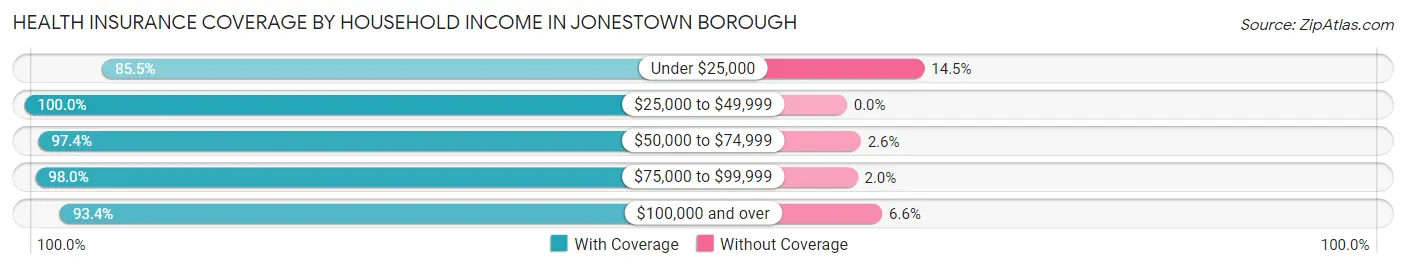
| Household Income | With Coverage | Without Coverage |
| Under $25,000 | 147 (85.5%) | 25 (14.5%) |
| $25,000 to $49,999 | 192 (100.0%) | 0 (0.0%) |
| $50,000 to $74,999 | 224 (97.4%) | 6 (2.6%) |
| $75,000 to $99,999 | 244 (98.0%) | 5 (2.0%) |
| $100,000 and over | 1,000 (93.4%) | 71 (6.6%) |
Public vs Private Health Insurance Coverage by Age in Jonestown borough
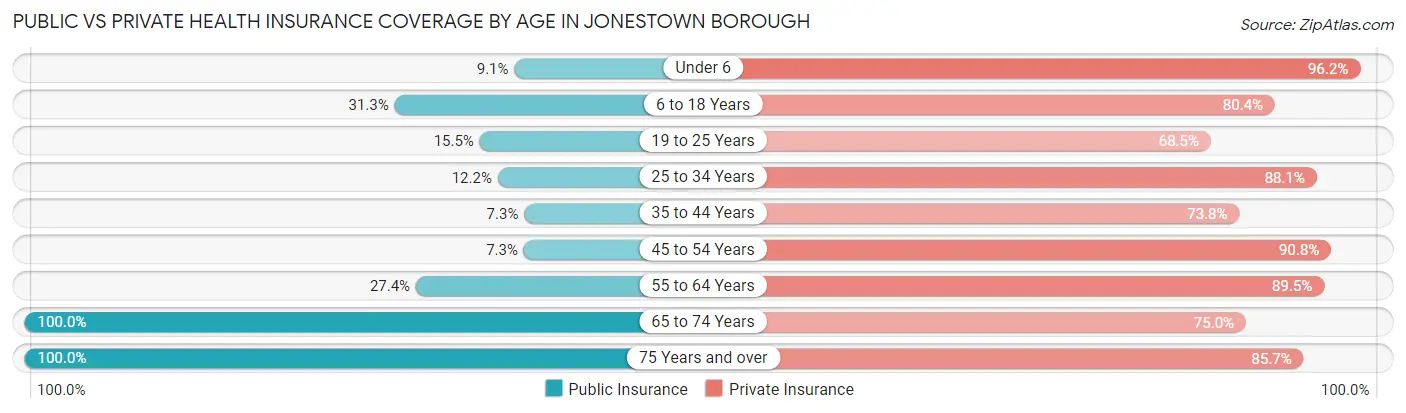
| Age Bracket | Public Insurance | Private Insurance |
| Under 6 | 12 (9.1%) | 127 (96.2%) |
| 6 to 18 Years | 115 (31.3%) | 295 (80.4%) |
| 19 to 25 Years | 34 (15.5%) | 150 (68.5%) |
| 25 to 34 Years | 38 (12.2%) | 275 (88.1%) |
| 35 to 44 Years | 18 (7.3%) | 183 (73.8%) |
| 45 to 54 Years | 16 (7.3%) | 198 (90.8%) |
| 55 to 64 Years | 81 (27.4%) | 265 (89.5%) |
| 65 to 74 Years | 52 (100.0%) | 39 (75.0%) |
| 75 Years and over | 70 (100.0%) | 60 (85.7%) |
| Total | 436 (22.8%) | 1,592 (83.2%) |
Disability Status by Sex by Age in Jonestown borough
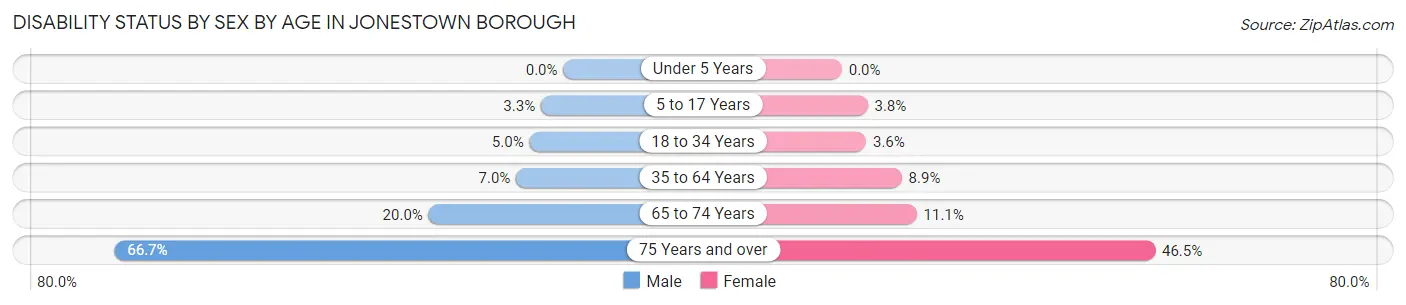
| Age Bracket | Male | Female |
| Under 5 Years | 0 (0.0%) | 0 (0.0%) |
| 5 to 17 Years | 7 (3.3%) | 5 (3.8%) |
| 18 to 34 Years | 17 (5.0%) | 8 (3.6%) |
| 35 to 64 Years | 25 (7.0%) | 36 (8.9%) |
| 65 to 74 Years | 5 (20.0%) | 3 (11.1%) |
| 75 Years and over | 18 (66.7%) | 20 (46.5%) |
Disability Class by Sex by Age in Jonestown borough
Disability Class: Hearing Difficulty
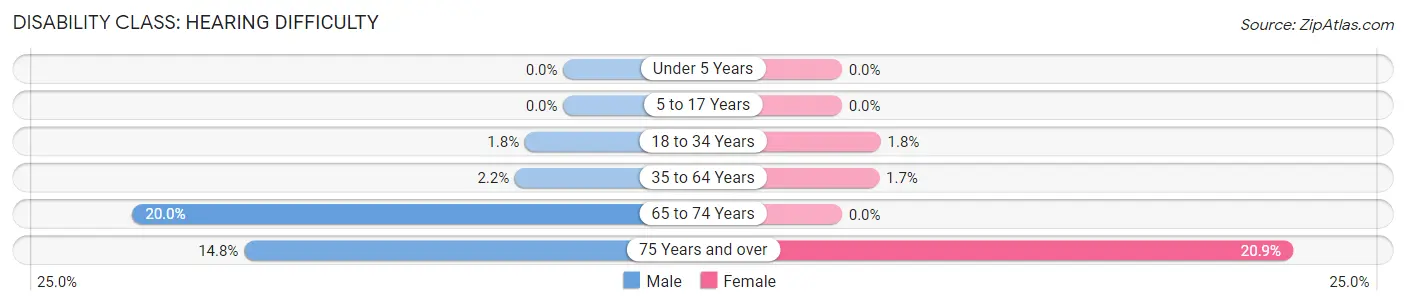
| Age Bracket | Male | Female |
| Under 5 Years | 0 (0.0%) | 0 (0.0%) |
| 5 to 17 Years | 0 (0.0%) | 0 (0.0%) |
| 18 to 34 Years | 6 (1.8%) | 4 (1.8%) |
| 35 to 64 Years | 8 (2.2%) | 7 (1.7%) |
| 65 to 74 Years | 5 (20.0%) | 0 (0.0%) |
| 75 Years and over | 4 (14.8%) | 9 (20.9%) |
Disability Class: Vision Difficulty
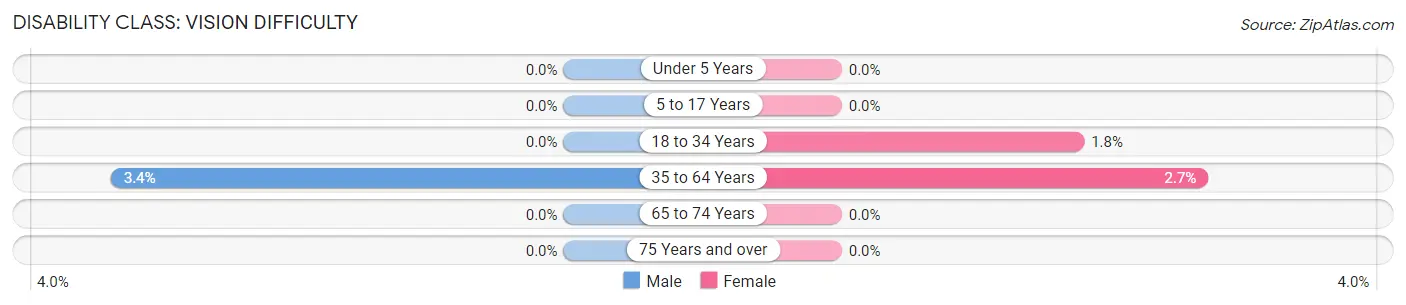
| Age Bracket | Male | Female |
| Under 5 Years | 0 (0.0%) | 0 (0.0%) |
| 5 to 17 Years | 0 (0.0%) | 0 (0.0%) |
| 18 to 34 Years | 0 (0.0%) | 4 (1.8%) |
| 35 to 64 Years | 12 (3.4%) | 11 (2.7%) |
| 65 to 74 Years | 0 (0.0%) | 0 (0.0%) |
| 75 Years and over | 0 (0.0%) | 0 (0.0%) |
Disability Class: Cognitive Difficulty
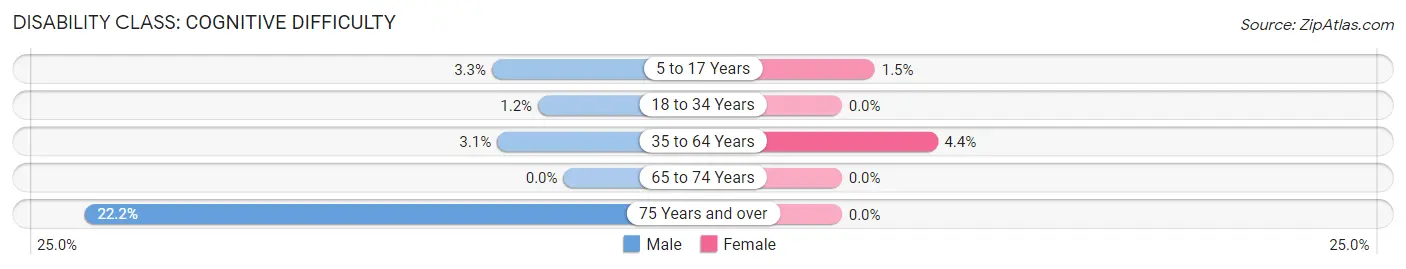
| Age Bracket | Male | Female |
| 5 to 17 Years | 7 (3.3%) | 2 (1.5%) |
| 18 to 34 Years | 4 (1.2%) | 0 (0.0%) |
| 35 to 64 Years | 11 (3.1%) | 18 (4.4%) |
| 65 to 74 Years | 0 (0.0%) | 0 (0.0%) |
| 75 Years and over | 6 (22.2%) | 0 (0.0%) |
Disability Class: Ambulatory Difficulty
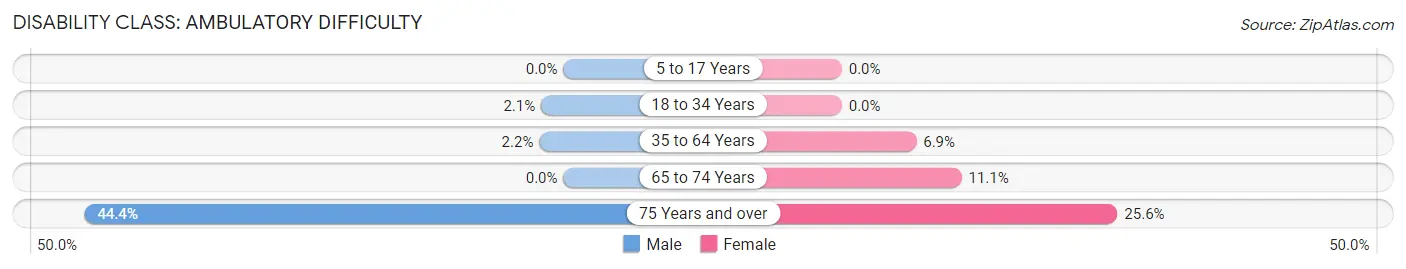
| Age Bracket | Male | Female |
| 5 to 17 Years | 0 (0.0%) | 0 (0.0%) |
| 18 to 34 Years | 7 (2.1%) | 0 (0.0%) |
| 35 to 64 Years | 8 (2.2%) | 28 (6.9%) |
| 65 to 74 Years | 0 (0.0%) | 3 (11.1%) |
| 75 Years and over | 12 (44.4%) | 11 (25.6%) |
Disability Class: Self-Care Difficulty
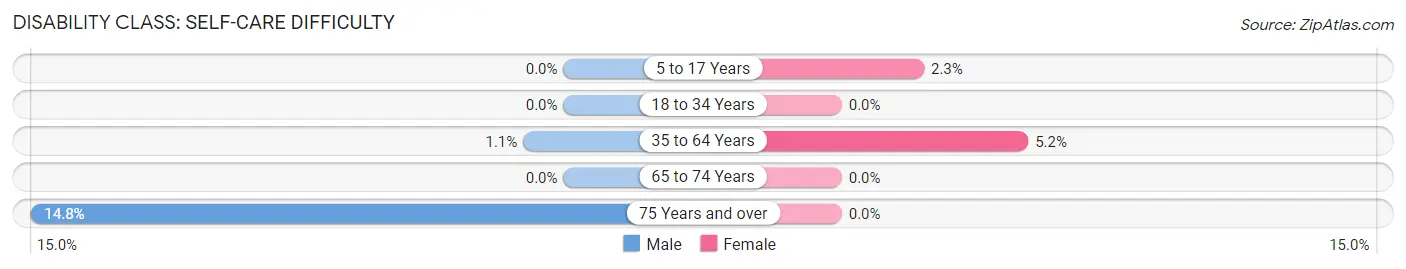
| Age Bracket | Male | Female |
| 5 to 17 Years | 0 (0.0%) | 3 (2.3%) |
| 18 to 34 Years | 0 (0.0%) | 0 (0.0%) |
| 35 to 64 Years | 4 (1.1%) | 21 (5.2%) |
| 65 to 74 Years | 0 (0.0%) | 0 (0.0%) |
| 75 Years and over | 4 (14.8%) | 0 (0.0%) |
Technology Access in Jonestown borough
Computing Device Access in Jonestown borough
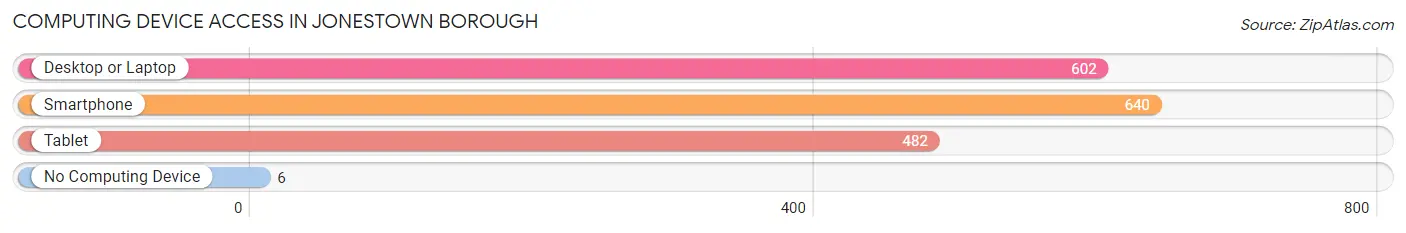
| Device Type | # Households | % Households |
| Desktop or Laptop | 602 | 86.4% |
| Smartphone | 640 | 91.8% |
| Tablet | 482 | 69.2% |
| No Computing Device | 6 | 0.9% |
| Total | 697 | 100.0% |
Internet Access in Jonestown borough
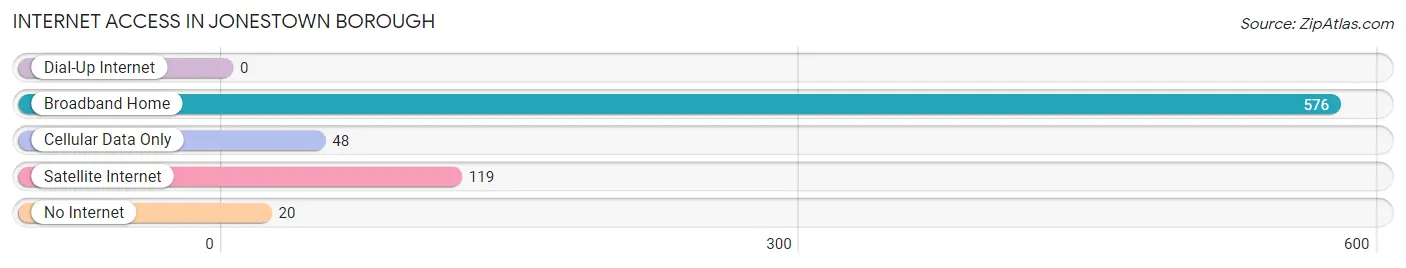
| Internet Type | # Households | % Households |
| Dial-Up Internet | 0 | 0.0% |
| Broadband Home | 576 | 82.6% |
| Cellular Data Only | 48 | 6.9% |
| Satellite Internet | 119 | 17.1% |
| No Internet | 20 | 2.9% |
| Total | 697 | 100.0% |
Jonestown borough Summary
Jonestown Borough is a small borough located in Lebanon County, Pennsylvania. It is situated in the southeastern part of the state, approximately 10 miles north of the state capital of Harrisburg. The borough is bordered by the townships of North Annville, South Annville, and East Hanover. As of the 2010 census, the population of Jonestown was 2,717.
History
Jonestown was founded in 1762 by John Jones, a Welsh immigrant. The town was originally known as Jones' Town, and was later changed to Jonestown. The town was incorporated in 1845.
Jonestown was an important stop on the Underground Railroad, and was home to several prominent abolitionists. The town was also the site of a major Civil War battle in 1863, when Confederate forces attempted to capture the town. The Union forces were able to repel the attack, and the town was spared from destruction.
Geography
Jonestown is located at 40°20'N 76°25'W (40.33, -76.41). It is situated in the southeastern part of the state, approximately 10 miles north of the state capital of Harrisburg. The borough is bordered by the townships of North Annville, South Annville, and East Hanover.
The borough has a total area of 0.9 square miles, all of which is land. The terrain is mostly flat, with some rolling hills. The climate is humid continental, with hot summers and cold winters.
Economy
The economy of Jonestown is largely based on agriculture and light manufacturing. The town is home to several small businesses, including a grocery store, a hardware store, and a few restaurants. The town also has a small industrial park, which houses several small manufacturing companies.
Demographics
As of the 2010 census, the population of Jonestown was 2,717. The racial makeup of the borough was 97.2% White, 0.7% African American, 0.2% Native American, 0.4% Asian, 0.1% Pacific Islander, 0.7% from other races, and 0.7% from two or more races. Hispanic or Latino of any race were 1.7% of the population.
The median income for a household in the borough was $41,944, and the median income for a family was $50,000. The per capita income for the borough was $20,845. About 8.2% of families and 10.2% of the population were below the poverty line, including 14.2% of those under age 18 and 8.2% of those age 65 or over.
Common Questions
What is Per Capita Income in Jonestown borough?
Per Capita income in Jonestown borough is $34,872.
What is the Median Family Income in Jonestown borough?
Median Family Income in Jonestown borough is $108,882.
What is the Median Household income in Jonestown borough?
Median Household Income in Jonestown borough is $95,792.
What is Income or Wage Gap in Jonestown borough?
Income or Wage Gap in Jonestown borough is 22.6%.
Women in Jonestown borough earn 77.4 cents for every dollar earned by a man.
What is Inequality or Gini Index in Jonestown borough?
Inequality or Gini Index in Jonestown borough is 0.33.
What is the Total Population of Jonestown borough?
Total Population of Jonestown borough is 1,979.
What is the Total Male Population of Jonestown borough?
Total Male Population of Jonestown borough is 1,056.
What is the Total Female Population of Jonestown borough?
Total Female Population of Jonestown borough is 923.
What is the Ratio of Males per 100 Females in Jonestown borough?
There are 114.41 Males per 100 Females in Jonestown borough.
What is the Ratio of Females per 100 Males in Jonestown borough?
There are 87.41 Females per 100 Males in Jonestown borough.
What is the Median Population Age in Jonestown borough?
Median Population Age in Jonestown borough is 32.5 Years.
What is the Average Family Size in Jonestown borough
Average Family Size in Jonestown borough is 3.2 People.
What is the Average Household Size in Jonestown borough
Average Household Size in Jonestown borough is 2.8 People.
How Large is the Labor Force in Jonestown borough?
There are 1,124 People in the Labor Forcein in Jonestown borough.
What is the Percentage of People in the Labor Force in Jonestown borough?
72.8% of People are in the Labor Force in Jonestown borough.
What is the Unemployment Rate in Jonestown borough?
Unemployment Rate in Jonestown borough is 4.3%.