Plum borough, PA Map & Demographics
Plum borough Overview
$44,464
PER CAPITA INCOME
$112,331
AVG FAMILY INCOME
$91,931
AVG HOUSEHOLD INCOME
28.3%
WAGE / INCOME GAP [ % ]
71.7¢/ $1
WAGE / INCOME GAP [ $ ]
0.38
INEQUALITY / GINI INDEX
27,032
TOTAL POPULATION
13,486
MALE POPULATION
13,546
FEMALE POPULATION
99.56
MALES / 100 FEMALES
100.44
FEMALES / 100 MALES
43.9
MEDIAN AGE
3.0
AVG FAMILY SIZE
2.5
AVG HOUSEHOLD SIZE
14,736
LABOR FORCE [ PEOPLE ]
67.3%
PERCENT IN LABOR FORCE
2.1%
UNEMPLOYMENT RATE
Income in Plum borough
Income Overview in Plum borough
Per Capita Income in Plum borough is $44,464, while median incomes of families and households are $112,331 and $91,931 respectively.
| Characteristic | Number | Measure |
| Per Capita Income | 27,032 | $44,464 |
| Median Family Income | 7,647 | $112,331 |
| Mean Family Income | 7,647 | $127,653 |
| Median Household Income | 10,727 | $91,931 |
| Mean Household Income | 10,727 | $110,558 |
| Income Deficit | 7,647 | $0 |
| Wage / Income Gap (%) | 27,032 | 28.34% |
| Wage / Income Gap ($) | 27,032 | 71.66¢ per $1 |
| Gini / Inequality Index | 27,032 | 0.38 |
Earnings by Sex in Plum borough
Average Earnings in Plum borough are $52,185, $59,116 for men and $42,362 for women, a difference of 28.3%.
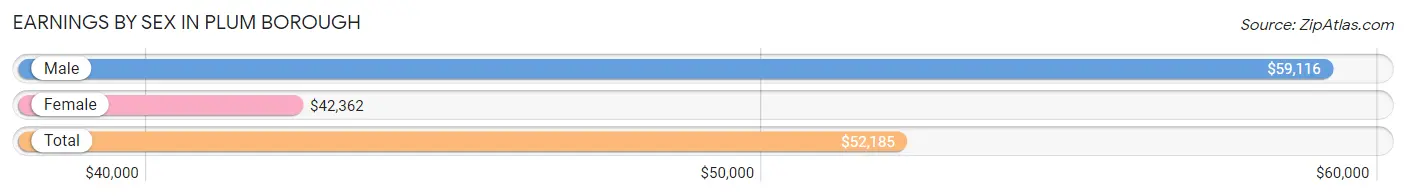
| Sex | Number | Average Earnings |
| Male | 8,046 (52.1%) | $59,116 |
| Female | 7,390 (47.9%) | $42,362 |
| Total | 15,436 (100.0%) | $52,185 |
Earnings by Sex by Income Bracket in Plum borough
The most common earnings brackets in Plum borough are $100,000+ for men (1,518 | 18.9%) and $75,000 to $99,999 for women (943 | 12.8%).
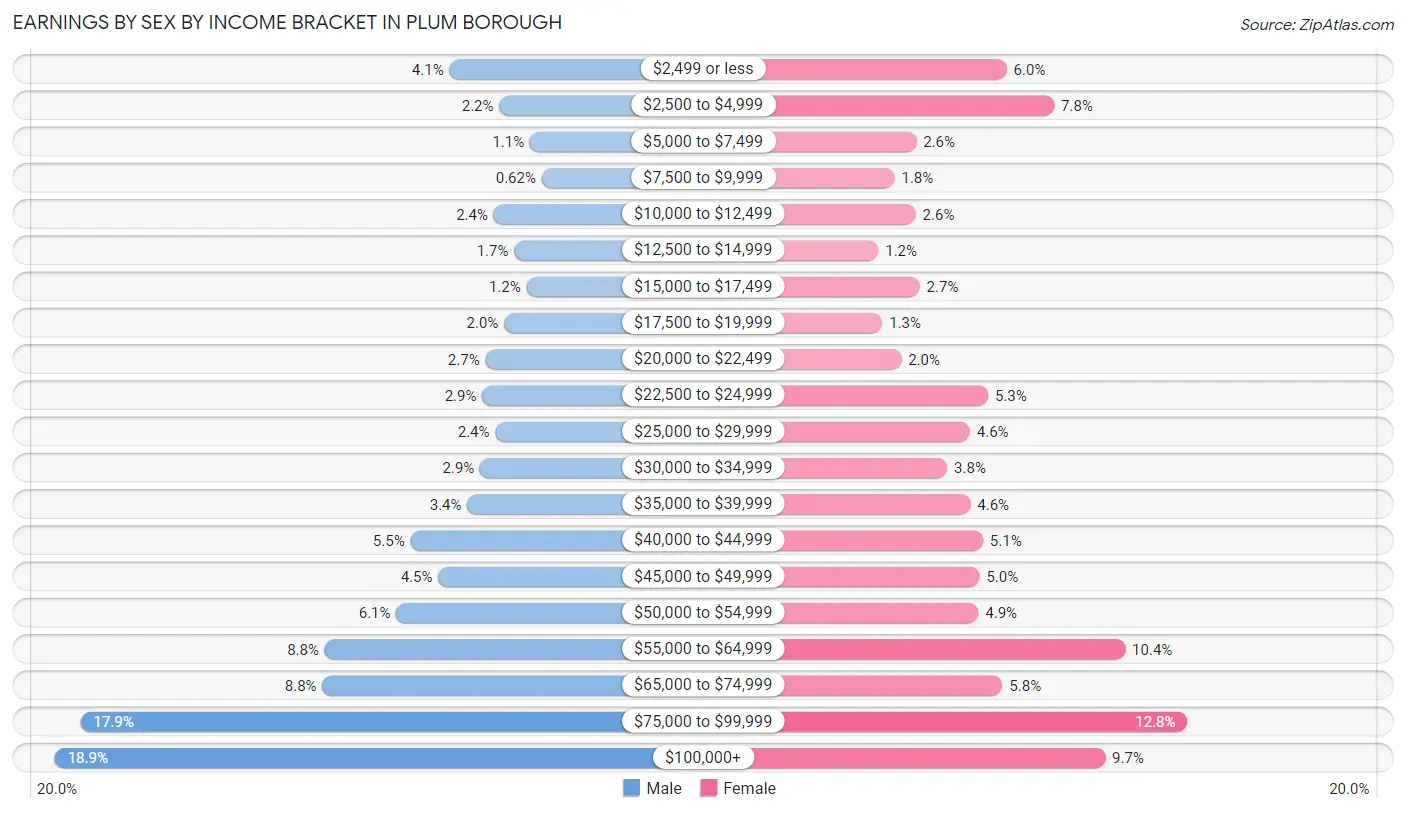
| Income | Male | Female |
| $2,499 or less | 328 (4.1%) | 443 (6.0%) |
| $2,500 to $4,999 | 178 (2.2%) | 574 (7.8%) |
| $5,000 to $7,499 | 85 (1.1%) | 192 (2.6%) |
| $7,500 to $9,999 | 50 (0.6%) | 132 (1.8%) |
| $10,000 to $12,499 | 195 (2.4%) | 191 (2.6%) |
| $12,500 to $14,999 | 133 (1.7%) | 87 (1.2%) |
| $15,000 to $17,499 | 96 (1.2%) | 202 (2.7%) |
| $17,500 to $19,999 | 163 (2.0%) | 98 (1.3%) |
| $20,000 to $22,499 | 220 (2.7%) | 151 (2.0%) |
| $22,500 to $24,999 | 229 (2.9%) | 391 (5.3%) |
| $25,000 to $29,999 | 190 (2.4%) | 341 (4.6%) |
| $30,000 to $34,999 | 236 (2.9%) | 278 (3.8%) |
| $35,000 to $39,999 | 274 (3.4%) | 342 (4.6%) |
| $40,000 to $44,999 | 446 (5.5%) | 377 (5.1%) |
| $45,000 to $49,999 | 362 (4.5%) | 367 (5.0%) |
| $50,000 to $54,999 | 488 (6.1%) | 364 (4.9%) |
| $55,000 to $64,999 | 704 (8.7%) | 771 (10.4%) |
| $65,000 to $74,999 | 711 (8.8%) | 431 (5.8%) |
| $75,000 to $99,999 | 1,440 (17.9%) | 943 (12.8%) |
| $100,000+ | 1,518 (18.9%) | 715 (9.7%) |
| Total | 8,046 (100.0%) | 7,390 (100.0%) |
Earnings by Sex by Educational Attainment in Plum borough
Average earnings in Plum borough are $66,008 for men and $51,492 for women, a difference of 22.0%. Men with an educational attainment of graduate degree enjoy the highest average annual earnings of $95,486, while those with less than high school education earn the least with $42,250. Women with an educational attainment of graduate degree earn the most with the average annual earnings of $73,750, while those with high school diploma education have the smallest earnings of $30,524.
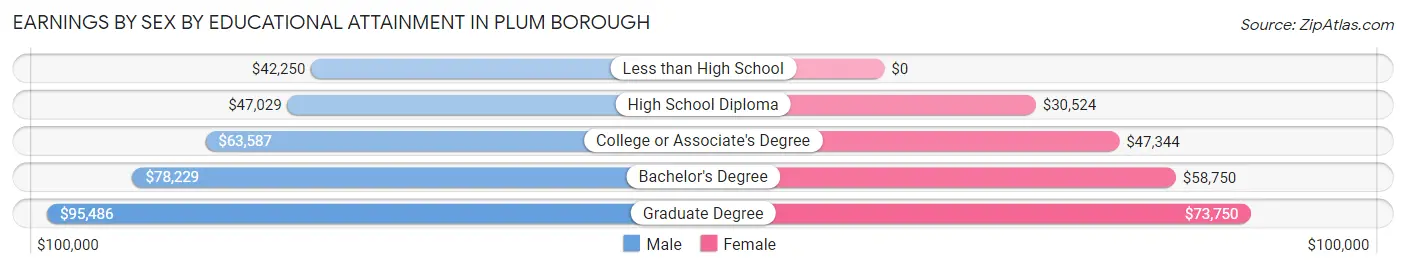
| Educational Attainment | Male Income | Female Income |
| Less than High School | $42,250 | $0 |
| High School Diploma | $47,029 | $30,524 |
| College or Associate's Degree | $63,587 | $47,344 |
| Bachelor's Degree | $78,229 | $58,750 |
| Graduate Degree | $95,486 | $73,750 |
| Total | $66,008 | $51,492 |
Family Income in Plum borough
Family Income Brackets in Plum borough
According to the Plum borough family income data, there are 2,164 families falling into the $100,000 to $149,999 income range, which is the most common income bracket and makes up 28.3% of all families. Conversely, the less than $10,000 income bracket is the least frequent group with only 76 families (1.0%) belonging to this category.
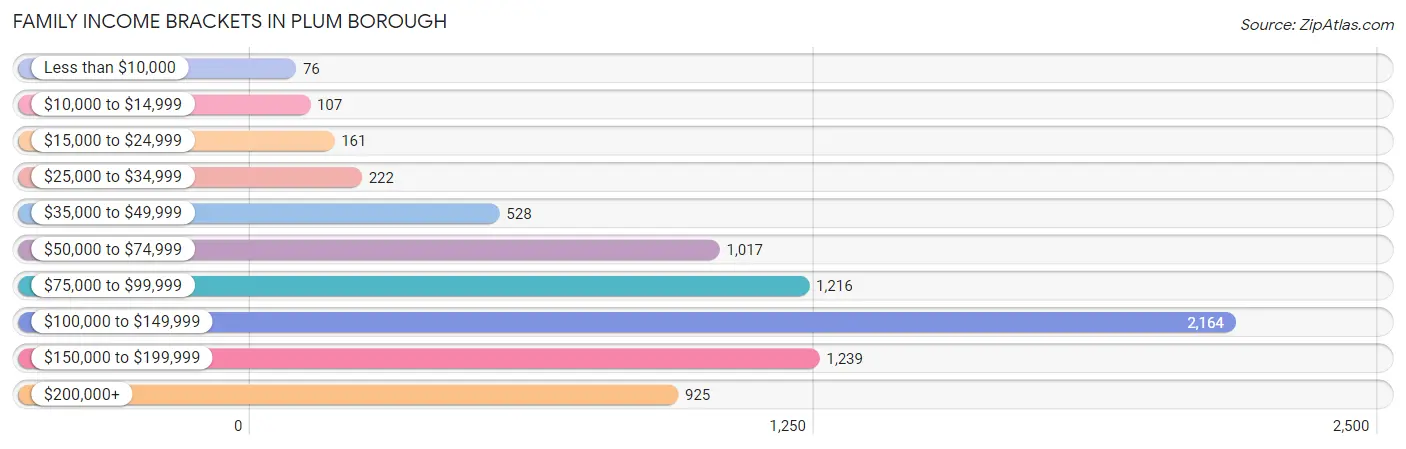
| Income Bracket | # Families | % Families |
| Less than $10,000 | 76 | 1.0% |
| $10,000 to $14,999 | 107 | 1.4% |
| $15,000 to $24,999 | 161 | 2.1% |
| $25,000 to $34,999 | 222 | 2.9% |
| $35,000 to $49,999 | 528 | 6.9% |
| $50,000 to $74,999 | 1,017 | 13.3% |
| $75,000 to $99,999 | 1,216 | 15.9% |
| $100,000 to $149,999 | 2,164 | 28.3% |
| $150,000 to $199,999 | 1,239 | 16.2% |
| $200,000+ | 925 | 12.1% |
Family Income by Famaliy Size in Plum borough
4-person families (1,599 | 20.9%) account for the highest median family income in Plum borough with $148,256 per family, while 3-person families (1,405 | 18.4%) have the highest median income of $45,498 per family member.
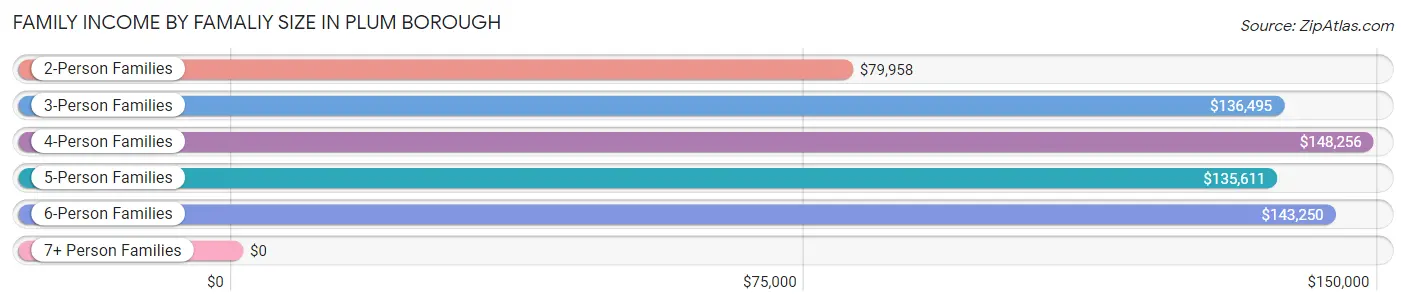
| Income Bracket | # Families | Median Income |
| 2-Person Families | 3,909 (51.1%) | $79,958 |
| 3-Person Families | 1,405 (18.4%) | $136,495 |
| 4-Person Families | 1,599 (20.9%) | $148,256 |
| 5-Person Families | 514 (6.7%) | $135,611 |
| 6-Person Families | 136 (1.8%) | $143,250 |
| 7+ Person Families | 84 (1.1%) | $0 |
| Total | 7,647 (100.0%) | $112,331 |
Family Income by Number of Earners in Plum borough
The median family income in Plum borough is $112,331, with families comprising 3+ earners (1,234) having the highest median family income of $171,258, while families with no earners (1,172) have the lowest median family income of $55,671, accounting for 16.1% and 15.3% of families, respectively.
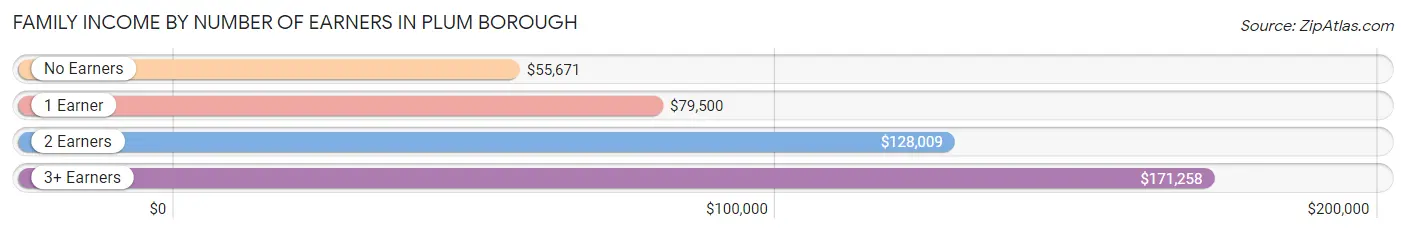
| Number of Earners | # Families | Median Income |
| No Earners | 1,172 (15.3%) | $55,671 |
| 1 Earner | 1,844 (24.1%) | $79,500 |
| 2 Earners | 3,397 (44.4%) | $128,009 |
| 3+ Earners | 1,234 (16.1%) | $171,258 |
| Total | 7,647 (100.0%) | $112,331 |
Household Income in Plum borough
Household Income Brackets in Plum borough
With 2,639 households falling in the category, the $100,000 to $149,999 income range is the most frequent in Plum borough, accounting for 24.6% of all households. In contrast, only 182 households (1.7%) fall into the $10,000 to $14,999 income bracket, making it the least populous group.
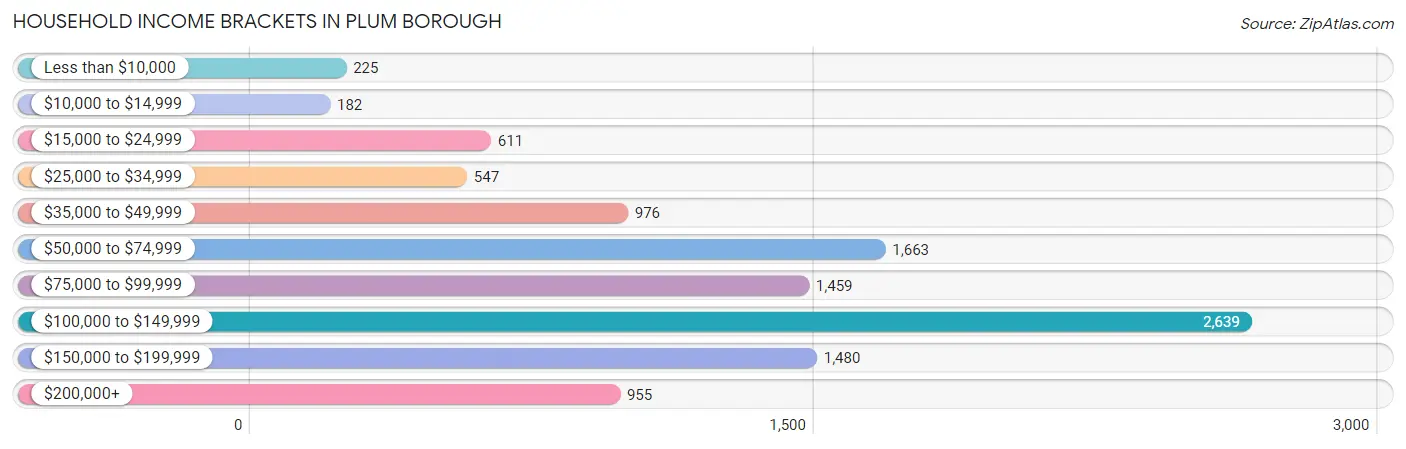
| Income Bracket | # Households | % Households |
| Less than $10,000 | 225 | 2.1% |
| $10,000 to $14,999 | 182 | 1.7% |
| $15,000 to $24,999 | 611 | 5.7% |
| $25,000 to $34,999 | 547 | 5.1% |
| $35,000 to $49,999 | 976 | 9.1% |
| $50,000 to $74,999 | 1,663 | 15.5% |
| $75,000 to $99,999 | 1,459 | 13.6% |
| $100,000 to $149,999 | 2,639 | 24.6% |
| $150,000 to $199,999 | 1,480 | 13.8% |
| $200,000+ | 955 | 8.9% |
Household Income by Householder Age in Plum borough
The median household income in Plum borough is $91,931, with the highest median household income of $114,082 found in the 45 to 64 years age bracket for the primary householder. A total of 4,021 households (37.5%) fall into this category. Meanwhile, the 65+ years age bracket for the primary householder has the lowest median household income of $59,382, with 3,531 households (32.9%) in this group.
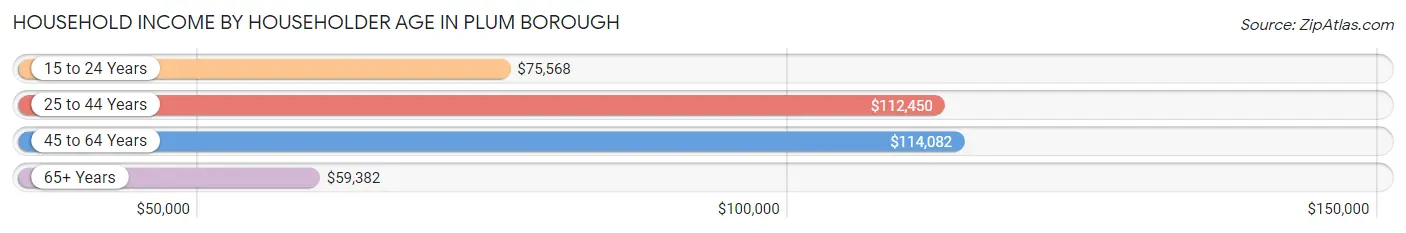
| Income Bracket | # Households | Median Income |
| 15 to 24 Years | 163 (1.5%) | $75,568 |
| 25 to 44 Years | 3,012 (28.1%) | $112,450 |
| 45 to 64 Years | 4,021 (37.5%) | $114,082 |
| 65+ Years | 3,531 (32.9%) | $59,382 |
| Total | 10,727 (100.0%) | $91,931 |
Poverty in Plum borough
Income Below Poverty by Sex and Age in Plum borough
With 2.8% poverty level for males and 3.5% for females among the residents of Plum borough, 65 to 74 year old males and 65 to 74 year old females are the most vulnerable to poverty, with 146 males (10.8%) and 152 females (9.9%) in their respective age groups living below the poverty level.
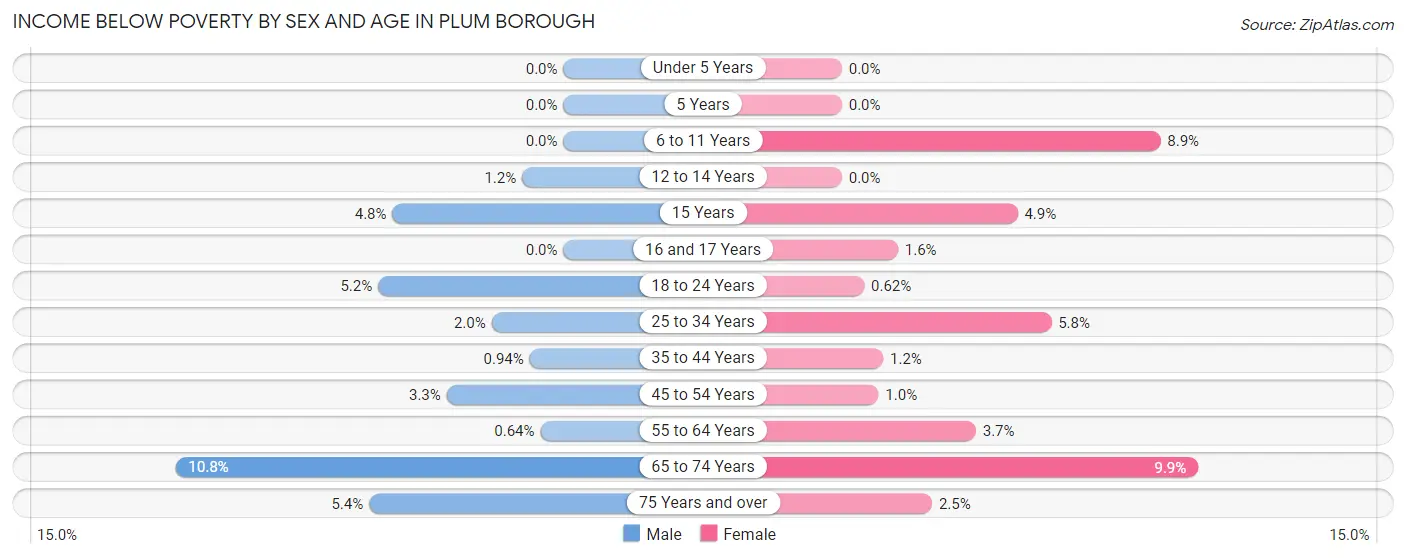
| Age Bracket | Male | Female |
| Under 5 Years | 0 (0.0%) | 0 (0.0%) |
| 5 Years | 0 (0.0%) | 0 (0.0%) |
| 6 to 11 Years | 0 (0.0%) | 68 (8.9%) |
| 12 to 14 Years | 6 (1.1%) | 0 (0.0%) |
| 15 Years | 8 (4.8%) | 9 (4.9%) |
| 16 and 17 Years | 0 (0.0%) | 9 (1.6%) |
| 18 to 24 Years | 44 (5.2%) | 5 (0.6%) |
| 25 to 34 Years | 31 (2.0%) | 86 (5.8%) |
| 35 to 44 Years | 16 (0.9%) | 19 (1.1%) |
| 45 to 54 Years | 60 (3.3%) | 17 (1.0%) |
| 55 to 64 Years | 13 (0.6%) | 74 (3.7%) |
| 65 to 74 Years | 146 (10.8%) | 152 (9.9%) |
| 75 Years and over | 56 (5.4%) | 40 (2.5%) |
| Total | 380 (2.8%) | 479 (3.5%) |
Income Above Poverty by Sex and Age in Plum borough
According to the poverty statistics in Plum borough, males aged under 5 years and females aged under 5 years are the age groups that are most secure financially, with 100.0% of males and 100.0% of females in these age groups living above the poverty line.
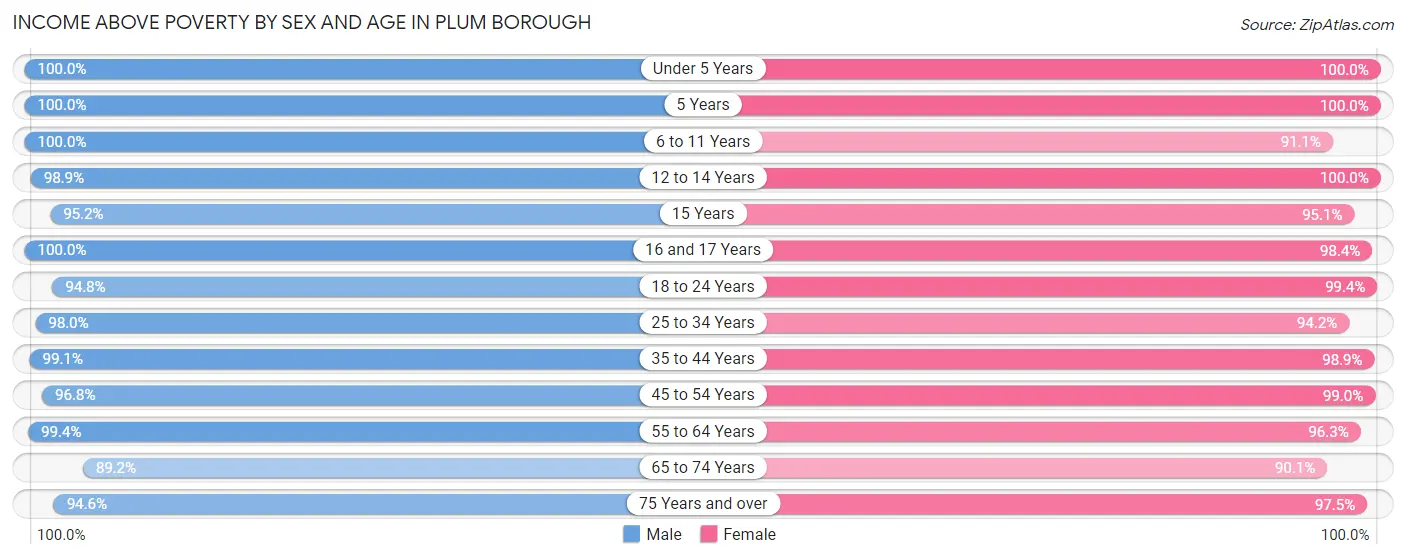
| Age Bracket | Male | Female |
| Under 5 Years | 714 (100.0%) | 745 (100.0%) |
| 5 Years | 267 (100.0%) | 159 (100.0%) |
| 6 to 11 Years | 1,250 (100.0%) | 699 (91.1%) |
| 12 to 14 Years | 517 (98.9%) | 346 (100.0%) |
| 15 Years | 160 (95.2%) | 175 (95.1%) |
| 16 and 17 Years | 149 (100.0%) | 567 (98.4%) |
| 18 to 24 Years | 808 (94.8%) | 798 (99.4%) |
| 25 to 34 Years | 1,522 (98.0%) | 1,388 (94.2%) |
| 35 to 44 Years | 1,695 (99.1%) | 1,637 (98.9%) |
| 45 to 54 Years | 1,785 (96.8%) | 1,649 (99.0%) |
| 55 to 64 Years | 2,016 (99.4%) | 1,911 (96.3%) |
| 65 to 74 Years | 1,206 (89.2%) | 1,381 (90.1%) |
| 75 Years and over | 980 (94.6%) | 1,555 (97.5%) |
| Total | 13,069 (97.2%) | 13,010 (96.5%) |
Income Below Poverty Among Married-Couple Families in Plum borough
The poverty statistics for married-couple families in Plum borough show that 2.2% or 139 of the total 6,372 families live below the poverty line. Families with no children have the highest poverty rate of 3.5%, comprising of 139 families. On the other hand, families with 1 or 2 children have the lowest poverty rate of 0.0%, which includes 0 families.
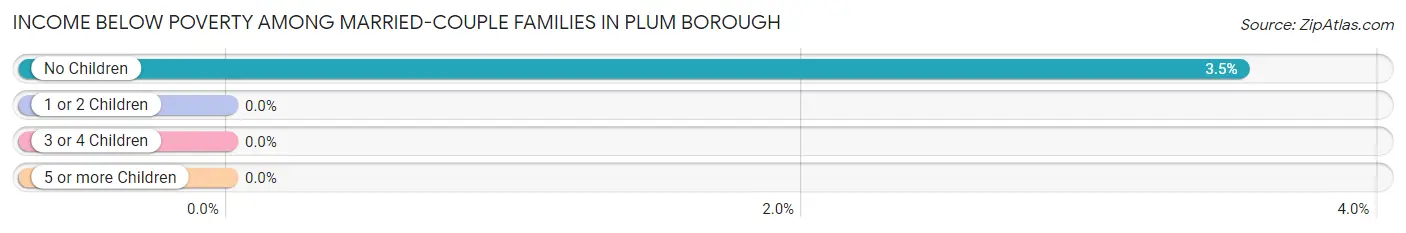
| Children | Above Poverty | Below Poverty |
| No Children | 3,807 (96.5%) | 139 (3.5%) |
| 1 or 2 Children | 1,919 (100.0%) | 0 (0.0%) |
| 3 or 4 Children | 432 (100.0%) | 0 (0.0%) |
| 5 or more Children | 75 (100.0%) | 0 (0.0%) |
| Total | 6,233 (97.8%) | 139 (2.2%) |
Income Below Poverty Among Single-Parent Households in Plum borough
According to the poverty data in Plum borough, 1.1% or 6 single-father households and 14.3% or 102 single-mother households are living below the poverty line. Among single-father households, those with 1 or 2 children have the highest poverty rate, with 6 households (2.7%) experiencing poverty. Likewise, among single-mother households, those with 1 or 2 children have the highest poverty rate, with 67 households (16.2%) falling below the poverty line.
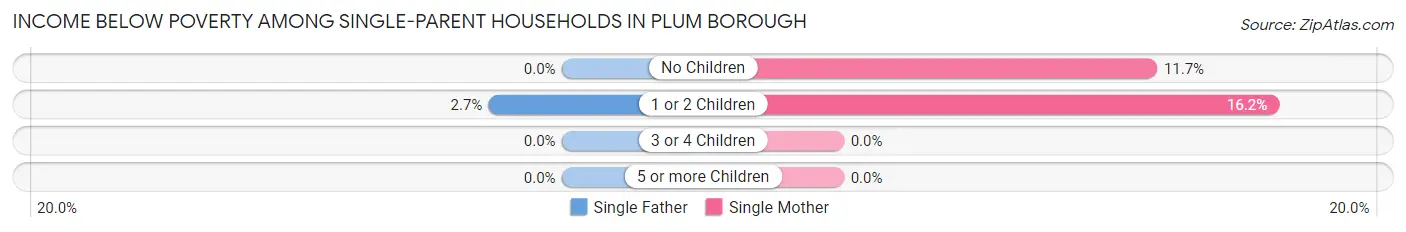
| Children | Single Father | Single Mother |
| No Children | 0 (0.0%) | 35 (11.7%) |
| 1 or 2 Children | 6 (2.7%) | 67 (16.2%) |
| 3 or 4 Children | 0 (0.0%) | 0 (0.0%) |
| 5 or more Children | 0 (0.0%) | 0 (0.0%) |
| Total | 6 (1.1%) | 102 (14.3%) |
Income Below Poverty Among Married-Couple vs Single-Parent Households in Plum borough
The poverty data for Plum borough shows that 139 of the married-couple family households (2.2%) and 108 of the single-parent households (8.5%) are living below the poverty level. Within the married-couple family households, those with no children have the highest poverty rate, with 139 households (3.5%) falling below the poverty line. Among the single-parent households, those with 1 or 2 children have the highest poverty rate, with 73 household (11.5%) living below poverty.
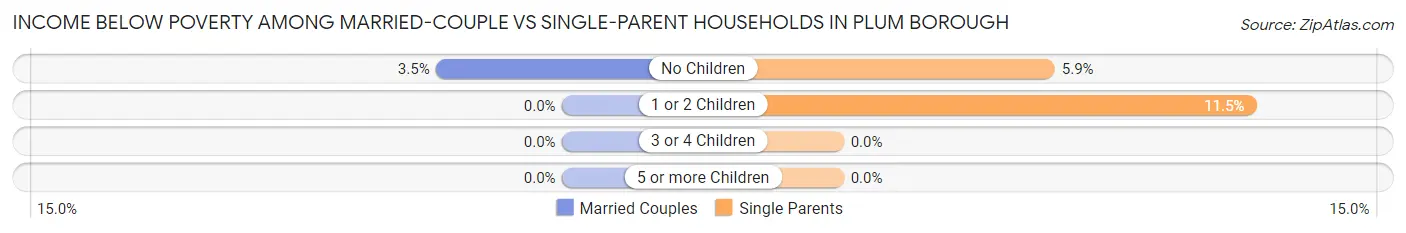
| Children | Married-Couple Families | Single-Parent Households |
| No Children | 139 (3.5%) | 35 (5.9%) |
| 1 or 2 Children | 0 (0.0%) | 73 (11.5%) |
| 3 or 4 Children | 0 (0.0%) | 0 (0.0%) |
| 5 or more Children | 0 (0.0%) | 0 (0.0%) |
| Total | 139 (2.2%) | 108 (8.5%) |
Race in Plum borough
The most populous races in Plum borough are White / Caucasian (24,658 | 91.2%), Black / African American (1,164 | 4.3%), and Two or more Races (708 | 2.6%).
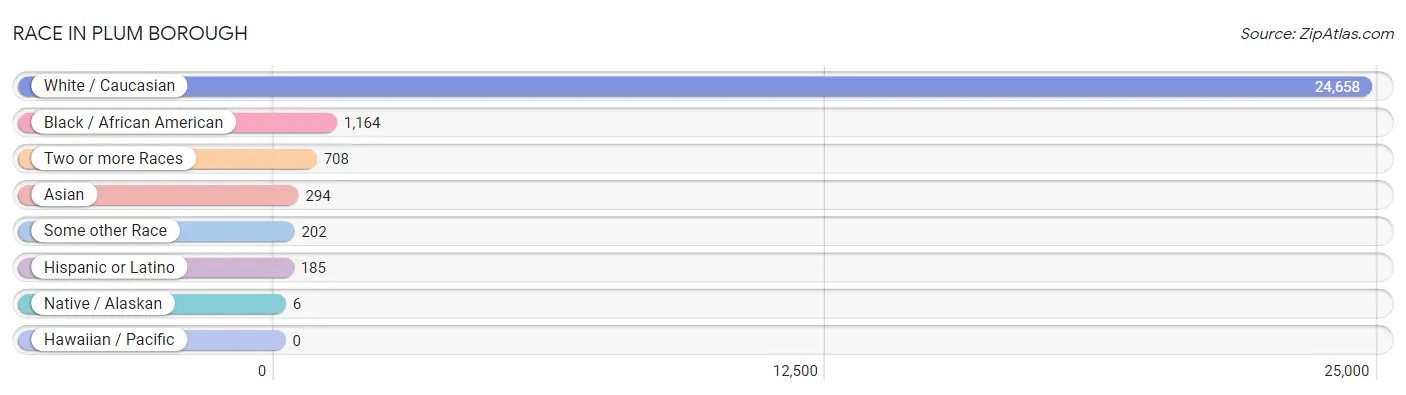
| Race | # Population | % Population |
| Asian | 294 | 1.1% |
| Black / African American | 1,164 | 4.3% |
| Hawaiian / Pacific | 0 | 0.0% |
| Hispanic or Latino | 185 | 0.7% |
| Native / Alaskan | 6 | 0.0% |
| White / Caucasian | 24,658 | 91.2% |
| Two or more Races | 708 | 2.6% |
| Some other Race | 202 | 0.7% |
| Total | 27,032 | 100.0% |
Ancestry in Plum borough
The most populous ancestries reported in Plum borough are German (7,639 | 28.3%), Italian (5,718 | 21.1%), Irish (5,483 | 20.3%), English (2,837 | 10.5%), and Polish (2,162 | 8.0%), together accounting for 88.2% of all Plum borough residents.
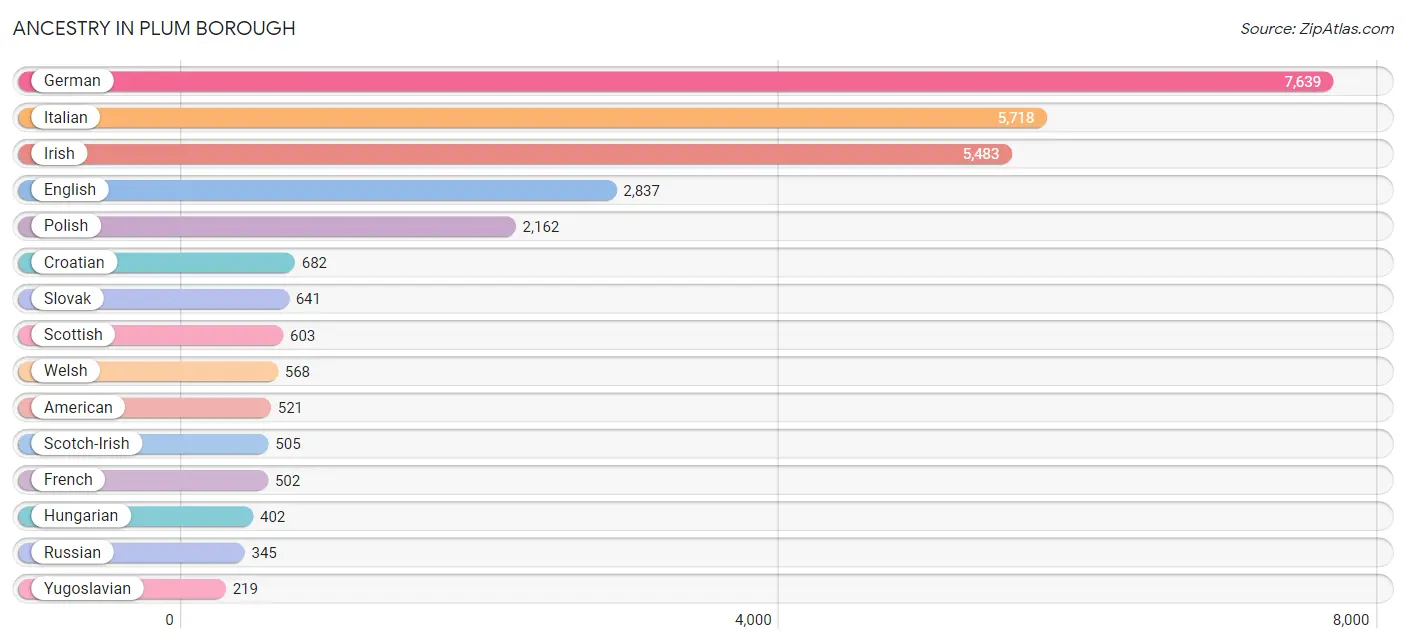
| Ancestry | # Population | % Population |
| African | 30 | 0.1% |
| American | 521 | 1.9% |
| Arab | 146 | 0.5% |
| Austrian | 128 | 0.5% |
| Bhutanese | 27 | 0.1% |
| British | 98 | 0.4% |
| Burmese | 33 | 0.1% |
| Carpatho Rusyn | 56 | 0.2% |
| Central American | 4 | 0.0% |
| Cherokee | 137 | 0.5% |
| Chippewa | 20 | 0.1% |
| Choctaw | 7 | 0.0% |
| Croatian | 682 | 2.5% |
| Cuban | 17 | 0.1% |
| Czech | 215 | 0.8% |
| Czechoslovakian | 55 | 0.2% |
| Dutch | 100 | 0.4% |
| Eastern European | 100 | 0.4% |
| English | 2,837 | 10.5% |
| European | 97 | 0.4% |
| Finnish | 48 | 0.2% |
| French | 502 | 1.9% |
| French American Indian | 8 | 0.0% |
| French Canadian | 81 | 0.3% |
| German | 7,639 | 28.3% |
| Ghanaian | 42 | 0.2% |
| Greek | 80 | 0.3% |
| Haitian | 56 | 0.2% |
| Hungarian | 402 | 1.5% |
| Indian (Asian) | 118 | 0.4% |
| Irish | 5,483 | 20.3% |
| Italian | 5,718 | 21.1% |
| Korean | 96 | 0.4% |
| Lebanese | 51 | 0.2% |
| Lithuanian | 23 | 0.1% |
| Mexican | 21 | 0.1% |
| Native Hawaiian | 1 | 0.0% |
| Nigerian | 42 | 0.2% |
| Norwegian | 42 | 0.2% |
| Palestinian | 15 | 0.1% |
| Pennsylvania German | 21 | 0.1% |
| Peruvian | 3 | 0.0% |
| Polish | 2,162 | 8.0% |
| Portuguese | 124 | 0.5% |
| Puerto Rican | 118 | 0.4% |
| Romanian | 30 | 0.1% |
| Russian | 345 | 1.3% |
| Salvadoran | 4 | 0.0% |
| Scandinavian | 106 | 0.4% |
| Scotch-Irish | 505 | 1.9% |
| Scottish | 603 | 2.2% |
| Serbian | 168 | 0.6% |
| Sioux | 32 | 0.1% |
| Slavic | 57 | 0.2% |
| Slovak | 641 | 2.4% |
| Slovene | 156 | 0.6% |
| South African | 46 | 0.2% |
| South American | 3 | 0.0% |
| Subsaharan African | 118 | 0.4% |
| Swedish | 171 | 0.6% |
| Swiss | 39 | 0.1% |
| Syrian | 15 | 0.1% |
| Thai | 125 | 0.5% |
| Ukrainian | 85 | 0.3% |
| Welsh | 568 | 2.1% |
| Yugoslavian | 219 | 0.8% | View All 66 Rows |
Immigrants in Plum borough
The most numerous immigrant groups reported in Plum borough came from Asia (247 | 0.9%), India (154 | 0.6%), South Central Asia (154 | 0.6%), Africa (77 | 0.3%), and Eastern Africa (59 | 0.2%), together accounting for 2.6% of all Plum borough residents.
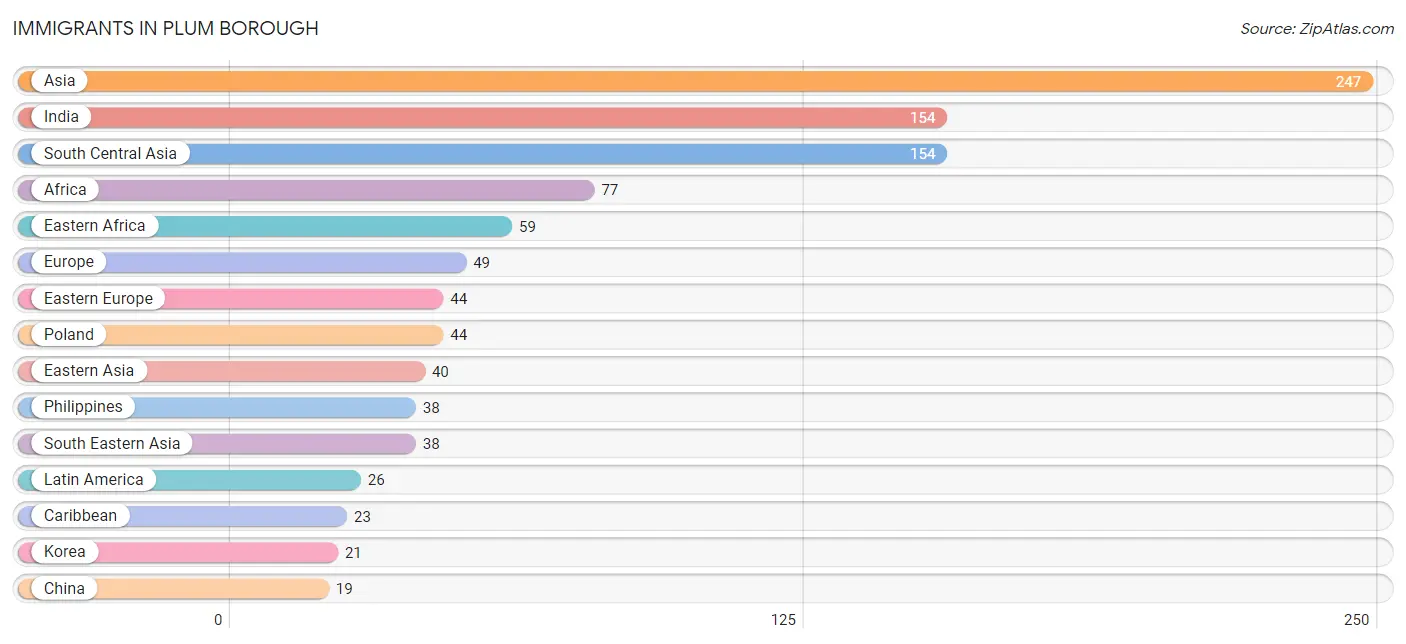
| Immigration Origin | # Population | % Population |
| Africa | 77 | 0.3% |
| Asia | 247 | 0.9% |
| Canada | 6 | 0.0% |
| Caribbean | 23 | 0.1% |
| China | 19 | 0.1% |
| Cuba | 17 | 0.1% |
| Eastern Africa | 59 | 0.2% |
| Eastern Asia | 40 | 0.2% |
| Eastern Europe | 44 | 0.2% |
| Europe | 49 | 0.2% |
| Haiti | 6 | 0.0% |
| India | 154 | 0.6% |
| Italy | 5 | 0.0% |
| Korea | 21 | 0.1% |
| Latin America | 26 | 0.1% |
| Lebanon | 15 | 0.1% |
| Peru | 3 | 0.0% |
| Philippines | 38 | 0.1% |
| Poland | 44 | 0.2% |
| South Africa | 18 | 0.1% |
| South America | 3 | 0.0% |
| South Central Asia | 154 | 0.6% |
| South Eastern Asia | 38 | 0.1% |
| Southern Europe | 5 | 0.0% |
| Western Asia | 15 | 0.1% | View All 25 Rows |
Sex and Age in Plum borough
Sex and Age in Plum borough
The most populous age groups in Plum borough are 60 to 64 Years (1,143 | 8.5%) for men and 60 to 64 Years (1,029 | 7.6%) for women.
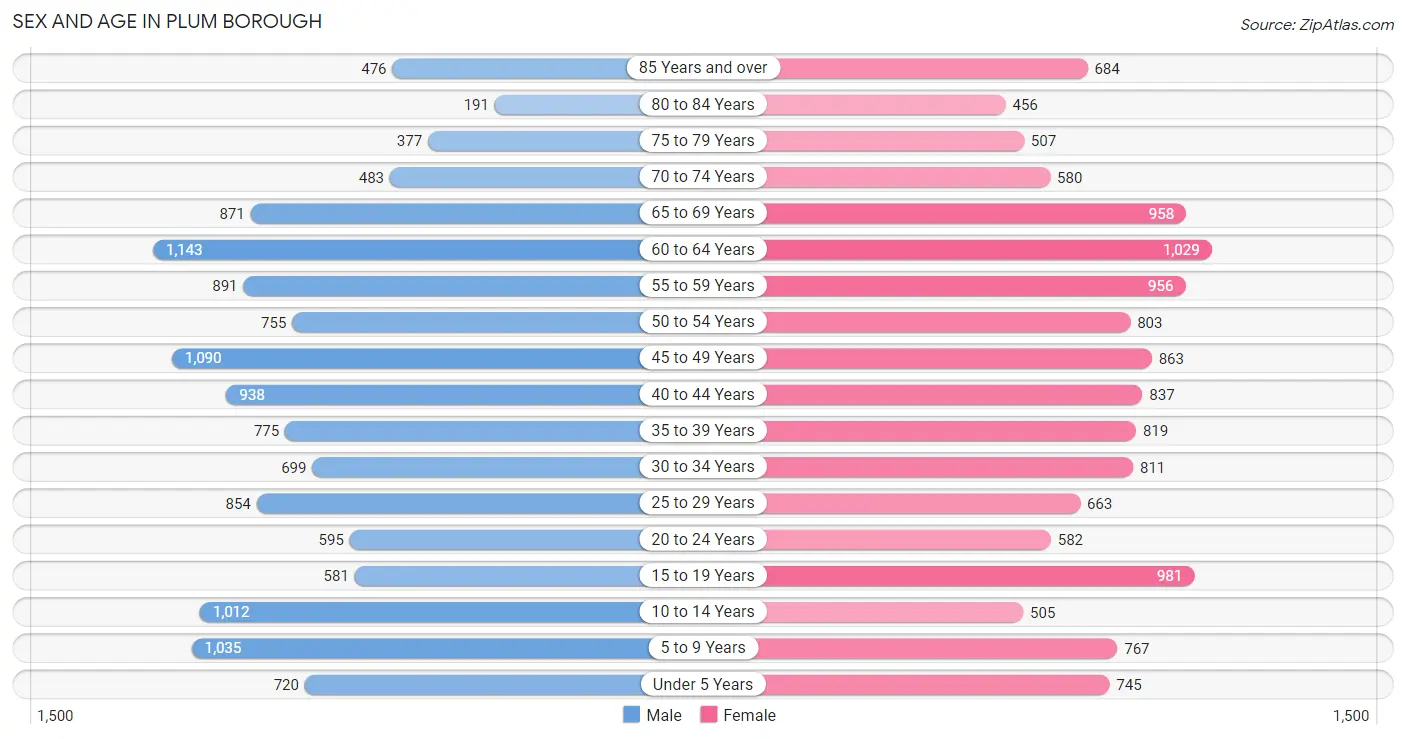
| Age Bracket | Male | Female |
| Under 5 Years | 720 (5.3%) | 745 (5.5%) |
| 5 to 9 Years | 1,035 (7.7%) | 767 (5.7%) |
| 10 to 14 Years | 1,012 (7.5%) | 505 (3.7%) |
| 15 to 19 Years | 581 (4.3%) | 981 (7.2%) |
| 20 to 24 Years | 595 (4.4%) | 582 (4.3%) |
| 25 to 29 Years | 854 (6.3%) | 663 (4.9%) |
| 30 to 34 Years | 699 (5.2%) | 811 (6.0%) |
| 35 to 39 Years | 775 (5.8%) | 819 (6.0%) |
| 40 to 44 Years | 938 (7.0%) | 837 (6.2%) |
| 45 to 49 Years | 1,090 (8.1%) | 863 (6.4%) |
| 50 to 54 Years | 755 (5.6%) | 803 (5.9%) |
| 55 to 59 Years | 891 (6.6%) | 956 (7.1%) |
| 60 to 64 Years | 1,143 (8.5%) | 1,029 (7.6%) |
| 65 to 69 Years | 871 (6.5%) | 958 (7.1%) |
| 70 to 74 Years | 483 (3.6%) | 580 (4.3%) |
| 75 to 79 Years | 377 (2.8%) | 507 (3.7%) |
| 80 to 84 Years | 191 (1.4%) | 456 (3.4%) |
| 85 Years and over | 476 (3.5%) | 684 (5.1%) |
| Total | 13,486 (100.0%) | 13,546 (100.0%) |
Families and Households in Plum borough
Median Family Size in Plum borough
The median family size in Plum borough is 3.01 persons per family, with married-couple families (6,372 | 83.3%) accounting for the largest median family size of 3.09 persons per family. On the other hand, single female/mother families (713 | 9.3%) represent the smallest median family size with 2.57 persons per family.
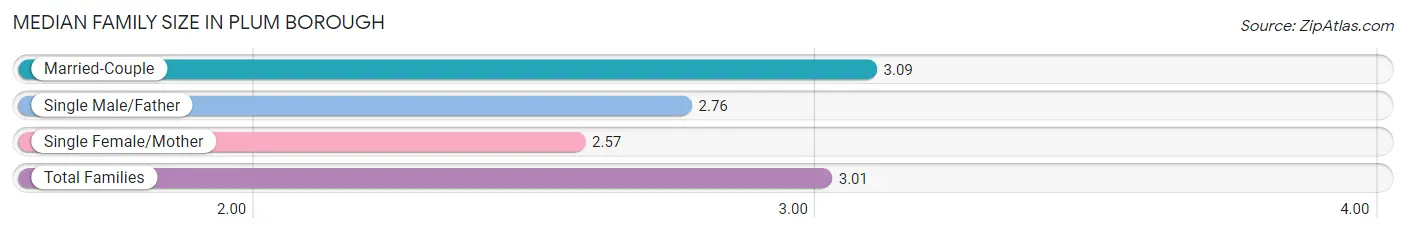
| Family Type | # Families | Family Size |
| Married-Couple | 6,372 (83.3%) | 3.09 |
| Single Male/Father | 562 (7.3%) | 2.76 |
| Single Female/Mother | 713 (9.3%) | 2.57 |
| Total Families | 7,647 (100.0%) | 3.01 |
Median Household Size in Plum borough
The median household size in Plum borough is 2.51 persons per household, with married-couple households (6,372 | 59.4%) accounting for the largest median household size of 3.09 persons per household. non-family households (3,080 | 28.7%) represent the smallest median household size with 1.16 persons per household.
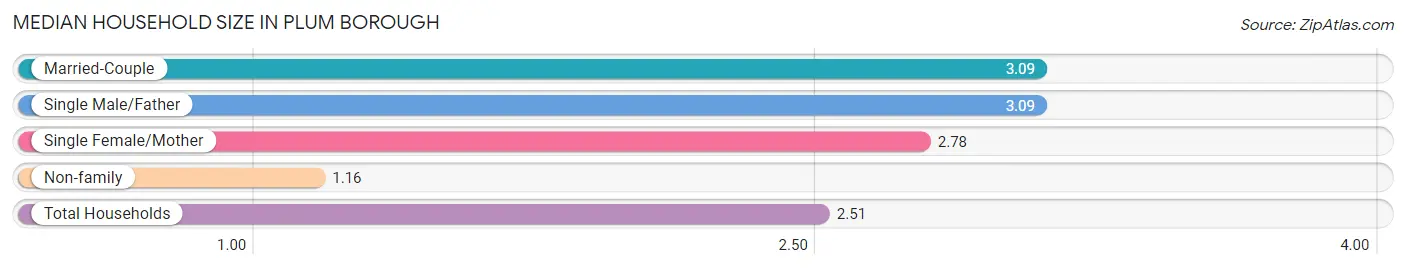
| Household Type | # Households | Household Size |
| Married-Couple | 6,372 (59.4%) | 3.09 |
| Single Male/Father | 562 (5.2%) | 3.09 |
| Single Female/Mother | 713 (6.7%) | 2.78 |
| Non-family | 3,080 (28.7%) | 1.16 |
| Total Households | 10,727 (100.0%) | 2.51 |
Household Size by Marriage Status in Plum borough
Out of a total of 10,727 households in Plum borough, 7,647 (71.3%) are family households, while 3,080 (28.7%) are nonfamily households. The most numerous type of family households are 2-person households, comprising 3,708, and the most common type of nonfamily households are 1-person households, comprising 2,612.
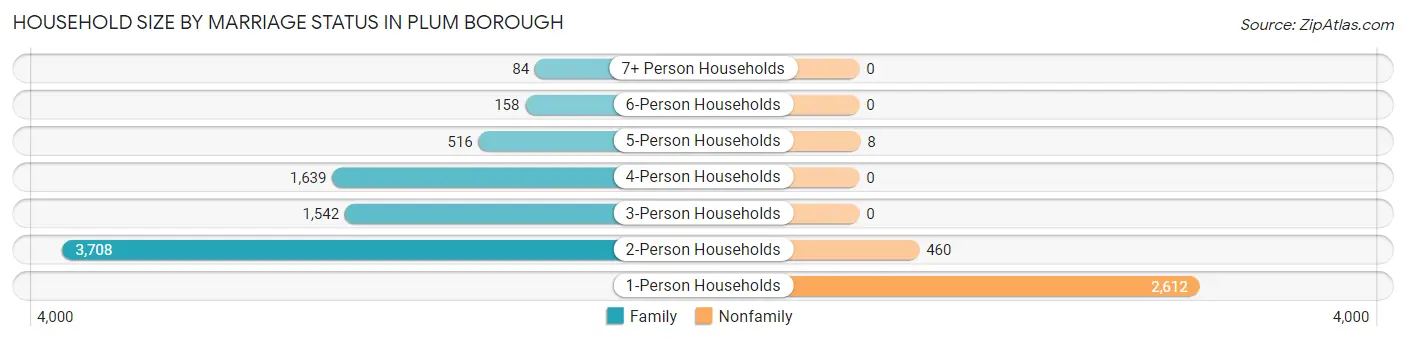
| Household Size | Family Households | Nonfamily Households |
| 1-Person Households | - | 2,612 (24.3%) |
| 2-Person Households | 3,708 (34.6%) | 460 (4.3%) |
| 3-Person Households | 1,542 (14.4%) | 0 (0.0%) |
| 4-Person Households | 1,639 (15.3%) | 0 (0.0%) |
| 5-Person Households | 516 (4.8%) | 8 (0.1%) |
| 6-Person Households | 158 (1.5%) | 0 (0.0%) |
| 7+ Person Households | 84 (0.8%) | 0 (0.0%) |
| Total | 7,647 (71.3%) | 3,080 (28.7%) |
Female Fertility in Plum borough
Fertility by Age in Plum borough
Average fertility rate in Plum borough is 56.0 births per 1,000 women. Women in the age bracket of 20 to 34 years have the highest fertility rate with 131.0 births per 1,000 women. Women in the age bracket of 20 to 34 years acount for 83.9% of all women with births.
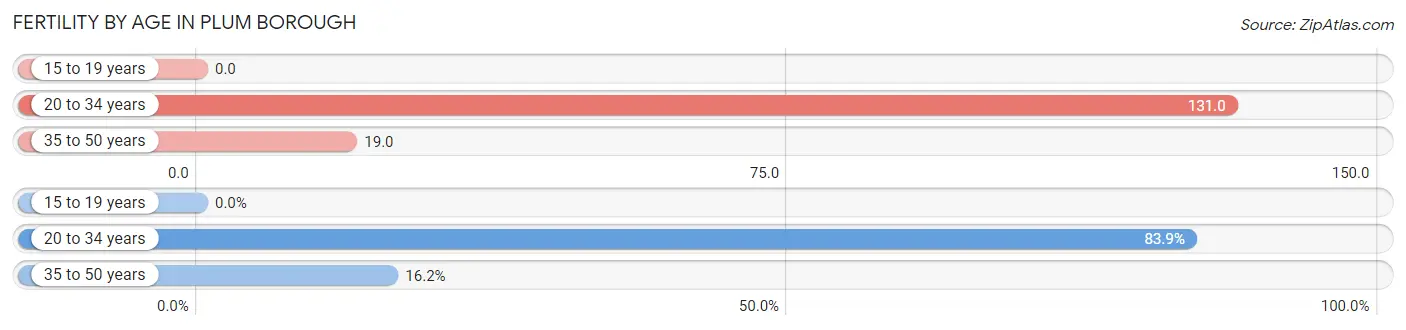
| Age Bracket | Women with Births | Births / 1,000 Women |
| 15 to 19 years | 0 (0.0%) | 0.0 |
| 20 to 34 years | 270 (83.9%) | 131.0 |
| 35 to 50 years | 52 (16.2%) | 19.0 |
| Total | 322 (100.0%) | 56.0 |
Fertility by Age by Marriage Status in Plum borough
73.0% of women with births (322) in Plum borough are married. The highest percentage of unmarried women with births falls into 20 to 34 years age bracket with 32.2% of them unmarried at the time of birth, while the lowest percentage of unmarried women with births belong to 35 to 50 years age bracket with 0.0% of them unmarried.
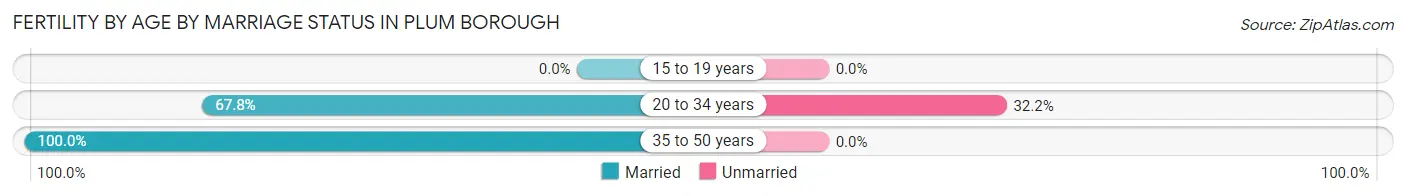
| Age Bracket | Married | Unmarried |
| 15 to 19 years | 0 (0.0%) | 0 (0.0%) |
| 20 to 34 years | 183 (67.8%) | 87 (32.2%) |
| 35 to 50 years | 52 (100.0%) | 0 (0.0%) |
| Total | 235 (73.0%) | 87 (27.0%) |
Fertility by Education in Plum borough
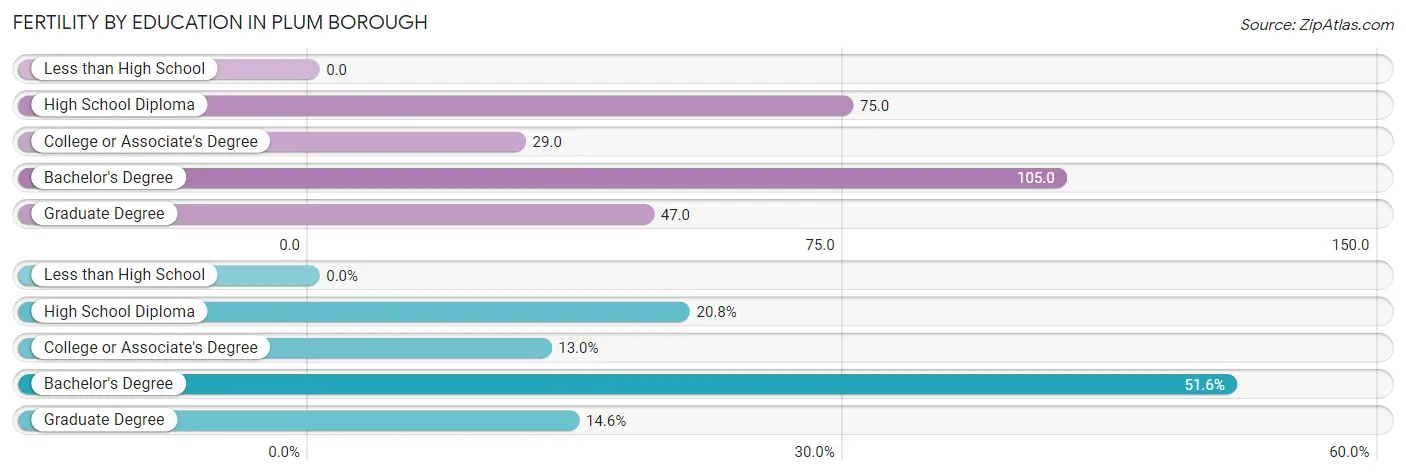
| Educational Attainment | Women with Births | Births / 1,000 Women |
| Less than High School | 0 (0.0%) | 0.0 |
| High School Diploma | 67 (20.8%) | 75.0 |
| College or Associate's Degree | 42 (13.0%) | 29.0 |
| Bachelor's Degree | 166 (51.5%) | 105.0 |
| Graduate Degree | 47 (14.6%) | 47.0 |
| Total | 322 (100.0%) | 56.0 |
Fertility by Education by Marriage Status in Plum borough
27.0% of women with births in Plum borough are unmarried. Women with the educational attainment of graduate degree are most likely to be married with 100.0% of them married at childbirth, while women with the educational attainment of high school diploma are least likely to be married with 89.5% of them unmarried at childbirth.
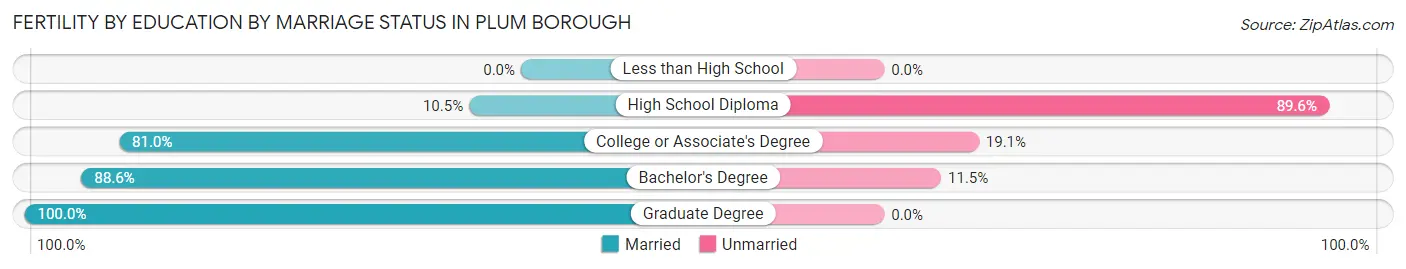
| Educational Attainment | Married | Unmarried |
| Less than High School | 0 (0.0%) | 0 (0.0%) |
| High School Diploma | 7 (10.4%) | 60 (89.5%) |
| College or Associate's Degree | 34 (80.9%) | 8 (19.1%) |
| Bachelor's Degree | 147 (88.5%) | 19 (11.5%) |
| Graduate Degree | 47 (100.0%) | 0 (0.0%) |
| Total | 235 (73.0%) | 87 (27.0%) |
Employment Characteristics in Plum borough
Employment by Class of Employer in Plum borough
Among the 14,117 employed individuals in Plum borough, private company employees (9,603 | 68.0%), not-for-profit organizations (1,918 | 13.6%), and local government employees (836 | 5.9%) make up the most common classes of employment.
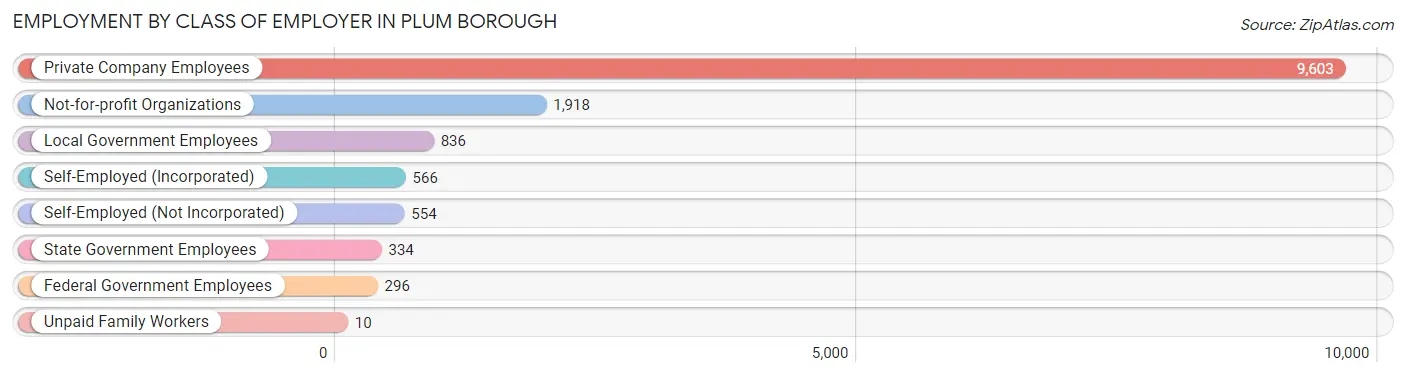
| Employer Class | # Employees | % Employees |
| Private Company Employees | 9,603 | 68.0% |
| Self-Employed (Incorporated) | 566 | 4.0% |
| Self-Employed (Not Incorporated) | 554 | 3.9% |
| Not-for-profit Organizations | 1,918 | 13.6% |
| Local Government Employees | 836 | 5.9% |
| State Government Employees | 334 | 2.4% |
| Federal Government Employees | 296 | 2.1% |
| Unpaid Family Workers | 10 | 0.1% |
| Total | 14,117 | 100.0% |
Employment Status by Age in Plum borough
According to the labor force statistics for Plum borough, out of the total population over 16 years of age (21,896), 67.3% or 14,736 individuals are in the labor force, with 2.1% or 309 of them unemployed. The age group with the highest labor force participation rate is 30 to 34 years, with 93.6% or 1,413 individuals in the labor force. Within the labor force, the 55 to 59 years age range has the highest percentage of unemployed individuals, with 5.9% or 92 of them being unemployed.
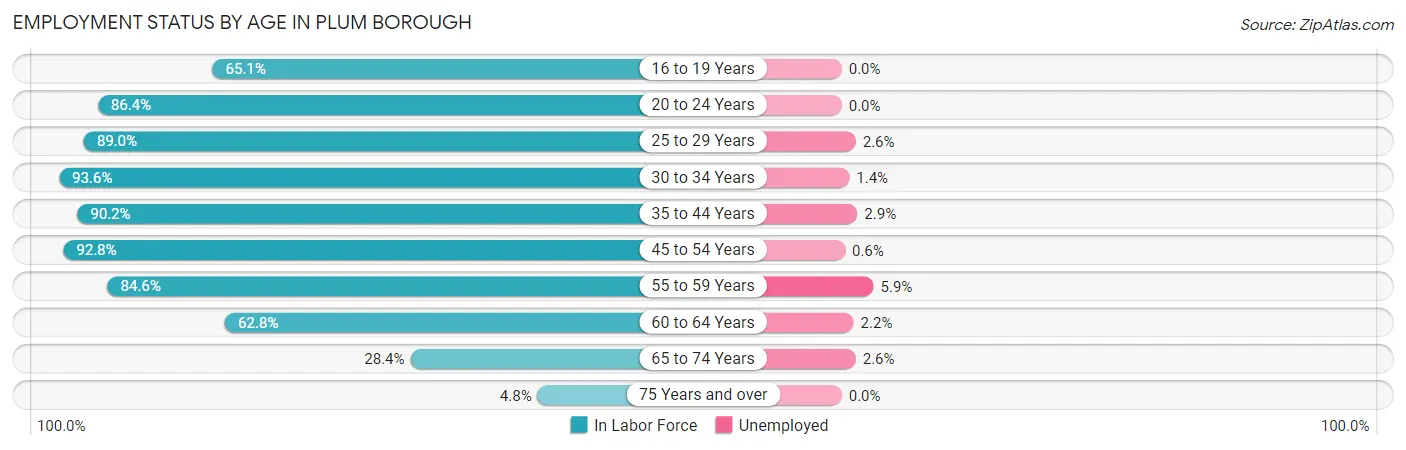
| Age Bracket | In Labor Force | Unemployed |
| 16 to 19 Years | 788 (65.1%) | 0 (0.0%) |
| 20 to 24 Years | 1,017 (86.4%) | 0 (0.0%) |
| 25 to 29 Years | 1,350 (89.0%) | 35 (2.6%) |
| 30 to 34 Years | 1,413 (93.6%) | 20 (1.4%) |
| 35 to 44 Years | 3,039 (90.2%) | 88 (2.9%) |
| 45 to 54 Years | 3,258 (92.8%) | 20 (0.6%) |
| 55 to 59 Years | 1,563 (84.6%) | 92 (5.9%) |
| 60 to 64 Years | 1,364 (62.8%) | 30 (2.2%) |
| 65 to 74 Years | 821 (28.4%) | 21 (2.6%) |
| 75 Years and over | 129 (4.8%) | 0 (0.0%) |
| Total | 14,736 (67.3%) | 309 (2.1%) |
Employment Status by Educational Attainment in Plum borough
According to labor force statistics for Plum borough, 86.1% of individuals (11,990) out of the total population between 25 and 64 years of age (13,926) are in the labor force, with 2.4% or 288 of them being unemployed. The group with the highest labor force participation rate are those with the educational attainment of bachelor's degree or higher, with 89.4% or 5,671 individuals in the labor force. Within the labor force, individuals with high school diploma education have the highest percentage of unemployment, with 4.6% or 109 of them being unemployed.
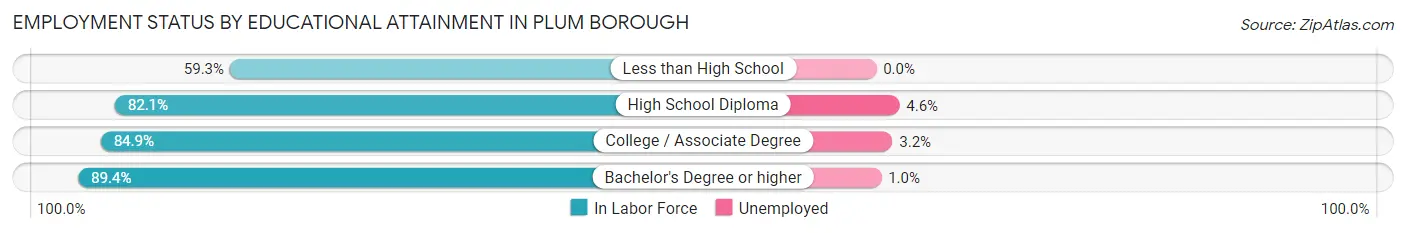
| Educational Attainment | In Labor Force | Unemployed |
| Less than High School | 102 (59.3%) | 0 (0.0%) |
| High School Diploma | 2,378 (82.1%) | 133 (4.6%) |
| College / Associate Degree | 3,833 (84.9%) | 144 (3.2%) |
| Bachelor's Degree or higher | 5,671 (89.4%) | 63 (1.0%) |
| Total | 11,990 (86.1%) | 334 (2.4%) |
Employment Occupations by Sex in Plum borough
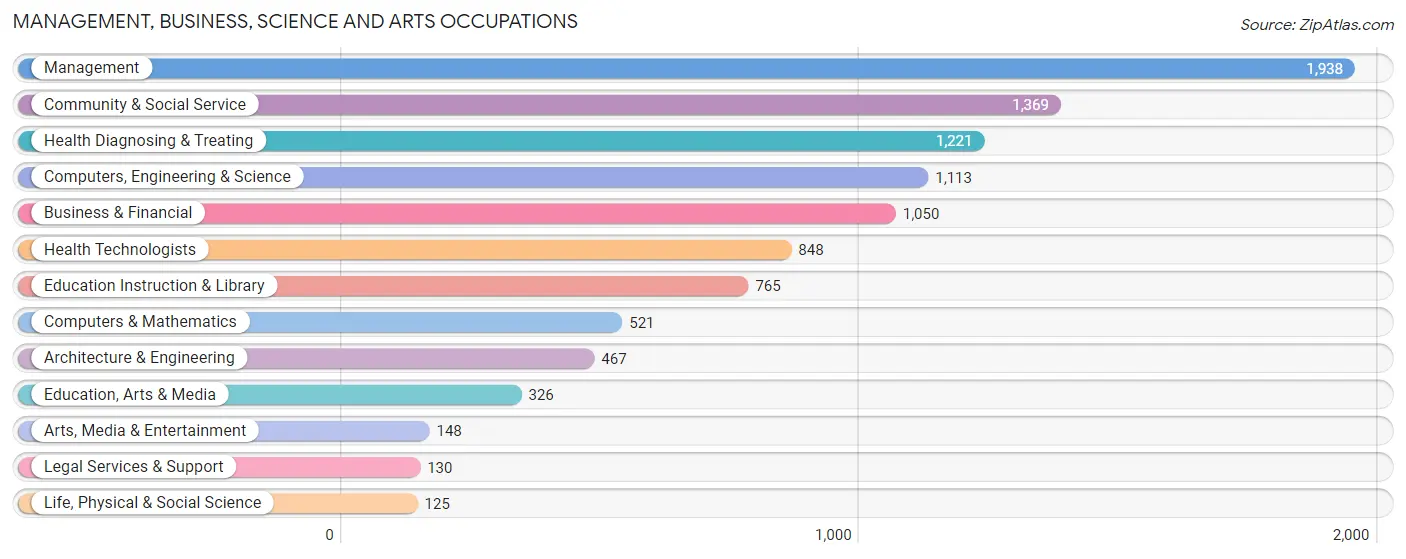
Management, Business, Science and Arts Occupations
The most common Management, Business, Science and Arts occupations in Plum borough are Management (1,938 | 13.5%), Community & Social Service (1,369 | 9.5%), Health Diagnosing & Treating (1,221 | 8.5%), Computers, Engineering & Science (1,113 | 7.8%), and Business & Financial (1,050 | 7.3%).
Management, Business, Science and Arts Occupations by Sex
Within the Management, Business, Science and Arts occupations in Plum borough, the most male-oriented occupations are Life, Physical & Social Science (81.6%), Architecture & Engineering (81.6%), and Computers, Engineering & Science (78.4%), while the most female-oriented occupations are Legal Services & Support (90.8%), Education Instruction & Library (78.4%), and Health Diagnosing & Treating (76.1%).
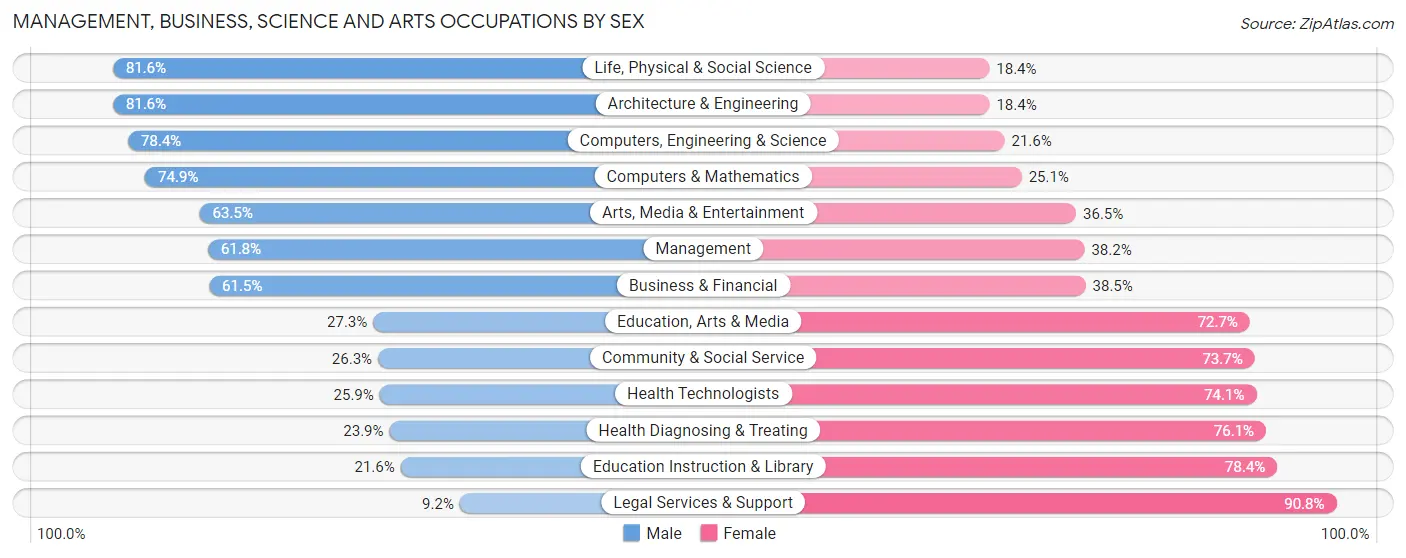
| Occupation | Male | Female |
| Management | 1,197 (61.8%) | 741 (38.2%) |
| Business & Financial | 646 (61.5%) | 404 (38.5%) |
| Computers, Engineering & Science | 873 (78.4%) | 240 (21.6%) |
| Computers & Mathematics | 390 (74.9%) | 131 (25.1%) |
| Architecture & Engineering | 381 (81.6%) | 86 (18.4%) |
| Life, Physical & Social Science | 102 (81.6%) | 23 (18.4%) |
| Community & Social Service | 360 (26.3%) | 1,009 (73.7%) |
| Education, Arts & Media | 89 (27.3%) | 237 (72.7%) |
| Legal Services & Support | 12 (9.2%) | 118 (90.8%) |
| Education Instruction & Library | 165 (21.6%) | 600 (78.4%) |
| Arts, Media & Entertainment | 94 (63.5%) | 54 (36.5%) |
| Health Diagnosing & Treating | 292 (23.9%) | 929 (76.1%) |
| Health Technologists | 220 (25.9%) | 628 (74.1%) |
| Total (Category) | 3,368 (50.3%) | 3,323 (49.7%) |
| Total (Overall) | 7,437 (51.8%) | 6,912 (48.2%) |
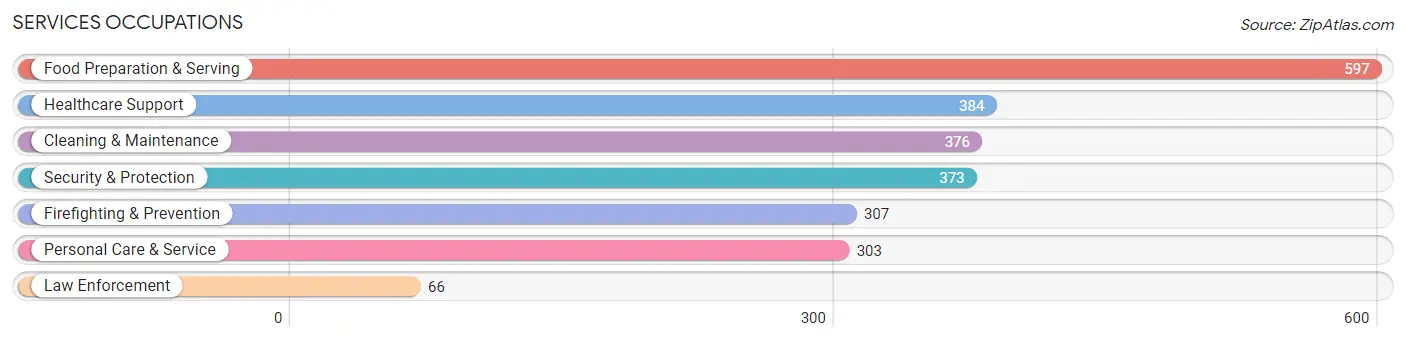
Services Occupations
The most common Services occupations in Plum borough are Food Preparation & Serving (597 | 4.2%), Healthcare Support (384 | 2.7%), Cleaning & Maintenance (376 | 2.6%), Security & Protection (373 | 2.6%), and Firefighting & Prevention (307 | 2.1%).
Services Occupations by Sex
Within the Services occupations in Plum borough, the most male-oriented occupations are Law Enforcement (100.0%), Cleaning & Maintenance (78.5%), and Security & Protection (68.6%), while the most female-oriented occupations are Healthcare Support (96.4%), Personal Care & Service (84.2%), and Food Preparation & Serving (43.0%).
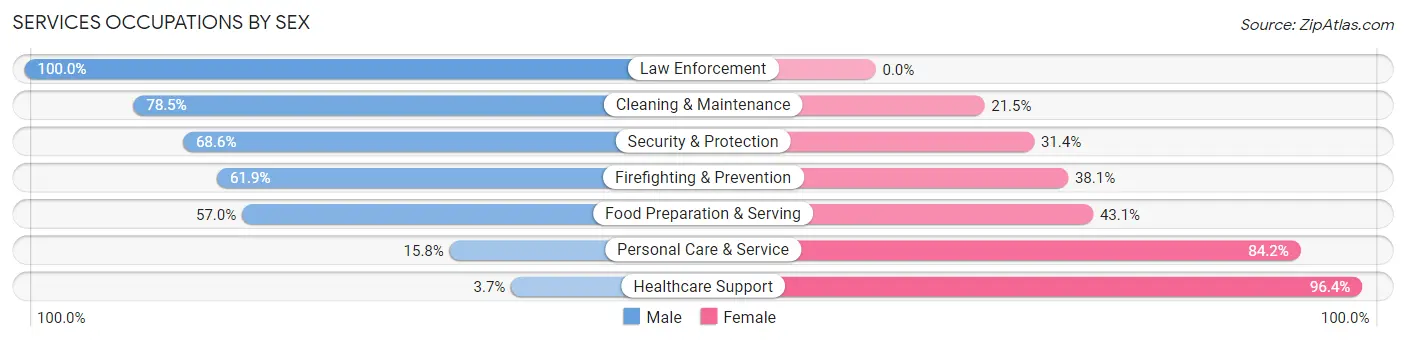
| Occupation | Male | Female |
| Healthcare Support | 14 (3.6%) | 370 (96.4%) |
| Security & Protection | 256 (68.6%) | 117 (31.4%) |
| Firefighting & Prevention | 190 (61.9%) | 117 (38.1%) |
| Law Enforcement | 66 (100.0%) | 0 (0.0%) |
| Food Preparation & Serving | 340 (57.0%) | 257 (43.0%) |
| Cleaning & Maintenance | 295 (78.5%) | 81 (21.5%) |
| Personal Care & Service | 48 (15.8%) | 255 (84.2%) |
| Total (Category) | 953 (46.9%) | 1,080 (53.1%) |
| Total (Overall) | 7,437 (51.8%) | 6,912 (48.2%) |
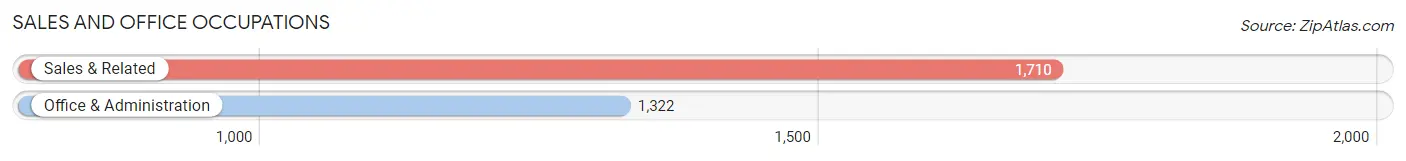
Sales and Office Occupations
The most common Sales and Office occupations in Plum borough are Sales & Related (1,710 | 11.9%), and Office & Administration (1,322 | 9.2%).
Sales and Office Occupations by Sex
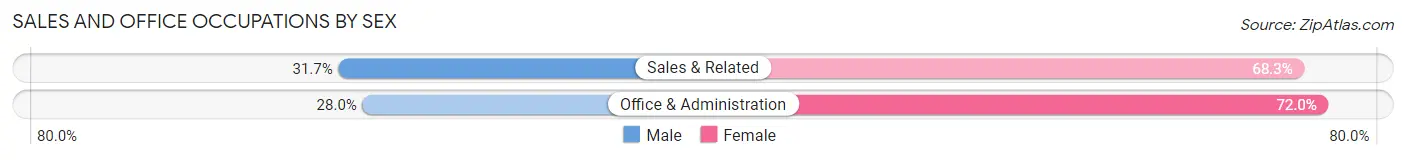
| Occupation | Male | Female |
| Sales & Related | 542 (31.7%) | 1,168 (68.3%) |
| Office & Administration | 370 (28.0%) | 952 (72.0%) |
| Total (Category) | 912 (30.1%) | 2,120 (69.9%) |
| Total (Overall) | 7,437 (51.8%) | 6,912 (48.2%) |
Natural Resources, Construction and Maintenance Occupations
The most common Natural Resources, Construction and Maintenance occupations in Plum borough are Construction & Extraction (725 | 5.1%), Installation, Maintenance & Repair (483 | 3.4%), and Farming, Fishing & Forestry (22 | 0.2%).
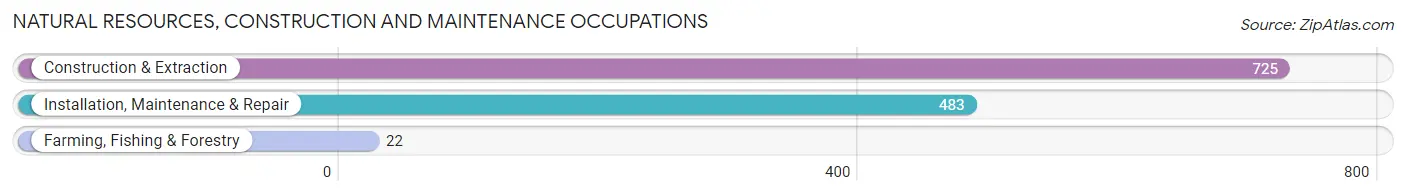
Natural Resources, Construction and Maintenance Occupations by Sex
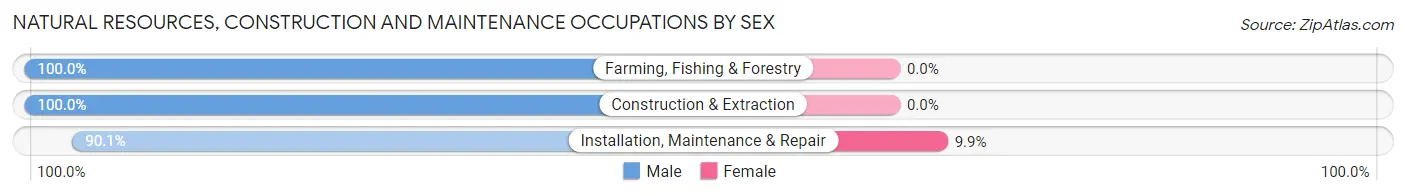
| Occupation | Male | Female |
| Farming, Fishing & Forestry | 22 (100.0%) | 0 (0.0%) |
| Construction & Extraction | 725 (100.0%) | 0 (0.0%) |
| Installation, Maintenance & Repair | 435 (90.1%) | 48 (9.9%) |
| Total (Category) | 1,182 (96.1%) | 48 (3.9%) |
| Total (Overall) | 7,437 (51.8%) | 6,912 (48.2%) |
Production, Transportation and Moving Occupations
The most common Production, Transportation and Moving occupations in Plum borough are Production (670 | 4.7%), Material Moving (353 | 2.5%), and Transportation (340 | 2.4%).
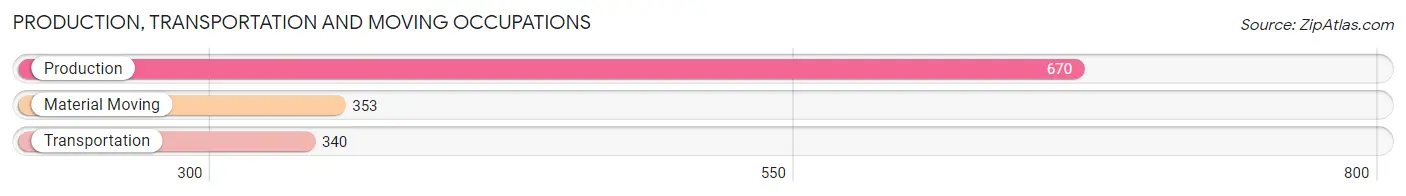
Production, Transportation and Moving Occupations by Sex
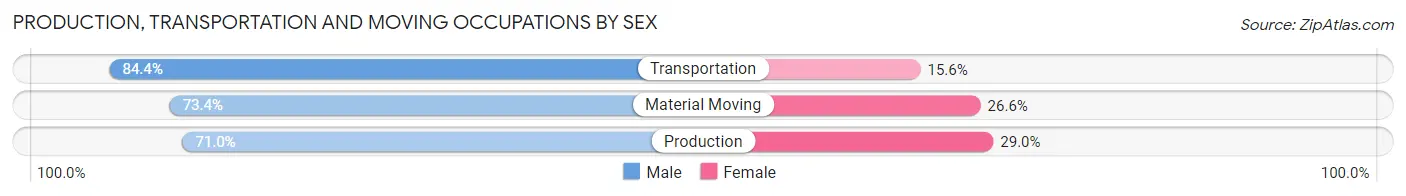
| Occupation | Male | Female |
| Production | 476 (71.0%) | 194 (29.0%) |
| Transportation | 287 (84.4%) | 53 (15.6%) |
| Material Moving | 259 (73.4%) | 94 (26.6%) |
| Total (Category) | 1,022 (75.0%) | 341 (25.0%) |
| Total (Overall) | 7,437 (51.8%) | 6,912 (48.2%) |
Employment Industries by Sex in Plum borough
Employment Industries in Plum borough
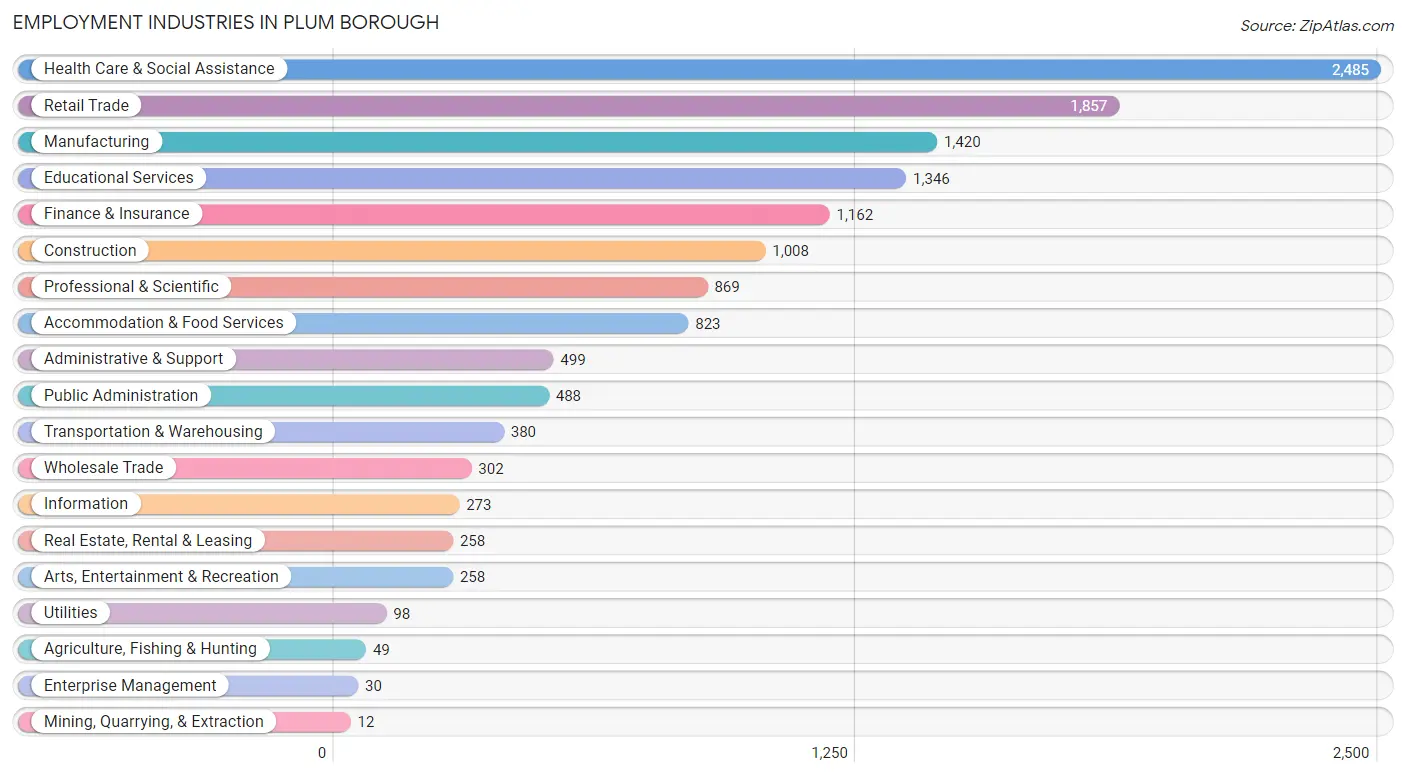
The major employment industries in Plum borough include Health Care & Social Assistance (2,485 | 17.3%), Retail Trade (1,857 | 12.9%), Manufacturing (1,420 | 9.9%), Educational Services (1,346 | 9.4%), and Finance & Insurance (1,162 | 8.1%).
Employment Industries by Sex in Plum borough
The Plum borough industries that see more men than women are Agriculture, Fishing & Hunting (100.0%), Transportation & Warehousing (91.6%), and Construction (91.0%), whereas the industries that tend to have a higher number of women are Enterprise Management (83.3%), Health Care & Social Assistance (76.8%), and Educational Services (75.8%).
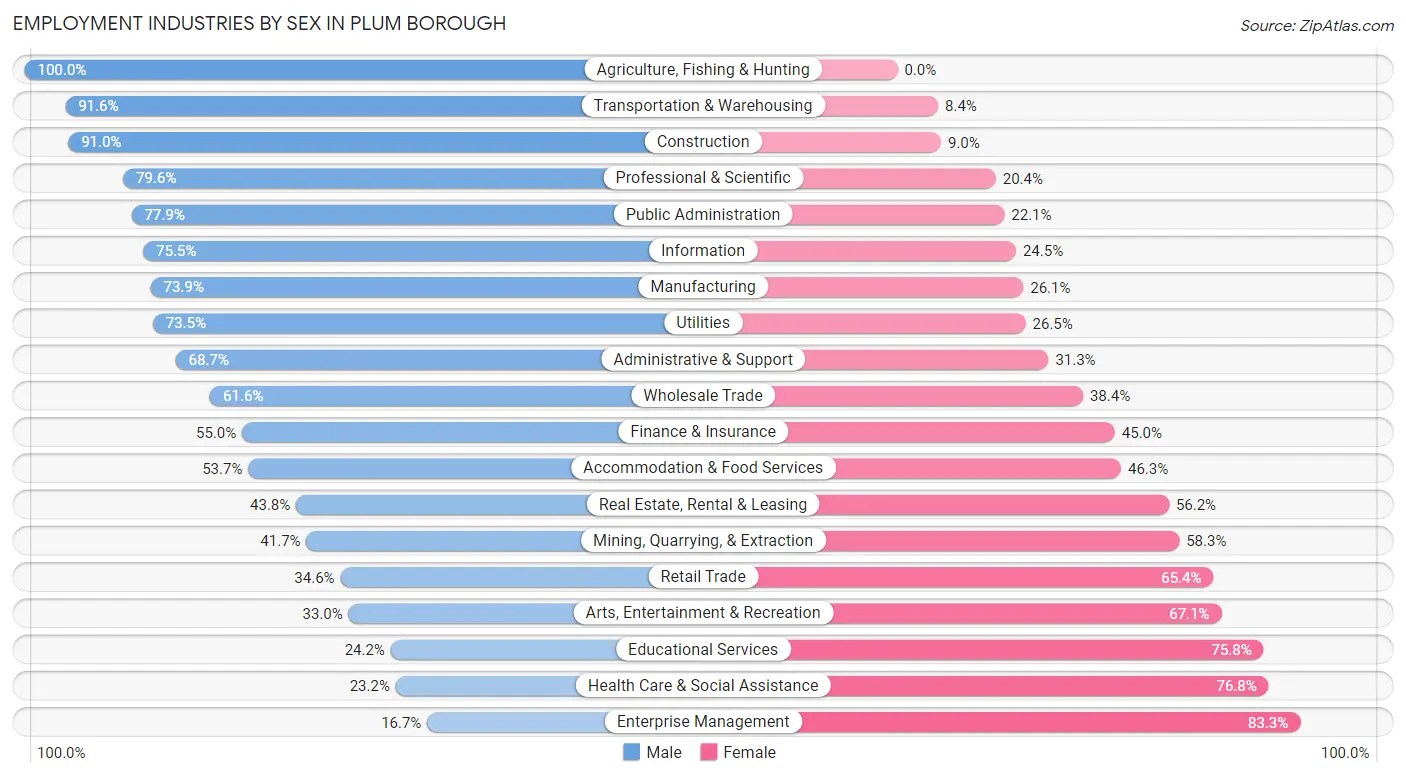
| Industry | Male | Female |
| Agriculture, Fishing & Hunting | 49 (100.0%) | 0 (0.0%) |
| Mining, Quarrying, & Extraction | 5 (41.7%) | 7 (58.3%) |
| Construction | 917 (91.0%) | 91 (9.0%) |
| Manufacturing | 1,050 (73.9%) | 370 (26.1%) |
| Wholesale Trade | 186 (61.6%) | 116 (38.4%) |
| Retail Trade | 643 (34.6%) | 1,214 (65.4%) |
| Transportation & Warehousing | 348 (91.6%) | 32 (8.4%) |
| Utilities | 72 (73.5%) | 26 (26.5%) |
| Information | 206 (75.5%) | 67 (24.5%) |
| Finance & Insurance | 639 (55.0%) | 523 (45.0%) |
| Real Estate, Rental & Leasing | 113 (43.8%) | 145 (56.2%) |
| Professional & Scientific | 692 (79.6%) | 177 (20.4%) |
| Enterprise Management | 5 (16.7%) | 25 (83.3%) |
| Administrative & Support | 343 (68.7%) | 156 (31.3%) |
| Educational Services | 326 (24.2%) | 1,020 (75.8%) |
| Health Care & Social Assistance | 576 (23.2%) | 1,909 (76.8%) |
| Arts, Entertainment & Recreation | 85 (33.0%) | 173 (67.0%) |
| Accommodation & Food Services | 442 (53.7%) | 381 (46.3%) |
| Public Administration | 380 (77.9%) | 108 (22.1%) |
| Total | 7,437 (51.8%) | 6,912 (48.2%) |
Education in Plum borough
School Enrollment in Plum borough
The most common levels of schooling among the 5,692 students in Plum borough are high school (1,462 | 25.7%), elementary school (1,305 | 22.9%), and middle school (1,205 | 21.2%).
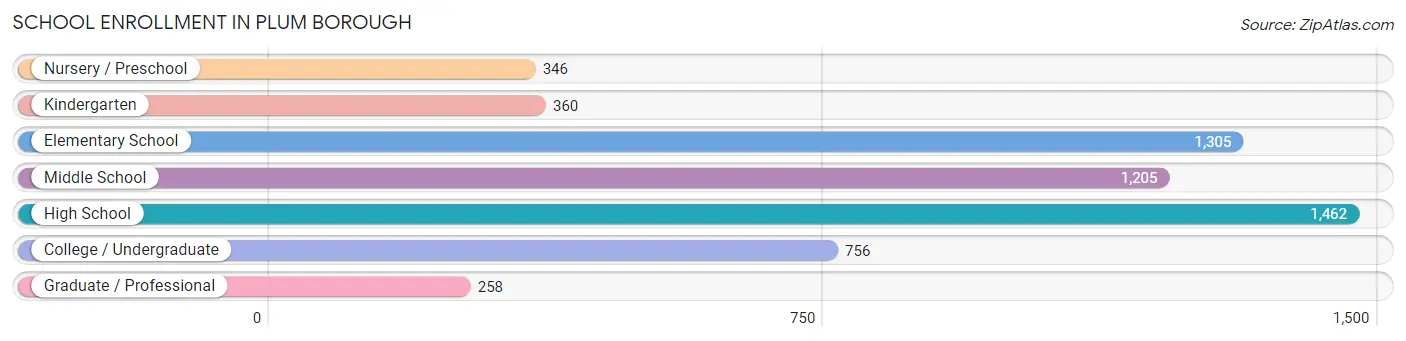
| School Level | # Students | % Students |
| Nursery / Preschool | 346 | 6.1% |
| Kindergarten | 360 | 6.3% |
| Elementary School | 1,305 | 22.9% |
| Middle School | 1,205 | 21.2% |
| High School | 1,462 | 25.7% |
| College / Undergraduate | 756 | 13.3% |
| Graduate / Professional | 258 | 4.5% |
| Total | 5,692 | 100.0% |
School Enrollment by Age by Funding Source in Plum borough
Out of a total of 5,692 students who are enrolled in schools in Plum borough, 945 (16.6%) attend a private institution, while the remaining 4,747 (83.4%) are enrolled in public schools. The age group of 3 to 4 year olds has the highest likelihood of being enrolled in private schools, with 85 (48.3% in the age bracket) enrolled. Conversely, the age group of 15 to 17 year olds has the lowest likelihood of being enrolled in a private school, with 1,059 (97.8% in the age bracket) attending a public institution.
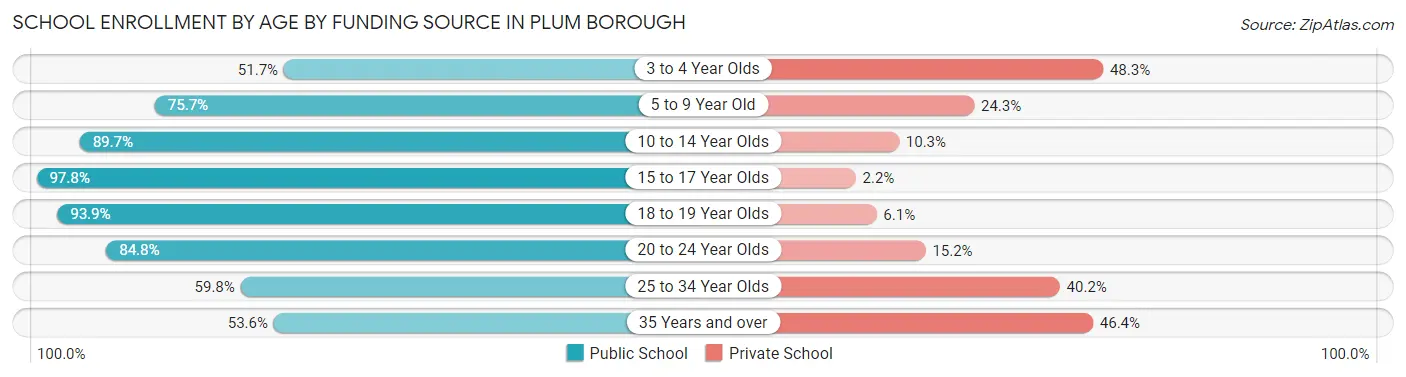
| Age Bracket | Public School | Private School |
| 3 to 4 Year Olds | 91 (51.7%) | 85 (48.3%) |
| 5 to 9 Year Old | 1,297 (75.7%) | 416 (24.3%) |
| 10 to 14 Year Olds | 1,361 (89.7%) | 156 (10.3%) |
| 15 to 17 Year Olds | 1,059 (97.8%) | 24 (2.2%) |
| 18 to 19 Year Olds | 323 (93.9%) | 21 (6.1%) |
| 20 to 24 Year Olds | 373 (84.8%) | 67 (15.2%) |
| 25 to 34 Year Olds | 159 (59.8%) | 107 (40.2%) |
| 35 Years and over | 82 (53.6%) | 71 (46.4%) |
| Total | 4,747 (83.4%) | 945 (16.6%) |
Educational Attainment by Field of Study in Plum borough
Business (1,740 | 20.7%), education (1,178 | 14.0%), science & technology (1,015 | 12.1%), arts & humanities (683 | 8.1%), and communications (657 | 7.8%) are the most common fields of study among 8,388 individuals in Plum borough who have obtained a bachelor's degree or higher.
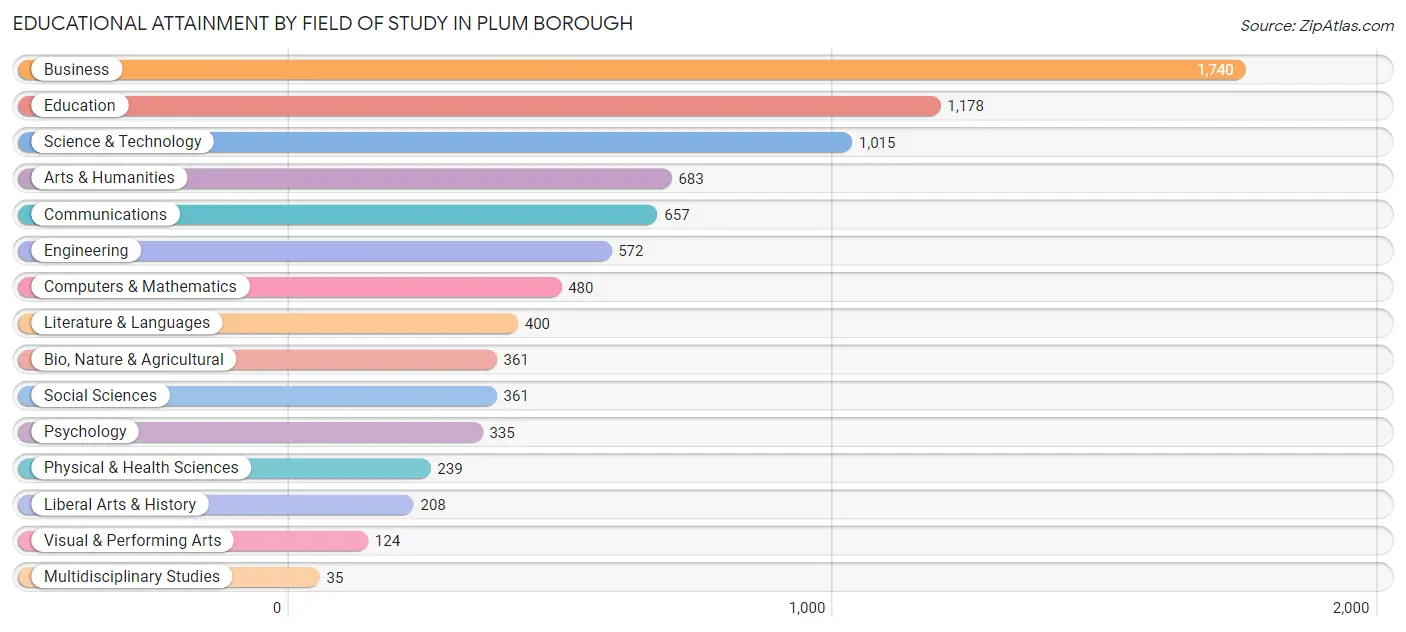
| Field of Study | # Graduates | % Graduates |
| Computers & Mathematics | 480 | 5.7% |
| Bio, Nature & Agricultural | 361 | 4.3% |
| Physical & Health Sciences | 239 | 2.9% |
| Psychology | 335 | 4.0% |
| Social Sciences | 361 | 4.3% |
| Engineering | 572 | 6.8% |
| Multidisciplinary Studies | 35 | 0.4% |
| Science & Technology | 1,015 | 12.1% |
| Business | 1,740 | 20.7% |
| Education | 1,178 | 14.0% |
| Literature & Languages | 400 | 4.8% |
| Liberal Arts & History | 208 | 2.5% |
| Visual & Performing Arts | 124 | 1.5% |
| Communications | 657 | 7.8% |
| Arts & Humanities | 683 | 8.1% |
| Total | 8,388 | 100.0% |
Transportation & Commute in Plum borough
Vehicle Availability by Sex in Plum borough
The most prevalent vehicle ownership categories in Plum borough are males with 2 vehicles (3,588, accounting for 48.3%) and females with 2 vehicles (3,049, making up 53.6%).
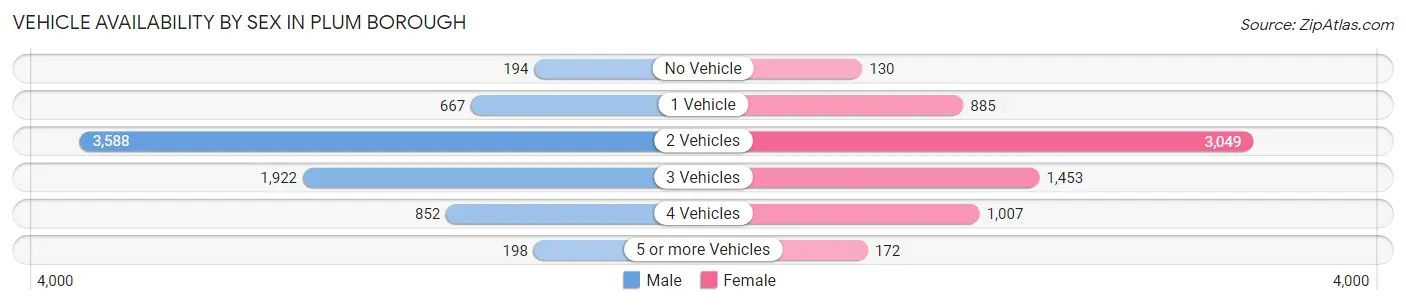
| Vehicles Available | Male | Female |
| No Vehicle | 194 (2.6%) | 130 (1.9%) |
| 1 Vehicle | 667 (9.0%) | 885 (13.2%) |
| 2 Vehicles | 3,588 (48.3%) | 3,049 (45.5%) |
| 3 Vehicles | 1,922 (25.9%) | 1,453 (21.7%) |
| 4 Vehicles | 852 (11.5%) | 1,007 (15.0%) |
| 5 or more Vehicles | 198 (2.7%) | 172 (2.6%) |
| Total | 7,421 (100.0%) | 6,696 (100.0%) |
Commute Time in Plum borough
The most frequently occuring commute durations in Plum borough are 30 to 34 minutes (1,931 commuters, 16.7%), 45 to 59 minutes (1,718 commuters, 14.9%), and 20 to 24 minutes (1,591 commuters, 13.8%).
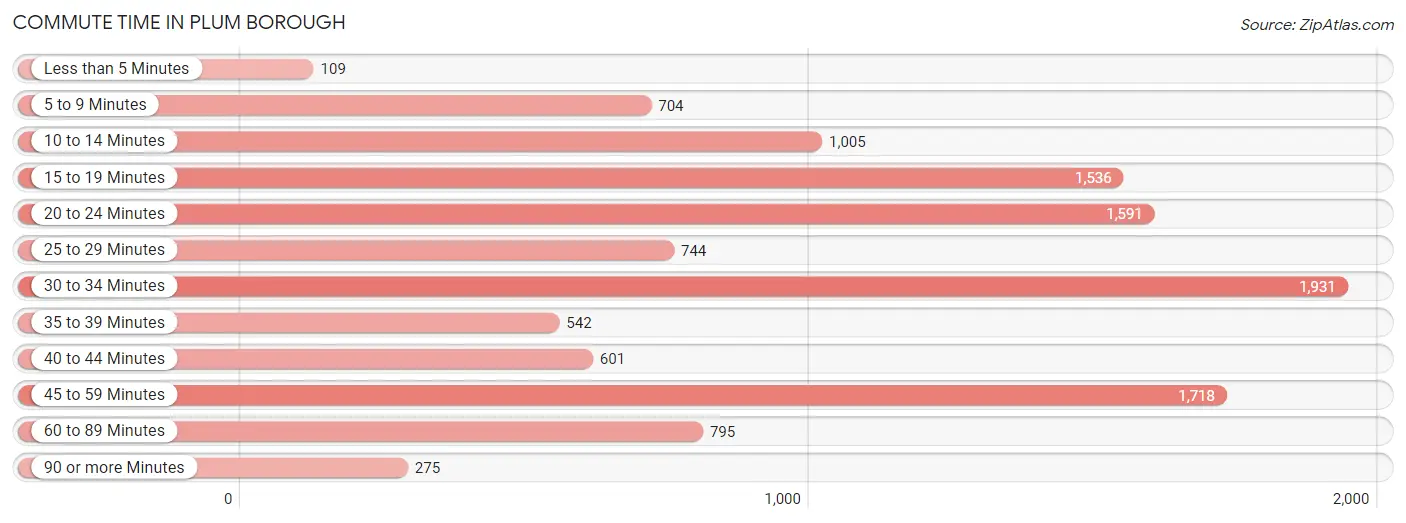
| Commute Time | # Commuters | % Commuters |
| Less than 5 Minutes | 109 | 0.9% |
| 5 to 9 Minutes | 704 | 6.1% |
| 10 to 14 Minutes | 1,005 | 8.7% |
| 15 to 19 Minutes | 1,536 | 13.3% |
| 20 to 24 Minutes | 1,591 | 13.8% |
| 25 to 29 Minutes | 744 | 6.4% |
| 30 to 34 Minutes | 1,931 | 16.7% |
| 35 to 39 Minutes | 542 | 4.7% |
| 40 to 44 Minutes | 601 | 5.2% |
| 45 to 59 Minutes | 1,718 | 14.9% |
| 60 to 89 Minutes | 795 | 6.9% |
| 90 or more Minutes | 275 | 2.4% |
Commute Time by Sex in Plum borough
The most common commute times in Plum borough are 30 to 34 minutes (1,208 commuters, 19.7%) for males and 15 to 19 minutes (896 commuters, 16.6%) for females.
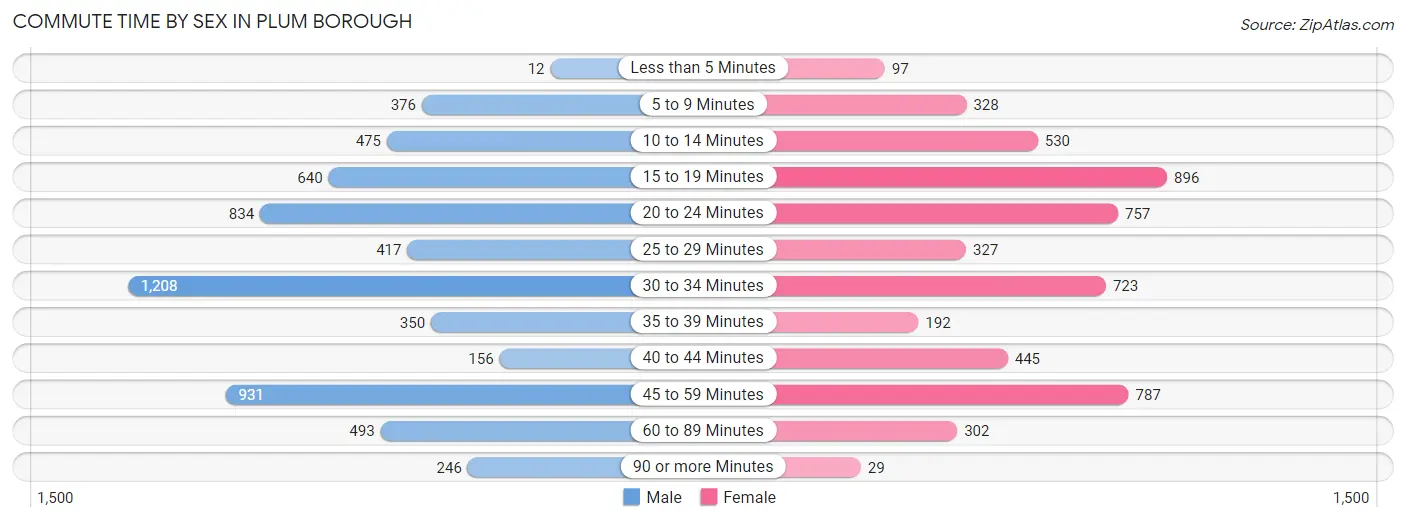
| Commute Time | Male | Female |
| Less than 5 Minutes | 12 (0.2%) | 97 (1.8%) |
| 5 to 9 Minutes | 376 (6.1%) | 328 (6.1%) |
| 10 to 14 Minutes | 475 (7.7%) | 530 (9.8%) |
| 15 to 19 Minutes | 640 (10.4%) | 896 (16.6%) |
| 20 to 24 Minutes | 834 (13.6%) | 757 (14.0%) |
| 25 to 29 Minutes | 417 (6.8%) | 327 (6.0%) |
| 30 to 34 Minutes | 1,208 (19.7%) | 723 (13.4%) |
| 35 to 39 Minutes | 350 (5.7%) | 192 (3.5%) |
| 40 to 44 Minutes | 156 (2.5%) | 445 (8.2%) |
| 45 to 59 Minutes | 931 (15.2%) | 787 (14.5%) |
| 60 to 89 Minutes | 493 (8.0%) | 302 (5.6%) |
| 90 or more Minutes | 246 (4.0%) | 29 (0.5%) |
Time of Departure to Work by Sex in Plum borough
The most frequent times of departure to work in Plum borough are 7:00 AM to 7:29 AM (847, 13.8%) for males and 7:00 AM to 7:29 AM (898, 16.6%) for females.
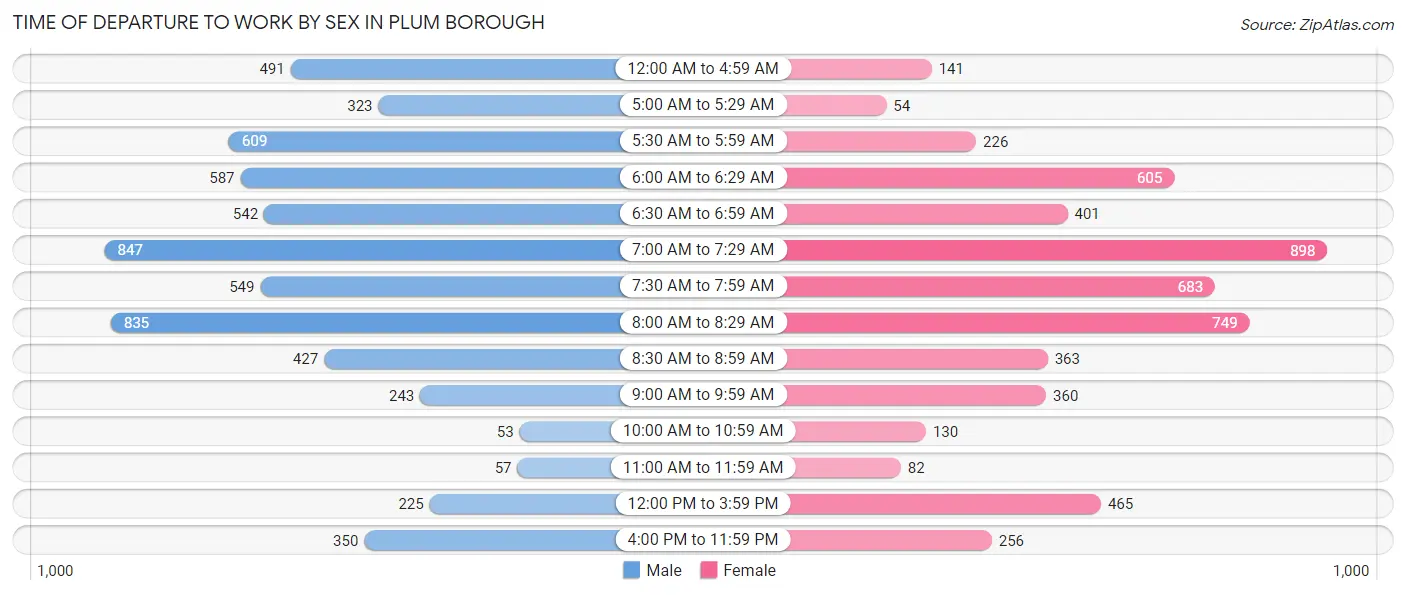
| Time of Departure | Male | Female |
| 12:00 AM to 4:59 AM | 491 (8.0%) | 141 (2.6%) |
| 5:00 AM to 5:29 AM | 323 (5.3%) | 54 (1.0%) |
| 5:30 AM to 5:59 AM | 609 (9.9%) | 226 (4.2%) |
| 6:00 AM to 6:29 AM | 587 (9.6%) | 605 (11.2%) |
| 6:30 AM to 6:59 AM | 542 (8.8%) | 401 (7.4%) |
| 7:00 AM to 7:29 AM | 847 (13.8%) | 898 (16.6%) |
| 7:30 AM to 7:59 AM | 549 (8.9%) | 683 (12.6%) |
| 8:00 AM to 8:29 AM | 835 (13.6%) | 749 (13.8%) |
| 8:30 AM to 8:59 AM | 427 (7.0%) | 363 (6.7%) |
| 9:00 AM to 9:59 AM | 243 (4.0%) | 360 (6.7%) |
| 10:00 AM to 10:59 AM | 53 (0.9%) | 130 (2.4%) |
| 11:00 AM to 11:59 AM | 57 (0.9%) | 82 (1.5%) |
| 12:00 PM to 3:59 PM | 225 (3.7%) | 465 (8.6%) |
| 4:00 PM to 11:59 PM | 350 (5.7%) | 256 (4.7%) |
| Total | 6,138 (100.0%) | 5,413 (100.0%) |
Housing Occupancy in Plum borough
Occupancy by Ownership in Plum borough
Of the total 10,727 dwellings in Plum borough, owner-occupied units account for 8,772 (81.8%), while renter-occupied units make up 1,955 (18.2%).
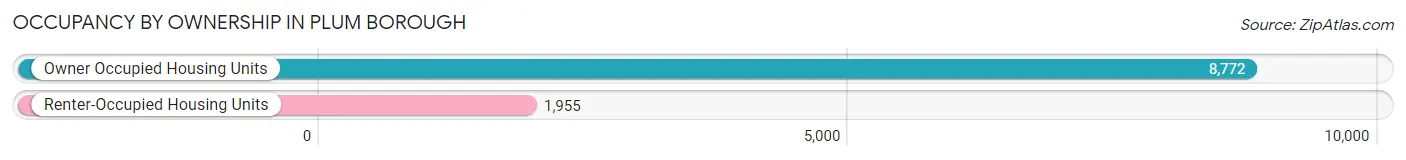
| Occupancy | # Housing Units | % Housing Units |
| Owner Occupied Housing Units | 8,772 | 81.8% |
| Renter-Occupied Housing Units | 1,955 | 18.2% |
| Total Occupied Housing Units | 10,727 | 100.0% |
Occupancy by Household Size in Plum borough
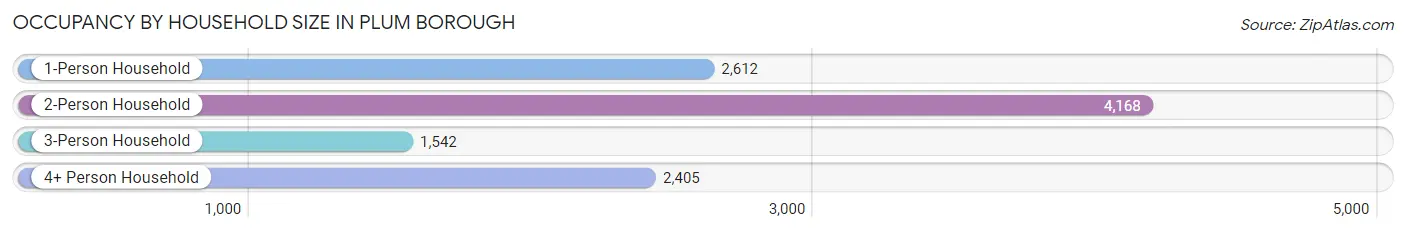
| Household Size | # Housing Units | % Housing Units |
| 1-Person Household | 2,612 | 24.3% |
| 2-Person Household | 4,168 | 38.9% |
| 3-Person Household | 1,542 | 14.4% |
| 4+ Person Household | 2,405 | 22.4% |
| Total Housing Units | 10,727 | 100.0% |
Occupancy by Ownership by Household Size in Plum borough
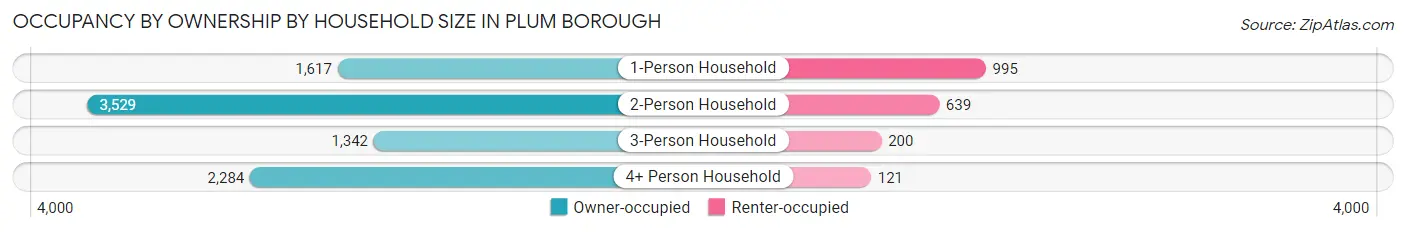
| Household Size | Owner-occupied | Renter-occupied |
| 1-Person Household | 1,617 (61.9%) | 995 (38.1%) |
| 2-Person Household | 3,529 (84.7%) | 639 (15.3%) |
| 3-Person Household | 1,342 (87.0%) | 200 (13.0%) |
| 4+ Person Household | 2,284 (95.0%) | 121 (5.0%) |
| Total Housing Units | 8,772 (81.8%) | 1,955 (18.2%) |
Occupancy by Educational Attainment in Plum borough
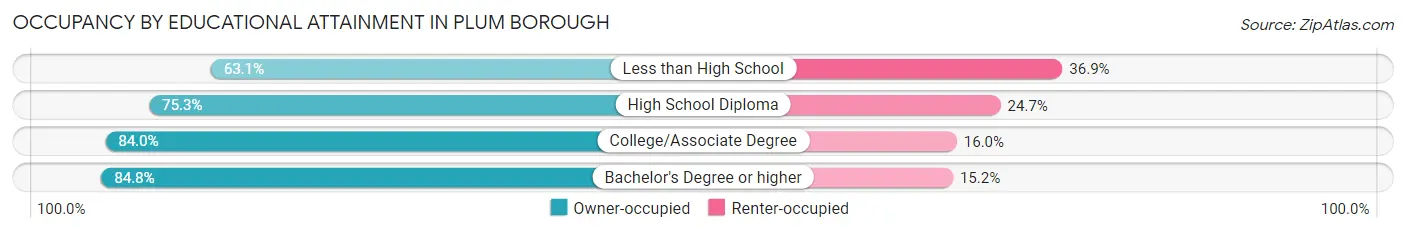
| Household Size | Owner-occupied | Renter-occupied |
| Less than High School | 123 (63.1%) | 72 (36.9%) |
| High School Diploma | 2,017 (75.3%) | 661 (24.7%) |
| College/Associate Degree | 2,808 (84.0%) | 535 (16.0%) |
| Bachelor's Degree or higher | 3,824 (84.8%) | 687 (15.2%) |
Occupancy by Age of Householder in Plum borough
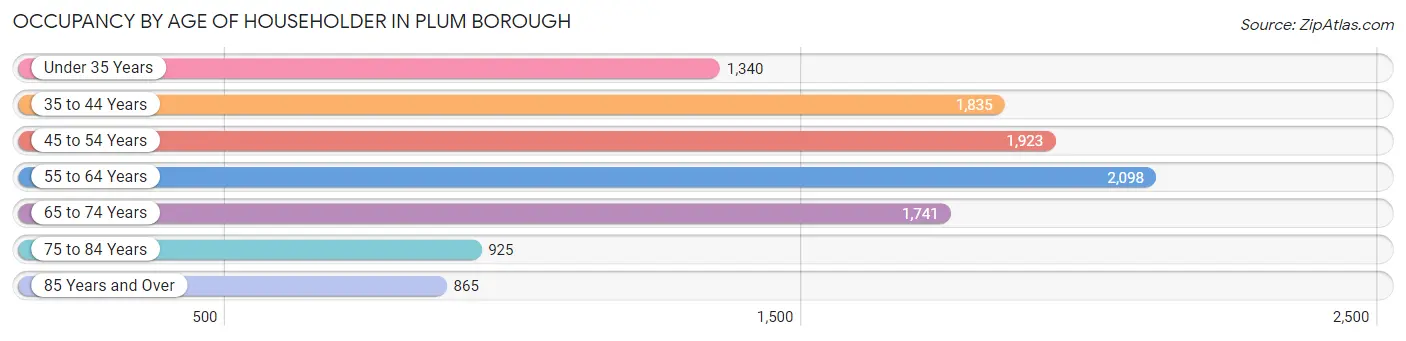
| Age Bracket | # Households | % Households |
| Under 35 Years | 1,340 | 12.5% |
| 35 to 44 Years | 1,835 | 17.1% |
| 45 to 54 Years | 1,923 | 17.9% |
| 55 to 64 Years | 2,098 | 19.6% |
| 65 to 74 Years | 1,741 | 16.2% |
| 75 to 84 Years | 925 | 8.6% |
| 85 Years and Over | 865 | 8.1% |
| Total | 10,727 | 100.0% |
Housing Finances in Plum borough
Median Income by Occupancy in Plum borough
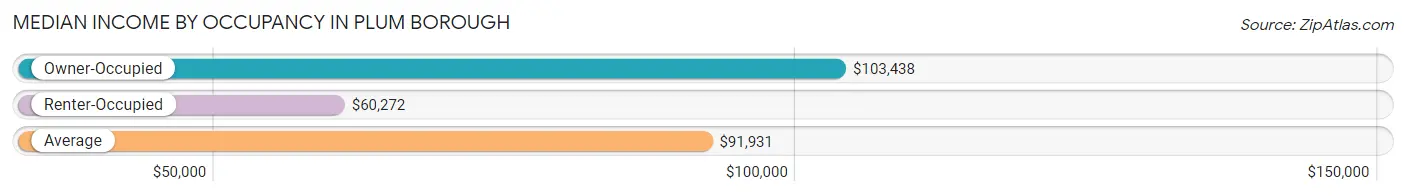
| Occupancy Type | # Households | Median Income |
| Owner-Occupied | 8,772 (81.8%) | $103,438 |
| Renter-Occupied | 1,955 (18.2%) | $60,272 |
| Average | 10,727 (100.0%) | $91,931 |
Occupancy by Householder Income Bracket in Plum borough
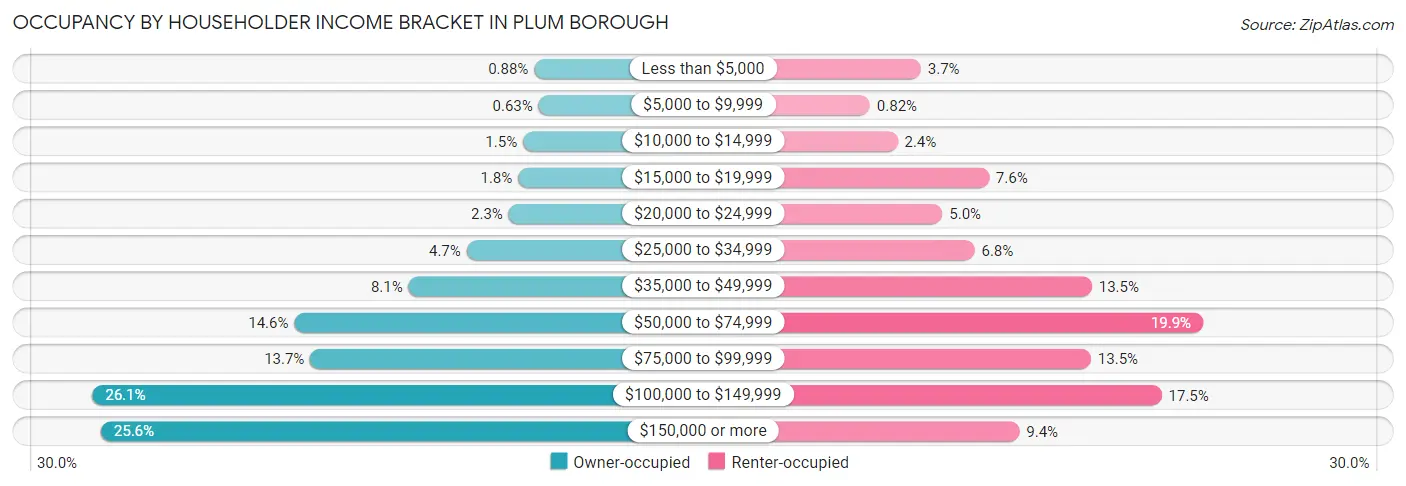
| Income Bracket | Owner-occupied | Renter-occupied |
| Less than $5,000 | 77 (0.9%) | 73 (3.7%) |
| $5,000 to $9,999 | 55 (0.6%) | 16 (0.8%) |
| $10,000 to $14,999 | 133 (1.5%) | 47 (2.4%) |
| $15,000 to $19,999 | 158 (1.8%) | 149 (7.6%) |
| $20,000 to $24,999 | 205 (2.3%) | 97 (5.0%) |
| $25,000 to $34,999 | 416 (4.7%) | 133 (6.8%) |
| $35,000 to $49,999 | 707 (8.1%) | 264 (13.5%) |
| $50,000 to $74,999 | 1,280 (14.6%) | 388 (19.9%) |
| $75,000 to $99,999 | 1,200 (13.7%) | 263 (13.5%) |
| $100,000 to $149,999 | 2,292 (26.1%) | 342 (17.5%) |
| $150,000 or more | 2,249 (25.6%) | 183 (9.4%) |
| Total | 8,772 (100.0%) | 1,955 (100.0%) |
Monthly Housing Cost Tiers in Plum borough
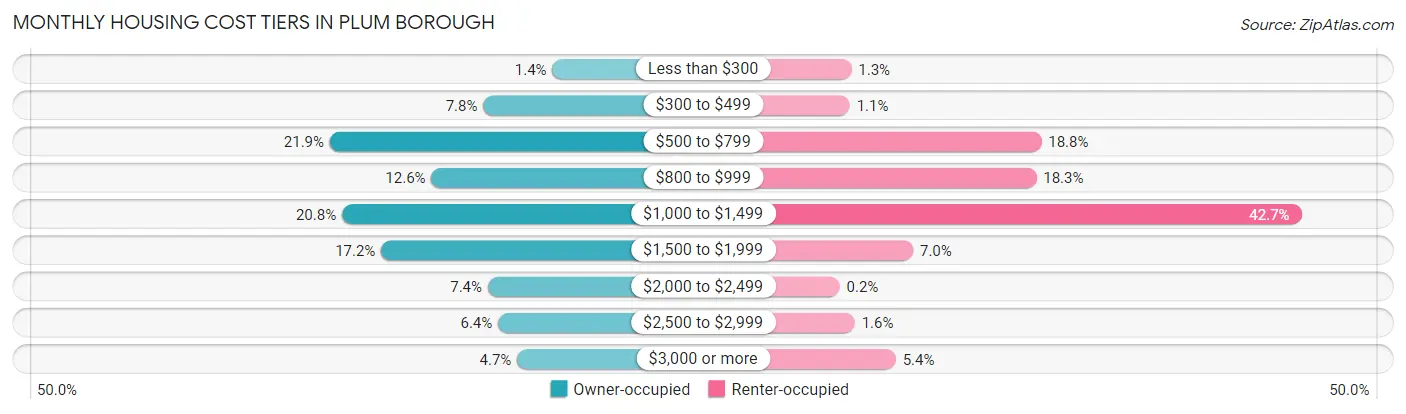
| Monthly Cost | Owner-occupied | Renter-occupied |
| Less than $300 | 124 (1.4%) | 25 (1.3%) |
| $300 to $499 | 682 (7.8%) | 22 (1.1%) |
| $500 to $799 | 1,921 (21.9%) | 367 (18.8%) |
| $800 to $999 | 1,101 (12.6%) | 358 (18.3%) |
| $1,000 to $1,499 | 1,823 (20.8%) | 835 (42.7%) |
| $1,500 to $1,999 | 1,506 (17.2%) | 136 (7.0%) |
| $2,000 to $2,499 | 645 (7.3%) | 4 (0.2%) |
| $2,500 to $2,999 | 562 (6.4%) | 31 (1.6%) |
| $3,000 or more | 408 (4.6%) | 105 (5.4%) |
| Total | 8,772 (100.0%) | 1,955 (100.0%) |
Physical Housing Characteristics in Plum borough
Housing Structures in Plum borough
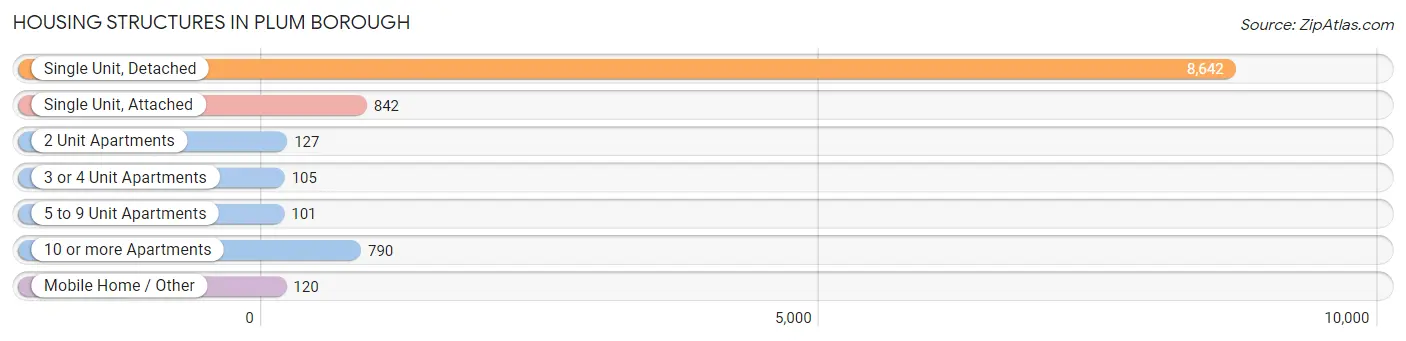
| Structure Type | # Housing Units | % Housing Units |
| Single Unit, Detached | 8,642 | 80.6% |
| Single Unit, Attached | 842 | 7.9% |
| 2 Unit Apartments | 127 | 1.2% |
| 3 or 4 Unit Apartments | 105 | 1.0% |
| 5 to 9 Unit Apartments | 101 | 0.9% |
| 10 or more Apartments | 790 | 7.4% |
| Mobile Home / Other | 120 | 1.1% |
| Total | 10,727 | 100.0% |
Housing Structures by Occupancy in Plum borough
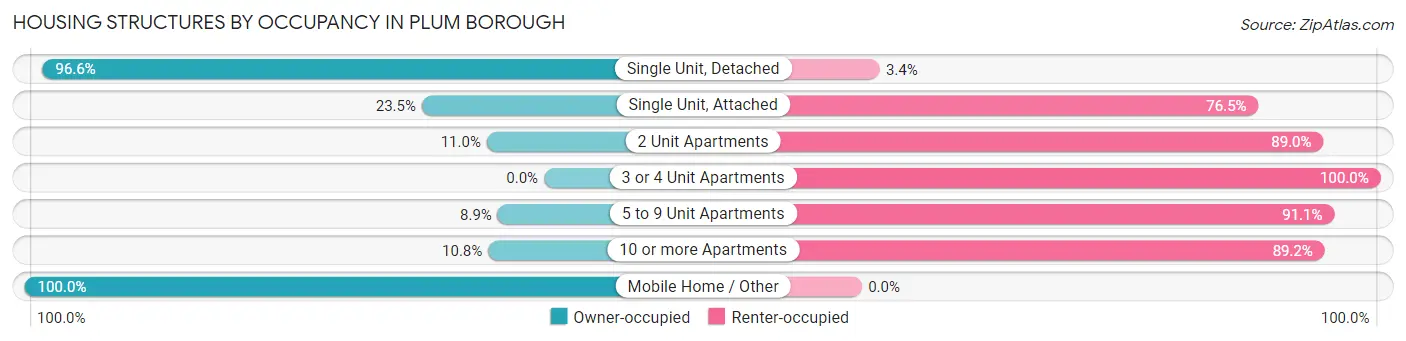
| Structure Type | Owner-occupied | Renter-occupied |
| Single Unit, Detached | 8,346 (96.6%) | 296 (3.4%) |
| Single Unit, Attached | 198 (23.5%) | 644 (76.5%) |
| 2 Unit Apartments | 14 (11.0%) | 113 (89.0%) |
| 3 or 4 Unit Apartments | 0 (0.0%) | 105 (100.0%) |
| 5 to 9 Unit Apartments | 9 (8.9%) | 92 (91.1%) |
| 10 or more Apartments | 85 (10.8%) | 705 (89.2%) |
| Mobile Home / Other | 120 (100.0%) | 0 (0.0%) |
| Total | 8,772 (81.8%) | 1,955 (18.2%) |
Housing Structures by Number of Rooms in Plum borough
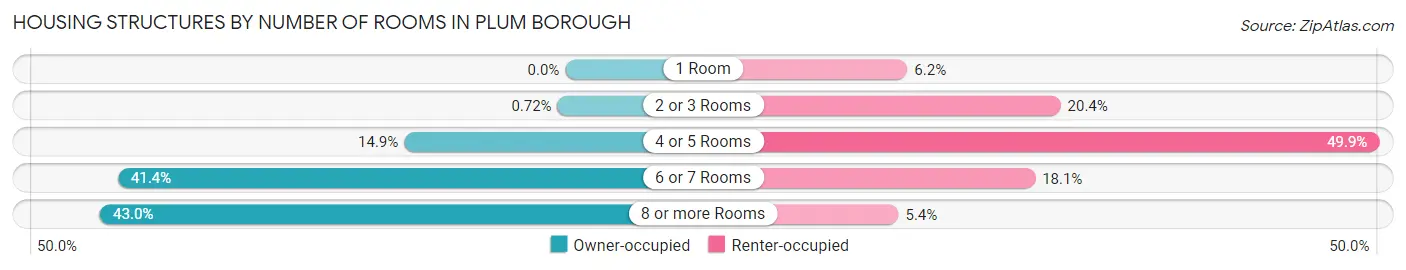
| Number of Rooms | Owner-occupied | Renter-occupied |
| 1 Room | 0 (0.0%) | 122 (6.2%) |
| 2 or 3 Rooms | 63 (0.7%) | 399 (20.4%) |
| 4 or 5 Rooms | 1,307 (14.9%) | 975 (49.9%) |
| 6 or 7 Rooms | 3,629 (41.4%) | 353 (18.1%) |
| 8 or more Rooms | 3,773 (43.0%) | 106 (5.4%) |
| Total | 8,772 (100.0%) | 1,955 (100.0%) |
Housing Structure by Heating Type in Plum borough
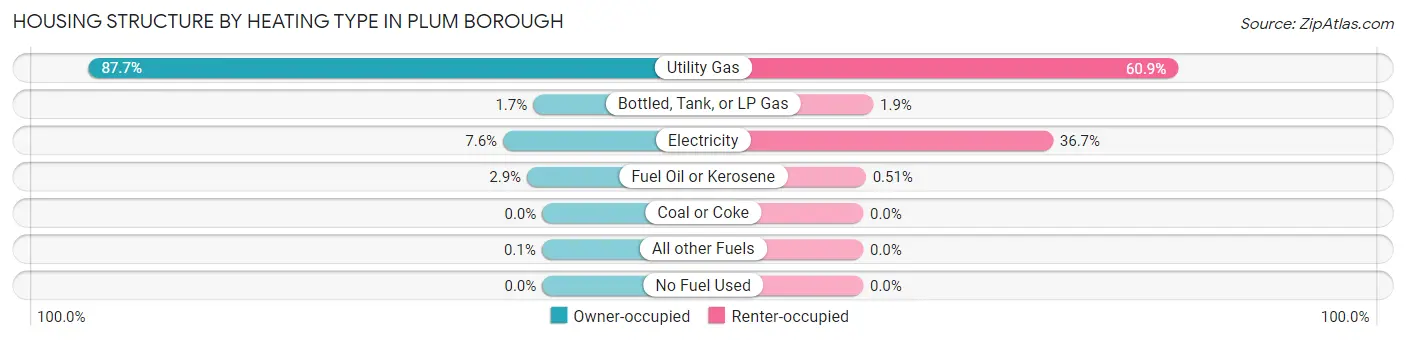
| Heating Type | Owner-occupied | Renter-occupied |
| Utility Gas | 7,689 (87.6%) | 1,190 (60.9%) |
| Bottled, Tank, or LP Gas | 153 (1.7%) | 38 (1.9%) |
| Electricity | 664 (7.6%) | 717 (36.7%) |
| Fuel Oil or Kerosene | 257 (2.9%) | 10 (0.5%) |
| Coal or Coke | 0 (0.0%) | 0 (0.0%) |
| All other Fuels | 9 (0.1%) | 0 (0.0%) |
| No Fuel Used | 0 (0.0%) | 0 (0.0%) |
| Total | 8,772 (100.0%) | 1,955 (100.0%) |
Household Vehicle Usage in Plum borough
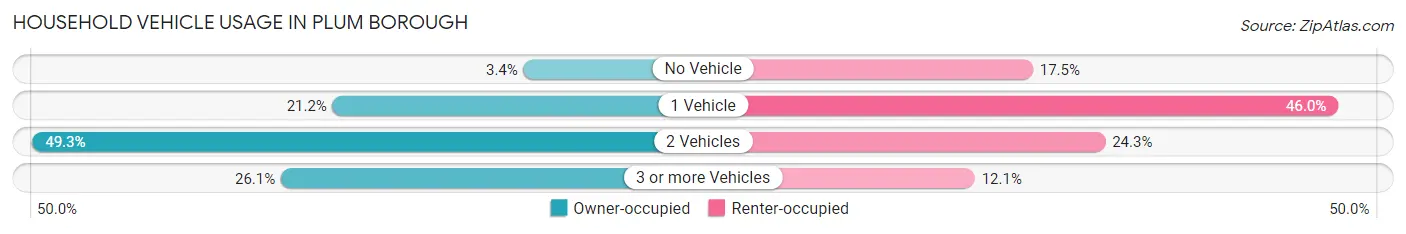
| Vehicles per Household | Owner-occupied | Renter-occupied |
| No Vehicle | 300 (3.4%) | 343 (17.5%) |
| 1 Vehicle | 1,863 (21.2%) | 900 (46.0%) |
| 2 Vehicles | 4,323 (49.3%) | 475 (24.3%) |
| 3 or more Vehicles | 2,286 (26.1%) | 237 (12.1%) |
| Total | 8,772 (100.0%) | 1,955 (100.0%) |
Real Estate & Mortgages in Plum borough
Real Estate and Mortgage Overview in Plum borough
| Characteristic | Without Mortgage | With Mortgage |
| Housing Units | 3,633 | 5,139 |
| Median Property Value | $184,900 | $213,300 |
| Median Household Income | $73,507 | $1,748 |
| Monthly Housing Costs | $659 | $408 |
| Real Estate Taxes | $3,539 | $36 |
Property Value by Mortgage Status in Plum borough
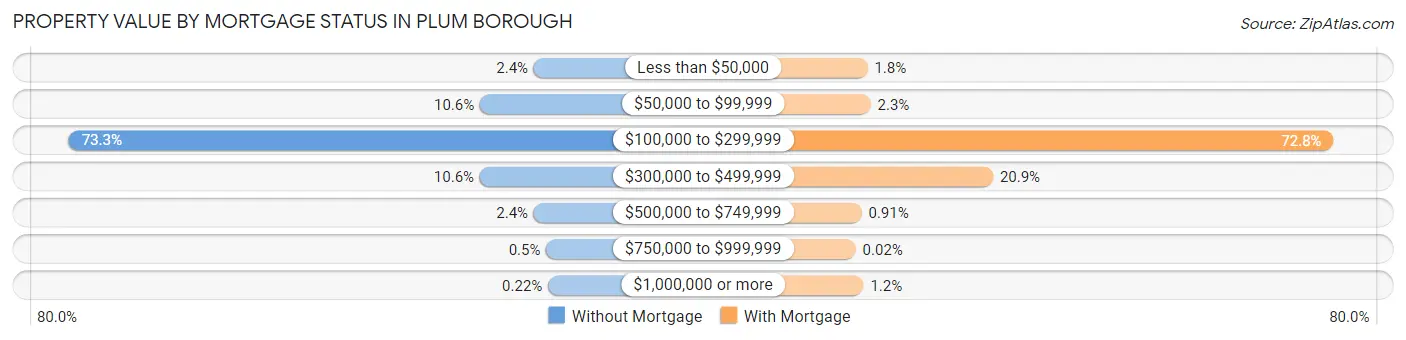
| Property Value | Without Mortgage | With Mortgage |
| Less than $50,000 | 87 (2.4%) | 93 (1.8%) |
| $50,000 to $99,999 | 385 (10.6%) | 118 (2.3%) |
| $100,000 to $299,999 | 2,662 (73.3%) | 3,742 (72.8%) |
| $300,000 to $499,999 | 386 (10.6%) | 1,076 (20.9%) |
| $500,000 to $749,999 | 87 (2.4%) | 47 (0.9%) |
| $750,000 to $999,999 | 18 (0.5%) | 1 (0.0%) |
| $1,000,000 or more | 8 (0.2%) | 62 (1.2%) |
| Total | 3,633 (100.0%) | 5,139 (100.0%) |
Household Income by Mortgage Status in Plum borough
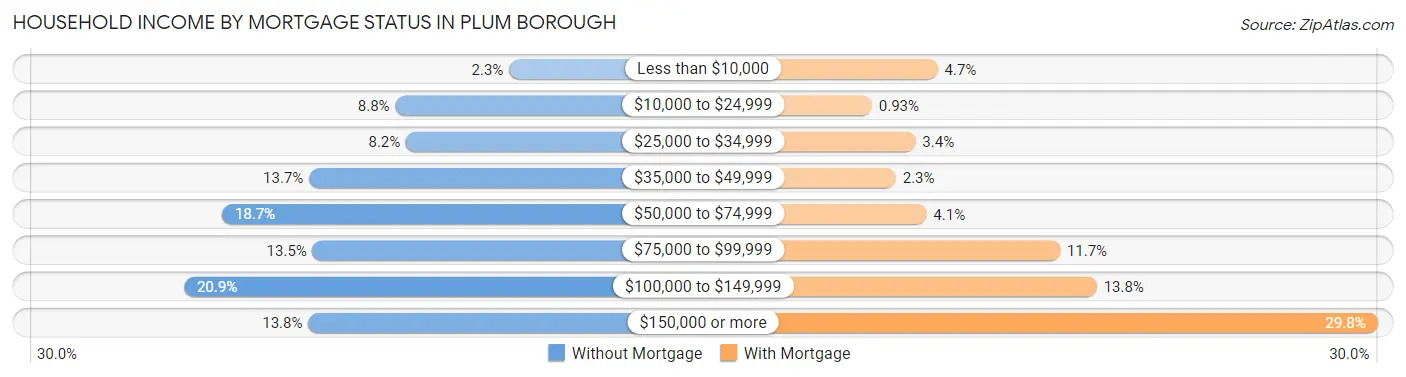
| Household Income | Without Mortgage | With Mortgage |
| Less than $10,000 | 84 (2.3%) | 241 (4.7%) |
| $10,000 to $24,999 | 320 (8.8%) | 48 (0.9%) |
| $25,000 to $34,999 | 298 (8.2%) | 176 (3.4%) |
| $35,000 to $49,999 | 499 (13.7%) | 118 (2.3%) |
| $50,000 to $74,999 | 680 (18.7%) | 208 (4.1%) |
| $75,000 to $99,999 | 492 (13.5%) | 600 (11.7%) |
| $100,000 to $149,999 | 759 (20.9%) | 708 (13.8%) |
| $150,000 or more | 501 (13.8%) | 1,533 (29.8%) |
| Total | 3,633 (100.0%) | 5,139 (100.0%) |
Property Value to Household Income Ratio in Plum borough
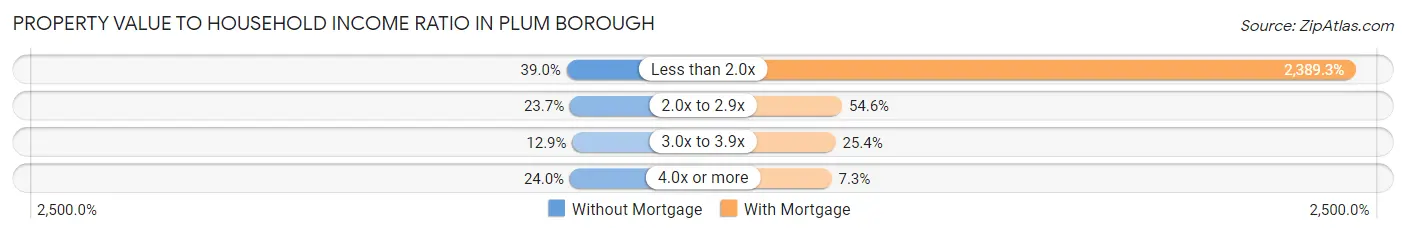
| Value-to-Income Ratio | Without Mortgage | With Mortgage |
| Less than 2.0x | 1,415 (39.0%) | 122,785 (2,389.3%) |
| 2.0x to 2.9x | 861 (23.7%) | 2,805 (54.6%) |
| 3.0x to 3.9x | 470 (12.9%) | 1,305 (25.4%) |
| 4.0x or more | 870 (23.9%) | 377 (7.3%) |
| Total | 3,633 (100.0%) | 5,139 (100.0%) |
Real Estate Taxes by Mortgage Status in Plum borough
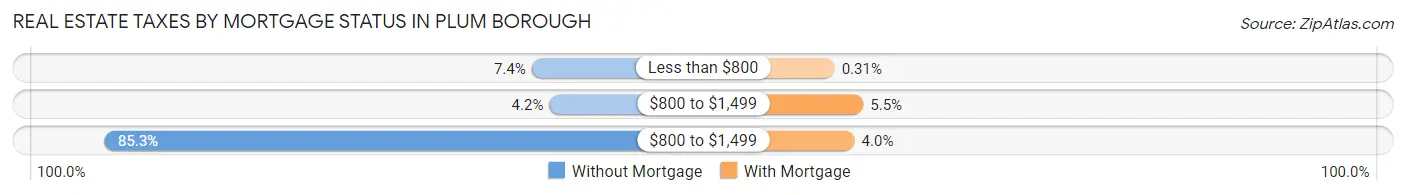
| Property Taxes | Without Mortgage | With Mortgage |
| Less than $800 | 269 (7.4%) | 16 (0.3%) |
| $800 to $1,499 | 152 (4.2%) | 284 (5.5%) |
| $800 to $1,499 | 3,100 (85.3%) | 203 (4.0%) |
| Total | 3,633 (100.0%) | 5,139 (100.0%) |
Health & Disability in Plum borough
Health Insurance Coverage by Age in Plum borough
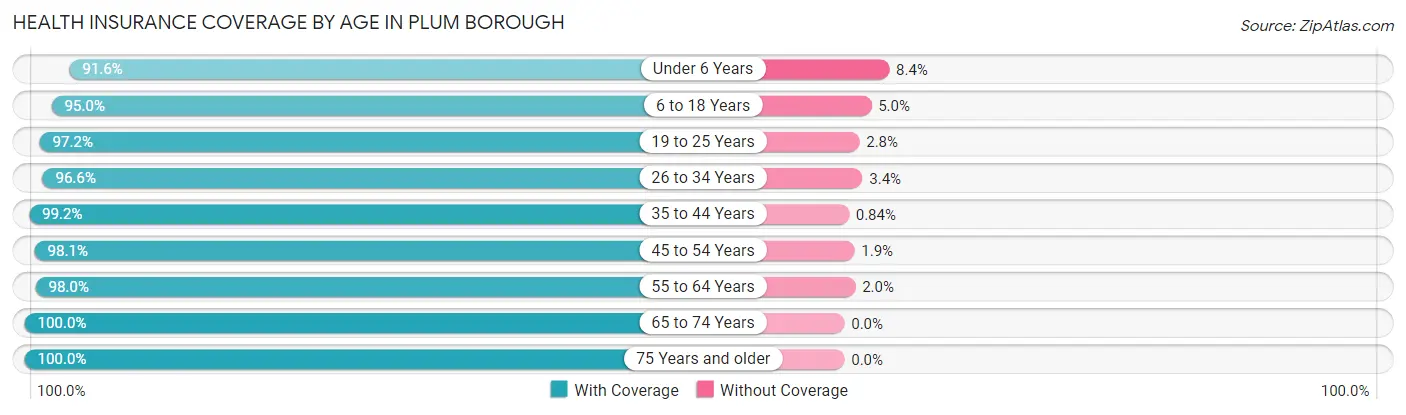
| Age Bracket | With Coverage | Without Coverage |
| Under 6 Years | 1,733 (91.6%) | 158 (8.4%) |
| 6 to 18 Years | 4,033 (95.0%) | 213 (5.0%) |
| 19 to 25 Years | 1,531 (97.2%) | 44 (2.8%) |
| 26 to 34 Years | 2,676 (96.6%) | 93 (3.4%) |
| 35 to 44 Years | 3,315 (99.2%) | 28 (0.8%) |
| 45 to 54 Years | 3,445 (98.1%) | 66 (1.9%) |
| 55 to 64 Years | 3,932 (98.0%) | 82 (2.0%) |
| 65 to 74 Years | 2,885 (100.0%) | 0 (0.0%) |
| 75 Years and older | 2,631 (100.0%) | 0 (0.0%) |
| Total | 26,181 (97.5%) | 684 (2.5%) |
Health Insurance Coverage by Citizenship Status in Plum borough
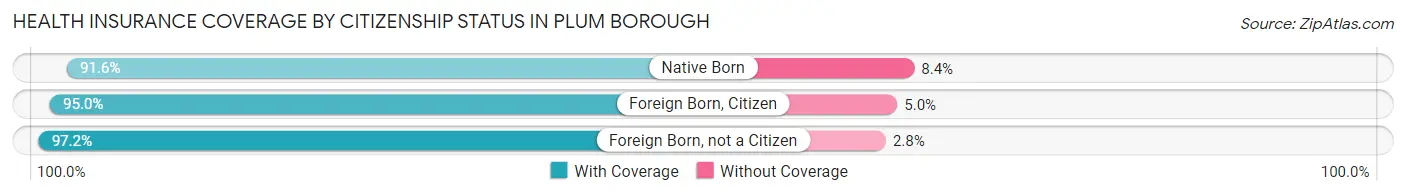
| Citizenship Status | With Coverage | Without Coverage |
| Native Born | 1,733 (91.6%) | 158 (8.4%) |
| Foreign Born, Citizen | 4,033 (95.0%) | 213 (5.0%) |
| Foreign Born, not a Citizen | 1,531 (97.2%) | 44 (2.8%) |
Health Insurance Coverage by Household Income in Plum borough
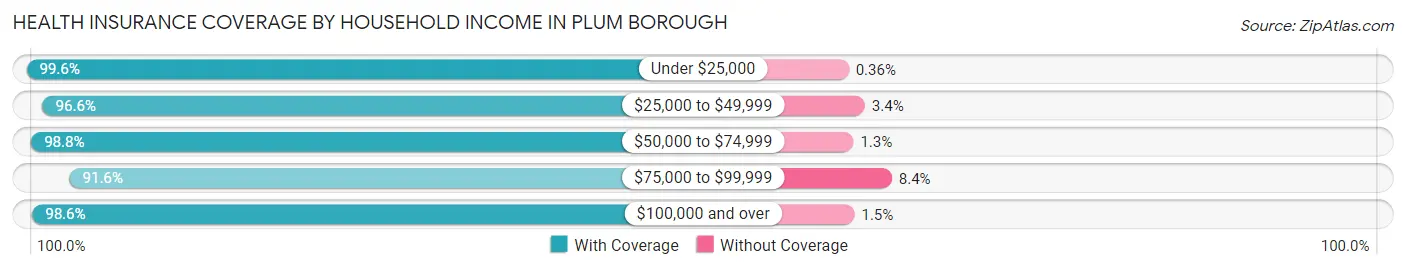
| Household Income | With Coverage | Without Coverage |
| Under $25,000 | 1,370 (99.6%) | 5 (0.4%) |
| $25,000 to $49,999 | 2,336 (96.6%) | 82 (3.4%) |
| $50,000 to $74,999 | 3,315 (98.8%) | 42 (1.3%) |
| $75,000 to $99,999 | 3,524 (91.6%) | 325 (8.4%) |
| $100,000 and over | 15,628 (98.6%) | 230 (1.5%) |
Public vs Private Health Insurance Coverage by Age in Plum borough
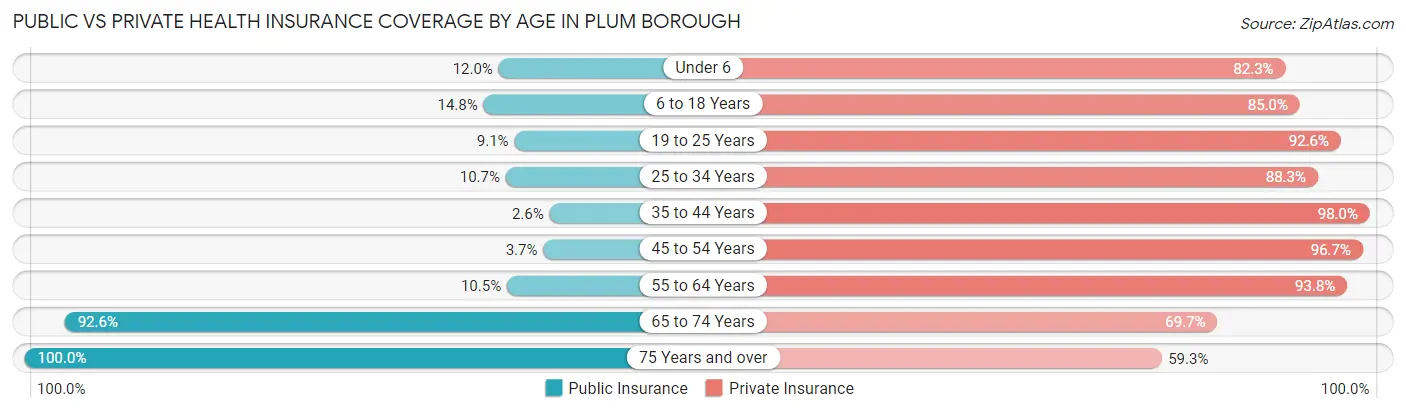
| Age Bracket | Public Insurance | Private Insurance |
| Under 6 | 227 (12.0%) | 1,557 (82.3%) |
| 6 to 18 Years | 629 (14.8%) | 3,610 (85.0%) |
| 19 to 25 Years | 143 (9.1%) | 1,459 (92.6%) |
| 25 to 34 Years | 296 (10.7%) | 2,446 (88.3%) |
| 35 to 44 Years | 86 (2.6%) | 3,276 (98.0%) |
| 45 to 54 Years | 131 (3.7%) | 3,395 (96.7%) |
| 55 to 64 Years | 420 (10.5%) | 3,765 (93.8%) |
| 65 to 74 Years | 2,670 (92.5%) | 2,011 (69.7%) |
| 75 Years and over | 2,631 (100.0%) | 1,560 (59.3%) |
| Total | 7,233 (26.9%) | 23,079 (85.9%) |
Disability Status by Sex by Age in Plum borough
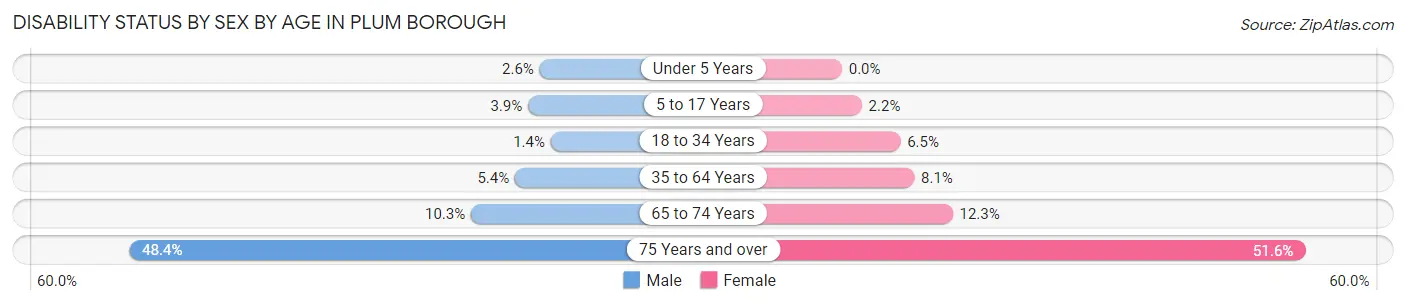
| Age Bracket | Male | Female |
| Under 5 Years | 19 (2.6%) | 0 (0.0%) |
| 5 to 17 Years | 93 (3.9%) | 45 (2.2%) |
| 18 to 34 Years | 33 (1.4%) | 147 (6.5%) |
| 35 to 64 Years | 299 (5.4%) | 427 (8.1%) |
| 65 to 74 Years | 139 (10.3%) | 189 (12.3%) |
| 75 Years and over | 501 (48.4%) | 823 (51.6%) |
Disability Class by Sex by Age in Plum borough
Disability Class: Hearing Difficulty
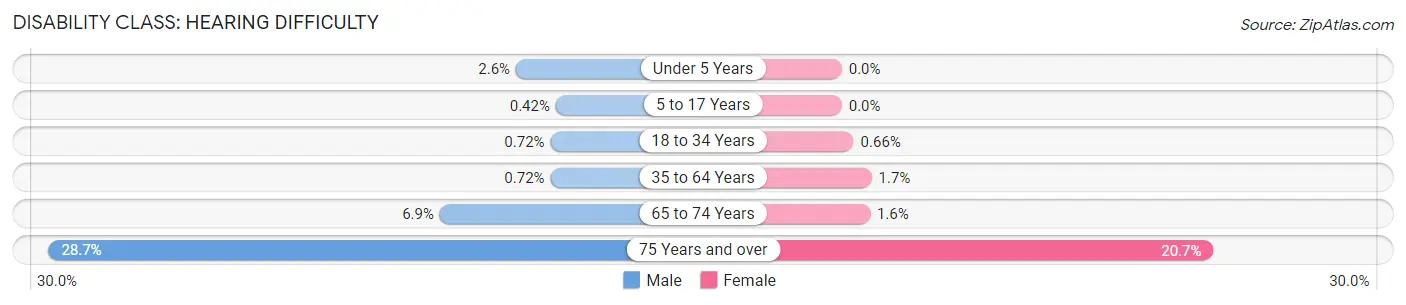
| Age Bracket | Male | Female |
| Under 5 Years | 19 (2.6%) | 0 (0.0%) |
| 5 to 17 Years | 10 (0.4%) | 0 (0.0%) |
| 18 to 34 Years | 17 (0.7%) | 15 (0.7%) |
| 35 to 64 Years | 40 (0.7%) | 88 (1.7%) |
| 65 to 74 Years | 93 (6.9%) | 24 (1.6%) |
| 75 Years and over | 297 (28.7%) | 330 (20.7%) |
Disability Class: Vision Difficulty
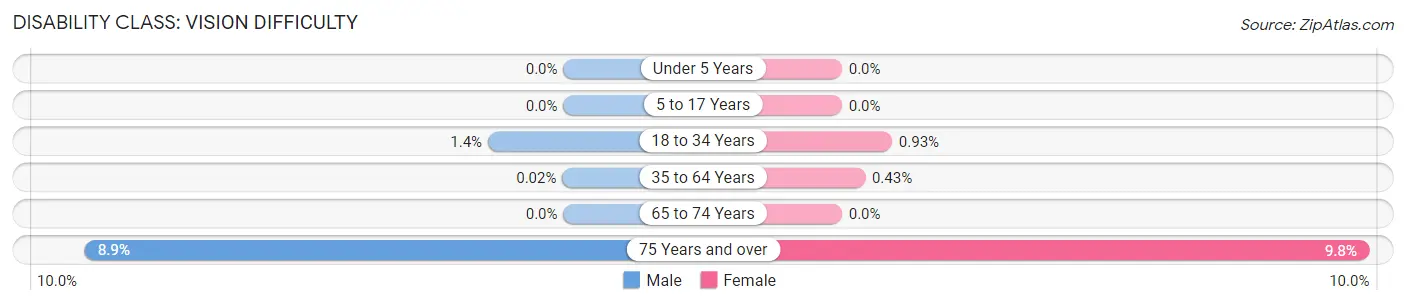
| Age Bracket | Male | Female |
| Under 5 Years | 0 (0.0%) | 0 (0.0%) |
| 5 to 17 Years | 0 (0.0%) | 0 (0.0%) |
| 18 to 34 Years | 33 (1.4%) | 21 (0.9%) |
| 35 to 64 Years | 1 (0.0%) | 23 (0.4%) |
| 65 to 74 Years | 0 (0.0%) | 0 (0.0%) |
| 75 Years and over | 92 (8.9%) | 156 (9.8%) |
Disability Class: Cognitive Difficulty
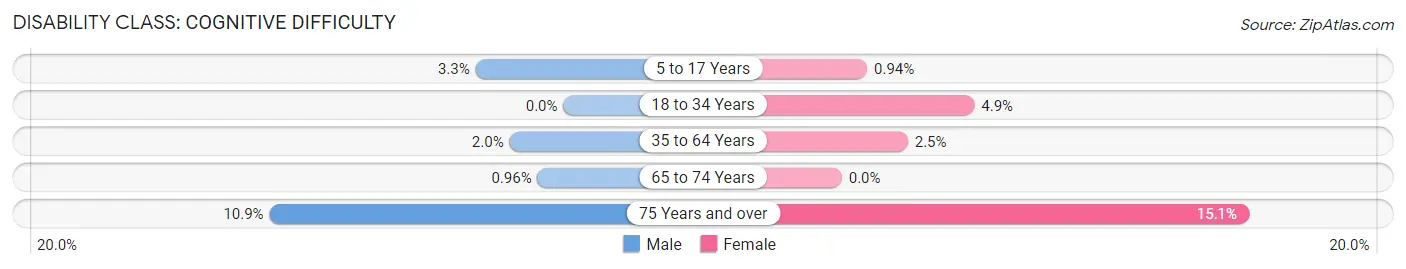
| Age Bracket | Male | Female |
| 5 to 17 Years | 77 (3.3%) | 19 (0.9%) |
| 18 to 34 Years | 0 (0.0%) | 111 (4.9%) |
| 35 to 64 Years | 111 (2.0%) | 130 (2.5%) |
| 65 to 74 Years | 13 (1.0%) | 0 (0.0%) |
| 75 Years and over | 113 (10.9%) | 241 (15.1%) |
Disability Class: Ambulatory Difficulty
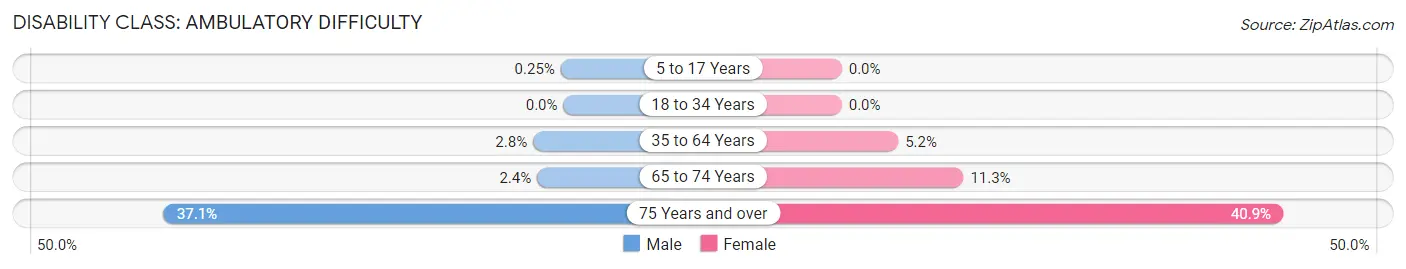
| Age Bracket | Male | Female |
| 5 to 17 Years | 6 (0.3%) | 0 (0.0%) |
| 18 to 34 Years | 0 (0.0%) | 0 (0.0%) |
| 35 to 64 Years | 157 (2.8%) | 278 (5.2%) |
| 65 to 74 Years | 33 (2.4%) | 173 (11.3%) |
| 75 Years and over | 384 (37.1%) | 653 (40.9%) |
Disability Class: Self-Care Difficulty
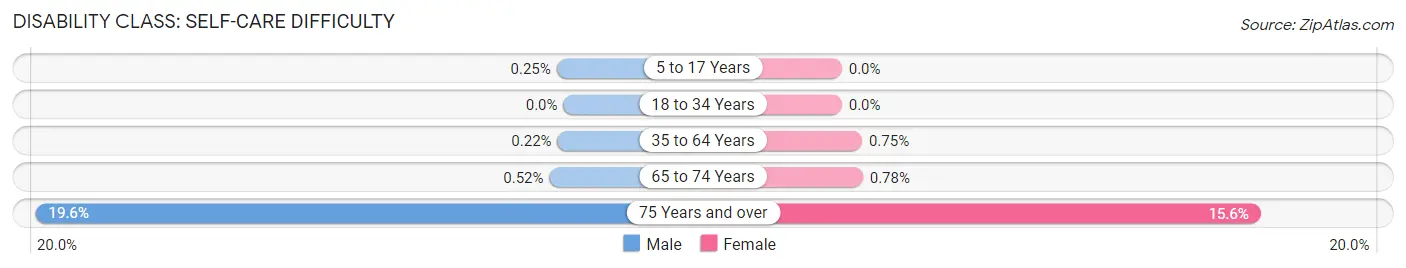
| Age Bracket | Male | Female |
| 5 to 17 Years | 6 (0.3%) | 0 (0.0%) |
| 18 to 34 Years | 0 (0.0%) | 0 (0.0%) |
| 35 to 64 Years | 12 (0.2%) | 40 (0.7%) |
| 65 to 74 Years | 7 (0.5%) | 12 (0.8%) |
| 75 Years and over | 203 (19.6%) | 248 (15.5%) |
Technology Access in Plum borough
Computing Device Access in Plum borough
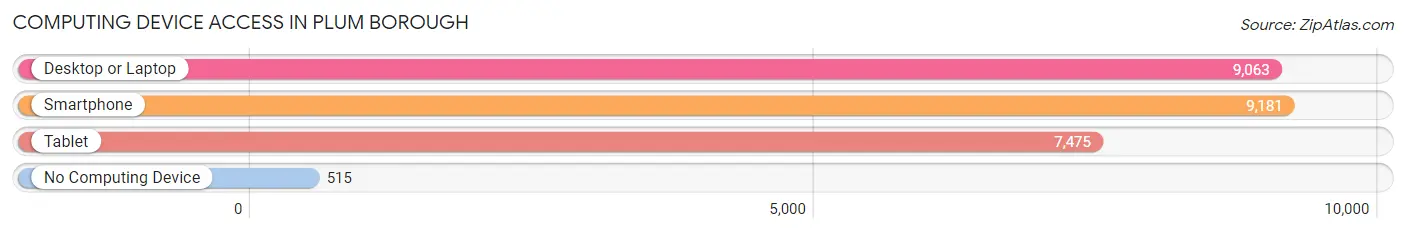
| Device Type | # Households | % Households |
| Desktop or Laptop | 9,063 | 84.5% |
| Smartphone | 9,181 | 85.6% |
| Tablet | 7,475 | 69.7% |
| No Computing Device | 515 | 4.8% |
| Total | 10,727 | 100.0% |
Internet Access in Plum borough
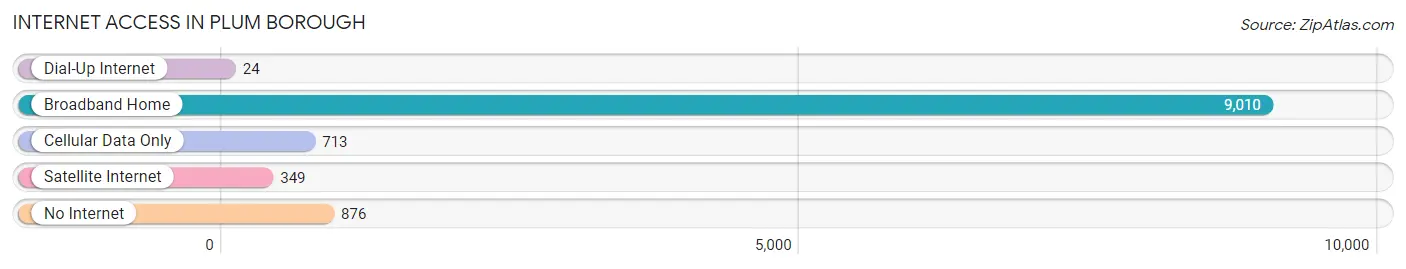
| Internet Type | # Households | % Households |
| Dial-Up Internet | 24 | 0.2% |
| Broadband Home | 9,010 | 84.0% |
| Cellular Data Only | 713 | 6.7% |
| Satellite Internet | 349 | 3.3% |
| No Internet | 876 | 8.2% |
| Total | 10,727 | 100.0% |
Plum borough Summary
Plum Borough is a borough located in Allegheny County, Pennsylvania, United States. It is a suburb of Pittsburgh, located about 12 miles east of the city. The population was 27,126 at the 2010 census.
History
Plum Borough was first settled in 1788 by John and Mary Plum, who were among the first settlers in the area. The borough was officially incorporated in 1876. The borough was named after the Plum family, who were among the first settlers in the area.
Geography
Plum Borough is located at 40°31'17" North, 79°45'17" West (40.5214, -79.7548). According to the United States Census Bureau, the borough has a total area of 8.2 square miles, all of it land.
Economy
Plum Borough is home to a variety of businesses, including manufacturing, retail, and service industries. The borough is also home to several large employers, including UPMC, Allegheny Health Network, and the University of Pittsburgh Medical Center.
Demographics
As of the 2010 census, there were 27,126 people, 10,845 households, and 7,717 families residing in the borough. The population density was 3,303.3 people per square mile. The racial makeup of the borough was 94.2% White, 2.3% African American, 0.2% Native American, 1.7% Asian, 0.1% Pacific Islander, 0.5% from other races, and 1.1% from two or more races. Hispanic or Latino of any race were 1.7% of the population.
The median income for a household in the borough was $60,945, and the median income for a family was $71,945. The per capita income for the borough was $27,945. About 3.2% of families and 4.3% of the population were below the poverty line, including 5.2% of those under age 18 and 4.2% of those age 65 or over.
Conclusion
Plum Borough is a borough located in Allegheny County, Pennsylvania, United States. It is a suburb of Pittsburgh, located about 12 miles east of the city. The population was 27,126 at the 2010 census. The borough was first settled in 1788 by John and Mary Plum, and was officially incorporated in 1876. Plum Borough is home to a variety of businesses, including manufacturing, retail, and service industries. The median income for a household in the borough was $60,945, and the median income for a family was $71,945. The racial makeup of the borough was 94.2% White, 2.3% African American, 0.2% Native American, 1.7% Asian, 0.1% Pacific Islander, 0.5% from other races, and 1.1% from two or more races. Plum Borough is a vibrant community with a rich history and a bright future.
Common Questions
What is Per Capita Income in Plum borough?
Per Capita income in Plum borough is $44,464.
What is the Median Family Income in Plum borough?
Median Family Income in Plum borough is $112,331.
What is the Median Household income in Plum borough?
Median Household Income in Plum borough is $91,931.
What is Income or Wage Gap in Plum borough?
Income or Wage Gap in Plum borough is 28.3%.
Women in Plum borough earn 71.7 cents for every dollar earned by a man.
What is Inequality or Gini Index in Plum borough?
Inequality or Gini Index in Plum borough is 0.38.
What is the Total Population of Plum borough?
Total Population of Plum borough is 27,032.
What is the Total Male Population of Plum borough?
Total Male Population of Plum borough is 13,486.
What is the Total Female Population of Plum borough?
Total Female Population of Plum borough is 13,546.
What is the Ratio of Males per 100 Females in Plum borough?
There are 99.56 Males per 100 Females in Plum borough.
What is the Ratio of Females per 100 Males in Plum borough?
There are 100.44 Females per 100 Males in Plum borough.
What is the Median Population Age in Plum borough?
Median Population Age in Plum borough is 43.9 Years.
What is the Average Family Size in Plum borough
Average Family Size in Plum borough is 3.0 People.
What is the Average Household Size in Plum borough
Average Household Size in Plum borough is 2.5 People.
How Large is the Labor Force in Plum borough?
There are 14,736 People in the Labor Forcein in Plum borough.
What is the Percentage of People in the Labor Force in Plum borough?
67.3% of People are in the Labor Force in Plum borough.
What is the Unemployment Rate in Plum borough?
Unemployment Rate in Plum borough is 2.1%.