Trumbauersville borough, PA Map & Demographics
Trumbauersville borough Overview
$53,403
PER CAPITA INCOME
$123,750
AVG FAMILY INCOME
$88,646
AVG HOUSEHOLD INCOME
38.0%
WAGE / INCOME GAP [ % ]
62.0¢/ $1
WAGE / INCOME GAP [ $ ]
0.38
INEQUALITY / GINI INDEX
924
TOTAL POPULATION
498
MALE POPULATION
426
FEMALE POPULATION
116.90
MALES / 100 FEMALES
85.54
FEMALES / 100 MALES
44.9
MEDIAN AGE
2.7
AVG FAMILY SIZE
2.2
AVG HOUSEHOLD SIZE
587
LABOR FORCE [ PEOPLE ]
71.2%
PERCENT IN LABOR FORCE
2.4%
UNEMPLOYMENT RATE
Income in Trumbauersville borough
Income Overview in Trumbauersville borough
Per Capita Income in Trumbauersville borough is $53,403, while median incomes of families and households are $123,750 and $88,646 respectively.
| Characteristic | Number | Measure |
| Per Capita Income | 924 | $53,403 |
| Median Family Income | 271 | $123,750 |
| Mean Family Income | 271 | $138,976 |
| Median Household Income | 417 | $88,646 |
| Mean Household Income | 417 | $115,814 |
| Income Deficit | 271 | $0 |
| Wage / Income Gap (%) | 924 | 38.05% |
| Wage / Income Gap ($) | 924 | 61.95¢ per $1 |
| Gini / Inequality Index | 924 | 0.38 |
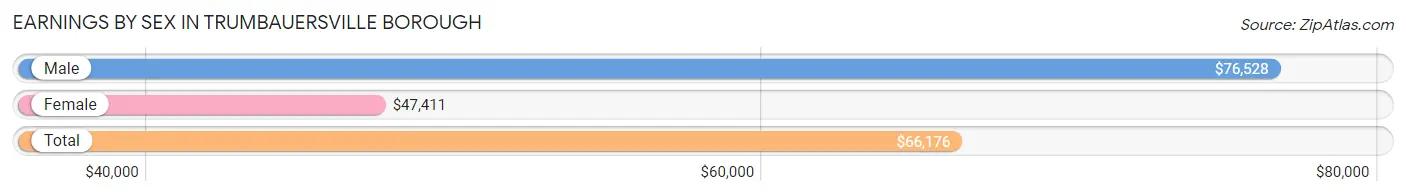
Earnings by Sex in Trumbauersville borough
Average Earnings in Trumbauersville borough are $66,176, $76,528 for men and $47,411 for women, a difference of 38.1%.
| Sex | Number | Average Earnings |
| Male | 329 (54.6%) | $76,528 |
| Female | 273 (45.4%) | $47,411 |
| Total | 602 (100.0%) | $66,176 |
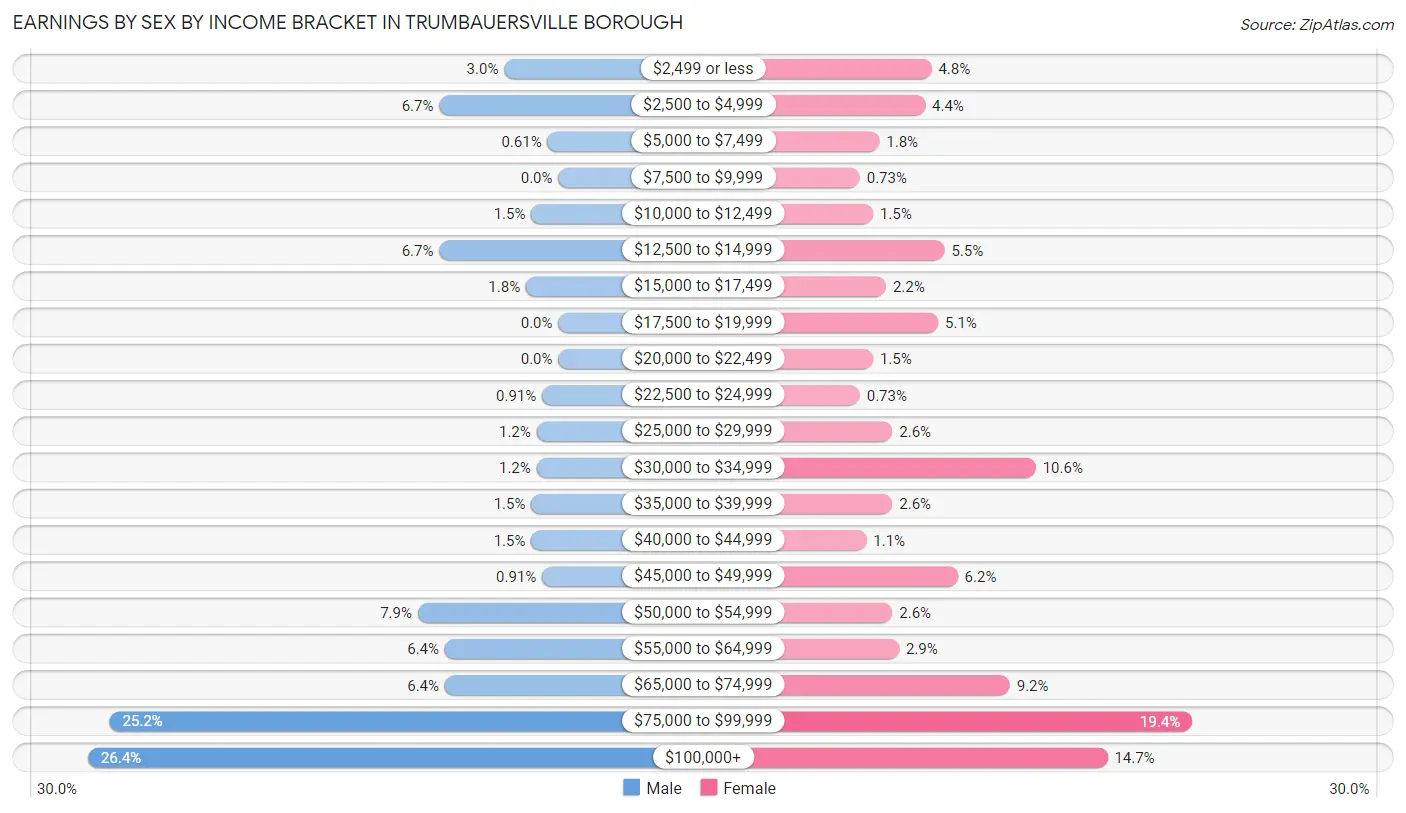
Earnings by Sex by Income Bracket in Trumbauersville borough
The most common earnings brackets in Trumbauersville borough are $100,000+ for men (87 | 26.4%) and $75,000 to $99,999 for women (53 | 19.4%).
| Income | Male | Female |
| $2,499 or less | 10 (3.0%) | 13 (4.8%) |
| $2,500 to $4,999 | 22 (6.7%) | 12 (4.4%) |
| $5,000 to $7,499 | 2 (0.6%) | 5 (1.8%) |
| $7,500 to $9,999 | 0 (0.0%) | 2 (0.7%) |
| $10,000 to $12,499 | 5 (1.5%) | 4 (1.5%) |
| $12,500 to $14,999 | 22 (6.7%) | 15 (5.5%) |
| $15,000 to $17,499 | 6 (1.8%) | 6 (2.2%) |
| $17,500 to $19,999 | 0 (0.0%) | 14 (5.1%) |
| $20,000 to $22,499 | 0 (0.0%) | 4 (1.5%) |
| $22,500 to $24,999 | 3 (0.9%) | 2 (0.7%) |
| $25,000 to $29,999 | 4 (1.2%) | 7 (2.6%) |
| $30,000 to $34,999 | 4 (1.2%) | 29 (10.6%) |
| $35,000 to $39,999 | 5 (1.5%) | 7 (2.6%) |
| $40,000 to $44,999 | 5 (1.5%) | 3 (1.1%) |
| $45,000 to $49,999 | 3 (0.9%) | 17 (6.2%) |
| $50,000 to $54,999 | 26 (7.9%) | 7 (2.6%) |
| $55,000 to $64,999 | 21 (6.4%) | 8 (2.9%) |
| $65,000 to $74,999 | 21 (6.4%) | 25 (9.2%) |
| $75,000 to $99,999 | 83 (25.2%) | 53 (19.4%) |
| $100,000+ | 87 (26.4%) | 40 (14.6%) |
| Total | 329 (100.0%) | 273 (100.0%) |
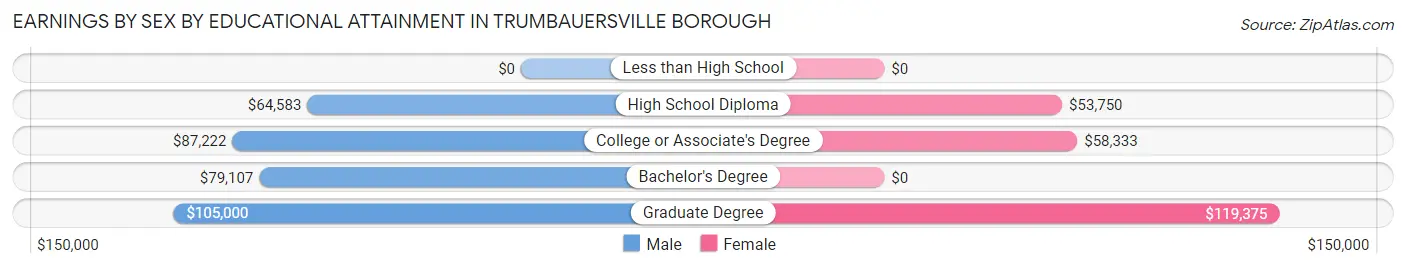
Earnings by Sex by Educational Attainment in Trumbauersville borough
Average earnings in Trumbauersville borough are $80,179 for men and $54,643 for women, a difference of 31.9%. Men with an educational attainment of graduate degree enjoy the highest average annual earnings of $105,000, while those with high school diploma education earn the least with $64,583. Women with an educational attainment of graduate degree earn the most with the average annual earnings of $119,375, while those with high school diploma education have the smallest earnings of $53,750.
| Educational Attainment | Male Income | Female Income |
| Less than High School | - | - |
| High School Diploma | $64,583 | $53,750 |
| College or Associate's Degree | $87,222 | $58,333 |
| Bachelor's Degree | $79,107 | $0 |
| Graduate Degree | $105,000 | $119,375 |
| Total | $80,179 | $54,643 |
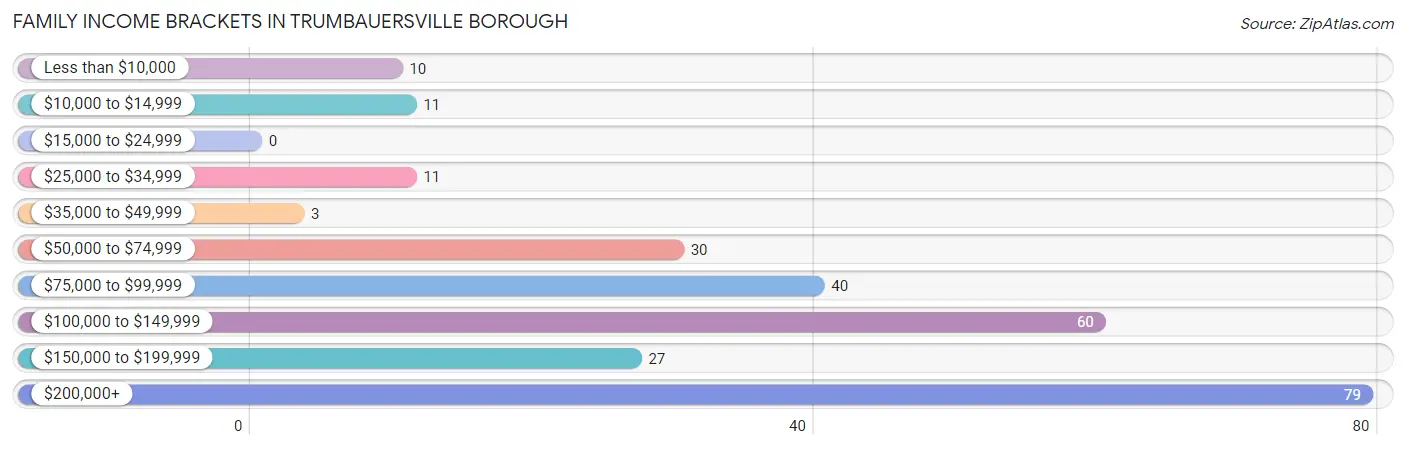
Family Income in Trumbauersville borough
Family Income Brackets in Trumbauersville borough
According to the Trumbauersville borough family income data, there are 79 families falling into the $200,000+ income range, which is the most common income bracket and makes up 29.1% of all families.
| Income Bracket | # Families | % Families |
| Less than $10,000 | 10 | 3.7% |
| $10,000 to $14,999 | 11 | 4.1% |
| $15,000 to $24,999 | 0 | 0.0% |
| $25,000 to $34,999 | 11 | 4.1% |
| $35,000 to $49,999 | 3 | 1.1% |
| $50,000 to $74,999 | 30 | 11.1% |
| $75,000 to $99,999 | 40 | 14.8% |
| $100,000 to $149,999 | 60 | 22.1% |
| $150,000 to $199,999 | 27 | 10.0% |
| $200,000+ | 79 | 29.2% |
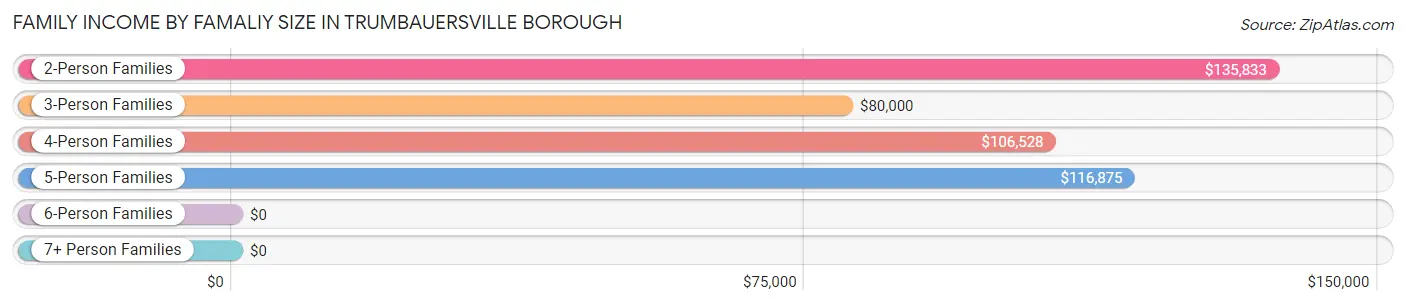
Family Income by Famaliy Size in Trumbauersville borough
2-person families (174 | 64.2%) account for the highest median family income in Trumbauersville borough with $135,833 per family, while 2-person families (174 | 64.2%) have the highest median income of $67,916 per family member.
| Income Bracket | # Families | Median Income |
| 2-Person Families | 174 (64.2%) | $135,833 |
| 3-Person Families | 32 (11.8%) | $80,000 |
| 4-Person Families | 59 (21.8%) | $106,528 |
| 5-Person Families | 5 (1.8%) | $116,875 |
| 6-Person Families | 0 (0.0%) | $0 |
| 7+ Person Families | 1 (0.4%) | $0 |
| Total | 271 (100.0%) | $123,750 |
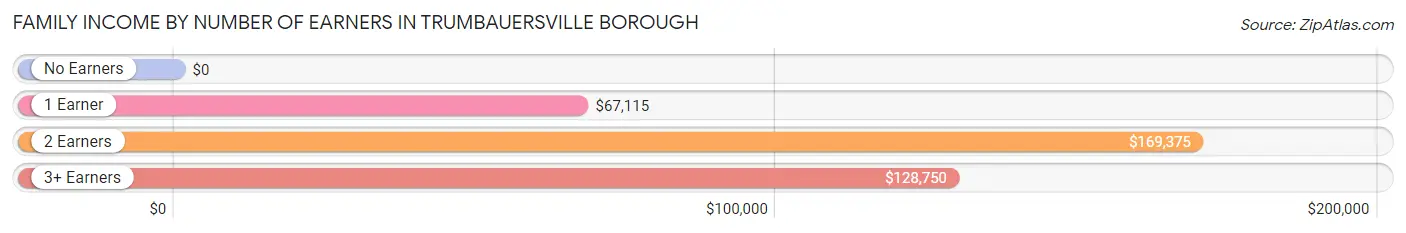
Family Income by Number of Earners in Trumbauersville borough
| Number of Earners | # Families | Median Income |
| No Earners | 28 (10.3%) | $0 |
| 1 Earner | 60 (22.1%) | $67,115 |
| 2 Earners | 147 (54.2%) | $169,375 |
| 3+ Earners | 36 (13.3%) | $128,750 |
| Total | 271 (100.0%) | $123,750 |
Household Income in Trumbauersville borough
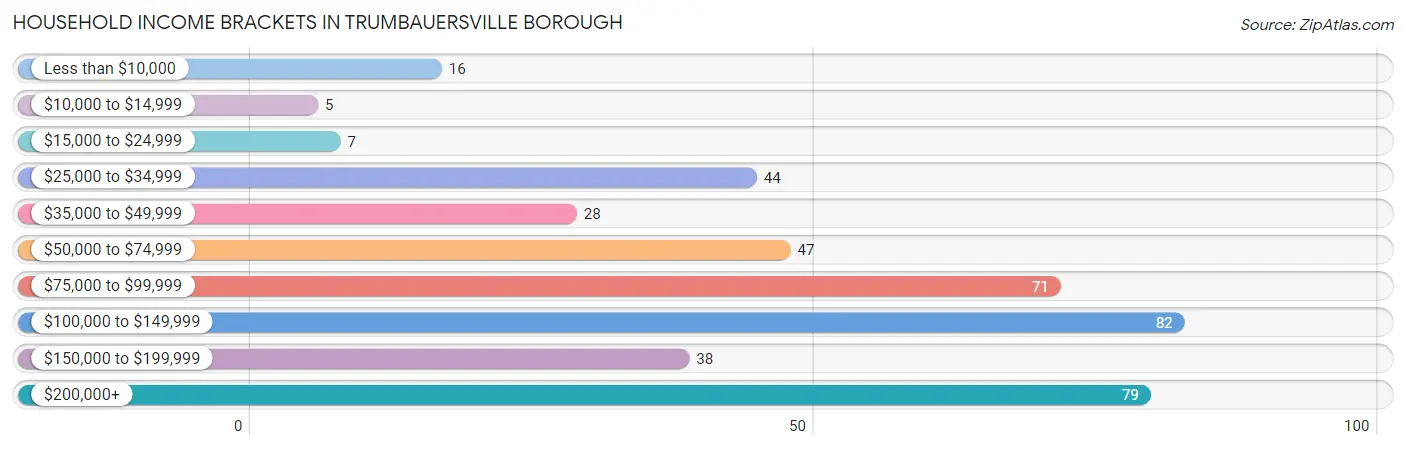
Household Income Brackets in Trumbauersville borough
With 82 households falling in the category, the $100,000 to $149,999 income range is the most frequent in Trumbauersville borough, accounting for 19.7% of all households. In contrast, only 5 households (1.2%) fall into the $10,000 to $14,999 income bracket, making it the least populous group.
| Income Bracket | # Households | % Households |
| Less than $10,000 | 16 | 3.8% |
| $10,000 to $14,999 | 5 | 1.2% |
| $15,000 to $24,999 | 7 | 1.7% |
| $25,000 to $34,999 | 44 | 10.6% |
| $35,000 to $49,999 | 28 | 6.7% |
| $50,000 to $74,999 | 47 | 11.3% |
| $75,000 to $99,999 | 71 | 17.0% |
| $100,000 to $149,999 | 82 | 19.7% |
| $150,000 to $199,999 | 38 | 9.1% |
| $200,000+ | 79 | 18.9% |
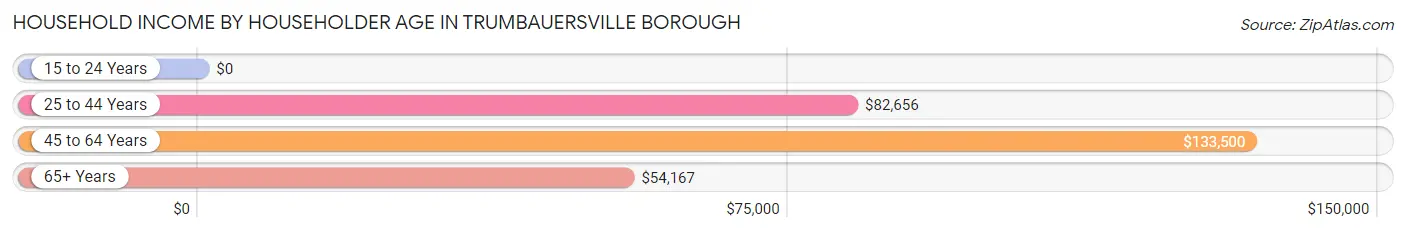
Household Income by Householder Age in Trumbauersville borough
The median household income in Trumbauersville borough is $88,646, with the highest median household income of $133,500 found in the 45 to 64 years age bracket for the primary householder. A total of 134 households (32.1%) fall into this category. Meanwhile, the 15 to 24 years age bracket for the primary householder has the lowest median household income of $0, with 10 households (2.4%) in this group.
| Income Bracket | # Households | Median Income |
| 15 to 24 Years | 10 (2.4%) | $0 |
| 25 to 44 Years | 149 (35.7%) | $82,656 |
| 45 to 64 Years | 134 (32.1%) | $133,500 |
| 65+ Years | 124 (29.7%) | $54,167 |
| Total | 417 (100.0%) | $88,646 |
Poverty in Trumbauersville borough
Income Below Poverty by Sex and Age in Trumbauersville borough
With 7.2% poverty level for males and 7.5% for females among the residents of Trumbauersville borough, 18 to 24 year old males and 18 to 24 year old females are the most vulnerable to poverty, with 13 males (28.9%) and 3 females (27.3%) in their respective age groups living below the poverty level.
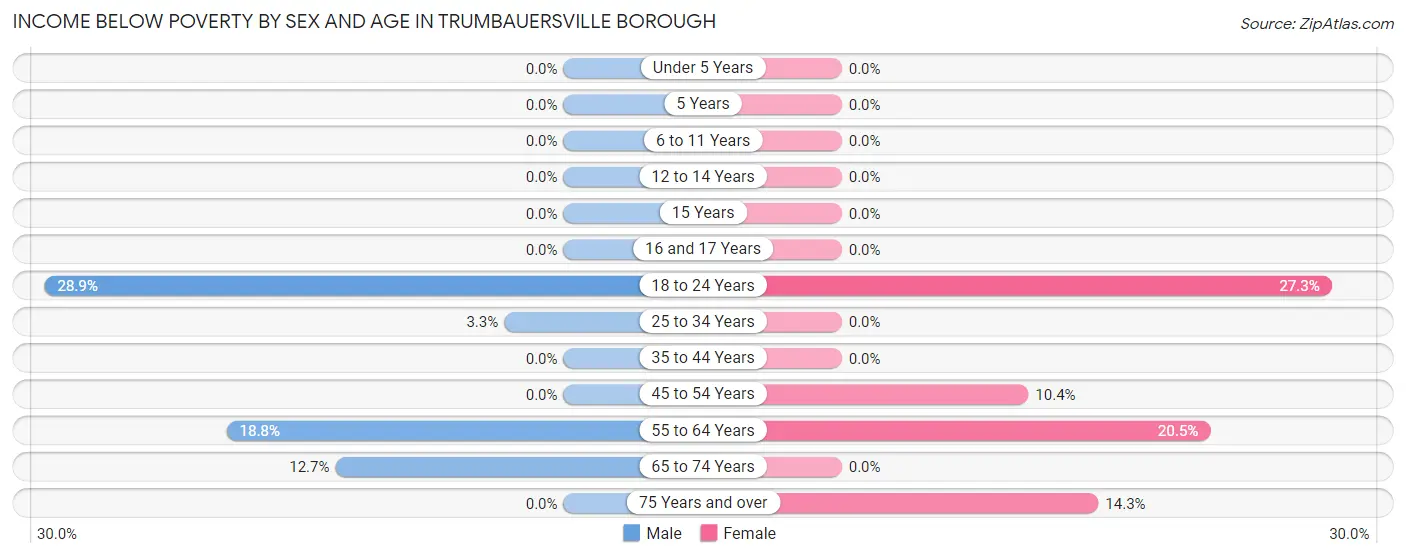
| Age Bracket | Male | Female |
| Under 5 Years | 0 (0.0%) | 0 (0.0%) |
| 5 Years | 0 (0.0%) | 0 (0.0%) |
| 6 to 11 Years | 0 (0.0%) | 0 (0.0%) |
| 12 to 14 Years | 0 (0.0%) | 0 (0.0%) |
| 15 Years | 0 (0.0%) | 0 (0.0%) |
| 16 and 17 Years | 0 (0.0%) | 0 (0.0%) |
| 18 to 24 Years | 13 (28.9%) | 3 (27.3%) |
| 25 to 34 Years | 3 (3.3%) | 0 (0.0%) |
| 35 to 44 Years | 0 (0.0%) | 0 (0.0%) |
| 45 to 54 Years | 0 (0.0%) | 8 (10.4%) |
| 55 to 64 Years | 12 (18.8%) | 16 (20.5%) |
| 65 to 74 Years | 8 (12.7%) | 0 (0.0%) |
| 75 Years and over | 0 (0.0%) | 5 (14.3%) |
| Total | 36 (7.2%) | 32 (7.5%) |
Income Above Poverty by Sex and Age in Trumbauersville borough
According to the poverty statistics in Trumbauersville borough, males aged under 5 years and females aged under 5 years are the age groups that are most secure financially, with 100.0% of males and 100.0% of females in these age groups living above the poverty line.
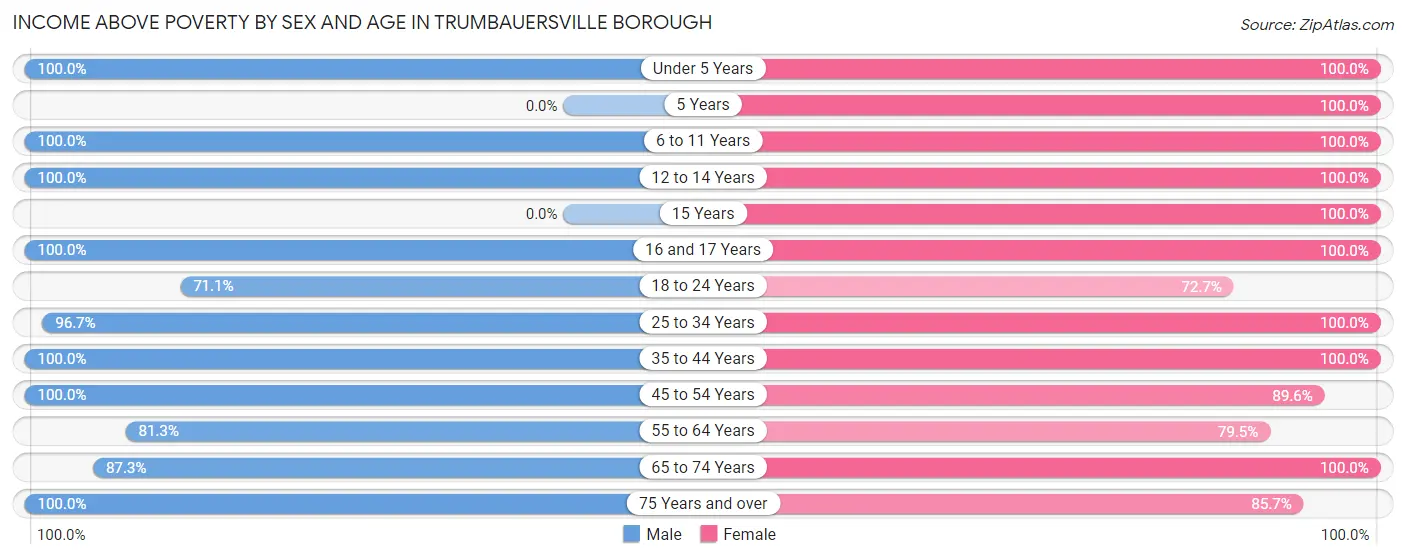
| Age Bracket | Male | Female |
| Under 5 Years | 8 (100.0%) | 23 (100.0%) |
| 5 Years | 0 (0.0%) | 3 (100.0%) |
| 6 to 11 Years | 36 (100.0%) | 14 (100.0%) |
| 12 to 14 Years | 8 (100.0%) | 5 (100.0%) |
| 15 Years | 0 (0.0%) | 2 (100.0%) |
| 16 and 17 Years | 15 (100.0%) | 18 (100.0%) |
| 18 to 24 Years | 32 (71.1%) | 8 (72.7%) |
| 25 to 34 Years | 88 (96.7%) | 63 (100.0%) |
| 35 to 44 Years | 73 (100.0%) | 50 (100.0%) |
| 45 to 54 Years | 71 (100.0%) | 69 (89.6%) |
| 55 to 64 Years | 52 (81.2%) | 62 (79.5%) |
| 65 to 74 Years | 55 (87.3%) | 47 (100.0%) |
| 75 Years and over | 24 (100.0%) | 30 (85.7%) |
| Total | 462 (92.8%) | 394 (92.5%) |
Income Below Poverty Among Married-Couple Families in Trumbauersville borough
The poverty statistics for married-couple families in Trumbauersville borough show that 3.8% or 8 of the total 213 families live below the poverty line. Families with no children have the highest poverty rate of 5.9%, comprising of 8 families. On the other hand, families with 1 or 2 children have the lowest poverty rate of 0.0%, which includes 0 families.
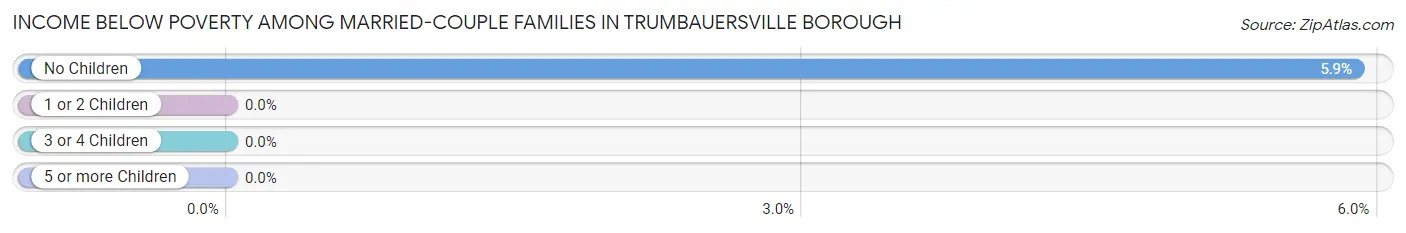
| Children | Above Poverty | Below Poverty |
| No Children | 128 (94.1%) | 8 (5.9%) |
| 1 or 2 Children | 73 (100.0%) | 0 (0.0%) |
| 3 or 4 Children | 4 (100.0%) | 0 (0.0%) |
| 5 or more Children | 0 (0.0%) | 0 (0.0%) |
| Total | 205 (96.2%) | 8 (3.8%) |
Income Below Poverty Among Single-Parent Households in Trumbauersville borough
According to the poverty data in Trumbauersville borough, 6.5% or 3 single-father households and 83.3% or 10 single-mother households are living below the poverty line. Among single-father households, those with no children have the highest poverty rate, with 3 households (6.5%) experiencing poverty. Likewise, among single-mother households, those with no children have the highest poverty rate, with 10 households (83.3%) falling below the poverty line.
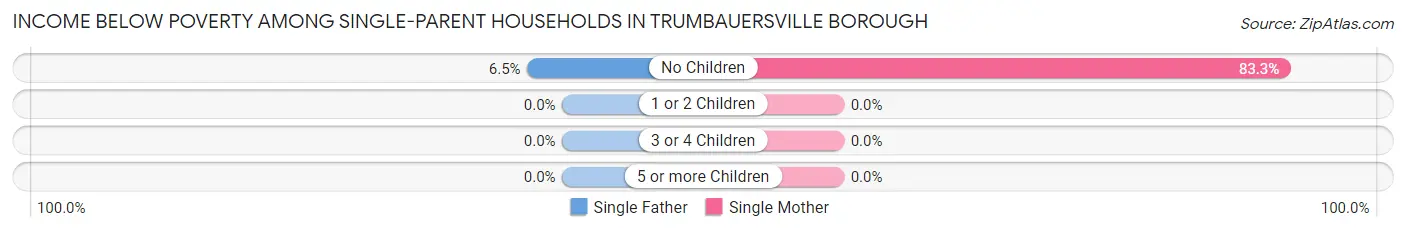
| Children | Single Father | Single Mother |
| No Children | 3 (6.5%) | 10 (83.3%) |
| 1 or 2 Children | 0 (0.0%) | 0 (0.0%) |
| 3 or 4 Children | 0 (0.0%) | 0 (0.0%) |
| 5 or more Children | 0 (0.0%) | 0 (0.0%) |
| Total | 3 (6.5%) | 10 (83.3%) |
Income Below Poverty Among Married-Couple vs Single-Parent Households in Trumbauersville borough
The poverty data for Trumbauersville borough shows that 8 of the married-couple family households (3.8%) and 13 of the single-parent households (22.4%) are living below the poverty level. Within the married-couple family households, those with no children have the highest poverty rate, with 8 households (5.9%) falling below the poverty line. Among the single-parent households, those with no children have the highest poverty rate, with 13 household (22.4%) living below poverty.
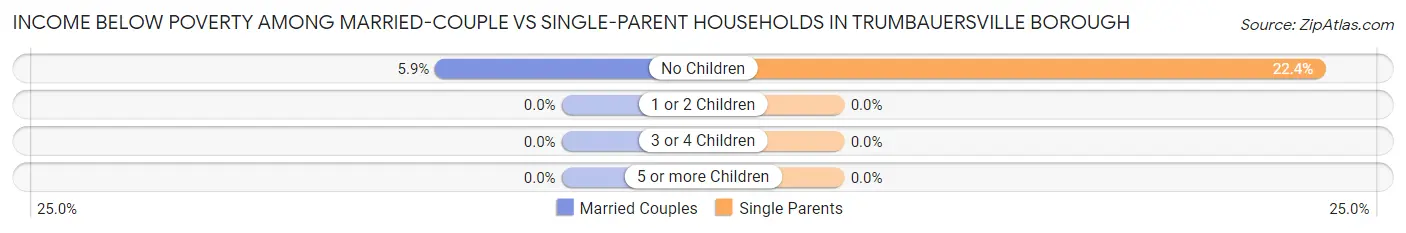
| Children | Married-Couple Families | Single-Parent Households |
| No Children | 8 (5.9%) | 13 (22.4%) |
| 1 or 2 Children | 0 (0.0%) | 0 (0.0%) |
| 3 or 4 Children | 0 (0.0%) | 0 (0.0%) |
| 5 or more Children | 0 (0.0%) | 0 (0.0%) |
| Total | 8 (3.8%) | 13 (22.4%) |
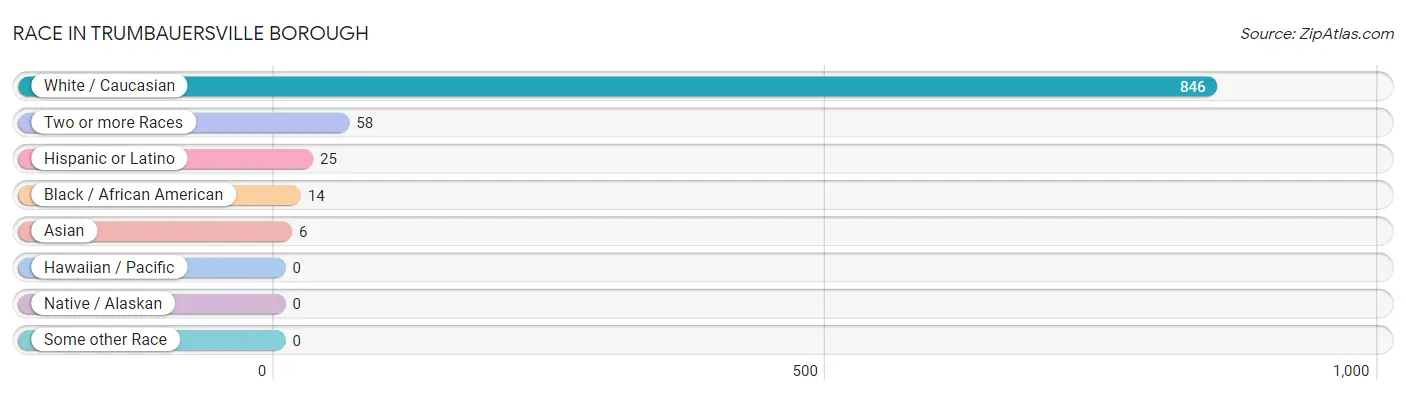
Race in Trumbauersville borough
The most populous races in Trumbauersville borough are White / Caucasian (846 | 91.6%), Two or more Races (58 | 6.3%), and Hispanic or Latino (25 | 2.7%).
| Race | # Population | % Population |
| Asian | 6 | 0.6% |
| Black / African American | 14 | 1.5% |
| Hawaiian / Pacific | 0 | 0.0% |
| Hispanic or Latino | 25 | 2.7% |
| Native / Alaskan | 0 | 0.0% |
| White / Caucasian | 846 | 91.6% |
| Two or more Races | 58 | 6.3% |
| Some other Race | 0 | 0.0% |
| Total | 924 | 100.0% |
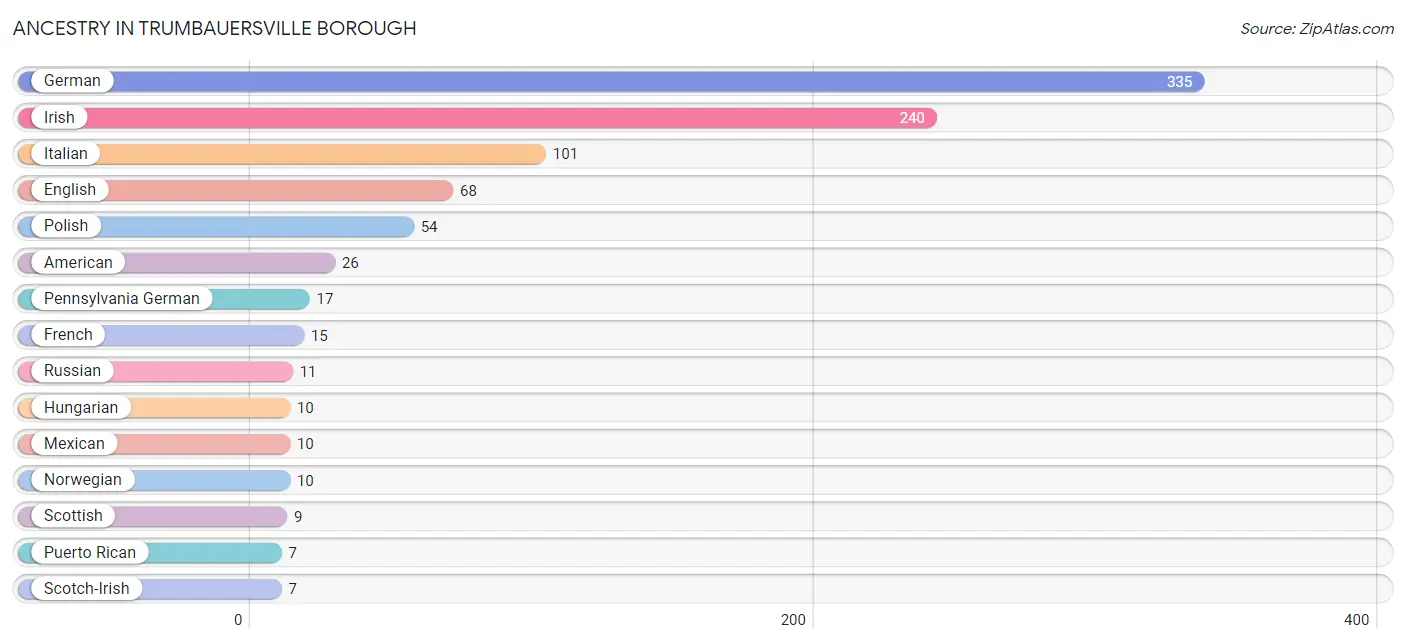
Ancestry in Trumbauersville borough
The most populous ancestries reported in Trumbauersville borough are German (335 | 36.3%), Irish (240 | 26.0%), Italian (101 | 10.9%), English (68 | 7.4%), and Polish (54 | 5.8%), together accounting for 86.4% of all Trumbauersville borough residents.
| Ancestry | # Population | % Population |
| American | 26 | 2.8% |
| Armenian | 4 | 0.4% |
| Australian | 6 | 0.6% |
| Burmese | 3 | 0.3% |
| Colombian | 4 | 0.4% |
| Czech | 5 | 0.5% |
| Czechoslovakian | 2 | 0.2% |
| Dutch | 3 | 0.3% |
| English | 68 | 7.4% |
| European | 6 | 0.6% |
| French | 15 | 1.6% |
| German | 335 | 36.3% |
| Hungarian | 10 | 1.1% |
| Irish | 240 | 26.0% |
| Italian | 101 | 10.9% |
| Lithuanian | 3 | 0.3% |
| Mexican | 10 | 1.1% |
| Mongolian | 3 | 0.3% |
| Norwegian | 10 | 1.1% |
| Pennsylvania German | 17 | 1.8% |
| Polish | 54 | 5.8% |
| Puerto Rican | 7 | 0.8% |
| Russian | 11 | 1.2% |
| Scotch-Irish | 7 | 0.8% |
| Scottish | 9 | 1.0% |
| Slovak | 3 | 0.3% |
| South American | 4 | 0.4% |
| Spaniard | 4 | 0.4% |
| Swedish | 6 | 0.6% |
| Ukrainian | 6 | 0.6% |
| Welsh | 3 | 0.3% | View All 31 Rows |
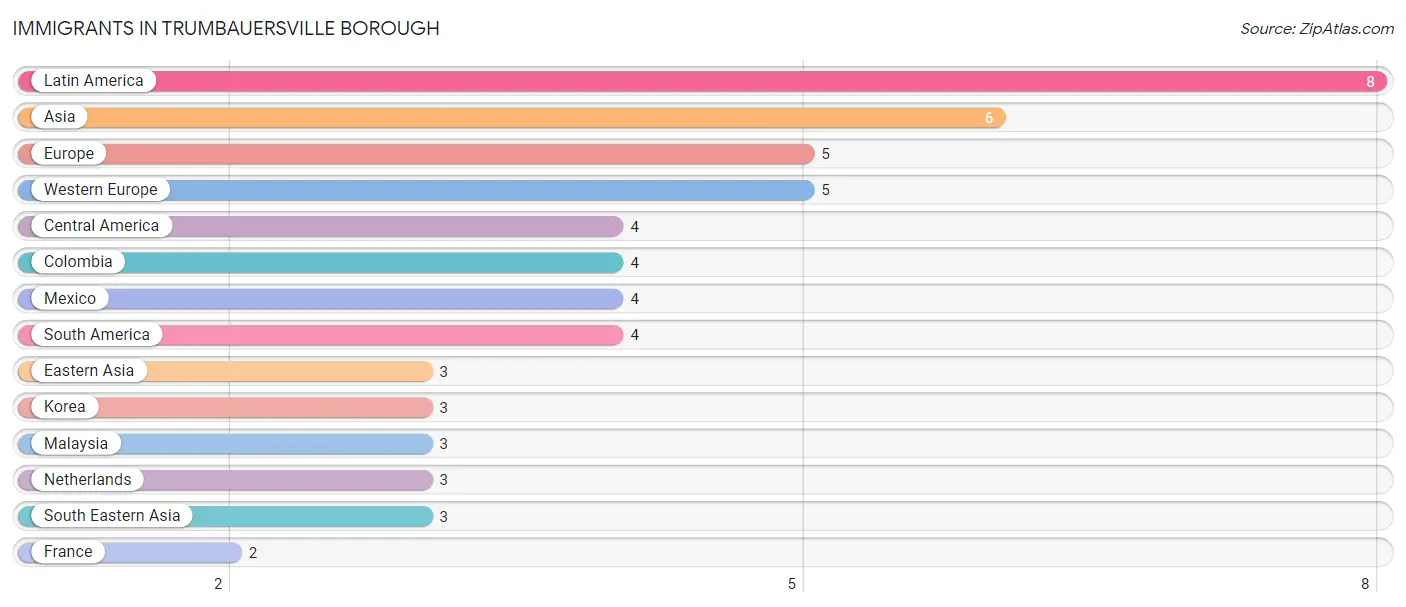
Immigrants in Trumbauersville borough
The most numerous immigrant groups reported in Trumbauersville borough came from Latin America (8 | 0.9%), Asia (6 | 0.6%), Europe (5 | 0.5%), Western Europe (5 | 0.5%), and Central America (4 | 0.4%), together accounting for 3.0% of all Trumbauersville borough residents.
| Immigration Origin | # Population | % Population |
| Asia | 6 | 0.6% |
| Central America | 4 | 0.4% |
| Colombia | 4 | 0.4% |
| Eastern Asia | 3 | 0.3% |
| Europe | 5 | 0.5% |
| France | 2 | 0.2% |
| Korea | 3 | 0.3% |
| Latin America | 8 | 0.9% |
| Malaysia | 3 | 0.3% |
| Mexico | 4 | 0.4% |
| Netherlands | 3 | 0.3% |
| South America | 4 | 0.4% |
| South Eastern Asia | 3 | 0.3% |
| Western Europe | 5 | 0.5% | View All 14 Rows |
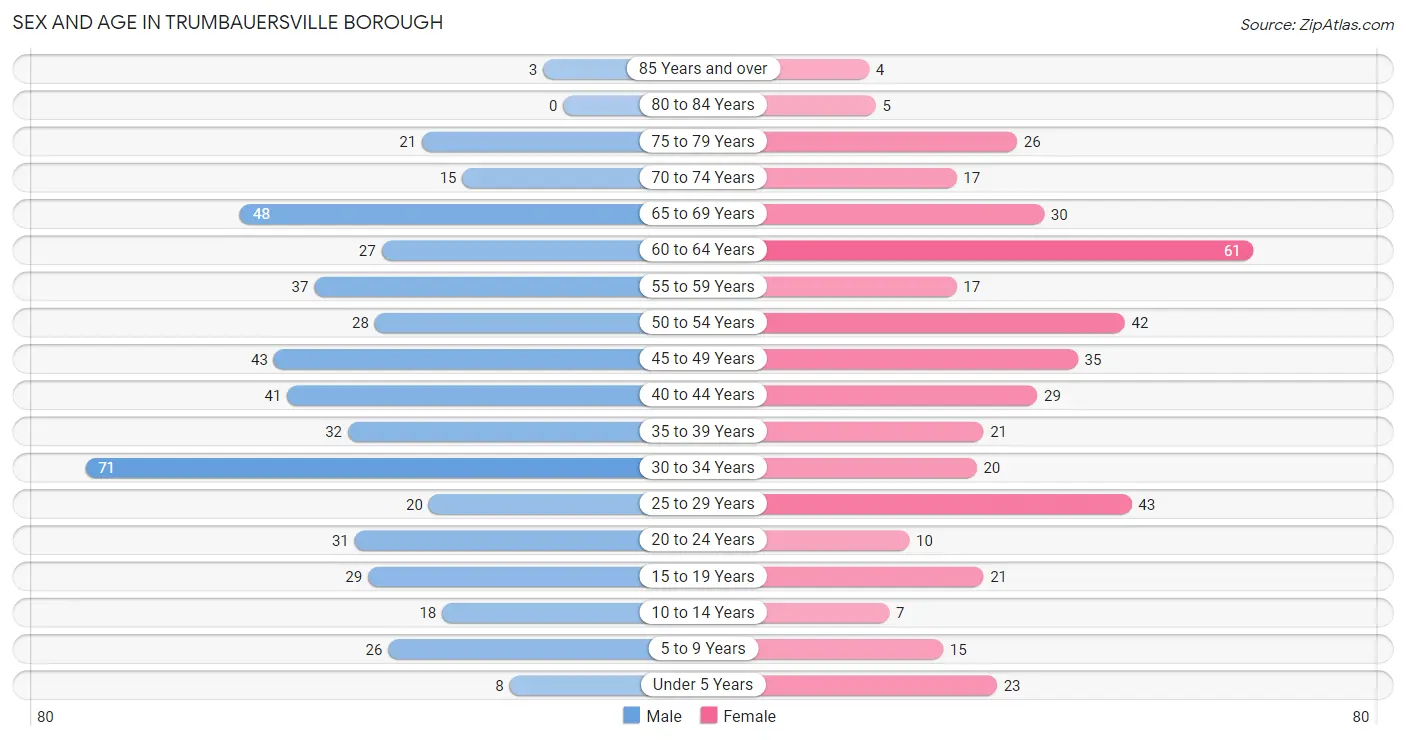
Sex and Age in Trumbauersville borough
Sex and Age in Trumbauersville borough
The most populous age groups in Trumbauersville borough are 30 to 34 Years (71 | 14.3%) for men and 60 to 64 Years (61 | 14.3%) for women.
| Age Bracket | Male | Female |
| Under 5 Years | 8 (1.6%) | 23 (5.4%) |
| 5 to 9 Years | 26 (5.2%) | 15 (3.5%) |
| 10 to 14 Years | 18 (3.6%) | 7 (1.6%) |
| 15 to 19 Years | 29 (5.8%) | 21 (4.9%) |
| 20 to 24 Years | 31 (6.2%) | 10 (2.4%) |
| 25 to 29 Years | 20 (4.0%) | 43 (10.1%) |
| 30 to 34 Years | 71 (14.3%) | 20 (4.7%) |
| 35 to 39 Years | 32 (6.4%) | 21 (4.9%) |
| 40 to 44 Years | 41 (8.2%) | 29 (6.8%) |
| 45 to 49 Years | 43 (8.6%) | 35 (8.2%) |
| 50 to 54 Years | 28 (5.6%) | 42 (9.9%) |
| 55 to 59 Years | 37 (7.4%) | 17 (4.0%) |
| 60 to 64 Years | 27 (5.4%) | 61 (14.3%) |
| 65 to 69 Years | 48 (9.6%) | 30 (7.0%) |
| 70 to 74 Years | 15 (3.0%) | 17 (4.0%) |
| 75 to 79 Years | 21 (4.2%) | 26 (6.1%) |
| 80 to 84 Years | 0 (0.0%) | 5 (1.2%) |
| 85 Years and over | 3 (0.6%) | 4 (0.9%) |
| Total | 498 (100.0%) | 426 (100.0%) |
Families and Households in Trumbauersville borough
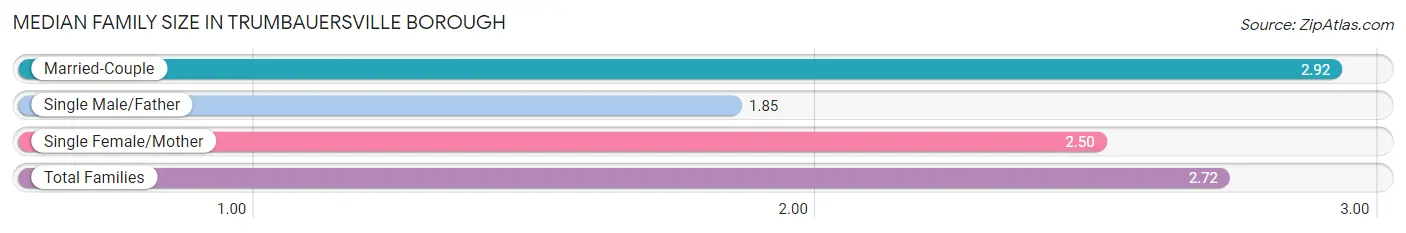
Median Family Size in Trumbauersville borough
The median family size in Trumbauersville borough is 2.72 persons per family, with married-couple families (213 | 78.6%) accounting for the largest median family size of 2.92 persons per family. On the other hand, single male/father families (46 | 17.0%) represent the smallest median family size with 1.85 persons per family.
| Family Type | # Families | Family Size |
| Married-Couple | 213 (78.6%) | 2.92 |
| Single Male/Father | 46 (17.0%) | 1.85 |
| Single Female/Mother | 12 (4.4%) | 2.50 |
| Total Families | 271 (100.0%) | 2.72 |
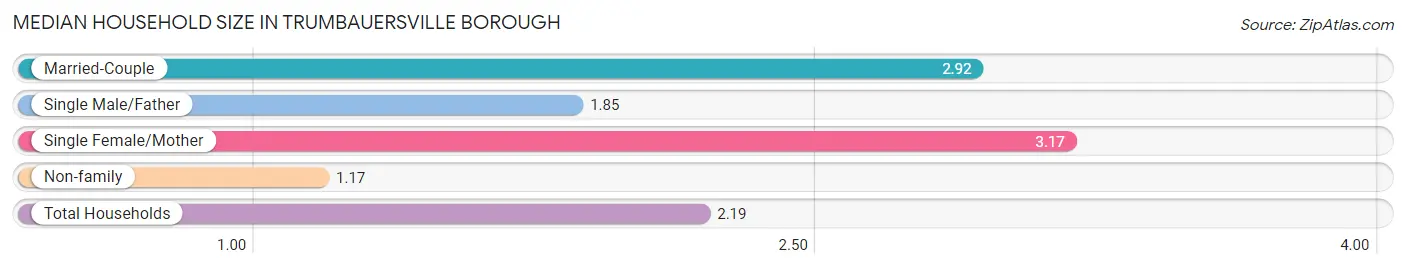
Median Household Size in Trumbauersville borough
The median household size in Trumbauersville borough is 2.19 persons per household, with single female/mother households (12 | 2.9%) accounting for the largest median household size of 3.17 persons per household. non-family households (146 | 35.0%) represent the smallest median household size with 1.17 persons per household.
| Household Type | # Households | Household Size |
| Married-Couple | 213 (51.1%) | 2.92 |
| Single Male/Father | 46 (11.0%) | 1.85 |
| Single Female/Mother | 12 (2.9%) | 3.17 |
| Non-family | 146 (35.0%) | 1.17 |
| Total Households | 417 (100.0%) | 2.19 |
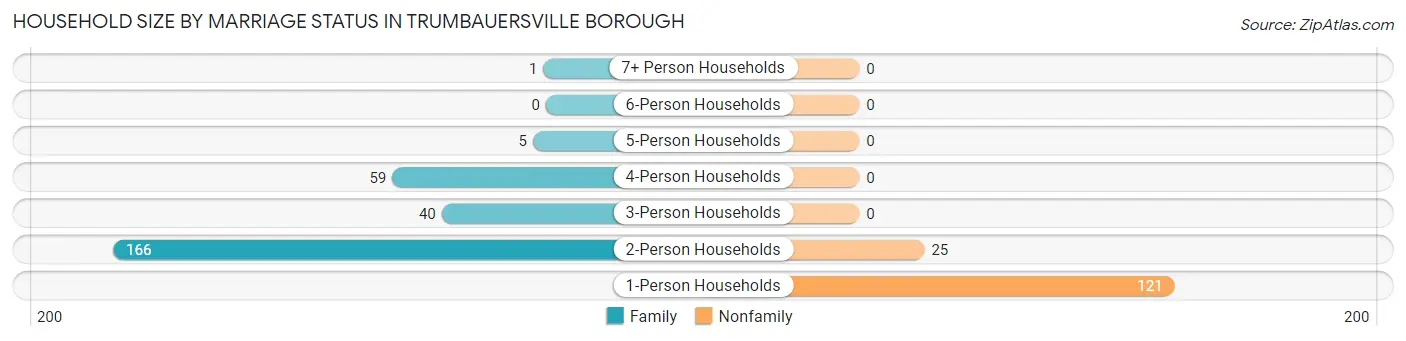
Household Size by Marriage Status in Trumbauersville borough
Out of a total of 417 households in Trumbauersville borough, 271 (65.0%) are family households, while 146 (35.0%) are nonfamily households. The most numerous type of family households are 2-person households, comprising 166, and the most common type of nonfamily households are 1-person households, comprising 121.
| Household Size | Family Households | Nonfamily Households |
| 1-Person Households | - | 121 (29.0%) |
| 2-Person Households | 166 (39.8%) | 25 (6.0%) |
| 3-Person Households | 40 (9.6%) | 0 (0.0%) |
| 4-Person Households | 59 (14.1%) | 0 (0.0%) |
| 5-Person Households | 5 (1.2%) | 0 (0.0%) |
| 6-Person Households | 0 (0.0%) | 0 (0.0%) |
| 7+ Person Households | 1 (0.2%) | 0 (0.0%) |
| Total | 271 (65.0%) | 146 (35.0%) |
Female Fertility in Trumbauersville borough
Fertility by Age in Trumbauersville borough
Average fertility rate in Trumbauersville borough is 53.0 births per 1,000 women. Women in the age bracket of 20 to 34 years have the highest fertility rate with 110.0 births per 1,000 women. Women in the age bracket of 20 to 34 years acount for 80.0% of all women with births.
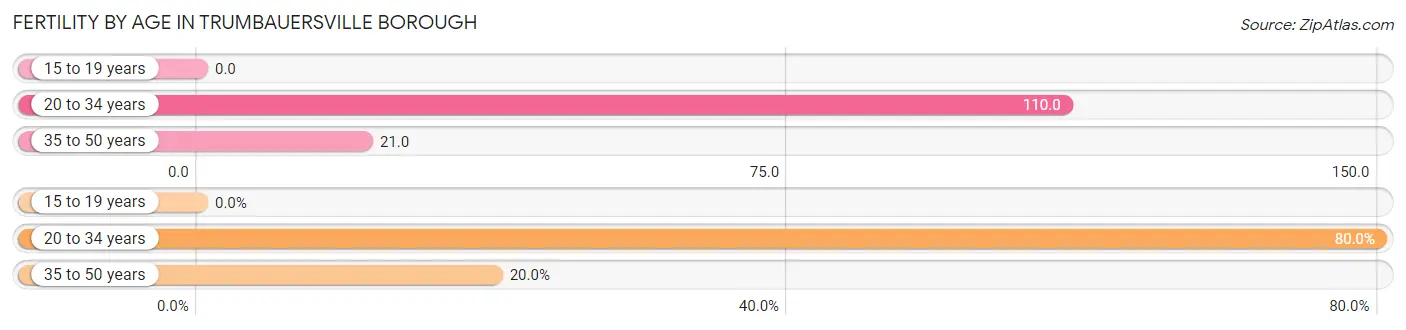
| Age Bracket | Women with Births | Births / 1,000 Women |
| 15 to 19 years | 0 (0.0%) | 0.0 |
| 20 to 34 years | 8 (80.0%) | 110.0 |
| 35 to 50 years | 2 (20.0%) | 21.0 |
| Total | 10 (100.0%) | 53.0 |
Fertility by Age by Marriage Status in Trumbauersville borough
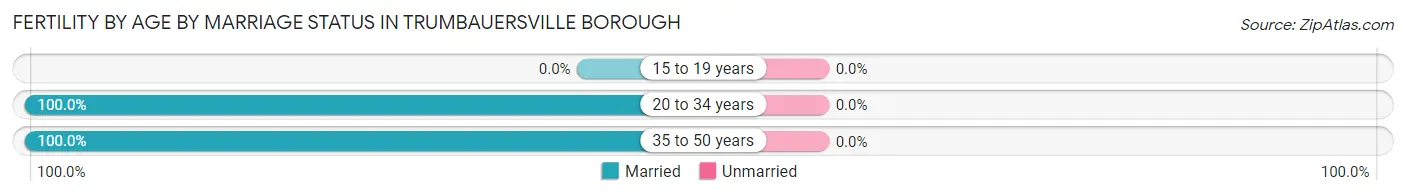
| Age Bracket | Married | Unmarried |
| 15 to 19 years | 0 (0.0%) | 0 (0.0%) |
| 20 to 34 years | 8 (100.0%) | 0 (0.0%) |
| 35 to 50 years | 2 (100.0%) | 0 (0.0%) |
| Total | 10 (100.0%) | 0 (0.0%) |
Fertility by Education in Trumbauersville borough
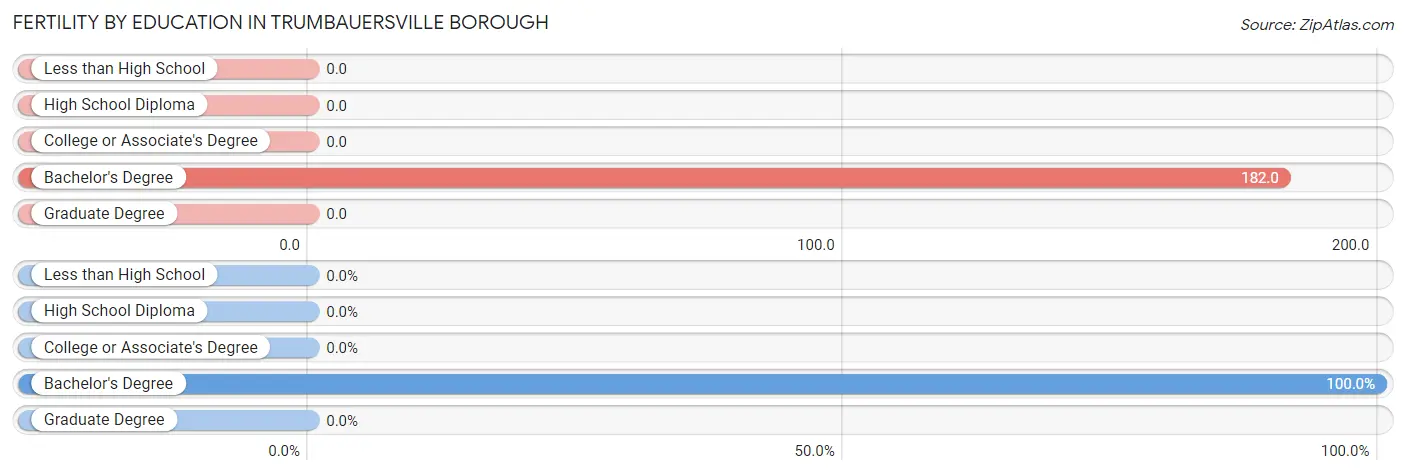
| Educational Attainment | Women with Births | Births / 1,000 Women |
| Less than High School | 0 (0.0%) | 0.0 |
| High School Diploma | 0 (0.0%) | 0.0 |
| College or Associate's Degree | 0 (0.0%) | 0.0 |
| Bachelor's Degree | 10 (100.0%) | 182.0 |
| Graduate Degree | 0 (0.0%) | 0.0 |
| Total | 10 (100.0%) | 53.0 |
Fertility by Education by Marriage Status in Trumbauersville borough
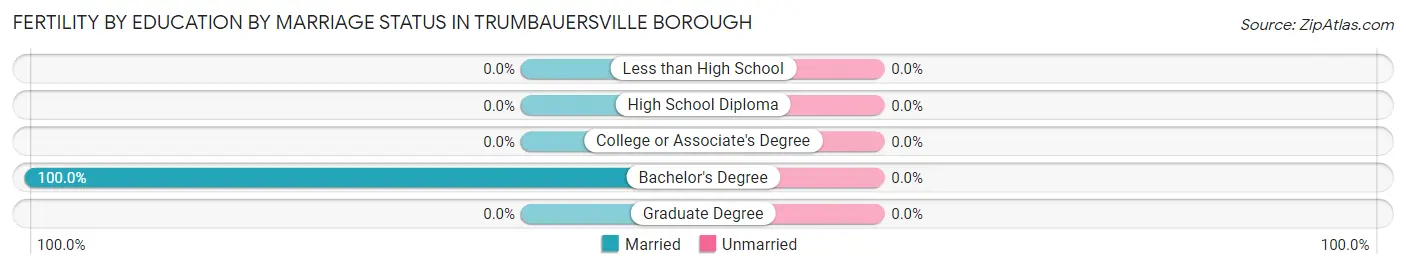
| Educational Attainment | Married | Unmarried |
| Less than High School | 0 (0.0%) | 0 (0.0%) |
| High School Diploma | 0 (0.0%) | 0 (0.0%) |
| College or Associate's Degree | 0 (0.0%) | 0 (0.0%) |
| Bachelor's Degree | 10 (100.0%) | 0 (0.0%) |
| Graduate Degree | 0 (0.0%) | 0 (0.0%) |
| Total | 10 (100.0%) | 0 (0.0%) |
Employment Characteristics in Trumbauersville borough
Employment by Class of Employer in Trumbauersville borough
Among the 571 employed individuals in Trumbauersville borough, private company employees (400 | 70.1%), local government employees (60 | 10.5%), and not-for-profit organizations (49 | 8.6%) make up the most common classes of employment.
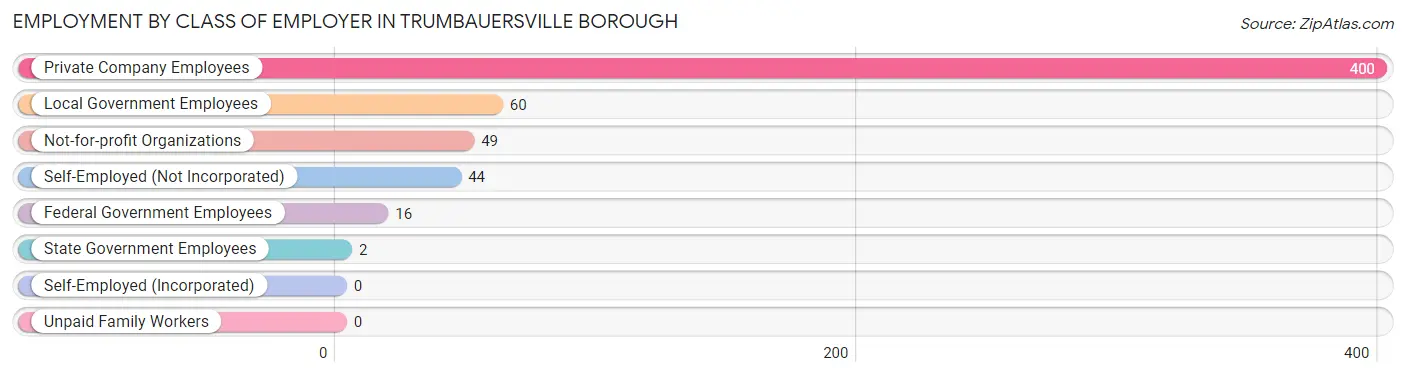
| Employer Class | # Employees | % Employees |
| Private Company Employees | 400 | 70.1% |
| Self-Employed (Incorporated) | 0 | 0.0% |
| Self-Employed (Not Incorporated) | 44 | 7.7% |
| Not-for-profit Organizations | 49 | 8.6% |
| Local Government Employees | 60 | 10.5% |
| State Government Employees | 2 | 0.4% |
| Federal Government Employees | 16 | 2.8% |
| Unpaid Family Workers | 0 | 0.0% |
| Total | 571 | 100.0% |
Employment Status by Age in Trumbauersville borough
According to the labor force statistics for Trumbauersville borough, out of the total population over 16 years of age (825), 71.2% or 587 individuals are in the labor force, with 2.4% or 14 of them unemployed. The age group with the highest labor force participation rate is 35 to 44 years, with 96.7% or 119 individuals in the labor force. Within the labor force, the 35 to 44 years age range has the highest percentage of unemployed individuals, with 10.9% or 13 of them being unemployed.
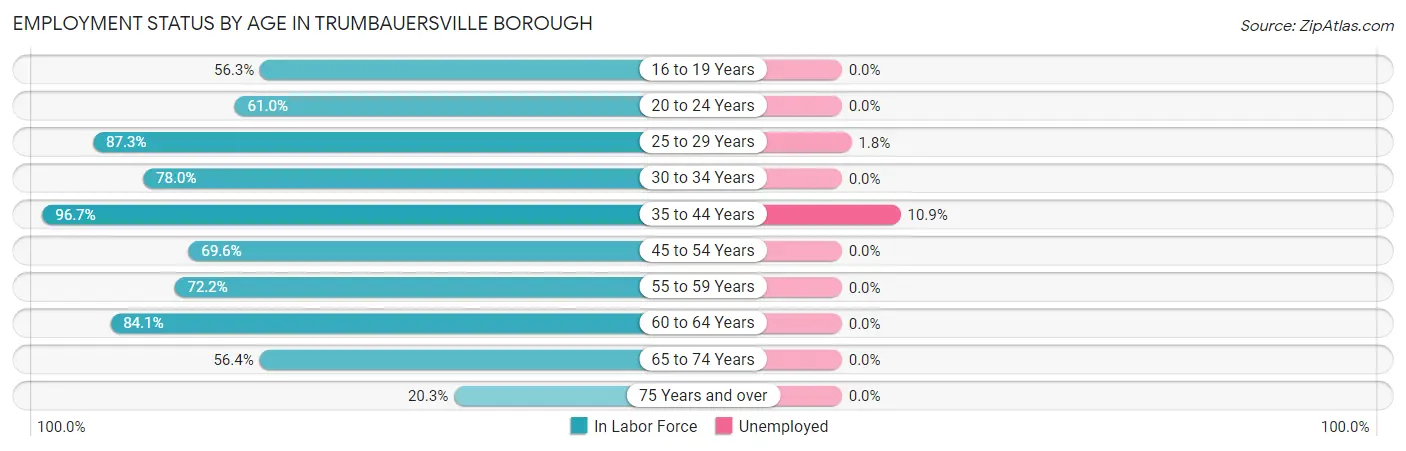
| Age Bracket | In Labor Force | Unemployed |
| 16 to 19 Years | 27 (56.3%) | 0 (0.0%) |
| 20 to 24 Years | 25 (61.0%) | 0 (0.0%) |
| 25 to 29 Years | 55 (87.3%) | 1 (1.8%) |
| 30 to 34 Years | 71 (78.0%) | 0 (0.0%) |
| 35 to 44 Years | 119 (96.7%) | 13 (10.9%) |
| 45 to 54 Years | 103 (69.6%) | 0 (0.0%) |
| 55 to 59 Years | 39 (72.2%) | 0 (0.0%) |
| 60 to 64 Years | 74 (84.1%) | 0 (0.0%) |
| 65 to 74 Years | 62 (56.4%) | 0 (0.0%) |
| 75 Years and over | 12 (20.3%) | 0 (0.0%) |
| Total | 587 (71.2%) | 14 (2.4%) |
Employment Status by Educational Attainment in Trumbauersville borough
According to labor force statistics for Trumbauersville borough, 81.3% of individuals (461) out of the total population between 25 and 64 years of age (567) are in the labor force, with 3.0% or 14 of them being unemployed. The group with the highest labor force participation rate are those with the educational attainment of college / associate degree, with 88.2% or 202 individuals in the labor force. Within the labor force, individuals with bachelor's degree or higher education have the highest percentage of unemployment, with 9.4% or 13 of them being unemployed.
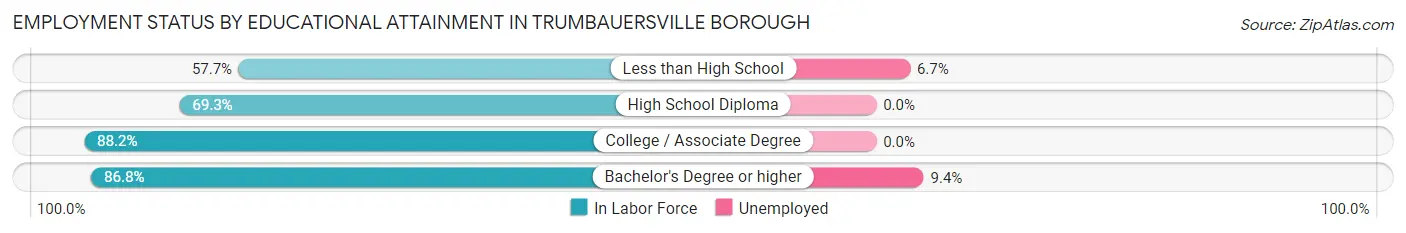
| Educational Attainment | In Labor Force | Unemployed |
| Less than High School | 15 (57.7%) | 2 (6.7%) |
| High School Diploma | 106 (69.3%) | 0 (0.0%) |
| College / Associate Degree | 202 (88.2%) | 0 (0.0%) |
| Bachelor's Degree or higher | 138 (86.8%) | 15 (9.4%) |
| Total | 461 (81.3%) | 17 (3.0%) |
Employment Occupations by Sex in Trumbauersville borough
Management, Business, Science and Arts Occupations
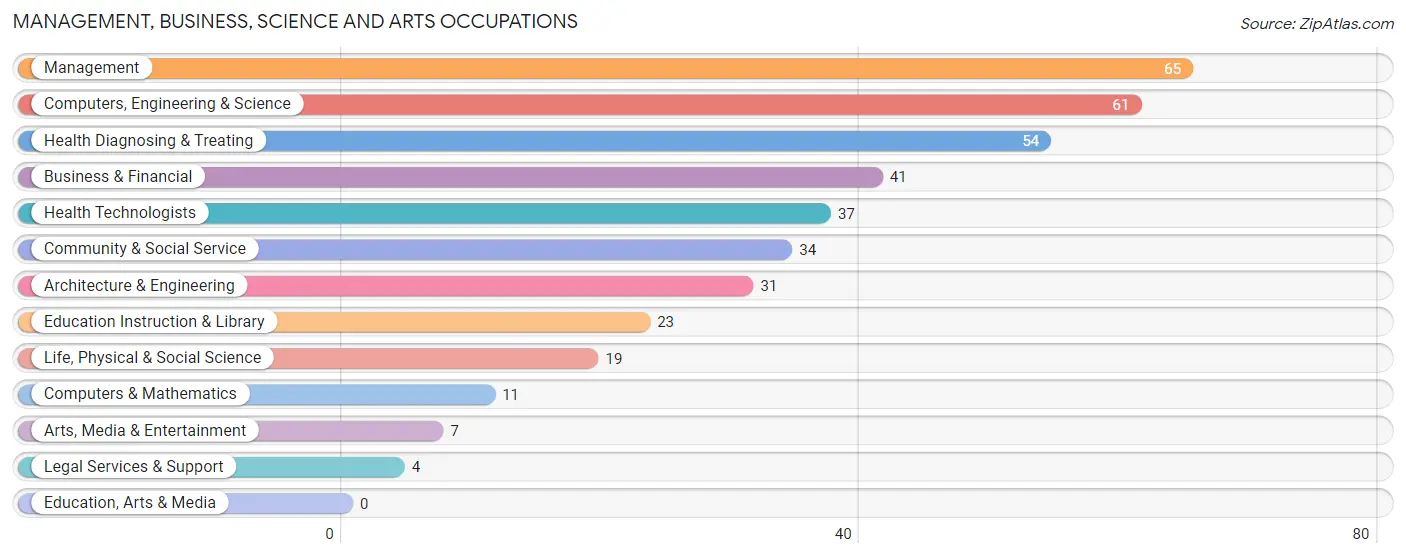
The most common Management, Business, Science and Arts occupations in Trumbauersville borough are Management (65 | 11.3%), Computers, Engineering & Science (61 | 10.6%), Health Diagnosing & Treating (54 | 9.4%), Business & Financial (41 | 7.2%), and Health Technologists (37 | 6.5%).
Management, Business, Science and Arts Occupations by Sex
Within the Management, Business, Science and Arts occupations in Trumbauersville borough, the most male-oriented occupations are Computers & Mathematics (100.0%), Architecture & Engineering (100.0%), and Legal Services & Support (100.0%), while the most female-oriented occupations are Arts, Media & Entertainment (100.0%), Health Diagnosing & Treating (96.3%), and Health Technologists (94.6%).
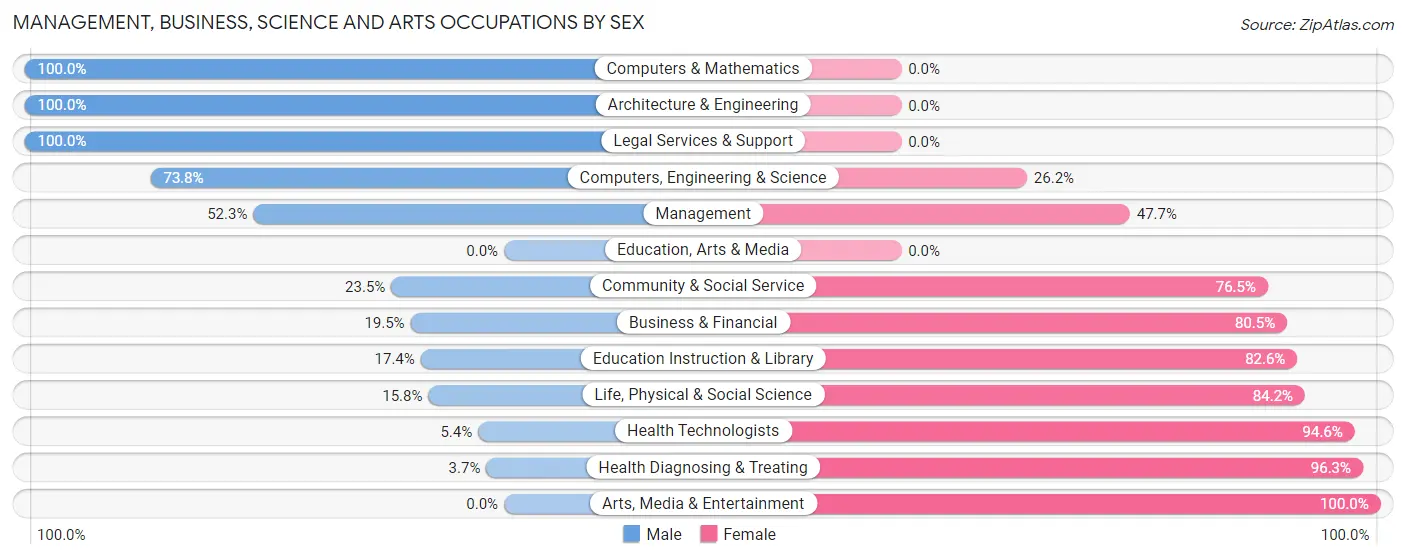
| Occupation | Male | Female |
| Management | 34 (52.3%) | 31 (47.7%) |
| Business & Financial | 8 (19.5%) | 33 (80.5%) |
| Computers, Engineering & Science | 45 (73.8%) | 16 (26.2%) |
| Computers & Mathematics | 11 (100.0%) | 0 (0.0%) |
| Architecture & Engineering | 31 (100.0%) | 0 (0.0%) |
| Life, Physical & Social Science | 3 (15.8%) | 16 (84.2%) |
| Community & Social Service | 8 (23.5%) | 26 (76.5%) |
| Education, Arts & Media | 0 (0.0%) | 0 (0.0%) |
| Legal Services & Support | 4 (100.0%) | 0 (0.0%) |
| Education Instruction & Library | 4 (17.4%) | 19 (82.6%) |
| Arts, Media & Entertainment | 0 (0.0%) | 7 (100.0%) |
| Health Diagnosing & Treating | 2 (3.7%) | 52 (96.3%) |
| Health Technologists | 2 (5.4%) | 35 (94.6%) |
| Total (Category) | 97 (38.0%) | 158 (62.0%) |
| Total (Overall) | 310 (54.1%) | 263 (45.9%) |
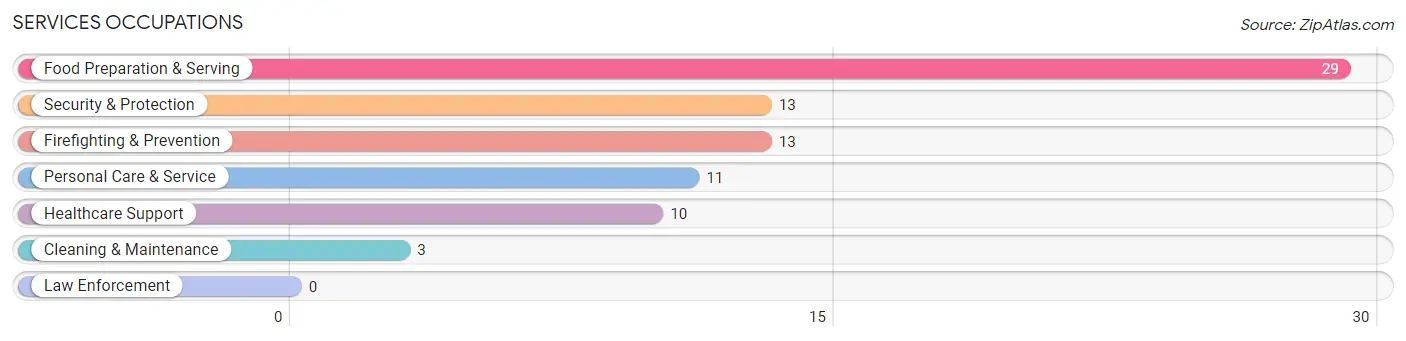
Services Occupations
The most common Services occupations in Trumbauersville borough are Food Preparation & Serving (29 | 5.1%), Security & Protection (13 | 2.3%), Firefighting & Prevention (13 | 2.3%), Personal Care & Service (11 | 1.9%), and Healthcare Support (10 | 1.8%).
Services Occupations by Sex
Within the Services occupations in Trumbauersville borough, the most male-oriented occupations are Security & Protection (100.0%), Firefighting & Prevention (100.0%), and Food Preparation & Serving (72.4%), while the most female-oriented occupations are Cleaning & Maintenance (100.0%), Personal Care & Service (100.0%), and Healthcare Support (70.0%).
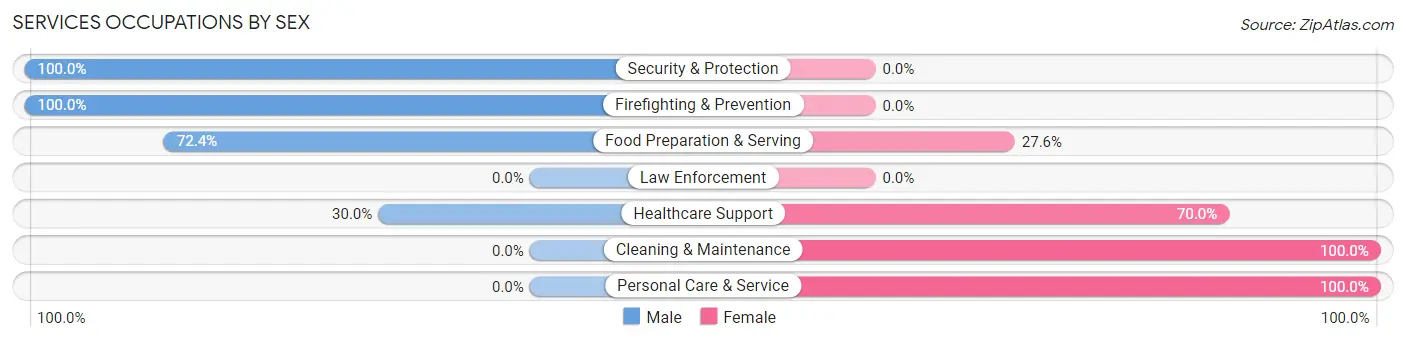
| Occupation | Male | Female |
| Healthcare Support | 3 (30.0%) | 7 (70.0%) |
| Security & Protection | 13 (100.0%) | 0 (0.0%) |
| Firefighting & Prevention | 13 (100.0%) | 0 (0.0%) |
| Law Enforcement | 0 (0.0%) | 0 (0.0%) |
| Food Preparation & Serving | 21 (72.4%) | 8 (27.6%) |
| Cleaning & Maintenance | 0 (0.0%) | 3 (100.0%) |
| Personal Care & Service | 0 (0.0%) | 11 (100.0%) |
| Total (Category) | 37 (56.1%) | 29 (43.9%) |
| Total (Overall) | 310 (54.1%) | 263 (45.9%) |
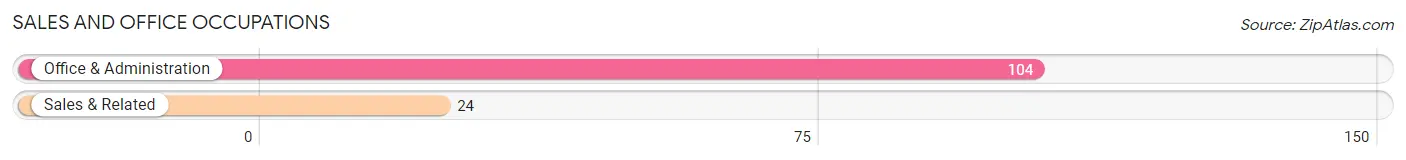
Sales and Office Occupations
The most common Sales and Office occupations in Trumbauersville borough are Office & Administration (104 | 18.1%), and Sales & Related (24 | 4.2%).
Sales and Office Occupations by Sex
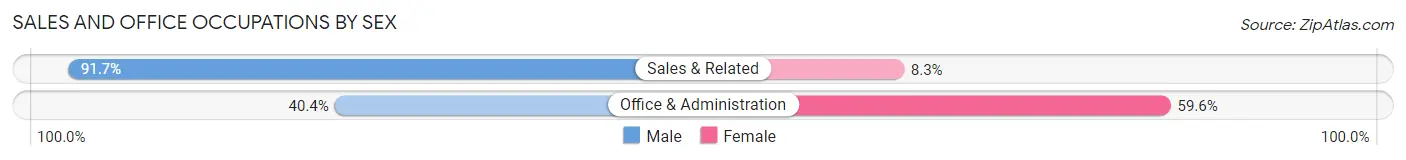
| Occupation | Male | Female |
| Sales & Related | 22 (91.7%) | 2 (8.3%) |
| Office & Administration | 42 (40.4%) | 62 (59.6%) |
| Total (Category) | 64 (50.0%) | 64 (50.0%) |
| Total (Overall) | 310 (54.1%) | 263 (45.9%) |
Natural Resources, Construction and Maintenance Occupations
The most common Natural Resources, Construction and Maintenance occupations in Trumbauersville borough are Construction & Extraction (31 | 5.4%), Installation, Maintenance & Repair (13 | 2.3%), and Farming, Fishing & Forestry (3 | 0.5%).
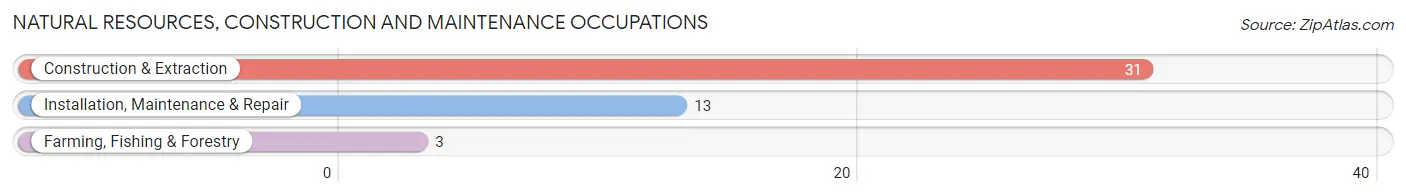
Natural Resources, Construction and Maintenance Occupations by Sex

| Occupation | Male | Female |
| Farming, Fishing & Forestry | 0 (0.0%) | 3 (100.0%) |
| Construction & Extraction | 31 (100.0%) | 0 (0.0%) |
| Installation, Maintenance & Repair | 13 (100.0%) | 0 (0.0%) |
| Total (Category) | 44 (93.6%) | 3 (6.4%) |
| Total (Overall) | 310 (54.1%) | 263 (45.9%) |
Production, Transportation and Moving Occupations
The most common Production, Transportation and Moving occupations in Trumbauersville borough are Production (44 | 7.7%), Material Moving (19 | 3.3%), and Transportation (14 | 2.4%).
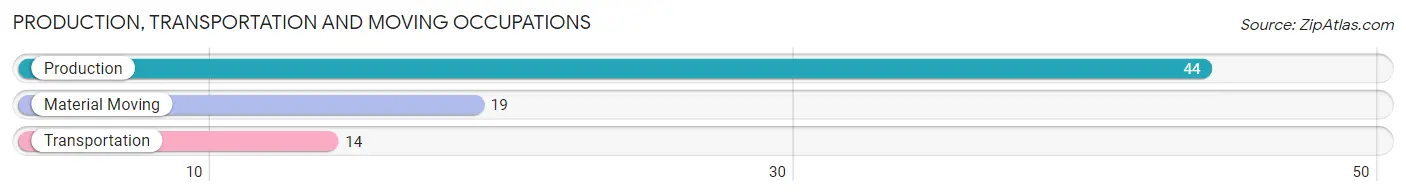
Production, Transportation and Moving Occupations by Sex
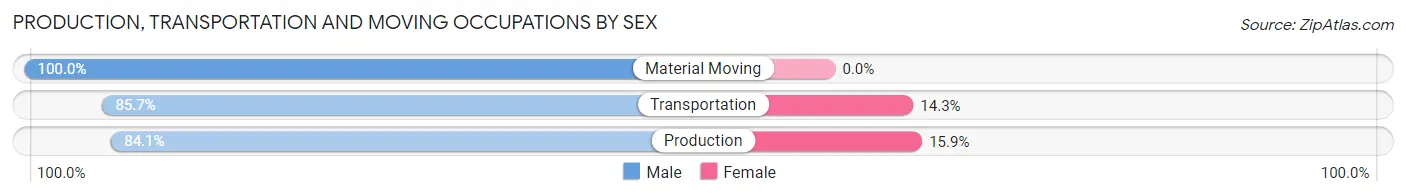
| Occupation | Male | Female |
| Production | 37 (84.1%) | 7 (15.9%) |
| Transportation | 12 (85.7%) | 2 (14.3%) |
| Material Moving | 19 (100.0%) | 0 (0.0%) |
| Total (Category) | 68 (88.3%) | 9 (11.7%) |
| Total (Overall) | 310 (54.1%) | 263 (45.9%) |
Employment Industries by Sex in Trumbauersville borough
Employment Industries in Trumbauersville borough
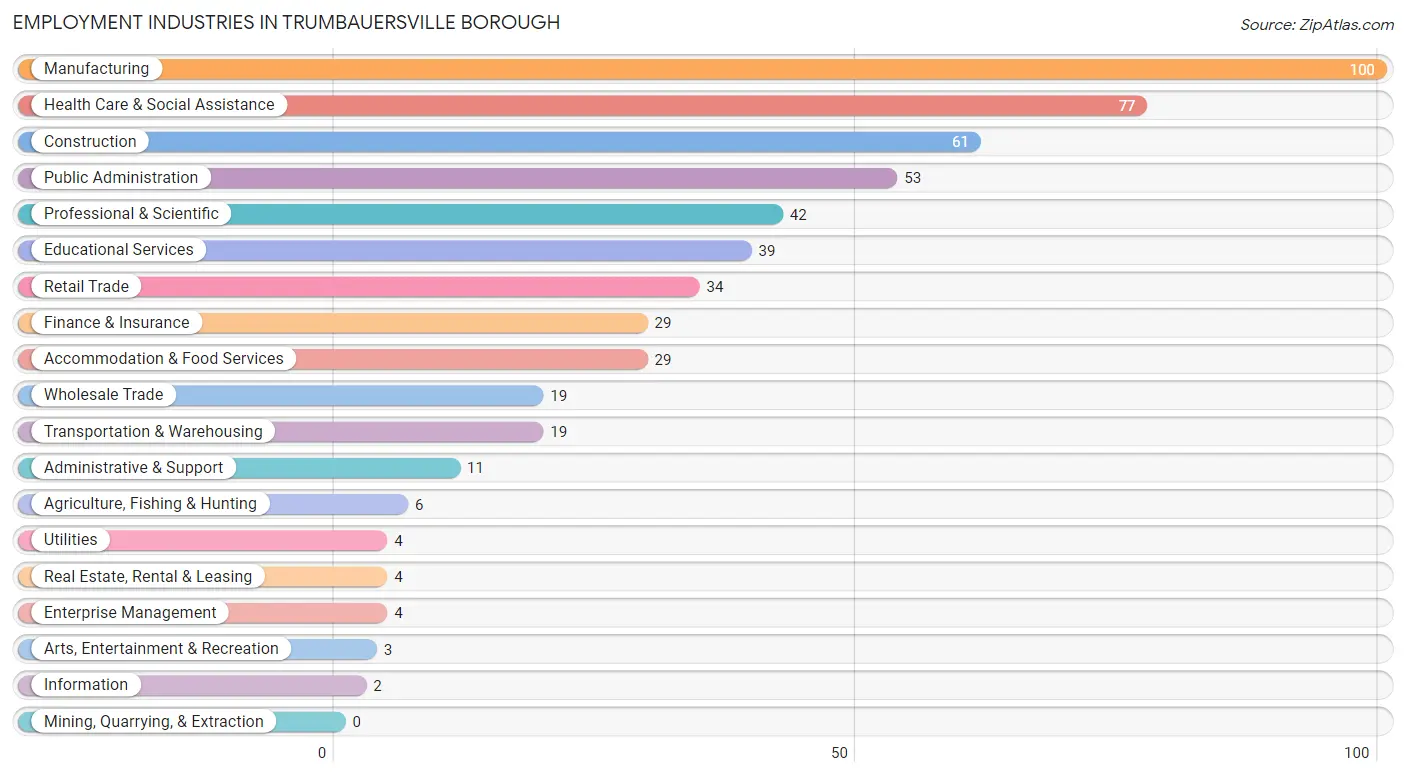
The major employment industries in Trumbauersville borough include Manufacturing (100 | 17.4%), Health Care & Social Assistance (77 | 13.4%), Construction (61 | 10.6%), Public Administration (53 | 9.2%), and Professional & Scientific (42 | 7.3%).
Employment Industries by Sex in Trumbauersville borough
The Trumbauersville borough industries that see more men than women are Utilities (100.0%), Real Estate, Rental & Leasing (100.0%), and Enterprise Management (100.0%), whereas the industries that tend to have a higher number of women are Information (100.0%), Arts, Entertainment & Recreation (100.0%), and Health Care & Social Assistance (93.5%).
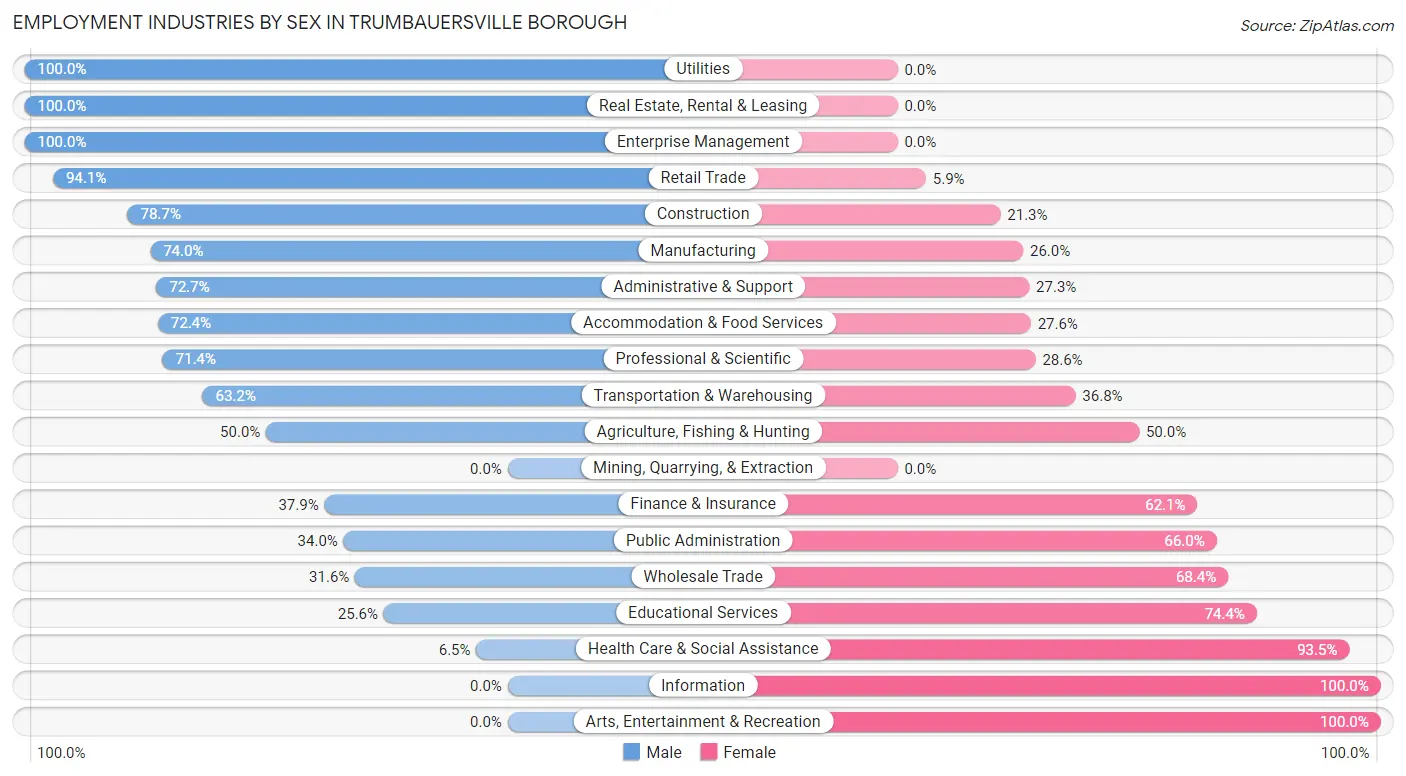
| Industry | Male | Female |
| Agriculture, Fishing & Hunting | 3 (50.0%) | 3 (50.0%) |
| Mining, Quarrying, & Extraction | 0 (0.0%) | 0 (0.0%) |
| Construction | 48 (78.7%) | 13 (21.3%) |
| Manufacturing | 74 (74.0%) | 26 (26.0%) |
| Wholesale Trade | 6 (31.6%) | 13 (68.4%) |
| Retail Trade | 32 (94.1%) | 2 (5.9%) |
| Transportation & Warehousing | 12 (63.2%) | 7 (36.8%) |
| Utilities | 4 (100.0%) | 0 (0.0%) |
| Information | 0 (0.0%) | 2 (100.0%) |
| Finance & Insurance | 11 (37.9%) | 18 (62.1%) |
| Real Estate, Rental & Leasing | 4 (100.0%) | 0 (0.0%) |
| Professional & Scientific | 30 (71.4%) | 12 (28.6%) |
| Enterprise Management | 4 (100.0%) | 0 (0.0%) |
| Administrative & Support | 8 (72.7%) | 3 (27.3%) |
| Educational Services | 10 (25.6%) | 29 (74.4%) |
| Health Care & Social Assistance | 5 (6.5%) | 72 (93.5%) |
| Arts, Entertainment & Recreation | 0 (0.0%) | 3 (100.0%) |
| Accommodation & Food Services | 21 (72.4%) | 8 (27.6%) |
| Public Administration | 18 (34.0%) | 35 (66.0%) |
| Total | 310 (54.1%) | 263 (45.9%) |
Education in Trumbauersville borough
School Enrollment in Trumbauersville borough
The most common levels of schooling among the 130 students in Trumbauersville borough are high school (47 | 36.1%), elementary school (28 | 21.5%), and middle school (23 | 17.7%).
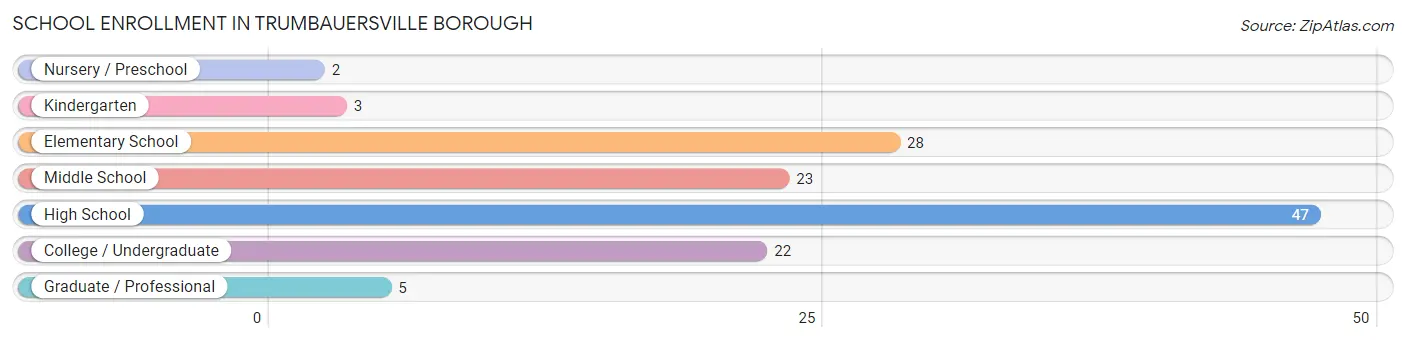
| School Level | # Students | % Students |
| Nursery / Preschool | 2 | 1.5% |
| Kindergarten | 3 | 2.3% |
| Elementary School | 28 | 21.5% |
| Middle School | 23 | 17.7% |
| High School | 47 | 36.1% |
| College / Undergraduate | 22 | 16.9% |
| Graduate / Professional | 5 | 3.8% |
| Total | 130 | 100.0% |
School Enrollment by Age by Funding Source in Trumbauersville borough
Out of a total of 130 students who are enrolled in schools in Trumbauersville borough, 16 (12.3%) attend a private institution, while the remaining 114 (87.7%) are enrolled in public schools. The age group of 3 to 4 year olds has the highest likelihood of being enrolled in private schools, with 2 (100.0% in the age bracket) enrolled. Conversely, the age group of 5 to 9 year old has the lowest likelihood of being enrolled in a private school, with 29 (100.0% in the age bracket) attending a public institution.
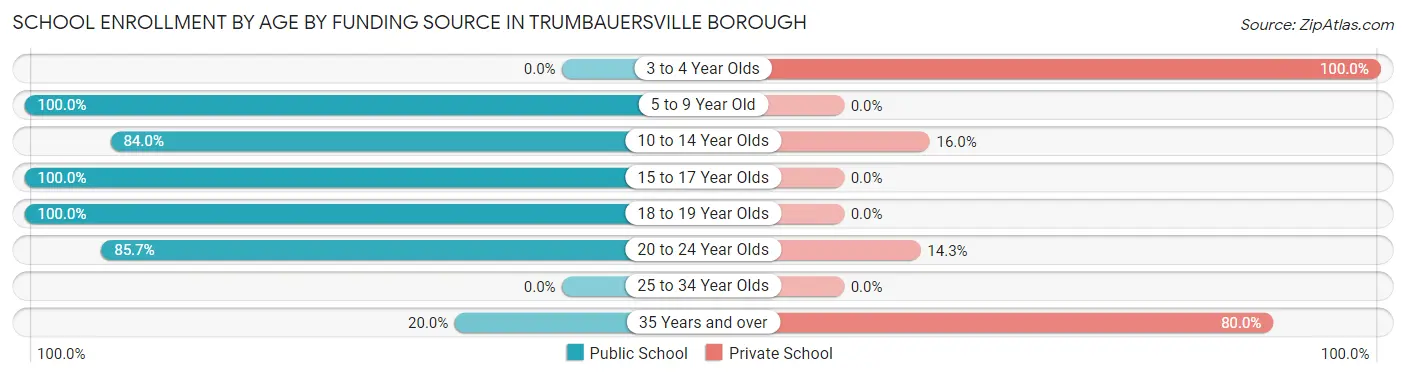
| Age Bracket | Public School | Private School |
| 3 to 4 Year Olds | 0 (0.0%) | 2 (100.0%) |
| 5 to 9 Year Old | 29 (100.0%) | 0 (0.0%) |
| 10 to 14 Year Olds | 21 (84.0%) | 4 (16.0%) |
| 15 to 17 Year Olds | 35 (100.0%) | 0 (0.0%) |
| 18 to 19 Year Olds | 15 (100.0%) | 0 (0.0%) |
| 20 to 24 Year Olds | 12 (85.7%) | 2 (14.3%) |
| 25 to 34 Year Olds | 0 (0.0%) | 0 (0.0%) |
| 35 Years and over | 2 (20.0%) | 8 (80.0%) |
| Total | 114 (87.7%) | 16 (12.3%) |
Educational Attainment by Field of Study in Trumbauersville borough
Science & technology (53 | 26.2%), bio, nature & agricultural (23 | 11.4%), business (23 | 11.4%), arts & humanities (20 | 9.9%), and psychology (19 | 9.4%) are the most common fields of study among 202 individuals in Trumbauersville borough who have obtained a bachelor's degree or higher.
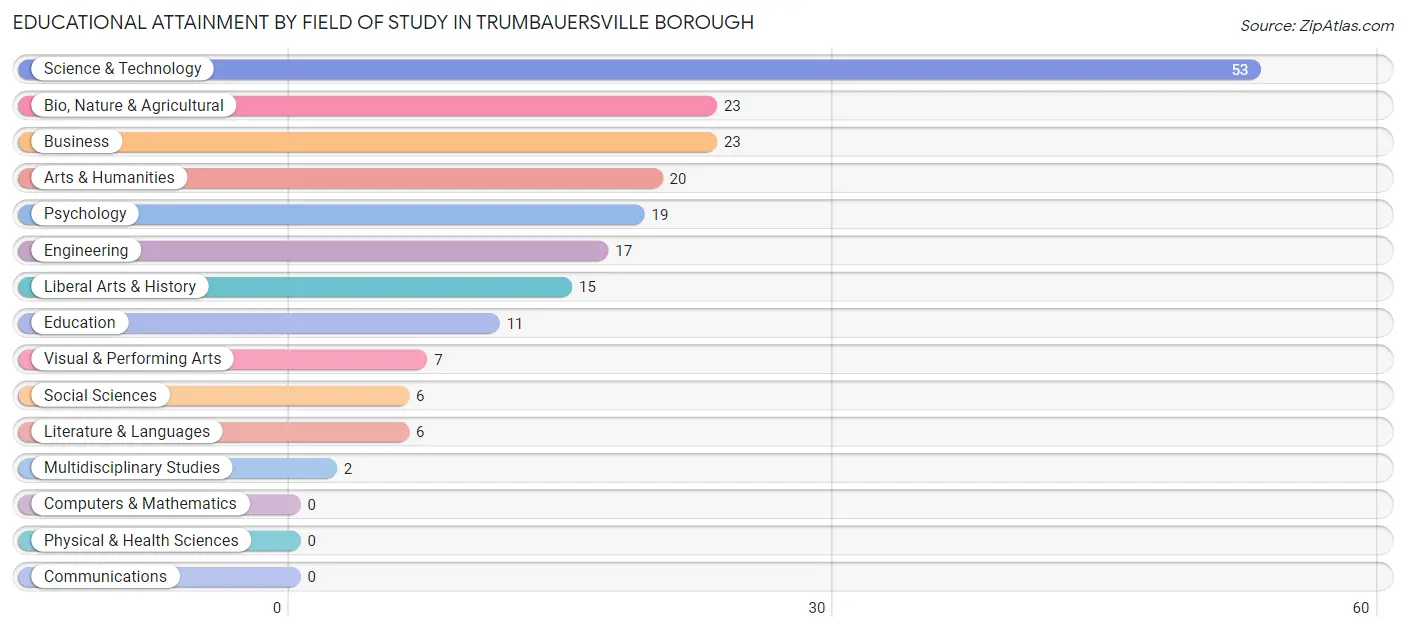
| Field of Study | # Graduates | % Graduates |
| Computers & Mathematics | 0 | 0.0% |
| Bio, Nature & Agricultural | 23 | 11.4% |
| Physical & Health Sciences | 0 | 0.0% |
| Psychology | 19 | 9.4% |
| Social Sciences | 6 | 3.0% |
| Engineering | 17 | 8.4% |
| Multidisciplinary Studies | 2 | 1.0% |
| Science & Technology | 53 | 26.2% |
| Business | 23 | 11.4% |
| Education | 11 | 5.4% |
| Literature & Languages | 6 | 3.0% |
| Liberal Arts & History | 15 | 7.4% |
| Visual & Performing Arts | 7 | 3.5% |
| Communications | 0 | 0.0% |
| Arts & Humanities | 20 | 9.9% |
| Total | 202 | 100.0% |
Transportation & Commute in Trumbauersville borough
Vehicle Availability by Sex in Trumbauersville borough
The most prevalent vehicle ownership categories in Trumbauersville borough are males with 2 vehicles (132, accounting for 42.6%) and females with 2 vehicles (105, making up 52.4%).
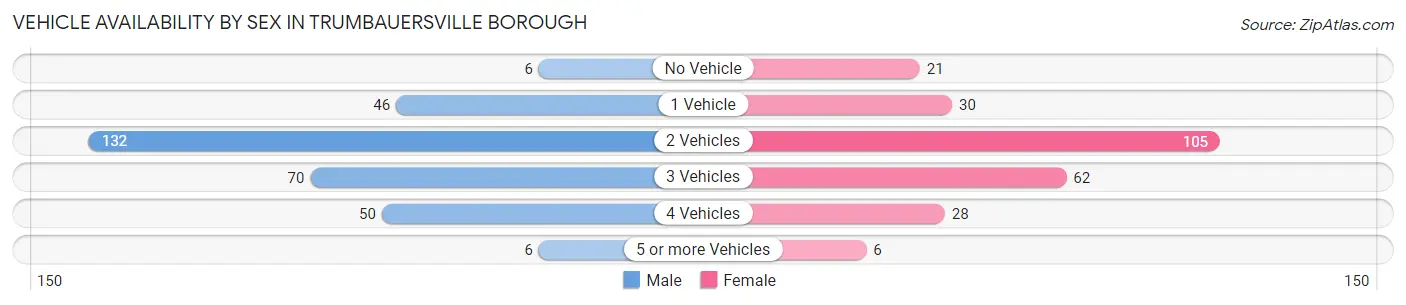
| Vehicles Available | Male | Female |
| No Vehicle | 6 (1.9%) | 21 (8.3%) |
| 1 Vehicle | 46 (14.8%) | 30 (11.9%) |
| 2 Vehicles | 132 (42.6%) | 105 (41.7%) |
| 3 Vehicles | 70 (22.6%) | 62 (24.6%) |
| 4 Vehicles | 50 (16.1%) | 28 (11.1%) |
| 5 or more Vehicles | 6 (1.9%) | 6 (2.4%) |
| Total | 310 (100.0%) | 252 (100.0%) |
Commute Time in Trumbauersville borough
The most frequently occuring commute durations in Trumbauersville borough are 15 to 19 minutes (103 commuters, 20.2%), 10 to 14 minutes (86 commuters, 16.9%), and 30 to 34 minutes (54 commuters, 10.6%).
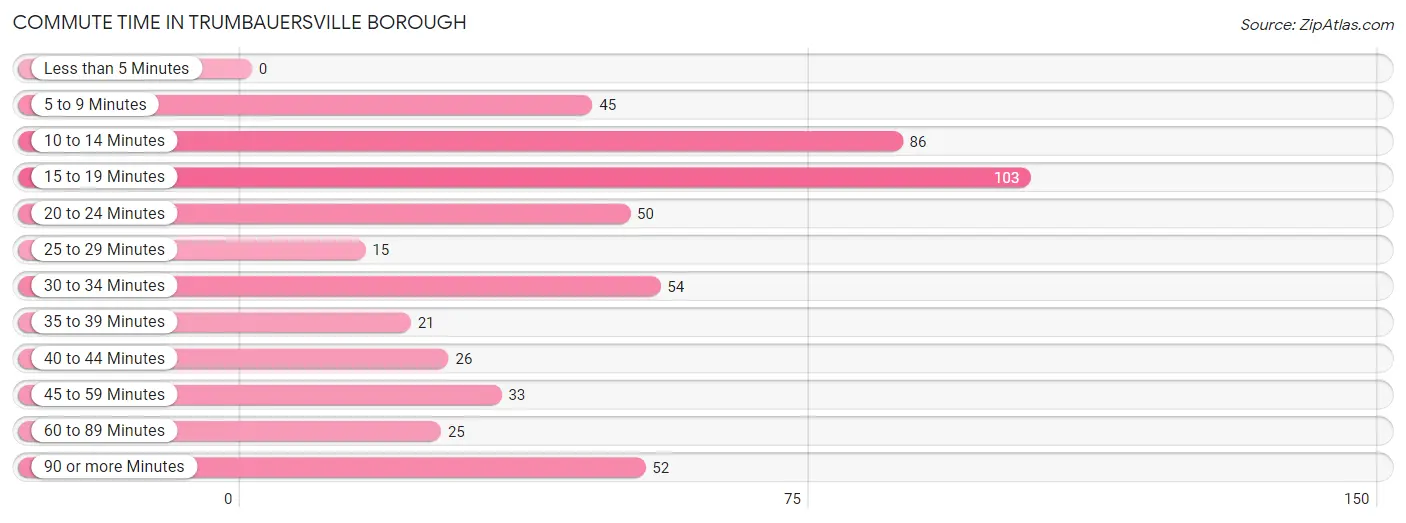
| Commute Time | # Commuters | % Commuters |
| Less than 5 Minutes | 0 | 0.0% |
| 5 to 9 Minutes | 45 | 8.8% |
| 10 to 14 Minutes | 86 | 16.9% |
| 15 to 19 Minutes | 103 | 20.2% |
| 20 to 24 Minutes | 50 | 9.8% |
| 25 to 29 Minutes | 15 | 2.9% |
| 30 to 34 Minutes | 54 | 10.6% |
| 35 to 39 Minutes | 21 | 4.1% |
| 40 to 44 Minutes | 26 | 5.1% |
| 45 to 59 Minutes | 33 | 6.5% |
| 60 to 89 Minutes | 25 | 4.9% |
| 90 or more Minutes | 52 | 10.2% |
Commute Time by Sex in Trumbauersville borough
The most common commute times in Trumbauersville borough are 15 to 19 minutes (57 commuters, 20.4%) for males and 10 to 14 minutes (46 commuters, 19.9%) for females.
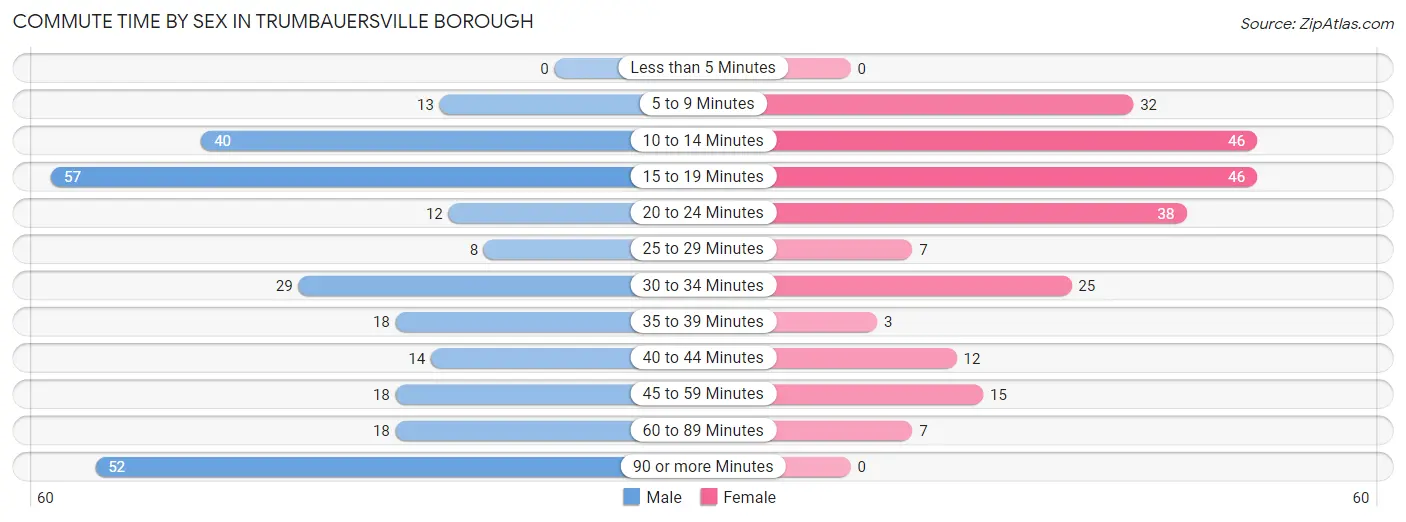
| Commute Time | Male | Female |
| Less than 5 Minutes | 0 (0.0%) | 0 (0.0%) |
| 5 to 9 Minutes | 13 (4.7%) | 32 (13.9%) |
| 10 to 14 Minutes | 40 (14.3%) | 46 (19.9%) |
| 15 to 19 Minutes | 57 (20.4%) | 46 (19.9%) |
| 20 to 24 Minutes | 12 (4.3%) | 38 (16.5%) |
| 25 to 29 Minutes | 8 (2.9%) | 7 (3.0%) |
| 30 to 34 Minutes | 29 (10.4%) | 25 (10.8%) |
| 35 to 39 Minutes | 18 (6.5%) | 3 (1.3%) |
| 40 to 44 Minutes | 14 (5.0%) | 12 (5.2%) |
| 45 to 59 Minutes | 18 (6.5%) | 15 (6.5%) |
| 60 to 89 Minutes | 18 (6.5%) | 7 (3.0%) |
| 90 or more Minutes | 52 (18.6%) | 0 (0.0%) |
Time of Departure to Work by Sex in Trumbauersville borough
The most frequent times of departure to work in Trumbauersville borough are 8:00 AM to 8:29 AM (61, 21.9%) for males and 8:30 AM to 8:59 AM (45, 19.5%) for females.
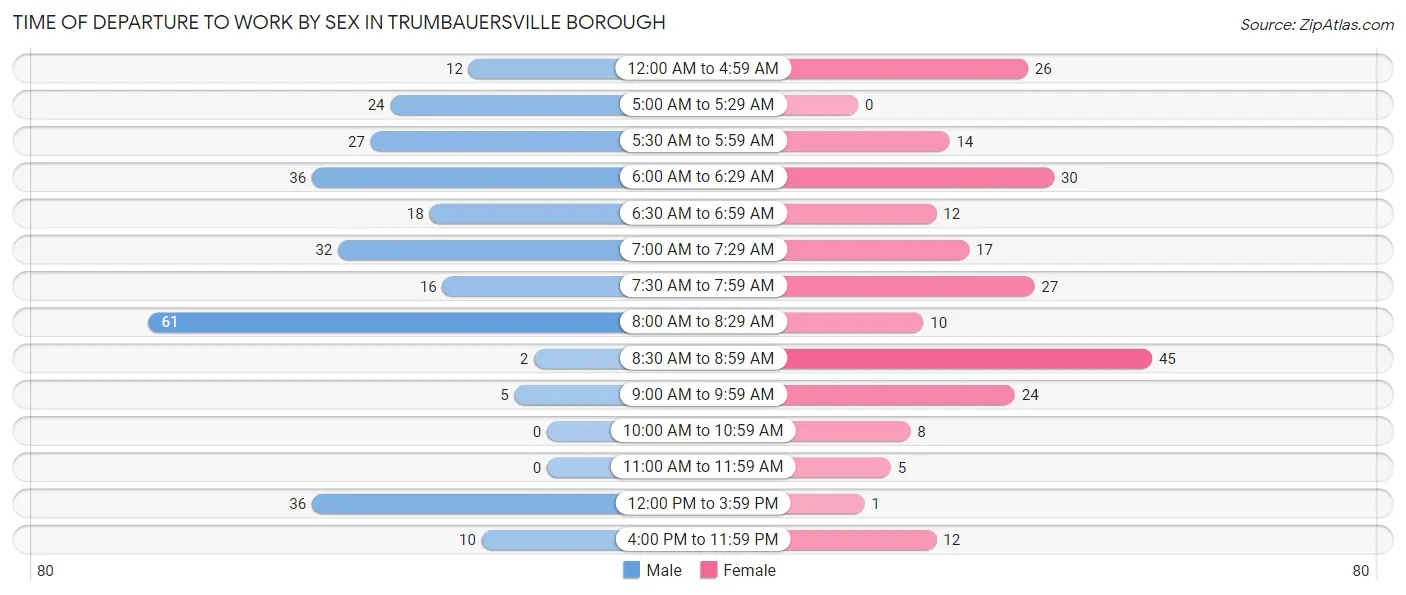
| Time of Departure | Male | Female |
| 12:00 AM to 4:59 AM | 12 (4.3%) | 26 (11.3%) |
| 5:00 AM to 5:29 AM | 24 (8.6%) | 0 (0.0%) |
| 5:30 AM to 5:59 AM | 27 (9.7%) | 14 (6.1%) |
| 6:00 AM to 6:29 AM | 36 (12.9%) | 30 (13.0%) |
| 6:30 AM to 6:59 AM | 18 (6.5%) | 12 (5.2%) |
| 7:00 AM to 7:29 AM | 32 (11.5%) | 17 (7.4%) |
| 7:30 AM to 7:59 AM | 16 (5.7%) | 27 (11.7%) |
| 8:00 AM to 8:29 AM | 61 (21.9%) | 10 (4.3%) |
| 8:30 AM to 8:59 AM | 2 (0.7%) | 45 (19.5%) |
| 9:00 AM to 9:59 AM | 5 (1.8%) | 24 (10.4%) |
| 10:00 AM to 10:59 AM | 0 (0.0%) | 8 (3.5%) |
| 11:00 AM to 11:59 AM | 0 (0.0%) | 5 (2.2%) |
| 12:00 PM to 3:59 PM | 36 (12.9%) | 1 (0.4%) |
| 4:00 PM to 11:59 PM | 10 (3.6%) | 12 (5.2%) |
| Total | 279 (100.0%) | 231 (100.0%) |
Housing Occupancy in Trumbauersville borough
Occupancy by Ownership in Trumbauersville borough
Of the total 417 dwellings in Trumbauersville borough, owner-occupied units account for 309 (74.1%), while renter-occupied units make up 108 (25.9%).
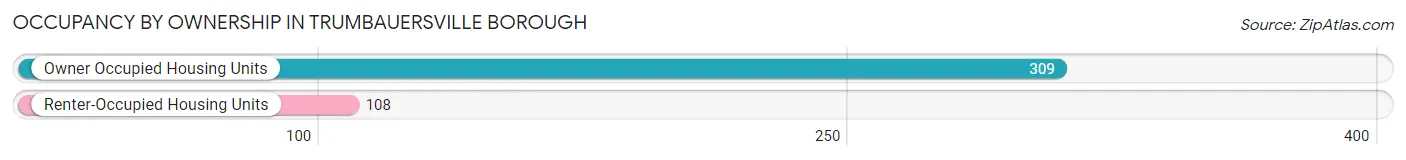
| Occupancy | # Housing Units | % Housing Units |
| Owner Occupied Housing Units | 309 | 74.1% |
| Renter-Occupied Housing Units | 108 | 25.9% |
| Total Occupied Housing Units | 417 | 100.0% |
Occupancy by Household Size in Trumbauersville borough
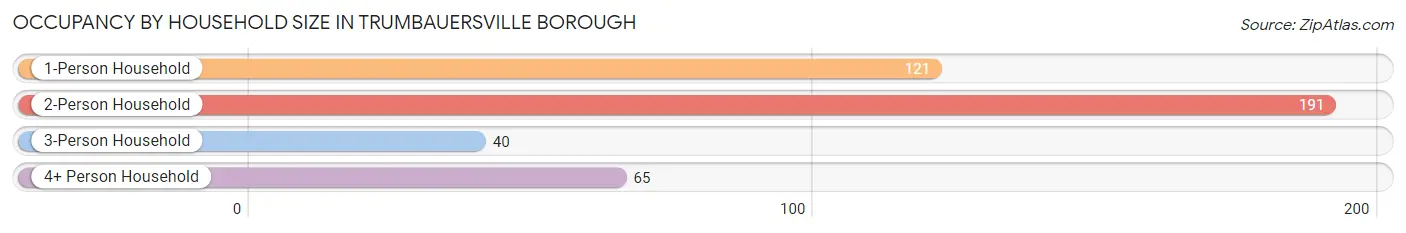
| Household Size | # Housing Units | % Housing Units |
| 1-Person Household | 121 | 29.0% |
| 2-Person Household | 191 | 45.8% |
| 3-Person Household | 40 | 9.6% |
| 4+ Person Household | 65 | 15.6% |
| Total Housing Units | 417 | 100.0% |
Occupancy by Ownership by Household Size in Trumbauersville borough
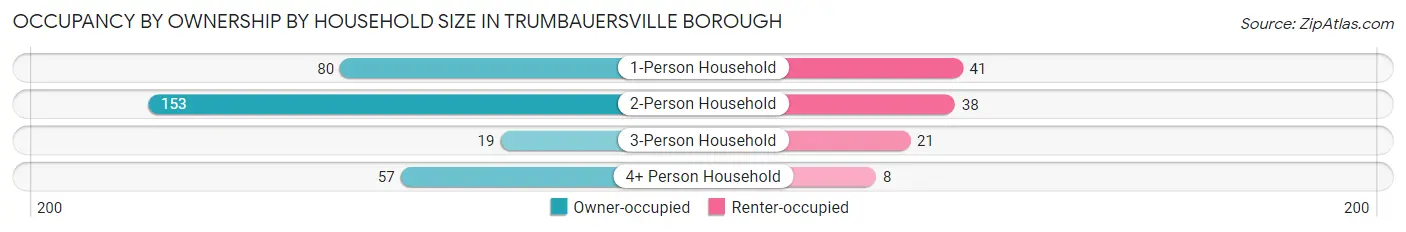
| Household Size | Owner-occupied | Renter-occupied |
| 1-Person Household | 80 (66.1%) | 41 (33.9%) |
| 2-Person Household | 153 (80.1%) | 38 (19.9%) |
| 3-Person Household | 19 (47.5%) | 21 (52.5%) |
| 4+ Person Household | 57 (87.7%) | 8 (12.3%) |
| Total Housing Units | 309 (74.1%) | 108 (25.9%) |
Occupancy by Educational Attainment in Trumbauersville borough
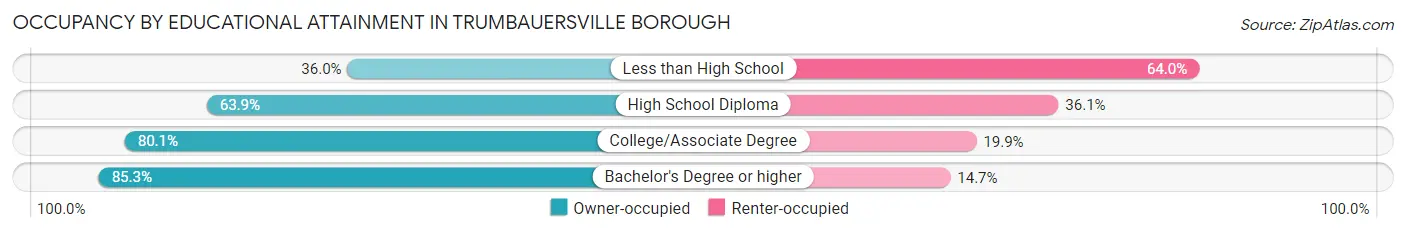
| Household Size | Owner-occupied | Renter-occupied |
| Less than High School | 9 (36.0%) | 16 (64.0%) |
| High School Diploma | 76 (63.9%) | 43 (36.1%) |
| College/Associate Degree | 137 (80.1%) | 34 (19.9%) |
| Bachelor's Degree or higher | 87 (85.3%) | 15 (14.7%) |
Occupancy by Age of Householder in Trumbauersville borough
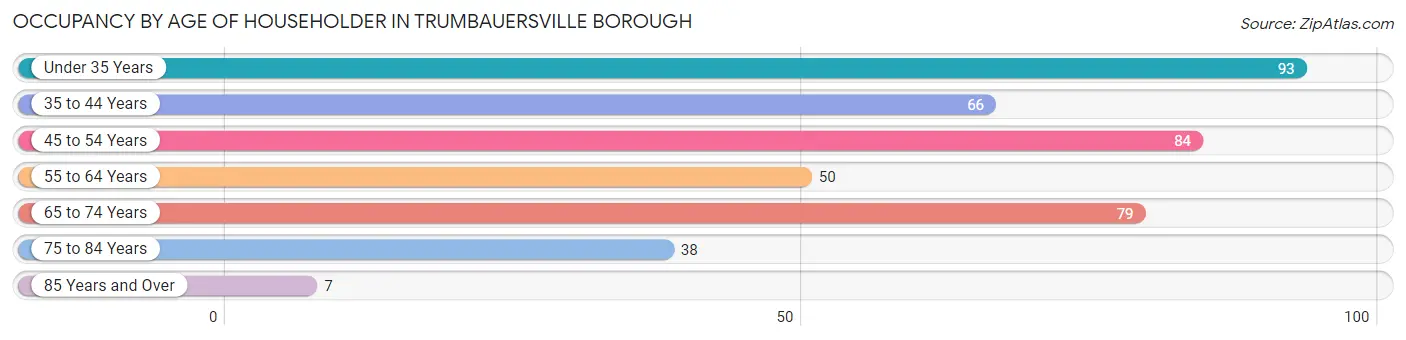
| Age Bracket | # Households | % Households |
| Under 35 Years | 93 | 22.3% |
| 35 to 44 Years | 66 | 15.8% |
| 45 to 54 Years | 84 | 20.1% |
| 55 to 64 Years | 50 | 12.0% |
| 65 to 74 Years | 79 | 18.9% |
| 75 to 84 Years | 38 | 9.1% |
| 85 Years and Over | 7 | 1.7% |
| Total | 417 | 100.0% |
Housing Finances in Trumbauersville borough
Median Income by Occupancy in Trumbauersville borough
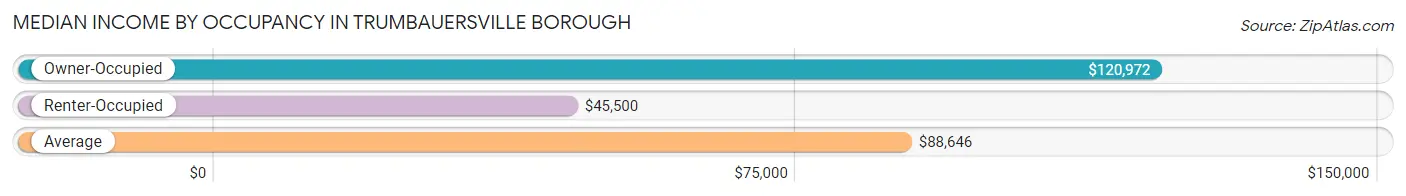
| Occupancy Type | # Households | Median Income |
| Owner-Occupied | 309 (74.1%) | $120,972 |
| Renter-Occupied | 108 (25.9%) | $45,500 |
| Average | 417 (100.0%) | $88,646 |
Occupancy by Householder Income Bracket in Trumbauersville borough
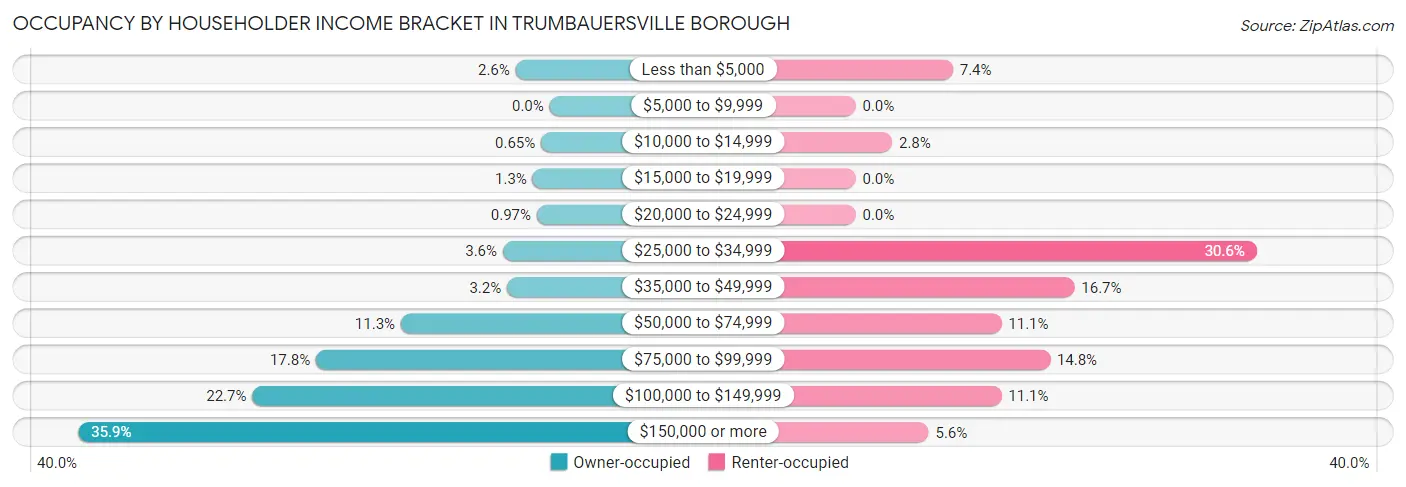
| Income Bracket | Owner-occupied | Renter-occupied |
| Less than $5,000 | 8 (2.6%) | 8 (7.4%) |
| $5,000 to $9,999 | 0 (0.0%) | 0 (0.0%) |
| $10,000 to $14,999 | 2 (0.6%) | 3 (2.8%) |
| $15,000 to $19,999 | 4 (1.3%) | 0 (0.0%) |
| $20,000 to $24,999 | 3 (1.0%) | 0 (0.0%) |
| $25,000 to $34,999 | 11 (3.6%) | 33 (30.6%) |
| $35,000 to $49,999 | 10 (3.2%) | 18 (16.7%) |
| $50,000 to $74,999 | 35 (11.3%) | 12 (11.1%) |
| $75,000 to $99,999 | 55 (17.8%) | 16 (14.8%) |
| $100,000 to $149,999 | 70 (22.7%) | 12 (11.1%) |
| $150,000 or more | 111 (35.9%) | 6 (5.6%) |
| Total | 309 (100.0%) | 108 (100.0%) |
Monthly Housing Cost Tiers in Trumbauersville borough
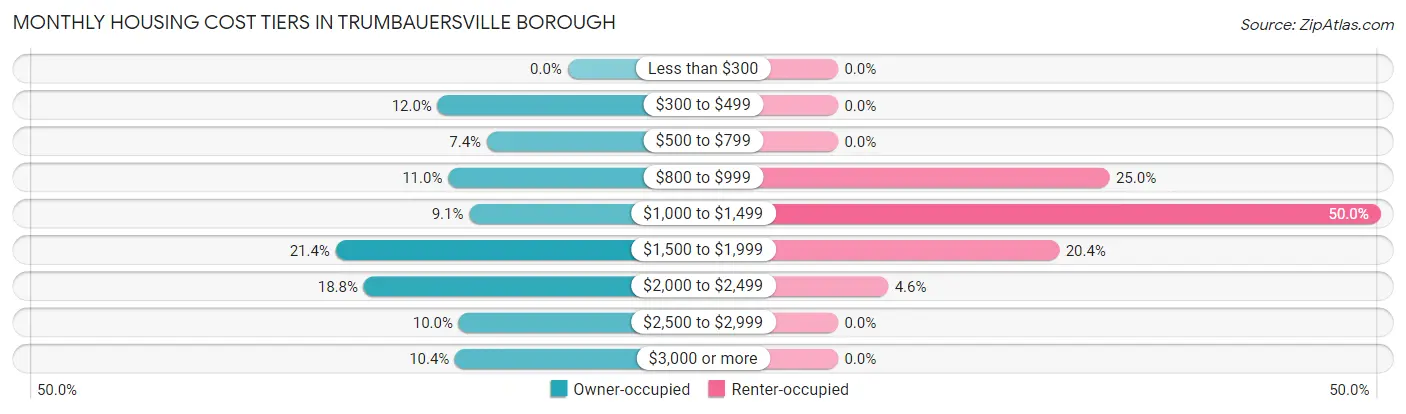
| Monthly Cost | Owner-occupied | Renter-occupied |
| Less than $300 | 0 (0.0%) | 0 (0.0%) |
| $300 to $499 | 37 (12.0%) | 0 (0.0%) |
| $500 to $799 | 23 (7.4%) | 0 (0.0%) |
| $800 to $999 | 34 (11.0%) | 27 (25.0%) |
| $1,000 to $1,499 | 28 (9.1%) | 54 (50.0%) |
| $1,500 to $1,999 | 66 (21.4%) | 22 (20.4%) |
| $2,000 to $2,499 | 58 (18.8%) | 5 (4.6%) |
| $2,500 to $2,999 | 31 (10.0%) | 0 (0.0%) |
| $3,000 or more | 32 (10.4%) | 0 (0.0%) |
| Total | 309 (100.0%) | 108 (100.0%) |
Physical Housing Characteristics in Trumbauersville borough
Housing Structures in Trumbauersville borough
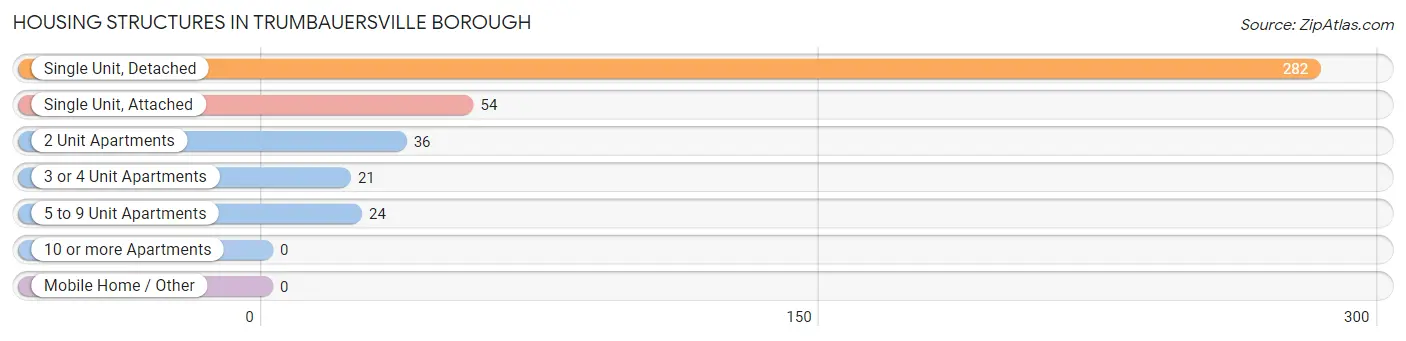
| Structure Type | # Housing Units | % Housing Units |
| Single Unit, Detached | 282 | 67.6% |
| Single Unit, Attached | 54 | 13.0% |
| 2 Unit Apartments | 36 | 8.6% |
| 3 or 4 Unit Apartments | 21 | 5.0% |
| 5 to 9 Unit Apartments | 24 | 5.8% |
| 10 or more Apartments | 0 | 0.0% |
| Mobile Home / Other | 0 | 0.0% |
| Total | 417 | 100.0% |
Housing Structures by Occupancy in Trumbauersville borough
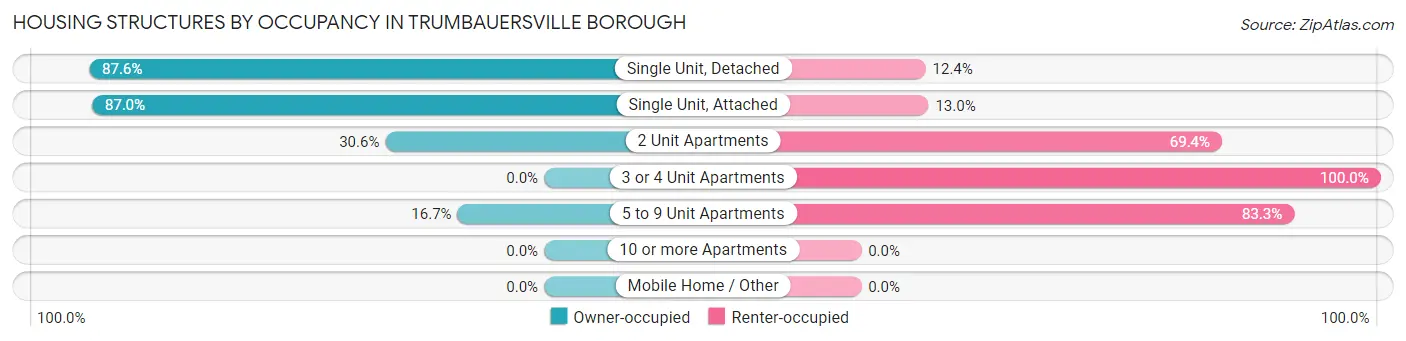
| Structure Type | Owner-occupied | Renter-occupied |
| Single Unit, Detached | 247 (87.6%) | 35 (12.4%) |
| Single Unit, Attached | 47 (87.0%) | 7 (13.0%) |
| 2 Unit Apartments | 11 (30.6%) | 25 (69.4%) |
| 3 or 4 Unit Apartments | 0 (0.0%) | 21 (100.0%) |
| 5 to 9 Unit Apartments | 4 (16.7%) | 20 (83.3%) |
| 10 or more Apartments | 0 (0.0%) | 0 (0.0%) |
| Mobile Home / Other | 0 (0.0%) | 0 (0.0%) |
| Total | 309 (74.1%) | 108 (25.9%) |
Housing Structures by Number of Rooms in Trumbauersville borough
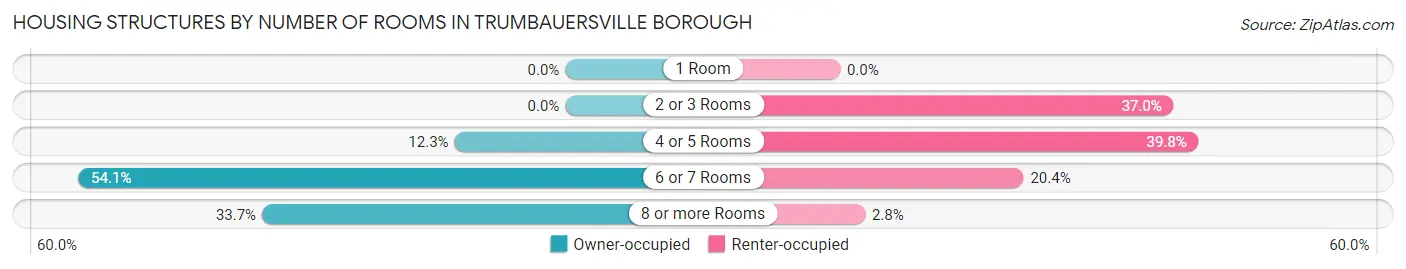
| Number of Rooms | Owner-occupied | Renter-occupied |
| 1 Room | 0 (0.0%) | 0 (0.0%) |
| 2 or 3 Rooms | 0 (0.0%) | 40 (37.0%) |
| 4 or 5 Rooms | 38 (12.3%) | 43 (39.8%) |
| 6 or 7 Rooms | 167 (54.0%) | 22 (20.4%) |
| 8 or more Rooms | 104 (33.7%) | 3 (2.8%) |
| Total | 309 (100.0%) | 108 (100.0%) |
Housing Structure by Heating Type in Trumbauersville borough
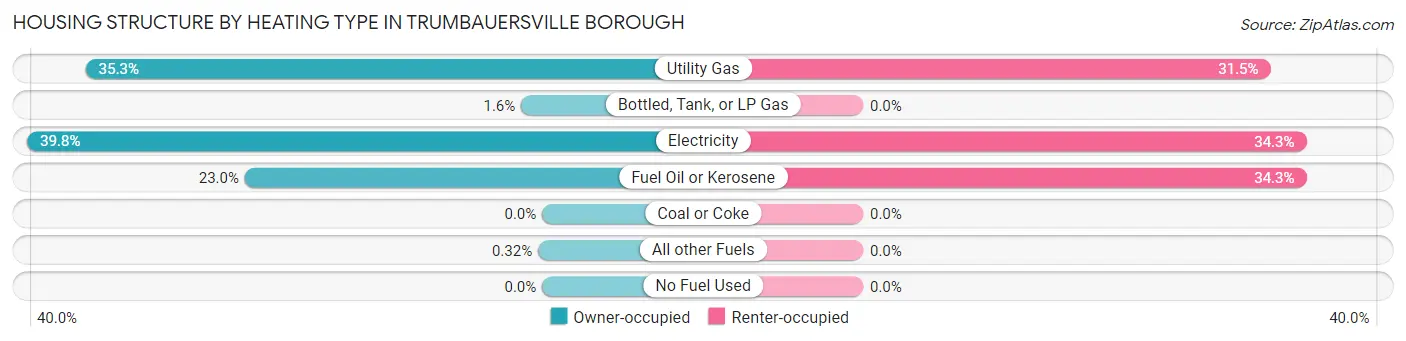
| Heating Type | Owner-occupied | Renter-occupied |
| Utility Gas | 109 (35.3%) | 34 (31.5%) |
| Bottled, Tank, or LP Gas | 5 (1.6%) | 0 (0.0%) |
| Electricity | 123 (39.8%) | 37 (34.3%) |
| Fuel Oil or Kerosene | 71 (23.0%) | 37 (34.3%) |
| Coal or Coke | 0 (0.0%) | 0 (0.0%) |
| All other Fuels | 1 (0.3%) | 0 (0.0%) |
| No Fuel Used | 0 (0.0%) | 0 (0.0%) |
| Total | 309 (100.0%) | 108 (100.0%) |
Household Vehicle Usage in Trumbauersville borough
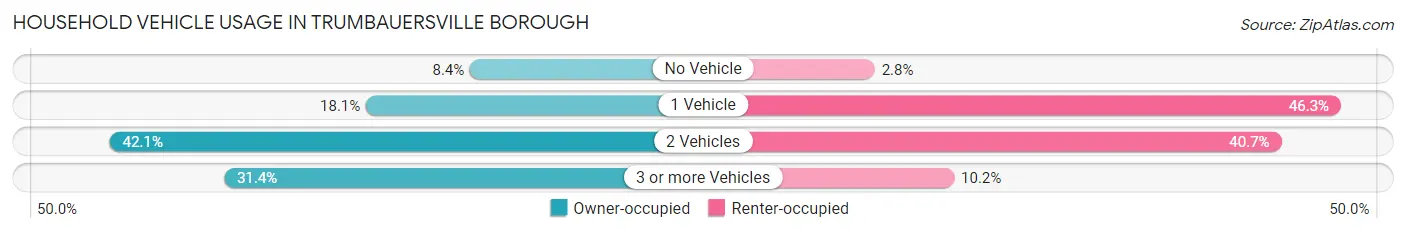
| Vehicles per Household | Owner-occupied | Renter-occupied |
| No Vehicle | 26 (8.4%) | 3 (2.8%) |
| 1 Vehicle | 56 (18.1%) | 50 (46.3%) |
| 2 Vehicles | 130 (42.1%) | 44 (40.7%) |
| 3 or more Vehicles | 97 (31.4%) | 11 (10.2%) |
| Total | 309 (100.0%) | 108 (100.0%) |
Real Estate & Mortgages in Trumbauersville borough
Real Estate and Mortgage Overview in Trumbauersville borough
| Characteristic | Without Mortgage | With Mortgage |
| Housing Units | 96 | 213 |
| Median Property Value | $284,600 | $305,900 |
| Median Household Income | - | - |
| Monthly Housing Costs | $585 | $32 |
| Real Estate Taxes | - | - |
Property Value by Mortgage Status in Trumbauersville borough
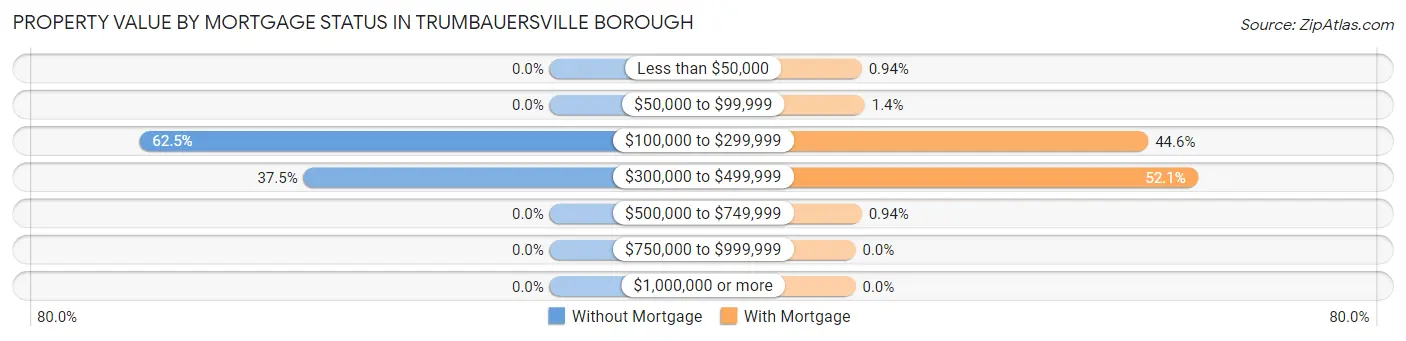
| Property Value | Without Mortgage | With Mortgage |
| Less than $50,000 | 0 (0.0%) | 2 (0.9%) |
| $50,000 to $99,999 | 0 (0.0%) | 3 (1.4%) |
| $100,000 to $299,999 | 60 (62.5%) | 95 (44.6%) |
| $300,000 to $499,999 | 36 (37.5%) | 111 (52.1%) |
| $500,000 to $749,999 | 0 (0.0%) | 2 (0.9%) |
| $750,000 to $999,999 | 0 (0.0%) | 0 (0.0%) |
| $1,000,000 or more | 0 (0.0%) | 0 (0.0%) |
| Total | 96 (100.0%) | 213 (100.0%) |
Household Income by Mortgage Status in Trumbauersville borough
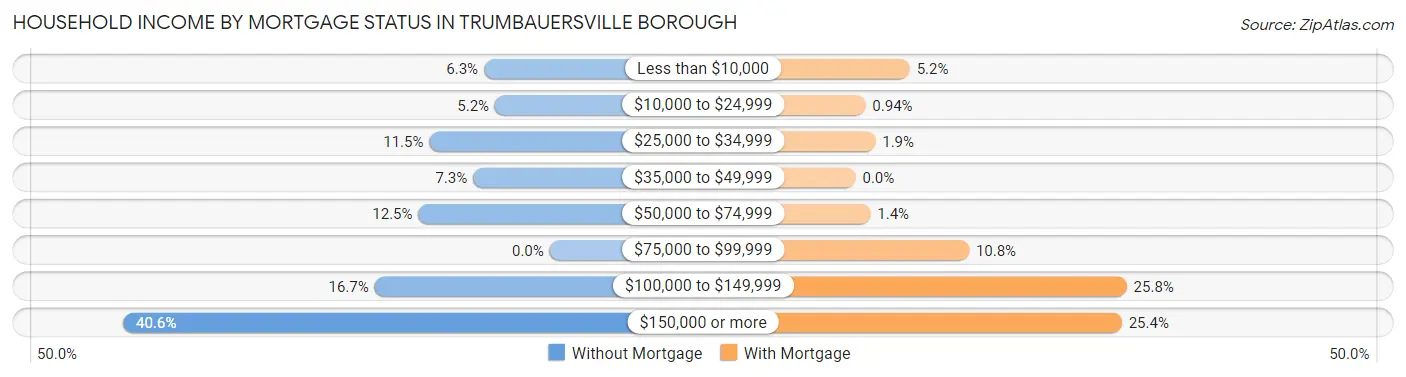
| Household Income | Without Mortgage | With Mortgage |
| Less than $10,000 | 6 (6.2%) | 11 (5.2%) |
| $10,000 to $24,999 | 5 (5.2%) | 2 (0.9%) |
| $25,000 to $34,999 | 11 (11.5%) | 4 (1.9%) |
| $35,000 to $49,999 | 7 (7.3%) | 0 (0.0%) |
| $50,000 to $74,999 | 12 (12.5%) | 3 (1.4%) |
| $75,000 to $99,999 | 0 (0.0%) | 23 (10.8%) |
| $100,000 to $149,999 | 16 (16.7%) | 55 (25.8%) |
| $150,000 or more | 39 (40.6%) | 54 (25.4%) |
| Total | 96 (100.0%) | 213 (100.0%) |
Property Value to Household Income Ratio in Trumbauersville borough
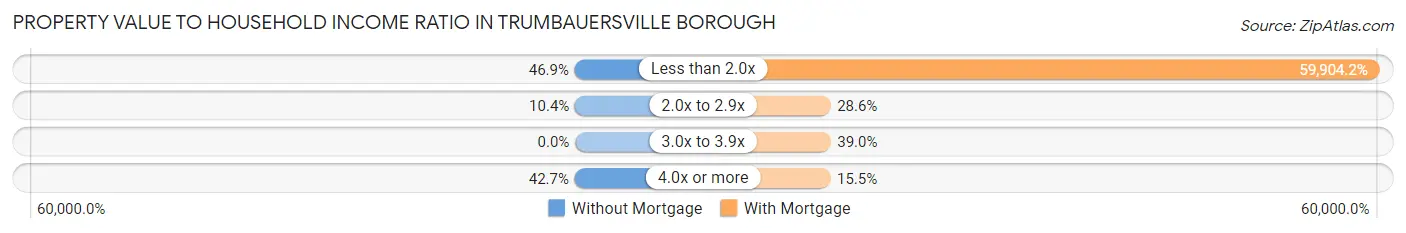
| Value-to-Income Ratio | Without Mortgage | With Mortgage |
| Less than 2.0x | 45 (46.9%) | 127,596 (59,904.2%) |
| 2.0x to 2.9x | 10 (10.4%) | 61 (28.6%) |
| 3.0x to 3.9x | 0 (0.0%) | 83 (39.0%) |
| 4.0x or more | 41 (42.7%) | 33 (15.5%) |
| Total | 96 (100.0%) | 213 (100.0%) |
Real Estate Taxes by Mortgage Status in Trumbauersville borough
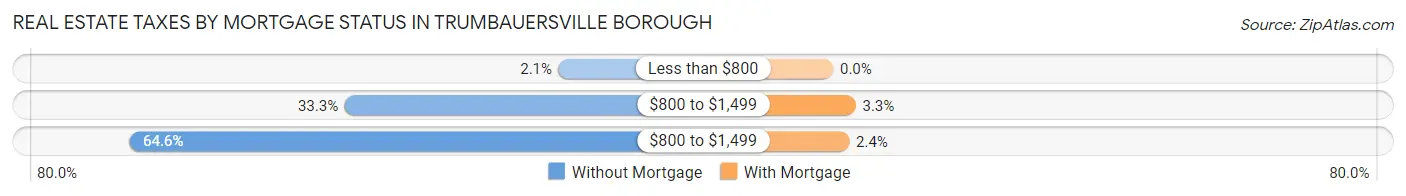
| Property Taxes | Without Mortgage | With Mortgage |
| Less than $800 | 2 (2.1%) | 0 (0.0%) |
| $800 to $1,499 | 32 (33.3%) | 7 (3.3%) |
| $800 to $1,499 | 62 (64.6%) | 5 (2.4%) |
| Total | 96 (100.0%) | 213 (100.0%) |
Health & Disability in Trumbauersville borough
Health Insurance Coverage by Age in Trumbauersville borough
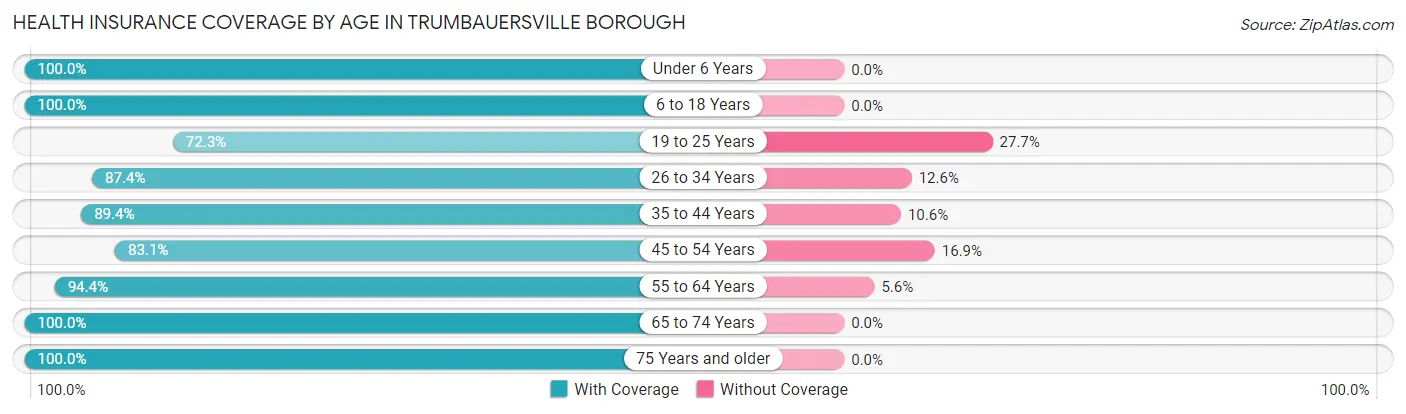
| Age Bracket | With Coverage | Without Coverage |
| Under 6 Years | 34 (100.0%) | 0 (0.0%) |
| 6 to 18 Years | 110 (100.0%) | 0 (0.0%) |
| 19 to 25 Years | 34 (72.3%) | 13 (27.7%) |
| 26 to 34 Years | 132 (87.4%) | 19 (12.6%) |
| 35 to 44 Years | 110 (89.4%) | 13 (10.6%) |
| 45 to 54 Years | 123 (83.1%) | 25 (16.9%) |
| 55 to 64 Years | 134 (94.4%) | 8 (5.6%) |
| 65 to 74 Years | 110 (100.0%) | 0 (0.0%) |
| 75 Years and older | 59 (100.0%) | 0 (0.0%) |
| Total | 846 (91.6%) | 78 (8.4%) |
Health Insurance Coverage by Citizenship Status in Trumbauersville borough
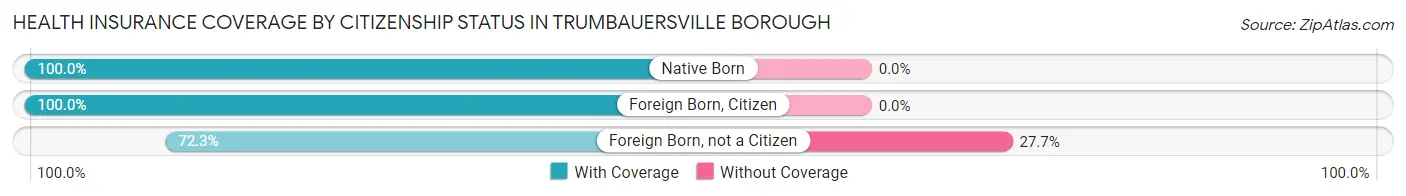
| Citizenship Status | With Coverage | Without Coverage |
| Native Born | 34 (100.0%) | 0 (0.0%) |
| Foreign Born, Citizen | 110 (100.0%) | 0 (0.0%) |
| Foreign Born, not a Citizen | 34 (72.3%) | 13 (27.7%) |
Health Insurance Coverage by Household Income in Trumbauersville borough
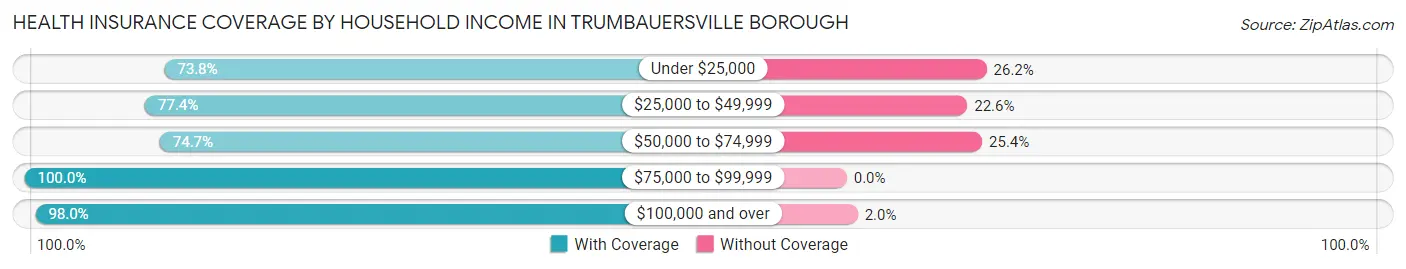
| Household Income | With Coverage | Without Coverage |
| Under $25,000 | 31 (73.8%) | 11 (26.2%) |
| $25,000 to $49,999 | 72 (77.4%) | 21 (22.6%) |
| $50,000 to $74,999 | 106 (74.7%) | 36 (25.4%) |
| $75,000 to $99,999 | 147 (100.0%) | 0 (0.0%) |
| $100,000 and over | 481 (98.0%) | 10 (2.0%) |
Public vs Private Health Insurance Coverage by Age in Trumbauersville borough
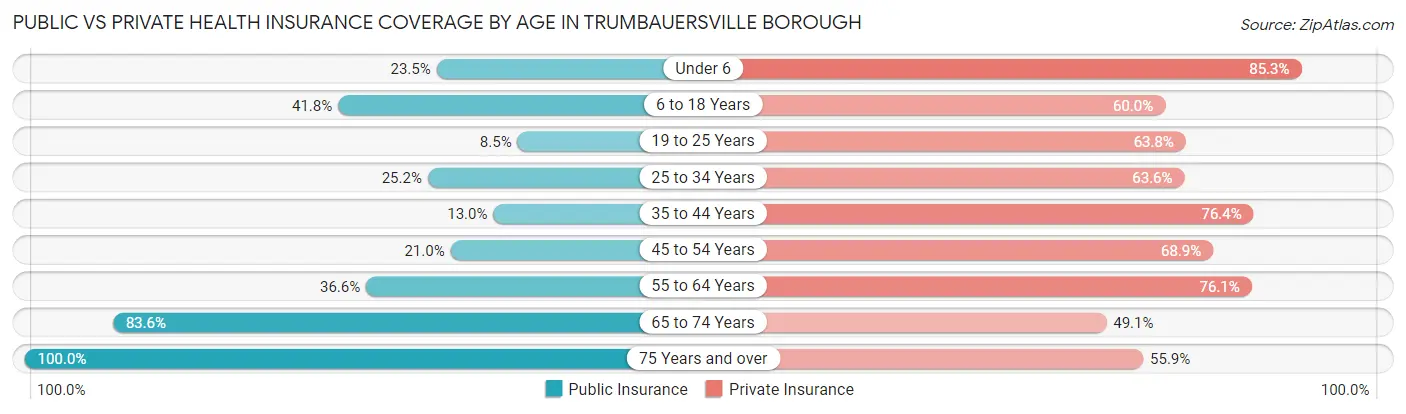
| Age Bracket | Public Insurance | Private Insurance |
| Under 6 | 8 (23.5%) | 29 (85.3%) |
| 6 to 18 Years | 46 (41.8%) | 66 (60.0%) |
| 19 to 25 Years | 4 (8.5%) | 30 (63.8%) |
| 25 to 34 Years | 38 (25.2%) | 96 (63.6%) |
| 35 to 44 Years | 16 (13.0%) | 94 (76.4%) |
| 45 to 54 Years | 31 (20.9%) | 102 (68.9%) |
| 55 to 64 Years | 52 (36.6%) | 108 (76.1%) |
| 65 to 74 Years | 92 (83.6%) | 54 (49.1%) |
| 75 Years and over | 59 (100.0%) | 33 (55.9%) |
| Total | 346 (37.4%) | 612 (66.2%) |
Disability Status by Sex by Age in Trumbauersville borough
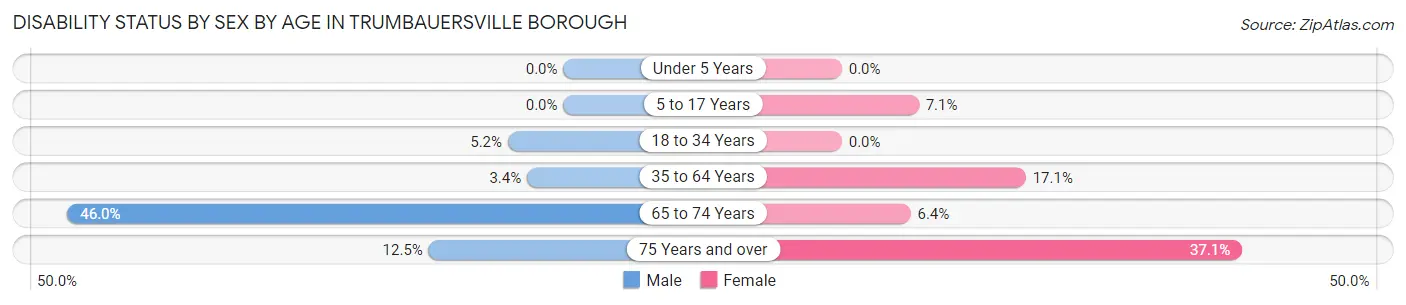
| Age Bracket | Male | Female |
| Under 5 Years | 0 (0.0%) | 0 (0.0%) |
| 5 to 17 Years | 0 (0.0%) | 3 (7.1%) |
| 18 to 34 Years | 7 (5.1%) | 0 (0.0%) |
| 35 to 64 Years | 7 (3.4%) | 35 (17.1%) |
| 65 to 74 Years | 29 (46.0%) | 3 (6.4%) |
| 75 Years and over | 3 (12.5%) | 13 (37.1%) |
Disability Class by Sex by Age in Trumbauersville borough
Disability Class: Hearing Difficulty
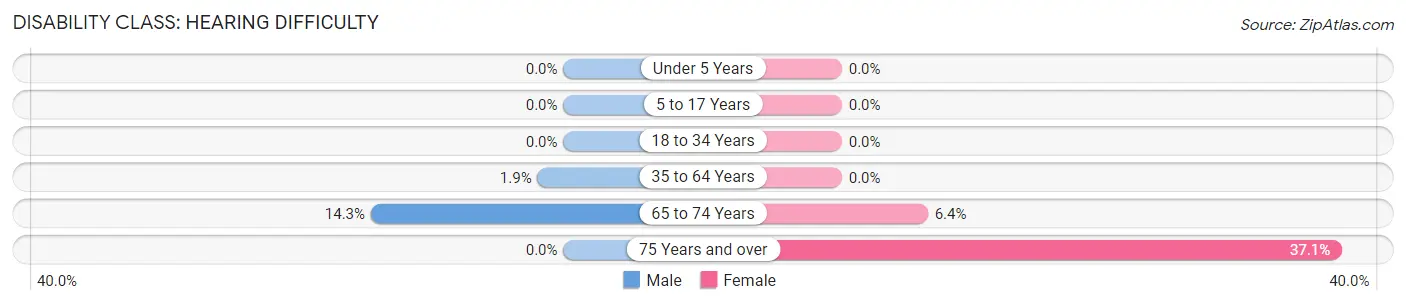
| Age Bracket | Male | Female |
| Under 5 Years | 0 (0.0%) | 0 (0.0%) |
| 5 to 17 Years | 0 (0.0%) | 0 (0.0%) |
| 18 to 34 Years | 0 (0.0%) | 0 (0.0%) |
| 35 to 64 Years | 4 (1.9%) | 0 (0.0%) |
| 65 to 74 Years | 9 (14.3%) | 3 (6.4%) |
| 75 Years and over | 0 (0.0%) | 13 (37.1%) |
Disability Class: Vision Difficulty
| Age Bracket | Male | Female |
| Under 5 Years | 0 (0.0%) | 0 (0.0%) |
| 5 to 17 Years | 0 (0.0%) | 0 (0.0%) |
| 18 to 34 Years | 0 (0.0%) | 0 (0.0%) |
| 35 to 64 Years | 0 (0.0%) | 0 (0.0%) |
| 65 to 74 Years | 0 (0.0%) | 0 (0.0%) |
| 75 Years and over | 0 (0.0%) | 0 (0.0%) |
Disability Class: Cognitive Difficulty
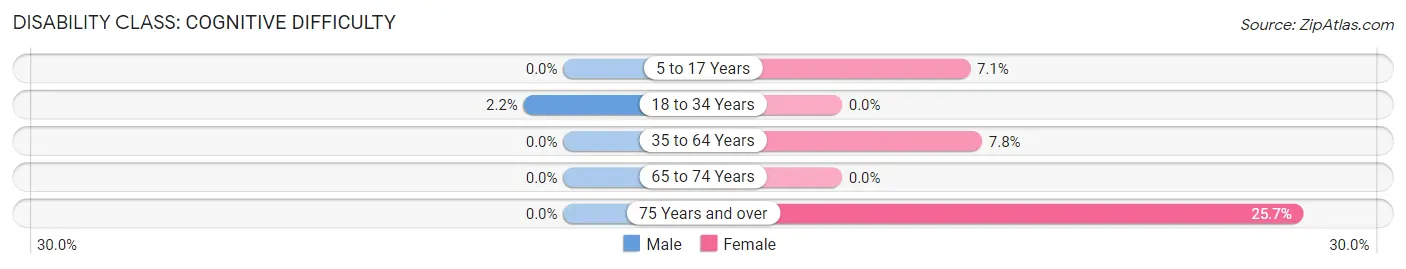
| Age Bracket | Male | Female |
| 5 to 17 Years | 0 (0.0%) | 3 (7.1%) |
| 18 to 34 Years | 3 (2.2%) | 0 (0.0%) |
| 35 to 64 Years | 0 (0.0%) | 16 (7.8%) |
| 65 to 74 Years | 0 (0.0%) | 0 (0.0%) |
| 75 Years and over | 0 (0.0%) | 9 (25.7%) |
Disability Class: Ambulatory Difficulty
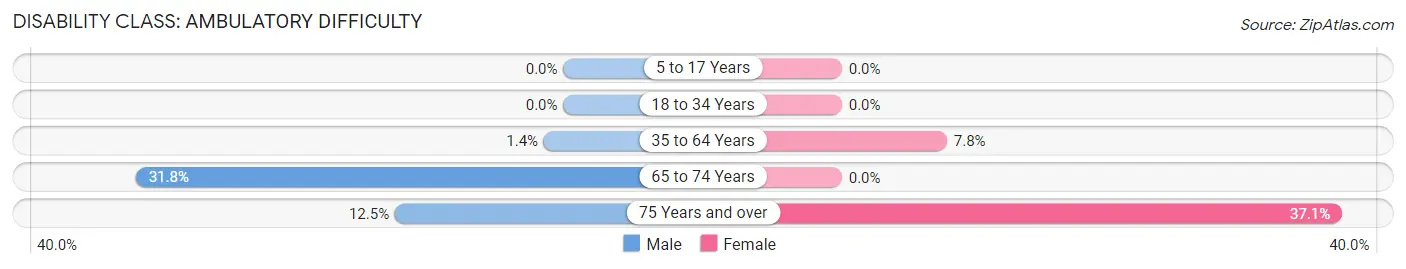
| Age Bracket | Male | Female |
| 5 to 17 Years | 0 (0.0%) | 0 (0.0%) |
| 18 to 34 Years | 0 (0.0%) | 0 (0.0%) |
| 35 to 64 Years | 3 (1.4%) | 16 (7.8%) |
| 65 to 74 Years | 20 (31.8%) | 0 (0.0%) |
| 75 Years and over | 3 (12.5%) | 13 (37.1%) |
Disability Class: Self-Care Difficulty
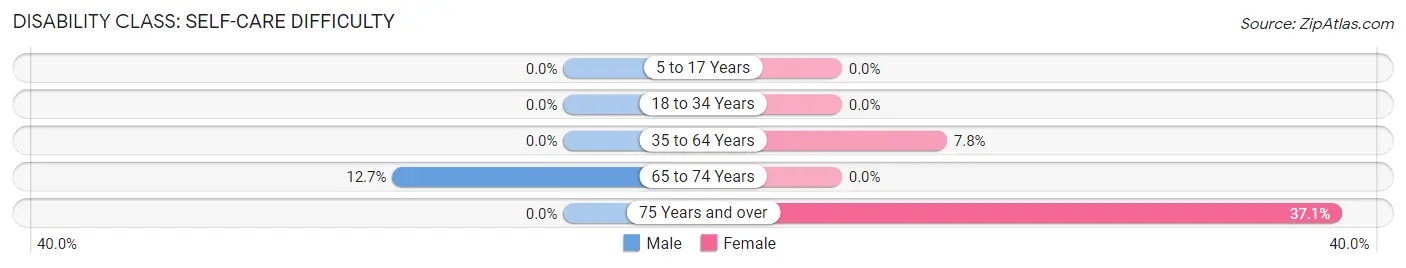
| Age Bracket | Male | Female |
| 5 to 17 Years | 0 (0.0%) | 0 (0.0%) |
| 18 to 34 Years | 0 (0.0%) | 0 (0.0%) |
| 35 to 64 Years | 0 (0.0%) | 16 (7.8%) |
| 65 to 74 Years | 8 (12.7%) | 0 (0.0%) |
| 75 Years and over | 0 (0.0%) | 13 (37.1%) |
Technology Access in Trumbauersville borough
Computing Device Access in Trumbauersville borough
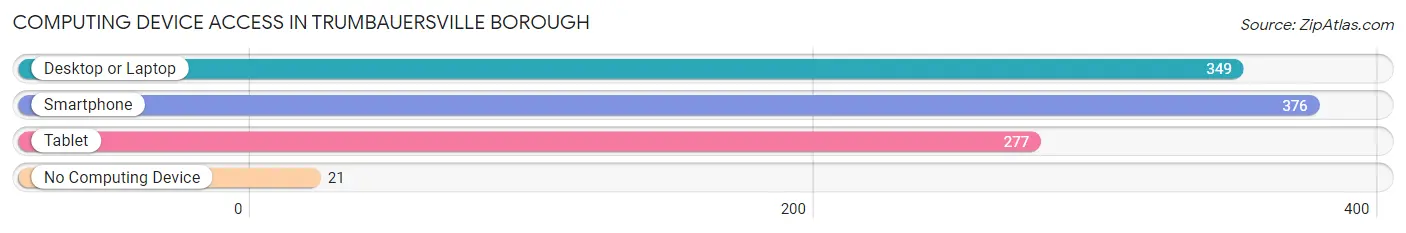
| Device Type | # Households | % Households |
| Desktop or Laptop | 349 | 83.7% |
| Smartphone | 376 | 90.2% |
| Tablet | 277 | 66.4% |
| No Computing Device | 21 | 5.0% |
| Total | 417 | 100.0% |
Internet Access in Trumbauersville borough
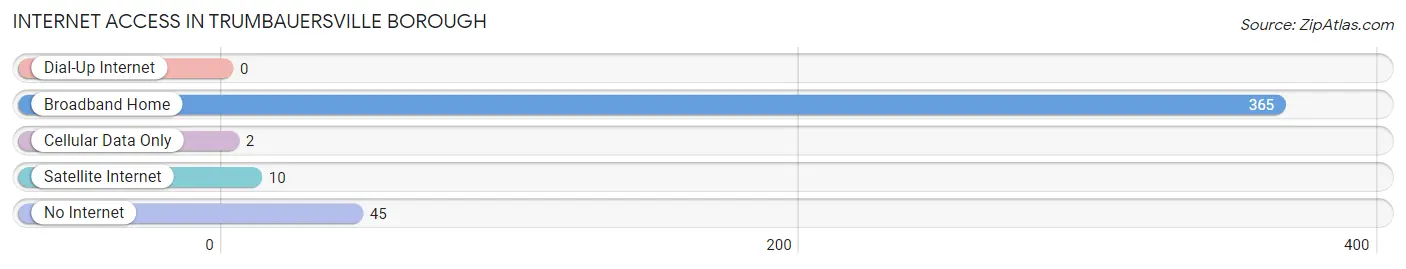
| Internet Type | # Households | % Households |
| Dial-Up Internet | 0 | 0.0% |
| Broadband Home | 365 | 87.5% |
| Cellular Data Only | 2 | 0.5% |
| Satellite Internet | 10 | 2.4% |
| No Internet | 45 | 10.8% |
| Total | 417 | 100.0% |
Trumbauersville borough Summary
Trumbauersville Borough is a small borough located in Bucks County, Pennsylvania. It is situated in the northern part of the county, approximately 25 miles north of Philadelphia. The borough is bordered by Milford Township to the north, Richland Township to the east, Quakertown Borough to the south, and Perkasie Borough to the west. As of the 2010 census, the population of Trumbauersville was 1,817.
History
Trumbauersville was founded in 1845 by John Trumbauer, a German immigrant who had settled in the area in 1832. Trumbauer purchased a large tract of land in the area and began to develop it into a small village. He built a grist mill, a saw mill, a store, and a post office. The village was named after him and was incorporated as a borough in 1876.
Trumbauersville was a rural farming community for much of its history. The borough was home to several small businesses, including a blacksmith shop, a general store, and a hotel. The village also had a school, a church, and a fire company.
In the late 19th century, the borough began to experience a period of growth and development. The population increased from just over 500 in 1880 to nearly 1,000 by 1900. The borough was connected to the rest of Bucks County by the North Pennsylvania Railroad in 1891. This allowed for the development of new businesses and industries, such as a brickyard, a canning factory, and a furniture factory.
Geography
Trumbauersville is located at 40°25'N 75°17'W (40.4167, -75.2833). The borough has a total area of 0.7 square miles, all of which is land. The borough is located in the northern part of Bucks County, approximately 25 miles north of Philadelphia. It is bordered by Milford Township to the north, Richland Township to the east, Quakertown Borough to the south, and Perkasie Borough to the west.
The borough is located in the Delaware River watershed. The borough is drained by the Tohickon Creek, which flows through the borough from the north to the south. The creek is a tributary of the Delaware River.
Economy
Trumbauersville is a small, rural borough with a population of just over 1,800. The borough is home to several small businesses, including a general store, a hardware store, a restaurant, and a bar. The borough also has a post office and a fire company.
The borough is home to several small manufacturing companies, including a furniture factory, a canning factory, and a brickyard. The borough is also home to a number of farms, which produce a variety of crops, including corn, soybeans, and hay.
Demographics
As of the 2010 census, the population of Trumbauersville was 1,817. The racial makeup of the borough was 97.2% White, 0.7% African American, 0.2% Native American, 0.4% Asian, 0.1% Pacific Islander, 0.4% from other races, and 1.0% from two or more races. Hispanic or Latino of any race were 1.7% of the population.
The median household income in Trumbauersville was $50,938, and the median family income was $60,000. The per capita income for the borough was $25,938. About 4.3% of families and 5.7% of the population were below the poverty line, including 8.3% of those under age 18 and 4.2% of those age 65 or over.
Common Questions
What is Per Capita Income in Trumbauersville borough?
Per Capita income in Trumbauersville borough is $53,403.
What is the Median Family Income in Trumbauersville borough?
Median Family Income in Trumbauersville borough is $123,750.
What is the Median Household income in Trumbauersville borough?
Median Household Income in Trumbauersville borough is $88,646.
What is Income or Wage Gap in Trumbauersville borough?
Income or Wage Gap in Trumbauersville borough is 38.0%.
Women in Trumbauersville borough earn 62.0 cents for every dollar earned by a man.
What is Inequality or Gini Index in Trumbauersville borough?
Inequality or Gini Index in Trumbauersville borough is 0.38.
What is the Total Population of Trumbauersville borough?
Total Population of Trumbauersville borough is 924.
What is the Total Male Population of Trumbauersville borough?
Total Male Population of Trumbauersville borough is 498.
What is the Total Female Population of Trumbauersville borough?
Total Female Population of Trumbauersville borough is 426.
What is the Ratio of Males per 100 Females in Trumbauersville borough?
There are 116.90 Males per 100 Females in Trumbauersville borough.
What is the Ratio of Females per 100 Males in Trumbauersville borough?
There are 85.54 Females per 100 Males in Trumbauersville borough.
What is the Median Population Age in Trumbauersville borough?
Median Population Age in Trumbauersville borough is 44.9 Years.
What is the Average Family Size in Trumbauersville borough
Average Family Size in Trumbauersville borough is 2.7 People.
What is the Average Household Size in Trumbauersville borough
Average Household Size in Trumbauersville borough is 2.2 People.
How Large is the Labor Force in Trumbauersville borough?
There are 587 People in the Labor Forcein in Trumbauersville borough.
What is the Percentage of People in the Labor Force in Trumbauersville borough?
71.2% of People are in the Labor Force in Trumbauersville borough.
What is the Unemployment Rate in Trumbauersville borough?
Unemployment Rate in Trumbauersville borough is 2.4%.