Berwick borough, PA Map & Demographics
Berwick borough Overview
$27,673
PER CAPITA INCOME
$52,706
AVG FAMILY INCOME
$46,505
AVG HOUSEHOLD INCOME
34.4%
WAGE / INCOME GAP [ % ]
65.6¢/ $1
WAGE / INCOME GAP [ $ ]
0.44
INEQUALITY / GINI INDEX
10,318
TOTAL POPULATION
5,130
MALE POPULATION
5,188
FEMALE POPULATION
98.88
MALES / 100 FEMALES
101.13
FEMALES / 100 MALES
41.7
MEDIAN AGE
2.8
AVG FAMILY SIZE
2.2
AVG HOUSEHOLD SIZE
5,211
LABOR FORCE [ PEOPLE ]
60.2%
PERCENT IN LABOR FORCE
4.0%
UNEMPLOYMENT RATE
Income in Berwick borough
Income Overview in Berwick borough
Per Capita Income in Berwick borough is $27,673, while median incomes of families and households are $52,706 and $46,505 respectively.
| Characteristic | Number | Measure |
| Per Capita Income | 10,318 | $27,673 |
| Median Family Income | 2,664 | $52,706 |
| Mean Family Income | 2,664 | $71,244 |
| Median Household Income | 4,557 | $46,505 |
| Mean Household Income | 4,557 | $61,485 |
| Income Deficit | 2,664 | $0 |
| Wage / Income Gap (%) | 10,318 | 34.44% |
| Wage / Income Gap ($) | 10,318 | 65.56¢ per $1 |
| Gini / Inequality Index | 10,318 | 0.44 |
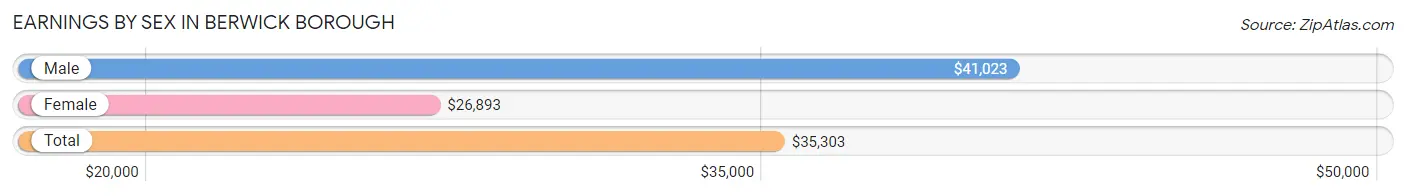
Earnings by Sex in Berwick borough
Average Earnings in Berwick borough are $35,303, $41,023 for men and $26,893 for women, a difference of 34.4%.
| Sex | Number | Average Earnings |
| Male | 2,617 (49.7%) | $41,023 |
| Female | 2,647 (50.3%) | $26,893 |
| Total | 5,264 (100.0%) | $35,303 |
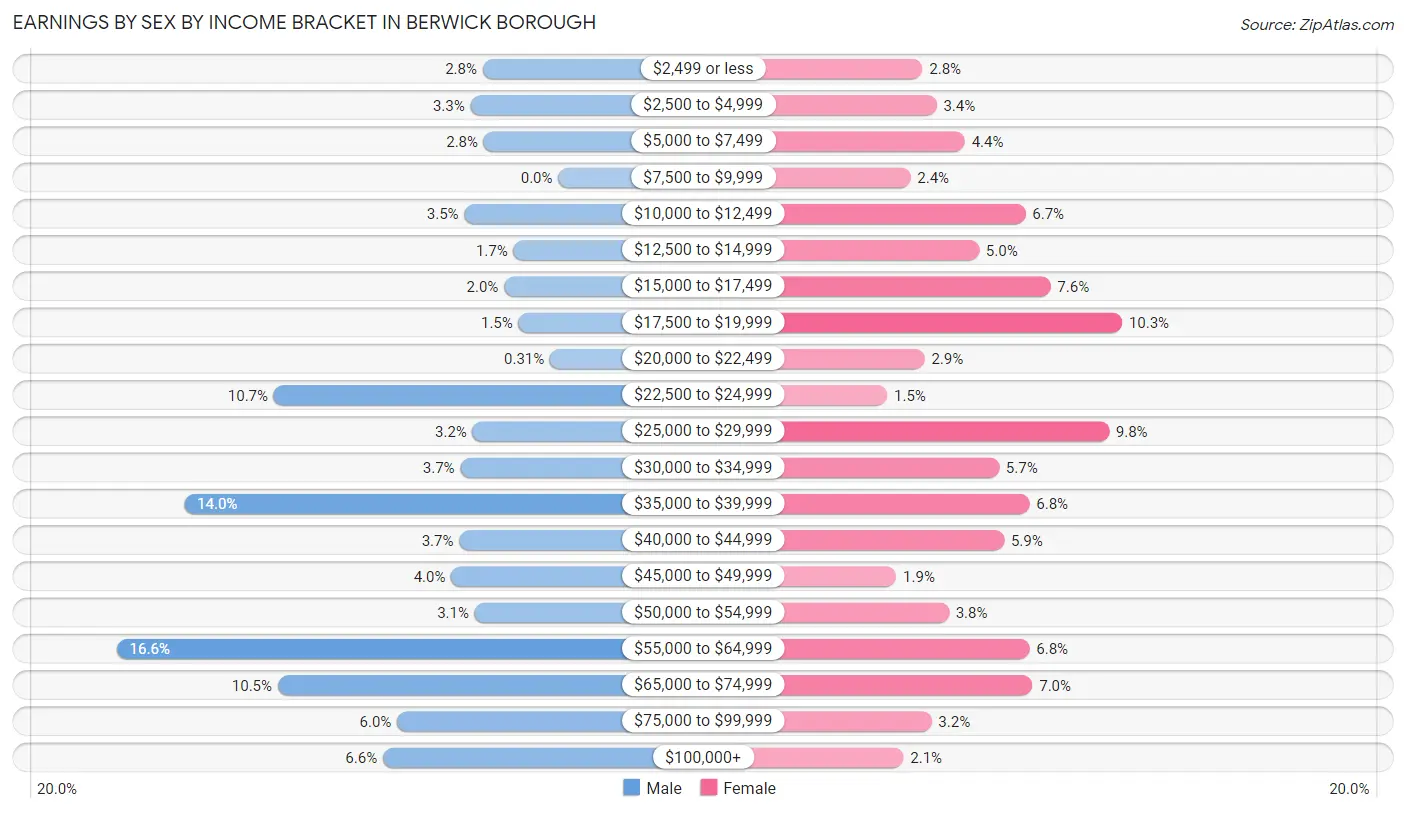
Earnings by Sex by Income Bracket in Berwick borough
The most common earnings brackets in Berwick borough are $55,000 to $64,999 for men (433 | 16.6%) and $17,500 to $19,999 for women (273 | 10.3%).
| Income | Male | Female |
| $2,499 or less | 74 (2.8%) | 75 (2.8%) |
| $2,500 to $4,999 | 86 (3.3%) | 89 (3.4%) |
| $5,000 to $7,499 | 73 (2.8%) | 117 (4.4%) |
| $7,500 to $9,999 | 0 (0.0%) | 63 (2.4%) |
| $10,000 to $12,499 | 92 (3.5%) | 177 (6.7%) |
| $12,500 to $14,999 | 44 (1.7%) | 131 (5.0%) |
| $15,000 to $17,499 | 53 (2.0%) | 202 (7.6%) |
| $17,500 to $19,999 | 39 (1.5%) | 273 (10.3%) |
| $20,000 to $22,499 | 8 (0.3%) | 77 (2.9%) |
| $22,500 to $24,999 | 279 (10.7%) | 40 (1.5%) |
| $25,000 to $29,999 | 84 (3.2%) | 260 (9.8%) |
| $30,000 to $34,999 | 96 (3.7%) | 151 (5.7%) |
| $35,000 to $39,999 | 367 (14.0%) | 181 (6.8%) |
| $40,000 to $44,999 | 97 (3.7%) | 156 (5.9%) |
| $45,000 to $49,999 | 105 (4.0%) | 49 (1.8%) |
| $50,000 to $54,999 | 82 (3.1%) | 101 (3.8%) |
| $55,000 to $64,999 | 433 (16.6%) | 181 (6.8%) |
| $65,000 to $74,999 | 275 (10.5%) | 184 (7.0%) |
| $75,000 to $99,999 | 158 (6.0%) | 84 (3.2%) |
| $100,000+ | 172 (6.6%) | 56 (2.1%) |
| Total | 2,617 (100.0%) | 2,647 (100.0%) |
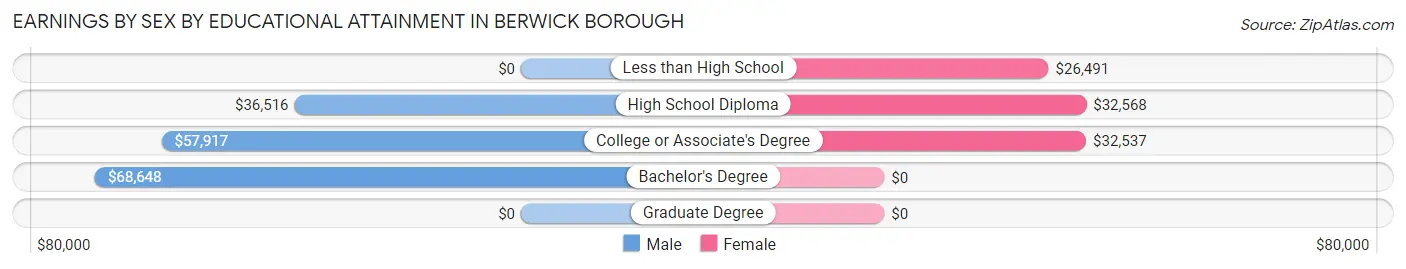
Earnings by Sex by Educational Attainment in Berwick borough
Average earnings in Berwick borough are $45,015 for men and $29,620 for women, a difference of 34.2%. Men with an educational attainment of bachelor's degree enjoy the highest average annual earnings of $68,648, while those with high school diploma education earn the least with $36,516. Women with an educational attainment of high school diploma earn the most with the average annual earnings of $32,568, while those with less than high school education have the smallest earnings of $26,491.
| Educational Attainment | Male Income | Female Income |
| Less than High School | - | - |
| High School Diploma | $36,516 | $32,568 |
| College or Associate's Degree | $57,917 | $32,537 |
| Bachelor's Degree | $68,648 | $0 |
| Graduate Degree | - | - |
| Total | $45,015 | $29,620 |
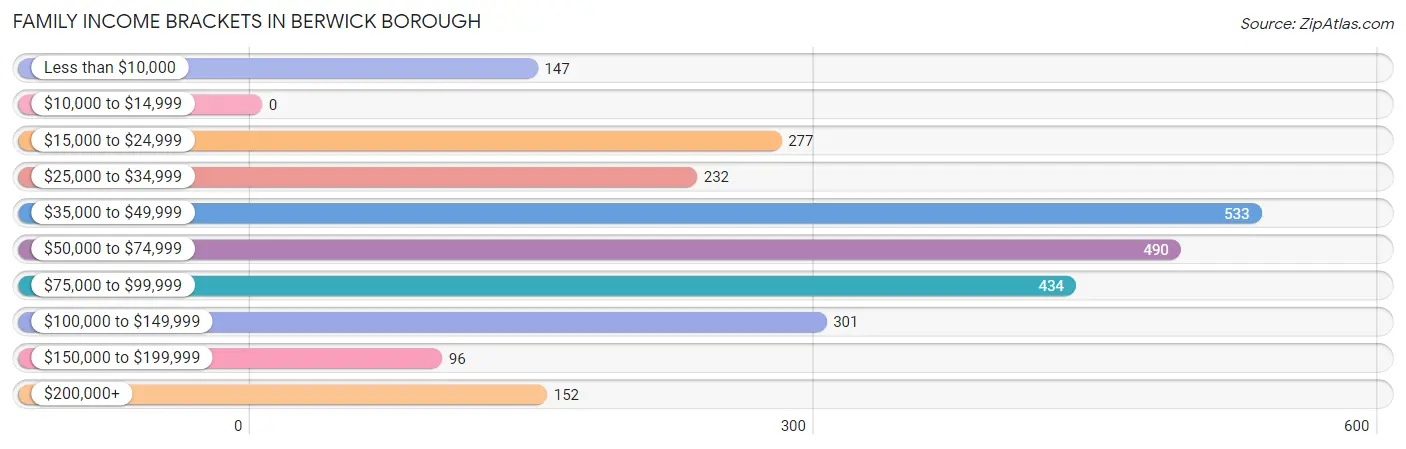
Family Income in Berwick borough
Family Income Brackets in Berwick borough
According to the Berwick borough family income data, there are 533 families falling into the $35,000 to $49,999 income range, which is the most common income bracket and makes up 20.0% of all families.
| Income Bracket | # Families | % Families |
| Less than $10,000 | 147 | 5.5% |
| $10,000 to $14,999 | 0 | 0.0% |
| $15,000 to $24,999 | 277 | 10.4% |
| $25,000 to $34,999 | 232 | 8.7% |
| $35,000 to $49,999 | 533 | 20.0% |
| $50,000 to $74,999 | 490 | 18.4% |
| $75,000 to $99,999 | 434 | 16.3% |
| $100,000 to $149,999 | 301 | 11.3% |
| $150,000 to $199,999 | 96 | 3.6% |
| $200,000+ | 152 | 5.7% |
Family Income by Famaliy Size in Berwick borough
5-person families (113 | 4.2%) account for the highest median family income in Berwick borough with $98,484 per family, while 2-person families (1,328 | 49.8%) have the highest median income of $21,767 per family member.
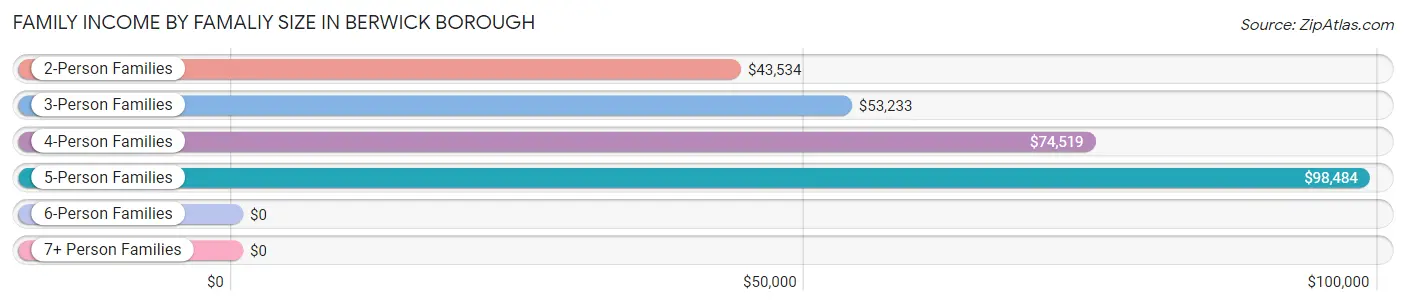
| Income Bracket | # Families | Median Income |
| 2-Person Families | 1,328 (49.8%) | $43,534 |
| 3-Person Families | 749 (28.1%) | $53,233 |
| 4-Person Families | 429 (16.1%) | $74,519 |
| 5-Person Families | 113 (4.2%) | $98,484 |
| 6-Person Families | 27 (1.0%) | $0 |
| 7+ Person Families | 18 (0.7%) | $0 |
| Total | 2,664 (100.0%) | $52,706 |
Family Income by Number of Earners in Berwick borough
The median family income in Berwick borough is $52,706, with families comprising 3+ earners (110) having the highest median family income of $145,800, while families with no earners (399) have the lowest median family income of $37,906, accounting for 4.1% and 15.0% of families, respectively.
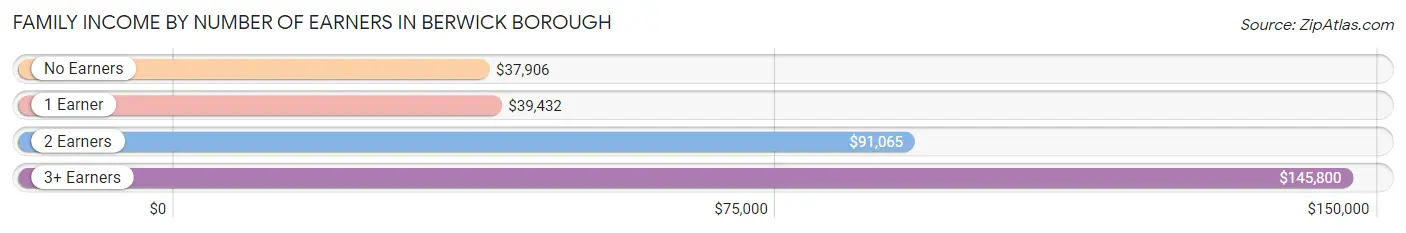
| Number of Earners | # Families | Median Income |
| No Earners | 399 (15.0%) | $37,906 |
| 1 Earner | 1,206 (45.3%) | $39,432 |
| 2 Earners | 949 (35.6%) | $91,065 |
| 3+ Earners | 110 (4.1%) | $145,800 |
| Total | 2,664 (100.0%) | $52,706 |
Household Income in Berwick borough
Household Income Brackets in Berwick borough
With 930 households falling in the category, the $35,000 to $49,999 income range is the most frequent in Berwick borough, accounting for 20.4% of all households. In contrast, only 137 households (3.0%) fall into the $150,000 to $199,999 income bracket, making it the least populous group.
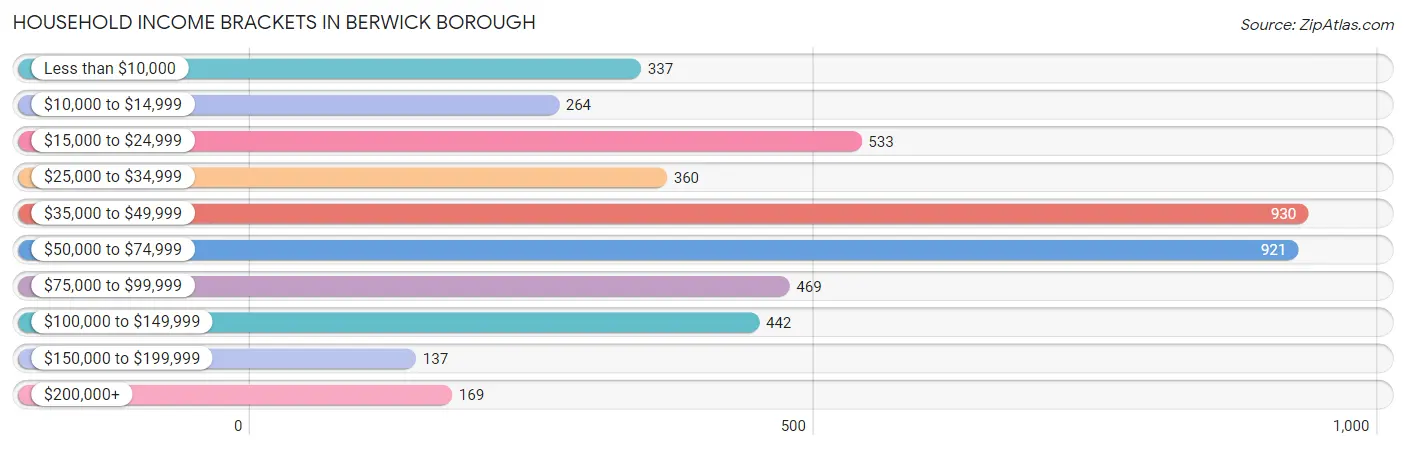
| Income Bracket | # Households | % Households |
| Less than $10,000 | 337 | 7.4% |
| $10,000 to $14,999 | 264 | 5.8% |
| $15,000 to $24,999 | 533 | 11.7% |
| $25,000 to $34,999 | 360 | 7.9% |
| $35,000 to $49,999 | 930 | 20.4% |
| $50,000 to $74,999 | 921 | 20.2% |
| $75,000 to $99,999 | 469 | 10.3% |
| $100,000 to $149,999 | 442 | 9.7% |
| $150,000 to $199,999 | 137 | 3.0% |
| $200,000+ | 169 | 3.7% |
Household Income by Householder Age in Berwick borough
The median household income in Berwick borough is $46,505, with the highest median household income of $60,063 found in the 25 to 44 years age bracket for the primary householder. A total of 1,242 households (27.3%) fall into this category. Meanwhile, the 65+ years age bracket for the primary householder has the lowest median household income of $38,214, with 1,262 households (27.7%) in this group.
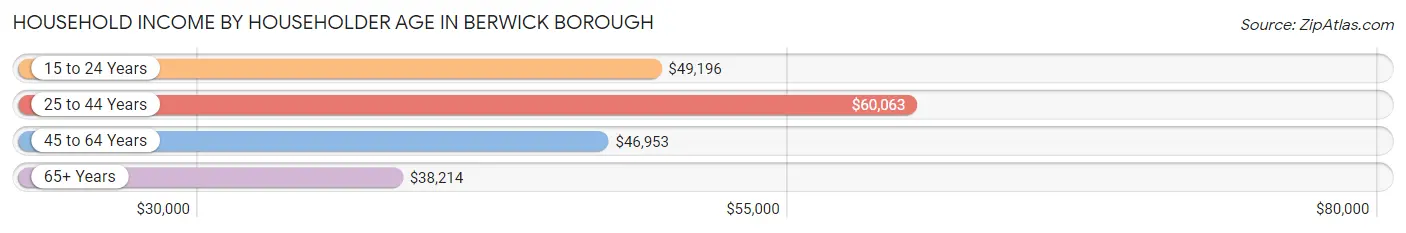
| Income Bracket | # Households | Median Income |
| 15 to 24 Years | 328 (7.2%) | $49,196 |
| 25 to 44 Years | 1,242 (27.3%) | $60,063 |
| 45 to 64 Years | 1,725 (37.9%) | $46,953 |
| 65+ Years | 1,262 (27.7%) | $38,214 |
| Total | 4,557 (100.0%) | $46,505 |
Poverty in Berwick borough
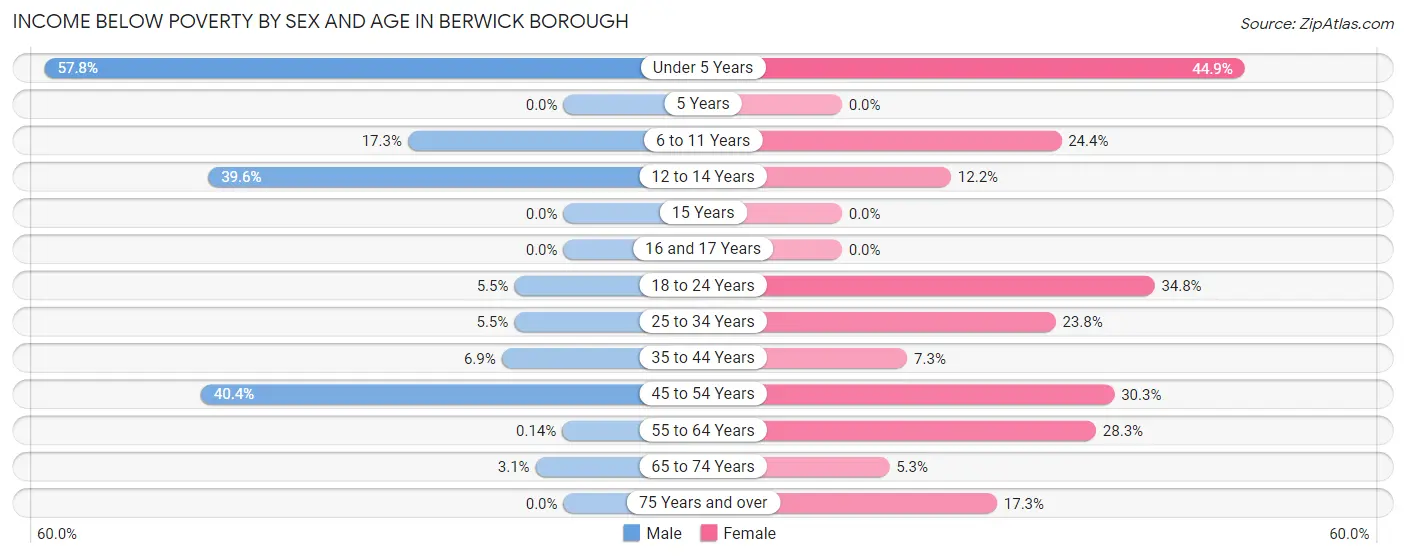
Income Below Poverty by Sex and Age in Berwick borough
With 14.1% poverty level for males and 22.2% for females among the residents of Berwick borough, under 5 year old males and under 5 year old females are the most vulnerable to poverty, with 145 males (57.8%) and 96 females (44.9%) in their respective age groups living below the poverty level.
| Age Bracket | Male | Female |
| Under 5 Years | 145 (57.8%) | 96 (44.9%) |
| 5 Years | 0 (0.0%) | 0 (0.0%) |
| 6 to 11 Years | 48 (17.3%) | 44 (24.4%) |
| 12 to 14 Years | 87 (39.6%) | 44 (12.1%) |
| 15 Years | 0 (0.0%) | 0 (0.0%) |
| 16 and 17 Years | 0 (0.0%) | 0 (0.0%) |
| 18 to 24 Years | 20 (5.5%) | 218 (34.8%) |
| 25 to 34 Years | 45 (5.5%) | 169 (23.8%) |
| 35 to 44 Years | 46 (6.9%) | 34 (7.3%) |
| 45 to 54 Years | 314 (40.4%) | 220 (30.3%) |
| 55 to 64 Years | 1 (0.1%) | 176 (28.3%) |
| 65 to 74 Years | 13 (3.1%) | 28 (5.3%) |
| 75 Years and over | 0 (0.0%) | 110 (17.3%) |
| Total | 719 (14.1%) | 1,139 (22.2%) |
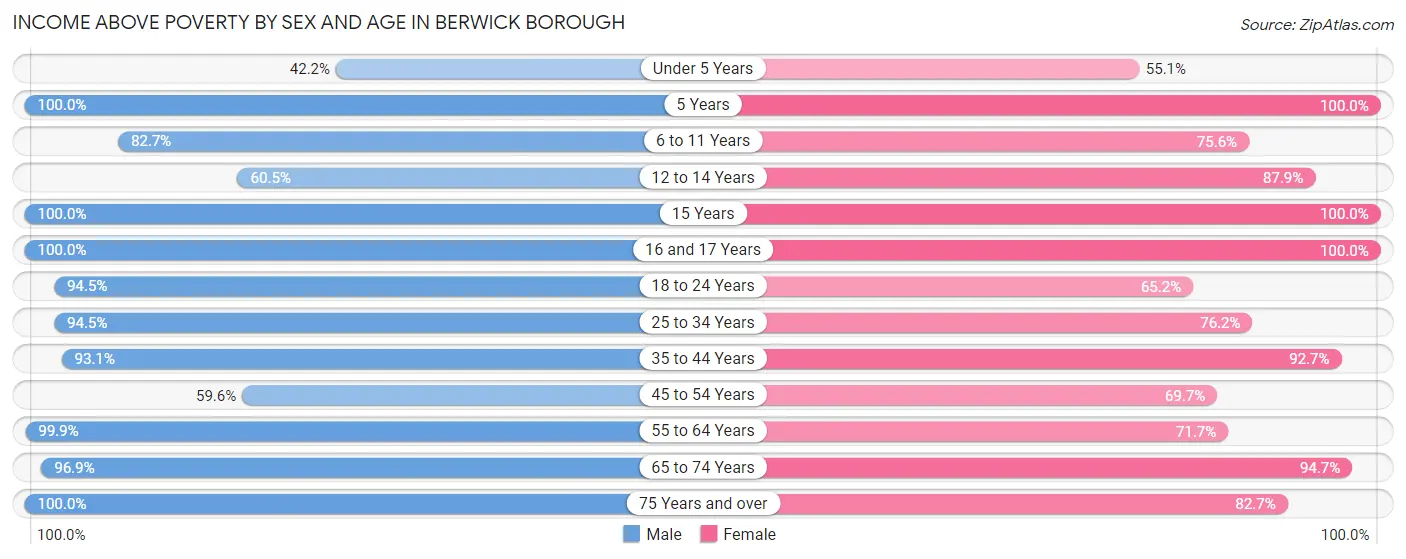
Income Above Poverty by Sex and Age in Berwick borough
According to the poverty statistics in Berwick borough, males aged 5 years and females aged 5 years are the age groups that are most secure financially, with 100.0% of males and 100.0% of females in these age groups living above the poverty line.
| Age Bracket | Male | Female |
| Under 5 Years | 106 (42.2%) | 118 (55.1%) |
| 5 Years | 56 (100.0%) | 47 (100.0%) |
| 6 to 11 Years | 229 (82.7%) | 136 (75.6%) |
| 12 to 14 Years | 133 (60.5%) | 318 (87.8%) |
| 15 Years | 44 (100.0%) | 11 (100.0%) |
| 16 and 17 Years | 221 (100.0%) | 11 (100.0%) |
| 18 to 24 Years | 346 (94.5%) | 408 (65.2%) |
| 25 to 34 Years | 776 (94.5%) | 541 (76.2%) |
| 35 to 44 Years | 623 (93.1%) | 433 (92.7%) |
| 45 to 54 Years | 464 (59.6%) | 505 (69.7%) |
| 55 to 64 Years | 727 (99.9%) | 446 (71.7%) |
| 65 to 74 Years | 405 (96.9%) | 502 (94.7%) |
| 75 Years and over | 254 (100.0%) | 527 (82.7%) |
| Total | 4,384 (85.9%) | 4,003 (77.8%) |
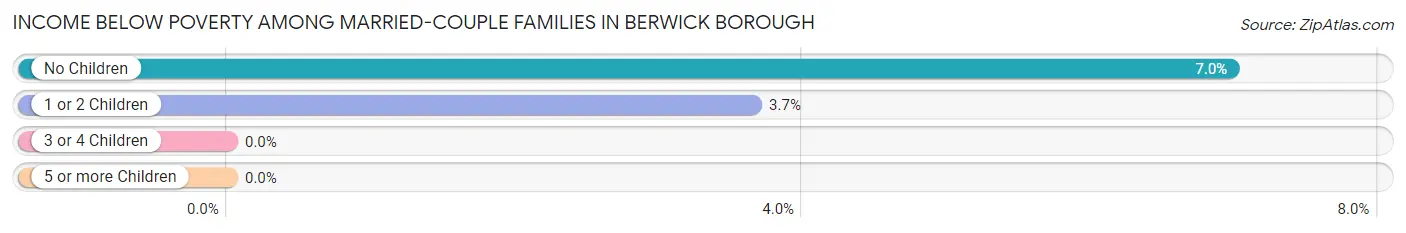
Income Below Poverty Among Married-Couple Families in Berwick borough
The poverty statistics for married-couple families in Berwick borough show that 5.7% or 98 of the total 1,721 families live below the poverty line. Families with no children have the highest poverty rate of 7.0%, comprising of 85 families. On the other hand, families with 3 or 4 children have the lowest poverty rate of 0.0%, which includes 0 families.
| Children | Above Poverty | Below Poverty |
| No Children | 1,134 (93.0%) | 85 (7.0%) |
| 1 or 2 Children | 343 (96.4%) | 13 (3.6%) |
| 3 or 4 Children | 128 (100.0%) | 0 (0.0%) |
| 5 or more Children | 18 (100.0%) | 0 (0.0%) |
| Total | 1,623 (94.3%) | 98 (5.7%) |
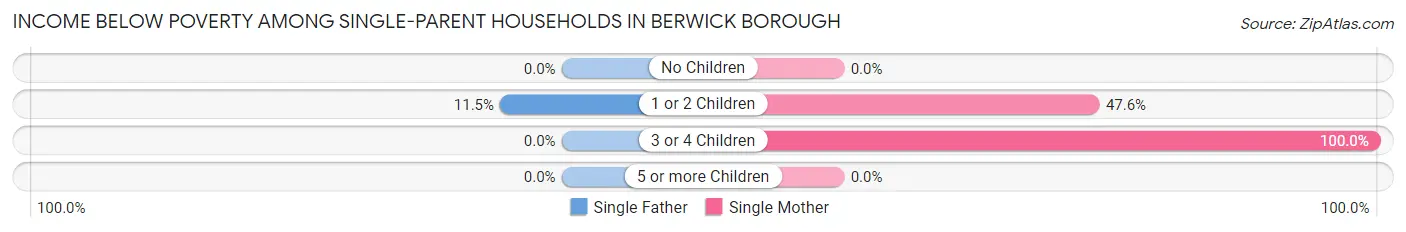
Income Below Poverty Among Single-Parent Households in Berwick borough
According to the poverty data in Berwick borough, 5.8% or 14 single-father households and 42.1% or 296 single-mother households are living below the poverty line. Among single-father households, those with 1 or 2 children have the highest poverty rate, with 14 households (11.5%) experiencing poverty. Likewise, among single-mother households, those with 3 or 4 children have the highest poverty rate, with 34 households (100.0%) falling below the poverty line.
| Children | Single Father | Single Mother |
| No Children | 0 (0.0%) | 0 (0.0%) |
| 1 or 2 Children | 14 (11.5%) | 262 (47.5%) |
| 3 or 4 Children | 0 (0.0%) | 34 (100.0%) |
| 5 or more Children | 0 (0.0%) | 0 (0.0%) |
| Total | 14 (5.8%) | 296 (42.1%) |
Income Below Poverty Among Married-Couple vs Single-Parent Households in Berwick borough
The poverty data for Berwick borough shows that 98 of the married-couple family households (5.7%) and 310 of the single-parent households (32.9%) are living below the poverty level. Within the married-couple family households, those with no children have the highest poverty rate, with 85 households (7.0%) falling below the poverty line. Among the single-parent households, those with 3 or 4 children have the highest poverty rate, with 34 household (100.0%) living below poverty.
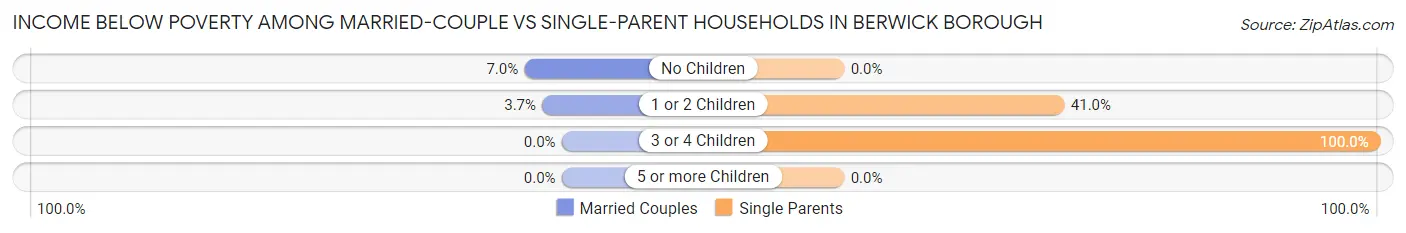
| Children | Married-Couple Families | Single-Parent Households |
| No Children | 85 (7.0%) | 0 (0.0%) |
| 1 or 2 Children | 13 (3.6%) | 276 (41.0%) |
| 3 or 4 Children | 0 (0.0%) | 34 (100.0%) |
| 5 or more Children | 0 (0.0%) | 0 (0.0%) |
| Total | 98 (5.7%) | 310 (32.9%) |
Race in Berwick borough
The most populous races in Berwick borough are White / Caucasian (9,420 | 91.3%), Hispanic or Latino (583 | 5.7%), and Black / African American (443 | 4.3%).
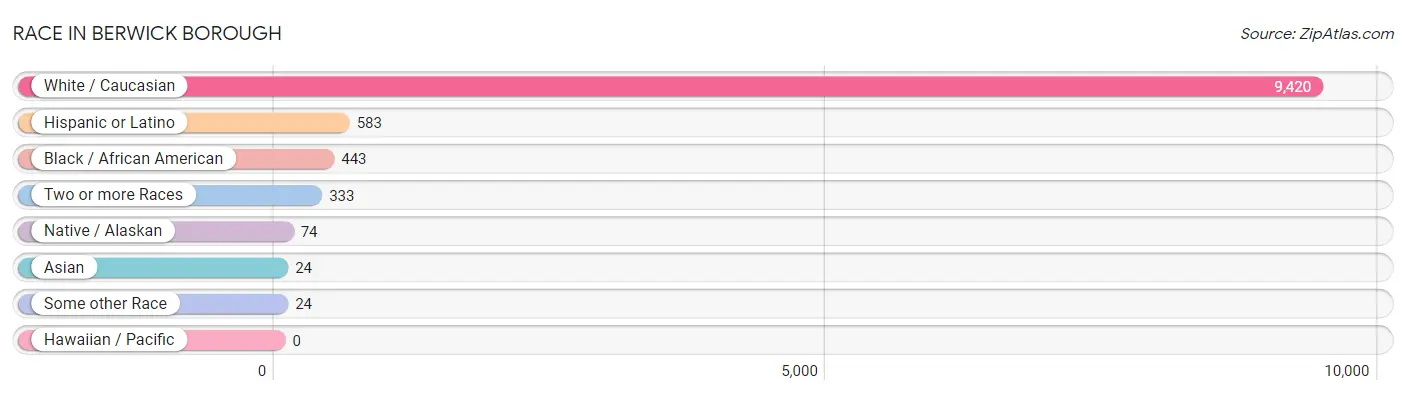
| Race | # Population | % Population |
| Asian | 24 | 0.2% |
| Black / African American | 443 | 4.3% |
| Hawaiian / Pacific | 0 | 0.0% |
| Hispanic or Latino | 583 | 5.7% |
| Native / Alaskan | 74 | 0.7% |
| White / Caucasian | 9,420 | 91.3% |
| Two or more Races | 333 | 3.2% |
| Some other Race | 24 | 0.2% |
| Total | 10,318 | 100.0% |
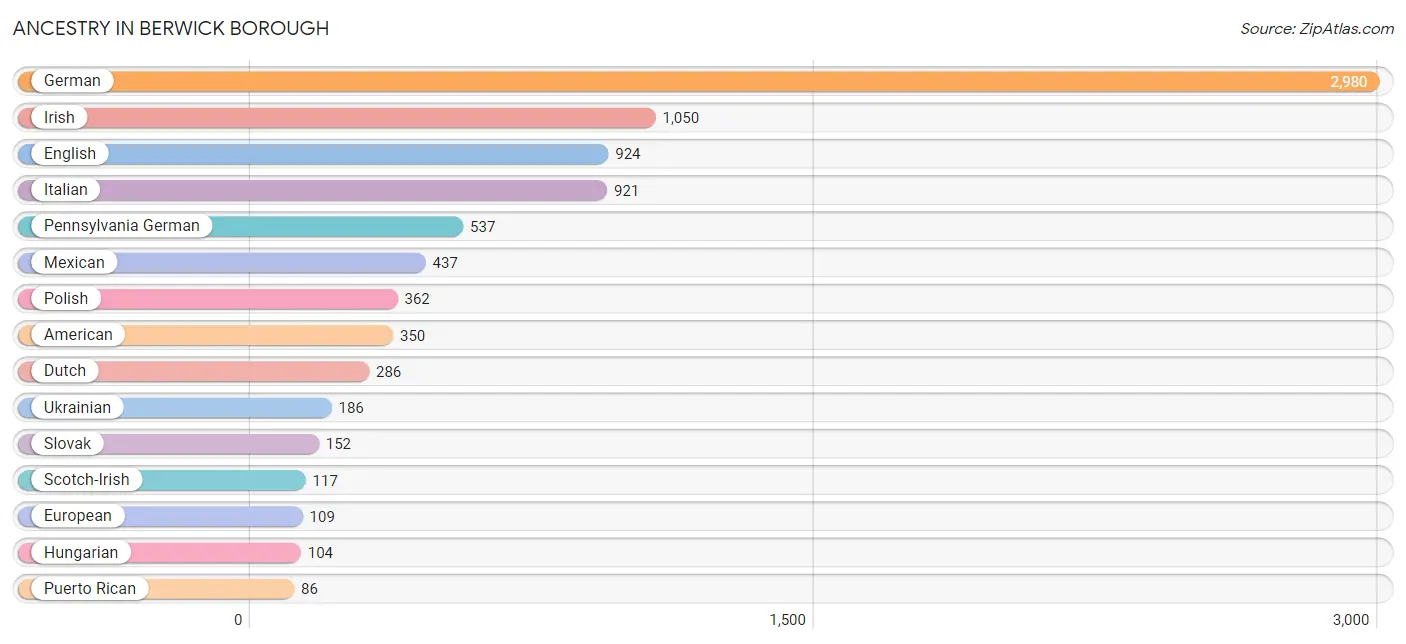
Ancestry in Berwick borough
The most populous ancestries reported in Berwick borough are German (2,980 | 28.9%), Irish (1,050 | 10.2%), English (924 | 9.0%), Italian (921 | 8.9%), and Pennsylvania German (537 | 5.2%), together accounting for 62.2% of all Berwick borough residents.
| Ancestry | # Population | % Population |
| American | 350 | 3.4% |
| Arab | 64 | 0.6% |
| Australian | 40 | 0.4% |
| Austrian | 20 | 0.2% |
| Blackfeet | 17 | 0.2% |
| British | 50 | 0.5% |
| Cherokee | 50 | 0.5% |
| Dutch | 286 | 2.8% |
| Eastern European | 20 | 0.2% |
| English | 924 | 9.0% |
| European | 109 | 1.1% |
| Finnish | 15 | 0.2% |
| French | 84 | 0.8% |
| German | 2,980 | 28.9% |
| Greek | 19 | 0.2% |
| Hungarian | 104 | 1.0% |
| Irish | 1,050 | 10.2% |
| Iroquois | 8 | 0.1% |
| Italian | 921 | 8.9% |
| Jamaican | 28 | 0.3% |
| Korean | 15 | 0.2% |
| Lebanese | 64 | 0.6% |
| Lithuanian | 85 | 0.8% |
| Mexican | 437 | 4.2% |
| Mexican American Indian | 66 | 0.6% |
| Norwegian | 41 | 0.4% |
| Pakistani | 24 | 0.2% |
| Pennsylvania German | 537 | 5.2% |
| Polish | 362 | 3.5% |
| Puerto Rican | 86 | 0.8% |
| Russian | 35 | 0.3% |
| Scandinavian | 12 | 0.1% |
| Scotch-Irish | 117 | 1.1% |
| Scottish | 76 | 0.7% |
| Slovak | 152 | 1.5% |
| Swedish | 10 | 0.1% |
| Ukrainian | 186 | 1.8% |
| Welsh | 83 | 0.8% | View All 38 Rows |
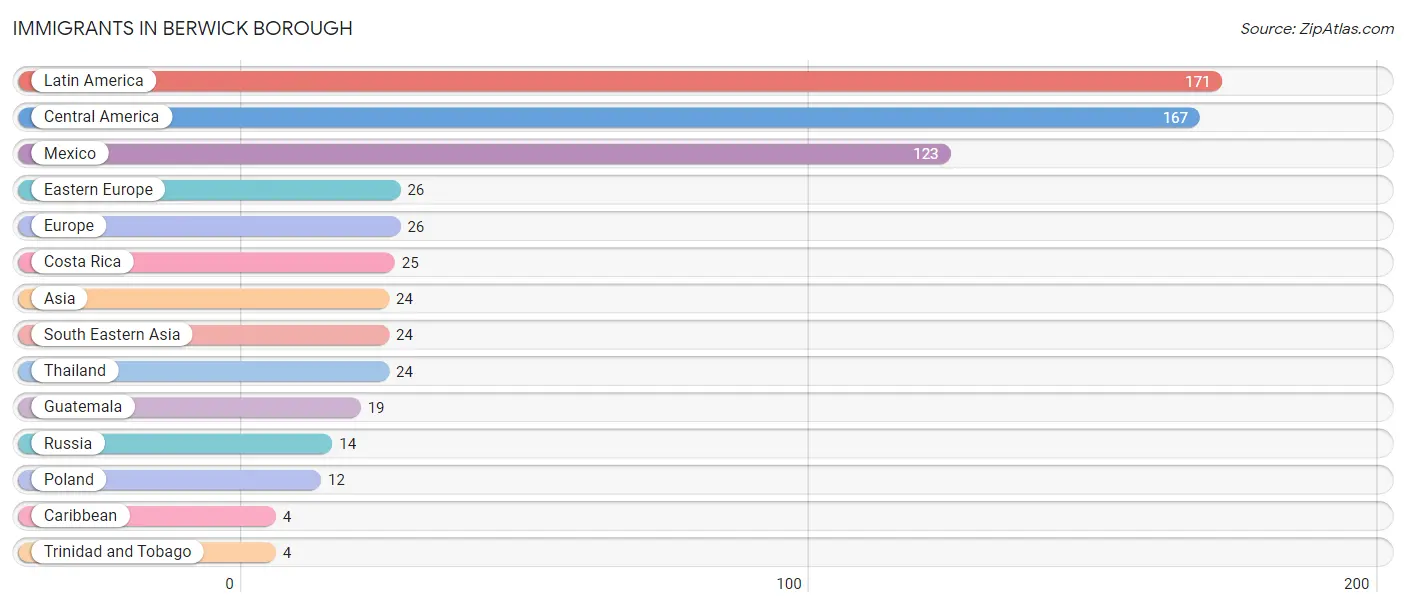
Immigrants in Berwick borough
The most numerous immigrant groups reported in Berwick borough came from Latin America (171 | 1.7%), Central America (167 | 1.6%), Mexico (123 | 1.2%), Eastern Europe (26 | 0.3%), and Europe (26 | 0.3%), together accounting for 5.0% of all Berwick borough residents.
| Immigration Origin | # Population | % Population |
| Asia | 24 | 0.2% |
| Caribbean | 4 | 0.0% |
| Central America | 167 | 1.6% |
| Costa Rica | 25 | 0.2% |
| Eastern Europe | 26 | 0.3% |
| Europe | 26 | 0.3% |
| Guatemala | 19 | 0.2% |
| Latin America | 171 | 1.7% |
| Mexico | 123 | 1.2% |
| Poland | 12 | 0.1% |
| Russia | 14 | 0.1% |
| South Eastern Asia | 24 | 0.2% |
| Thailand | 24 | 0.2% |
| Trinidad and Tobago | 4 | 0.0% | View All 14 Rows |
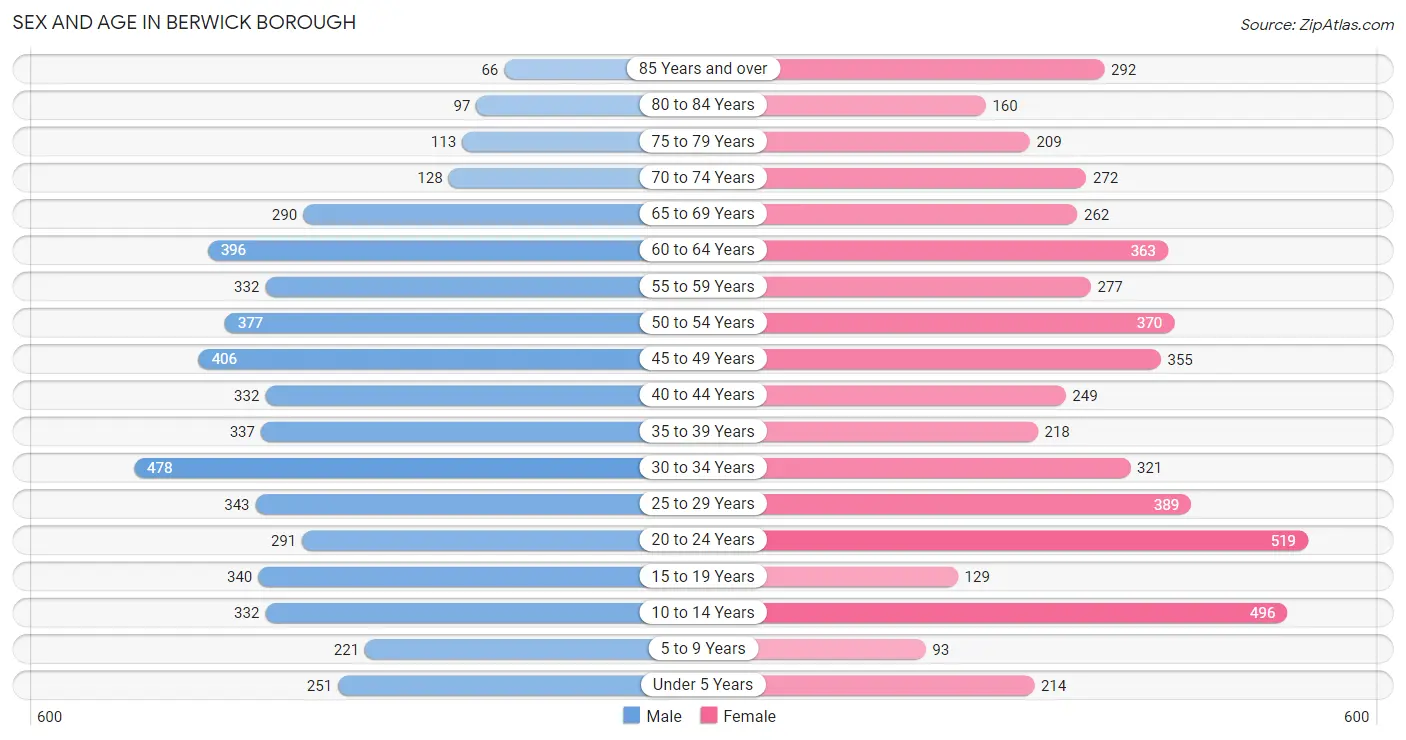
Sex and Age in Berwick borough
Sex and Age in Berwick borough
The most populous age groups in Berwick borough are 30 to 34 Years (478 | 9.3%) for men and 20 to 24 Years (519 | 10.0%) for women.
| Age Bracket | Male | Female |
| Under 5 Years | 251 (4.9%) | 214 (4.1%) |
| 5 to 9 Years | 221 (4.3%) | 93 (1.8%) |
| 10 to 14 Years | 332 (6.5%) | 496 (9.6%) |
| 15 to 19 Years | 340 (6.6%) | 129 (2.5%) |
| 20 to 24 Years | 291 (5.7%) | 519 (10.0%) |
| 25 to 29 Years | 343 (6.7%) | 389 (7.5%) |
| 30 to 34 Years | 478 (9.3%) | 321 (6.2%) |
| 35 to 39 Years | 337 (6.6%) | 218 (4.2%) |
| 40 to 44 Years | 332 (6.5%) | 249 (4.8%) |
| 45 to 49 Years | 406 (7.9%) | 355 (6.8%) |
| 50 to 54 Years | 377 (7.3%) | 370 (7.1%) |
| 55 to 59 Years | 332 (6.5%) | 277 (5.3%) |
| 60 to 64 Years | 396 (7.7%) | 363 (7.0%) |
| 65 to 69 Years | 290 (5.7%) | 262 (5.1%) |
| 70 to 74 Years | 128 (2.5%) | 272 (5.2%) |
| 75 to 79 Years | 113 (2.2%) | 209 (4.0%) |
| 80 to 84 Years | 97 (1.9%) | 160 (3.1%) |
| 85 Years and over | 66 (1.3%) | 292 (5.6%) |
| Total | 5,130 (100.0%) | 5,188 (100.0%) |
Families and Households in Berwick borough
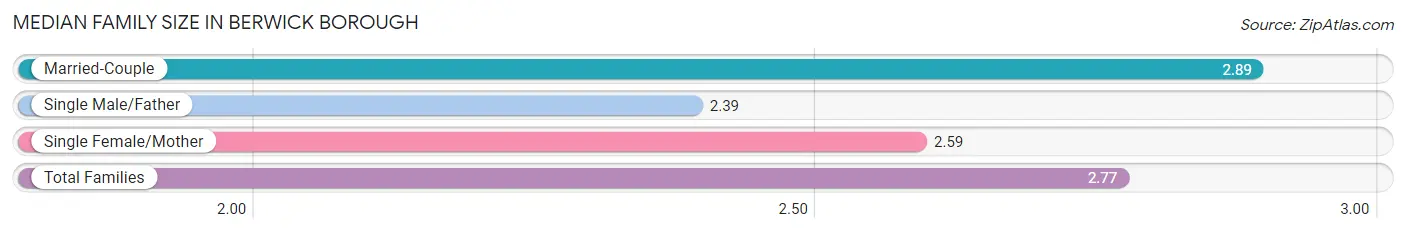
Median Family Size in Berwick borough
The median family size in Berwick borough is 2.77 persons per family, with married-couple families (1,721 | 64.6%) accounting for the largest median family size of 2.89 persons per family. On the other hand, single male/father families (240 | 9.0%) represent the smallest median family size with 2.39 persons per family.
| Family Type | # Families | Family Size |
| Married-Couple | 1,721 (64.6%) | 2.89 |
| Single Male/Father | 240 (9.0%) | 2.39 |
| Single Female/Mother | 703 (26.4%) | 2.59 |
| Total Families | 2,664 (100.0%) | 2.77 |
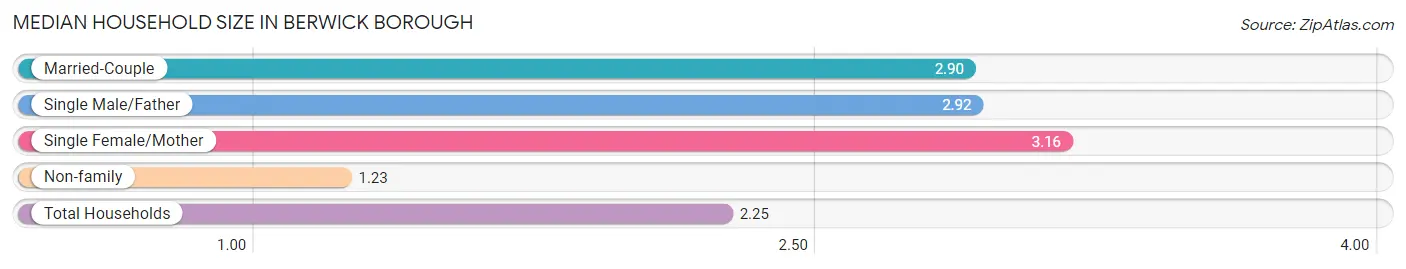
Median Household Size in Berwick borough
The median household size in Berwick borough is 2.25 persons per household, with single female/mother households (703 | 15.4%) accounting for the largest median household size of 3.16 persons per household. non-family households (1,893 | 41.5%) represent the smallest median household size with 1.23 persons per household.
| Household Type | # Households | Household Size |
| Married-Couple | 1,721 (37.8%) | 2.90 |
| Single Male/Father | 240 (5.3%) | 2.92 |
| Single Female/Mother | 703 (15.4%) | 3.16 |
| Non-family | 1,893 (41.5%) | 1.23 |
| Total Households | 4,557 (100.0%) | 2.25 |
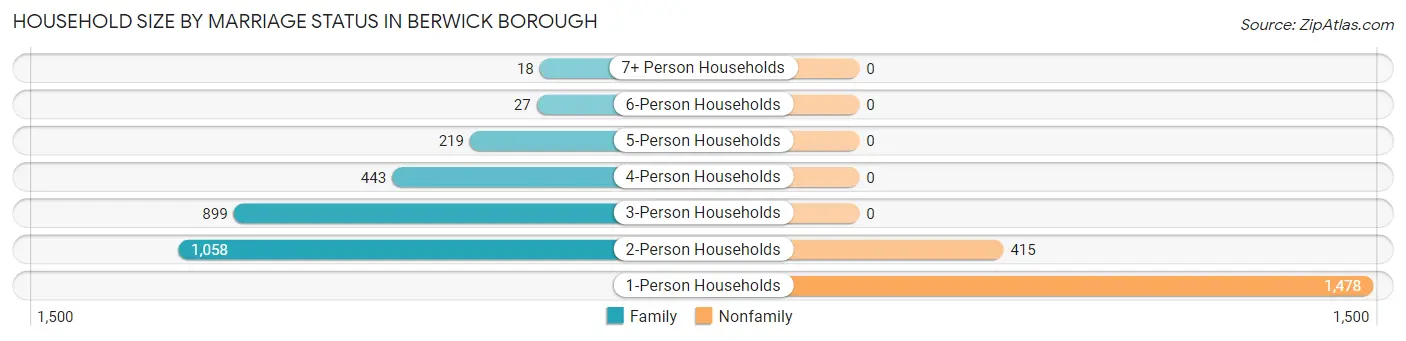
Household Size by Marriage Status in Berwick borough
Out of a total of 4,557 households in Berwick borough, 2,664 (58.5%) are family households, while 1,893 (41.5%) are nonfamily households. The most numerous type of family households are 2-person households, comprising 1,058, and the most common type of nonfamily households are 1-person households, comprising 1,478.
| Household Size | Family Households | Nonfamily Households |
| 1-Person Households | - | 1,478 (32.4%) |
| 2-Person Households | 1,058 (23.2%) | 415 (9.1%) |
| 3-Person Households | 899 (19.7%) | 0 (0.0%) |
| 4-Person Households | 443 (9.7%) | 0 (0.0%) |
| 5-Person Households | 219 (4.8%) | 0 (0.0%) |
| 6-Person Households | 27 (0.6%) | 0 (0.0%) |
| 7+ Person Households | 18 (0.4%) | 0 (0.0%) |
| Total | 2,664 (58.5%) | 1,893 (41.5%) |
Female Fertility in Berwick borough
Fertility by Age in Berwick borough
Average fertility rate in Berwick borough is 138.0 births per 1,000 women. Women in the age bracket of 20 to 34 years have the highest fertility rate with 245.0 births per 1,000 women. Women in the age bracket of 20 to 34 years acount for 100.0% of all women with births.
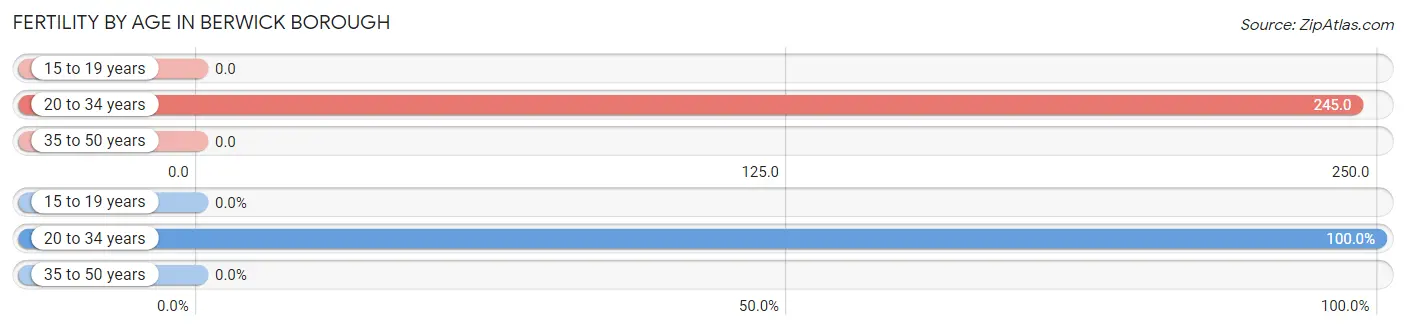
| Age Bracket | Women with Births | Births / 1,000 Women |
| 15 to 19 years | 0 (0.0%) | 0.0 |
| 20 to 34 years | 301 (100.0%) | 245.0 |
| 35 to 50 years | 0 (0.0%) | 0.0 |
| Total | 301 (100.0%) | 138.0 |
Fertility by Age by Marriage Status in Berwick borough
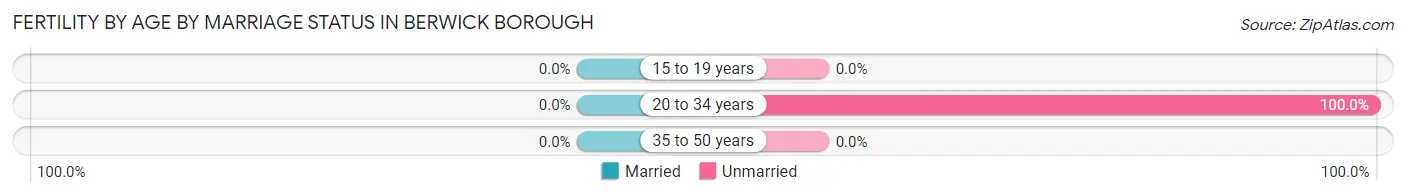
| Age Bracket | Married | Unmarried |
| 15 to 19 years | 0 (0.0%) | 0 (0.0%) |
| 20 to 34 years | 0 (0.0%) | 301 (100.0%) |
| 35 to 50 years | 0 (0.0%) | 0 (0.0%) |
| Total | 0 (0.0%) | 301 (100.0%) |
Fertility by Education in Berwick borough
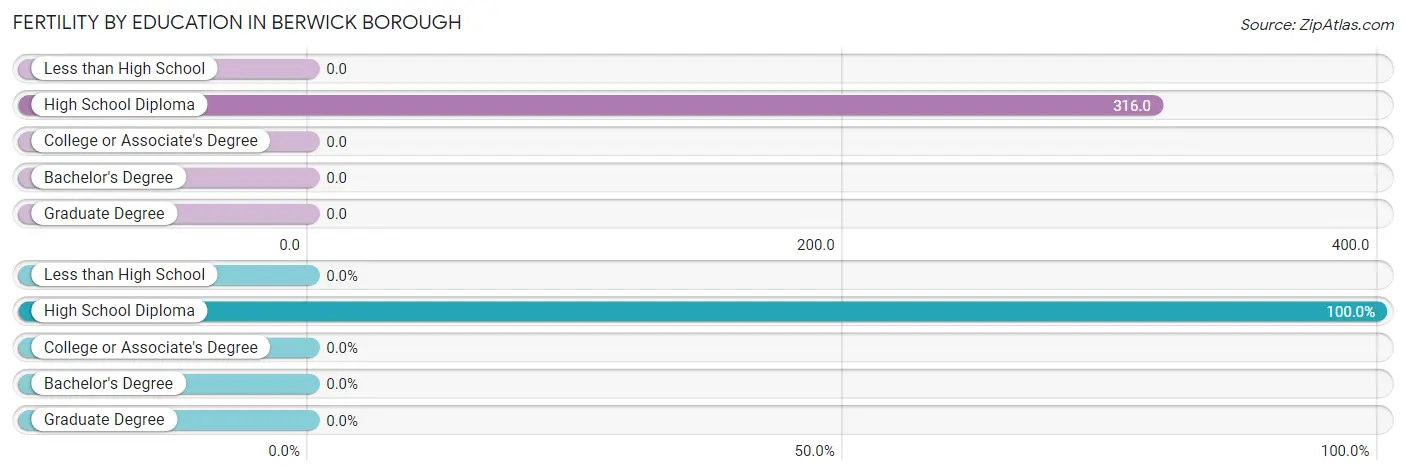
| Educational Attainment | Women with Births | Births / 1,000 Women |
| Less than High School | 0 (0.0%) | 0.0 |
| High School Diploma | 301 (100.0%) | 316.0 |
| College or Associate's Degree | 0 (0.0%) | 0.0 |
| Bachelor's Degree | 0 (0.0%) | 0.0 |
| Graduate Degree | 0 (0.0%) | 0.0 |
| Total | 301 (100.0%) | 138.0 |
Fertility by Education by Marriage Status in Berwick borough
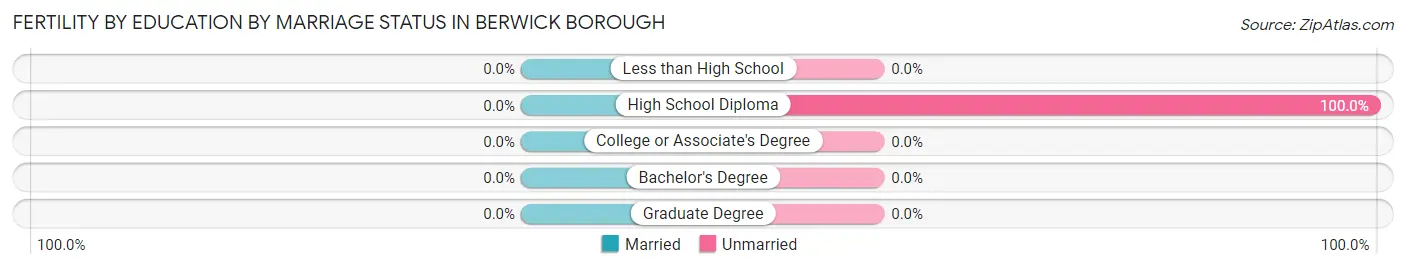
| Educational Attainment | Married | Unmarried |
| Less than High School | 0 (0.0%) | 0 (0.0%) |
| High School Diploma | 0 (0.0%) | 301 (100.0%) |
| College or Associate's Degree | 0 (0.0%) | 0 (0.0%) |
| Bachelor's Degree | 0 (0.0%) | 0 (0.0%) |
| Graduate Degree | 0 (0.0%) | 0 (0.0%) |
| Total | 0 (0.0%) | 301 (100.0%) |
Employment Characteristics in Berwick borough
Employment by Class of Employer in Berwick borough
Among the 4,985 employed individuals in Berwick borough, private company employees (3,728 | 74.8%), not-for-profit organizations (526 | 10.5%), and state government employees (243 | 4.9%) make up the most common classes of employment.
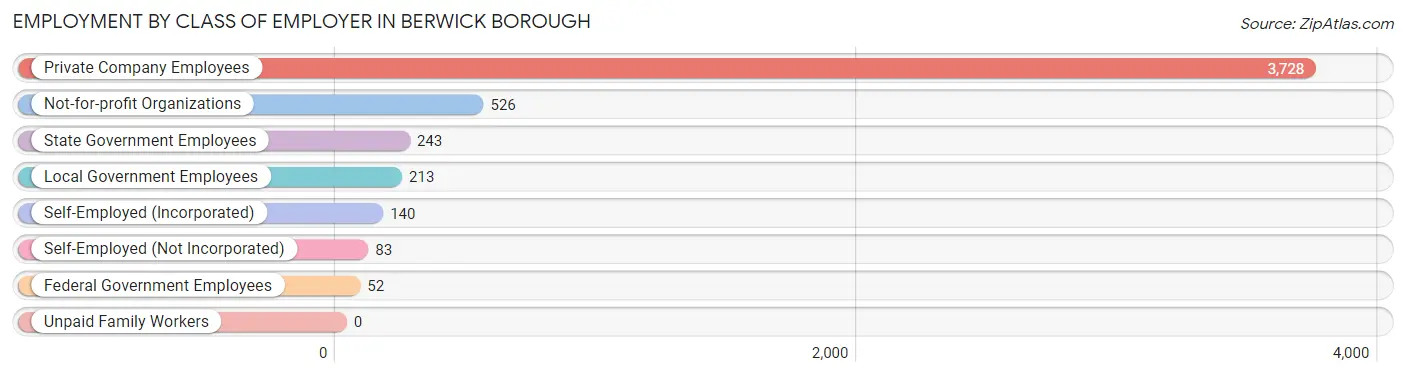
| Employer Class | # Employees | % Employees |
| Private Company Employees | 3,728 | 74.8% |
| Self-Employed (Incorporated) | 140 | 2.8% |
| Self-Employed (Not Incorporated) | 83 | 1.7% |
| Not-for-profit Organizations | 526 | 10.5% |
| Local Government Employees | 213 | 4.3% |
| State Government Employees | 243 | 4.9% |
| Federal Government Employees | 52 | 1.0% |
| Unpaid Family Workers | 0 | 0.0% |
| Total | 4,985 | 100.0% |
Employment Status by Age in Berwick borough
According to the labor force statistics for Berwick borough, out of the total population over 16 years of age (8,656), 60.2% or 5,211 individuals are in the labor force, with 4.0% or 208 of them unemployed. The age group with the highest labor force participation rate is 25 to 29 years, with 92.8% or 679 individuals in the labor force. Within the labor force, the 16 to 19 years age range has the highest percentage of unemployed individuals, with 52.9% or 63 of them being unemployed.
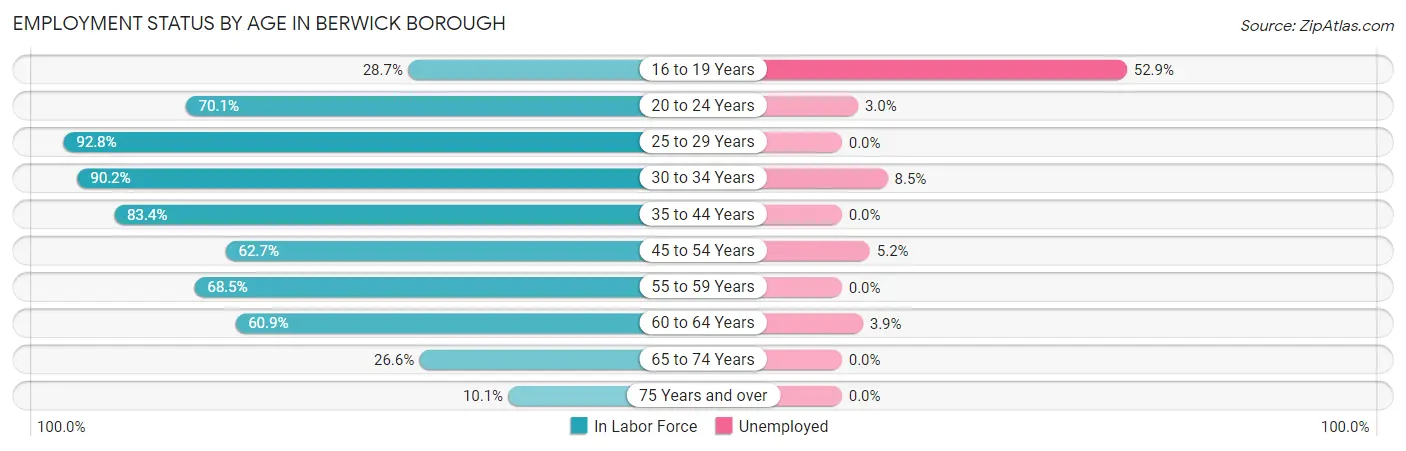
| Age Bracket | In Labor Force | Unemployed |
| 16 to 19 Years | 119 (28.7%) | 63 (52.9%) |
| 20 to 24 Years | 568 (70.1%) | 17 (3.0%) |
| 25 to 29 Years | 679 (92.8%) | 0 (0.0%) |
| 30 to 34 Years | 721 (90.2%) | 61 (8.5%) |
| 35 to 44 Years | 947 (83.4%) | 0 (0.0%) |
| 45 to 54 Years | 946 (62.7%) | 49 (5.2%) |
| 55 to 59 Years | 417 (68.5%) | 0 (0.0%) |
| 60 to 64 Years | 462 (60.9%) | 18 (3.9%) |
| 65 to 74 Years | 253 (26.6%) | 0 (0.0%) |
| 75 Years and over | 95 (10.1%) | 0 (0.0%) |
| Total | 5,211 (60.2%) | 208 (4.0%) |
Employment Status by Educational Attainment in Berwick borough
According to labor force statistics for Berwick borough, 75.3% of individuals (4,174) out of the total population between 25 and 64 years of age (5,543) are in the labor force, with 3.1% or 129 of them being unemployed. The group with the highest labor force participation rate are those with the educational attainment of college / associate degree, with 89.7% or 997 individuals in the labor force. Within the labor force, individuals with high school diploma education have the highest percentage of unemployment, with 4.6% or 88 of them being unemployed.
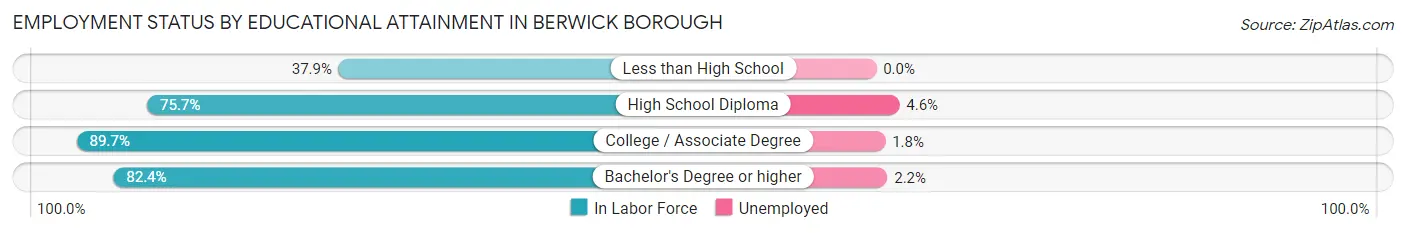
| Educational Attainment | In Labor Force | Unemployed |
| Less than High School | 262 (37.9%) | 0 (0.0%) |
| High School Diploma | 1,908 (75.7%) | 116 (4.6%) |
| College / Associate Degree | 997 (89.7%) | 20 (1.8%) |
| Bachelor's Degree or higher | 1,004 (82.4%) | 27 (2.2%) |
| Total | 4,174 (75.3%) | 172 (3.1%) |
Employment Occupations by Sex in Berwick borough
Management, Business, Science and Arts Occupations
The most common Management, Business, Science and Arts occupations in Berwick borough are Health Diagnosing & Treating (380 | 7.6%), Community & Social Service (304 | 6.1%), Management (226 | 4.5%), Health Technologists (169 | 3.4%), and Education Instruction & Library (166 | 3.3%).
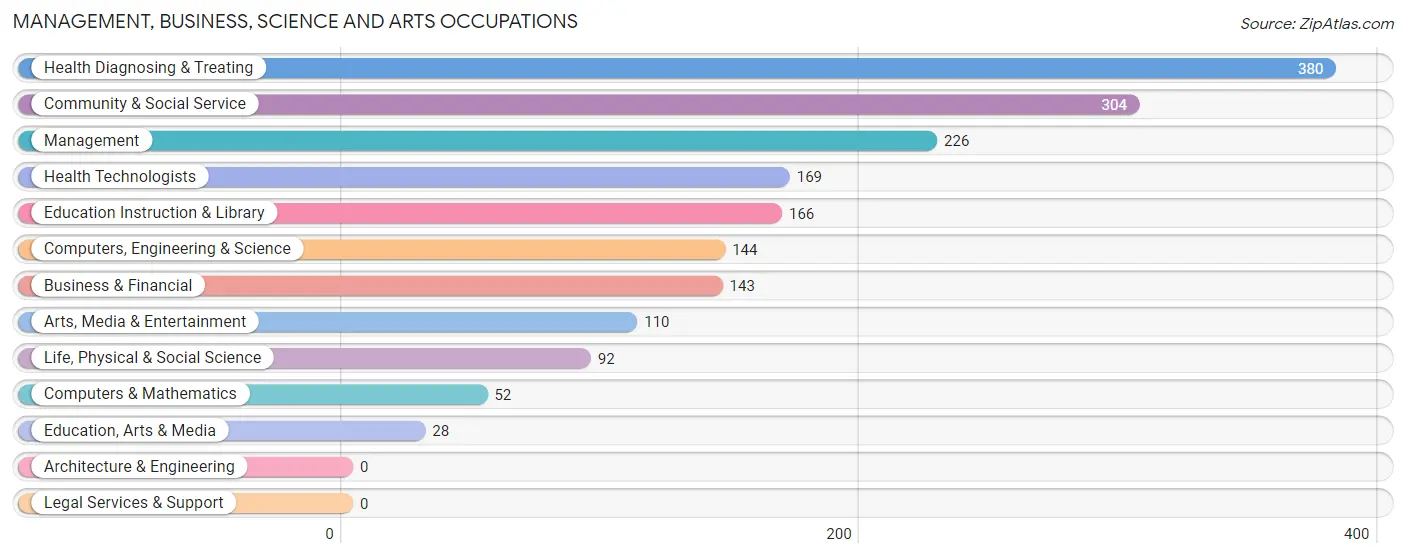
Management, Business, Science and Arts Occupations by Sex
Within the Management, Business, Science and Arts occupations in Berwick borough, the most male-oriented occupations are Education, Arts & Media (100.0%), Management (57.1%), and Life, Physical & Social Science (55.4%), while the most female-oriented occupations are Health Diagnosing & Treating (100.0%), Health Technologists (100.0%), and Education Instruction & Library (68.7%).
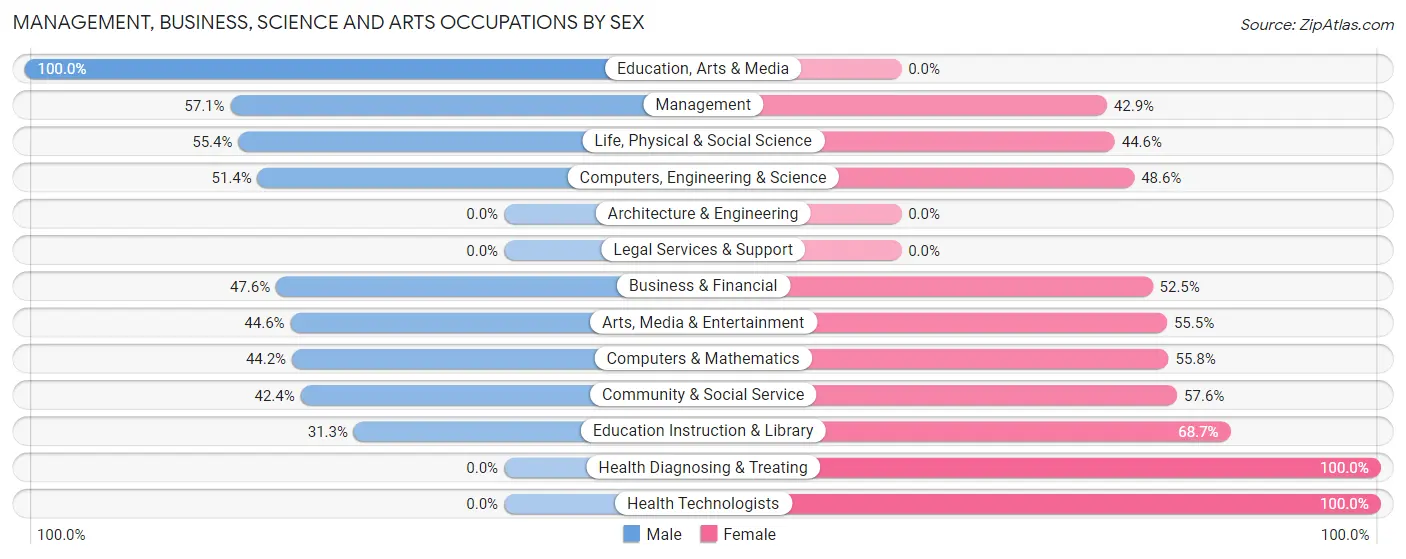
| Occupation | Male | Female |
| Management | 129 (57.1%) | 97 (42.9%) |
| Business & Financial | 68 (47.5%) | 75 (52.4%) |
| Computers, Engineering & Science | 74 (51.4%) | 70 (48.6%) |
| Computers & Mathematics | 23 (44.2%) | 29 (55.8%) |
| Architecture & Engineering | 0 (0.0%) | 0 (0.0%) |
| Life, Physical & Social Science | 51 (55.4%) | 41 (44.6%) |
| Community & Social Service | 129 (42.4%) | 175 (57.6%) |
| Education, Arts & Media | 28 (100.0%) | 0 (0.0%) |
| Legal Services & Support | 0 (0.0%) | 0 (0.0%) |
| Education Instruction & Library | 52 (31.3%) | 114 (68.7%) |
| Arts, Media & Entertainment | 49 (44.6%) | 61 (55.4%) |
| Health Diagnosing & Treating | 0 (0.0%) | 380 (100.0%) |
| Health Technologists | 0 (0.0%) | 169 (100.0%) |
| Total (Category) | 400 (33.4%) | 797 (66.6%) |
| Total (Overall) | 2,432 (48.6%) | 2,567 (51.3%) |
Services Occupations
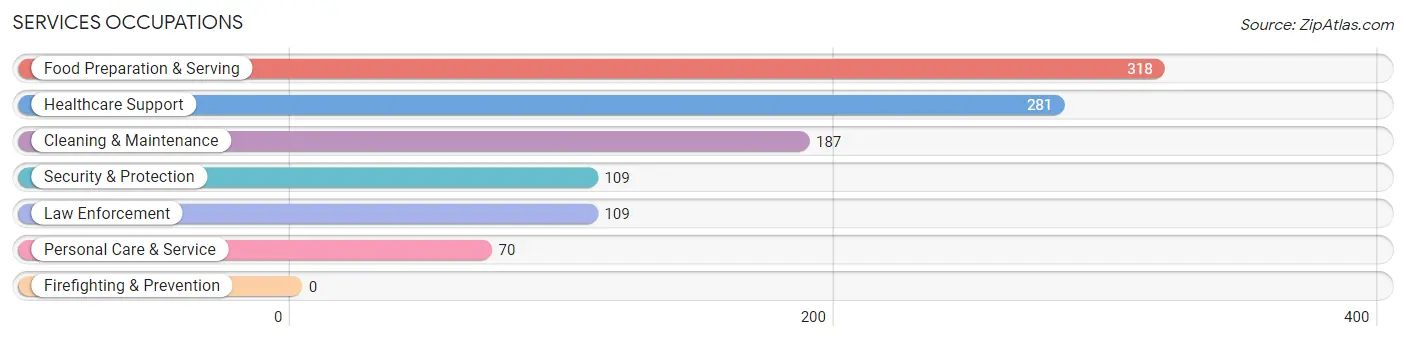
The most common Services occupations in Berwick borough are Food Preparation & Serving (318 | 6.4%), Healthcare Support (281 | 5.6%), Cleaning & Maintenance (187 | 3.7%), Security & Protection (109 | 2.2%), and Law Enforcement (109 | 2.2%).
Services Occupations by Sex
Within the Services occupations in Berwick borough, the most male-oriented occupations are Security & Protection (100.0%), Law Enforcement (100.0%), and Cleaning & Maintenance (79.7%), while the most female-oriented occupations are Healthcare Support (100.0%), Personal Care & Service (80.0%), and Food Preparation & Serving (69.5%).
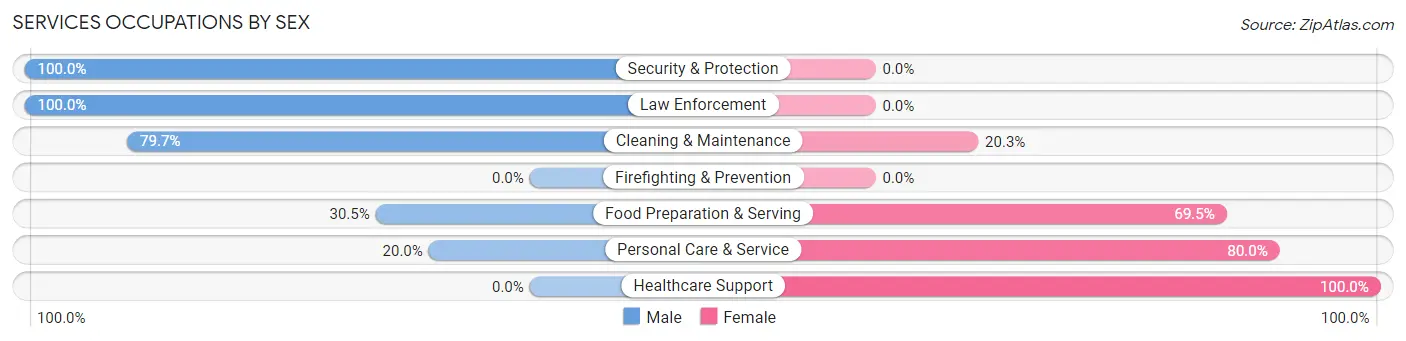
| Occupation | Male | Female |
| Healthcare Support | 0 (0.0%) | 281 (100.0%) |
| Security & Protection | 109 (100.0%) | 0 (0.0%) |
| Firefighting & Prevention | 0 (0.0%) | 0 (0.0%) |
| Law Enforcement | 109 (100.0%) | 0 (0.0%) |
| Food Preparation & Serving | 97 (30.5%) | 221 (69.5%) |
| Cleaning & Maintenance | 149 (79.7%) | 38 (20.3%) |
| Personal Care & Service | 14 (20.0%) | 56 (80.0%) |
| Total (Category) | 369 (38.2%) | 596 (61.8%) |
| Total (Overall) | 2,432 (48.6%) | 2,567 (51.3%) |
Sales and Office Occupations
The most common Sales and Office occupations in Berwick borough are Office & Administration (551 | 11.0%), and Sales & Related (419 | 8.4%).

Sales and Office Occupations by Sex

| Occupation | Male | Female |
| Sales & Related | 157 (37.5%) | 262 (62.5%) |
| Office & Administration | 63 (11.4%) | 488 (88.6%) |
| Total (Category) | 220 (22.7%) | 750 (77.3%) |
| Total (Overall) | 2,432 (48.6%) | 2,567 (51.3%) |
Natural Resources, Construction and Maintenance Occupations
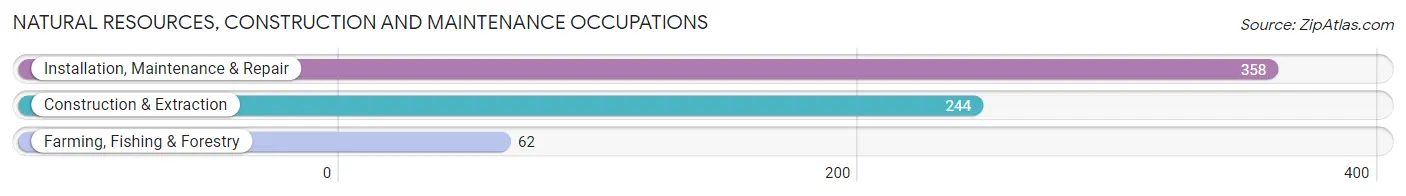
The most common Natural Resources, Construction and Maintenance occupations in Berwick borough are Installation, Maintenance & Repair (358 | 7.2%), Construction & Extraction (244 | 4.9%), and Farming, Fishing & Forestry (62 | 1.2%).
Natural Resources, Construction and Maintenance Occupations by Sex

| Occupation | Male | Female |
| Farming, Fishing & Forestry | 0 (0.0%) | 62 (100.0%) |
| Construction & Extraction | 244 (100.0%) | 0 (0.0%) |
| Installation, Maintenance & Repair | 301 (84.1%) | 57 (15.9%) |
| Total (Category) | 545 (82.1%) | 119 (17.9%) |
| Total (Overall) | 2,432 (48.6%) | 2,567 (51.3%) |
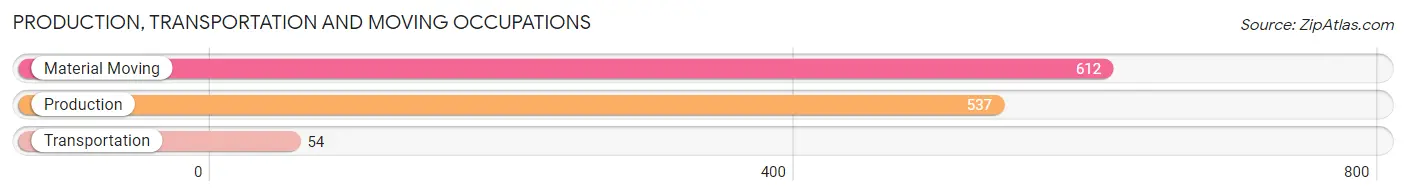
Production, Transportation and Moving Occupations
The most common Production, Transportation and Moving occupations in Berwick borough are Material Moving (612 | 12.2%), Production (537 | 10.7%), and Transportation (54 | 1.1%).
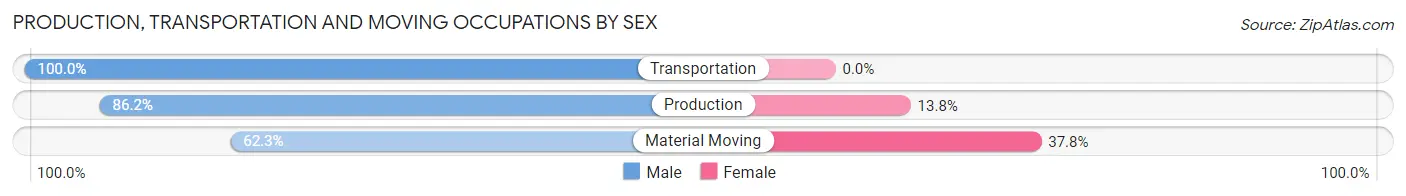
Production, Transportation and Moving Occupations by Sex
| Occupation | Male | Female |
| Production | 463 (86.2%) | 74 (13.8%) |
| Transportation | 54 (100.0%) | 0 (0.0%) |
| Material Moving | 381 (62.3%) | 231 (37.8%) |
| Total (Category) | 898 (74.7%) | 305 (25.4%) |
| Total (Overall) | 2,432 (48.6%) | 2,567 (51.3%) |
Employment Industries by Sex in Berwick borough
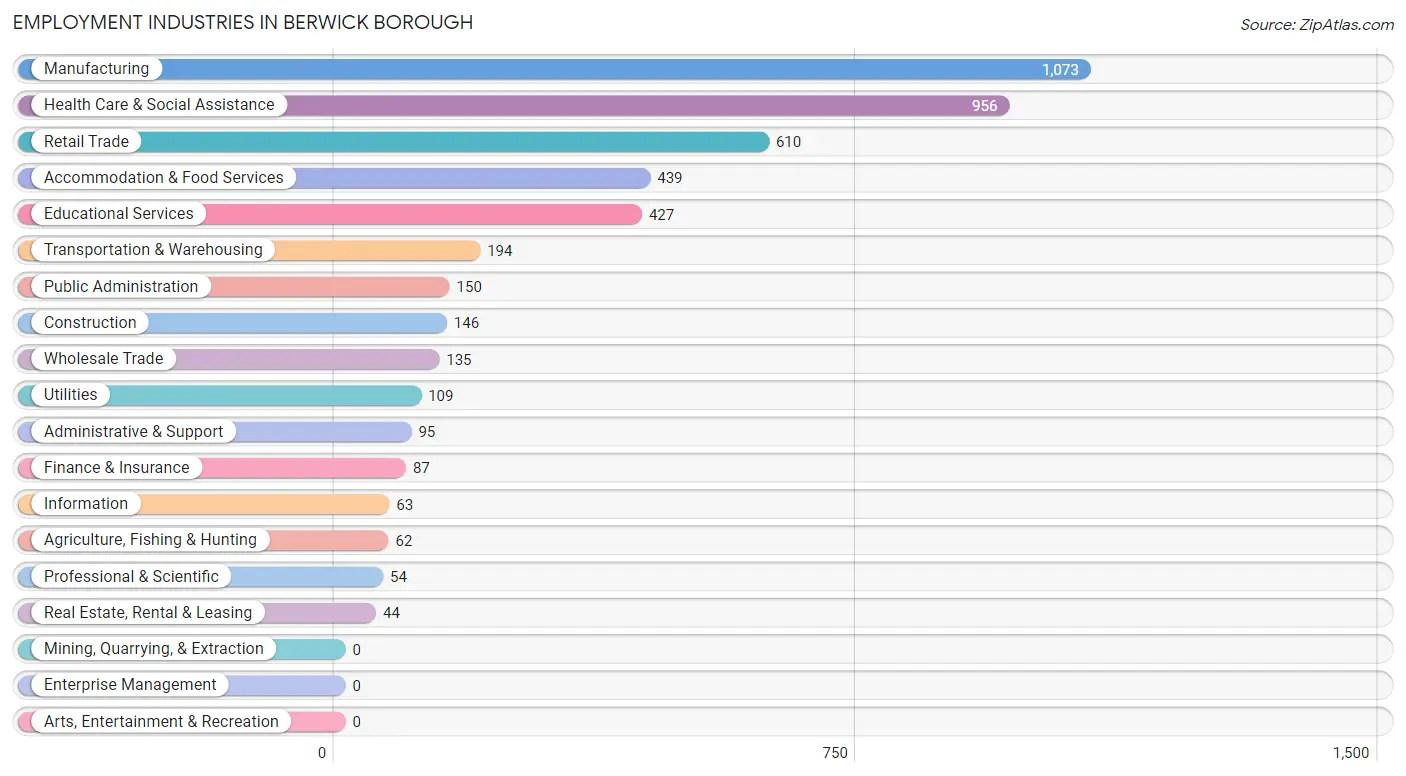
Employment Industries in Berwick borough
The major employment industries in Berwick borough include Manufacturing (1,073 | 21.5%), Health Care & Social Assistance (956 | 19.1%), Retail Trade (610 | 12.2%), Accommodation & Food Services (439 | 8.8%), and Educational Services (427 | 8.5%).
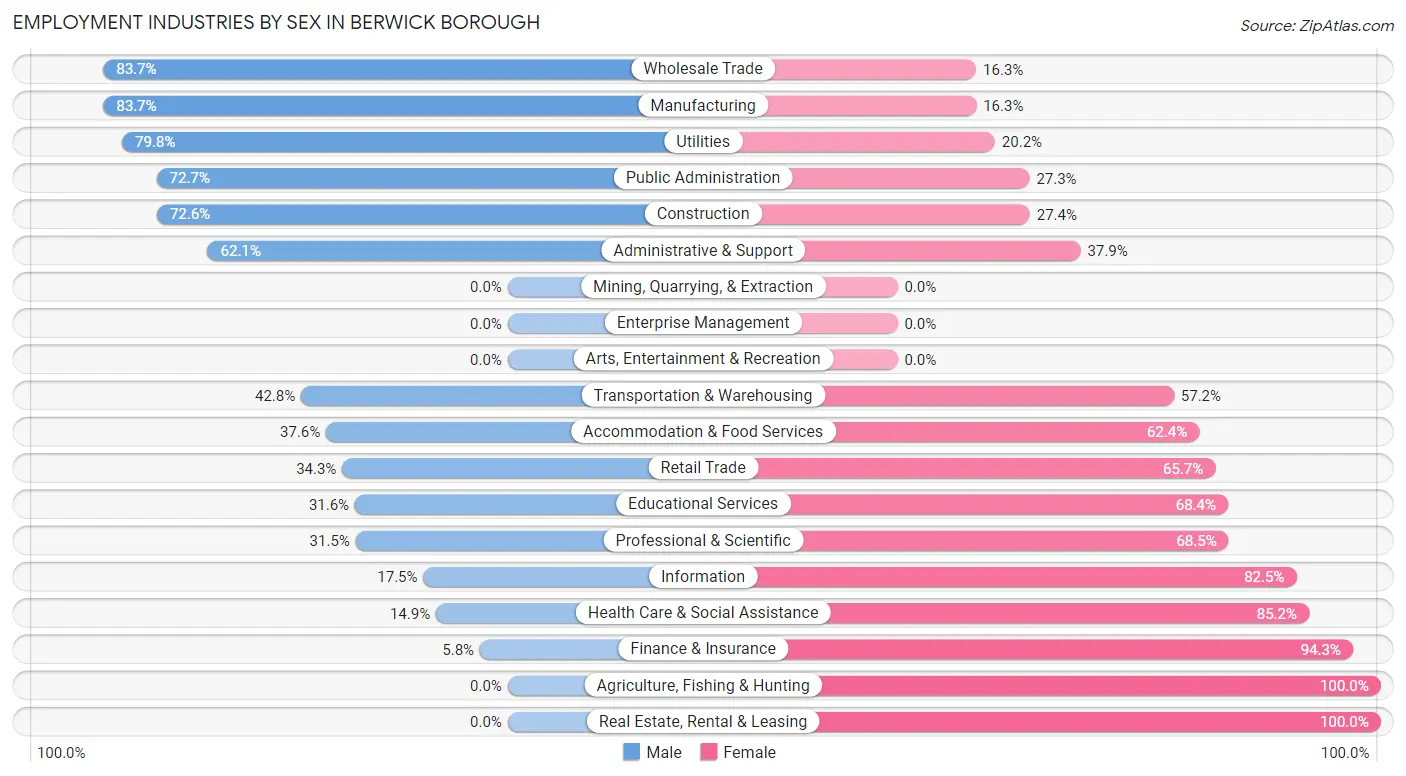
Employment Industries by Sex in Berwick borough
The Berwick borough industries that see more men than women are Wholesale Trade (83.7%), Manufacturing (83.7%), and Utilities (79.8%), whereas the industries that tend to have a higher number of women are Agriculture, Fishing & Hunting (100.0%), Real Estate, Rental & Leasing (100.0%), and Finance & Insurance (94.3%).
| Industry | Male | Female |
| Agriculture, Fishing & Hunting | 0 (0.0%) | 62 (100.0%) |
| Mining, Quarrying, & Extraction | 0 (0.0%) | 0 (0.0%) |
| Construction | 106 (72.6%) | 40 (27.4%) |
| Manufacturing | 898 (83.7%) | 175 (16.3%) |
| Wholesale Trade | 113 (83.7%) | 22 (16.3%) |
| Retail Trade | 209 (34.3%) | 401 (65.7%) |
| Transportation & Warehousing | 83 (42.8%) | 111 (57.2%) |
| Utilities | 87 (79.8%) | 22 (20.2%) |
| Information | 11 (17.5%) | 52 (82.5%) |
| Finance & Insurance | 5 (5.8%) | 82 (94.3%) |
| Real Estate, Rental & Leasing | 0 (0.0%) | 44 (100.0%) |
| Professional & Scientific | 17 (31.5%) | 37 (68.5%) |
| Enterprise Management | 0 (0.0%) | 0 (0.0%) |
| Administrative & Support | 59 (62.1%) | 36 (37.9%) |
| Educational Services | 135 (31.6%) | 292 (68.4%) |
| Health Care & Social Assistance | 142 (14.8%) | 814 (85.2%) |
| Arts, Entertainment & Recreation | 0 (0.0%) | 0 (0.0%) |
| Accommodation & Food Services | 165 (37.6%) | 274 (62.4%) |
| Public Administration | 109 (72.7%) | 41 (27.3%) |
| Total | 2,432 (48.6%) | 2,567 (51.3%) |
Education in Berwick borough
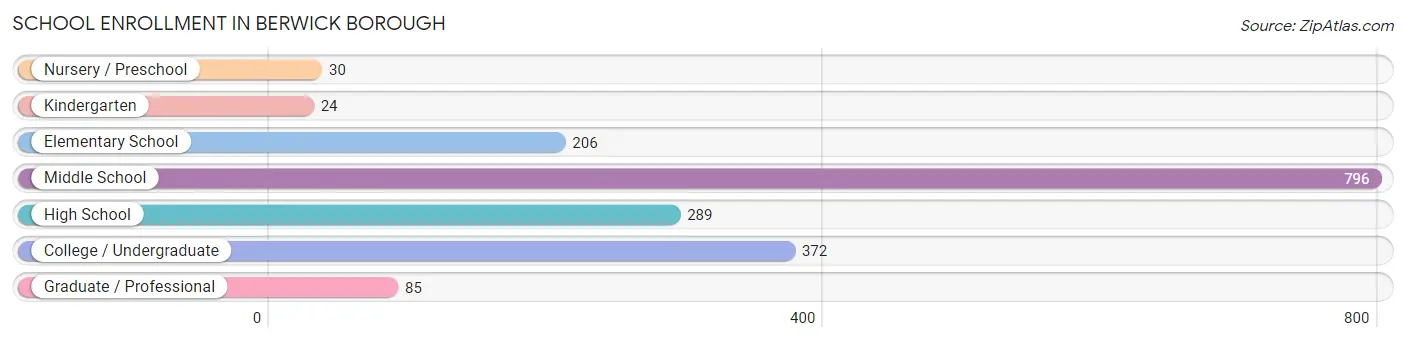
School Enrollment in Berwick borough
The most common levels of schooling among the 1,802 students in Berwick borough are middle school (796 | 44.2%), college / undergraduate (372 | 20.6%), and high school (289 | 16.0%).
| School Level | # Students | % Students |
| Nursery / Preschool | 30 | 1.7% |
| Kindergarten | 24 | 1.3% |
| Elementary School | 206 | 11.4% |
| Middle School | 796 | 44.2% |
| High School | 289 | 16.0% |
| College / Undergraduate | 372 | 20.6% |
| Graduate / Professional | 85 | 4.7% |
| Total | 1,802 | 100.0% |
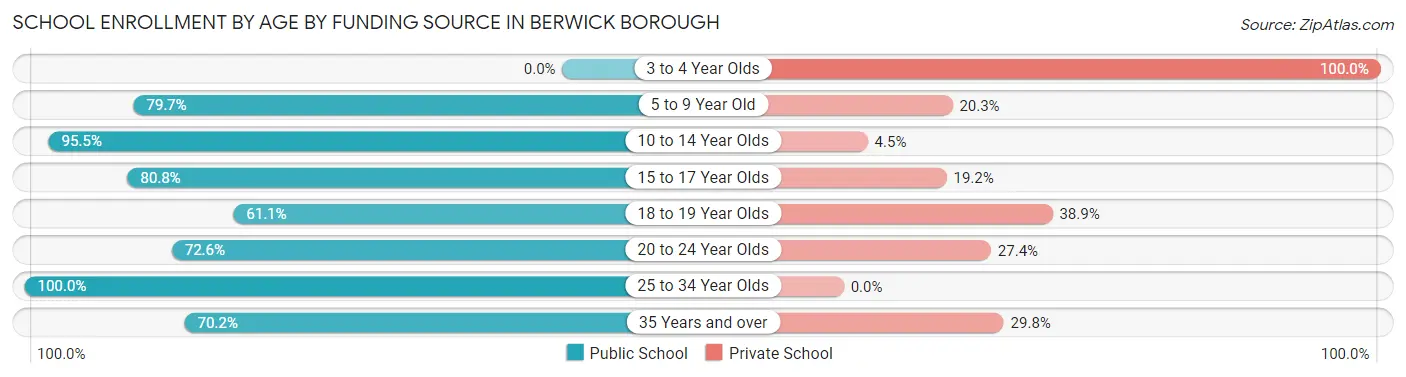
School Enrollment by Age by Funding Source in Berwick borough
Out of a total of 1,802 students who are enrolled in schools in Berwick borough, 279 (15.5%) attend a private institution, while the remaining 1,523 (84.5%) are enrolled in public schools. The age group of 3 to 4 year olds has the highest likelihood of being enrolled in private schools, with 14 (100.0% in the age bracket) enrolled. Conversely, the age group of 25 to 34 year olds has the lowest likelihood of being enrolled in a private school, with 45 (100.0% in the age bracket) attending a public institution.
| Age Bracket | Public School | Private School |
| 3 to 4 Year Olds | 0 (0.0%) | 14 (100.0%) |
| 5 to 9 Year Old | 181 (79.7%) | 46 (20.3%) |
| 10 to 14 Year Olds | 791 (95.5%) | 37 (4.5%) |
| 15 to 17 Year Olds | 232 (80.8%) | 55 (19.2%) |
| 18 to 19 Year Olds | 77 (61.1%) | 49 (38.9%) |
| 20 to 24 Year Olds | 90 (72.6%) | 34 (27.4%) |
| 25 to 34 Year Olds | 45 (100.0%) | 0 (0.0%) |
| 35 Years and over | 106 (70.2%) | 45 (29.8%) |
| Total | 1,523 (84.5%) | 279 (15.5%) |
Educational Attainment by Field of Study in Berwick borough
Education (297 | 19.8%), science & technology (243 | 16.2%), business (236 | 15.7%), arts & humanities (219 | 14.6%), and social sciences (92 | 6.1%) are the most common fields of study among 1,501 individuals in Berwick borough who have obtained a bachelor's degree or higher.
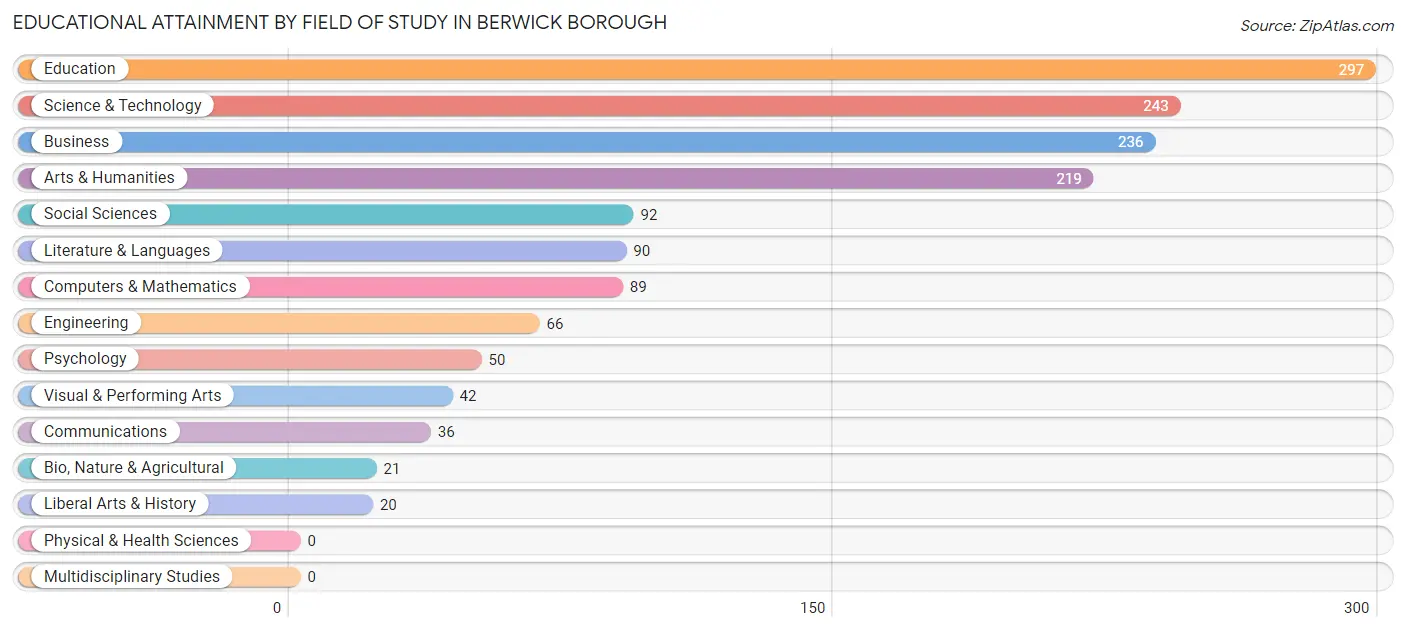
| Field of Study | # Graduates | % Graduates |
| Computers & Mathematics | 89 | 5.9% |
| Bio, Nature & Agricultural | 21 | 1.4% |
| Physical & Health Sciences | 0 | 0.0% |
| Psychology | 50 | 3.3% |
| Social Sciences | 92 | 6.1% |
| Engineering | 66 | 4.4% |
| Multidisciplinary Studies | 0 | 0.0% |
| Science & Technology | 243 | 16.2% |
| Business | 236 | 15.7% |
| Education | 297 | 19.8% |
| Literature & Languages | 90 | 6.0% |
| Liberal Arts & History | 20 | 1.3% |
| Visual & Performing Arts | 42 | 2.8% |
| Communications | 36 | 2.4% |
| Arts & Humanities | 219 | 14.6% |
| Total | 1,501 | 100.0% |
Transportation & Commute in Berwick borough
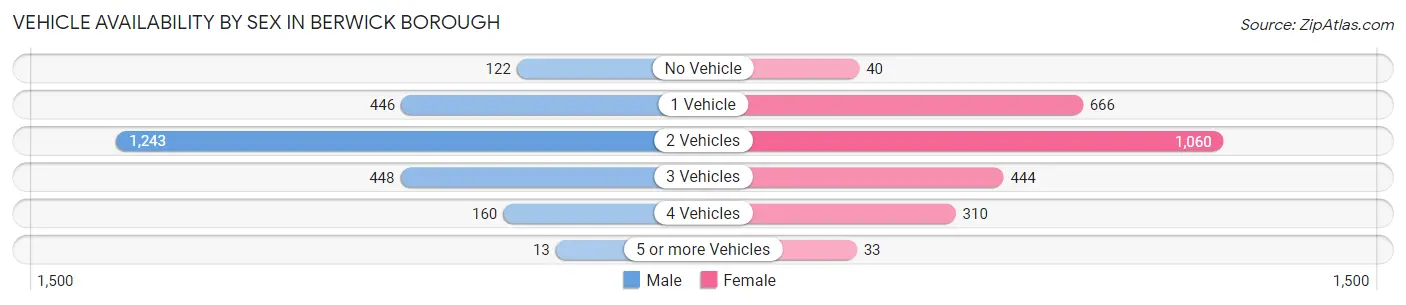
Vehicle Availability by Sex in Berwick borough
The most prevalent vehicle ownership categories in Berwick borough are males with 2 vehicles (1,243, accounting for 51.1%) and females with 2 vehicles (1,060, making up 48.7%).
| Vehicles Available | Male | Female |
| No Vehicle | 122 (5.0%) | 40 (1.6%) |
| 1 Vehicle | 446 (18.3%) | 666 (26.1%) |
| 2 Vehicles | 1,243 (51.1%) | 1,060 (41.5%) |
| 3 Vehicles | 448 (18.4%) | 444 (17.4%) |
| 4 Vehicles | 160 (6.6%) | 310 (12.1%) |
| 5 or more Vehicles | 13 (0.5%) | 33 (1.3%) |
| Total | 2,432 (100.0%) | 2,553 (100.0%) |
Commute Time in Berwick borough
The most frequently occuring commute durations in Berwick borough are 5 to 9 minutes (1,000 commuters, 21.1%), 10 to 14 minutes (902 commuters, 19.0%), and 15 to 19 minutes (743 commuters, 15.7%).
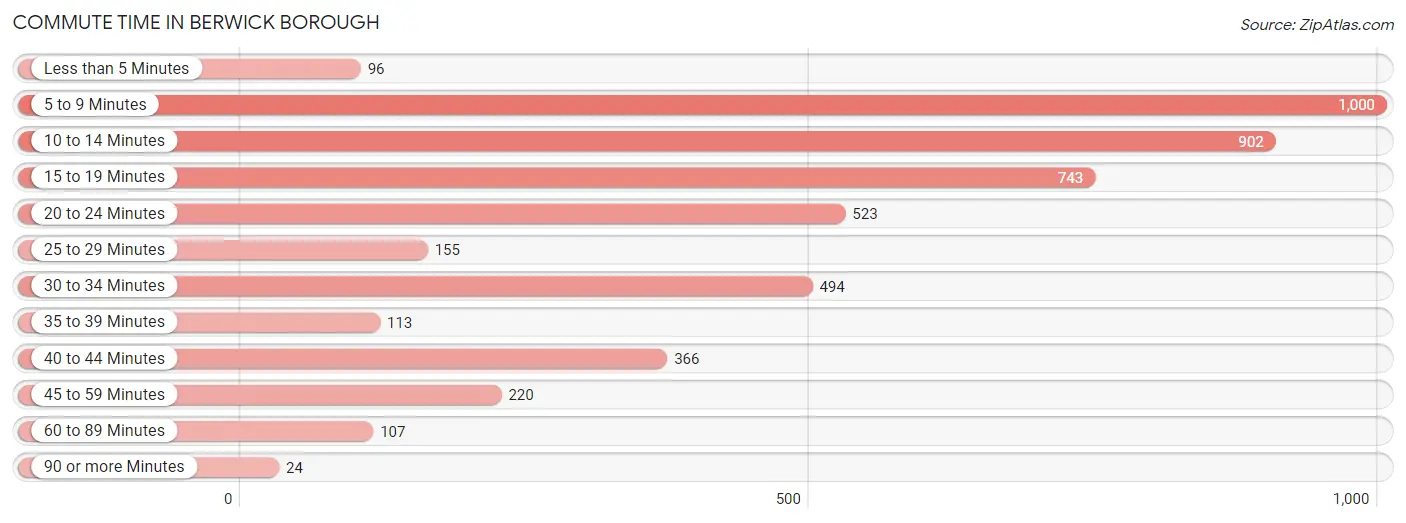
| Commute Time | # Commuters | % Commuters |
| Less than 5 Minutes | 96 | 2.0% |
| 5 to 9 Minutes | 1,000 | 21.1% |
| 10 to 14 Minutes | 902 | 19.0% |
| 15 to 19 Minutes | 743 | 15.7% |
| 20 to 24 Minutes | 523 | 11.0% |
| 25 to 29 Minutes | 155 | 3.3% |
| 30 to 34 Minutes | 494 | 10.4% |
| 35 to 39 Minutes | 113 | 2.4% |
| 40 to 44 Minutes | 366 | 7.7% |
| 45 to 59 Minutes | 220 | 4.6% |
| 60 to 89 Minutes | 107 | 2.3% |
| 90 or more Minutes | 24 | 0.5% |
Commute Time by Sex in Berwick borough
The most common commute times in Berwick borough are 15 to 19 minutes (466 commuters, 20.1%) for males and 10 to 14 minutes (579 commuters, 23.9%) for females.
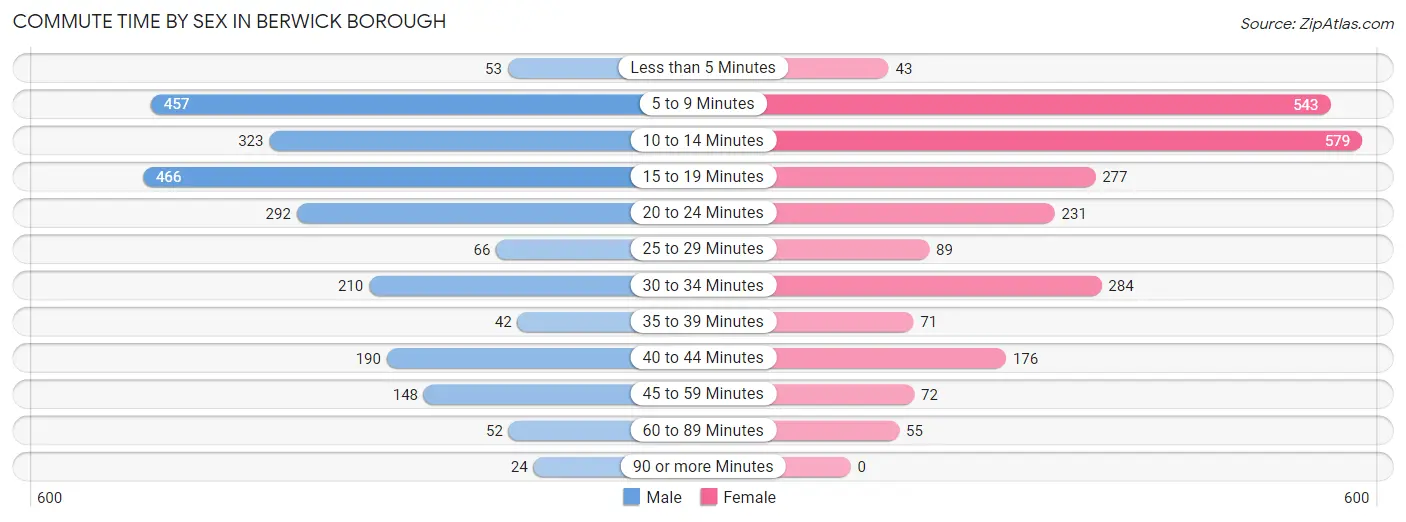
| Commute Time | Male | Female |
| Less than 5 Minutes | 53 (2.3%) | 43 (1.8%) |
| 5 to 9 Minutes | 457 (19.7%) | 543 (22.4%) |
| 10 to 14 Minutes | 323 (13.9%) | 579 (23.9%) |
| 15 to 19 Minutes | 466 (20.1%) | 277 (11.5%) |
| 20 to 24 Minutes | 292 (12.6%) | 231 (9.6%) |
| 25 to 29 Minutes | 66 (2.8%) | 89 (3.7%) |
| 30 to 34 Minutes | 210 (9.0%) | 284 (11.7%) |
| 35 to 39 Minutes | 42 (1.8%) | 71 (2.9%) |
| 40 to 44 Minutes | 190 (8.2%) | 176 (7.3%) |
| 45 to 59 Minutes | 148 (6.4%) | 72 (3.0%) |
| 60 to 89 Minutes | 52 (2.2%) | 55 (2.3%) |
| 90 or more Minutes | 24 (1.0%) | 0 (0.0%) |
Time of Departure to Work by Sex in Berwick borough
The most frequent times of departure to work in Berwick borough are 7:00 AM to 7:29 AM (649, 27.9%) for males and 7:00 AM to 7:29 AM (673, 27.8%) for females.
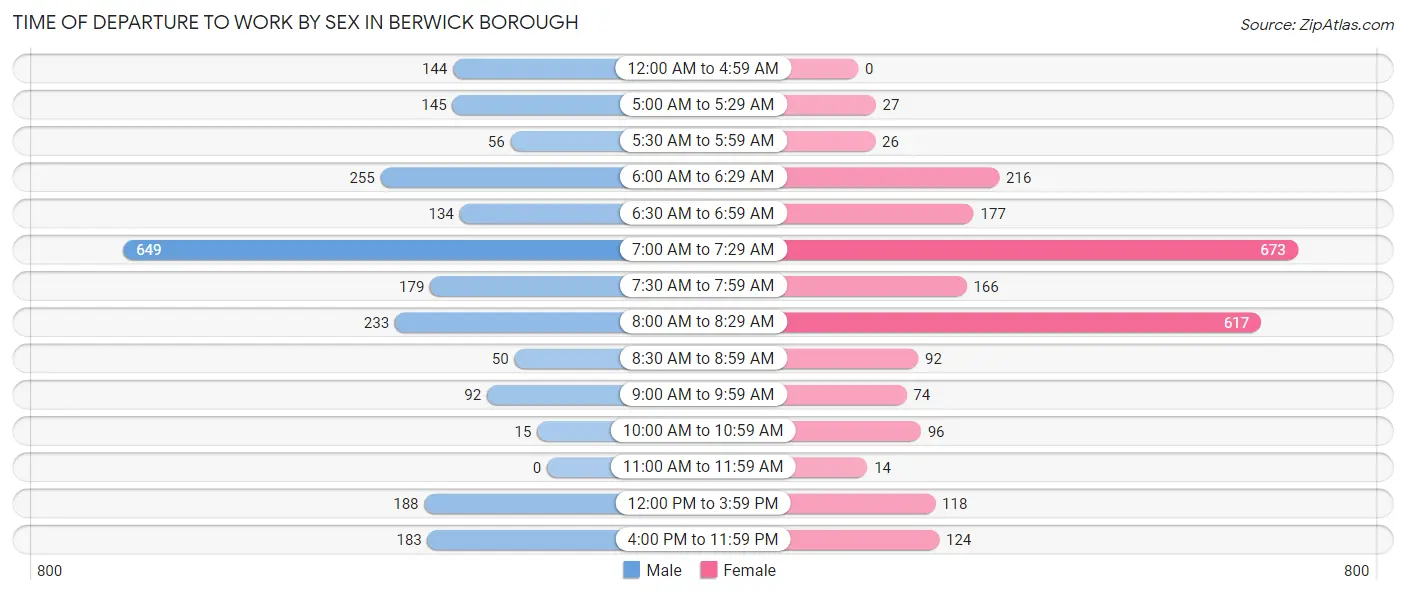
| Time of Departure | Male | Female |
| 12:00 AM to 4:59 AM | 144 (6.2%) | 0 (0.0%) |
| 5:00 AM to 5:29 AM | 145 (6.2%) | 27 (1.1%) |
| 5:30 AM to 5:59 AM | 56 (2.4%) | 26 (1.1%) |
| 6:00 AM to 6:29 AM | 255 (11.0%) | 216 (8.9%) |
| 6:30 AM to 6:59 AM | 134 (5.8%) | 177 (7.3%) |
| 7:00 AM to 7:29 AM | 649 (27.9%) | 673 (27.8%) |
| 7:30 AM to 7:59 AM | 179 (7.7%) | 166 (6.9%) |
| 8:00 AM to 8:29 AM | 233 (10.0%) | 617 (25.5%) |
| 8:30 AM to 8:59 AM | 50 (2.1%) | 92 (3.8%) |
| 9:00 AM to 9:59 AM | 92 (4.0%) | 74 (3.1%) |
| 10:00 AM to 10:59 AM | 15 (0.6%) | 96 (4.0%) |
| 11:00 AM to 11:59 AM | 0 (0.0%) | 14 (0.6%) |
| 12:00 PM to 3:59 PM | 188 (8.1%) | 118 (4.9%) |
| 4:00 PM to 11:59 PM | 183 (7.9%) | 124 (5.1%) |
| Total | 2,323 (100.0%) | 2,420 (100.0%) |
Housing Occupancy in Berwick borough
Occupancy by Ownership in Berwick borough
Of the total 4,557 dwellings in Berwick borough, owner-occupied units account for 2,816 (61.8%), while renter-occupied units make up 1,741 (38.2%).
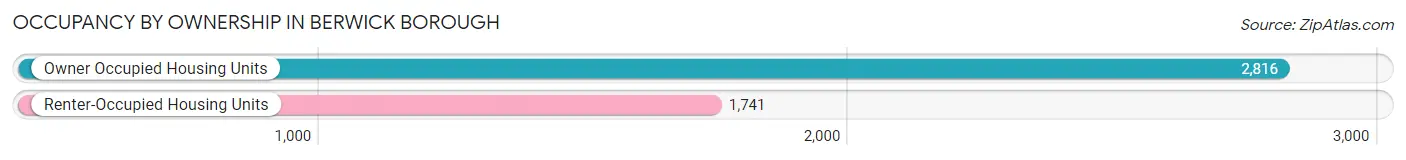
| Occupancy | # Housing Units | % Housing Units |
| Owner Occupied Housing Units | 2,816 | 61.8% |
| Renter-Occupied Housing Units | 1,741 | 38.2% |
| Total Occupied Housing Units | 4,557 | 100.0% |
Occupancy by Household Size in Berwick borough
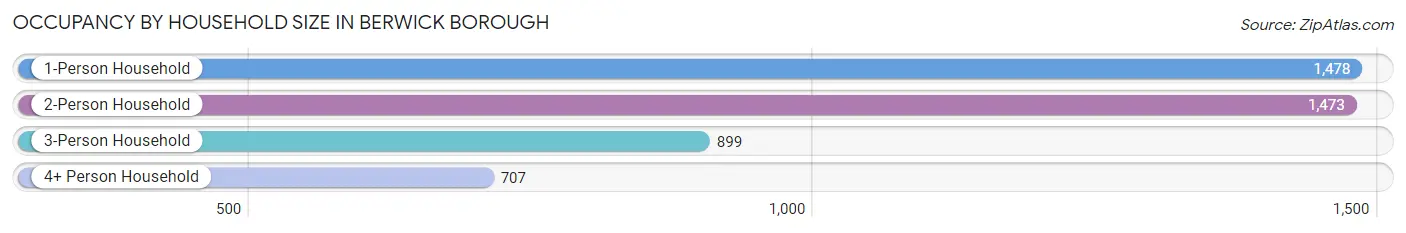
| Household Size | # Housing Units | % Housing Units |
| 1-Person Household | 1,478 | 32.4% |
| 2-Person Household | 1,473 | 32.3% |
| 3-Person Household | 899 | 19.7% |
| 4+ Person Household | 707 | 15.5% |
| Total Housing Units | 4,557 | 100.0% |
Occupancy by Ownership by Household Size in Berwick borough
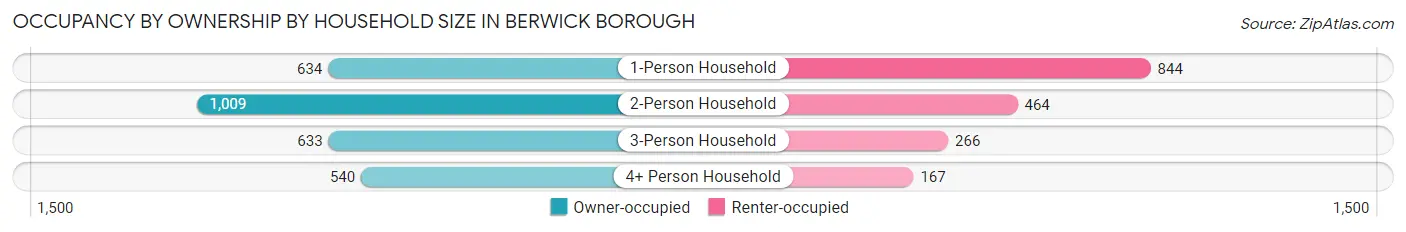
| Household Size | Owner-occupied | Renter-occupied |
| 1-Person Household | 634 (42.9%) | 844 (57.1%) |
| 2-Person Household | 1,009 (68.5%) | 464 (31.5%) |
| 3-Person Household | 633 (70.4%) | 266 (29.6%) |
| 4+ Person Household | 540 (76.4%) | 167 (23.6%) |
| Total Housing Units | 2,816 (61.8%) | 1,741 (38.2%) |
Occupancy by Educational Attainment in Berwick borough
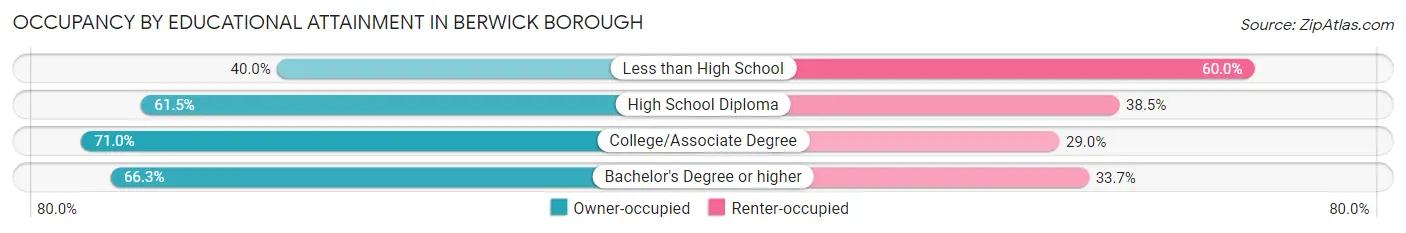
| Household Size | Owner-occupied | Renter-occupied |
| Less than High School | 237 (40.0%) | 355 (60.0%) |
| High School Diploma | 1,251 (61.5%) | 784 (38.5%) |
| College/Associate Degree | 734 (71.0%) | 300 (29.0%) |
| Bachelor's Degree or higher | 594 (66.3%) | 302 (33.7%) |
Occupancy by Age of Householder in Berwick borough
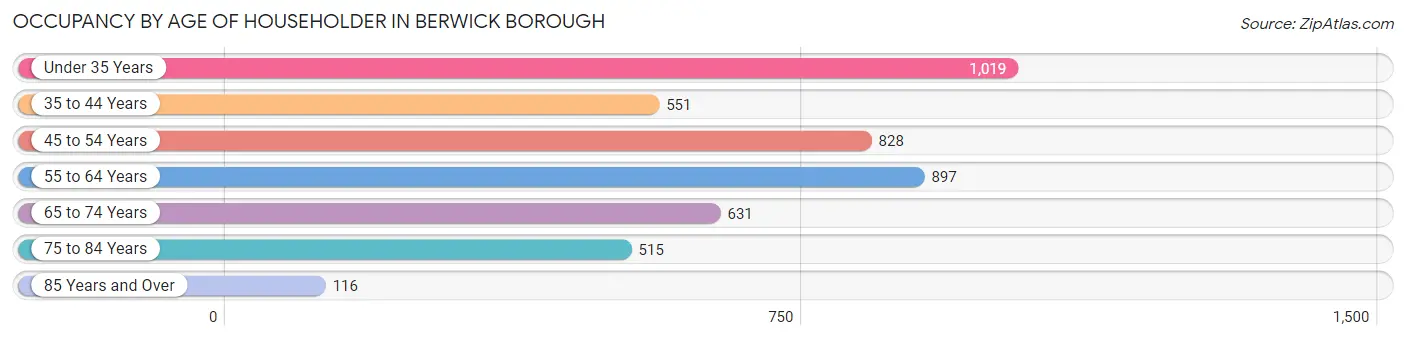
| Age Bracket | # Households | % Households |
| Under 35 Years | 1,019 | 22.4% |
| 35 to 44 Years | 551 | 12.1% |
| 45 to 54 Years | 828 | 18.2% |
| 55 to 64 Years | 897 | 19.7% |
| 65 to 74 Years | 631 | 13.9% |
| 75 to 84 Years | 515 | 11.3% |
| 85 Years and Over | 116 | 2.5% |
| Total | 4,557 | 100.0% |
Housing Finances in Berwick borough
Median Income by Occupancy in Berwick borough
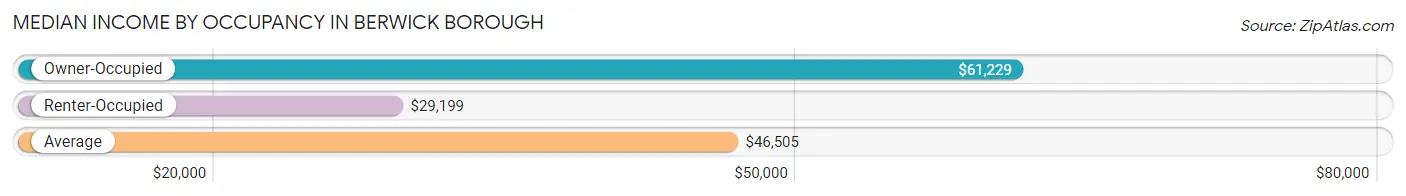
| Occupancy Type | # Households | Median Income |
| Owner-Occupied | 2,816 (61.8%) | $61,229 |
| Renter-Occupied | 1,741 (38.2%) | $29,199 |
| Average | 4,557 (100.0%) | $46,505 |
Occupancy by Householder Income Bracket in Berwick borough
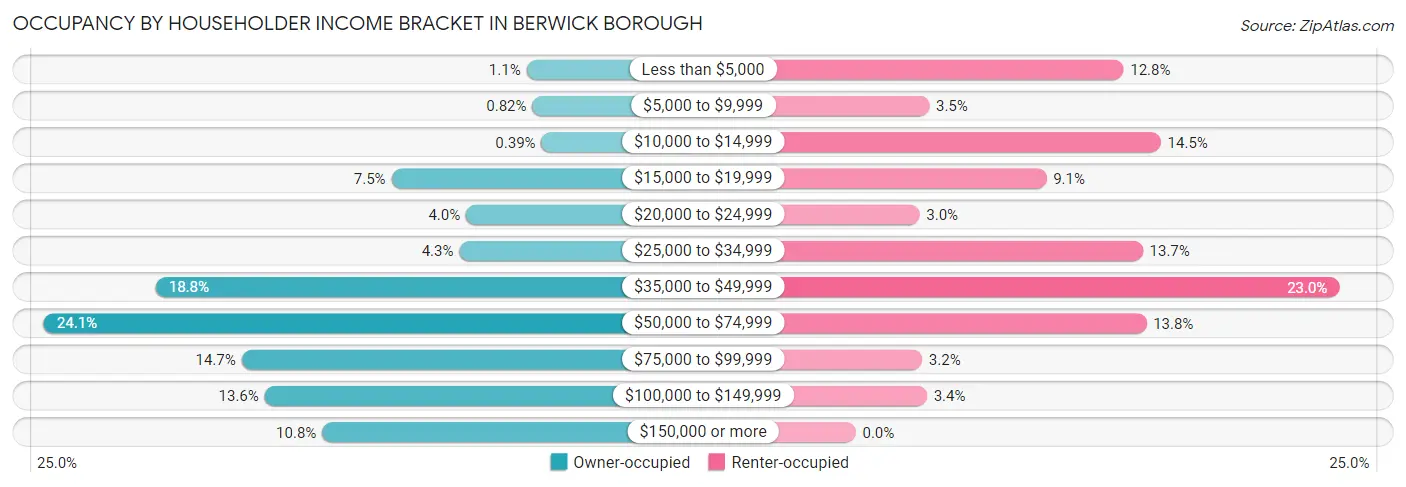
| Income Bracket | Owner-occupied | Renter-occupied |
| Less than $5,000 | 31 (1.1%) | 222 (12.8%) |
| $5,000 to $9,999 | 23 (0.8%) | 61 (3.5%) |
| $10,000 to $14,999 | 11 (0.4%) | 253 (14.5%) |
| $15,000 to $19,999 | 212 (7.5%) | 158 (9.1%) |
| $20,000 to $24,999 | 112 (4.0%) | 53 (3.0%) |
| $25,000 to $34,999 | 121 (4.3%) | 238 (13.7%) |
| $35,000 to $49,999 | 528 (18.8%) | 401 (23.0%) |
| $50,000 to $74,999 | 678 (24.1%) | 241 (13.8%) |
| $75,000 to $99,999 | 413 (14.7%) | 55 (3.2%) |
| $100,000 to $149,999 | 382 (13.6%) | 59 (3.4%) |
| $150,000 or more | 305 (10.8%) | 0 (0.0%) |
| Total | 2,816 (100.0%) | 1,741 (100.0%) |
Monthly Housing Cost Tiers in Berwick borough
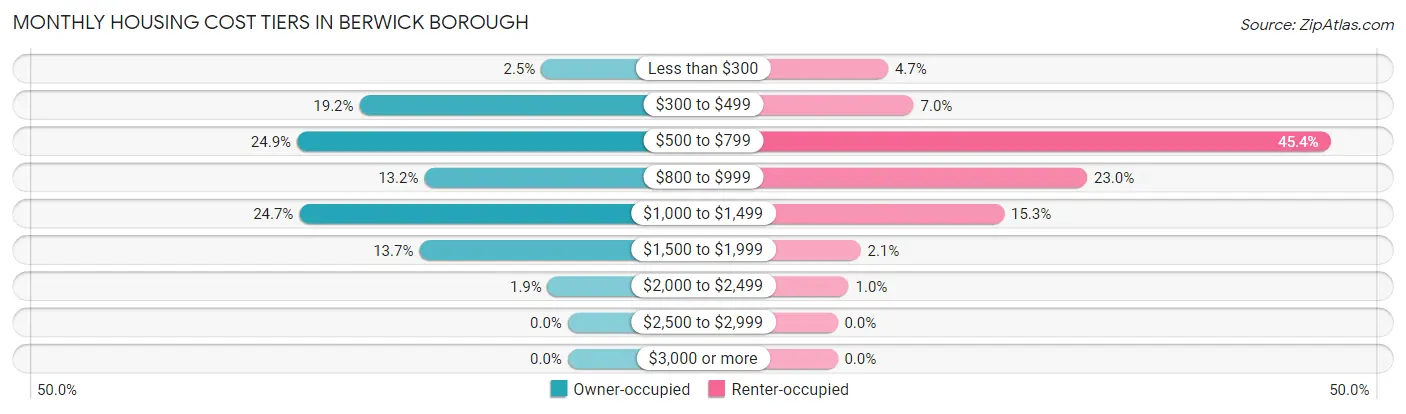
| Monthly Cost | Owner-occupied | Renter-occupied |
| Less than $300 | 69 (2.5%) | 81 (4.6%) |
| $300 to $499 | 540 (19.2%) | 122 (7.0%) |
| $500 to $799 | 702 (24.9%) | 790 (45.4%) |
| $800 to $999 | 372 (13.2%) | 400 (23.0%) |
| $1,000 to $1,499 | 696 (24.7%) | 267 (15.3%) |
| $1,500 to $1,999 | 385 (13.7%) | 37 (2.1%) |
| $2,000 to $2,499 | 52 (1.8%) | 18 (1.0%) |
| $2,500 to $2,999 | 0 (0.0%) | 0 (0.0%) |
| $3,000 or more | 0 (0.0%) | 0 (0.0%) |
| Total | 2,816 (100.0%) | 1,741 (100.0%) |
Physical Housing Characteristics in Berwick borough
Housing Structures in Berwick borough
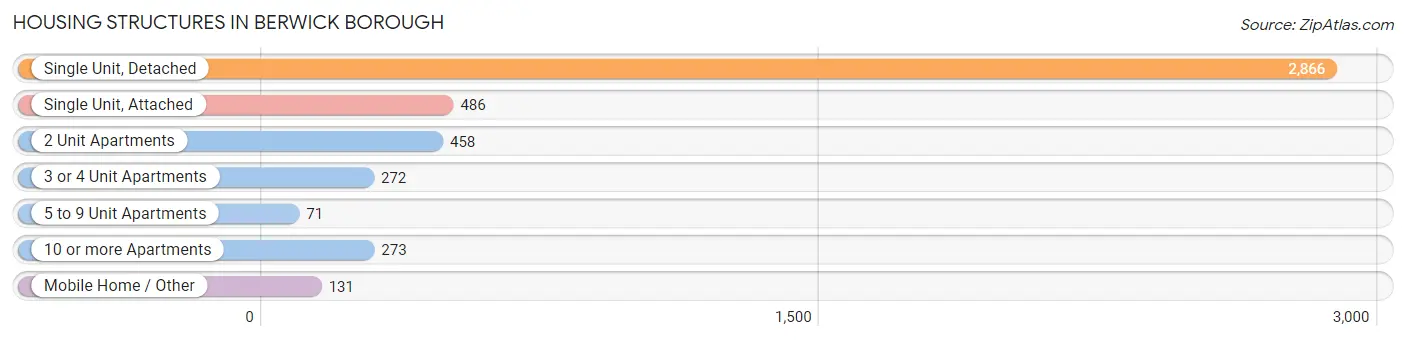
| Structure Type | # Housing Units | % Housing Units |
| Single Unit, Detached | 2,866 | 62.9% |
| Single Unit, Attached | 486 | 10.7% |
| 2 Unit Apartments | 458 | 10.1% |
| 3 or 4 Unit Apartments | 272 | 6.0% |
| 5 to 9 Unit Apartments | 71 | 1.6% |
| 10 or more Apartments | 273 | 6.0% |
| Mobile Home / Other | 131 | 2.9% |
| Total | 4,557 | 100.0% |
Housing Structures by Occupancy in Berwick borough
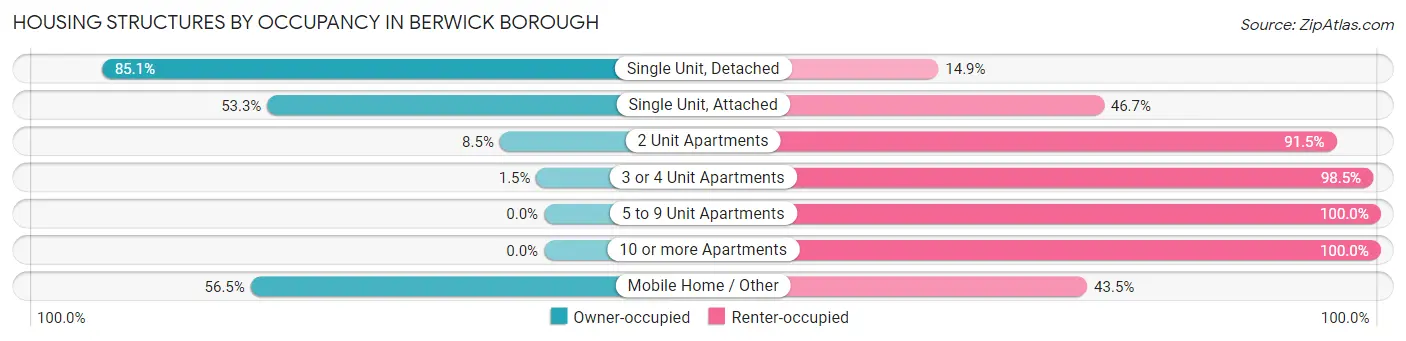
| Structure Type | Owner-occupied | Renter-occupied |
| Single Unit, Detached | 2,440 (85.1%) | 426 (14.9%) |
| Single Unit, Attached | 259 (53.3%) | 227 (46.7%) |
| 2 Unit Apartments | 39 (8.5%) | 419 (91.5%) |
| 3 or 4 Unit Apartments | 4 (1.5%) | 268 (98.5%) |
| 5 to 9 Unit Apartments | 0 (0.0%) | 71 (100.0%) |
| 10 or more Apartments | 0 (0.0%) | 273 (100.0%) |
| Mobile Home / Other | 74 (56.5%) | 57 (43.5%) |
| Total | 2,816 (61.8%) | 1,741 (38.2%) |
Housing Structures by Number of Rooms in Berwick borough
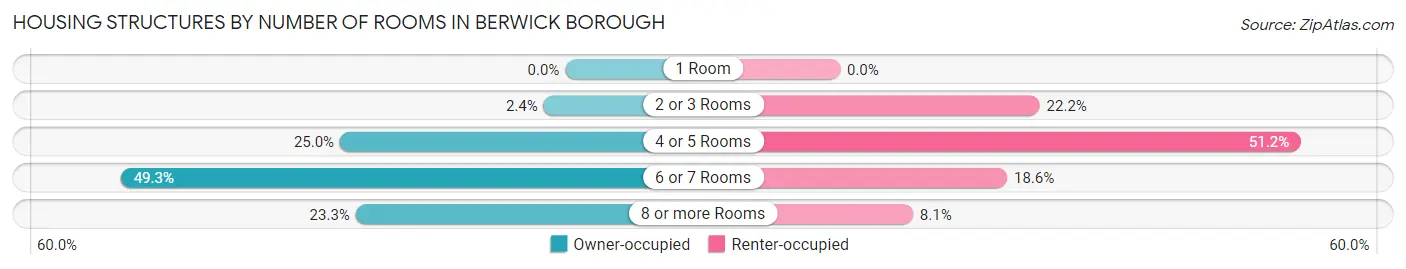
| Number of Rooms | Owner-occupied | Renter-occupied |
| 1 Room | 0 (0.0%) | 0 (0.0%) |
| 2 or 3 Rooms | 68 (2.4%) | 386 (22.2%) |
| 4 or 5 Rooms | 704 (25.0%) | 891 (51.2%) |
| 6 or 7 Rooms | 1,389 (49.3%) | 323 (18.5%) |
| 8 or more Rooms | 655 (23.3%) | 141 (8.1%) |
| Total | 2,816 (100.0%) | 1,741 (100.0%) |
Housing Structure by Heating Type in Berwick borough
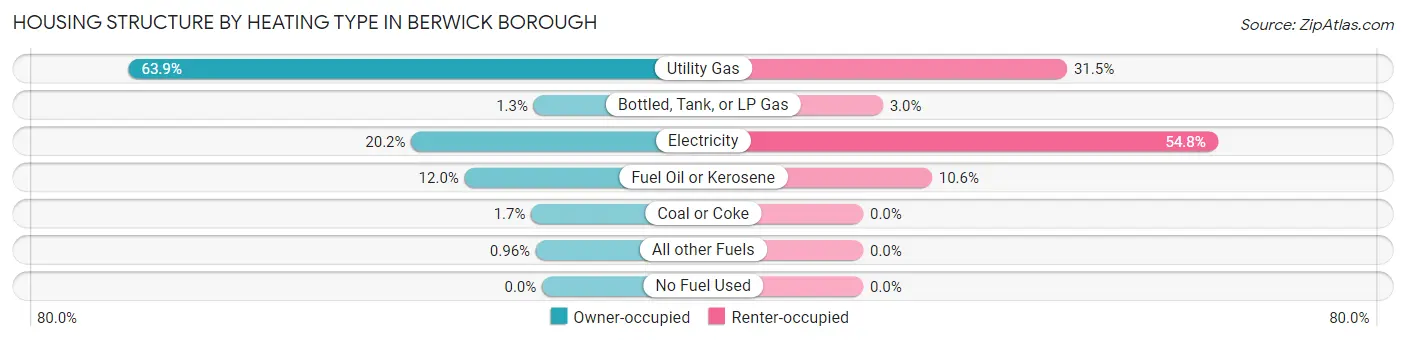
| Heating Type | Owner-occupied | Renter-occupied |
| Utility Gas | 1,800 (63.9%) | 549 (31.5%) |
| Bottled, Tank, or LP Gas | 36 (1.3%) | 53 (3.0%) |
| Electricity | 569 (20.2%) | 954 (54.8%) |
| Fuel Oil or Kerosene | 337 (12.0%) | 185 (10.6%) |
| Coal or Coke | 47 (1.7%) | 0 (0.0%) |
| All other Fuels | 27 (1.0%) | 0 (0.0%) |
| No Fuel Used | 0 (0.0%) | 0 (0.0%) |
| Total | 2,816 (100.0%) | 1,741 (100.0%) |
Household Vehicle Usage in Berwick borough
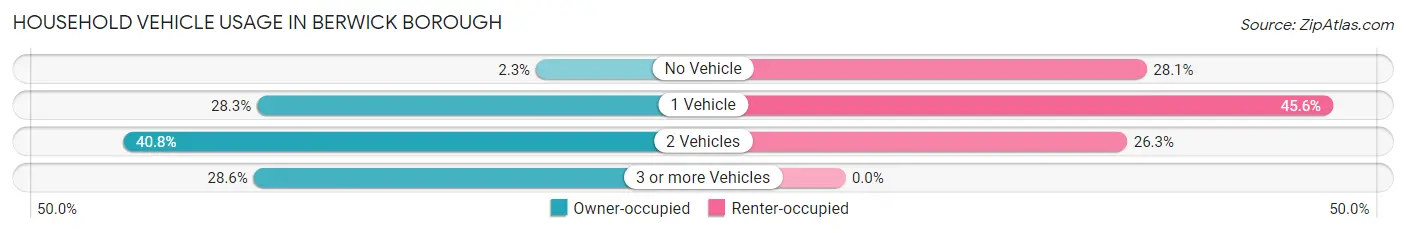
| Vehicles per Household | Owner-occupied | Renter-occupied |
| No Vehicle | 64 (2.3%) | 490 (28.1%) |
| 1 Vehicle | 797 (28.3%) | 793 (45.6%) |
| 2 Vehicles | 1,149 (40.8%) | 458 (26.3%) |
| 3 or more Vehicles | 806 (28.6%) | 0 (0.0%) |
| Total | 2,816 (100.0%) | 1,741 (100.0%) |
Real Estate & Mortgages in Berwick borough
Real Estate and Mortgage Overview in Berwick borough
| Characteristic | Without Mortgage | With Mortgage |
| Housing Units | 1,320 | 1,496 |
| Median Property Value | $113,900 | $161,600 |
| Median Household Income | $47,192 | $156 |
| Monthly Housing Costs | $517 | $0 |
| Real Estate Taxes | $1,434 | $30 |
Property Value by Mortgage Status in Berwick borough
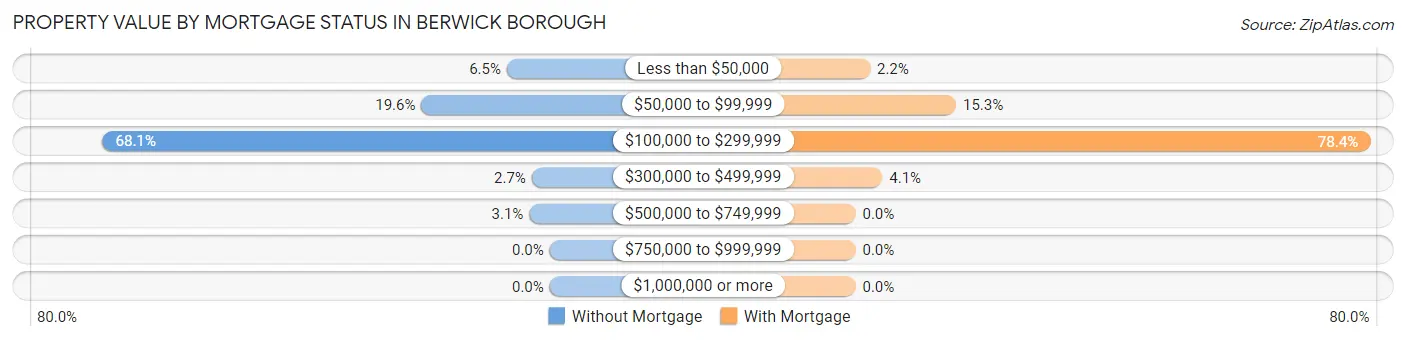
| Property Value | Without Mortgage | With Mortgage |
| Less than $50,000 | 86 (6.5%) | 33 (2.2%) |
| $50,000 to $99,999 | 258 (19.6%) | 229 (15.3%) |
| $100,000 to $299,999 | 899 (68.1%) | 1,173 (78.4%) |
| $300,000 to $499,999 | 36 (2.7%) | 61 (4.1%) |
| $500,000 to $749,999 | 41 (3.1%) | 0 (0.0%) |
| $750,000 to $999,999 | 0 (0.0%) | 0 (0.0%) |
| $1,000,000 or more | 0 (0.0%) | 0 (0.0%) |
| Total | 1,320 (100.0%) | 1,496 (100.0%) |
Household Income by Mortgage Status in Berwick borough
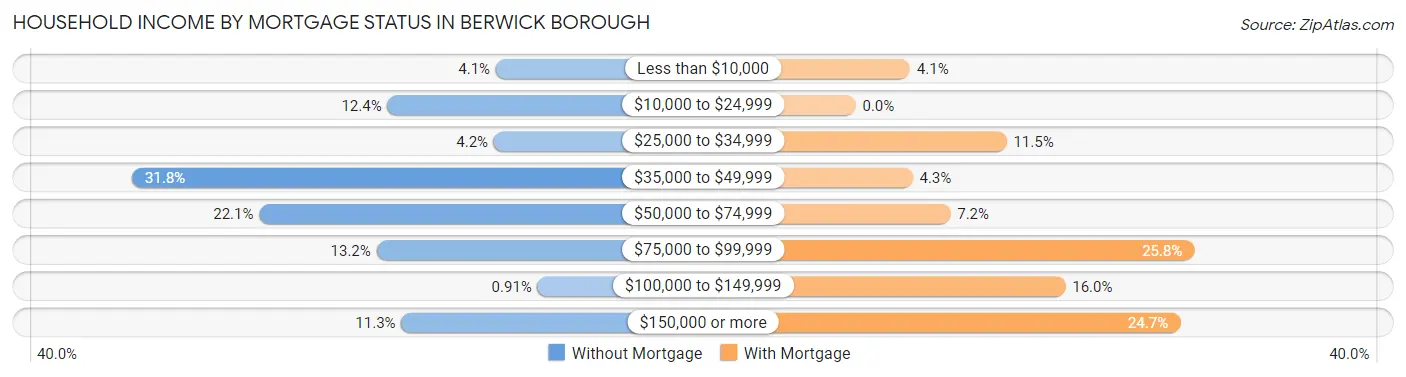
| Household Income | Without Mortgage | With Mortgage |
| Less than $10,000 | 54 (4.1%) | 62 (4.1%) |
| $10,000 to $24,999 | 163 (12.3%) | 0 (0.0%) |
| $25,000 to $34,999 | 56 (4.2%) | 172 (11.5%) |
| $35,000 to $49,999 | 420 (31.8%) | 65 (4.3%) |
| $50,000 to $74,999 | 292 (22.1%) | 108 (7.2%) |
| $75,000 to $99,999 | 174 (13.2%) | 386 (25.8%) |
| $100,000 to $149,999 | 12 (0.9%) | 239 (16.0%) |
| $150,000 or more | 149 (11.3%) | 370 (24.7%) |
| Total | 1,320 (100.0%) | 1,496 (100.0%) |
Property Value to Household Income Ratio in Berwick borough
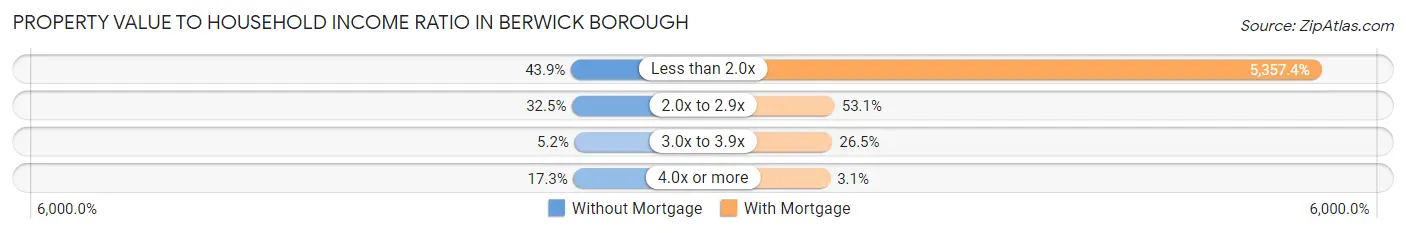
| Value-to-Income Ratio | Without Mortgage | With Mortgage |
| Less than 2.0x | 580 (43.9%) | 80,147 (5,357.4%) |
| 2.0x to 2.9x | 429 (32.5%) | 795 (53.1%) |
| 3.0x to 3.9x | 68 (5.1%) | 396 (26.5%) |
| 4.0x or more | 228 (17.3%) | 46 (3.1%) |
| Total | 1,320 (100.0%) | 1,496 (100.0%) |
Real Estate Taxes by Mortgage Status in Berwick borough
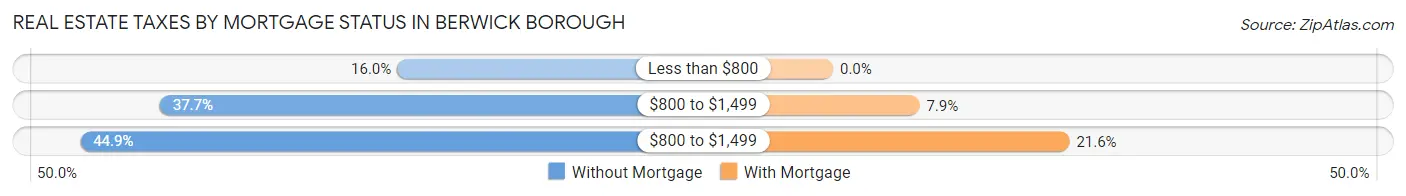
| Property Taxes | Without Mortgage | With Mortgage |
| Less than $800 | 211 (16.0%) | 0 (0.0%) |
| $800 to $1,499 | 497 (37.7%) | 118 (7.9%) |
| $800 to $1,499 | 593 (44.9%) | 323 (21.6%) |
| Total | 1,320 (100.0%) | 1,496 (100.0%) |
Health & Disability in Berwick borough
Health Insurance Coverage by Age in Berwick borough
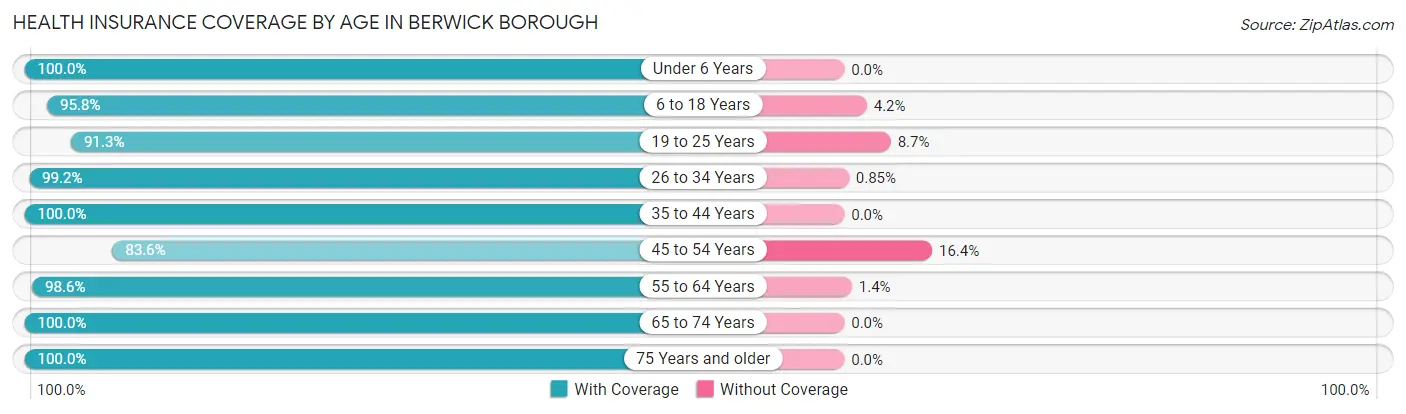
| Age Bracket | With Coverage | Without Coverage |
| Under 6 Years | 568 (100.0%) | 0 (0.0%) |
| 6 to 18 Years | 1,303 (95.8%) | 57 (4.2%) |
| 19 to 25 Years | 875 (91.3%) | 83 (8.7%) |
| 26 to 34 Years | 1,518 (99.2%) | 13 (0.9%) |
| 35 to 44 Years | 1,136 (100.0%) | 0 (0.0%) |
| 45 to 54 Years | 1,257 (83.6%) | 246 (16.4%) |
| 55 to 64 Years | 1,331 (98.6%) | 19 (1.4%) |
| 65 to 74 Years | 948 (100.0%) | 0 (0.0%) |
| 75 Years and older | 891 (100.0%) | 0 (0.0%) |
| Total | 9,827 (95.9%) | 418 (4.1%) |
Health Insurance Coverage by Citizenship Status in Berwick borough
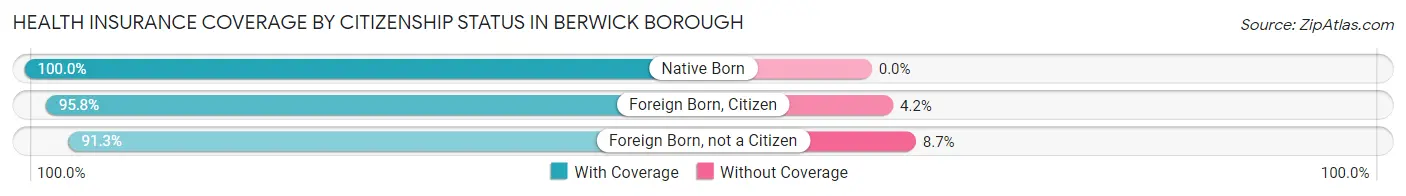
| Citizenship Status | With Coverage | Without Coverage |
| Native Born | 568 (100.0%) | 0 (0.0%) |
| Foreign Born, Citizen | 1,303 (95.8%) | 57 (4.2%) |
| Foreign Born, not a Citizen | 875 (91.3%) | 83 (8.7%) |
Health Insurance Coverage by Household Income in Berwick borough
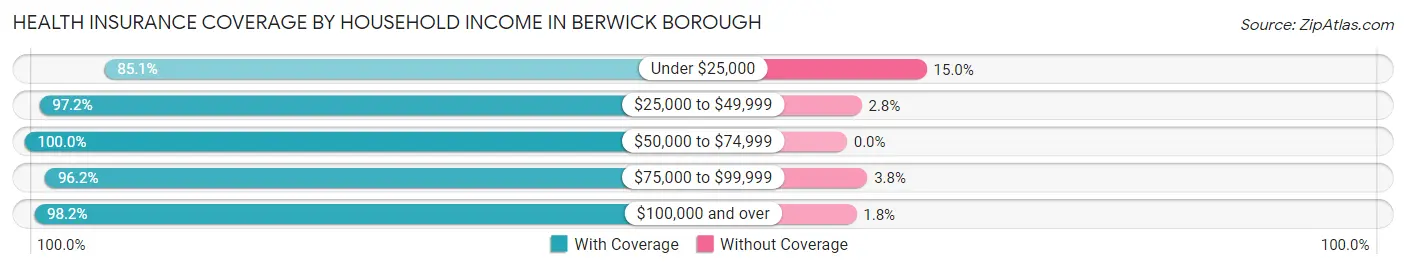
| Household Income | With Coverage | Without Coverage |
| Under $25,000 | 1,394 (85.1%) | 245 (14.9%) |
| $25,000 to $49,999 | 2,752 (97.2%) | 78 (2.8%) |
| $50,000 to $74,999 | 2,162 (100.0%) | 0 (0.0%) |
| $75,000 to $99,999 | 1,431 (96.2%) | 57 (3.8%) |
| $100,000 and over | 2,083 (98.2%) | 38 (1.8%) |
Public vs Private Health Insurance Coverage by Age in Berwick borough
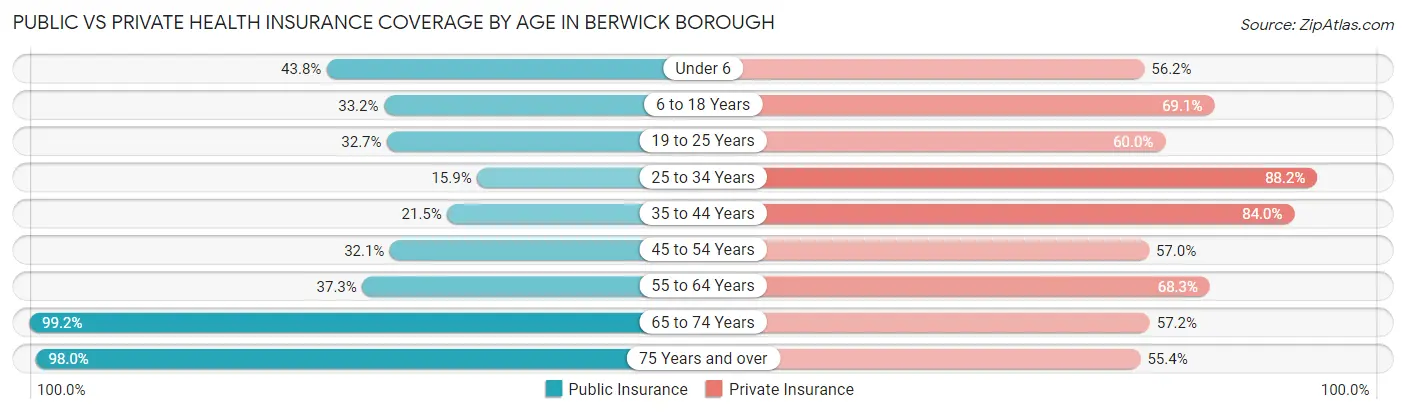
| Age Bracket | Public Insurance | Private Insurance |
| Under 6 | 249 (43.8%) | 319 (56.2%) |
| 6 to 18 Years | 452 (33.2%) | 940 (69.1%) |
| 19 to 25 Years | 313 (32.7%) | 575 (60.0%) |
| 25 to 34 Years | 244 (15.9%) | 1,351 (88.2%) |
| 35 to 44 Years | 244 (21.5%) | 954 (84.0%) |
| 45 to 54 Years | 483 (32.1%) | 857 (57.0%) |
| 55 to 64 Years | 503 (37.3%) | 922 (68.3%) |
| 65 to 74 Years | 940 (99.2%) | 542 (57.2%) |
| 75 Years and over | 873 (98.0%) | 494 (55.4%) |
| Total | 4,301 (42.0%) | 6,954 (67.9%) |
Disability Status by Sex by Age in Berwick borough
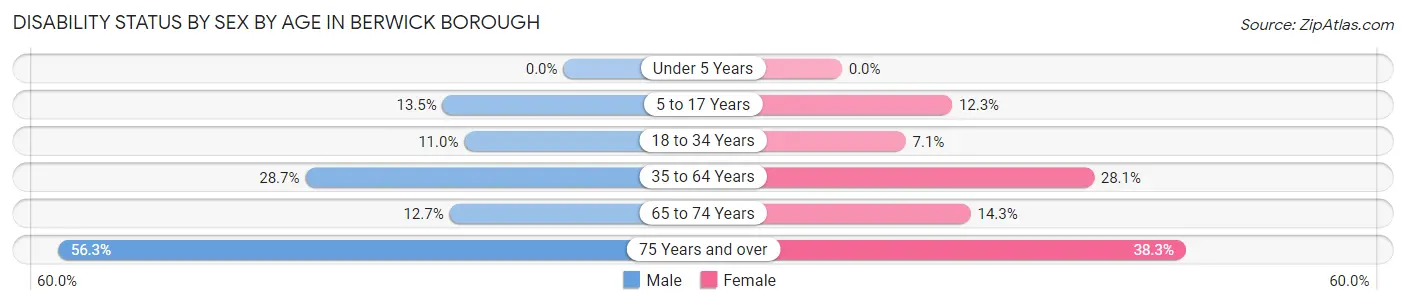
| Age Bracket | Male | Female |
| Under 5 Years | 0 (0.0%) | 0 (0.0%) |
| 5 to 17 Years | 110 (13.5%) | 75 (12.3%) |
| 18 to 34 Years | 131 (11.0%) | 95 (7.1%) |
| 35 to 64 Years | 625 (28.7%) | 509 (28.1%) |
| 65 to 74 Years | 53 (12.7%) | 76 (14.3%) |
| 75 Years and over | 143 (56.3%) | 244 (38.3%) |
Disability Class by Sex by Age in Berwick borough
Disability Class: Hearing Difficulty
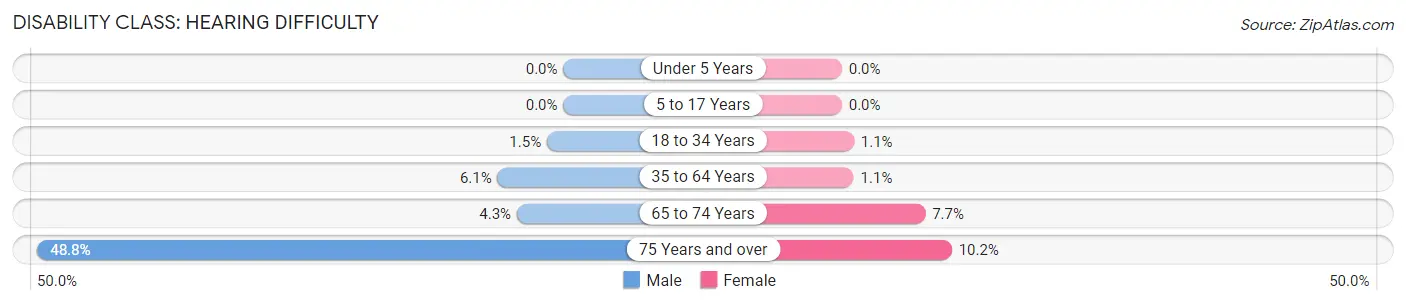
| Age Bracket | Male | Female |
| Under 5 Years | 0 (0.0%) | 0 (0.0%) |
| 5 to 17 Years | 0 (0.0%) | 0 (0.0%) |
| 18 to 34 Years | 18 (1.5%) | 15 (1.1%) |
| 35 to 64 Years | 133 (6.1%) | 20 (1.1%) |
| 65 to 74 Years | 18 (4.3%) | 41 (7.7%) |
| 75 Years and over | 124 (48.8%) | 65 (10.2%) |
Disability Class: Vision Difficulty
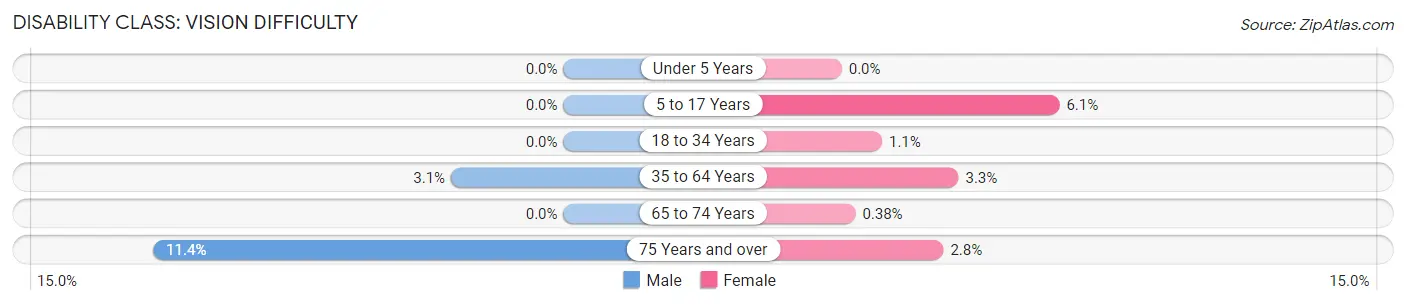
| Age Bracket | Male | Female |
| Under 5 Years | 0 (0.0%) | 0 (0.0%) |
| 5 to 17 Years | 0 (0.0%) | 37 (6.1%) |
| 18 to 34 Years | 0 (0.0%) | 15 (1.1%) |
| 35 to 64 Years | 68 (3.1%) | 59 (3.3%) |
| 65 to 74 Years | 0 (0.0%) | 2 (0.4%) |
| 75 Years and over | 29 (11.4%) | 18 (2.8%) |
Disability Class: Cognitive Difficulty
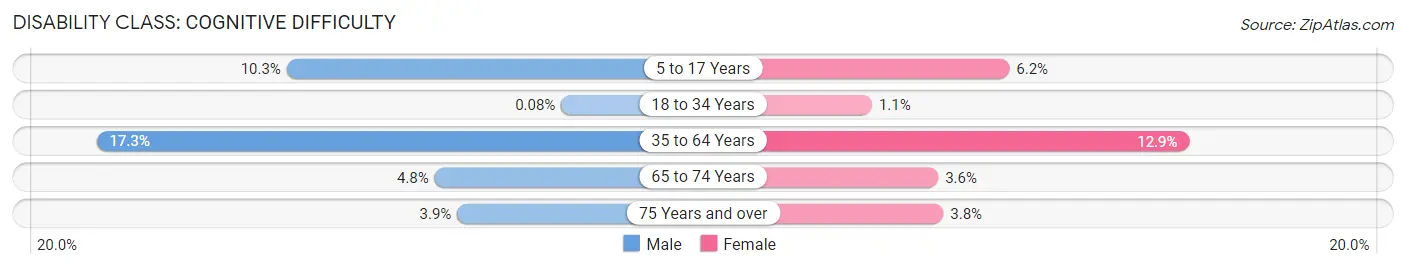
| Age Bracket | Male | Female |
| 5 to 17 Years | 84 (10.3%) | 38 (6.2%) |
| 18 to 34 Years | 1 (0.1%) | 15 (1.1%) |
| 35 to 64 Years | 377 (17.3%) | 234 (12.9%) |
| 65 to 74 Years | 20 (4.8%) | 19 (3.6%) |
| 75 Years and over | 10 (3.9%) | 24 (3.8%) |
Disability Class: Ambulatory Difficulty
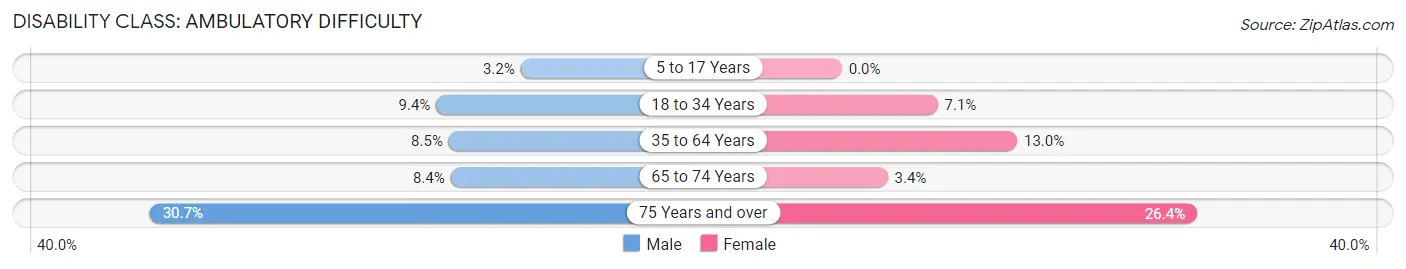
| Age Bracket | Male | Female |
| 5 to 17 Years | 26 (3.2%) | 0 (0.0%) |
| 18 to 34 Years | 112 (9.4%) | 95 (7.1%) |
| 35 to 64 Years | 185 (8.5%) | 236 (13.0%) |
| 65 to 74 Years | 35 (8.4%) | 18 (3.4%) |
| 75 Years and over | 78 (30.7%) | 168 (26.4%) |
Disability Class: Self-Care Difficulty
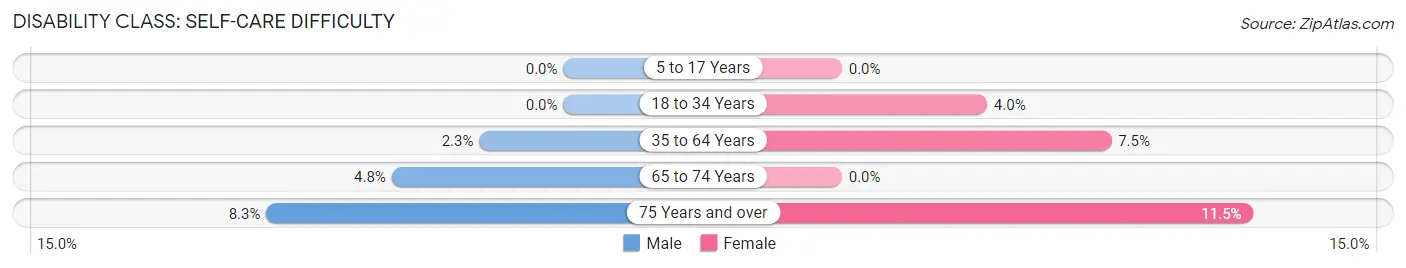
| Age Bracket | Male | Female |
| 5 to 17 Years | 0 (0.0%) | 0 (0.0%) |
| 18 to 34 Years | 0 (0.0%) | 54 (4.0%) |
| 35 to 64 Years | 51 (2.3%) | 136 (7.5%) |
| 65 to 74 Years | 20 (4.8%) | 0 (0.0%) |
| 75 Years and over | 21 (8.3%) | 73 (11.5%) |
Technology Access in Berwick borough
Computing Device Access in Berwick borough
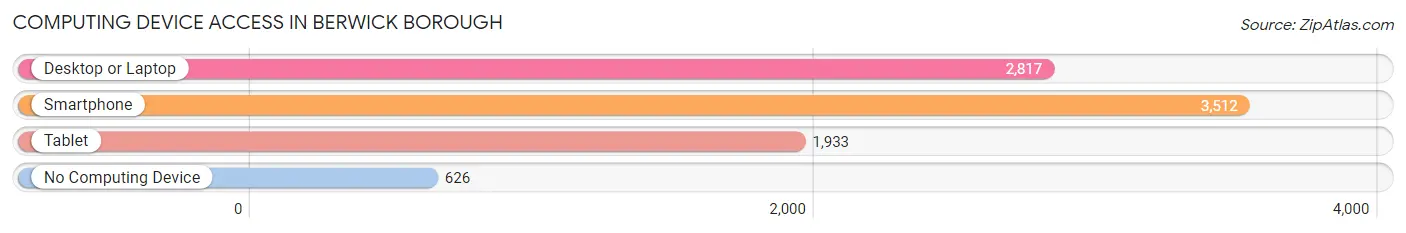
| Device Type | # Households | % Households |
| Desktop or Laptop | 2,817 | 61.8% |
| Smartphone | 3,512 | 77.1% |
| Tablet | 1,933 | 42.4% |
| No Computing Device | 626 | 13.7% |
| Total | 4,557 | 100.0% |
Internet Access in Berwick borough
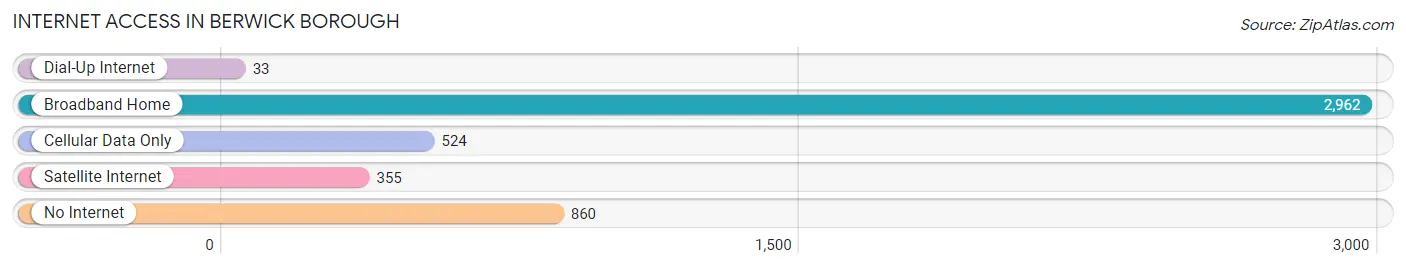
| Internet Type | # Households | % Households |
| Dial-Up Internet | 33 | 0.7% |
| Broadband Home | 2,962 | 65.0% |
| Cellular Data Only | 524 | 11.5% |
| Satellite Internet | 355 | 7.8% |
| No Internet | 860 | 18.9% |
| Total | 4,557 | 100.0% |
Berwick borough Summary
Berwick Borough is a small borough located in Columbia County, Pennsylvania. It is situated along the Susquehanna River, approximately 10 miles south of Bloomsburg and 25 miles northwest of Wilkes-Barre. The borough has a population of approximately 10,000 people and covers an area of 1.3 square miles.
History
Berwick was founded in 1786 by a group of settlers from Connecticut. The town was named after Berwick-upon-Tweed, a town in England. The town was incorporated in 1818 and was the first borough in Columbia County.
Berwick was an important stop on the Susquehanna and Tidewater Canal, which opened in 1834. The canal was used to transport coal and other goods from the coal mines in the area. The canal was eventually replaced by the Pennsylvania Railroad in 1857.
Berwick was an important industrial center in the late 19th and early 20th centuries. The town was home to several factories, including the Berwick Iron Works, the Berwick Foundry, and the Berwick Car Works. The town was also home to several coal mines, which provided employment for many of the town’s residents.
Geography
Berwick is located in the Susquehanna Valley, which is part of the Appalachian Mountains. The borough is situated along the Susquehanna River, which forms the western boundary of the borough. The borough is located in a hilly area, with elevations ranging from 500 to 1,000 feet above sea level.
The climate in Berwick is humid continental, with cold winters and hot, humid summers. The average annual temperature is 48°F, and the average annual precipitation is 40 inches.
Economy
Berwick’s economy is largely based on manufacturing and services. The town is home to several factories, including the Berwick Iron Works, the Berwick Foundry, and the Berwick Car Works. The town is also home to several retail stores, restaurants, and other businesses.
The town is also home to several coal mines, which provide employment for many of the town’s residents. The coal mines are owned by several companies, including the Berwick Coal Company and the Berwick Mining Company.
Demographics
As of the 2010 census, the population of Berwick was 10,477. The racial makeup of the borough was 94.3% White, 2.3% African American, 0.3% Native American, 0.7% Asian, 0.1% Pacific Islander, 0.9% from other races, and 1.4% from two or more races. Hispanic or Latino of any race were 2.7% of the population.
The median household income in Berwick was $37,917, and the median family income was $45,938. The per capita income was $19,945. About 11.3% of families and 14.2% of the population were below the poverty line, including 19.2% of those under age 18 and 8.2% of those age 65 or over.
Berwick is served by the Berwick Area School District, which includes four elementary schools, one middle school, and one high school. The borough is also home to several churches, including the First Presbyterian Church, the First United Methodist Church, and the Berwick Baptist Church.
Common Questions
What is Per Capita Income in Berwick borough?
Per Capita income in Berwick borough is $27,673.
What is the Median Family Income in Berwick borough?
Median Family Income in Berwick borough is $52,706.
What is the Median Household income in Berwick borough?
Median Household Income in Berwick borough is $46,505.
What is Income or Wage Gap in Berwick borough?
Income or Wage Gap in Berwick borough is 34.4%.
Women in Berwick borough earn 65.6 cents for every dollar earned by a man.
What is Inequality or Gini Index in Berwick borough?
Inequality or Gini Index in Berwick borough is 0.44.
What is the Total Population of Berwick borough?
Total Population of Berwick borough is 10,318.
What is the Total Male Population of Berwick borough?
Total Male Population of Berwick borough is 5,130.
What is the Total Female Population of Berwick borough?
Total Female Population of Berwick borough is 5,188.
What is the Ratio of Males per 100 Females in Berwick borough?
There are 98.88 Males per 100 Females in Berwick borough.
What is the Ratio of Females per 100 Males in Berwick borough?
There are 101.13 Females per 100 Males in Berwick borough.
What is the Median Population Age in Berwick borough?
Median Population Age in Berwick borough is 41.7 Years.
What is the Average Family Size in Berwick borough
Average Family Size in Berwick borough is 2.8 People.
What is the Average Household Size in Berwick borough
Average Household Size in Berwick borough is 2.2 People.
How Large is the Labor Force in Berwick borough?
There are 5,211 People in the Labor Forcein in Berwick borough.
What is the Percentage of People in the Labor Force in Berwick borough?
60.2% of People are in the Labor Force in Berwick borough.
What is the Unemployment Rate in Berwick borough?
Unemployment Rate in Berwick borough is 4.0%.