Saxton borough, PA Map & Demographics
Saxton borough Overview
$22,764
PER CAPITA INCOME
$52,188
AVG FAMILY INCOME
$36,250
AVG HOUSEHOLD INCOME
9.6%
WAGE / INCOME GAP [ % ]
90.4¢/ $1
WAGE / INCOME GAP [ $ ]
0.40
INEQUALITY / GINI INDEX
655
TOTAL POPULATION
312
MALE POPULATION
343
FEMALE POPULATION
90.96
MALES / 100 FEMALES
109.94
FEMALES / 100 MALES
43.9
MEDIAN AGE
2.9
AVG FAMILY SIZE
2.1
AVG HOUSEHOLD SIZE
252
LABOR FORCE [ PEOPLE ]
47.0%
PERCENT IN LABOR FORCE
11.1%
UNEMPLOYMENT RATE
Income in Saxton borough
Income Overview in Saxton borough
Per Capita Income in Saxton borough is $22,764, while median incomes of families and households are $52,188 and $36,250 respectively.
| Characteristic | Number | Measure |
| Per Capita Income | 655 | $22,764 |
| Median Family Income | 160 | $52,188 |
| Mean Family Income | 160 | $56,816 |
| Median Household Income | 307 | $36,250 |
| Mean Household Income | 307 | $46,187 |
| Income Deficit | 160 | $0 |
| Wage / Income Gap (%) | 655 | 9.56% |
| Wage / Income Gap ($) | 655 | 90.44¢ per $1 |
| Gini / Inequality Index | 655 | 0.40 |
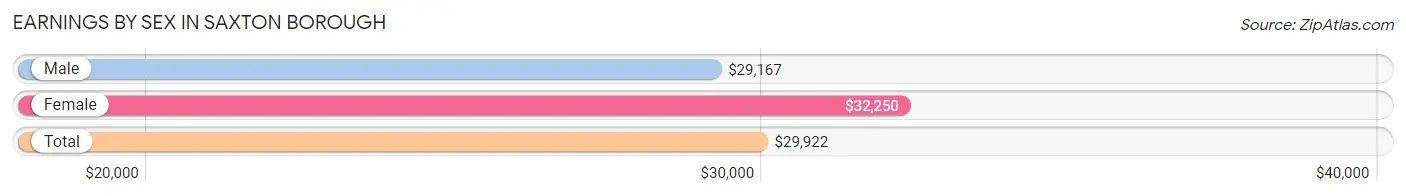
Earnings by Sex in Saxton borough
Average Earnings in Saxton borough are $29,922, $29,167 for men and $32,250 for women, a difference of 9.6%.
| Sex | Number | Average Earnings |
| Male | 140 (52.0%) | $29,167 |
| Female | 129 (48.0%) | $32,250 |
| Total | 269 (100.0%) | $29,922 |
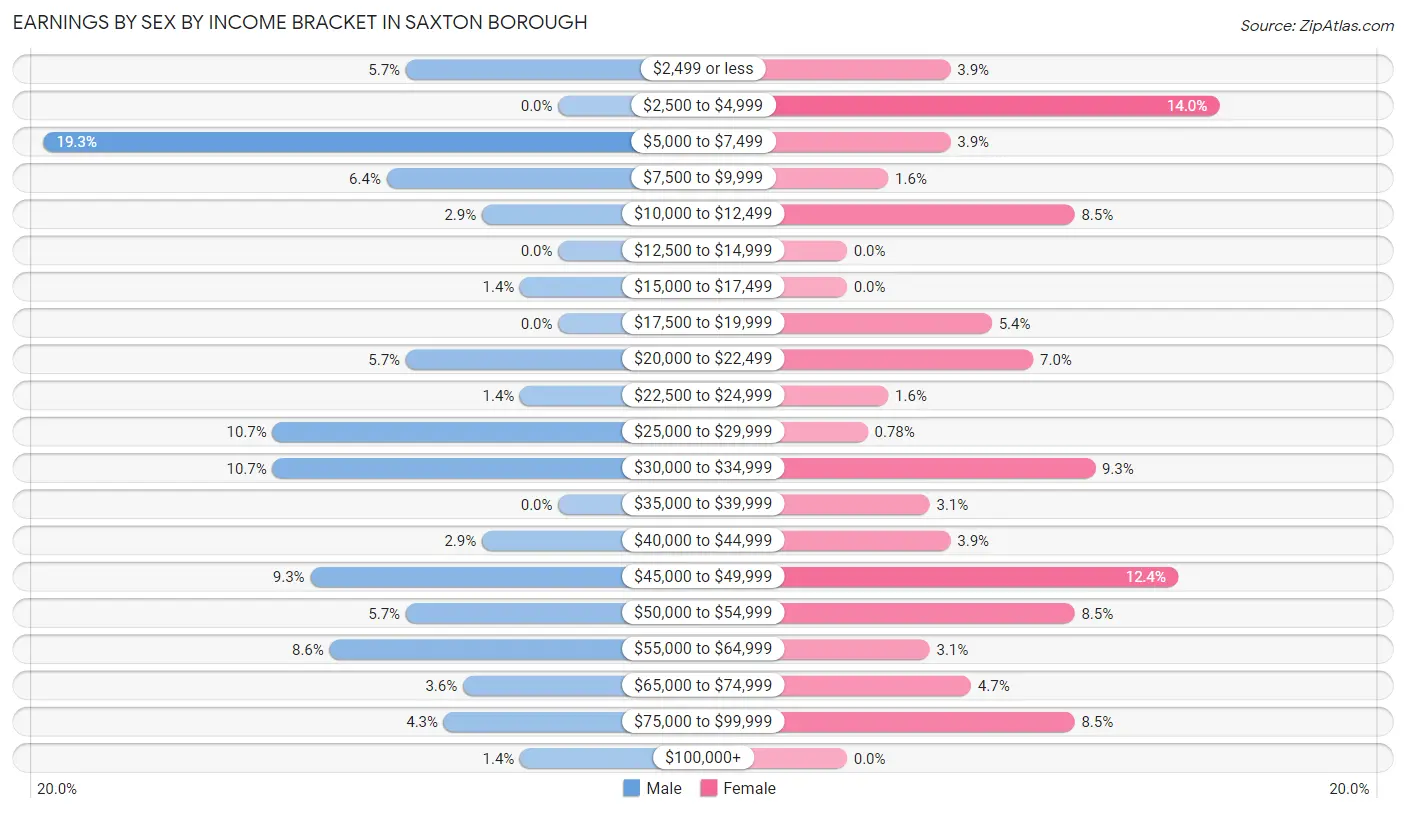
Earnings by Sex by Income Bracket in Saxton borough
The most common earnings brackets in Saxton borough are $5,000 to $7,499 for men (27 | 19.3%) and $2,500 to $4,999 for women (18 | 14.0%).
| Income | Male | Female |
| $2,499 or less | 8 (5.7%) | 5 (3.9%) |
| $2,500 to $4,999 | 0 (0.0%) | 18 (14.0%) |
| $5,000 to $7,499 | 27 (19.3%) | 5 (3.9%) |
| $7,500 to $9,999 | 9 (6.4%) | 2 (1.5%) |
| $10,000 to $12,499 | 4 (2.9%) | 11 (8.5%) |
| $12,500 to $14,999 | 0 (0.0%) | 0 (0.0%) |
| $15,000 to $17,499 | 2 (1.4%) | 0 (0.0%) |
| $17,500 to $19,999 | 0 (0.0%) | 7 (5.4%) |
| $20,000 to $22,499 | 8 (5.7%) | 9 (7.0%) |
| $22,500 to $24,999 | 2 (1.4%) | 2 (1.5%) |
| $25,000 to $29,999 | 15 (10.7%) | 1 (0.8%) |
| $30,000 to $34,999 | 15 (10.7%) | 12 (9.3%) |
| $35,000 to $39,999 | 0 (0.0%) | 4 (3.1%) |
| $40,000 to $44,999 | 4 (2.9%) | 5 (3.9%) |
| $45,000 to $49,999 | 13 (9.3%) | 16 (12.4%) |
| $50,000 to $54,999 | 8 (5.7%) | 11 (8.5%) |
| $55,000 to $64,999 | 12 (8.6%) | 4 (3.1%) |
| $65,000 to $74,999 | 5 (3.6%) | 6 (4.6%) |
| $75,000 to $99,999 | 6 (4.3%) | 11 (8.5%) |
| $100,000+ | 2 (1.4%) | 0 (0.0%) |
| Total | 140 (100.0%) | 129 (100.0%) |
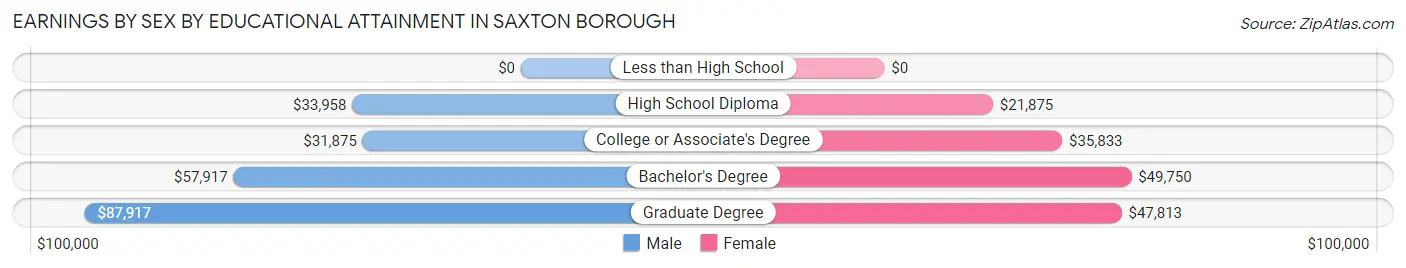
Earnings by Sex by Educational Attainment in Saxton borough
Average earnings in Saxton borough are $33,977 for men and $33,929 for women, a difference of 0.1%. Men with an educational attainment of graduate degree enjoy the highest average annual earnings of $87,917, while those with college or associate's degree education earn the least with $31,875. Women with an educational attainment of bachelor's degree earn the most with the average annual earnings of $49,750, while those with high school diploma education have the smallest earnings of $21,875.
| Educational Attainment | Male Income | Female Income |
| Less than High School | - | - |
| High School Diploma | $33,958 | $21,875 |
| College or Associate's Degree | $31,875 | $35,833 |
| Bachelor's Degree | $57,917 | $49,750 |
| Graduate Degree | $87,917 | $47,813 |
| Total | $33,977 | $33,929 |
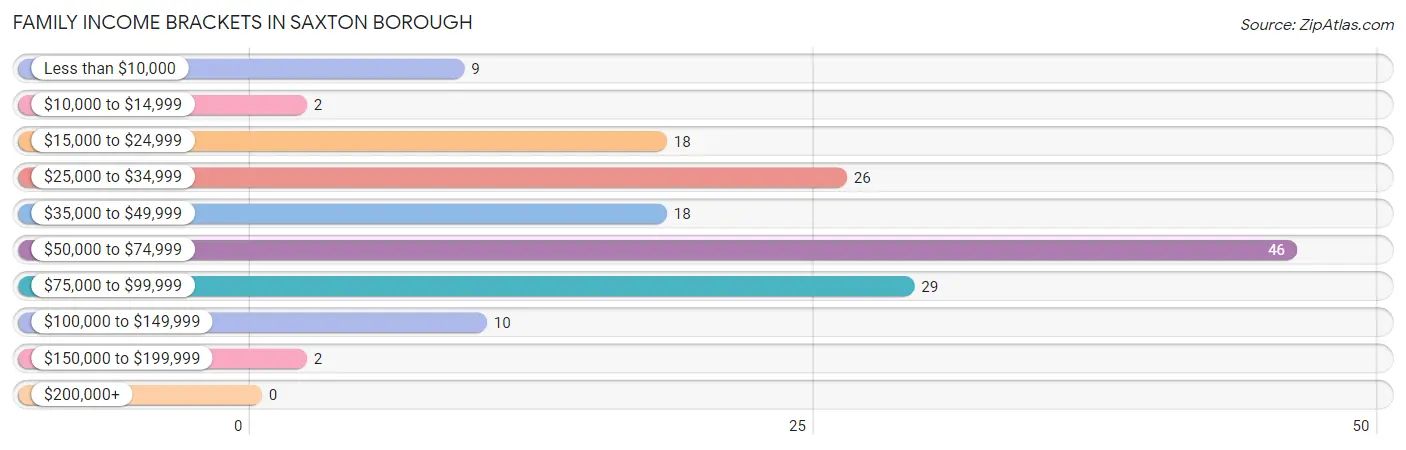
Family Income in Saxton borough
Family Income Brackets in Saxton borough
According to the Saxton borough family income data, there are 46 families falling into the $50,000 to $74,999 income range, which is the most common income bracket and makes up 28.7% of all families.
| Income Bracket | # Families | % Families |
| Less than $10,000 | 9 | 5.6% |
| $10,000 to $14,999 | 2 | 1.3% |
| $15,000 to $24,999 | 18 | 11.3% |
| $25,000 to $34,999 | 26 | 16.3% |
| $35,000 to $49,999 | 18 | 11.3% |
| $50,000 to $74,999 | 46 | 28.8% |
| $75,000 to $99,999 | 29 | 18.1% |
| $100,000 to $149,999 | 10 | 6.3% |
| $150,000 to $199,999 | 2 | 1.3% |
| $200,000+ | 0 | 0.0% |
Family Income by Famaliy Size in Saxton borough
4-person families (17 | 10.6%) account for the highest median family income in Saxton borough with $69,583 per family, while 2-person families (100 | 62.5%) have the highest median income of $24,688 per family member.
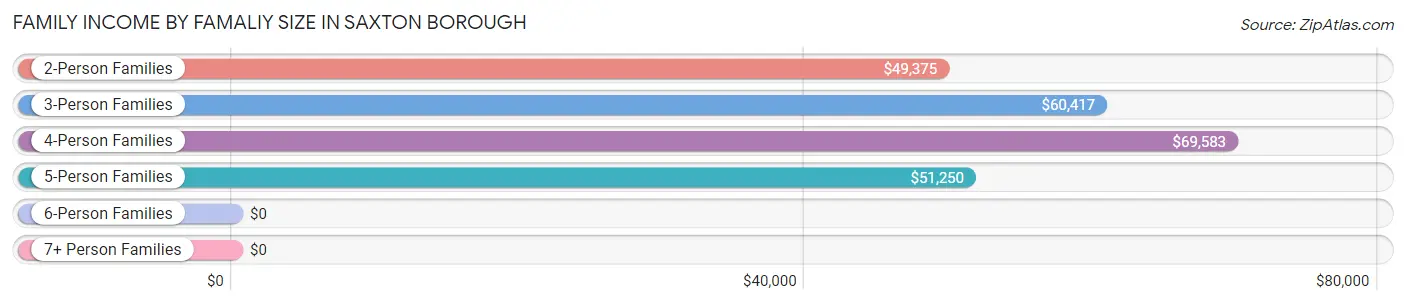
| Income Bracket | # Families | Median Income |
| 2-Person Families | 100 (62.5%) | $49,375 |
| 3-Person Families | 35 (21.9%) | $60,417 |
| 4-Person Families | 17 (10.6%) | $69,583 |
| 5-Person Families | 6 (3.7%) | $51,250 |
| 6-Person Families | 0 (0.0%) | $0 |
| 7+ Person Families | 2 (1.3%) | $0 |
| Total | 160 (100.0%) | $52,188 |
Family Income by Number of Earners in Saxton borough
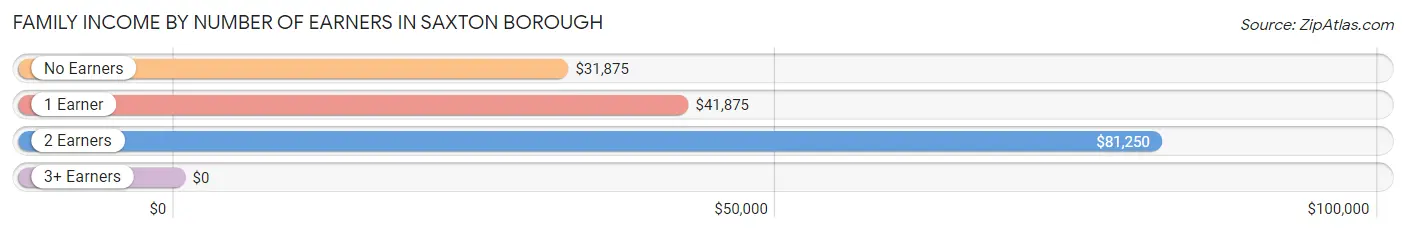
| Number of Earners | # Families | Median Income |
| No Earners | 45 (28.1%) | $31,875 |
| 1 Earner | 59 (36.9%) | $41,875 |
| 2 Earners | 52 (32.5%) | $81,250 |
| 3+ Earners | 4 (2.5%) | $0 |
| Total | 160 (100.0%) | $52,188 |
Household Income in Saxton borough
Household Income Brackets in Saxton borough
With 63 households falling in the category, the $50,000 to $74,999 income range is the most frequent in Saxton borough, accounting for 20.5% of all households.
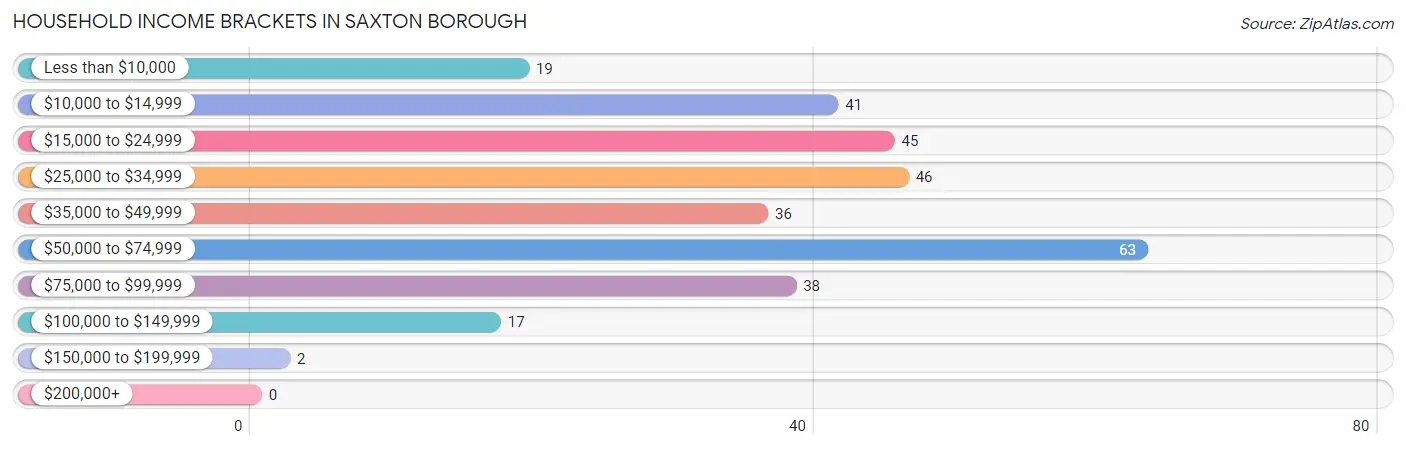
| Income Bracket | # Households | % Households |
| Less than $10,000 | 19 | 6.2% |
| $10,000 to $14,999 | 41 | 13.4% |
| $15,000 to $24,999 | 45 | 14.7% |
| $25,000 to $34,999 | 46 | 15.0% |
| $35,000 to $49,999 | 36 | 11.7% |
| $50,000 to $74,999 | 63 | 20.5% |
| $75,000 to $99,999 | 38 | 12.4% |
| $100,000 to $149,999 | 17 | 5.5% |
| $150,000 to $199,999 | 2 | 0.7% |
| $200,000+ | 0 | 0.0% |
Household Income by Householder Age in Saxton borough
The median household income in Saxton borough is $36,250, with the highest median household income of $57,031 found in the 25 to 44 years age bracket for the primary householder. A total of 77 households (25.1%) fall into this category. Meanwhile, the 15 to 24 years age bracket for the primary householder has the lowest median household income of $0, with 7 households (2.3%) in this group.
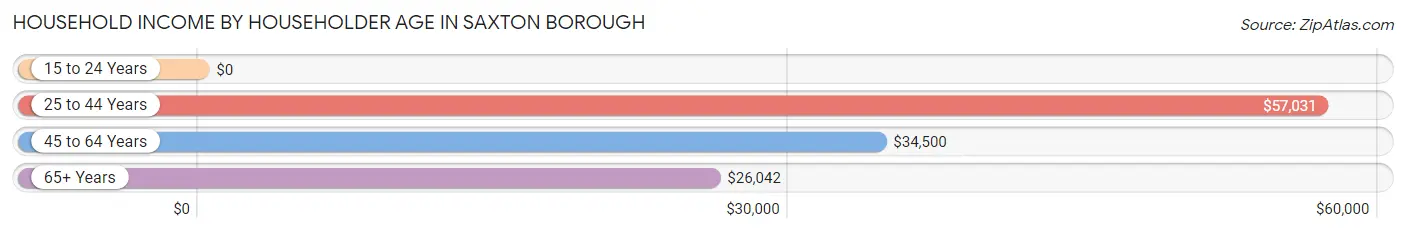
| Income Bracket | # Households | Median Income |
| 15 to 24 Years | 7 (2.3%) | $0 |
| 25 to 44 Years | 77 (25.1%) | $57,031 |
| 45 to 64 Years | 112 (36.5%) | $34,500 |
| 65+ Years | 111 (36.2%) | $26,042 |
| Total | 307 (100.0%) | $36,250 |
Poverty in Saxton borough
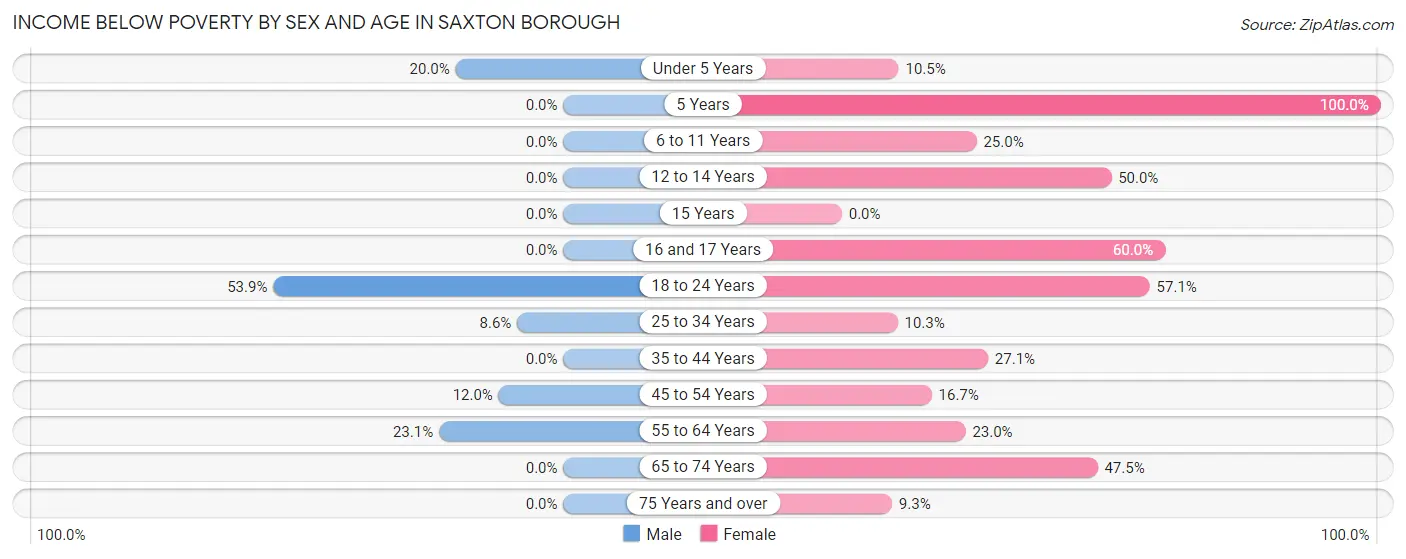
Income Below Poverty by Sex and Age in Saxton borough
With 13.8% poverty level for males and 26.8% for females among the residents of Saxton borough, 18 to 24 year old males and 5 year old females are the most vulnerable to poverty, with 21 males (53.8%) and 2 females (100.0%) in their respective age groups living below the poverty level.
| Age Bracket | Male | Female |
| Under 5 Years | 4 (20.0%) | 2 (10.5%) |
| 5 Years | 0 (0.0%) | 2 (100.0%) |
| 6 to 11 Years | 0 (0.0%) | 4 (25.0%) |
| 12 to 14 Years | 0 (0.0%) | 3 (50.0%) |
| 15 Years | 0 (0.0%) | 0 (0.0%) |
| 16 and 17 Years | 0 (0.0%) | 3 (60.0%) |
| 18 to 24 Years | 21 (53.8%) | 8 (57.1%) |
| 25 to 34 Years | 3 (8.6%) | 3 (10.3%) |
| 35 to 44 Years | 0 (0.0%) | 16 (27.1%) |
| 45 to 54 Years | 3 (12.0%) | 5 (16.7%) |
| 55 to 64 Years | 12 (23.1%) | 14 (23.0%) |
| 65 to 74 Years | 0 (0.0%) | 28 (47.5%) |
| 75 Years and over | 0 (0.0%) | 4 (9.3%) |
| Total | 43 (13.8%) | 92 (26.8%) |
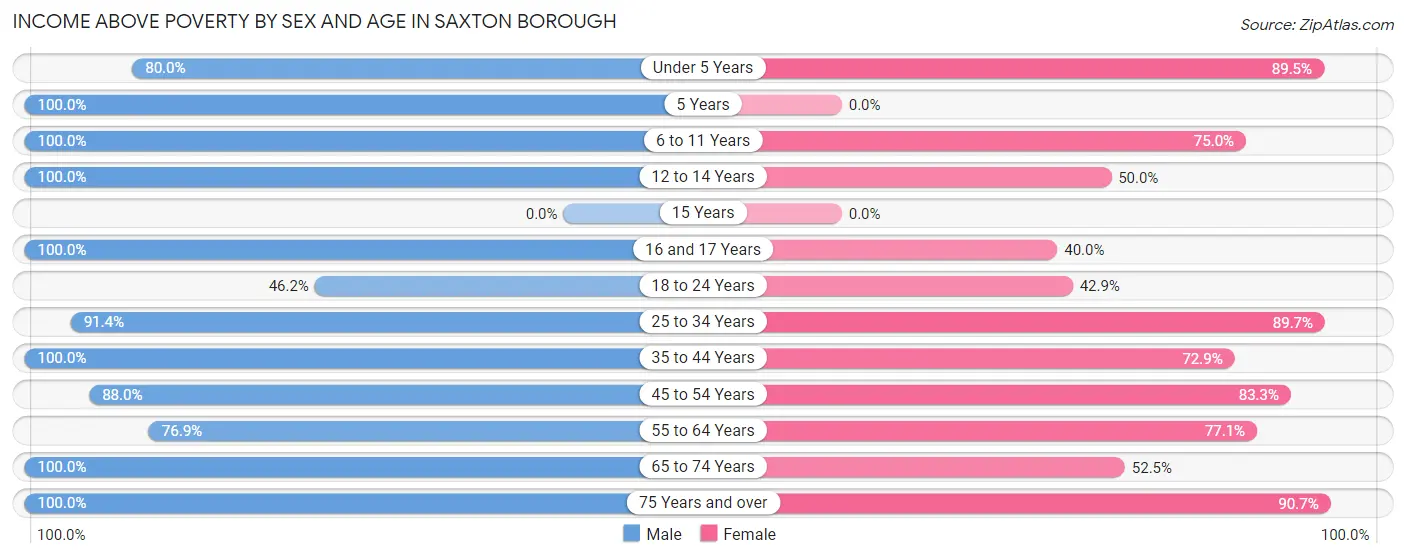
Income Above Poverty by Sex and Age in Saxton borough
According to the poverty statistics in Saxton borough, males aged 5 years and females aged 75 years and over are the age groups that are most secure financially, with 100.0% of males and 90.7% of females in these age groups living above the poverty line.
| Age Bracket | Male | Female |
| Under 5 Years | 16 (80.0%) | 17 (89.5%) |
| 5 Years | 12 (100.0%) | 0 (0.0%) |
| 6 to 11 Years | 34 (100.0%) | 12 (75.0%) |
| 12 to 14 Years | 9 (100.0%) | 3 (50.0%) |
| 15 Years | 0 (0.0%) | 0 (0.0%) |
| 16 and 17 Years | 5 (100.0%) | 2 (40.0%) |
| 18 to 24 Years | 18 (46.2%) | 6 (42.9%) |
| 25 to 34 Years | 32 (91.4%) | 26 (89.7%) |
| 35 to 44 Years | 30 (100.0%) | 43 (72.9%) |
| 45 to 54 Years | 22 (88.0%) | 25 (83.3%) |
| 55 to 64 Years | 40 (76.9%) | 47 (77.0%) |
| 65 to 74 Years | 17 (100.0%) | 31 (52.5%) |
| 75 Years and over | 33 (100.0%) | 39 (90.7%) |
| Total | 268 (86.2%) | 251 (73.2%) |
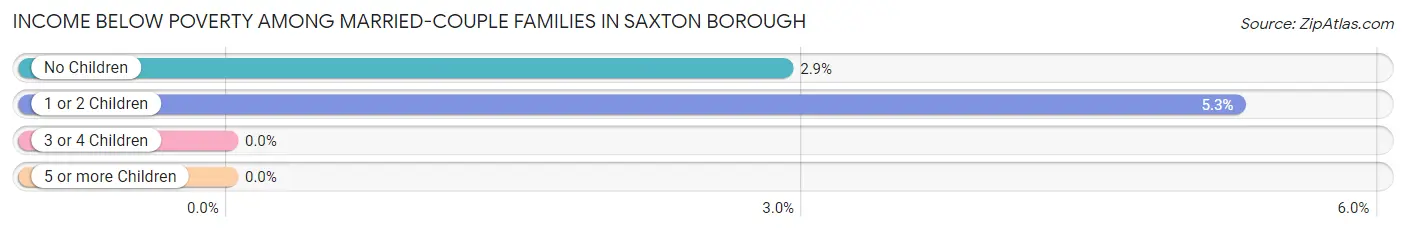
Income Below Poverty Among Married-Couple Families in Saxton borough
The poverty statistics for married-couple families in Saxton borough show that 3.2% or 3 of the total 93 families live below the poverty line. Families with 1 or 2 children have the highest poverty rate of 5.3%, comprising of 1 families. On the other hand, families with 3 or 4 children have the lowest poverty rate of 0.0%, which includes 0 families.
| Children | Above Poverty | Below Poverty |
| No Children | 67 (97.1%) | 2 (2.9%) |
| 1 or 2 Children | 18 (94.7%) | 1 (5.3%) |
| 3 or 4 Children | 3 (100.0%) | 0 (0.0%) |
| 5 or more Children | 2 (100.0%) | 0 (0.0%) |
| Total | 90 (96.8%) | 3 (3.2%) |
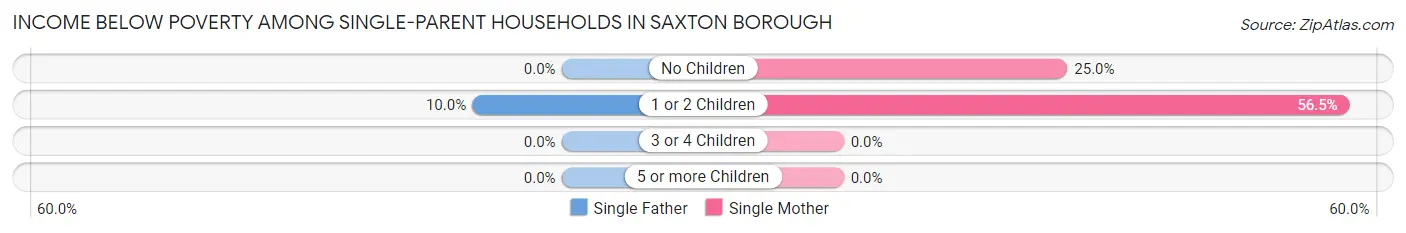
Income Below Poverty Among Single-Parent Households in Saxton borough
According to the poverty data in Saxton borough, 9.1% or 2 single-father households and 40.0% or 18 single-mother households are living below the poverty line. Among single-father households, those with 1 or 2 children have the highest poverty rate, with 2 households (10.0%) experiencing poverty. Likewise, among single-mother households, those with 1 or 2 children have the highest poverty rate, with 13 households (56.5%) falling below the poverty line.
| Children | Single Father | Single Mother |
| No Children | 0 (0.0%) | 5 (25.0%) |
| 1 or 2 Children | 2 (10.0%) | 13 (56.5%) |
| 3 or 4 Children | 0 (0.0%) | 0 (0.0%) |
| 5 or more Children | 0 (0.0%) | 0 (0.0%) |
| Total | 2 (9.1%) | 18 (40.0%) |
Income Below Poverty Among Married-Couple vs Single-Parent Households in Saxton borough
The poverty data for Saxton borough shows that 3 of the married-couple family households (3.2%) and 20 of the single-parent households (29.8%) are living below the poverty level. Within the married-couple family households, those with 1 or 2 children have the highest poverty rate, with 1 households (5.3%) falling below the poverty line. Among the single-parent households, those with 1 or 2 children have the highest poverty rate, with 15 household (34.9%) living below poverty.
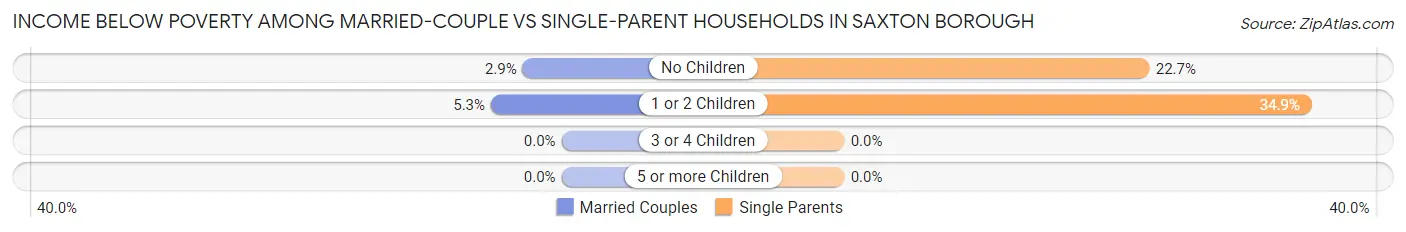
| Children | Married-Couple Families | Single-Parent Households |
| No Children | 2 (2.9%) | 5 (22.7%) |
| 1 or 2 Children | 1 (5.3%) | 15 (34.9%) |
| 3 or 4 Children | 0 (0.0%) | 0 (0.0%) |
| 5 or more Children | 0 (0.0%) | 0 (0.0%) |
| Total | 3 (3.2%) | 20 (29.8%) |
Race in Saxton borough
The most populous races in Saxton borough are White / Caucasian (625 | 95.4%), Black / African American (23 | 3.5%), and Two or more Races (7 | 1.1%).
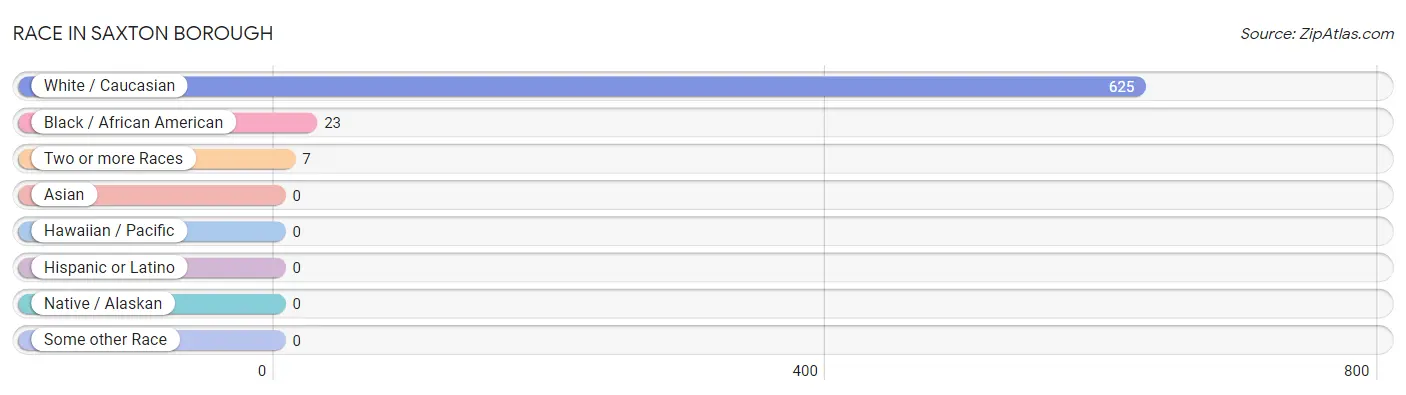
| Race | # Population | % Population |
| Asian | 0 | 0.0% |
| Black / African American | 23 | 3.5% |
| Hawaiian / Pacific | 0 | 0.0% |
| Hispanic or Latino | 0 | 0.0% |
| Native / Alaskan | 0 | 0.0% |
| White / Caucasian | 625 | 95.4% |
| Two or more Races | 7 | 1.1% |
| Some other Race | 0 | 0.0% |
| Total | 655 | 100.0% |
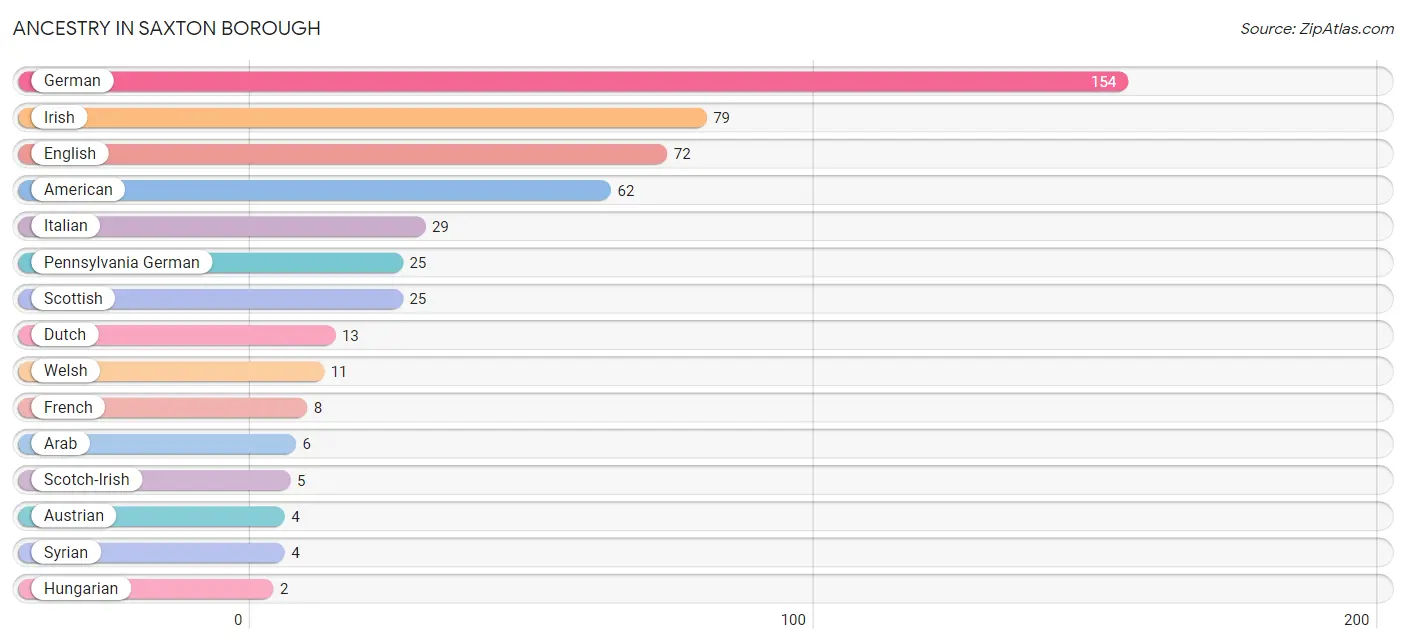
Ancestry in Saxton borough
The most populous ancestries reported in Saxton borough are German (154 | 23.5%), Irish (79 | 12.1%), English (72 | 11.0%), American (62 | 9.5%), and Italian (29 | 4.4%), together accounting for 60.5% of all Saxton borough residents.
| Ancestry | # Population | % Population |
| American | 62 | 9.5% |
| Arab | 6 | 0.9% |
| Austrian | 4 | 0.6% |
| Dutch | 13 | 2.0% |
| English | 72 | 11.0% |
| French | 8 | 1.2% |
| German | 154 | 23.5% |
| Hungarian | 2 | 0.3% |
| Irish | 79 | 12.1% |
| Italian | 29 | 4.4% |
| Jamaican | 2 | 0.3% |
| Pennsylvania German | 25 | 3.8% |
| Polish | 2 | 0.3% |
| Russian | 2 | 0.3% |
| Scotch-Irish | 5 | 0.8% |
| Scottish | 25 | 3.8% |
| Swedish | 2 | 0.3% |
| Syrian | 4 | 0.6% |
| Ukrainian | 1 | 0.2% |
| Welsh | 11 | 1.7% | View All 20 Rows |
Immigrants in Saxton borough
The most numerous immigrant groups reported in Saxton borough came from Europe (4 | 0.6%), Germany (3 | 0.5%), Western Europe (3 | 0.5%), Asia (2 | 0.3%), and Saudi Arabia (2 | 0.3%), together accounting for 2.1% of all Saxton borough residents.
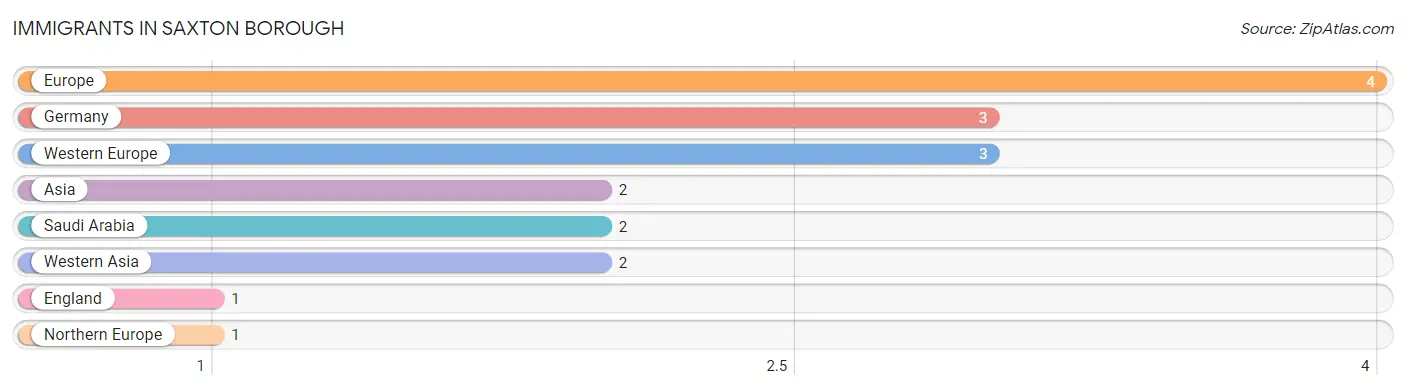
| Immigration Origin | # Population | % Population |
| Asia | 2 | 0.3% |
| England | 1 | 0.2% |
| Europe | 4 | 0.6% |
| Germany | 3 | 0.5% |
| Northern Europe | 1 | 0.2% |
| Saudi Arabia | 2 | 0.3% |
| Western Asia | 2 | 0.3% |
| Western Europe | 3 | 0.5% | View All 8 Rows |
Sex and Age in Saxton borough
Sex and Age in Saxton borough
The most populous age groups in Saxton borough are 5 to 9 Years (38 | 12.2%) for men and 65 to 69 Years (45 | 13.1%) for women.
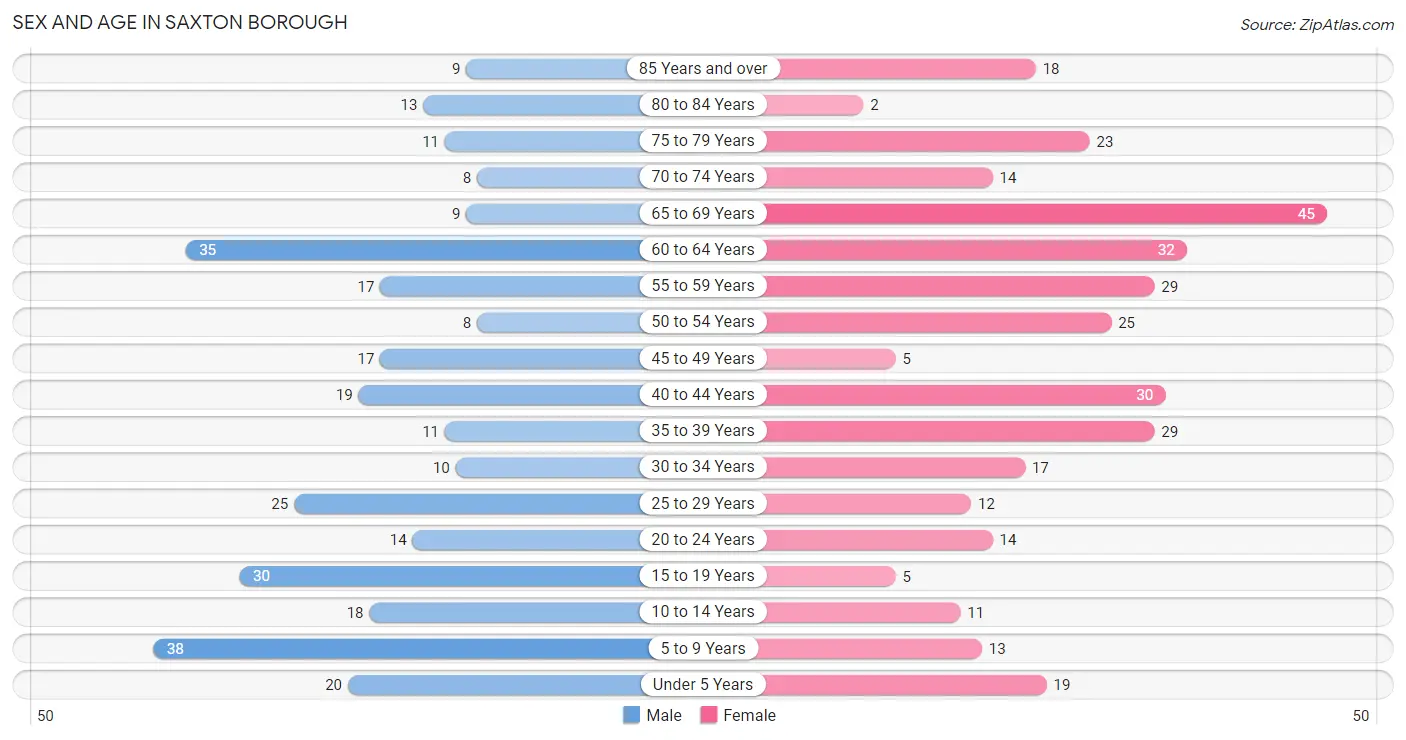
| Age Bracket | Male | Female |
| Under 5 Years | 20 (6.4%) | 19 (5.5%) |
| 5 to 9 Years | 38 (12.2%) | 13 (3.8%) |
| 10 to 14 Years | 18 (5.8%) | 11 (3.2%) |
| 15 to 19 Years | 30 (9.6%) | 5 (1.5%) |
| 20 to 24 Years | 14 (4.5%) | 14 (4.1%) |
| 25 to 29 Years | 25 (8.0%) | 12 (3.5%) |
| 30 to 34 Years | 10 (3.2%) | 17 (5.0%) |
| 35 to 39 Years | 11 (3.5%) | 29 (8.5%) |
| 40 to 44 Years | 19 (6.1%) | 30 (8.7%) |
| 45 to 49 Years | 17 (5.4%) | 5 (1.5%) |
| 50 to 54 Years | 8 (2.6%) | 25 (7.3%) |
| 55 to 59 Years | 17 (5.4%) | 29 (8.5%) |
| 60 to 64 Years | 35 (11.2%) | 32 (9.3%) |
| 65 to 69 Years | 9 (2.9%) | 45 (13.1%) |
| 70 to 74 Years | 8 (2.6%) | 14 (4.1%) |
| 75 to 79 Years | 11 (3.5%) | 23 (6.7%) |
| 80 to 84 Years | 13 (4.2%) | 2 (0.6%) |
| 85 Years and over | 9 (2.9%) | 18 (5.2%) |
| Total | 312 (100.0%) | 343 (100.0%) |
Families and Households in Saxton borough
Median Family Size in Saxton borough
The median family size in Saxton borough is 2.92 persons per family, with married-couple families (93 | 58.1%) accounting for the largest median family size of 3.01 persons per family. On the other hand, single male/father families (22 | 13.8%) represent the smallest median family size with 2.77 persons per family.
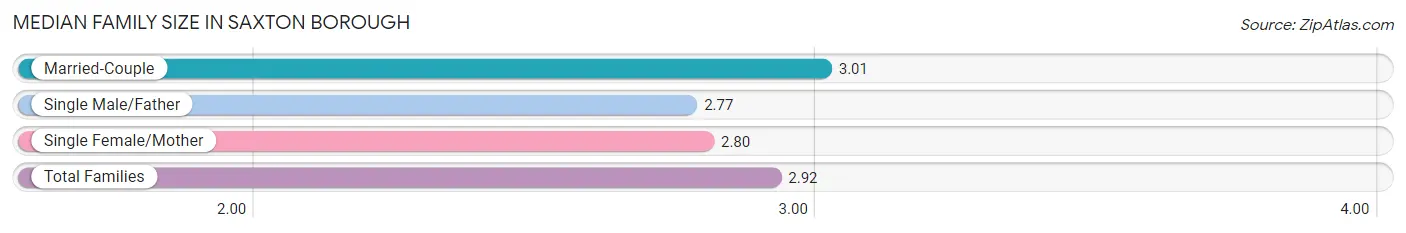
| Family Type | # Families | Family Size |
| Married-Couple | 93 (58.1%) | 3.01 |
| Single Male/Father | 22 (13.8%) | 2.77 |
| Single Female/Mother | 45 (28.1%) | 2.80 |
| Total Families | 160 (100.0%) | 2.92 |
Median Household Size in Saxton borough
The median household size in Saxton borough is 2.13 persons per household, with single male/father households (22 | 7.2%) accounting for the largest median household size of 3.82 persons per household. non-family households (147 | 47.9%) represent the smallest median household size with 1.07 persons per household.
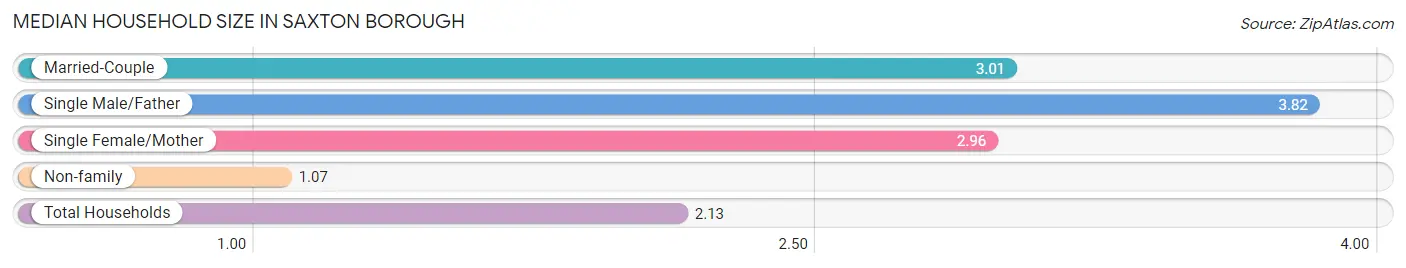
| Household Type | # Households | Household Size |
| Married-Couple | 93 (30.3%) | 3.01 |
| Single Male/Father | 22 (7.2%) | 3.82 |
| Single Female/Mother | 45 (14.7%) | 2.96 |
| Non-family | 147 (47.9%) | 1.07 |
| Total Households | 307 (100.0%) | 2.13 |
Household Size by Marriage Status in Saxton borough
Out of a total of 307 households in Saxton borough, 160 (52.1%) are family households, while 147 (47.9%) are nonfamily households. The most numerous type of family households are 2-person households, comprising 84, and the most common type of nonfamily households are 1-person households, comprising 138.
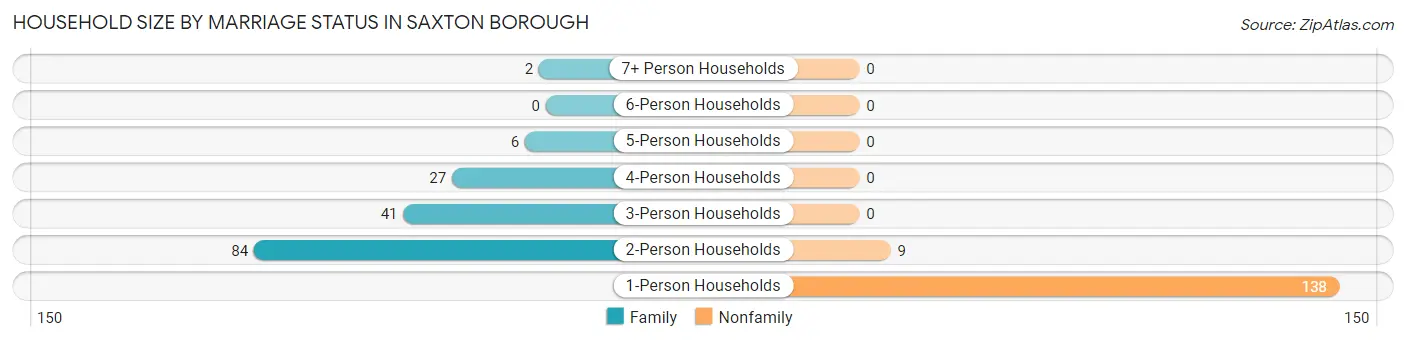
| Household Size | Family Households | Nonfamily Households |
| 1-Person Households | - | 138 (45.0%) |
| 2-Person Households | 84 (27.4%) | 9 (2.9%) |
| 3-Person Households | 41 (13.4%) | 0 (0.0%) |
| 4-Person Households | 27 (8.8%) | 0 (0.0%) |
| 5-Person Households | 6 (1.9%) | 0 (0.0%) |
| 6-Person Households | 0 (0.0%) | 0 (0.0%) |
| 7+ Person Households | 2 (0.6%) | 0 (0.0%) |
| Total | 160 (52.1%) | 147 (47.9%) |
Female Fertility in Saxton borough
Fertility by Age in Saxton borough
| Age Bracket | Women with Births | Births / 1,000 Women |
| 15 to 19 years | 0 (0.0%) | 0.0 |
| 20 to 34 years | 0 (0.0%) | 0.0 |
| 35 to 50 years | 0 (0.0%) | 0.0 |
| Total | 0 (0.0%) | 0.0 |
Fertility by Age by Marriage Status in Saxton borough
| Age Bracket | Married | Unmarried |
| 15 to 19 years | 0 (0.0%) | 0 (0.0%) |
| 20 to 34 years | 0 (0.0%) | 0 (0.0%) |
| 35 to 50 years | 0 (0.0%) | 0 (0.0%) |
| Total | 0 (0.0%) | 0 (0.0%) |
Fertility by Education in Saxton borough
| Educational Attainment | Women with Births | Births / 1,000 Women |
| Less than High School | 0 (0.0%) | 0.0 |
| High School Diploma | 0 (0.0%) | 0.0 |
| College or Associate's Degree | 0 (0.0%) | 0.0 |
| Bachelor's Degree | 0 (0.0%) | 0.0 |
| Graduate Degree | 0 (0.0%) | 0.0 |
| Total | 0 (0.0%) | 0.0 |
Fertility by Education by Marriage Status in Saxton borough
| Educational Attainment | Married | Unmarried |
| Less than High School | 0 (0.0%) | 0 (0.0%) |
| High School Diploma | 0 (0.0%) | 0 (0.0%) |
| College or Associate's Degree | 0 (0.0%) | 0 (0.0%) |
| Bachelor's Degree | 0 (0.0%) | 0 (0.0%) |
| Graduate Degree | 0 (0.0%) | 0 (0.0%) |
| Total | 0 (0.0%) | 0 (0.0%) |
Employment Characteristics in Saxton borough
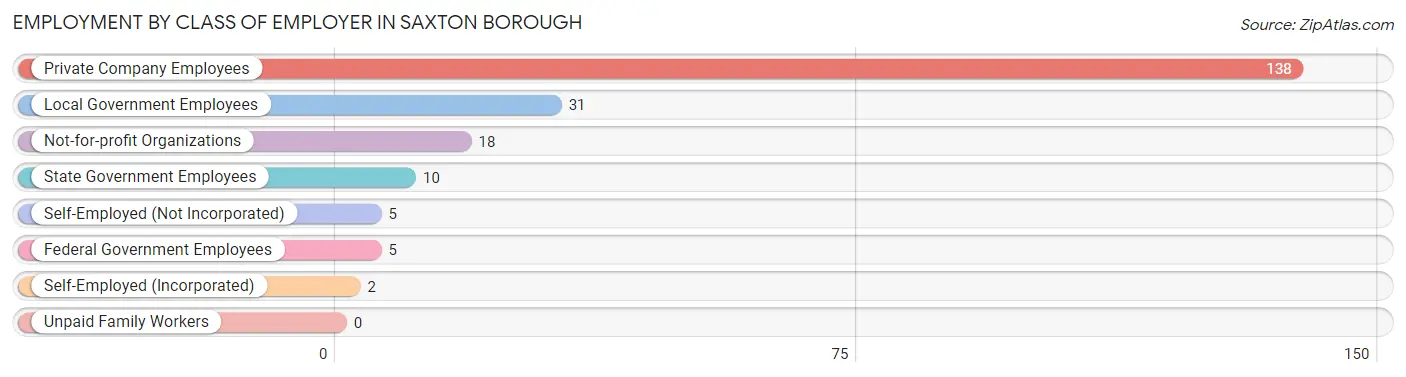
Employment by Class of Employer in Saxton borough
Among the 209 employed individuals in Saxton borough, private company employees (138 | 66.0%), local government employees (31 | 14.8%), and not-for-profit organizations (18 | 8.6%) make up the most common classes of employment.
| Employer Class | # Employees | % Employees |
| Private Company Employees | 138 | 66.0% |
| Self-Employed (Incorporated) | 2 | 1.0% |
| Self-Employed (Not Incorporated) | 5 | 2.4% |
| Not-for-profit Organizations | 18 | 8.6% |
| Local Government Employees | 31 | 14.8% |
| State Government Employees | 10 | 4.8% |
| Federal Government Employees | 5 | 2.4% |
| Unpaid Family Workers | 0 | 0.0% |
| Total | 209 | 100.0% |
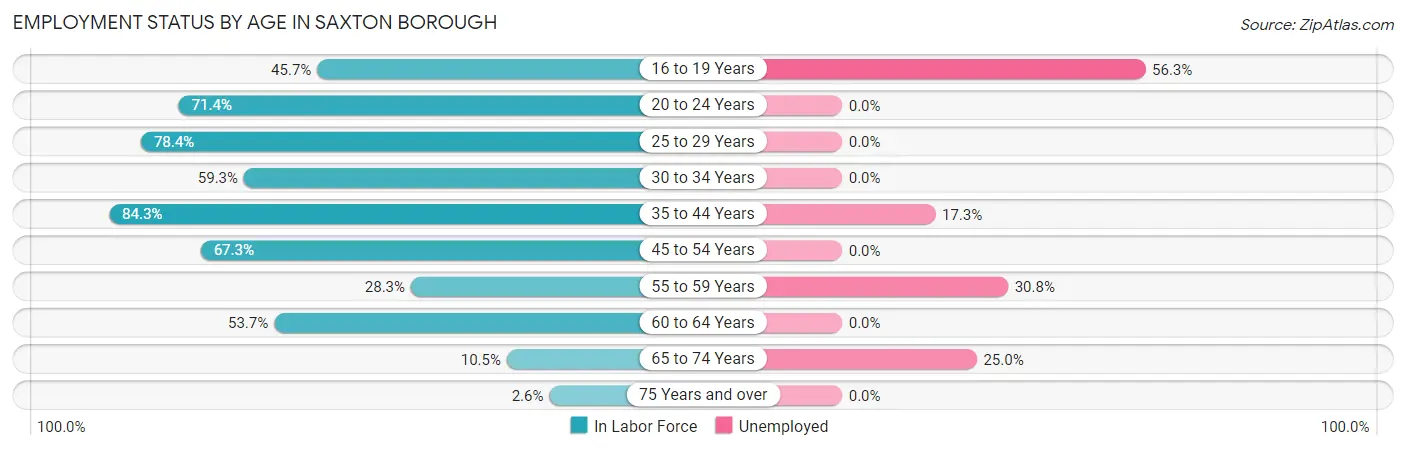
Employment Status by Age in Saxton borough
According to the labor force statistics for Saxton borough, out of the total population over 16 years of age (536), 47.0% or 252 individuals are in the labor force, with 11.1% or 28 of them unemployed. The age group with the highest labor force participation rate is 35 to 44 years, with 84.3% or 75 individuals in the labor force. Within the labor force, the 16 to 19 years age range has the highest percentage of unemployed individuals, with 56.3% or 9 of them being unemployed.
| Age Bracket | In Labor Force | Unemployed |
| 16 to 19 Years | 16 (45.7%) | 9 (56.3%) |
| 20 to 24 Years | 20 (71.4%) | 0 (0.0%) |
| 25 to 29 Years | 29 (78.4%) | 0 (0.0%) |
| 30 to 34 Years | 16 (59.3%) | 0 (0.0%) |
| 35 to 44 Years | 75 (84.3%) | 13 (17.3%) |
| 45 to 54 Years | 37 (67.3%) | 0 (0.0%) |
| 55 to 59 Years | 13 (28.3%) | 4 (30.8%) |
| 60 to 64 Years | 36 (53.7%) | 0 (0.0%) |
| 65 to 74 Years | 8 (10.5%) | 2 (25.0%) |
| 75 Years and over | 2 (2.6%) | 0 (0.0%) |
| Total | 252 (47.0%) | 28 (11.1%) |
Employment Status by Educational Attainment in Saxton borough
According to labor force statistics for Saxton borough, 64.2% of individuals (206) out of the total population between 25 and 64 years of age (321) are in the labor force, with 8.3% or 17 of them being unemployed. The group with the highest labor force participation rate are those with the educational attainment of bachelor's degree or higher, with 90.2% or 55 individuals in the labor force. Within the labor force, individuals with less than high school education have the highest percentage of unemployment, with 47.1% or 8 of them being unemployed.
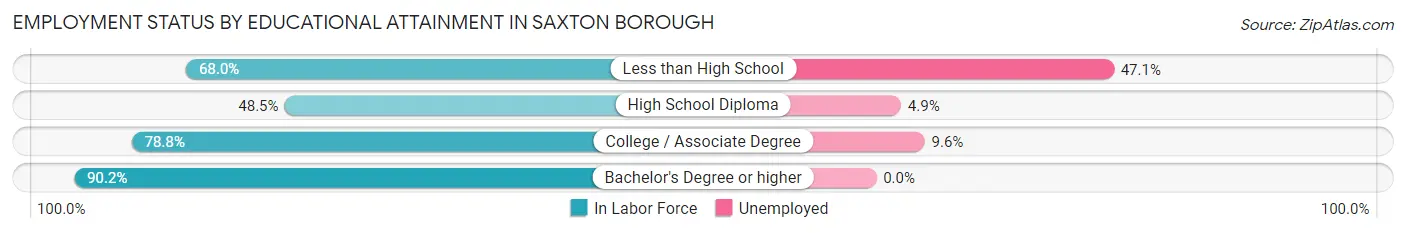
| Educational Attainment | In Labor Force | Unemployed |
| Less than High School | 17 (68.0%) | 12 (47.1%) |
| High School Diploma | 82 (48.5%) | 8 (4.9%) |
| College / Associate Degree | 52 (78.8%) | 6 (9.6%) |
| Bachelor's Degree or higher | 55 (90.2%) | 0 (0.0%) |
| Total | 206 (64.2%) | 27 (8.3%) |
Employment Occupations by Sex in Saxton borough
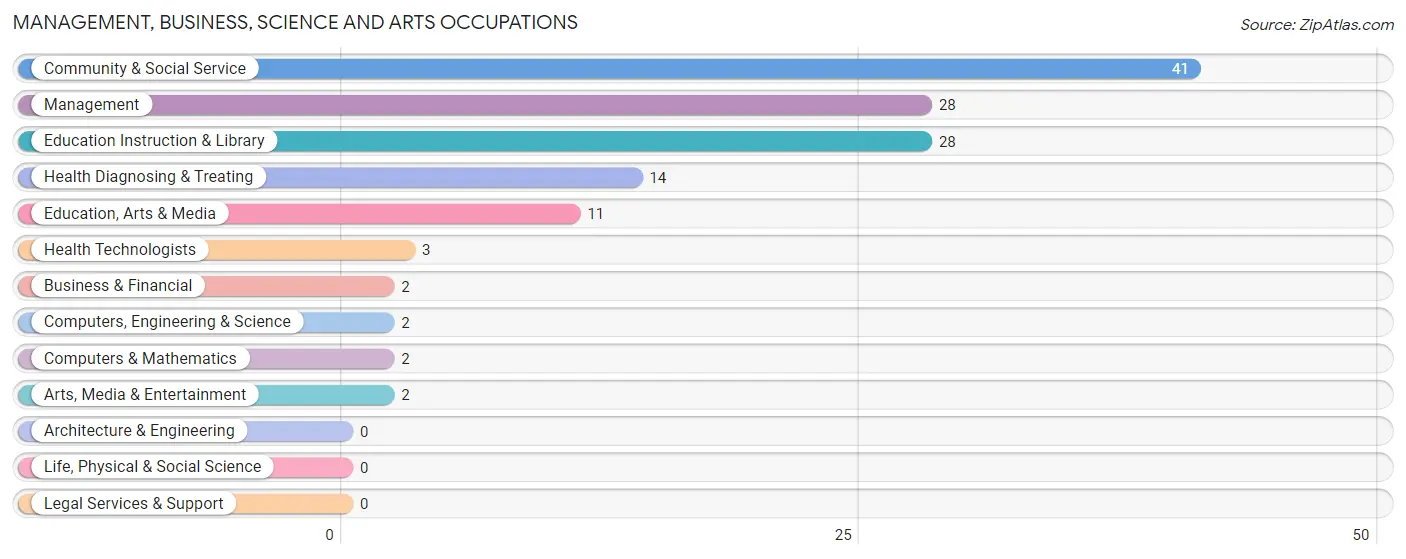
Management, Business, Science and Arts Occupations
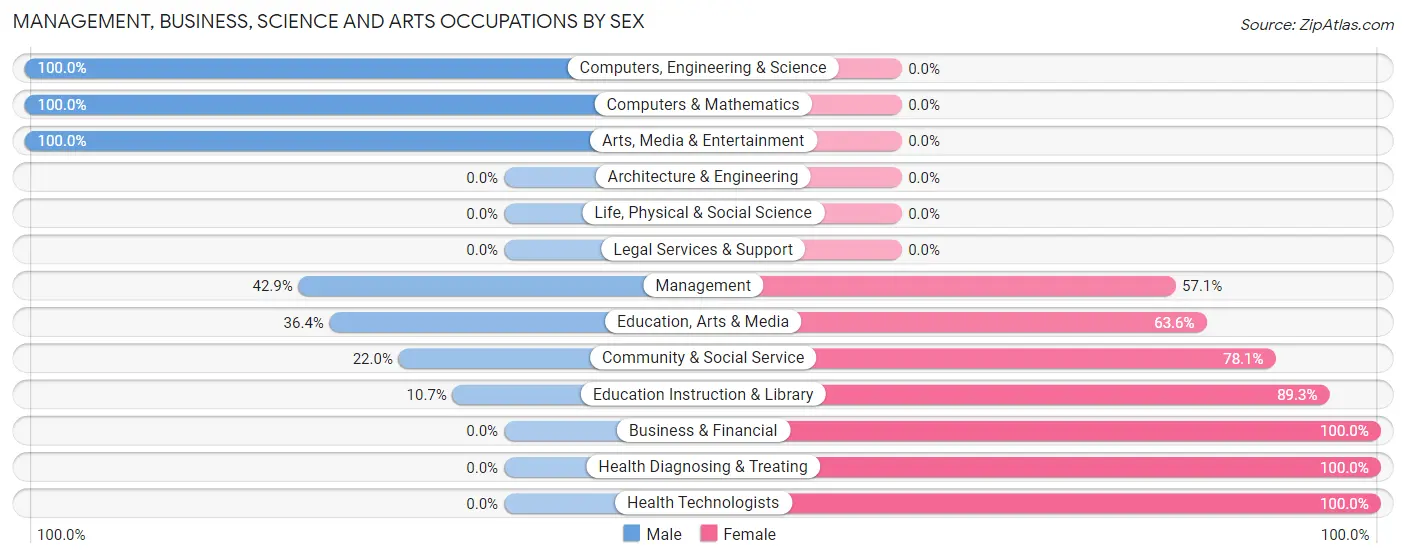
The most common Management, Business, Science and Arts occupations in Saxton borough are Community & Social Service (41 | 18.3%), Management (28 | 12.5%), Education Instruction & Library (28 | 12.5%), Health Diagnosing & Treating (14 | 6.2%), and Education, Arts & Media (11 | 4.9%).
Management, Business, Science and Arts Occupations by Sex
Within the Management, Business, Science and Arts occupations in Saxton borough, the most male-oriented occupations are Computers, Engineering & Science (100.0%), Computers & Mathematics (100.0%), and Arts, Media & Entertainment (100.0%), while the most female-oriented occupations are Business & Financial (100.0%), Health Diagnosing & Treating (100.0%), and Health Technologists (100.0%).
| Occupation | Male | Female |
| Management | 12 (42.9%) | 16 (57.1%) |
| Business & Financial | 0 (0.0%) | 2 (100.0%) |
| Computers, Engineering & Science | 2 (100.0%) | 0 (0.0%) |
| Computers & Mathematics | 2 (100.0%) | 0 (0.0%) |
| Architecture & Engineering | 0 (0.0%) | 0 (0.0%) |
| Life, Physical & Social Science | 0 (0.0%) | 0 (0.0%) |
| Community & Social Service | 9 (22.0%) | 32 (78.0%) |
| Education, Arts & Media | 4 (36.4%) | 7 (63.6%) |
| Legal Services & Support | 0 (0.0%) | 0 (0.0%) |
| Education Instruction & Library | 3 (10.7%) | 25 (89.3%) |
| Arts, Media & Entertainment | 2 (100.0%) | 0 (0.0%) |
| Health Diagnosing & Treating | 0 (0.0%) | 14 (100.0%) |
| Health Technologists | 0 (0.0%) | 3 (100.0%) |
| Total (Category) | 23 (26.4%) | 64 (73.6%) |
| Total (Overall) | 117 (52.2%) | 107 (47.8%) |
Services Occupations
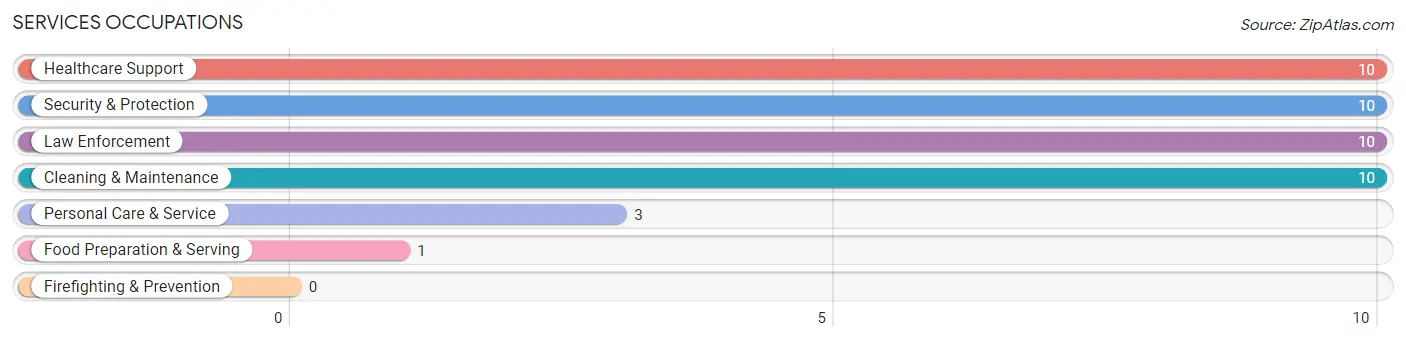
The most common Services occupations in Saxton borough are Healthcare Support (10 | 4.5%), Security & Protection (10 | 4.5%), Law Enforcement (10 | 4.5%), Cleaning & Maintenance (10 | 4.5%), and Personal Care & Service (3 | 1.3%).
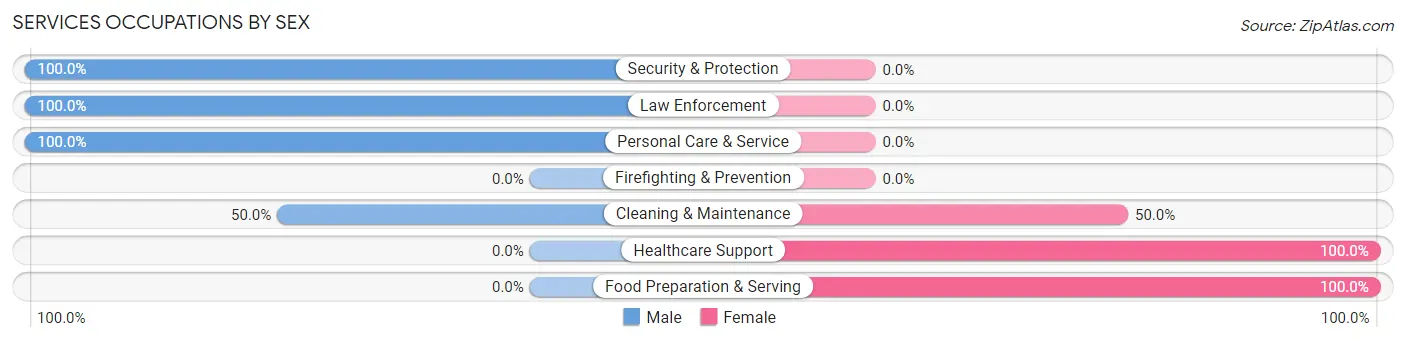
Services Occupations by Sex
Within the Services occupations in Saxton borough, the most male-oriented occupations are Security & Protection (100.0%), Law Enforcement (100.0%), and Personal Care & Service (100.0%), while the most female-oriented occupations are Healthcare Support (100.0%), Food Preparation & Serving (100.0%), and Cleaning & Maintenance (50.0%).
| Occupation | Male | Female |
| Healthcare Support | 0 (0.0%) | 10 (100.0%) |
| Security & Protection | 10 (100.0%) | 0 (0.0%) |
| Firefighting & Prevention | 0 (0.0%) | 0 (0.0%) |
| Law Enforcement | 10 (100.0%) | 0 (0.0%) |
| Food Preparation & Serving | 0 (0.0%) | 1 (100.0%) |
| Cleaning & Maintenance | 5 (50.0%) | 5 (50.0%) |
| Personal Care & Service | 3 (100.0%) | 0 (0.0%) |
| Total (Category) | 18 (52.9%) | 16 (47.1%) |
| Total (Overall) | 117 (52.2%) | 107 (47.8%) |
Sales and Office Occupations
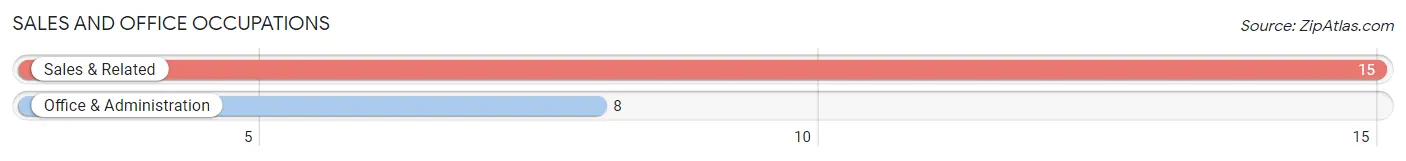
The most common Sales and Office occupations in Saxton borough are Sales & Related (15 | 6.7%), and Office & Administration (8 | 3.6%).
Sales and Office Occupations by Sex
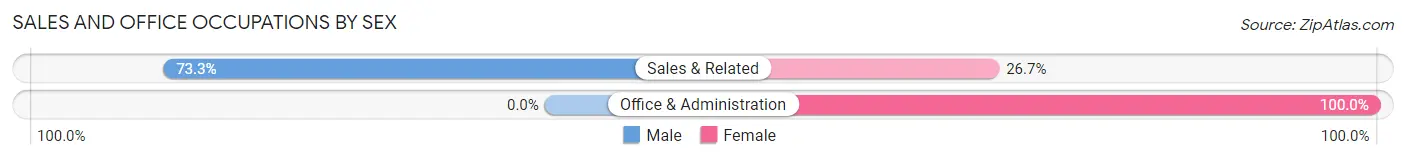
| Occupation | Male | Female |
| Sales & Related | 11 (73.3%) | 4 (26.7%) |
| Office & Administration | 0 (0.0%) | 8 (100.0%) |
| Total (Category) | 11 (47.8%) | 12 (52.2%) |
| Total (Overall) | 117 (52.2%) | 107 (47.8%) |
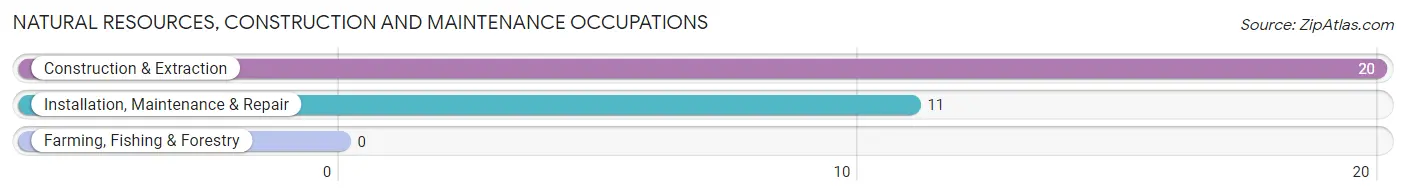
Natural Resources, Construction and Maintenance Occupations
The most common Natural Resources, Construction and Maintenance occupations in Saxton borough are Construction & Extraction (20 | 8.9%), and Installation, Maintenance & Repair (11 | 4.9%).
Natural Resources, Construction and Maintenance Occupations by Sex
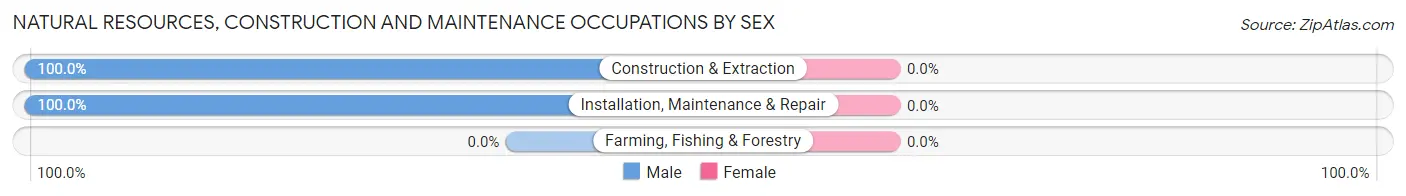
| Occupation | Male | Female |
| Farming, Fishing & Forestry | 0 (0.0%) | 0 (0.0%) |
| Construction & Extraction | 20 (100.0%) | 0 (0.0%) |
| Installation, Maintenance & Repair | 11 (100.0%) | 0 (0.0%) |
| Total (Category) | 31 (100.0%) | 0 (0.0%) |
| Total (Overall) | 117 (52.2%) | 107 (47.8%) |
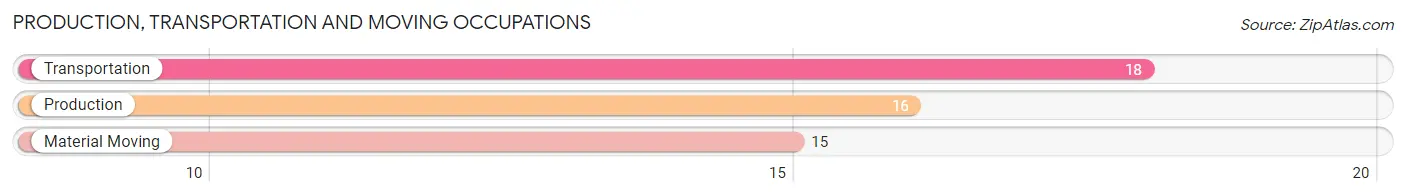
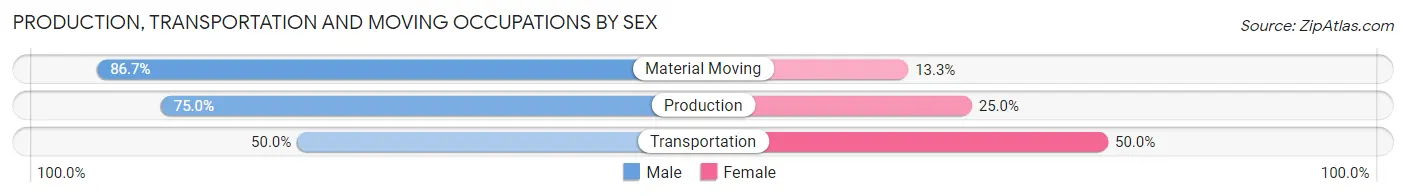
Production, Transportation and Moving Occupations
The most common Production, Transportation and Moving occupations in Saxton borough are Transportation (18 | 8.0%), Production (16 | 7.1%), and Material Moving (15 | 6.7%).
Production, Transportation and Moving Occupations by Sex
| Occupation | Male | Female |
| Production | 12 (75.0%) | 4 (25.0%) |
| Transportation | 9 (50.0%) | 9 (50.0%) |
| Material Moving | 13 (86.7%) | 2 (13.3%) |
| Total (Category) | 34 (69.4%) | 15 (30.6%) |
| Total (Overall) | 117 (52.2%) | 107 (47.8%) |
Employment Industries by Sex in Saxton borough
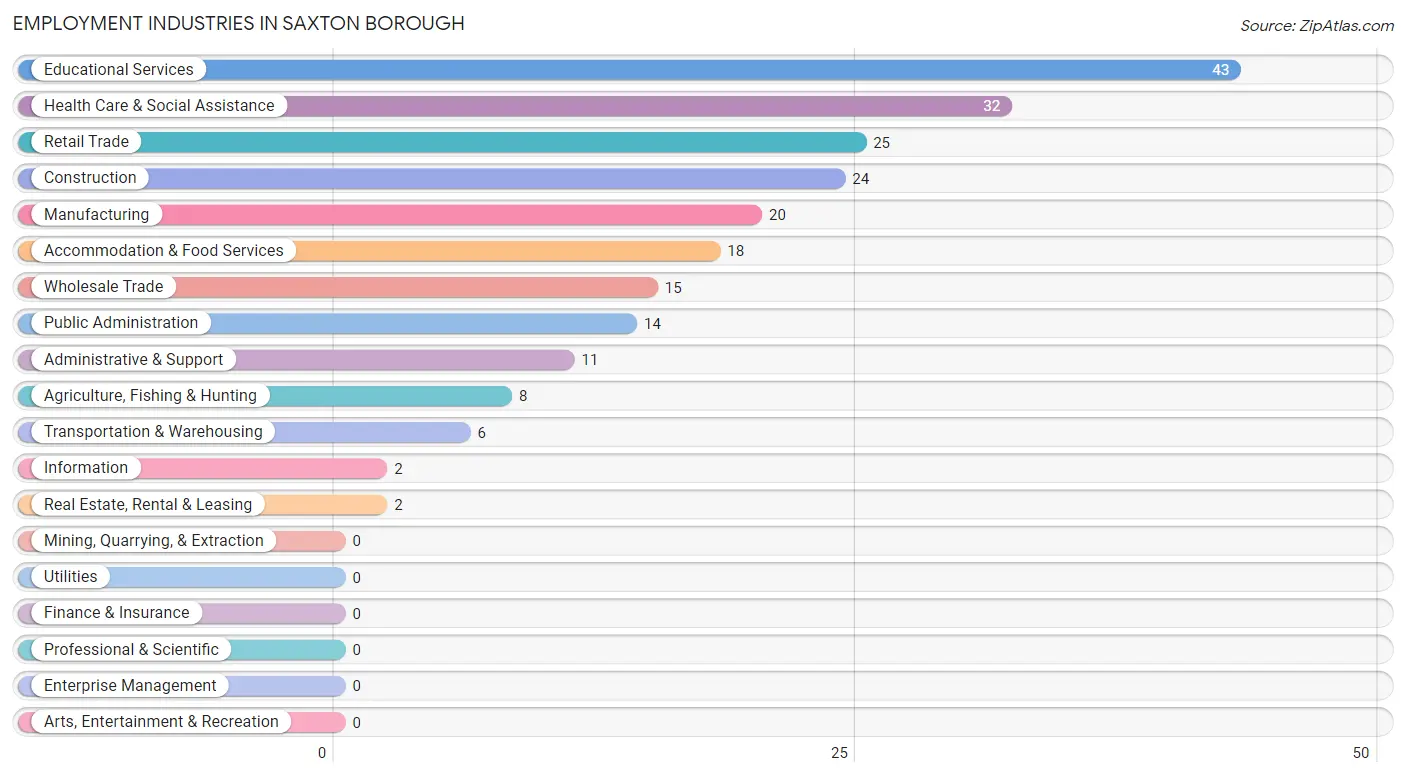
Employment Industries in Saxton borough
The major employment industries in Saxton borough include Educational Services (43 | 19.2%), Health Care & Social Assistance (32 | 14.3%), Retail Trade (25 | 11.2%), Construction (24 | 10.7%), and Manufacturing (20 | 8.9%).
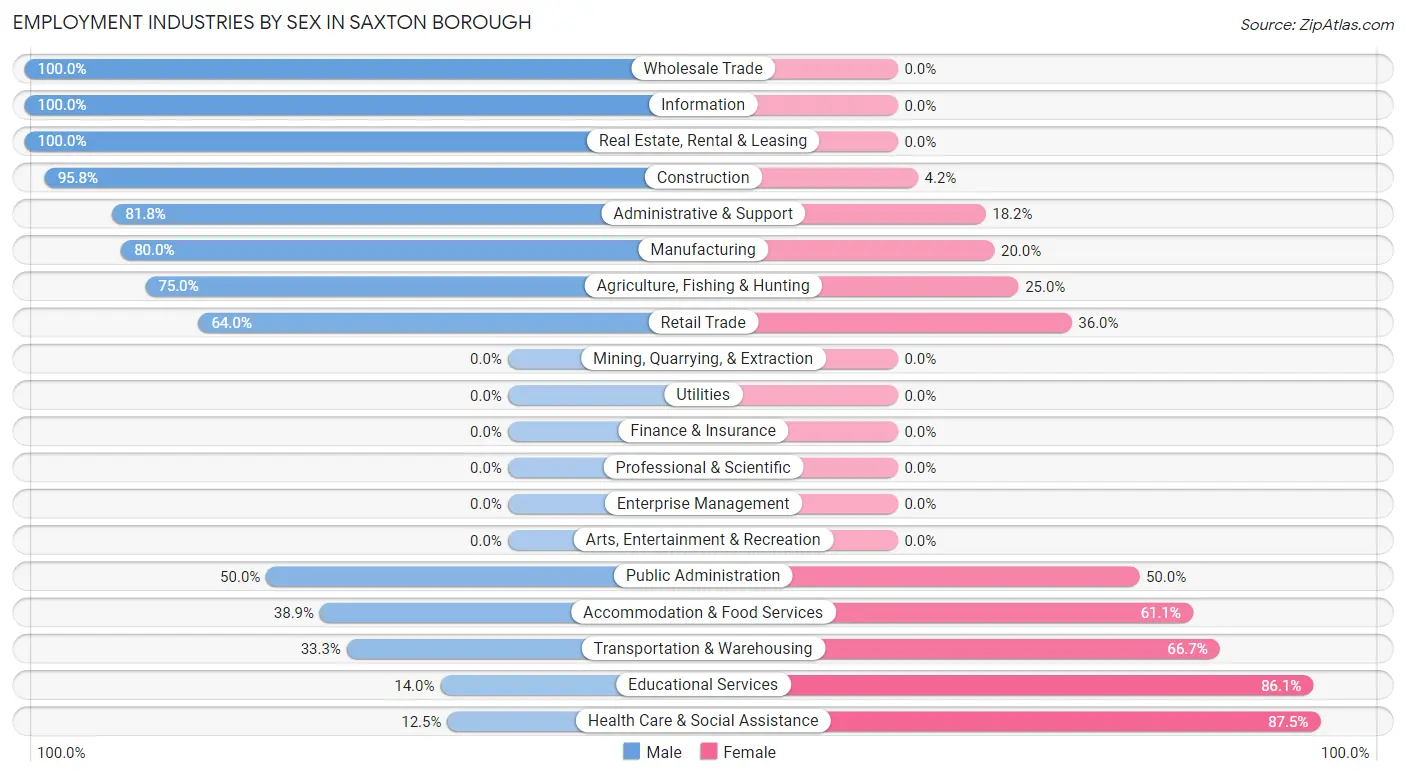
Employment Industries by Sex in Saxton borough
The Saxton borough industries that see more men than women are Wholesale Trade (100.0%), Information (100.0%), and Real Estate, Rental & Leasing (100.0%), whereas the industries that tend to have a higher number of women are Health Care & Social Assistance (87.5%), Educational Services (86.1%), and Transportation & Warehousing (66.7%).
| Industry | Male | Female |
| Agriculture, Fishing & Hunting | 6 (75.0%) | 2 (25.0%) |
| Mining, Quarrying, & Extraction | 0 (0.0%) | 0 (0.0%) |
| Construction | 23 (95.8%) | 1 (4.2%) |
| Manufacturing | 16 (80.0%) | 4 (20.0%) |
| Wholesale Trade | 15 (100.0%) | 0 (0.0%) |
| Retail Trade | 16 (64.0%) | 9 (36.0%) |
| Transportation & Warehousing | 2 (33.3%) | 4 (66.7%) |
| Utilities | 0 (0.0%) | 0 (0.0%) |
| Information | 2 (100.0%) | 0 (0.0%) |
| Finance & Insurance | 0 (0.0%) | 0 (0.0%) |
| Real Estate, Rental & Leasing | 2 (100.0%) | 0 (0.0%) |
| Professional & Scientific | 0 (0.0%) | 0 (0.0%) |
| Enterprise Management | 0 (0.0%) | 0 (0.0%) |
| Administrative & Support | 9 (81.8%) | 2 (18.2%) |
| Educational Services | 6 (14.0%) | 37 (86.1%) |
| Health Care & Social Assistance | 4 (12.5%) | 28 (87.5%) |
| Arts, Entertainment & Recreation | 0 (0.0%) | 0 (0.0%) |
| Accommodation & Food Services | 7 (38.9%) | 11 (61.1%) |
| Public Administration | 7 (50.0%) | 7 (50.0%) |
| Total | 117 (52.2%) | 107 (47.8%) |
Education in Saxton borough
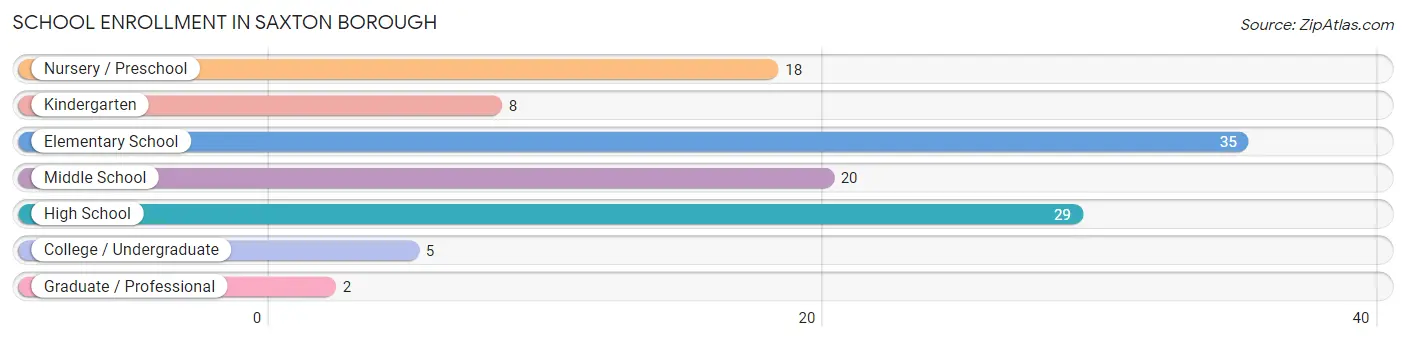
School Enrollment in Saxton borough
The most common levels of schooling among the 117 students in Saxton borough are elementary school (35 | 29.9%), high school (29 | 24.8%), and middle school (20 | 17.1%).
| School Level | # Students | % Students |
| Nursery / Preschool | 18 | 15.4% |
| Kindergarten | 8 | 6.8% |
| Elementary School | 35 | 29.9% |
| Middle School | 20 | 17.1% |
| High School | 29 | 24.8% |
| College / Undergraduate | 5 | 4.3% |
| Graduate / Professional | 2 | 1.7% |
| Total | 117 | 100.0% |
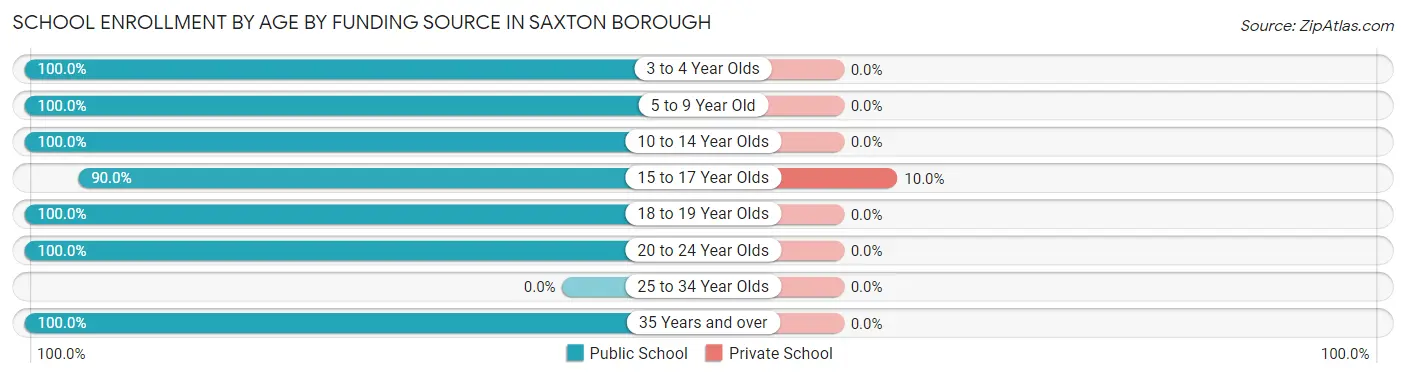
School Enrollment by Age by Funding Source in Saxton borough
Out of a total of 117 students who are enrolled in schools in Saxton borough, 1 (0.9%) attend a private institution, while the remaining 116 (99.1%) are enrolled in public schools. The age group of 15 to 17 year olds has the highest likelihood of being enrolled in private schools, with 1 (10.0% in the age bracket) enrolled. Conversely, the age group of 3 to 4 year olds has the lowest likelihood of being enrolled in a private school, with 10 (100.0% in the age bracket) attending a public institution.
| Age Bracket | Public School | Private School |
| 3 to 4 Year Olds | 10 (100.0%) | 0 (0.0%) |
| 5 to 9 Year Old | 51 (100.0%) | 0 (0.0%) |
| 10 to 14 Year Olds | 29 (100.0%) | 0 (0.0%) |
| 15 to 17 Year Olds | 9 (90.0%) | 1 (10.0%) |
| 18 to 19 Year Olds | 10 (100.0%) | 0 (0.0%) |
| 20 to 24 Year Olds | 3 (100.0%) | 0 (0.0%) |
| 25 to 34 Year Olds | 0 (0.0%) | 0 (0.0%) |
| 35 Years and over | 4 (100.0%) | 0 (0.0%) |
| Total | 116 (99.1%) | 1 (0.9%) |
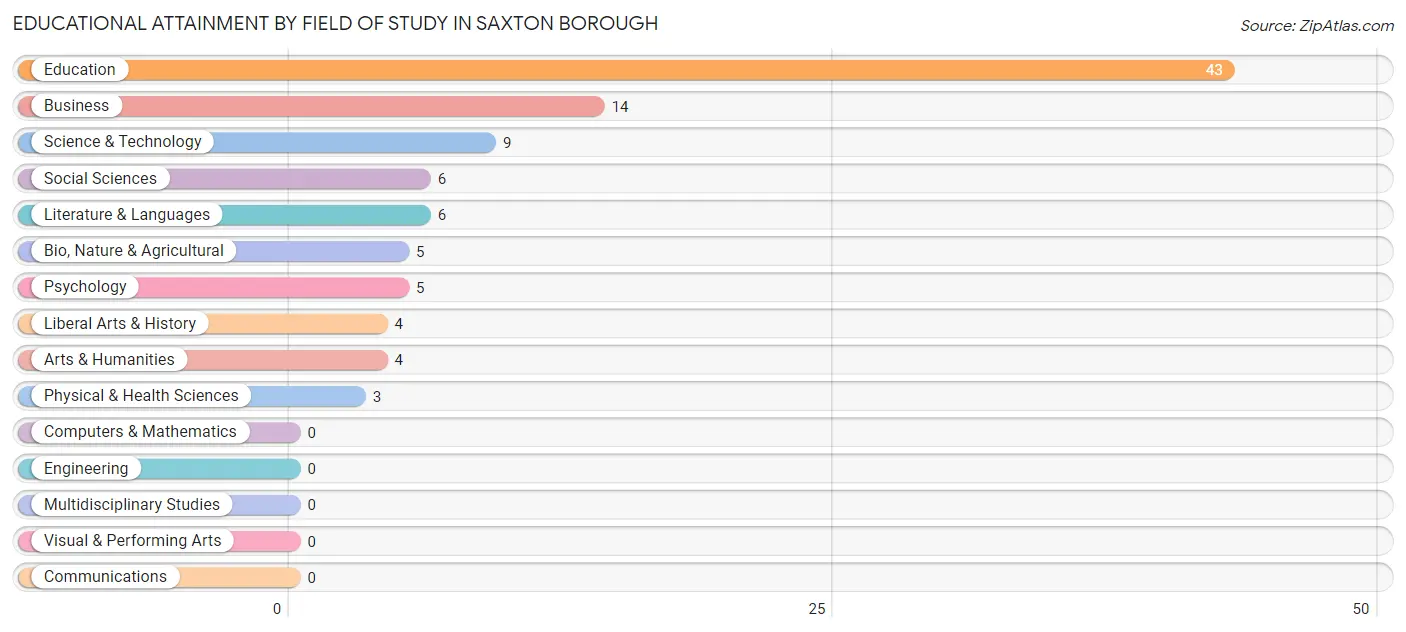
Educational Attainment by Field of Study in Saxton borough
Education (43 | 43.4%), business (14 | 14.1%), science & technology (9 | 9.1%), social sciences (6 | 6.1%), and literature & languages (6 | 6.1%) are the most common fields of study among 99 individuals in Saxton borough who have obtained a bachelor's degree or higher.
| Field of Study | # Graduates | % Graduates |
| Computers & Mathematics | 0 | 0.0% |
| Bio, Nature & Agricultural | 5 | 5.1% |
| Physical & Health Sciences | 3 | 3.0% |
| Psychology | 5 | 5.1% |
| Social Sciences | 6 | 6.1% |
| Engineering | 0 | 0.0% |
| Multidisciplinary Studies | 0 | 0.0% |
| Science & Technology | 9 | 9.1% |
| Business | 14 | 14.1% |
| Education | 43 | 43.4% |
| Literature & Languages | 6 | 6.1% |
| Liberal Arts & History | 4 | 4.0% |
| Visual & Performing Arts | 0 | 0.0% |
| Communications | 0 | 0.0% |
| Arts & Humanities | 4 | 4.0% |
| Total | 99 | 100.0% |
Transportation & Commute in Saxton borough
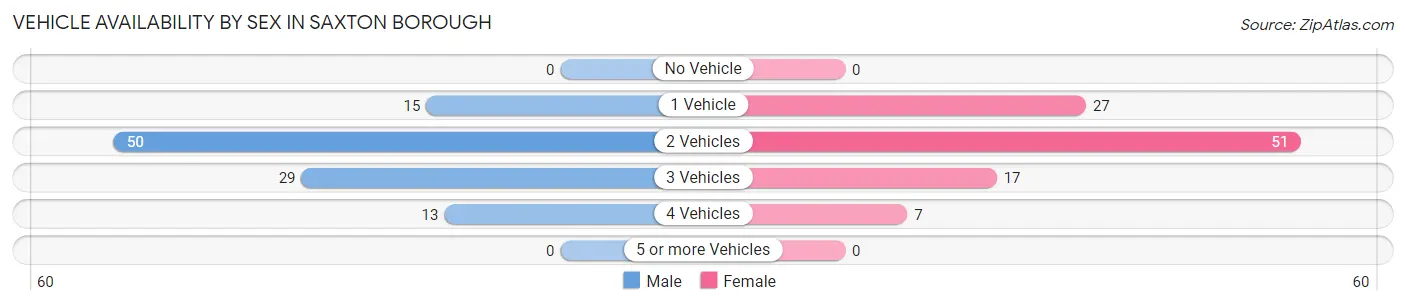
Vehicle Availability by Sex in Saxton borough
The most prevalent vehicle ownership categories in Saxton borough are males with 2 vehicles (50, accounting for 46.7%) and females with 2 vehicles (51, making up 49.0%).
| Vehicles Available | Male | Female |
| No Vehicle | 0 (0.0%) | 0 (0.0%) |
| 1 Vehicle | 15 (14.0%) | 27 (26.5%) |
| 2 Vehicles | 50 (46.7%) | 51 (50.0%) |
| 3 Vehicles | 29 (27.1%) | 17 (16.7%) |
| 4 Vehicles | 13 (12.1%) | 7 (6.9%) |
| 5 or more Vehicles | 0 (0.0%) | 0 (0.0%) |
| Total | 107 (100.0%) | 102 (100.0%) |
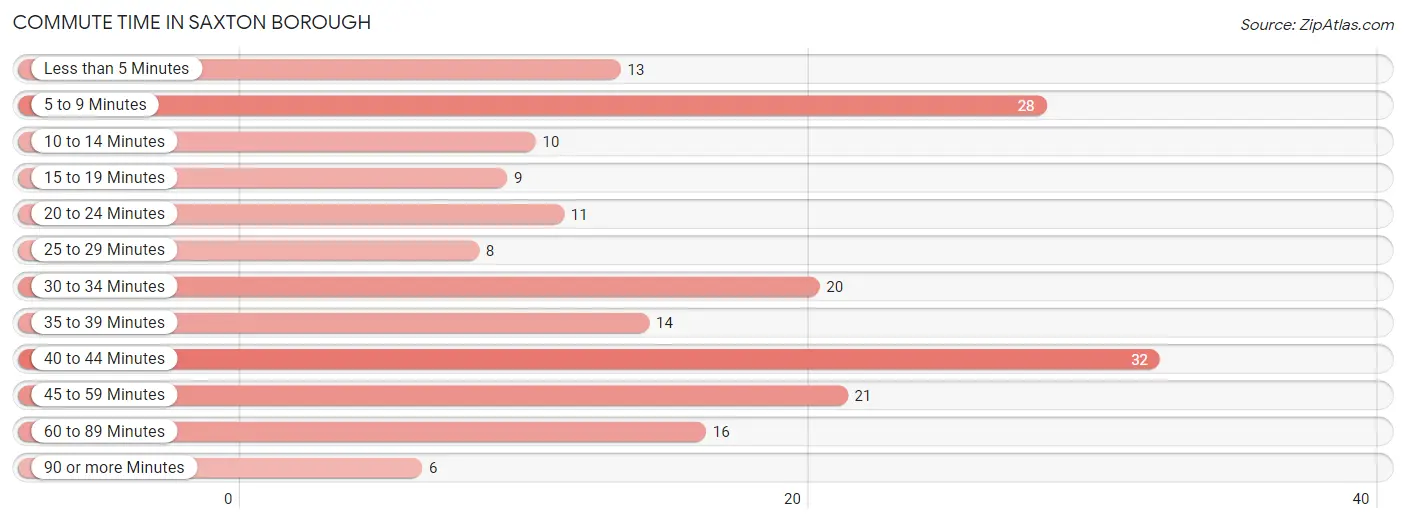
Commute Time in Saxton borough
The most frequently occuring commute durations in Saxton borough are 40 to 44 minutes (32 commuters, 17.0%), 5 to 9 minutes (28 commuters, 14.9%), and 45 to 59 minutes (21 commuters, 11.2%).
| Commute Time | # Commuters | % Commuters |
| Less than 5 Minutes | 13 | 6.9% |
| 5 to 9 Minutes | 28 | 14.9% |
| 10 to 14 Minutes | 10 | 5.3% |
| 15 to 19 Minutes | 9 | 4.8% |
| 20 to 24 Minutes | 11 | 5.9% |
| 25 to 29 Minutes | 8 | 4.3% |
| 30 to 34 Minutes | 20 | 10.6% |
| 35 to 39 Minutes | 14 | 7.4% |
| 40 to 44 Minutes | 32 | 17.0% |
| 45 to 59 Minutes | 21 | 11.2% |
| 60 to 89 Minutes | 16 | 8.5% |
| 90 or more Minutes | 6 | 3.2% |
Commute Time by Sex in Saxton borough
The most common commute times in Saxton borough are 30 to 34 minutes (19 commuters, 18.8%) for males and 5 to 9 minutes (23 commuters, 26.4%) for females.
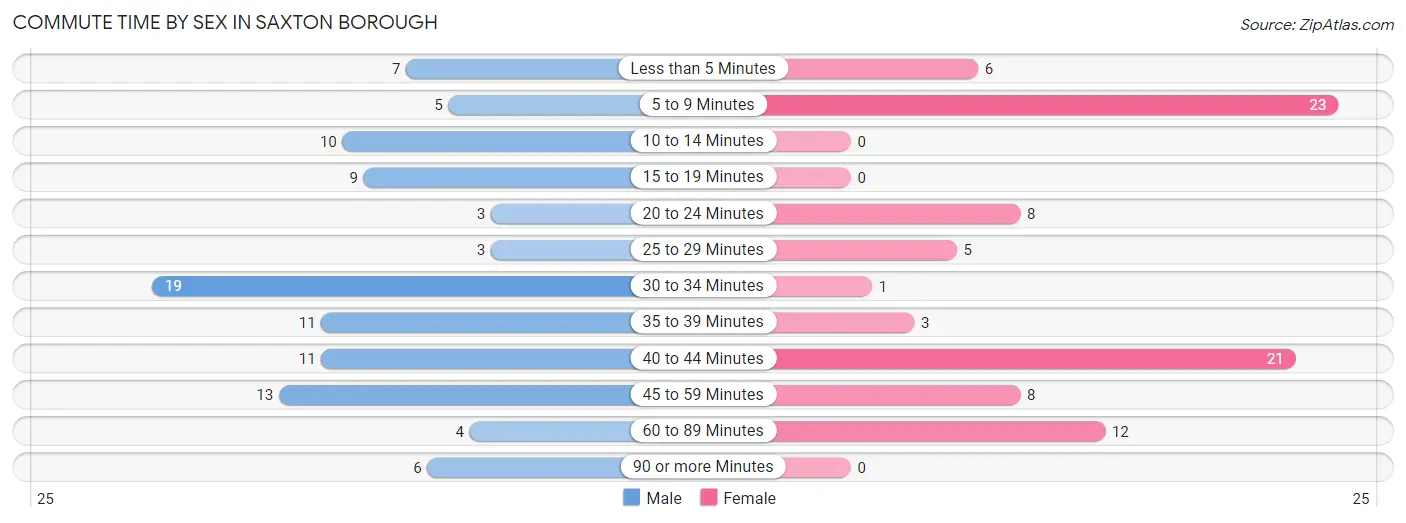
| Commute Time | Male | Female |
| Less than 5 Minutes | 7 (6.9%) | 6 (6.9%) |
| 5 to 9 Minutes | 5 (5.0%) | 23 (26.4%) |
| 10 to 14 Minutes | 10 (9.9%) | 0 (0.0%) |
| 15 to 19 Minutes | 9 (8.9%) | 0 (0.0%) |
| 20 to 24 Minutes | 3 (3.0%) | 8 (9.2%) |
| 25 to 29 Minutes | 3 (3.0%) | 5 (5.8%) |
| 30 to 34 Minutes | 19 (18.8%) | 1 (1.1%) |
| 35 to 39 Minutes | 11 (10.9%) | 3 (3.5%) |
| 40 to 44 Minutes | 11 (10.9%) | 21 (24.1%) |
| 45 to 59 Minutes | 13 (12.9%) | 8 (9.2%) |
| 60 to 89 Minutes | 4 (4.0%) | 12 (13.8%) |
| 90 or more Minutes | 6 (5.9%) | 0 (0.0%) |
Time of Departure to Work by Sex in Saxton borough
The most frequent times of departure to work in Saxton borough are 12:00 AM to 4:59 AM (26, 25.7%) for males and 6:30 AM to 6:59 AM (19, 21.8%) for females.
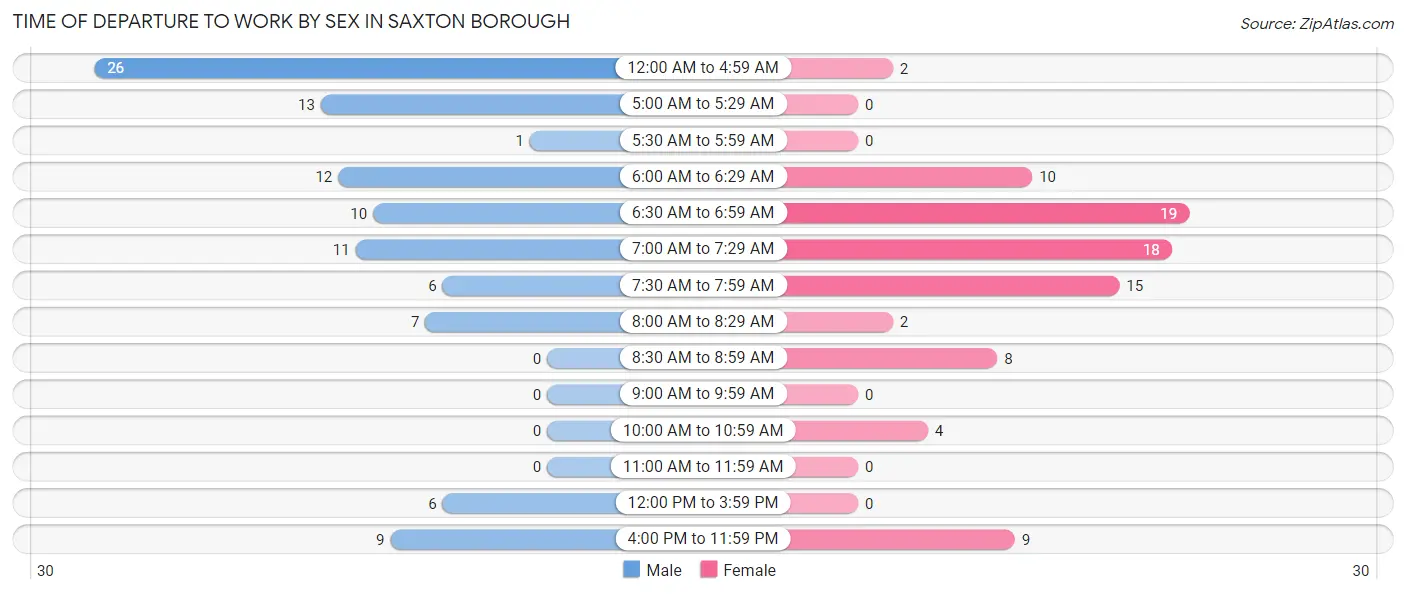
| Time of Departure | Male | Female |
| 12:00 AM to 4:59 AM | 26 (25.7%) | 2 (2.3%) |
| 5:00 AM to 5:29 AM | 13 (12.9%) | 0 (0.0%) |
| 5:30 AM to 5:59 AM | 1 (1.0%) | 0 (0.0%) |
| 6:00 AM to 6:29 AM | 12 (11.9%) | 10 (11.5%) |
| 6:30 AM to 6:59 AM | 10 (9.9%) | 19 (21.8%) |
| 7:00 AM to 7:29 AM | 11 (10.9%) | 18 (20.7%) |
| 7:30 AM to 7:59 AM | 6 (5.9%) | 15 (17.2%) |
| 8:00 AM to 8:29 AM | 7 (6.9%) | 2 (2.3%) |
| 8:30 AM to 8:59 AM | 0 (0.0%) | 8 (9.2%) |
| 9:00 AM to 9:59 AM | 0 (0.0%) | 0 (0.0%) |
| 10:00 AM to 10:59 AM | 0 (0.0%) | 4 (4.6%) |
| 11:00 AM to 11:59 AM | 0 (0.0%) | 0 (0.0%) |
| 12:00 PM to 3:59 PM | 6 (5.9%) | 0 (0.0%) |
| 4:00 PM to 11:59 PM | 9 (8.9%) | 9 (10.3%) |
| Total | 101 (100.0%) | 87 (100.0%) |
Housing Occupancy in Saxton borough
Occupancy by Ownership in Saxton borough
Of the total 307 dwellings in Saxton borough, owner-occupied units account for 173 (56.4%), while renter-occupied units make up 134 (43.6%).
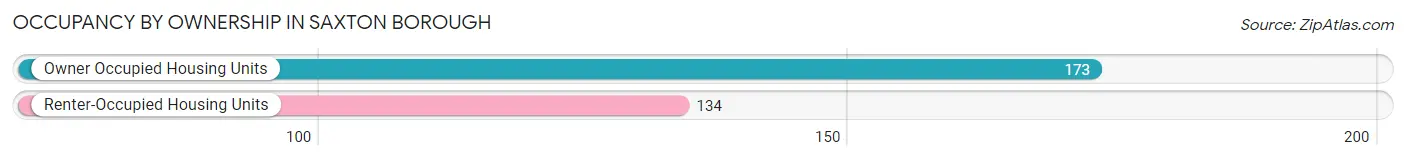
| Occupancy | # Housing Units | % Housing Units |
| Owner Occupied Housing Units | 173 | 56.4% |
| Renter-Occupied Housing Units | 134 | 43.6% |
| Total Occupied Housing Units | 307 | 100.0% |
Occupancy by Household Size in Saxton borough
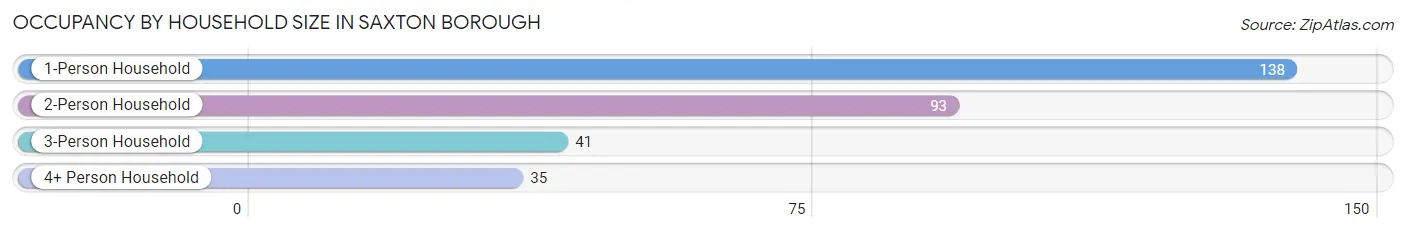
| Household Size | # Housing Units | % Housing Units |
| 1-Person Household | 138 | 45.0% |
| 2-Person Household | 93 | 30.3% |
| 3-Person Household | 41 | 13.4% |
| 4+ Person Household | 35 | 11.4% |
| Total Housing Units | 307 | 100.0% |
Occupancy by Ownership by Household Size in Saxton borough
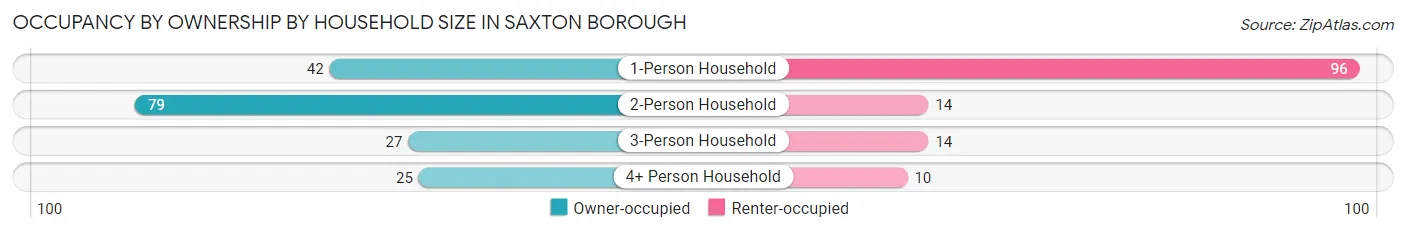
| Household Size | Owner-occupied | Renter-occupied |
| 1-Person Household | 42 (30.4%) | 96 (69.6%) |
| 2-Person Household | 79 (85.0%) | 14 (15.0%) |
| 3-Person Household | 27 (65.8%) | 14 (34.2%) |
| 4+ Person Household | 25 (71.4%) | 10 (28.6%) |
| Total Housing Units | 173 (56.4%) | 134 (43.6%) |
Occupancy by Educational Attainment in Saxton borough
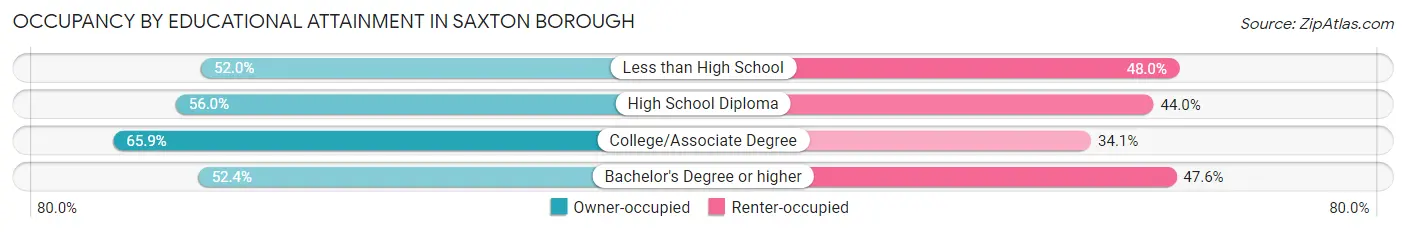
| Household Size | Owner-occupied | Renter-occupied |
| Less than High School | 13 (52.0%) | 12 (48.0%) |
| High School Diploma | 98 (56.0%) | 77 (44.0%) |
| College/Associate Degree | 29 (65.9%) | 15 (34.1%) |
| Bachelor's Degree or higher | 33 (52.4%) | 30 (47.6%) |
Occupancy by Age of Householder in Saxton borough
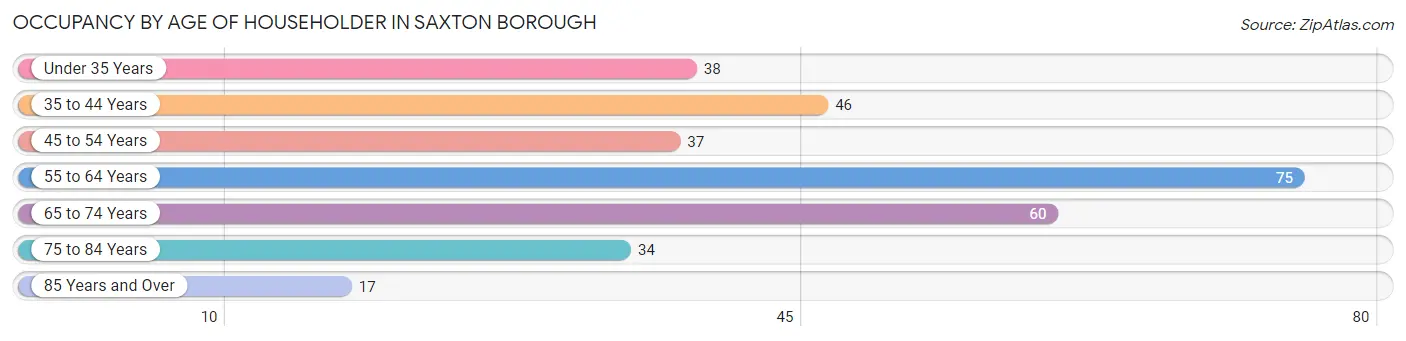
| Age Bracket | # Households | % Households |
| Under 35 Years | 38 | 12.4% |
| 35 to 44 Years | 46 | 15.0% |
| 45 to 54 Years | 37 | 12.0% |
| 55 to 64 Years | 75 | 24.4% |
| 65 to 74 Years | 60 | 19.5% |
| 75 to 84 Years | 34 | 11.1% |
| 85 Years and Over | 17 | 5.5% |
| Total | 307 | 100.0% |
Housing Finances in Saxton borough
Median Income by Occupancy in Saxton borough
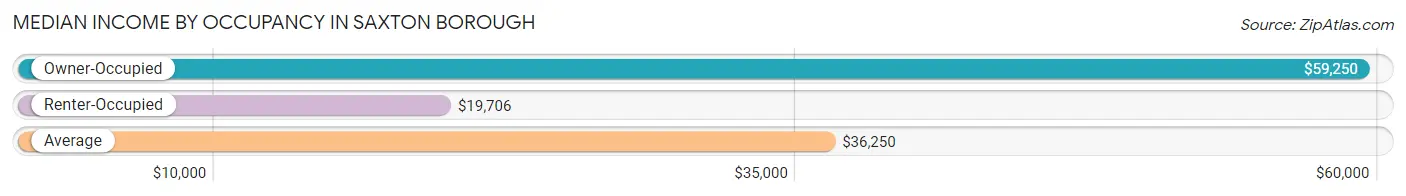
| Occupancy Type | # Households | Median Income |
| Owner-Occupied | 173 (56.4%) | $59,250 |
| Renter-Occupied | 134 (43.6%) | $19,706 |
| Average | 307 (100.0%) | $36,250 |
Occupancy by Householder Income Bracket in Saxton borough
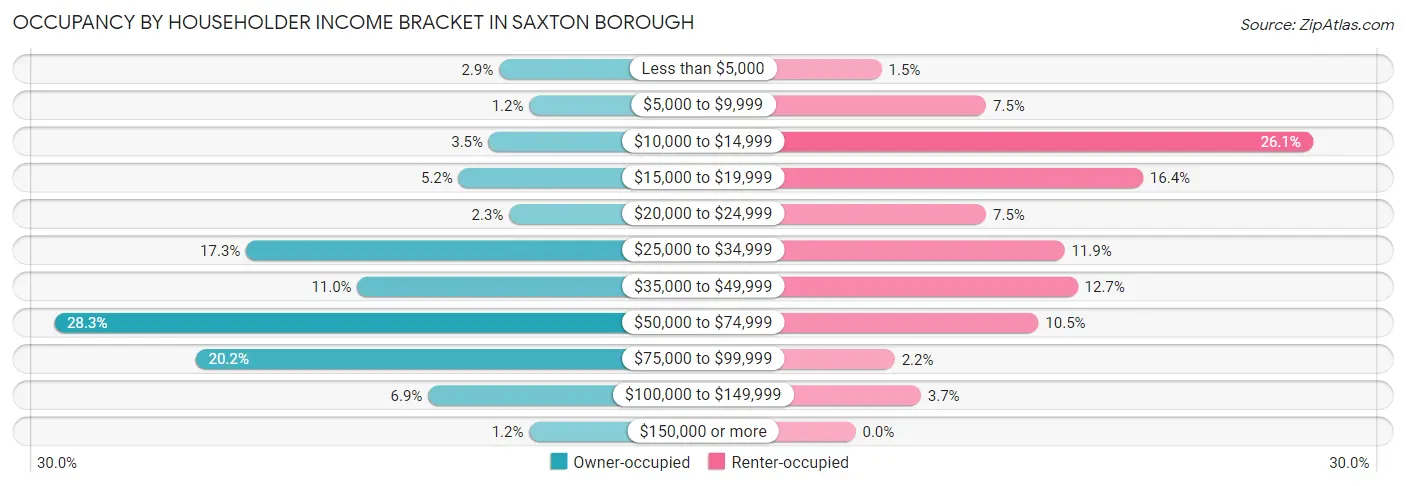
| Income Bracket | Owner-occupied | Renter-occupied |
| Less than $5,000 | 5 (2.9%) | 2 (1.5%) |
| $5,000 to $9,999 | 2 (1.2%) | 10 (7.5%) |
| $10,000 to $14,999 | 6 (3.5%) | 35 (26.1%) |
| $15,000 to $19,999 | 9 (5.2%) | 22 (16.4%) |
| $20,000 to $24,999 | 4 (2.3%) | 10 (7.5%) |
| $25,000 to $34,999 | 30 (17.3%) | 16 (11.9%) |
| $35,000 to $49,999 | 19 (11.0%) | 17 (12.7%) |
| $50,000 to $74,999 | 49 (28.3%) | 14 (10.4%) |
| $75,000 to $99,999 | 35 (20.2%) | 3 (2.2%) |
| $100,000 to $149,999 | 12 (6.9%) | 5 (3.7%) |
| $150,000 or more | 2 (1.2%) | 0 (0.0%) |
| Total | 173 (100.0%) | 134 (100.0%) |
Monthly Housing Cost Tiers in Saxton borough
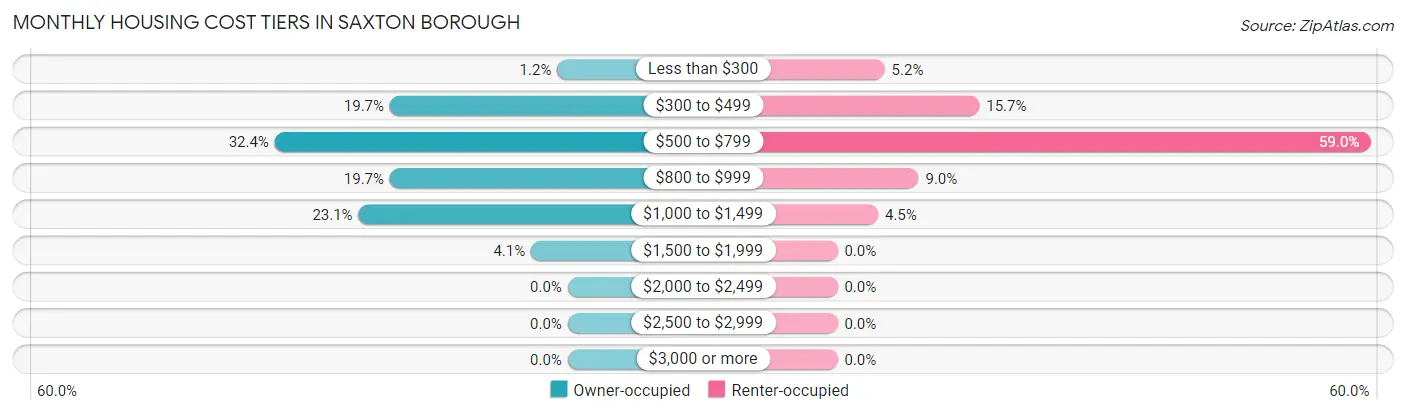
| Monthly Cost | Owner-occupied | Renter-occupied |
| Less than $300 | 2 (1.2%) | 7 (5.2%) |
| $300 to $499 | 34 (19.7%) | 21 (15.7%) |
| $500 to $799 | 56 (32.4%) | 79 (59.0%) |
| $800 to $999 | 34 (19.7%) | 12 (9.0%) |
| $1,000 to $1,499 | 40 (23.1%) | 6 (4.5%) |
| $1,500 to $1,999 | 7 (4.1%) | 0 (0.0%) |
| $2,000 to $2,499 | 0 (0.0%) | 0 (0.0%) |
| $2,500 to $2,999 | 0 (0.0%) | 0 (0.0%) |
| $3,000 or more | 0 (0.0%) | 0 (0.0%) |
| Total | 173 (100.0%) | 134 (100.0%) |
Physical Housing Characteristics in Saxton borough
Housing Structures in Saxton borough
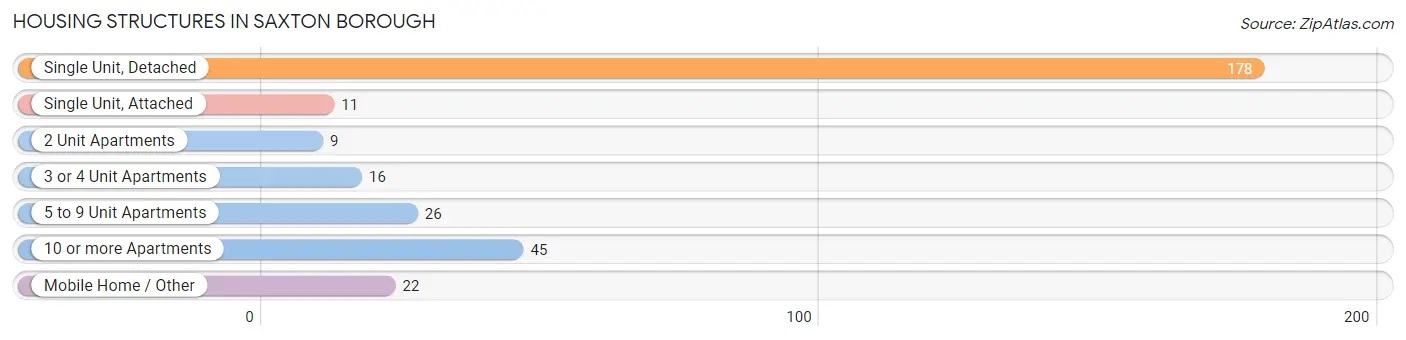
| Structure Type | # Housing Units | % Housing Units |
| Single Unit, Detached | 178 | 58.0% |
| Single Unit, Attached | 11 | 3.6% |
| 2 Unit Apartments | 9 | 2.9% |
| 3 or 4 Unit Apartments | 16 | 5.2% |
| 5 to 9 Unit Apartments | 26 | 8.5% |
| 10 or more Apartments | 45 | 14.7% |
| Mobile Home / Other | 22 | 7.2% |
| Total | 307 | 100.0% |
Housing Structures by Occupancy in Saxton borough
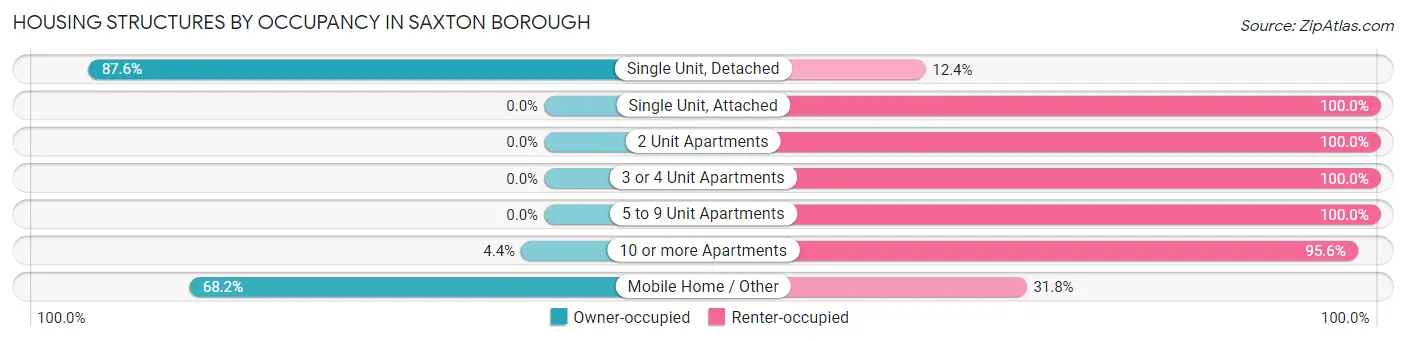
| Structure Type | Owner-occupied | Renter-occupied |
| Single Unit, Detached | 156 (87.6%) | 22 (12.4%) |
| Single Unit, Attached | 0 (0.0%) | 11 (100.0%) |
| 2 Unit Apartments | 0 (0.0%) | 9 (100.0%) |
| 3 or 4 Unit Apartments | 0 (0.0%) | 16 (100.0%) |
| 5 to 9 Unit Apartments | 0 (0.0%) | 26 (100.0%) |
| 10 or more Apartments | 2 (4.4%) | 43 (95.6%) |
| Mobile Home / Other | 15 (68.2%) | 7 (31.8%) |
| Total | 173 (56.4%) | 134 (43.6%) |
Housing Structures by Number of Rooms in Saxton borough
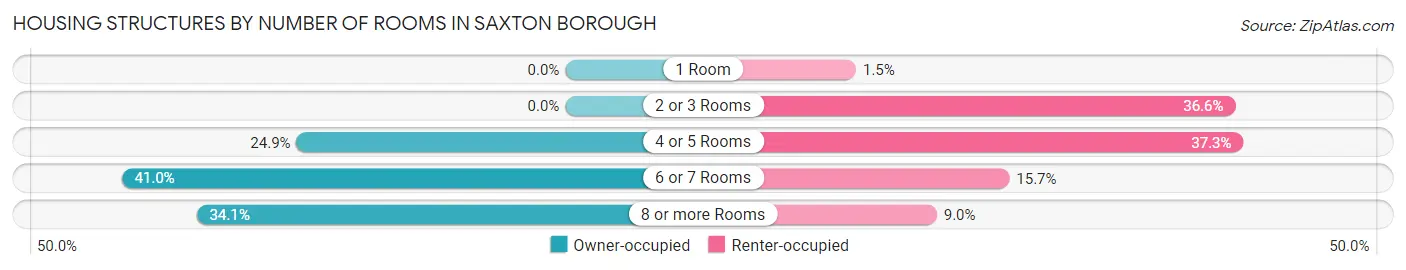
| Number of Rooms | Owner-occupied | Renter-occupied |
| 1 Room | 0 (0.0%) | 2 (1.5%) |
| 2 or 3 Rooms | 0 (0.0%) | 49 (36.6%) |
| 4 or 5 Rooms | 43 (24.9%) | 50 (37.3%) |
| 6 or 7 Rooms | 71 (41.0%) | 21 (15.7%) |
| 8 or more Rooms | 59 (34.1%) | 12 (9.0%) |
| Total | 173 (100.0%) | 134 (100.0%) |
Housing Structure by Heating Type in Saxton borough
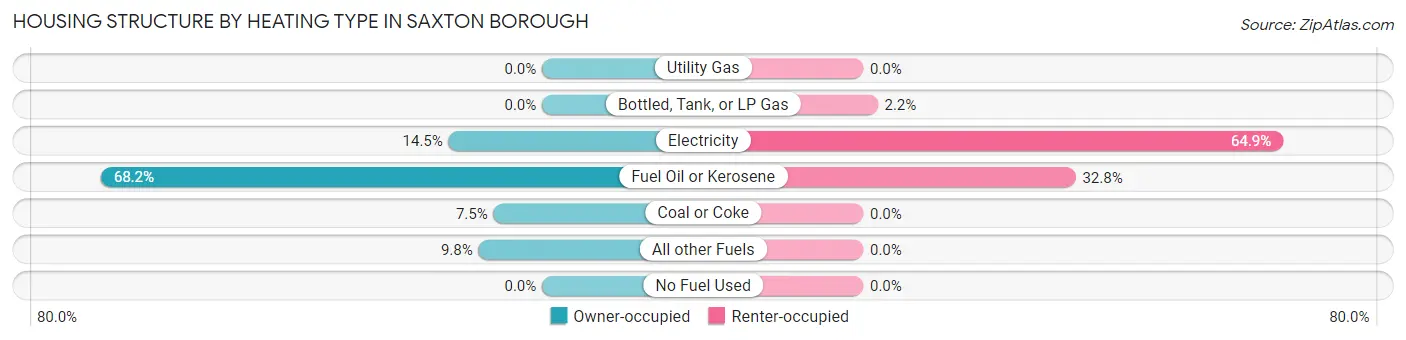
| Heating Type | Owner-occupied | Renter-occupied |
| Utility Gas | 0 (0.0%) | 0 (0.0%) |
| Bottled, Tank, or LP Gas | 0 (0.0%) | 3 (2.2%) |
| Electricity | 25 (14.4%) | 87 (64.9%) |
| Fuel Oil or Kerosene | 118 (68.2%) | 44 (32.8%) |
| Coal or Coke | 13 (7.5%) | 0 (0.0%) |
| All other Fuels | 17 (9.8%) | 0 (0.0%) |
| No Fuel Used | 0 (0.0%) | 0 (0.0%) |
| Total | 173 (100.0%) | 134 (100.0%) |
Household Vehicle Usage in Saxton borough
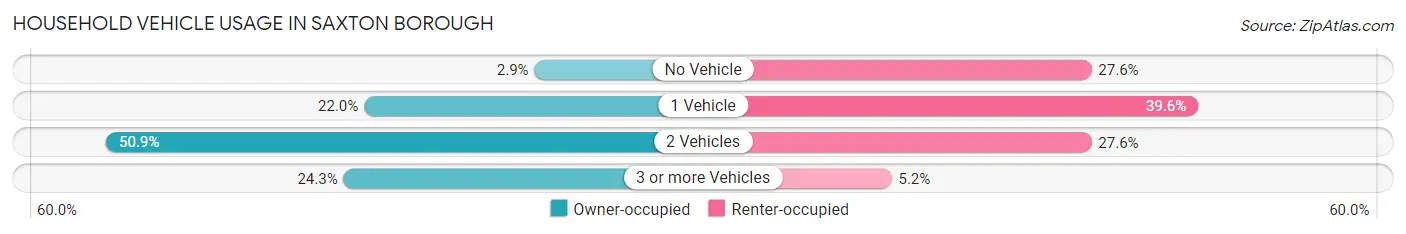
| Vehicles per Household | Owner-occupied | Renter-occupied |
| No Vehicle | 5 (2.9%) | 37 (27.6%) |
| 1 Vehicle | 38 (22.0%) | 53 (39.6%) |
| 2 Vehicles | 88 (50.9%) | 37 (27.6%) |
| 3 or more Vehicles | 42 (24.3%) | 7 (5.2%) |
| Total | 173 (100.0%) | 134 (100.0%) |
Real Estate & Mortgages in Saxton borough
Real Estate and Mortgage Overview in Saxton borough
| Characteristic | Without Mortgage | With Mortgage |
| Housing Units | 90 | 83 |
| Median Property Value | $98,300 | $128,400 |
| Median Household Income | $48,000 | $2 |
| Monthly Housing Costs | $550 | $0 |
| Real Estate Taxes | $1,427 | $0 |
Property Value by Mortgage Status in Saxton borough
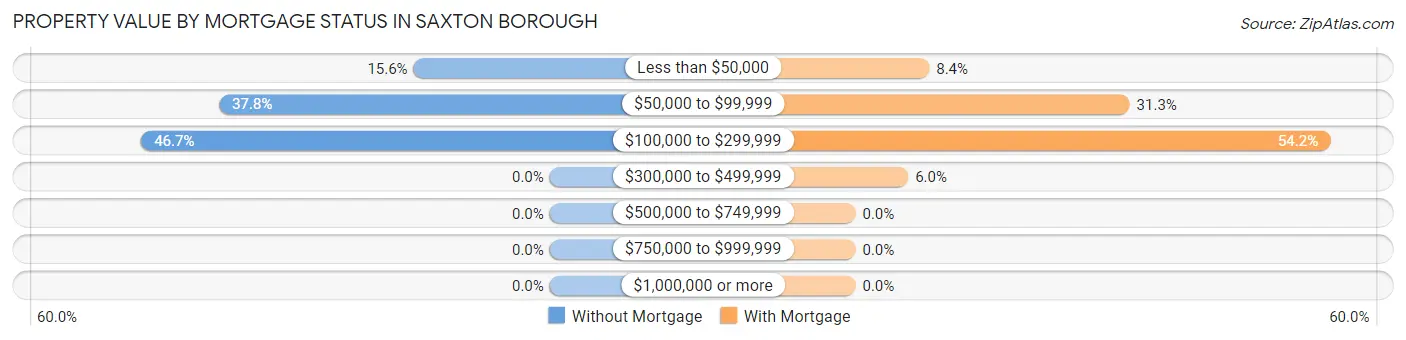
| Property Value | Without Mortgage | With Mortgage |
| Less than $50,000 | 14 (15.6%) | 7 (8.4%) |
| $50,000 to $99,999 | 34 (37.8%) | 26 (31.3%) |
| $100,000 to $299,999 | 42 (46.7%) | 45 (54.2%) |
| $300,000 to $499,999 | 0 (0.0%) | 5 (6.0%) |
| $500,000 to $749,999 | 0 (0.0%) | 0 (0.0%) |
| $750,000 to $999,999 | 0 (0.0%) | 0 (0.0%) |
| $1,000,000 or more | 0 (0.0%) | 0 (0.0%) |
| Total | 90 (100.0%) | 83 (100.0%) |
Household Income by Mortgage Status in Saxton borough
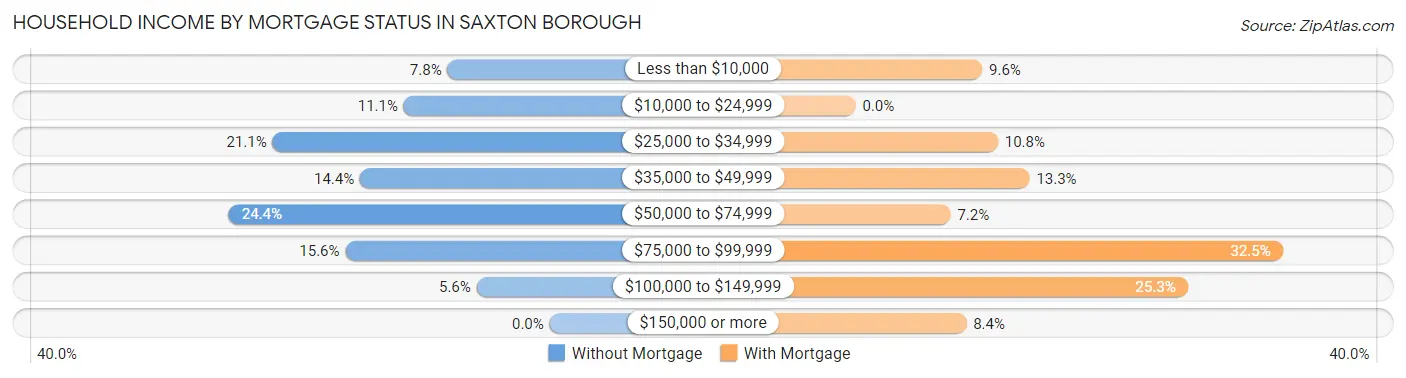
| Household Income | Without Mortgage | With Mortgage |
| Less than $10,000 | 7 (7.8%) | 8 (9.6%) |
| $10,000 to $24,999 | 10 (11.1%) | 0 (0.0%) |
| $25,000 to $34,999 | 19 (21.1%) | 9 (10.8%) |
| $35,000 to $49,999 | 13 (14.4%) | 11 (13.3%) |
| $50,000 to $74,999 | 22 (24.4%) | 6 (7.2%) |
| $75,000 to $99,999 | 14 (15.6%) | 27 (32.5%) |
| $100,000 to $149,999 | 5 (5.6%) | 21 (25.3%) |
| $150,000 or more | 0 (0.0%) | 7 (8.4%) |
| Total | 90 (100.0%) | 83 (100.0%) |
Property Value to Household Income Ratio in Saxton borough
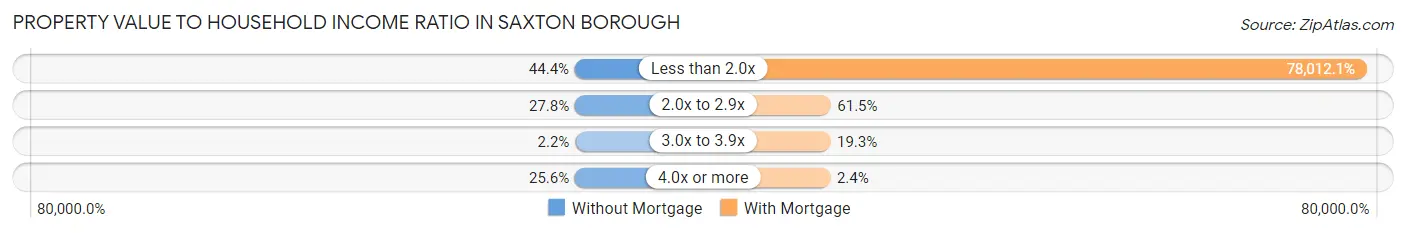
| Value-to-Income Ratio | Without Mortgage | With Mortgage |
| Less than 2.0x | 40 (44.4%) | 64,750 (78,012.0%) |
| 2.0x to 2.9x | 25 (27.8%) | 51 (61.5%) |
| 3.0x to 3.9x | 2 (2.2%) | 16 (19.3%) |
| 4.0x or more | 23 (25.6%) | 2 (2.4%) |
| Total | 90 (100.0%) | 83 (100.0%) |
Real Estate Taxes by Mortgage Status in Saxton borough
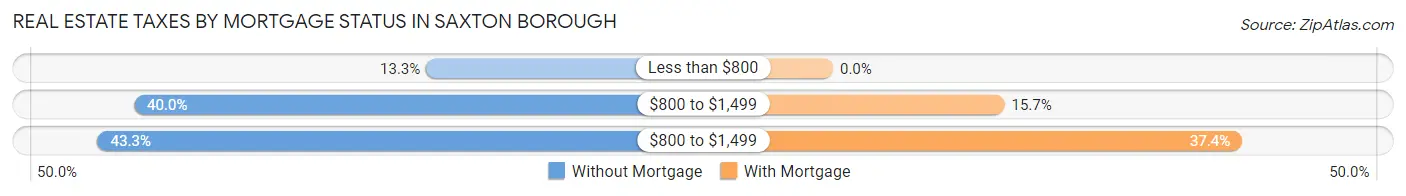
| Property Taxes | Without Mortgage | With Mortgage |
| Less than $800 | 12 (13.3%) | 0 (0.0%) |
| $800 to $1,499 | 36 (40.0%) | 13 (15.7%) |
| $800 to $1,499 | 39 (43.3%) | 31 (37.3%) |
| Total | 90 (100.0%) | 83 (100.0%) |
Health & Disability in Saxton borough
Health Insurance Coverage by Age in Saxton borough
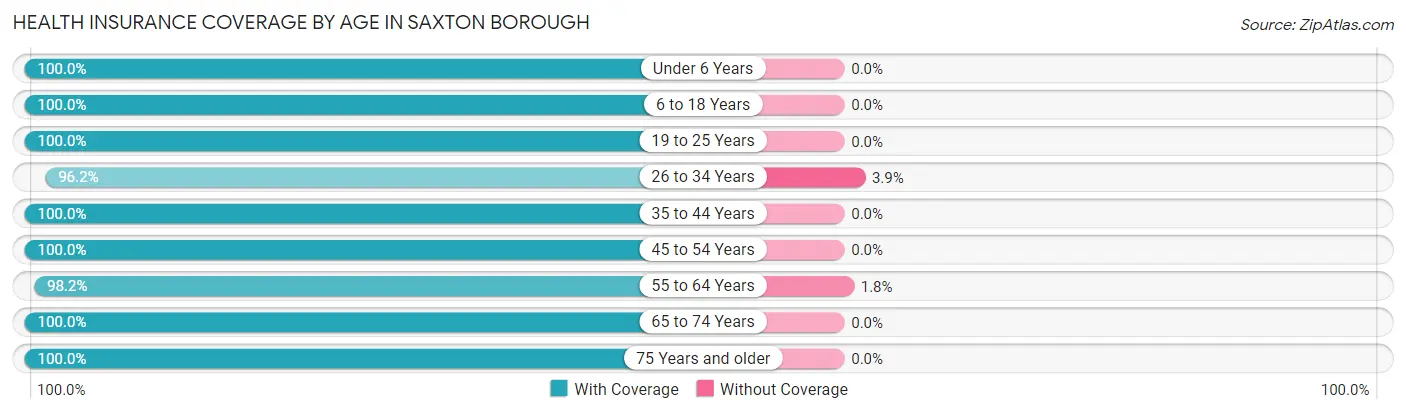
| Age Bracket | With Coverage | Without Coverage |
| Under 6 Years | 53 (100.0%) | 0 (0.0%) |
| 6 to 18 Years | 101 (100.0%) | 0 (0.0%) |
| 19 to 25 Years | 40 (100.0%) | 0 (0.0%) |
| 26 to 34 Years | 50 (96.2%) | 2 (3.8%) |
| 35 to 44 Years | 89 (100.0%) | 0 (0.0%) |
| 45 to 54 Years | 55 (100.0%) | 0 (0.0%) |
| 55 to 64 Years | 111 (98.2%) | 2 (1.8%) |
| 65 to 74 Years | 76 (100.0%) | 0 (0.0%) |
| 75 Years and older | 76 (100.0%) | 0 (0.0%) |
| Total | 651 (99.4%) | 4 (0.6%) |
Health Insurance Coverage by Citizenship Status in Saxton borough
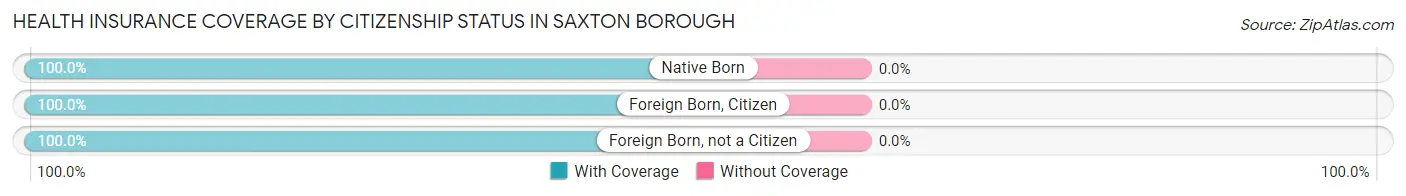
| Citizenship Status | With Coverage | Without Coverage |
| Native Born | 53 (100.0%) | 0 (0.0%) |
| Foreign Born, Citizen | 101 (100.0%) | 0 (0.0%) |
| Foreign Born, not a Citizen | 40 (100.0%) | 0 (0.0%) |
Health Insurance Coverage by Household Income in Saxton borough
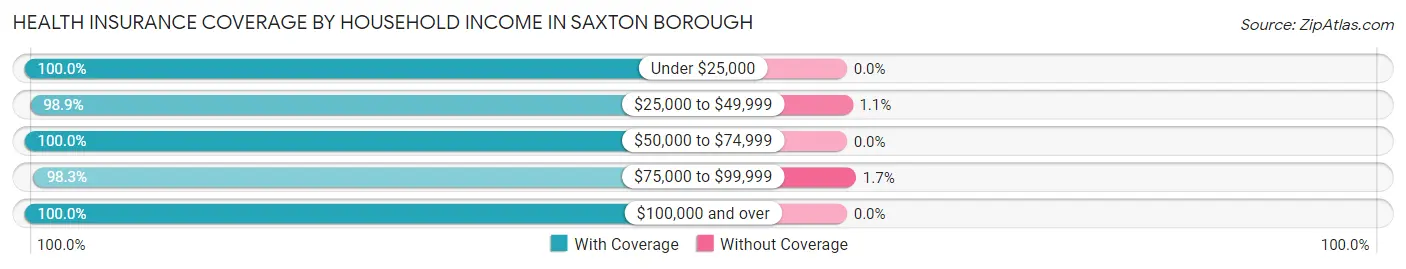
| Household Income | With Coverage | Without Coverage |
| Under $25,000 | 150 (100.0%) | 0 (0.0%) |
| $25,000 to $49,999 | 186 (98.9%) | 2 (1.1%) |
| $50,000 to $74,999 | 134 (100.0%) | 0 (0.0%) |
| $75,000 to $99,999 | 115 (98.3%) | 2 (1.7%) |
| $100,000 and over | 66 (100.0%) | 0 (0.0%) |
Public vs Private Health Insurance Coverage by Age in Saxton borough
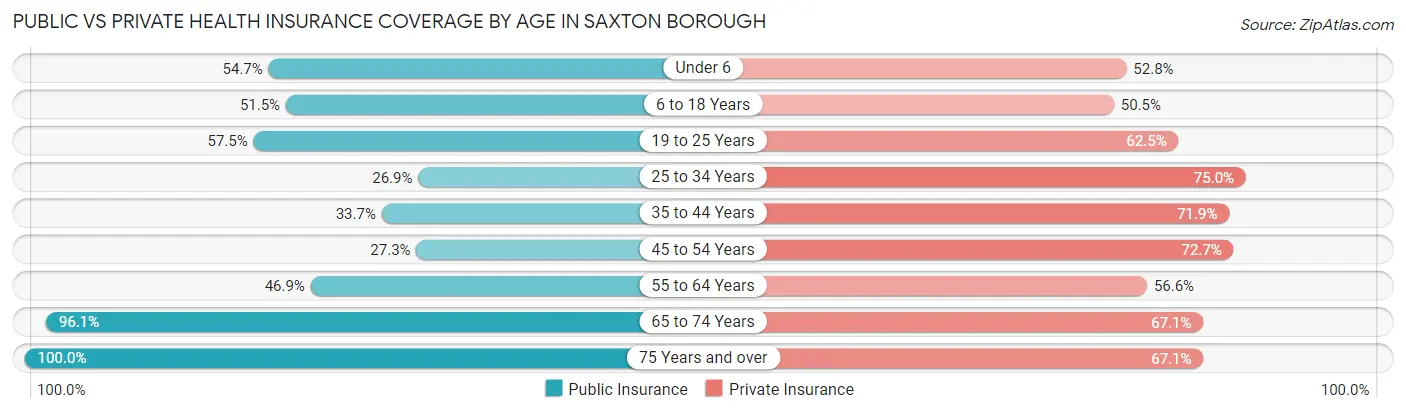
| Age Bracket | Public Insurance | Private Insurance |
| Under 6 | 29 (54.7%) | 28 (52.8%) |
| 6 to 18 Years | 52 (51.5%) | 51 (50.5%) |
| 19 to 25 Years | 23 (57.5%) | 25 (62.5%) |
| 25 to 34 Years | 14 (26.9%) | 39 (75.0%) |
| 35 to 44 Years | 30 (33.7%) | 64 (71.9%) |
| 45 to 54 Years | 15 (27.3%) | 40 (72.7%) |
| 55 to 64 Years | 53 (46.9%) | 64 (56.6%) |
| 65 to 74 Years | 73 (96.1%) | 51 (67.1%) |
| 75 Years and over | 76 (100.0%) | 51 (67.1%) |
| Total | 365 (55.7%) | 413 (63.0%) |
Disability Status by Sex by Age in Saxton borough
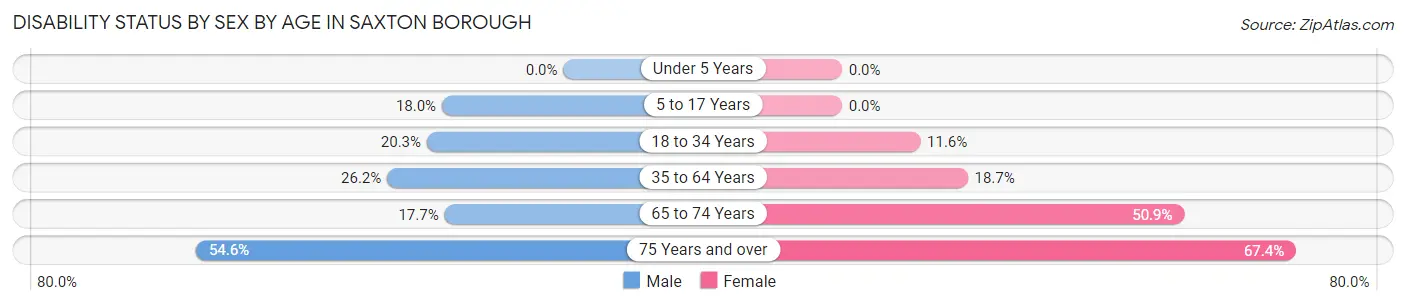
| Age Bracket | Male | Female |
| Under 5 Years | 0 (0.0%) | 0 (0.0%) |
| 5 to 17 Years | 11 (18.0%) | 0 (0.0%) |
| 18 to 34 Years | 15 (20.3%) | 5 (11.6%) |
| 35 to 64 Years | 28 (26.2%) | 28 (18.7%) |
| 65 to 74 Years | 3 (17.6%) | 30 (50.8%) |
| 75 Years and over | 18 (54.5%) | 29 (67.4%) |
Disability Class by Sex by Age in Saxton borough
Disability Class: Hearing Difficulty
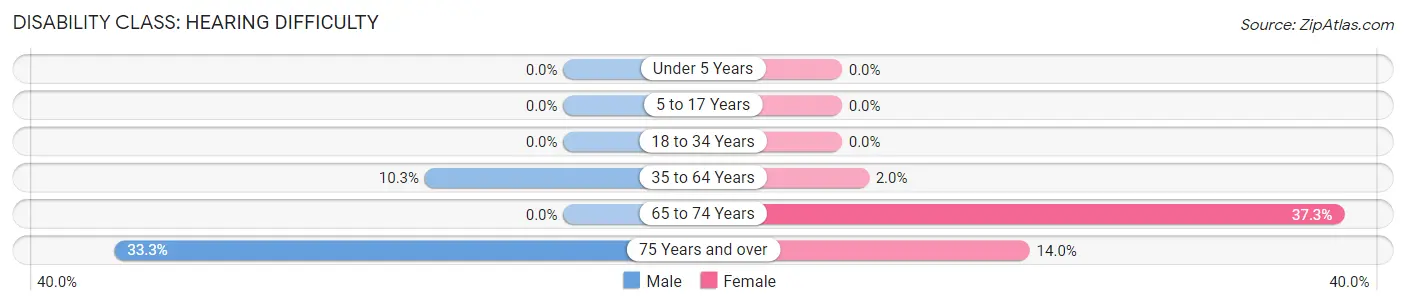
| Age Bracket | Male | Female |
| Under 5 Years | 0 (0.0%) | 0 (0.0%) |
| 5 to 17 Years | 0 (0.0%) | 0 (0.0%) |
| 18 to 34 Years | 0 (0.0%) | 0 (0.0%) |
| 35 to 64 Years | 11 (10.3%) | 3 (2.0%) |
| 65 to 74 Years | 0 (0.0%) | 22 (37.3%) |
| 75 Years and over | 11 (33.3%) | 6 (14.0%) |
Disability Class: Vision Difficulty
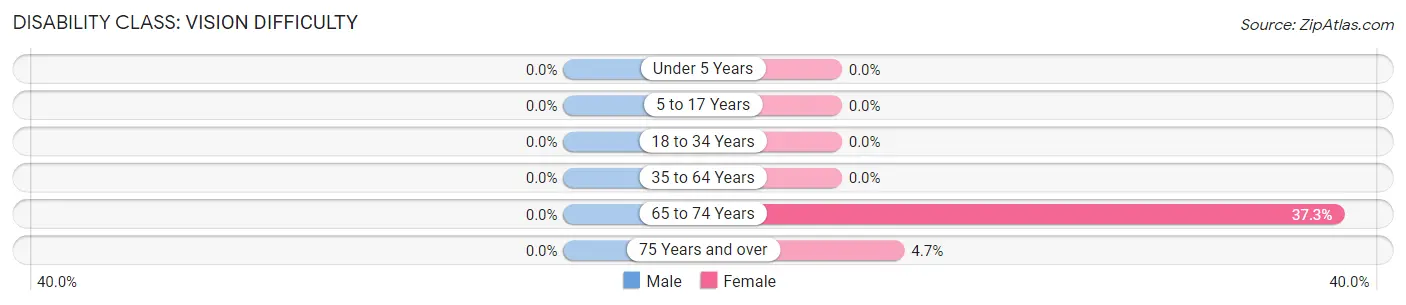
| Age Bracket | Male | Female |
| Under 5 Years | 0 (0.0%) | 0 (0.0%) |
| 5 to 17 Years | 0 (0.0%) | 0 (0.0%) |
| 18 to 34 Years | 0 (0.0%) | 0 (0.0%) |
| 35 to 64 Years | 0 (0.0%) | 0 (0.0%) |
| 65 to 74 Years | 0 (0.0%) | 22 (37.3%) |
| 75 Years and over | 0 (0.0%) | 2 (4.6%) |
Disability Class: Cognitive Difficulty
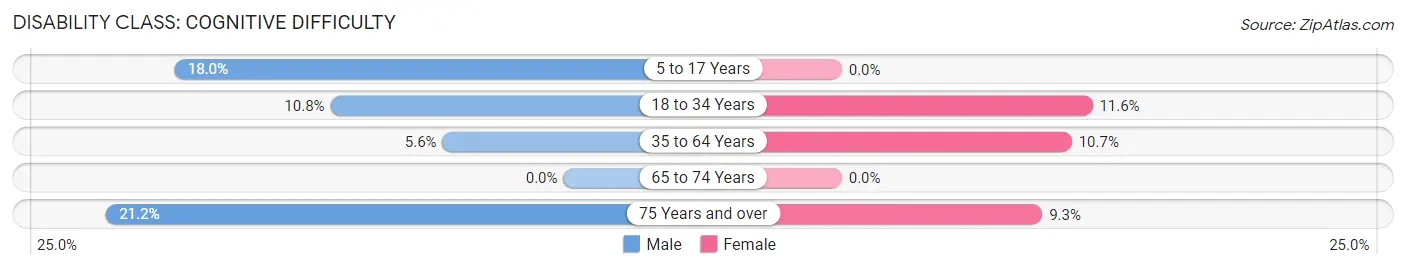
| Age Bracket | Male | Female |
| 5 to 17 Years | 11 (18.0%) | 0 (0.0%) |
| 18 to 34 Years | 8 (10.8%) | 5 (11.6%) |
| 35 to 64 Years | 6 (5.6%) | 16 (10.7%) |
| 65 to 74 Years | 0 (0.0%) | 0 (0.0%) |
| 75 Years and over | 7 (21.2%) | 4 (9.3%) |
Disability Class: Ambulatory Difficulty
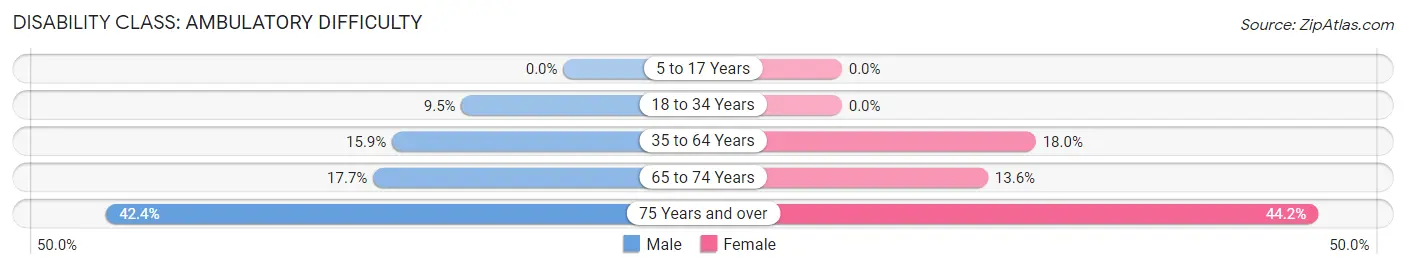
| Age Bracket | Male | Female |
| 5 to 17 Years | 0 (0.0%) | 0 (0.0%) |
| 18 to 34 Years | 7 (9.5%) | 0 (0.0%) |
| 35 to 64 Years | 17 (15.9%) | 27 (18.0%) |
| 65 to 74 Years | 3 (17.6%) | 8 (13.6%) |
| 75 Years and over | 14 (42.4%) | 19 (44.2%) |
Disability Class: Self-Care Difficulty
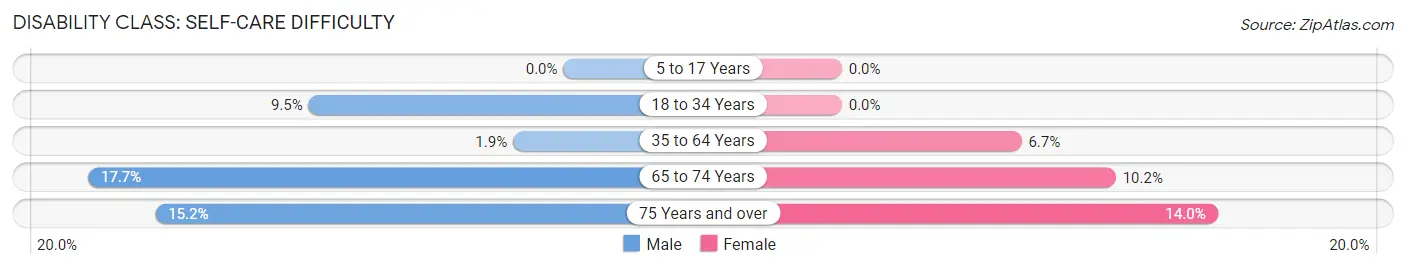
| Age Bracket | Male | Female |
| 5 to 17 Years | 0 (0.0%) | 0 (0.0%) |
| 18 to 34 Years | 7 (9.5%) | 0 (0.0%) |
| 35 to 64 Years | 2 (1.9%) | 10 (6.7%) |
| 65 to 74 Years | 3 (17.6%) | 6 (10.2%) |
| 75 Years and over | 5 (15.1%) | 6 (14.0%) |
Technology Access in Saxton borough
Computing Device Access in Saxton borough
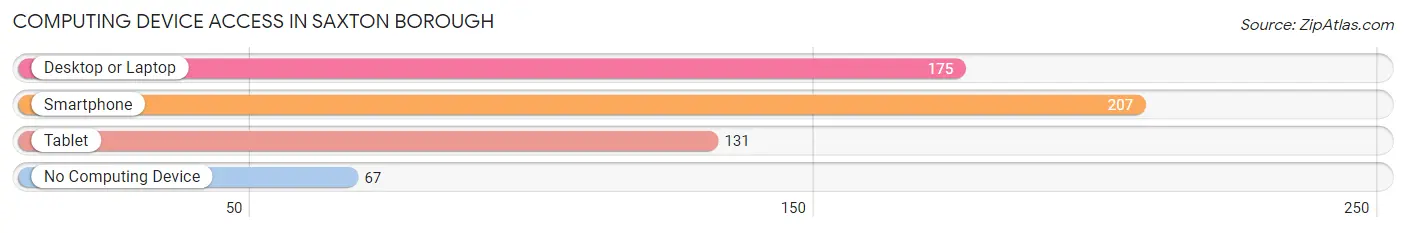
| Device Type | # Households | % Households |
| Desktop or Laptop | 175 | 57.0% |
| Smartphone | 207 | 67.4% |
| Tablet | 131 | 42.7% |
| No Computing Device | 67 | 21.8% |
| Total | 307 | 100.0% |
Internet Access in Saxton borough
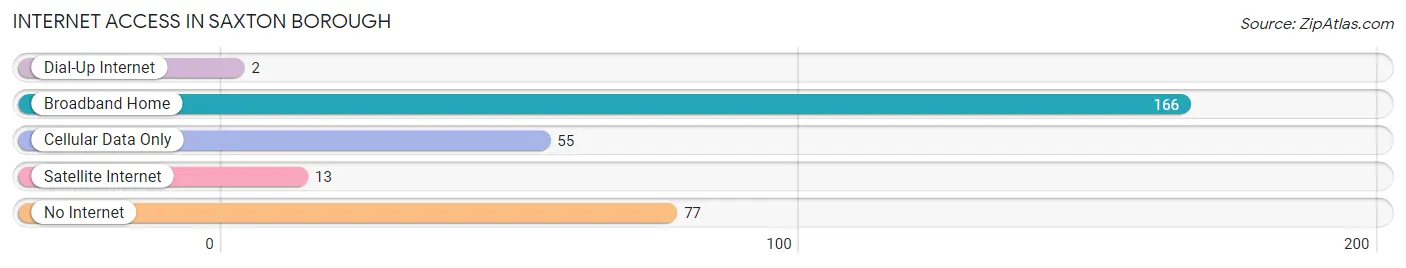
| Internet Type | # Households | % Households |
| Dial-Up Internet | 2 | 0.6% |
| Broadband Home | 166 | 54.1% |
| Cellular Data Only | 55 | 17.9% |
| Satellite Internet | 13 | 4.2% |
| No Internet | 77 | 25.1% |
| Total | 307 | 100.0% |
Saxton borough Summary
Saxton Borough is a small borough located in Bedford County, Pennsylvania. It is situated in the foothills of the Allegheny Mountains and is part of the Altoona Metropolitan Statistical Area. The borough has a population of 1,845 as of the 2010 census.
History
Saxton Borough was founded in 1845 by a group of settlers from the nearby town of Bedford. The town was named after the Saxton family, who were among the first settlers. The town was incorporated in 1854 and has remained relatively unchanged since then.
The town was originally a farming community, but in the late 19th century, the town began to develop into a small industrial center. The town was home to several small factories, including a tannery, a sawmill, and a brickyard. The town also had a railroad station, which connected it to the larger cities of Altoona and Pittsburgh.
The town experienced a period of growth in the early 20th century, as the population increased from 1,000 in 1900 to 1,845 in 2010. The town also experienced a period of decline in the mid-20th century, as many of the factories closed and the population decreased.
Geography
Saxton Borough is located in the foothills of the Allegheny Mountains in Bedford County, Pennsylvania. The borough is situated at an elevation of 1,400 feet and covers an area of 0.7 square miles. The town is located approximately 10 miles east of Altoona and 60 miles east of Pittsburgh.
The borough is bordered by the towns of Bedford, Everett, and Hopewell. The town is located in a rural area and is surrounded by rolling hills and farmland. The town is also located near several small lakes, including Lake Raystown and Lake Gordon.
Economy
The economy of Saxton Borough is largely based on agriculture and tourism. The town is home to several small farms, which produce a variety of crops, including corn, soybeans, and hay. The town is also home to several small businesses, including restaurants, shops, and a bed and breakfast.
The town is also a popular tourist destination, as it is located near several popular attractions, including the Allegheny Mountains, Lake Raystown, and the Pennsylvania Grand Canyon. The town is also home to several annual festivals, including the Saxton Summer Festival and the Saxton Fall Festival.
Demographics
As of the 2010 census, the population of Saxton Borough was 1,845. The population is largely white (97.2%) and the median age is 43. The median household income is $41,250 and the median home value is $117,000.
The town is served by the Saxton-Bedford School District, which includes two elementary schools, one middle school, and one high school. The town is also home to several churches, including the Saxton United Methodist Church and the Saxton Presbyterian Church.
Common Questions
What is Per Capita Income in Saxton borough?
Per Capita income in Saxton borough is $22,764.
What is the Median Family Income in Saxton borough?
Median Family Income in Saxton borough is $52,188.
What is the Median Household income in Saxton borough?
Median Household Income in Saxton borough is $36,250.
What is Income or Wage Gap in Saxton borough?
Income or Wage Gap in Saxton borough is 9.6%.
Women in Saxton borough earn 90.4 cents for every dollar earned by a man.
What is Inequality or Gini Index in Saxton borough?
Inequality or Gini Index in Saxton borough is 0.40.
What is the Total Population of Saxton borough?
Total Population of Saxton borough is 655.
What is the Total Male Population of Saxton borough?
Total Male Population of Saxton borough is 312.
What is the Total Female Population of Saxton borough?
Total Female Population of Saxton borough is 343.
What is the Ratio of Males per 100 Females in Saxton borough?
There are 90.96 Males per 100 Females in Saxton borough.
What is the Ratio of Females per 100 Males in Saxton borough?
There are 109.94 Females per 100 Males in Saxton borough.
What is the Median Population Age in Saxton borough?
Median Population Age in Saxton borough is 43.9 Years.
What is the Average Family Size in Saxton borough
Average Family Size in Saxton borough is 2.9 People.
What is the Average Household Size in Saxton borough
Average Household Size in Saxton borough is 2.1 People.
How Large is the Labor Force in Saxton borough?
There are 252 People in the Labor Forcein in Saxton borough.
What is the Percentage of People in the Labor Force in Saxton borough?
47.0% of People are in the Labor Force in Saxton borough.
What is the Unemployment Rate in Saxton borough?
Unemployment Rate in Saxton borough is 11.1%.