Simpson, PA Map & Demographics
Simpson Map
Simpson Overview
$30,010
PER CAPITA INCOME
$62,014
AVG FAMILY INCOME
$44,639
AVG HOUSEHOLD INCOME
10.0%
WAGE / INCOME GAP [ % ]
90.0¢/ $1
WAGE / INCOME GAP [ $ ]
0.45
INEQUALITY / GINI INDEX
1,147
TOTAL POPULATION
556
MALE POPULATION
591
FEMALE POPULATION
94.08
MALES / 100 FEMALES
106.29
FEMALES / 100 MALES
43.3
MEDIAN AGE
3.1
AVG FAMILY SIZE
2.4
AVG HOUSEHOLD SIZE
582
LABOR FORCE [ PEOPLE ]
61.5%
PERCENT IN LABOR FORCE
1.9%
UNEMPLOYMENT RATE
Simpson Area Codes
Income in Simpson
Income Overview in Simpson
Per Capita Income in Simpson is $30,010, while median incomes of families and households are $62,014 and $44,639 respectively.
| Characteristic | Number | Measure |
| Per Capita Income | 1,147 | $30,010 |
| Median Family Income | 283 | $62,014 |
| Mean Family Income | 283 | $76,550 |
| Median Household Income | 489 | $44,639 |
| Mean Household Income | 489 | $70,569 |
| Income Deficit | 283 | $0 |
| Wage / Income Gap (%) | 1,147 | 9.95% |
| Wage / Income Gap ($) | 1,147 | 90.05¢ per $1 |
| Gini / Inequality Index | 1,147 | 0.45 |
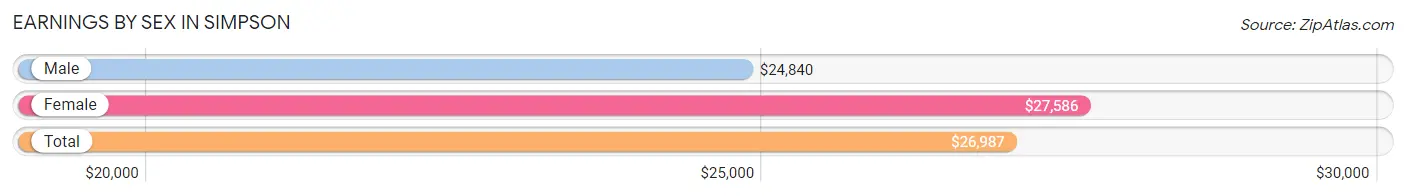
Earnings by Sex in Simpson
Average Earnings in Simpson are $26,987, $24,840 for men and $27,586 for women, a difference of 10.0%.
| Sex | Number | Average Earnings |
| Male | 328 (54.7%) | $24,840 |
| Female | 272 (45.3%) | $27,586 |
| Total | 600 (100.0%) | $26,987 |
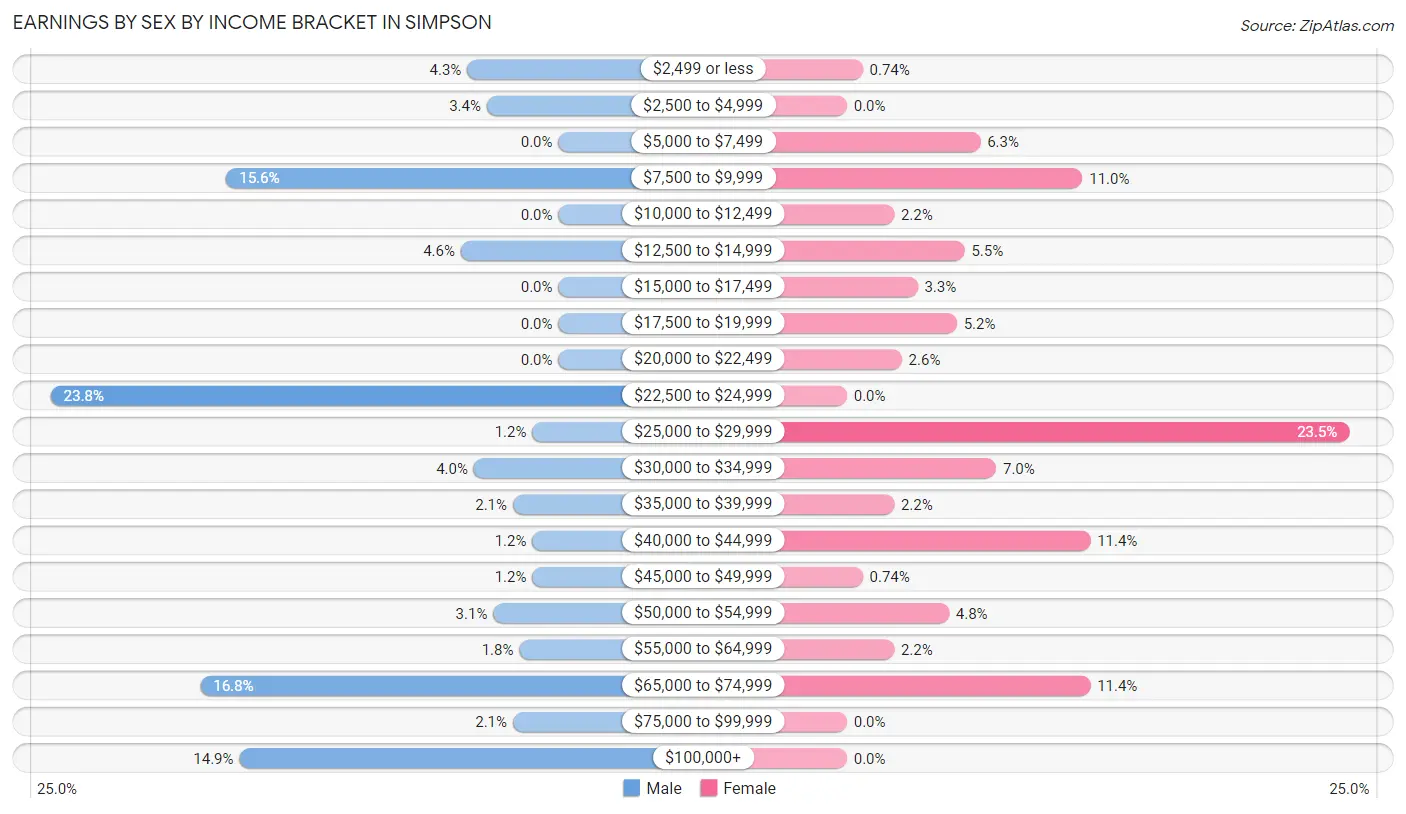
Earnings by Sex by Income Bracket in Simpson
The most common earnings brackets in Simpson are $22,500 to $24,999 for men (78 | 23.8%) and $25,000 to $29,999 for women (64 | 23.5%).
| Income | Male | Female |
| $2,499 or less | 14 (4.3%) | 2 (0.7%) |
| $2,500 to $4,999 | 11 (3.4%) | 0 (0.0%) |
| $5,000 to $7,499 | 0 (0.0%) | 17 (6.2%) |
| $7,500 to $9,999 | 51 (15.5%) | 30 (11.0%) |
| $10,000 to $12,499 | 0 (0.0%) | 6 (2.2%) |
| $12,500 to $14,999 | 15 (4.6%) | 15 (5.5%) |
| $15,000 to $17,499 | 0 (0.0%) | 9 (3.3%) |
| $17,500 to $19,999 | 0 (0.0%) | 14 (5.1%) |
| $20,000 to $22,499 | 0 (0.0%) | 7 (2.6%) |
| $22,500 to $24,999 | 78 (23.8%) | 0 (0.0%) |
| $25,000 to $29,999 | 4 (1.2%) | 64 (23.5%) |
| $30,000 to $34,999 | 13 (4.0%) | 19 (7.0%) |
| $35,000 to $39,999 | 7 (2.1%) | 6 (2.2%) |
| $40,000 to $44,999 | 4 (1.2%) | 31 (11.4%) |
| $45,000 to $49,999 | 4 (1.2%) | 2 (0.7%) |
| $50,000 to $54,999 | 10 (3.0%) | 13 (4.8%) |
| $55,000 to $64,999 | 6 (1.8%) | 6 (2.2%) |
| $65,000 to $74,999 | 55 (16.8%) | 31 (11.4%) |
| $75,000 to $99,999 | 7 (2.1%) | 0 (0.0%) |
| $100,000+ | 49 (14.9%) | 0 (0.0%) |
| Total | 328 (100.0%) | 272 (100.0%) |
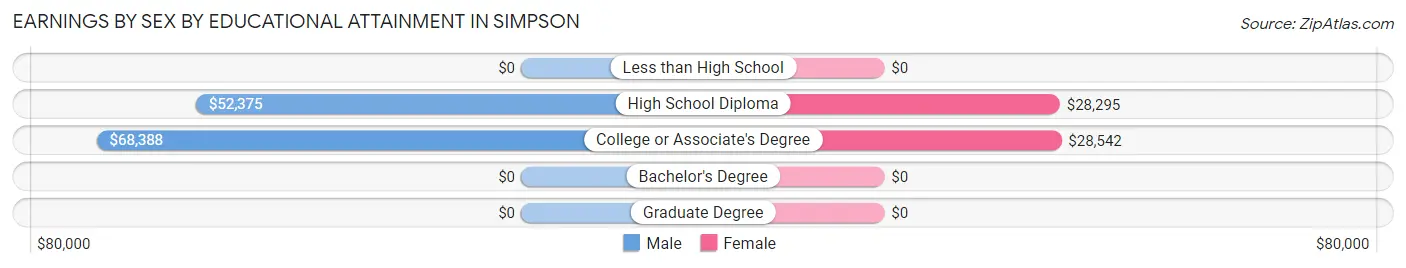
Earnings by Sex by Educational Attainment in Simpson
Average earnings in Simpson are $67,533 for men and $27,974 for women, a difference of 58.6%. Men with an educational attainment of college or associate's degree enjoy the highest average annual earnings of $68,388, while those with high school diploma education earn the least with $52,375. Women with an educational attainment of college or associate's degree earn the most with the average annual earnings of $28,542, while those with high school diploma education have the smallest earnings of $28,295.
| Educational Attainment | Male Income | Female Income |
| Less than High School | - | - |
| High School Diploma | $52,375 | $28,295 |
| College or Associate's Degree | $68,388 | $28,542 |
| Bachelor's Degree | - | - |
| Graduate Degree | - | - |
| Total | $67,533 | $27,974 |
Family Income in Simpson
Family Income Brackets in Simpson
According to the Simpson family income data, there are 78 families falling into the $100,000 to $149,999 income range, which is the most common income bracket and makes up 27.6% of all families.
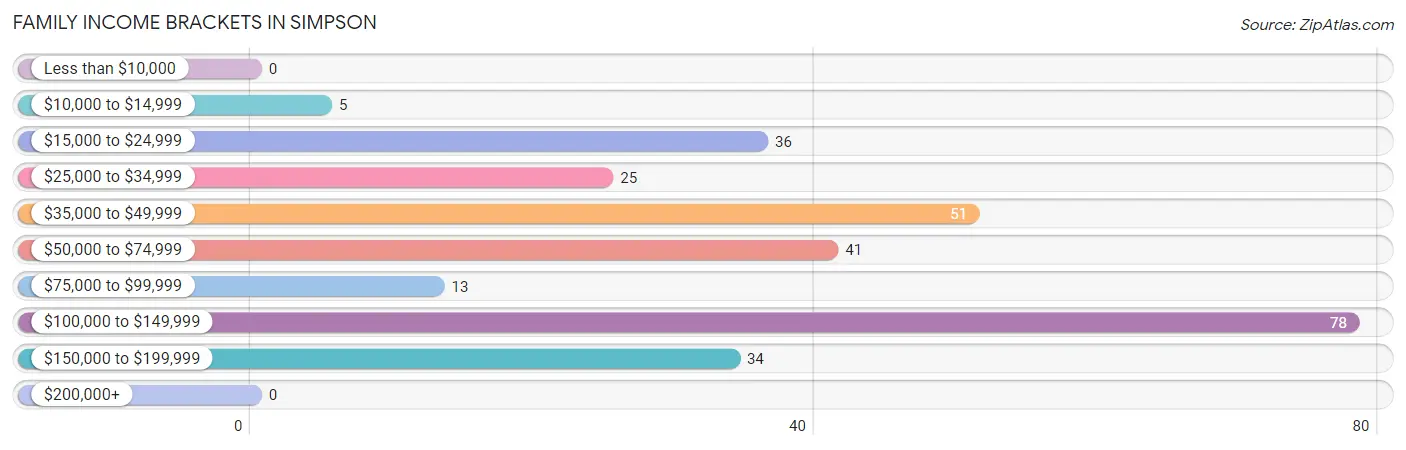
| Income Bracket | # Families | % Families |
| Less than $10,000 | 0 | 0.0% |
| $10,000 to $14,999 | 5 | 1.8% |
| $15,000 to $24,999 | 36 | 12.7% |
| $25,000 to $34,999 | 25 | 8.8% |
| $35,000 to $49,999 | 51 | 18.0% |
| $50,000 to $74,999 | 41 | 14.5% |
| $75,000 to $99,999 | 13 | 4.6% |
| $100,000 to $149,999 | 78 | 27.6% |
| $150,000 to $199,999 | 34 | 12.0% |
| $200,000+ | 0 | 0.0% |
Family Income by Famaliy Size in Simpson
4-person families (80 | 28.3%) account for the highest median family income in Simpson with $116,250 per family, while 3-person families (69 | 24.4%) have the highest median income of $33,713 per family member.
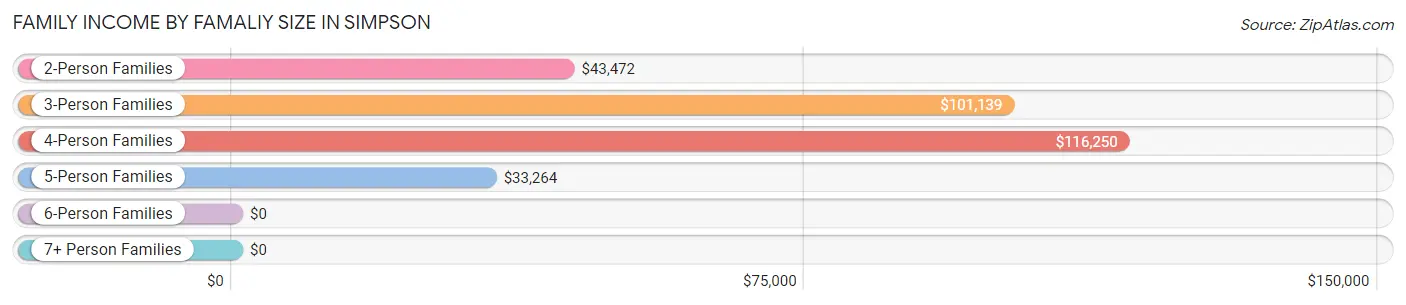
| Income Bracket | # Families | Median Income |
| 2-Person Families | 103 (36.4%) | $43,472 |
| 3-Person Families | 69 (24.4%) | $101,139 |
| 4-Person Families | 80 (28.3%) | $116,250 |
| 5-Person Families | 25 (8.8%) | $33,264 |
| 6-Person Families | 6 (2.1%) | $0 |
| 7+ Person Families | 0 (0.0%) | $0 |
| Total | 283 (100.0%) | $62,014 |
Family Income by Number of Earners in Simpson
The median family income in Simpson is $62,014, with families comprising 3+ earners (68) having the highest median family income of $101,889, while families with 2 earners (63) have the lowest median family income of $37,212, accounting for 24.0% and 22.3% of families, respectively.
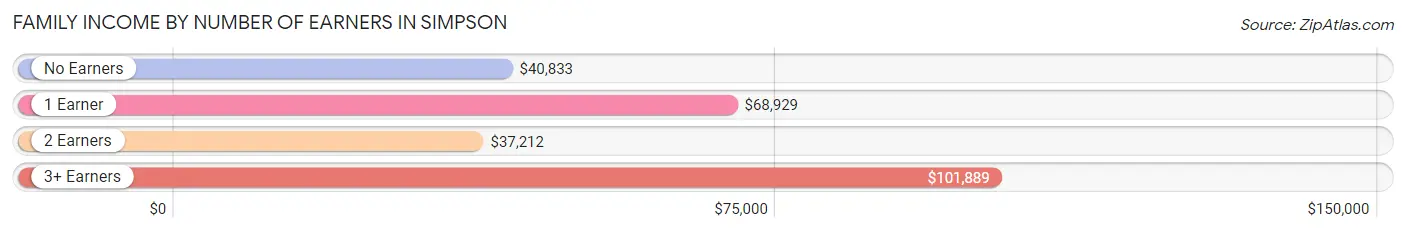
| Number of Earners | # Families | Median Income |
| No Earners | 66 (23.3%) | $40,833 |
| 1 Earner | 86 (30.4%) | $68,929 |
| 2 Earners | 63 (22.3%) | $37,212 |
| 3+ Earners | 68 (24.0%) | $101,889 |
| Total | 283 (100.0%) | $62,014 |
Household Income in Simpson
Household Income Brackets in Simpson
With 118 households falling in the category, the $35,000 to $49,999 income range is the most frequent in Simpson, accounting for 24.1% of all households. In contrast, only 7 households (1.4%) fall into the $200,000+ income bracket, making it the least populous group.
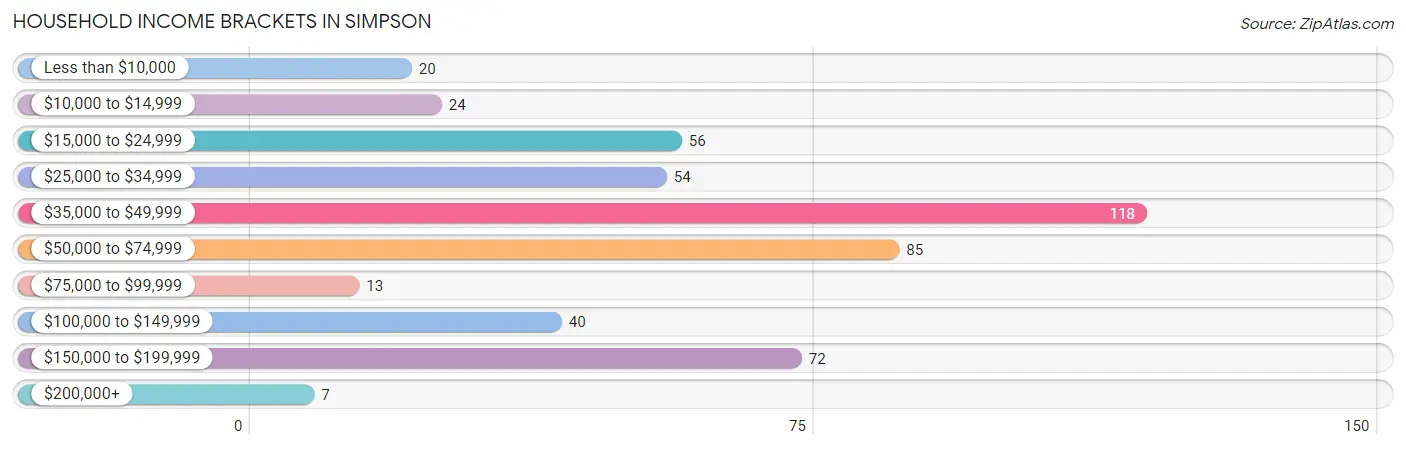
| Income Bracket | # Households | % Households |
| Less than $10,000 | 20 | 4.1% |
| $10,000 to $14,999 | 24 | 4.9% |
| $15,000 to $24,999 | 56 | 11.5% |
| $25,000 to $34,999 | 54 | 11.0% |
| $35,000 to $49,999 | 118 | 24.1% |
| $50,000 to $74,999 | 85 | 17.4% |
| $75,000 to $99,999 | 13 | 2.7% |
| $100,000 to $149,999 | 40 | 8.2% |
| $150,000 to $199,999 | 72 | 14.7% |
| $200,000+ | 7 | 1.4% |
Household Income by Householder Age in Simpson
The median household income in Simpson is $44,639, with the highest median household income of $41,103 found in the 65+ years age bracket for the primary householder. A total of 181 households (37.0%) fall into this category. Meanwhile, the 15 to 24 years age bracket for the primary householder has the lowest median household income of $0, with 15 households (3.1%) in this group.
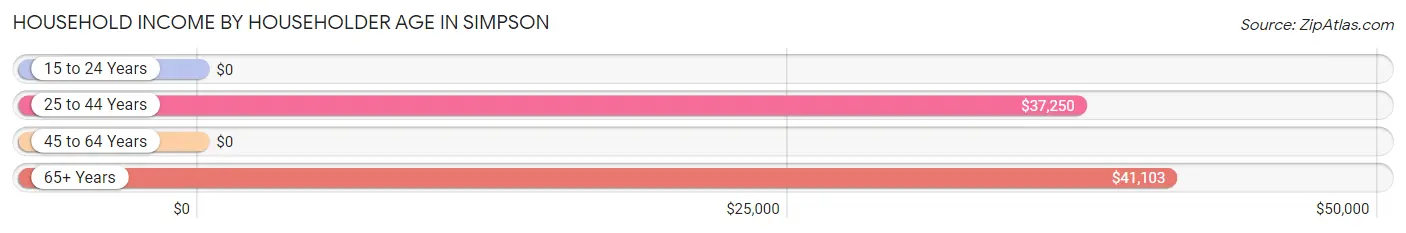
| Income Bracket | # Households | Median Income |
| 15 to 24 Years | 15 (3.1%) | $0 |
| 25 to 44 Years | 110 (22.5%) | $37,250 |
| 45 to 64 Years | 183 (37.4%) | $0 |
| 65+ Years | 181 (37.0%) | $41,103 |
| Total | 489 (100.0%) | $44,639 |
Poverty in Simpson
Income Below Poverty by Sex and Age in Simpson
With 15.1% poverty level for males and 21.7% for females among the residents of Simpson, 6 to 11 year old males and under 5 year old females are the most vulnerable to poverty, with 22 males (66.7%) and 19 females (76.0%) in their respective age groups living below the poverty level.
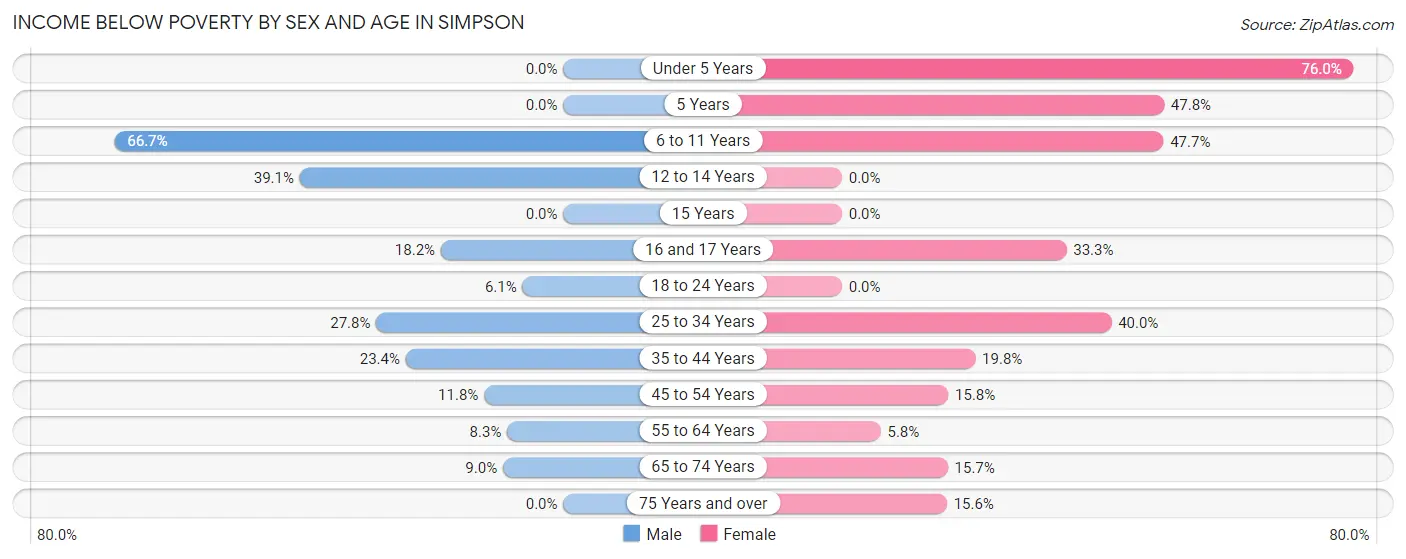
| Age Bracket | Male | Female |
| Under 5 Years | 0 (0.0%) | 19 (76.0%) |
| 5 Years | 0 (0.0%) | 11 (47.8%) |
| 6 to 11 Years | 22 (66.7%) | 21 (47.7%) |
| 12 to 14 Years | 9 (39.1%) | 0 (0.0%) |
| 15 Years | 0 (0.0%) | 0 (0.0%) |
| 16 and 17 Years | 2 (18.2%) | 3 (33.3%) |
| 18 to 24 Years | 8 (6.1%) | 0 (0.0%) |
| 25 to 34 Years | 10 (27.8%) | 16 (40.0%) |
| 35 to 44 Years | 11 (23.4%) | 20 (19.8%) |
| 45 to 54 Years | 10 (11.8%) | 9 (15.8%) |
| 55 to 64 Years | 6 (8.3%) | 5 (5.8%) |
| 65 to 74 Years | 6 (9.0%) | 11 (15.7%) |
| 75 Years and over | 0 (0.0%) | 12 (15.6%) |
| Total | 84 (15.1%) | 127 (21.7%) |
Income Above Poverty by Sex and Age in Simpson
According to the poverty statistics in Simpson, males aged under 5 years and females aged 12 to 14 years are the age groups that are most secure financially, with 100.0% of males and 100.0% of females in these age groups living above the poverty line.
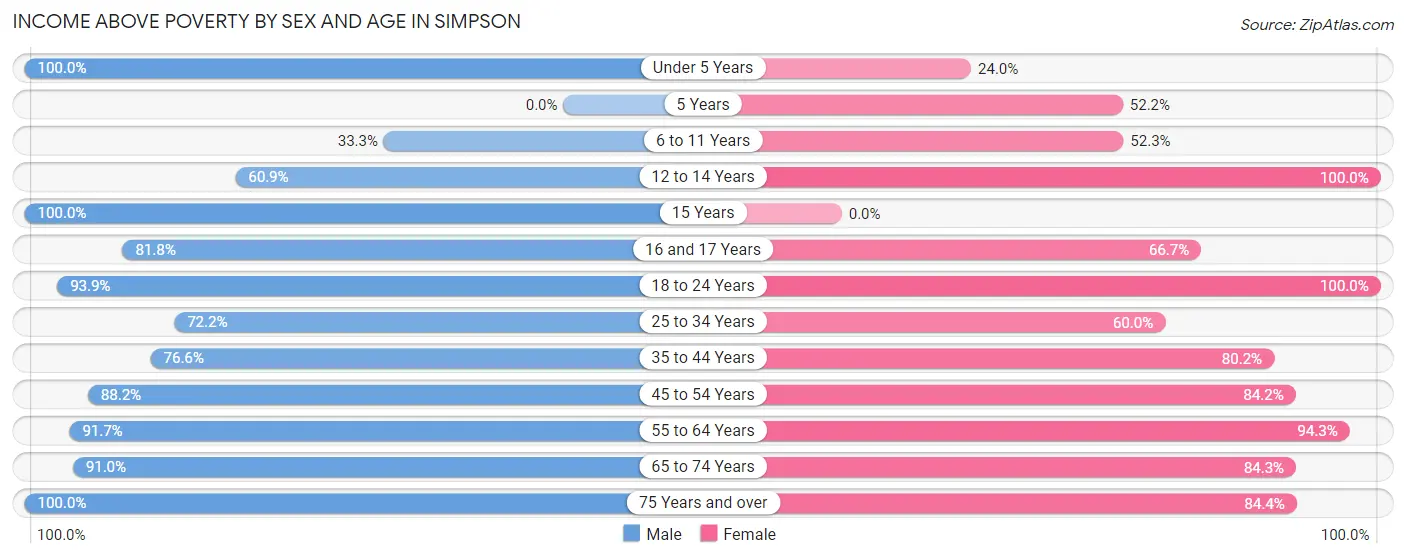
| Age Bracket | Male | Female |
| Under 5 Years | 7 (100.0%) | 6 (24.0%) |
| 5 Years | 0 (0.0%) | 12 (52.2%) |
| 6 to 11 Years | 11 (33.3%) | 23 (52.3%) |
| 12 to 14 Years | 14 (60.9%) | 21 (100.0%) |
| 15 Years | 19 (100.0%) | 0 (0.0%) |
| 16 and 17 Years | 9 (81.8%) | 6 (66.7%) |
| 18 to 24 Years | 124 (93.9%) | 32 (100.0%) |
| 25 to 34 Years | 26 (72.2%) | 24 (60.0%) |
| 35 to 44 Years | 36 (76.6%) | 81 (80.2%) |
| 45 to 54 Years | 75 (88.2%) | 48 (84.2%) |
| 55 to 64 Years | 66 (91.7%) | 82 (94.3%) |
| 65 to 74 Years | 61 (91.0%) | 59 (84.3%) |
| 75 Years and over | 24 (100.0%) | 65 (84.4%) |
| Total | 472 (84.9%) | 459 (78.3%) |
Income Below Poverty Among Married-Couple Families in Simpson
The poverty statistics for married-couple families in Simpson show that 12.1% or 24 of the total 198 families live below the poverty line. Families with 3 or 4 children have the highest poverty rate of 53.8%, comprising of 7 families. On the other hand, families with no children have the lowest poverty rate of 5.4%, which includes 6 families.
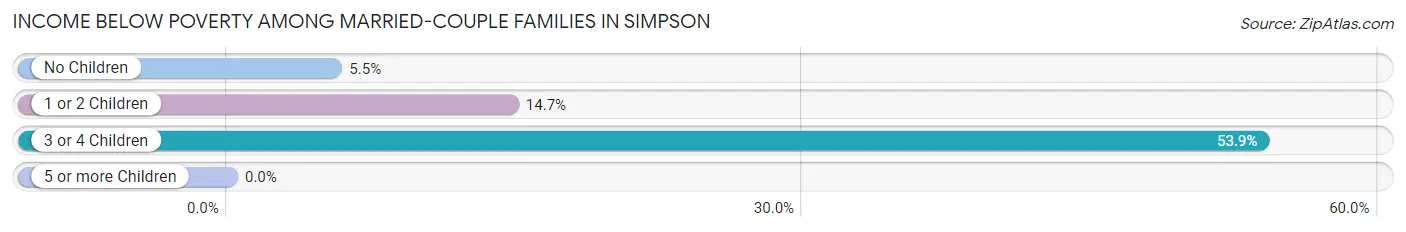
| Children | Above Poverty | Below Poverty |
| No Children | 104 (94.6%) | 6 (5.4%) |
| 1 or 2 Children | 64 (85.3%) | 11 (14.7%) |
| 3 or 4 Children | 6 (46.2%) | 7 (53.8%) |
| 5 or more Children | 0 (0.0%) | 0 (0.0%) |
| Total | 174 (87.9%) | 24 (12.1%) |
Income Below Poverty Among Single-Parent Households in Simpson
According to the poverty data in Simpson, 5.0% or 2 single-father households and 51.1% or 23 single-mother households are living below the poverty line. Among single-father households, those with no children have the highest poverty rate, with 2 households (5.0%) experiencing poverty. Likewise, among single-mother households, those with 3 or 4 children have the highest poverty rate, with 18 households (100.0%) falling below the poverty line.
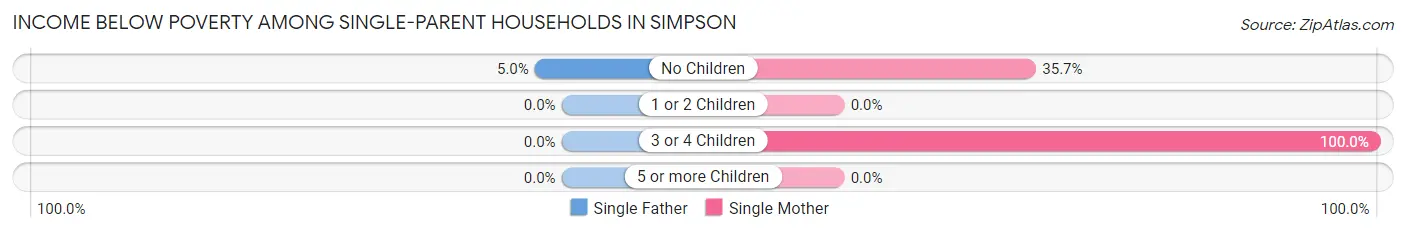
| Children | Single Father | Single Mother |
| No Children | 2 (5.0%) | 5 (35.7%) |
| 1 or 2 Children | 0 (0.0%) | 0 (0.0%) |
| 3 or 4 Children | 0 (0.0%) | 18 (100.0%) |
| 5 or more Children | 0 (0.0%) | 0 (0.0%) |
| Total | 2 (5.0%) | 23 (51.1%) |
Income Below Poverty Among Married-Couple vs Single-Parent Households in Simpson
The poverty data for Simpson shows that 24 of the married-couple family households (12.1%) and 25 of the single-parent households (29.4%) are living below the poverty level. Within the married-couple family households, those with 3 or 4 children have the highest poverty rate, with 7 households (53.8%) falling below the poverty line. Among the single-parent households, those with 3 or 4 children have the highest poverty rate, with 18 household (100.0%) living below poverty.
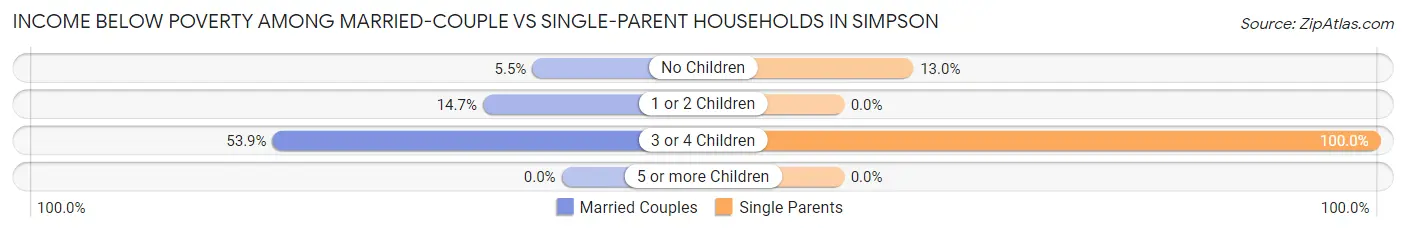
| Children | Married-Couple Families | Single-Parent Households |
| No Children | 6 (5.4%) | 7 (13.0%) |
| 1 or 2 Children | 11 (14.7%) | 0 (0.0%) |
| 3 or 4 Children | 7 (53.8%) | 18 (100.0%) |
| 5 or more Children | 0 (0.0%) | 0 (0.0%) |
| Total | 24 (12.1%) | 25 (29.4%) |
Race in Simpson
The most populous races in Simpson are White / Caucasian (1,115 | 97.2%), Two or more Races (21 | 1.8%), and Hispanic or Latino (16 | 1.4%).
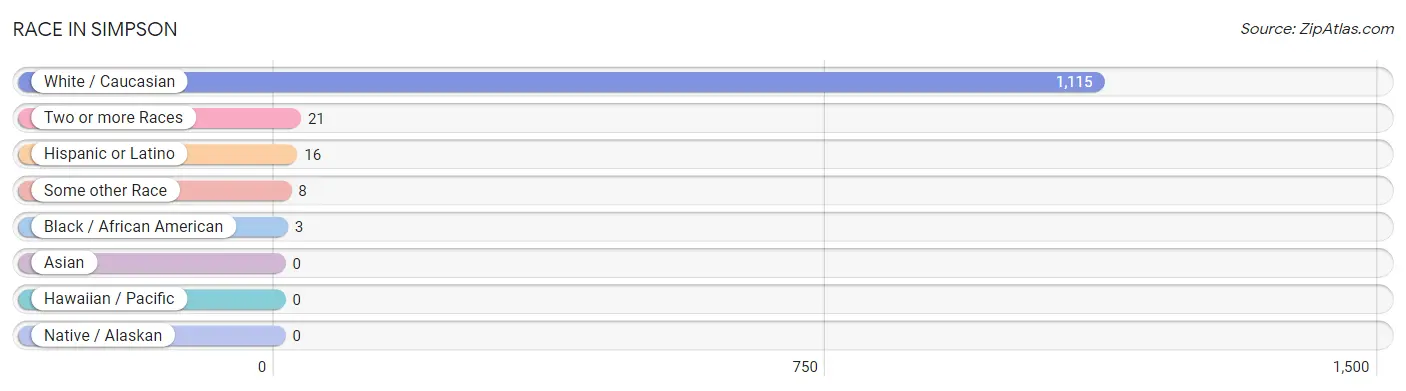
| Race | # Population | % Population |
| Asian | 0 | 0.0% |
| Black / African American | 3 | 0.3% |
| Hawaiian / Pacific | 0 | 0.0% |
| Hispanic or Latino | 16 | 1.4% |
| Native / Alaskan | 0 | 0.0% |
| White / Caucasian | 1,115 | 97.2% |
| Two or more Races | 21 | 1.8% |
| Some other Race | 8 | 0.7% |
| Total | 1,147 | 100.0% |
Ancestry in Simpson
The most populous ancestries reported in Simpson are American (223 | 19.4%), Polish (214 | 18.7%), German (211 | 18.4%), Irish (186 | 16.2%), and Italian (156 | 13.6%), together accounting for 86.3% of all Simpson residents.
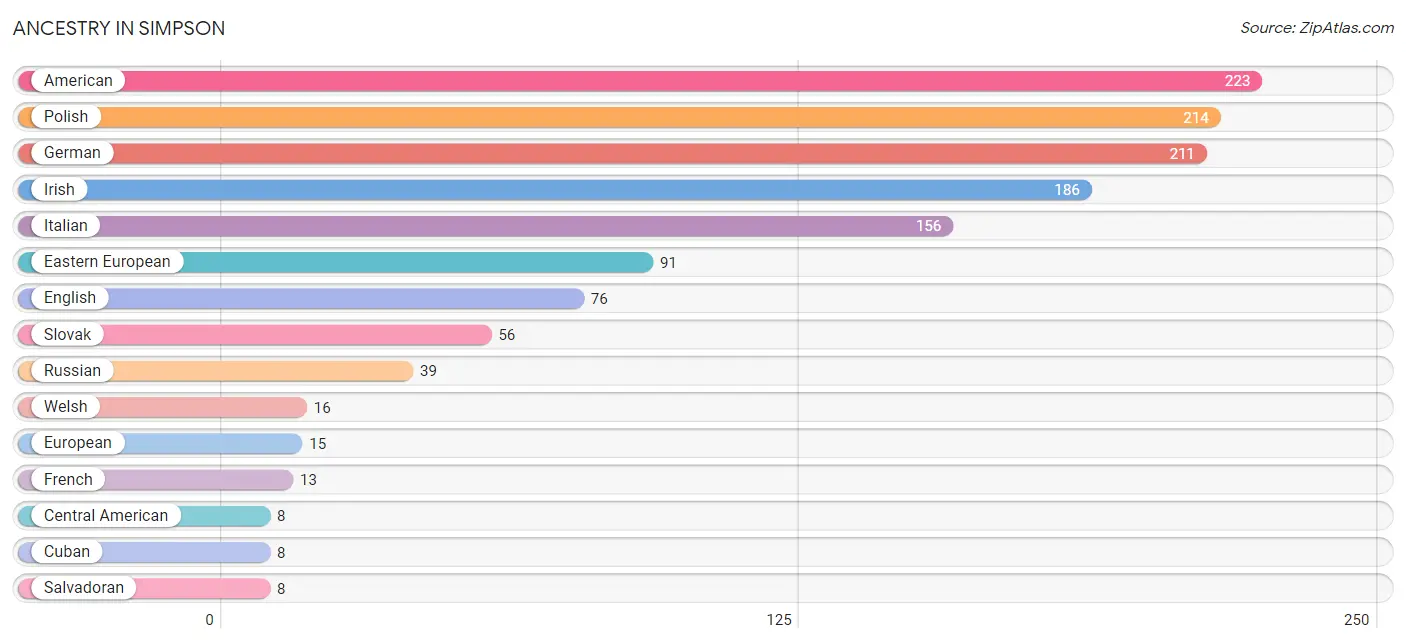
| Ancestry | # Population | % Population |
| African | 3 | 0.3% |
| American | 223 | 19.4% |
| Central American | 8 | 0.7% |
| Cherokee | 7 | 0.6% |
| Cuban | 8 | 0.7% |
| Eastern European | 91 | 7.9% |
| English | 76 | 6.6% |
| European | 15 | 1.3% |
| French | 13 | 1.1% |
| German | 211 | 18.4% |
| Irish | 186 | 16.2% |
| Italian | 156 | 13.6% |
| Polish | 214 | 18.7% |
| Russian | 39 | 3.4% |
| Salvadoran | 8 | 0.7% |
| Slovak | 56 | 4.9% |
| Slovene | 5 | 0.4% |
| Subsaharan African | 3 | 0.3% |
| Ukrainian | 5 | 0.4% |
| Welsh | 16 | 1.4% | View All 20 Rows |
Immigrants in Simpson
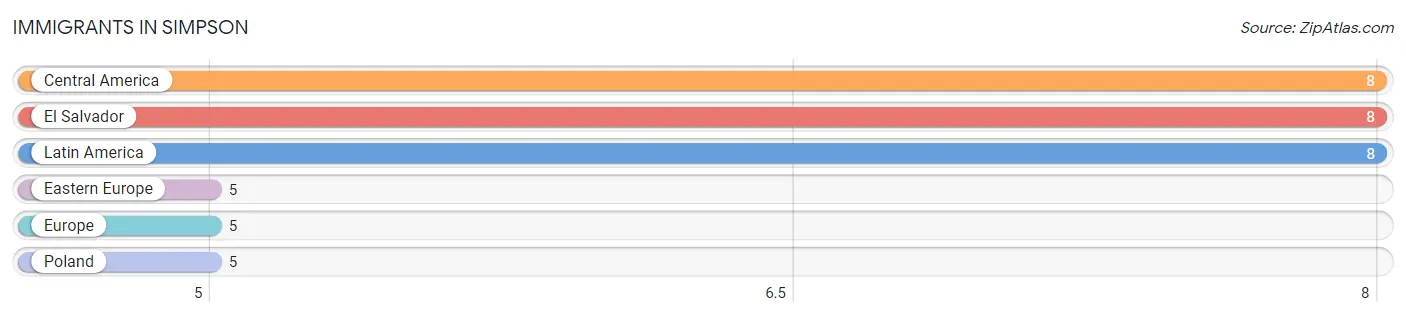
The most numerous immigrant groups reported in Simpson came from Central America (8 | 0.7%), El Salvador (8 | 0.7%), Latin America (8 | 0.7%), Eastern Europe (5 | 0.4%), and Europe (5 | 0.4%), together accounting for 3.0% of all Simpson residents.
| Immigration Origin | # Population | % Population |
| Central America | 8 | 0.7% |
| Eastern Europe | 5 | 0.4% |
| El Salvador | 8 | 0.7% |
| Europe | 5 | 0.4% |
| Latin America | 8 | 0.7% |
| Poland | 5 | 0.4% | View All 6 Rows |
Sex and Age in Simpson
Sex and Age in Simpson
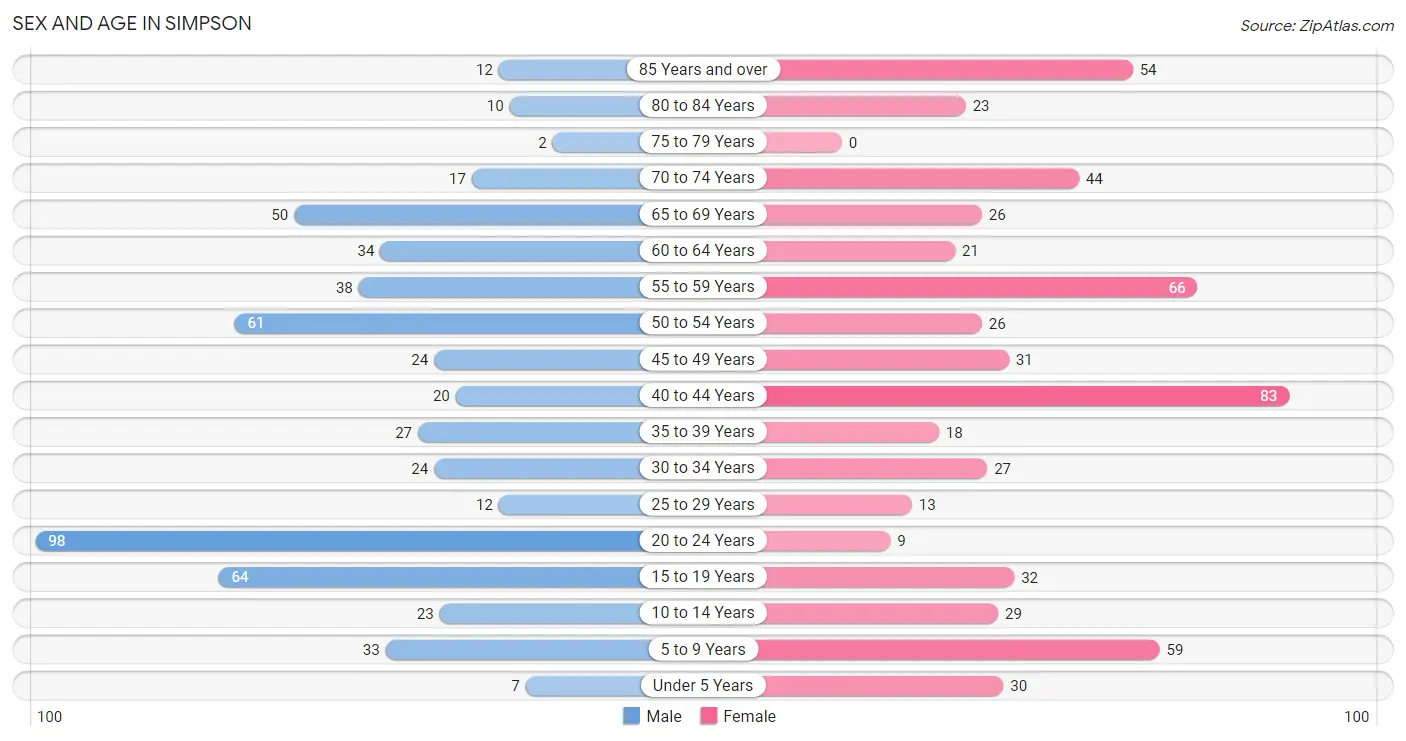
The most populous age groups in Simpson are 20 to 24 Years (98 | 17.6%) for men and 40 to 44 Years (83 | 14.0%) for women.
| Age Bracket | Male | Female |
| Under 5 Years | 7 (1.3%) | 30 (5.1%) |
| 5 to 9 Years | 33 (5.9%) | 59 (10.0%) |
| 10 to 14 Years | 23 (4.1%) | 29 (4.9%) |
| 15 to 19 Years | 64 (11.5%) | 32 (5.4%) |
| 20 to 24 Years | 98 (17.6%) | 9 (1.5%) |
| 25 to 29 Years | 12 (2.2%) | 13 (2.2%) |
| 30 to 34 Years | 24 (4.3%) | 27 (4.6%) |
| 35 to 39 Years | 27 (4.9%) | 18 (3.0%) |
| 40 to 44 Years | 20 (3.6%) | 83 (14.0%) |
| 45 to 49 Years | 24 (4.3%) | 31 (5.2%) |
| 50 to 54 Years | 61 (11.0%) | 26 (4.4%) |
| 55 to 59 Years | 38 (6.8%) | 66 (11.2%) |
| 60 to 64 Years | 34 (6.1%) | 21 (3.5%) |
| 65 to 69 Years | 50 (9.0%) | 26 (4.4%) |
| 70 to 74 Years | 17 (3.1%) | 44 (7.4%) |
| 75 to 79 Years | 2 (0.4%) | 0 (0.0%) |
| 80 to 84 Years | 10 (1.8%) | 23 (3.9%) |
| 85 Years and over | 12 (2.2%) | 54 (9.1%) |
| Total | 556 (100.0%) | 591 (100.0%) |
Families and Households in Simpson
Median Family Size in Simpson
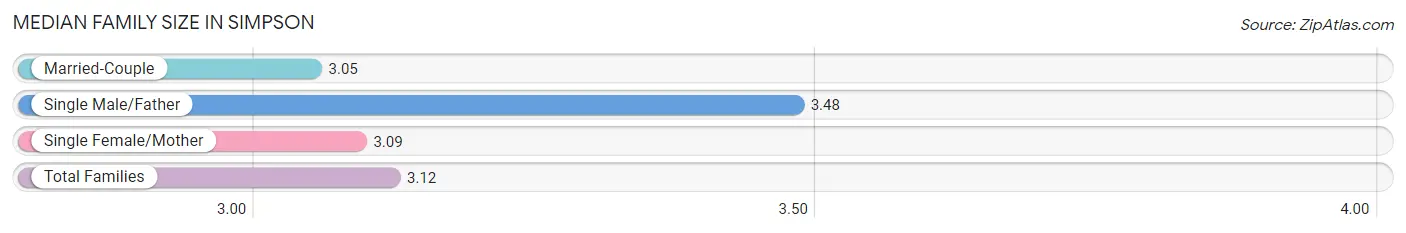
The median family size in Simpson is 3.12 persons per family, with single male/father families (40 | 14.1%) accounting for the largest median family size of 3.48 persons per family. On the other hand, married-couple families (198 | 70.0%) represent the smallest median family size with 3.05 persons per family.
| Family Type | # Families | Family Size |
| Married-Couple | 198 (70.0%) | 3.05 |
| Single Male/Father | 40 (14.1%) | 3.48 |
| Single Female/Mother | 45 (15.9%) | 3.09 |
| Total Families | 283 (100.0%) | 3.12 |
Median Household Size in Simpson
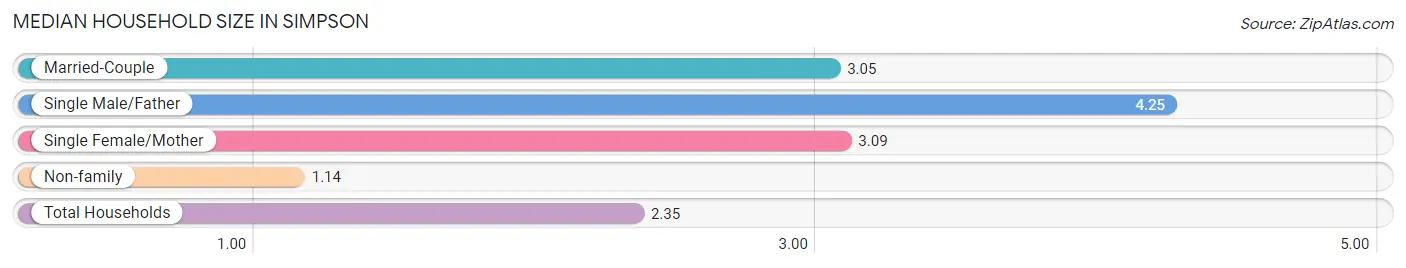
The median household size in Simpson is 2.35 persons per household, with single male/father households (40 | 8.2%) accounting for the largest median household size of 4.25 persons per household. non-family households (206 | 42.1%) represent the smallest median household size with 1.14 persons per household.
| Household Type | # Households | Household Size |
| Married-Couple | 198 (40.5%) | 3.05 |
| Single Male/Father | 40 (8.2%) | 4.25 |
| Single Female/Mother | 45 (9.2%) | 3.09 |
| Non-family | 206 (42.1%) | 1.14 |
| Total Households | 489 (100.0%) | 2.35 |
Household Size by Marriage Status in Simpson
Out of a total of 489 households in Simpson, 283 (57.9%) are family households, while 206 (42.1%) are nonfamily households. The most numerous type of family households are 4-person households, comprising 118, and the most common type of nonfamily households are 1-person households, comprising 180.
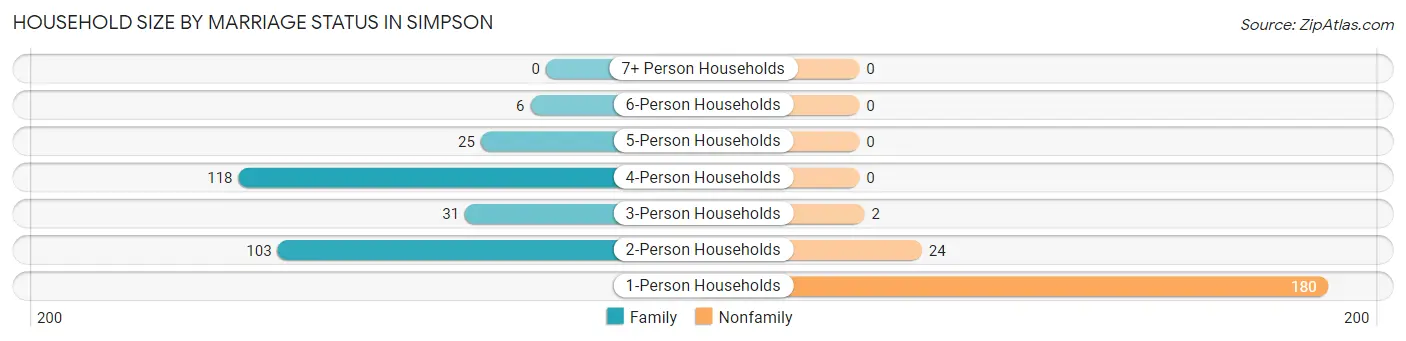
| Household Size | Family Households | Nonfamily Households |
| 1-Person Households | - | 180 (36.8%) |
| 2-Person Households | 103 (21.1%) | 24 (4.9%) |
| 3-Person Households | 31 (6.3%) | 2 (0.4%) |
| 4-Person Households | 118 (24.1%) | 0 (0.0%) |
| 5-Person Households | 25 (5.1%) | 0 (0.0%) |
| 6-Person Households | 6 (1.2%) | 0 (0.0%) |
| 7+ Person Households | 0 (0.0%) | 0 (0.0%) |
| Total | 283 (57.9%) | 206 (42.1%) |
Female Fertility in Simpson
Fertility by Age in Simpson
| Age Bracket | Women with Births | Births / 1,000 Women |
| 15 to 19 years | 0 (0.0%) | 0.0 |
| 20 to 34 years | 0 (0.0%) | 0.0 |
| 35 to 50 years | 0 (0.0%) | 0.0 |
| Total | 0 (0.0%) | 0.0 |
Fertility by Age by Marriage Status in Simpson
| Age Bracket | Married | Unmarried |
| 15 to 19 years | 0 (0.0%) | 0 (0.0%) |
| 20 to 34 years | 0 (0.0%) | 0 (0.0%) |
| 35 to 50 years | 0 (0.0%) | 0 (0.0%) |
| Total | 0 (0.0%) | 0 (0.0%) |
Fertility by Education in Simpson
| Educational Attainment | Women with Births | Births / 1,000 Women |
| Less than High School | 0 (0.0%) | 0.0 |
| High School Diploma | 0 (0.0%) | 0.0 |
| College or Associate's Degree | 0 (0.0%) | 0.0 |
| Bachelor's Degree | 0 (0.0%) | 0.0 |
| Graduate Degree | 0 (0.0%) | 0.0 |
| Total | 0 (0.0%) | 0.0 |
Fertility by Education by Marriage Status in Simpson
| Educational Attainment | Married | Unmarried |
| Less than High School | 0 (0.0%) | 0 (0.0%) |
| High School Diploma | 0 (0.0%) | 0 (0.0%) |
| College or Associate's Degree | 0 (0.0%) | 0 (0.0%) |
| Bachelor's Degree | 0 (0.0%) | 0 (0.0%) |
| Graduate Degree | 0 (0.0%) | 0 (0.0%) |
| Total | 0 (0.0%) | 0 (0.0%) |
Employment Characteristics in Simpson
Employment by Class of Employer in Simpson
Among the 566 employed individuals in Simpson, private company employees (427 | 75.4%), not-for-profit organizations (90 | 15.9%), and self-employed (not incorporated) (17 | 3.0%) make up the most common classes of employment.
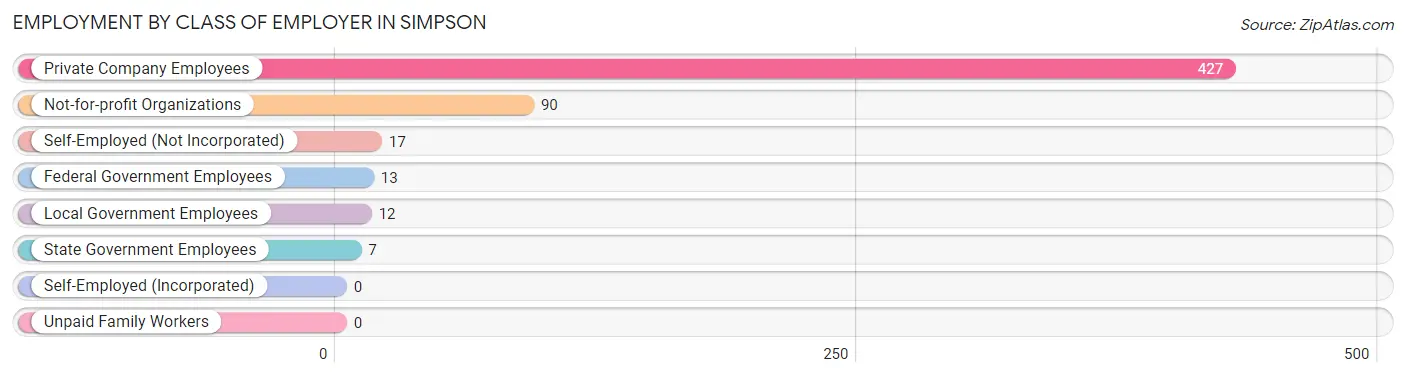
| Employer Class | # Employees | % Employees |
| Private Company Employees | 427 | 75.4% |
| Self-Employed (Incorporated) | 0 | 0.0% |
| Self-Employed (Not Incorporated) | 17 | 3.0% |
| Not-for-profit Organizations | 90 | 15.9% |
| Local Government Employees | 12 | 2.1% |
| State Government Employees | 7 | 1.2% |
| Federal Government Employees | 13 | 2.3% |
| Unpaid Family Workers | 0 | 0.0% |
| Total | 566 | 100.0% |
Employment Status by Age in Simpson
According to the labor force statistics for Simpson, out of the total population over 16 years of age (947), 61.5% or 582 individuals are in the labor force, with 1.9% or 11 of them unemployed. The age group with the highest labor force participation rate is 35 to 44 years, with 95.3% or 141 individuals in the labor force. Within the labor force, the 45 to 54 years age range has the highest percentage of unemployed individuals, with 8.1% or 9 of them being unemployed.
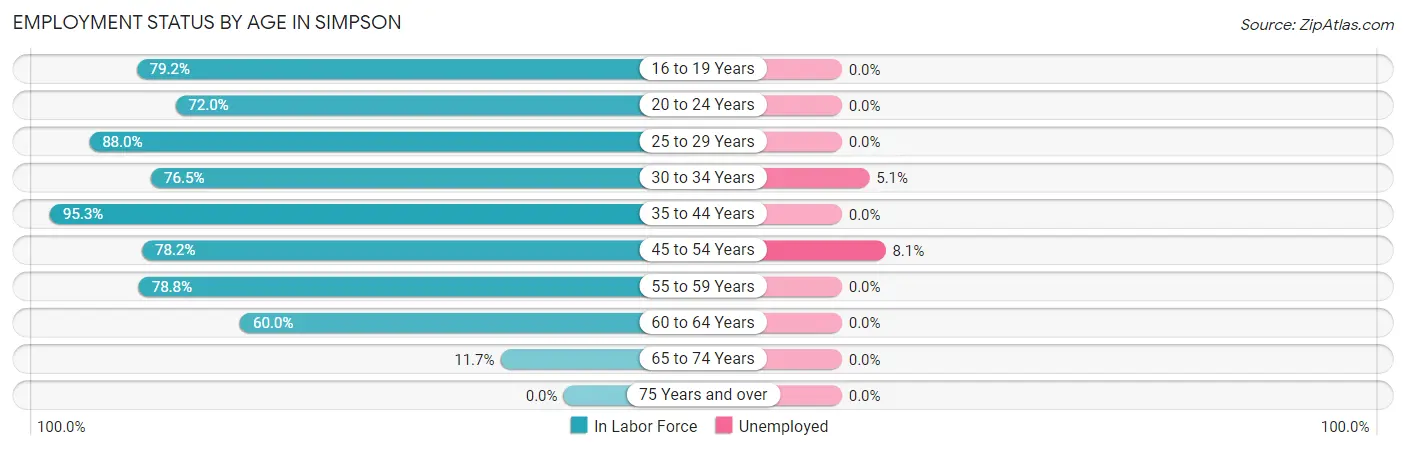
| Age Bracket | In Labor Force | Unemployed |
| 16 to 19 Years | 61 (79.2%) | 0 (0.0%) |
| 20 to 24 Years | 77 (72.0%) | 0 (0.0%) |
| 25 to 29 Years | 22 (88.0%) | 0 (0.0%) |
| 30 to 34 Years | 39 (76.5%) | 2 (5.1%) |
| 35 to 44 Years | 141 (95.3%) | 0 (0.0%) |
| 45 to 54 Years | 111 (78.2%) | 9 (8.1%) |
| 55 to 59 Years | 82 (78.8%) | 0 (0.0%) |
| 60 to 64 Years | 33 (60.0%) | 0 (0.0%) |
| 65 to 74 Years | 16 (11.7%) | 0 (0.0%) |
| 75 Years and over | 0 (0.0%) | 0 (0.0%) |
| Total | 582 (61.5%) | 11 (1.9%) |
Employment Status by Educational Attainment in Simpson
According to labor force statistics for Simpson, 81.5% of individuals (428) out of the total population between 25 and 64 years of age (525) are in the labor force, with 2.6% or 11 of them being unemployed. The group with the highest labor force participation rate are those with the educational attainment of college / associate degree, with 90.0% or 188 individuals in the labor force. Within the labor force, individuals with high school diploma education have the highest percentage of unemployment, with 7.2% or 11 of them being unemployed.
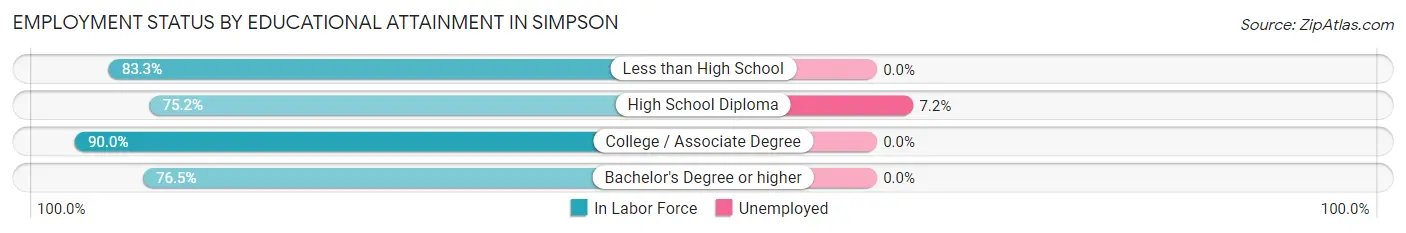
| Educational Attainment | In Labor Force | Unemployed |
| Less than High School | 10 (83.3%) | 0 (0.0%) |
| High School Diploma | 152 (75.2%) | 15 (7.2%) |
| College / Associate Degree | 188 (90.0%) | 0 (0.0%) |
| Bachelor's Degree or higher | 78 (76.5%) | 0 (0.0%) |
| Total | 428 (81.5%) | 14 (2.6%) |
Employment Occupations by Sex in Simpson
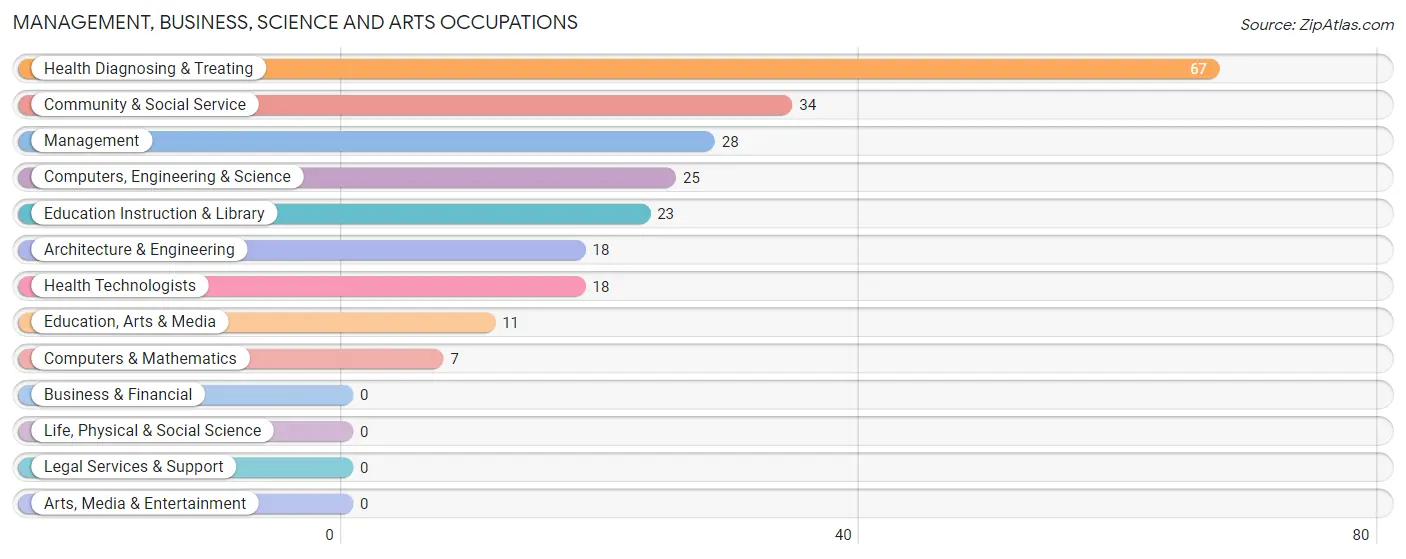
Management, Business, Science and Arts Occupations
The most common Management, Business, Science and Arts occupations in Simpson are Health Diagnosing & Treating (67 | 11.7%), Community & Social Service (34 | 5.9%), Management (28 | 4.9%), Computers, Engineering & Science (25 | 4.4%), and Education Instruction & Library (23 | 4.0%).
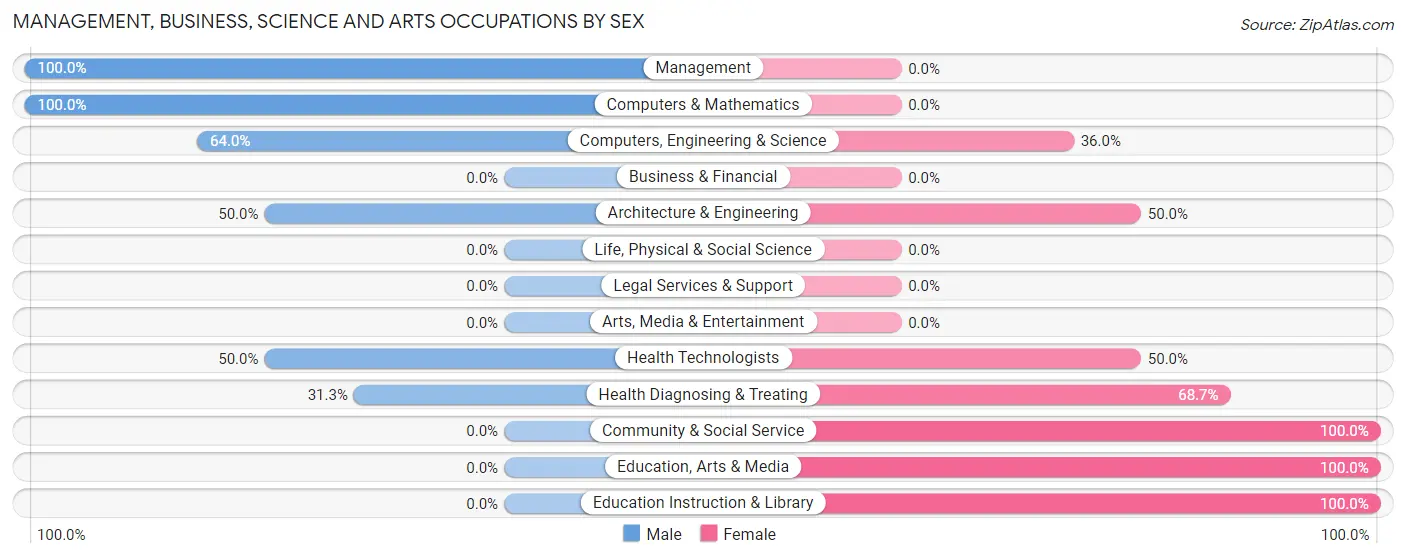
Management, Business, Science and Arts Occupations by Sex
Within the Management, Business, Science and Arts occupations in Simpson, the most male-oriented occupations are Management (100.0%), Computers & Mathematics (100.0%), and Computers, Engineering & Science (64.0%), while the most female-oriented occupations are Community & Social Service (100.0%), Education, Arts & Media (100.0%), and Education Instruction & Library (100.0%).
| Occupation | Male | Female |
| Management | 28 (100.0%) | 0 (0.0%) |
| Business & Financial | 0 (0.0%) | 0 (0.0%) |
| Computers, Engineering & Science | 16 (64.0%) | 9 (36.0%) |
| Computers & Mathematics | 7 (100.0%) | 0 (0.0%) |
| Architecture & Engineering | 9 (50.0%) | 9 (50.0%) |
| Life, Physical & Social Science | 0 (0.0%) | 0 (0.0%) |
| Community & Social Service | 0 (0.0%) | 34 (100.0%) |
| Education, Arts & Media | 0 (0.0%) | 11 (100.0%) |
| Legal Services & Support | 0 (0.0%) | 0 (0.0%) |
| Education Instruction & Library | 0 (0.0%) | 23 (100.0%) |
| Arts, Media & Entertainment | 0 (0.0%) | 0 (0.0%) |
| Health Diagnosing & Treating | 21 (31.3%) | 46 (68.7%) |
| Health Technologists | 9 (50.0%) | 9 (50.0%) |
| Total (Category) | 65 (42.2%) | 89 (57.8%) |
| Total (Overall) | 313 (54.8%) | 258 (45.2%) |
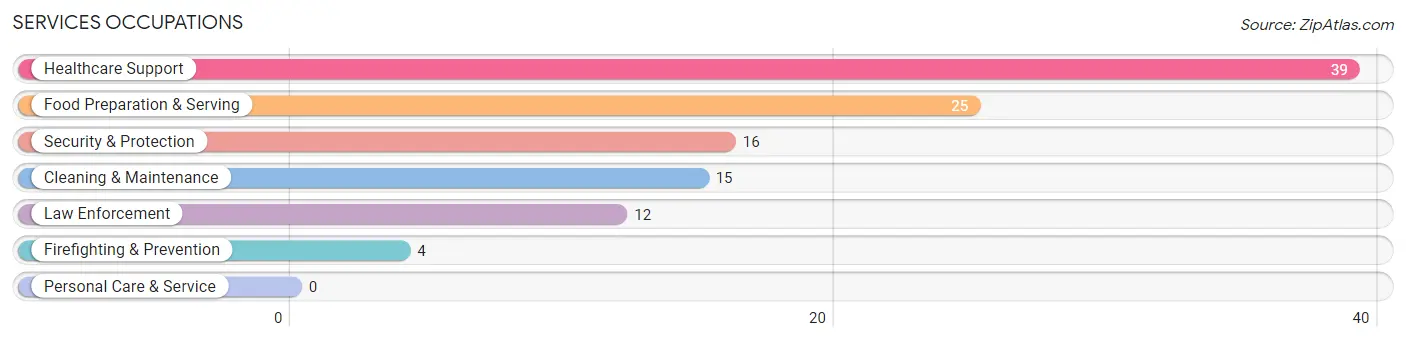
Services Occupations
The most common Services occupations in Simpson are Healthcare Support (39 | 6.8%), Food Preparation & Serving (25 | 4.4%), Security & Protection (16 | 2.8%), Cleaning & Maintenance (15 | 2.6%), and Law Enforcement (12 | 2.1%).
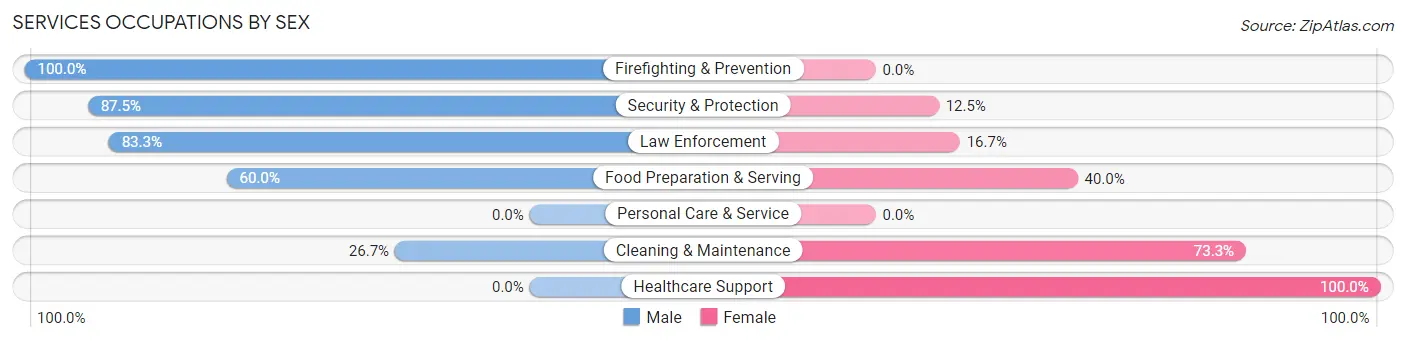
Services Occupations by Sex
Within the Services occupations in Simpson, the most male-oriented occupations are Firefighting & Prevention (100.0%), Security & Protection (87.5%), and Law Enforcement (83.3%), while the most female-oriented occupations are Healthcare Support (100.0%), Cleaning & Maintenance (73.3%), and Food Preparation & Serving (40.0%).
| Occupation | Male | Female |
| Healthcare Support | 0 (0.0%) | 39 (100.0%) |
| Security & Protection | 14 (87.5%) | 2 (12.5%) |
| Firefighting & Prevention | 4 (100.0%) | 0 (0.0%) |
| Law Enforcement | 10 (83.3%) | 2 (16.7%) |
| Food Preparation & Serving | 15 (60.0%) | 10 (40.0%) |
| Cleaning & Maintenance | 4 (26.7%) | 11 (73.3%) |
| Personal Care & Service | 0 (0.0%) | 0 (0.0%) |
| Total (Category) | 33 (34.7%) | 62 (65.3%) |
| Total (Overall) | 313 (54.8%) | 258 (45.2%) |
Sales and Office Occupations
The most common Sales and Office occupations in Simpson are Sales & Related (45 | 7.9%), and Office & Administration (43 | 7.5%).
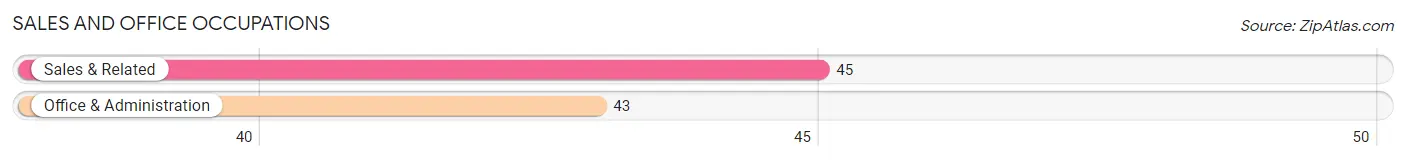
Sales and Office Occupations by Sex
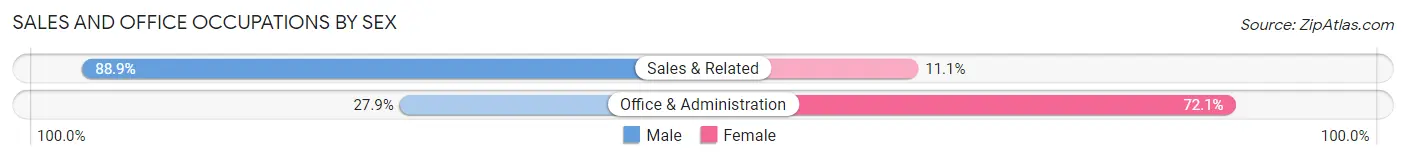
| Occupation | Male | Female |
| Sales & Related | 40 (88.9%) | 5 (11.1%) |
| Office & Administration | 12 (27.9%) | 31 (72.1%) |
| Total (Category) | 52 (59.1%) | 36 (40.9%) |
| Total (Overall) | 313 (54.8%) | 258 (45.2%) |
Natural Resources, Construction and Maintenance Occupations
The most common Natural Resources, Construction and Maintenance occupations in Simpson are Construction & Extraction (76 | 13.3%), and Installation, Maintenance & Repair (21 | 3.7%).
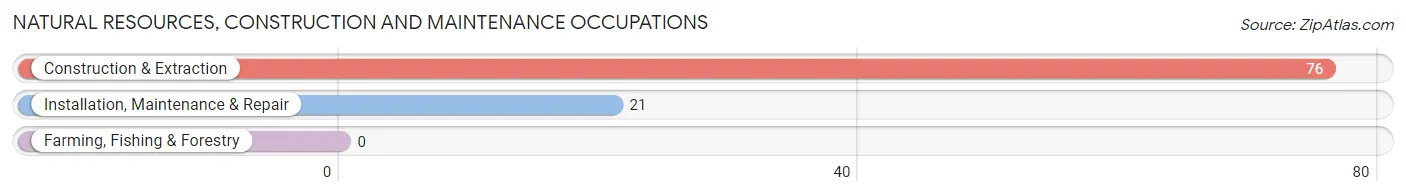
Natural Resources, Construction and Maintenance Occupations by Sex
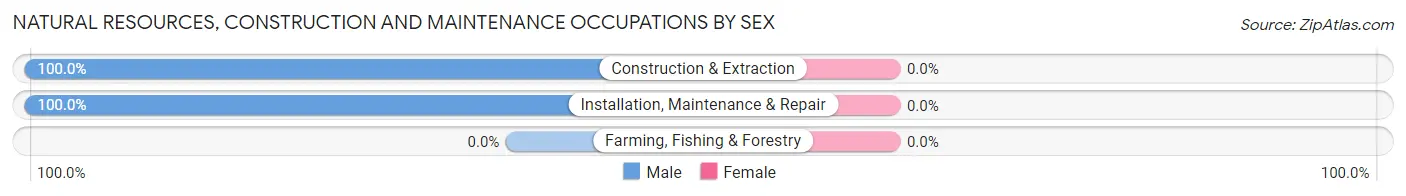
| Occupation | Male | Female |
| Farming, Fishing & Forestry | 0 (0.0%) | 0 (0.0%) |
| Construction & Extraction | 76 (100.0%) | 0 (0.0%) |
| Installation, Maintenance & Repair | 21 (100.0%) | 0 (0.0%) |
| Total (Category) | 97 (100.0%) | 0 (0.0%) |
| Total (Overall) | 313 (54.8%) | 258 (45.2%) |
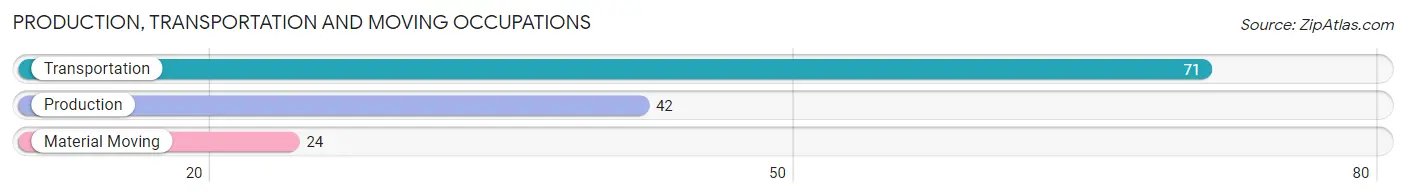
Production, Transportation and Moving Occupations
The most common Production, Transportation and Moving occupations in Simpson are Transportation (71 | 12.4%), Production (42 | 7.4%), and Material Moving (24 | 4.2%).
Production, Transportation and Moving Occupations by Sex
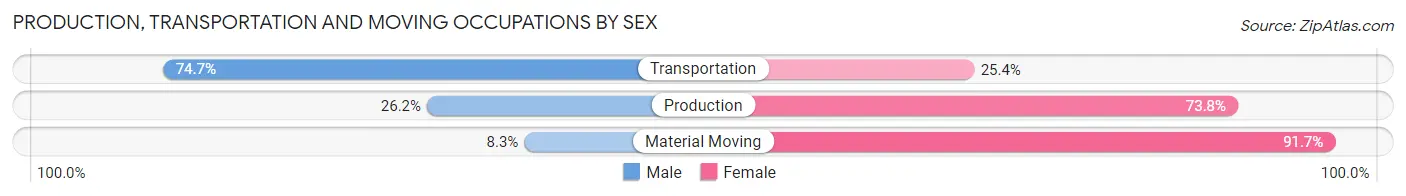
| Occupation | Male | Female |
| Production | 11 (26.2%) | 31 (73.8%) |
| Transportation | 53 (74.7%) | 18 (25.4%) |
| Material Moving | 2 (8.3%) | 22 (91.7%) |
| Total (Category) | 66 (48.2%) | 71 (51.8%) |
| Total (Overall) | 313 (54.8%) | 258 (45.2%) |
Employment Industries by Sex in Simpson
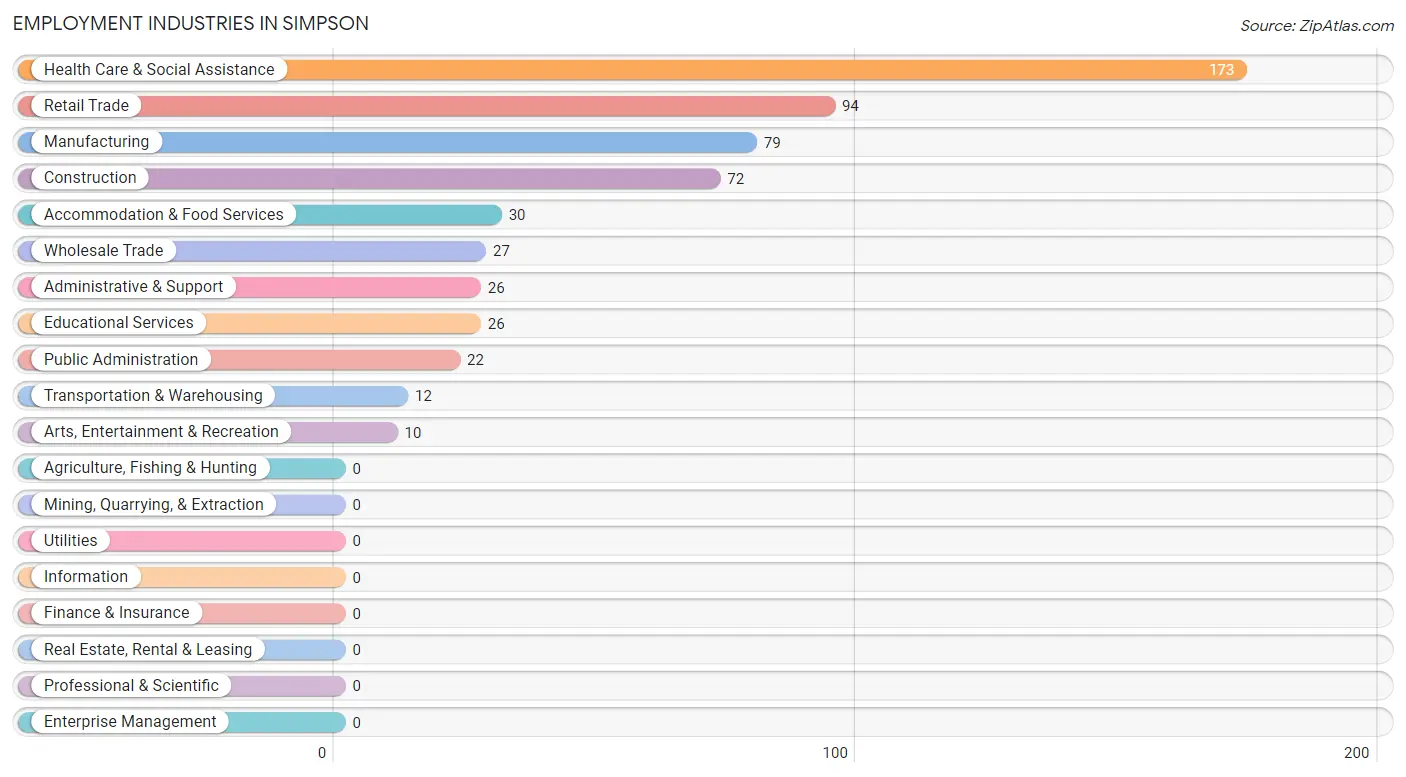
Employment Industries in Simpson
The major employment industries in Simpson include Health Care & Social Assistance (173 | 30.3%), Retail Trade (94 | 16.5%), Manufacturing (79 | 13.8%), Construction (72 | 12.6%), and Accommodation & Food Services (30 | 5.2%).
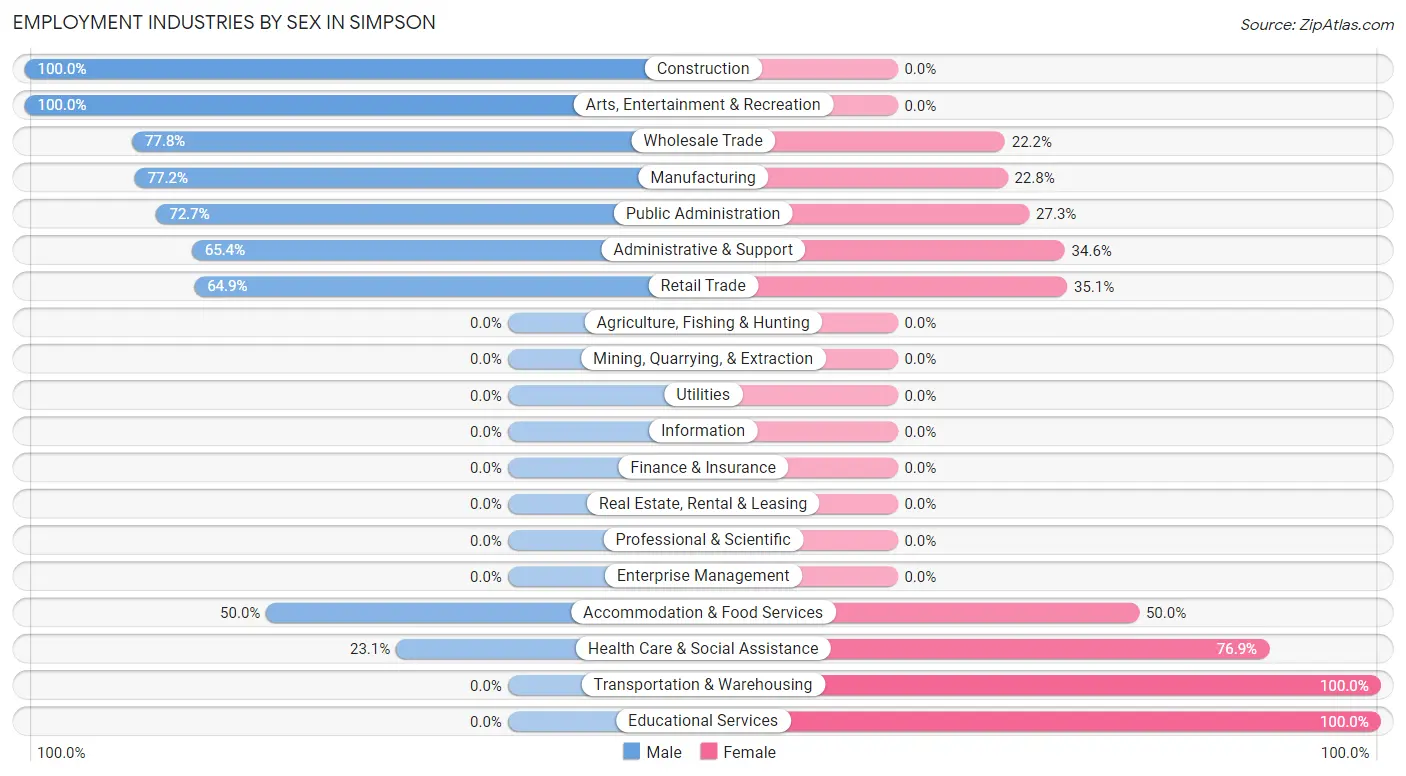
Employment Industries by Sex in Simpson
The Simpson industries that see more men than women are Construction (100.0%), Arts, Entertainment & Recreation (100.0%), and Wholesale Trade (77.8%), whereas the industries that tend to have a higher number of women are Transportation & Warehousing (100.0%), Educational Services (100.0%), and Health Care & Social Assistance (76.9%).
| Industry | Male | Female |
| Agriculture, Fishing & Hunting | 0 (0.0%) | 0 (0.0%) |
| Mining, Quarrying, & Extraction | 0 (0.0%) | 0 (0.0%) |
| Construction | 72 (100.0%) | 0 (0.0%) |
| Manufacturing | 61 (77.2%) | 18 (22.8%) |
| Wholesale Trade | 21 (77.8%) | 6 (22.2%) |
| Retail Trade | 61 (64.9%) | 33 (35.1%) |
| Transportation & Warehousing | 0 (0.0%) | 12 (100.0%) |
| Utilities | 0 (0.0%) | 0 (0.0%) |
| Information | 0 (0.0%) | 0 (0.0%) |
| Finance & Insurance | 0 (0.0%) | 0 (0.0%) |
| Real Estate, Rental & Leasing | 0 (0.0%) | 0 (0.0%) |
| Professional & Scientific | 0 (0.0%) | 0 (0.0%) |
| Enterprise Management | 0 (0.0%) | 0 (0.0%) |
| Administrative & Support | 17 (65.4%) | 9 (34.6%) |
| Educational Services | 0 (0.0%) | 26 (100.0%) |
| Health Care & Social Assistance | 40 (23.1%) | 133 (76.9%) |
| Arts, Entertainment & Recreation | 10 (100.0%) | 0 (0.0%) |
| Accommodation & Food Services | 15 (50.0%) | 15 (50.0%) |
| Public Administration | 16 (72.7%) | 6 (27.3%) |
| Total | 313 (54.8%) | 258 (45.2%) |
Education in Simpson
School Enrollment in Simpson
The most common levels of schooling among the 269 students in Simpson are high school (112 | 41.6%), elementary school (59 | 21.9%), and middle school (31 | 11.5%).
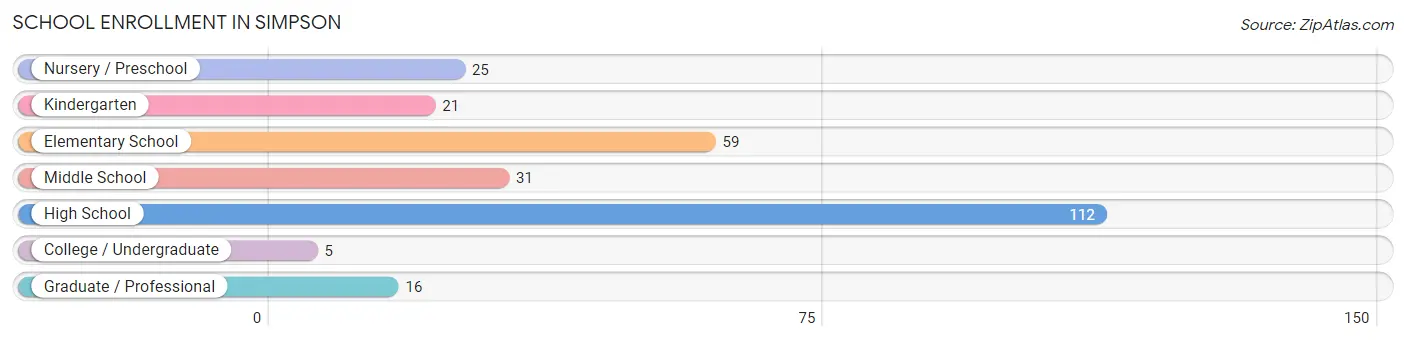
| School Level | # Students | % Students |
| Nursery / Preschool | 25 | 9.3% |
| Kindergarten | 21 | 7.8% |
| Elementary School | 59 | 21.9% |
| Middle School | 31 | 11.5% |
| High School | 112 | 41.6% |
| College / Undergraduate | 5 | 1.9% |
| Graduate / Professional | 16 | 5.9% |
| Total | 269 | 100.0% |
School Enrollment by Age by Funding Source in Simpson
Out of a total of 269 students who are enrolled in schools in Simpson, 26 (9.7%) attend a private institution, while the remaining 243 (90.3%) are enrolled in public schools. The age group of 35 years and over has the highest likelihood of being enrolled in private schools, with 5 (71.4% in the age bracket) enrolled. Conversely, the age group of 3 to 4 year olds has the lowest likelihood of being enrolled in a private school, with 25 (100.0% in the age bracket) attending a public institution.
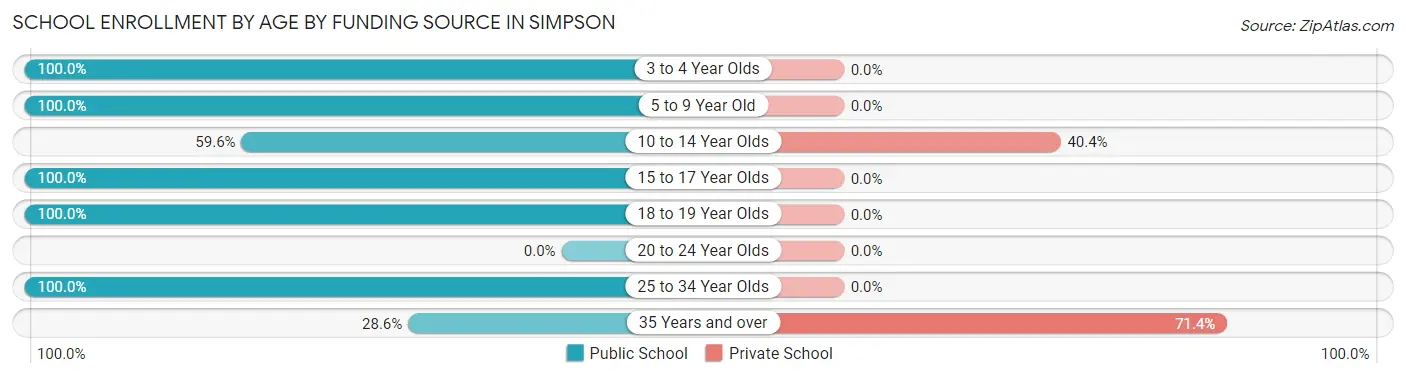
| Age Bracket | Public School | Private School |
| 3 to 4 Year Olds | 25 (100.0%) | 0 (0.0%) |
| 5 to 9 Year Old | 80 (100.0%) | 0 (0.0%) |
| 10 to 14 Year Olds | 31 (59.6%) | 21 (40.4%) |
| 15 to 17 Year Olds | 39 (100.0%) | 0 (0.0%) |
| 18 to 19 Year Olds | 52 (100.0%) | 0 (0.0%) |
| 20 to 24 Year Olds | 0 (0.0%) | 0 (0.0%) |
| 25 to 34 Year Olds | 14 (100.0%) | 0 (0.0%) |
| 35 Years and over | 2 (28.6%) | 5 (71.4%) |
| Total | 243 (90.3%) | 26 (9.7%) |
Educational Attainment by Field of Study in Simpson
Business (46 | 34.3%), education (22 | 16.4%), science & technology (19 | 14.2%), literature & languages (12 | 9.0%), and physical & health sciences (9 | 6.7%) are the most common fields of study among 134 individuals in Simpson who have obtained a bachelor's degree or higher.
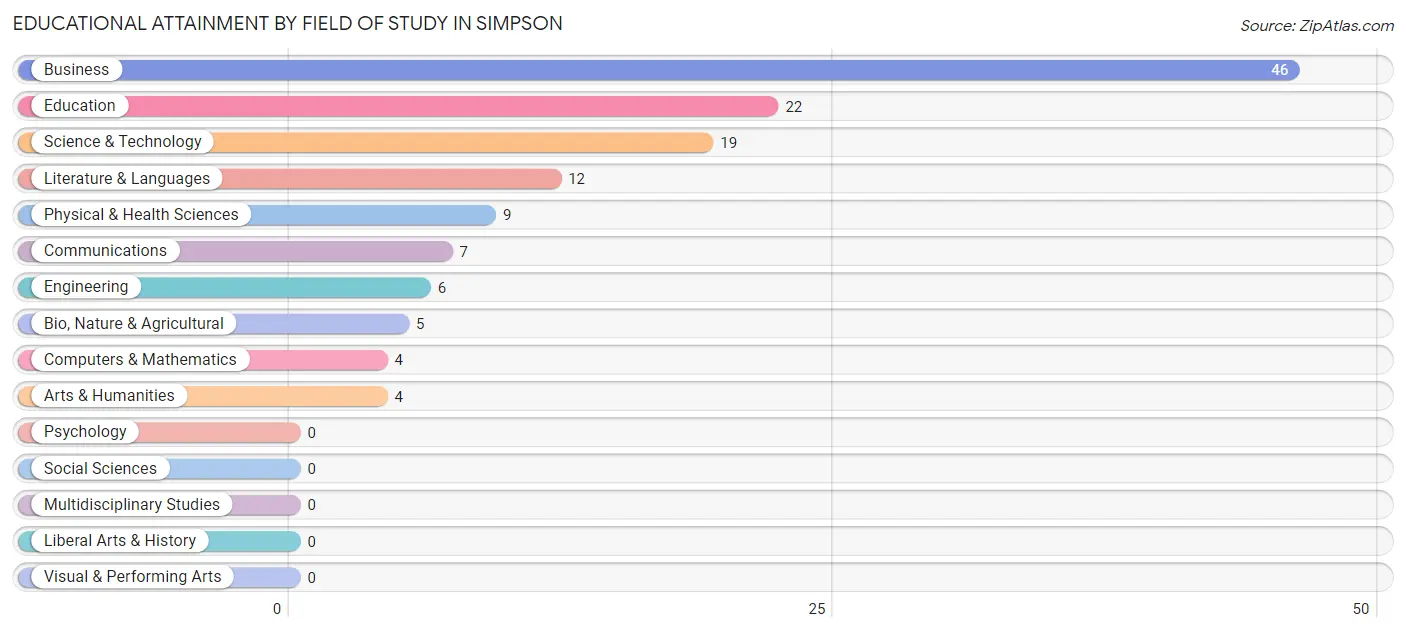
| Field of Study | # Graduates | % Graduates |
| Computers & Mathematics | 4 | 3.0% |
| Bio, Nature & Agricultural | 5 | 3.7% |
| Physical & Health Sciences | 9 | 6.7% |
| Psychology | 0 | 0.0% |
| Social Sciences | 0 | 0.0% |
| Engineering | 6 | 4.5% |
| Multidisciplinary Studies | 0 | 0.0% |
| Science & Technology | 19 | 14.2% |
| Business | 46 | 34.3% |
| Education | 22 | 16.4% |
| Literature & Languages | 12 | 9.0% |
| Liberal Arts & History | 0 | 0.0% |
| Visual & Performing Arts | 0 | 0.0% |
| Communications | 7 | 5.2% |
| Arts & Humanities | 4 | 3.0% |
| Total | 134 | 100.0% |
Transportation & Commute in Simpson
Vehicle Availability by Sex in Simpson
The most prevalent vehicle ownership categories in Simpson are males with 4 vehicles (149, accounting for 48.4%) and females with 4 vehicles (49, making up 57.8%).
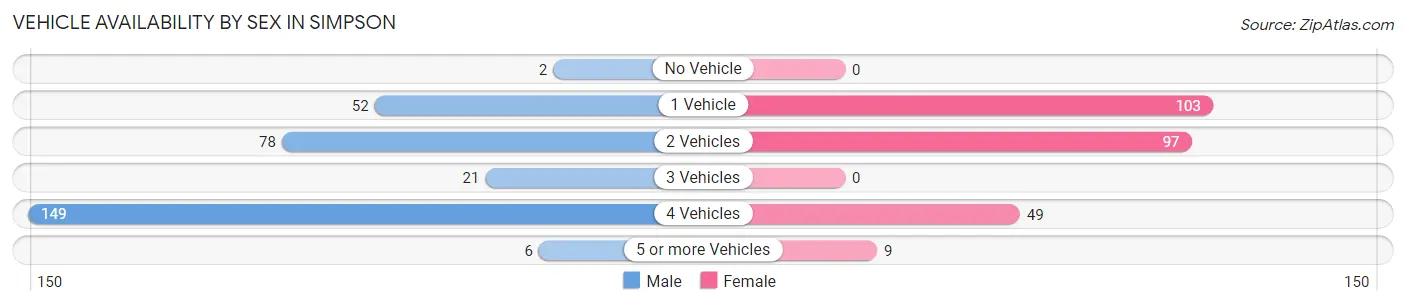
| Vehicles Available | Male | Female |
| No Vehicle | 2 (0.6%) | 0 (0.0%) |
| 1 Vehicle | 52 (16.9%) | 103 (39.9%) |
| 2 Vehicles | 78 (25.3%) | 97 (37.6%) |
| 3 Vehicles | 21 (6.8%) | 0 (0.0%) |
| 4 Vehicles | 149 (48.4%) | 49 (19.0%) |
| 5 or more Vehicles | 6 (1.9%) | 9 (3.5%) |
| Total | 308 (100.0%) | 258 (100.0%) |
Commute Time in Simpson
The most frequently occuring commute durations in Simpson are 5 to 9 minutes (182 commuters, 32.9%), 15 to 19 minutes (90 commuters, 16.3%), and 10 to 14 minutes (60 commuters, 10.8%).
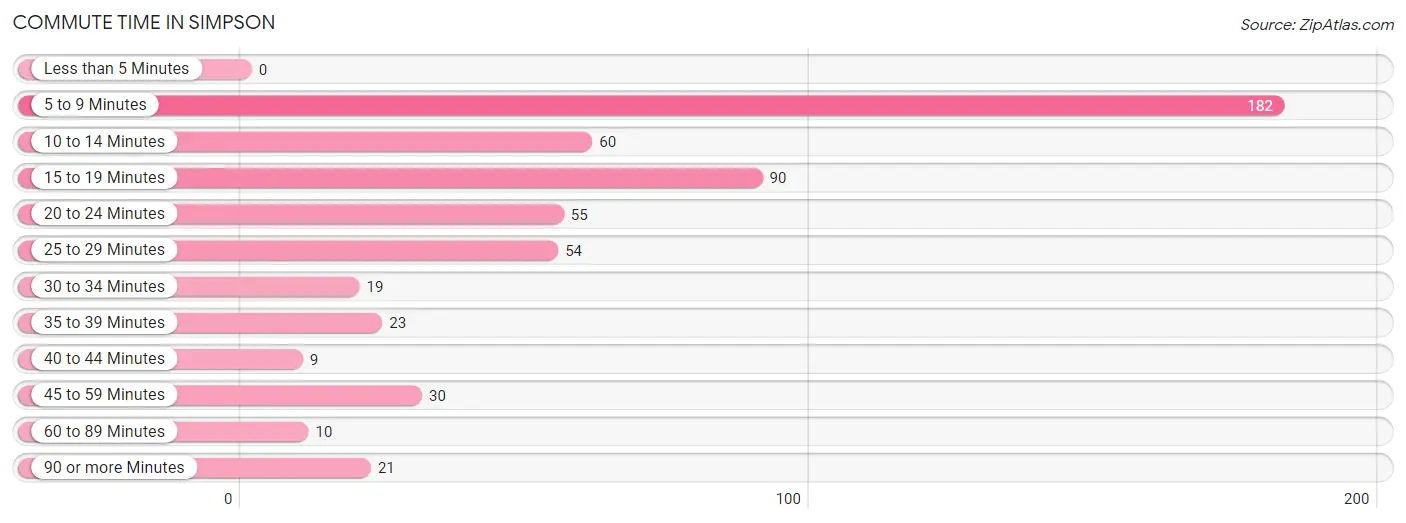
| Commute Time | # Commuters | % Commuters |
| Less than 5 Minutes | 0 | 0.0% |
| 5 to 9 Minutes | 182 | 32.9% |
| 10 to 14 Minutes | 60 | 10.8% |
| 15 to 19 Minutes | 90 | 16.3% |
| 20 to 24 Minutes | 55 | 10.0% |
| 25 to 29 Minutes | 54 | 9.8% |
| 30 to 34 Minutes | 19 | 3.4% |
| 35 to 39 Minutes | 23 | 4.2% |
| 40 to 44 Minutes | 9 | 1.6% |
| 45 to 59 Minutes | 30 | 5.4% |
| 60 to 89 Minutes | 10 | 1.8% |
| 90 or more Minutes | 21 | 3.8% |
Commute Time by Sex in Simpson
The most common commute times in Simpson are 5 to 9 minutes (82 commuters, 26.6%) for males and 5 to 9 minutes (100 commuters, 40.8%) for females.
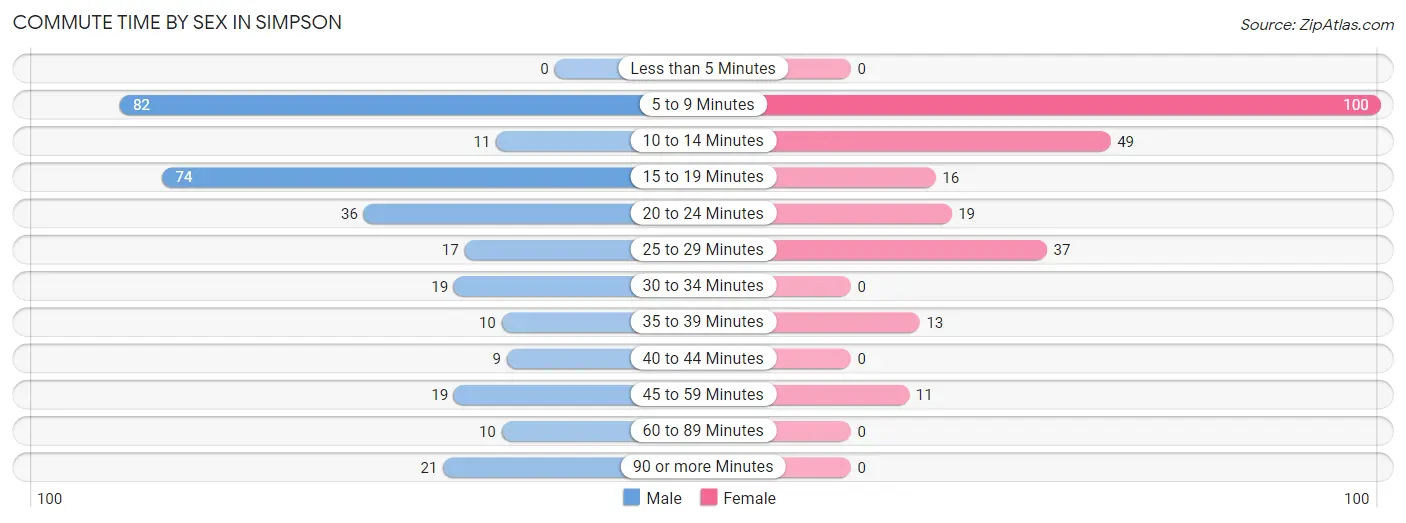
| Commute Time | Male | Female |
| Less than 5 Minutes | 0 (0.0%) | 0 (0.0%) |
| 5 to 9 Minutes | 82 (26.6%) | 100 (40.8%) |
| 10 to 14 Minutes | 11 (3.6%) | 49 (20.0%) |
| 15 to 19 Minutes | 74 (24.0%) | 16 (6.5%) |
| 20 to 24 Minutes | 36 (11.7%) | 19 (7.8%) |
| 25 to 29 Minutes | 17 (5.5%) | 37 (15.1%) |
| 30 to 34 Minutes | 19 (6.2%) | 0 (0.0%) |
| 35 to 39 Minutes | 10 (3.3%) | 13 (5.3%) |
| 40 to 44 Minutes | 9 (2.9%) | 0 (0.0%) |
| 45 to 59 Minutes | 19 (6.2%) | 11 (4.5%) |
| 60 to 89 Minutes | 10 (3.3%) | 0 (0.0%) |
| 90 or more Minutes | 21 (6.8%) | 0 (0.0%) |
Time of Departure to Work by Sex in Simpson
The most frequent times of departure to work in Simpson are 7:00 AM to 7:29 AM (126, 40.9%) for males and 7:30 AM to 7:59 AM (41, 16.7%) for females.
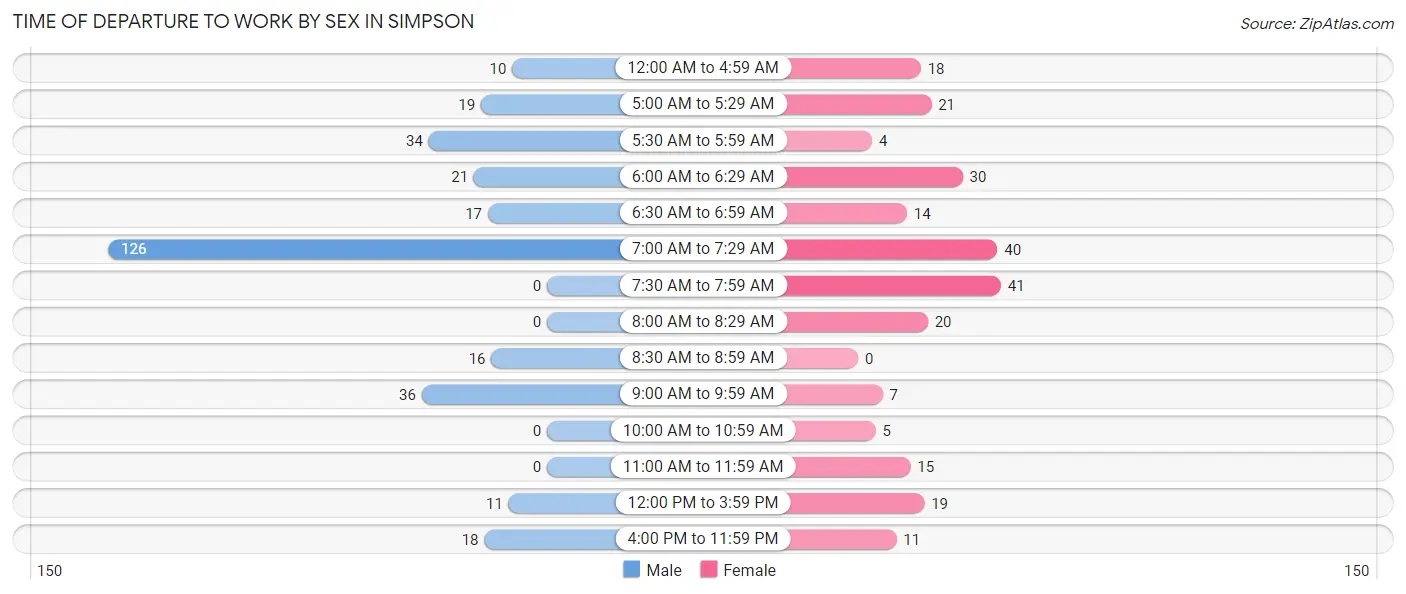
| Time of Departure | Male | Female |
| 12:00 AM to 4:59 AM | 10 (3.3%) | 18 (7.3%) |
| 5:00 AM to 5:29 AM | 19 (6.2%) | 21 (8.6%) |
| 5:30 AM to 5:59 AM | 34 (11.0%) | 4 (1.6%) |
| 6:00 AM to 6:29 AM | 21 (6.8%) | 30 (12.2%) |
| 6:30 AM to 6:59 AM | 17 (5.5%) | 14 (5.7%) |
| 7:00 AM to 7:29 AM | 126 (40.9%) | 40 (16.3%) |
| 7:30 AM to 7:59 AM | 0 (0.0%) | 41 (16.7%) |
| 8:00 AM to 8:29 AM | 0 (0.0%) | 20 (8.2%) |
| 8:30 AM to 8:59 AM | 16 (5.2%) | 0 (0.0%) |
| 9:00 AM to 9:59 AM | 36 (11.7%) | 7 (2.9%) |
| 10:00 AM to 10:59 AM | 0 (0.0%) | 5 (2.0%) |
| 11:00 AM to 11:59 AM | 0 (0.0%) | 15 (6.1%) |
| 12:00 PM to 3:59 PM | 11 (3.6%) | 19 (7.8%) |
| 4:00 PM to 11:59 PM | 18 (5.8%) | 11 (4.5%) |
| Total | 308 (100.0%) | 245 (100.0%) |
Housing Occupancy in Simpson
Occupancy by Ownership in Simpson
Of the total 489 dwellings in Simpson, owner-occupied units account for 388 (79.3%), while renter-occupied units make up 101 (20.6%).
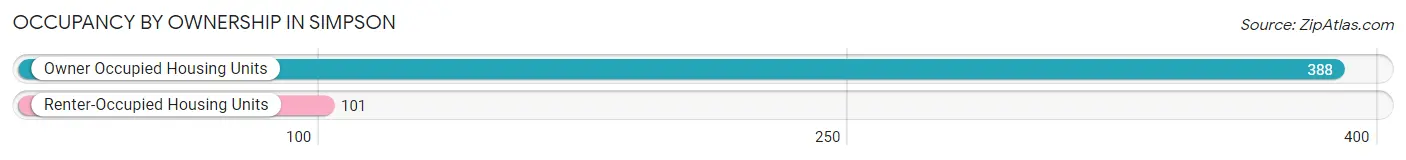
| Occupancy | # Housing Units | % Housing Units |
| Owner Occupied Housing Units | 388 | 79.3% |
| Renter-Occupied Housing Units | 101 | 20.6% |
| Total Occupied Housing Units | 489 | 100.0% |
Occupancy by Household Size in Simpson
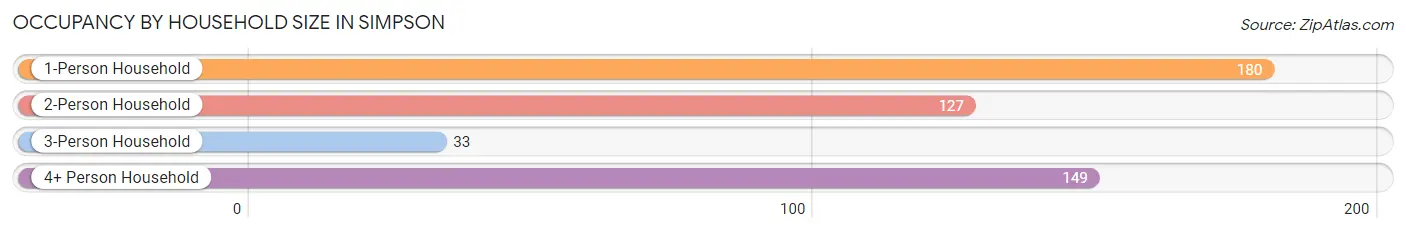
| Household Size | # Housing Units | % Housing Units |
| 1-Person Household | 180 | 36.8% |
| 2-Person Household | 127 | 26.0% |
| 3-Person Household | 33 | 6.8% |
| 4+ Person Household | 149 | 30.5% |
| Total Housing Units | 489 | 100.0% |
Occupancy by Ownership by Household Size in Simpson
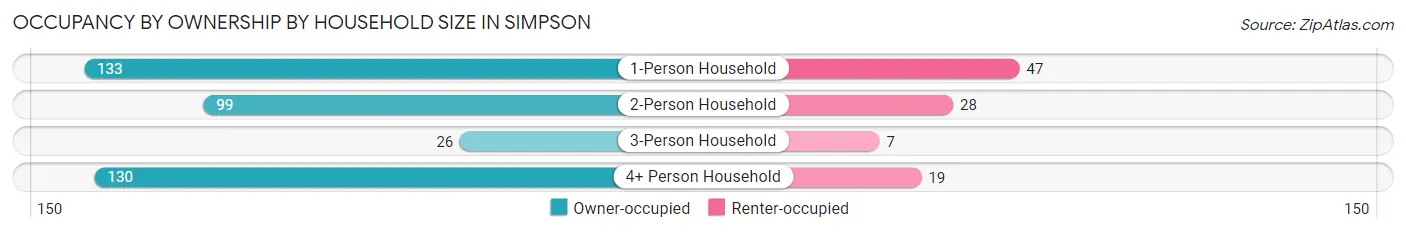
| Household Size | Owner-occupied | Renter-occupied |
| 1-Person Household | 133 (73.9%) | 47 (26.1%) |
| 2-Person Household | 99 (77.9%) | 28 (22.1%) |
| 3-Person Household | 26 (78.8%) | 7 (21.2%) |
| 4+ Person Household | 130 (87.3%) | 19 (12.8%) |
| Total Housing Units | 388 (79.3%) | 101 (20.6%) |
Occupancy by Educational Attainment in Simpson
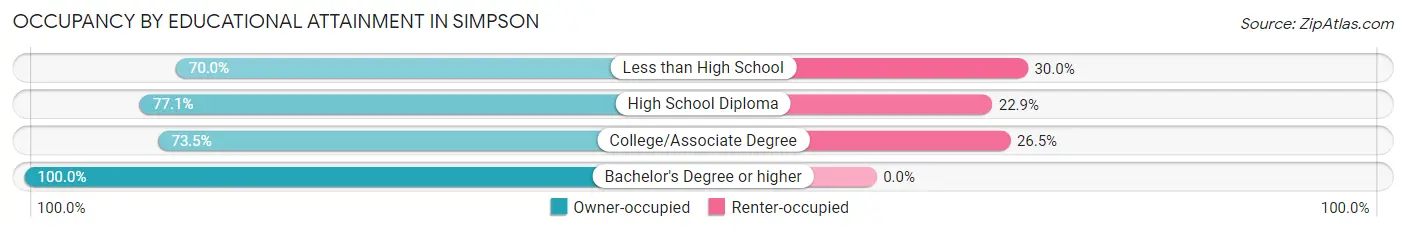
| Household Size | Owner-occupied | Renter-occupied |
| Less than High School | 21 (70.0%) | 9 (30.0%) |
| High School Diploma | 148 (77.1%) | 44 (22.9%) |
| College/Associate Degree | 133 (73.5%) | 48 (26.5%) |
| Bachelor's Degree or higher | 86 (100.0%) | 0 (0.0%) |
Occupancy by Age of Householder in Simpson
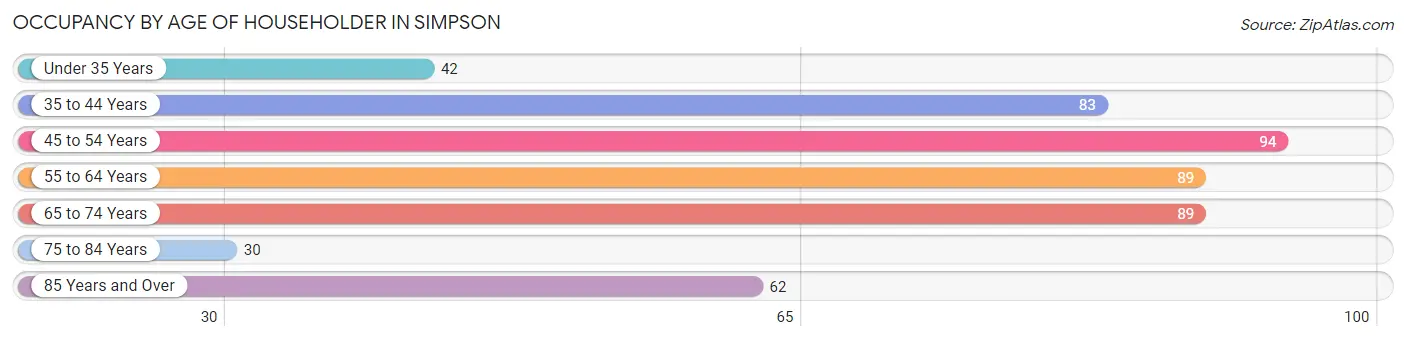
| Age Bracket | # Households | % Households |
| Under 35 Years | 42 | 8.6% |
| 35 to 44 Years | 83 | 17.0% |
| 45 to 54 Years | 94 | 19.2% |
| 55 to 64 Years | 89 | 18.2% |
| 65 to 74 Years | 89 | 18.2% |
| 75 to 84 Years | 30 | 6.1% |
| 85 Years and Over | 62 | 12.7% |
| Total | 489 | 100.0% |
Housing Finances in Simpson
Median Income by Occupancy in Simpson
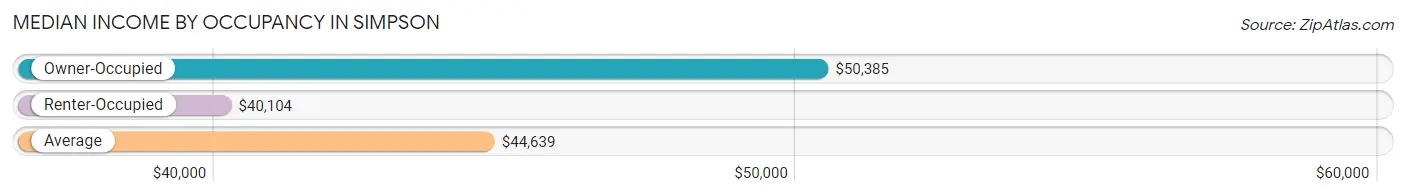
| Occupancy Type | # Households | Median Income |
| Owner-Occupied | 388 (79.3%) | $50,385 |
| Renter-Occupied | 101 (20.6%) | $40,104 |
| Average | 489 (100.0%) | $44,639 |
Occupancy by Householder Income Bracket in Simpson
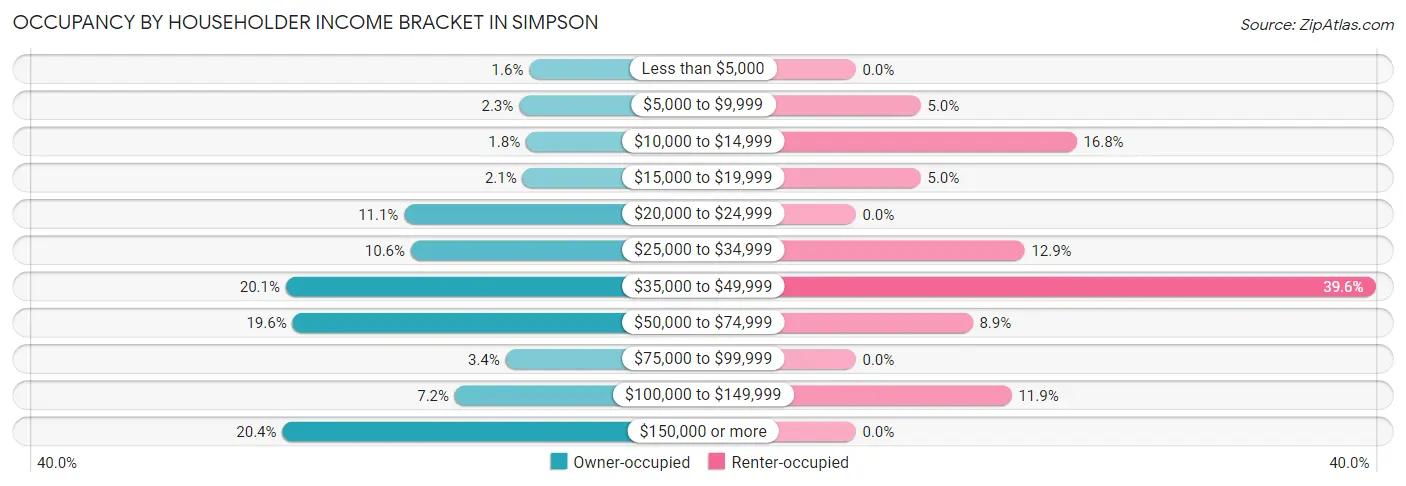
| Income Bracket | Owner-occupied | Renter-occupied |
| Less than $5,000 | 6 (1.5%) | 0 (0.0%) |
| $5,000 to $9,999 | 9 (2.3%) | 5 (5.0%) |
| $10,000 to $14,999 | 7 (1.8%) | 17 (16.8%) |
| $15,000 to $19,999 | 8 (2.1%) | 5 (5.0%) |
| $20,000 to $24,999 | 43 (11.1%) | 0 (0.0%) |
| $25,000 to $34,999 | 41 (10.6%) | 13 (12.9%) |
| $35,000 to $49,999 | 78 (20.1%) | 40 (39.6%) |
| $50,000 to $74,999 | 76 (19.6%) | 9 (8.9%) |
| $75,000 to $99,999 | 13 (3.4%) | 0 (0.0%) |
| $100,000 to $149,999 | 28 (7.2%) | 12 (11.9%) |
| $150,000 or more | 79 (20.4%) | 0 (0.0%) |
| Total | 388 (100.0%) | 101 (100.0%) |
Monthly Housing Cost Tiers in Simpson
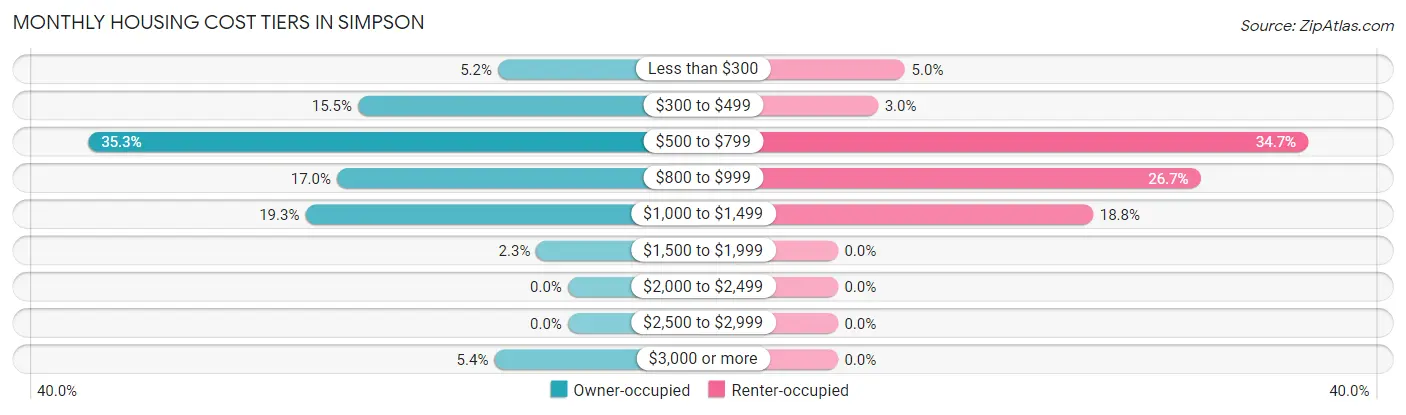
| Monthly Cost | Owner-occupied | Renter-occupied |
| Less than $300 | 20 (5.1%) | 5 (5.0%) |
| $300 to $499 | 60 (15.5%) | 3 (3.0%) |
| $500 to $799 | 137 (35.3%) | 35 (34.6%) |
| $800 to $999 | 66 (17.0%) | 27 (26.7%) |
| $1,000 to $1,499 | 75 (19.3%) | 19 (18.8%) |
| $1,500 to $1,999 | 9 (2.3%) | 0 (0.0%) |
| $2,000 to $2,499 | 0 (0.0%) | 0 (0.0%) |
| $2,500 to $2,999 | 0 (0.0%) | 0 (0.0%) |
| $3,000 or more | 21 (5.4%) | 0 (0.0%) |
| Total | 388 (100.0%) | 101 (100.0%) |
Physical Housing Characteristics in Simpson
Housing Structures in Simpson
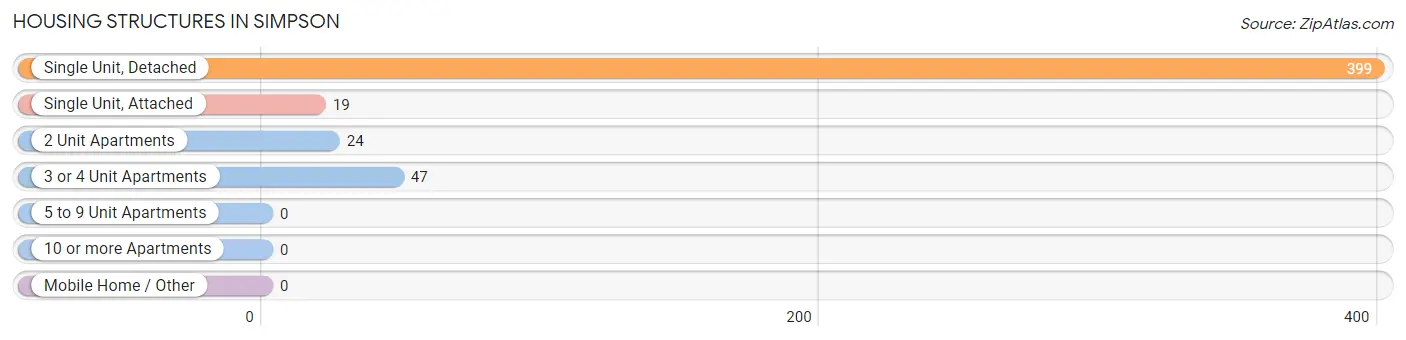
| Structure Type | # Housing Units | % Housing Units |
| Single Unit, Detached | 399 | 81.6% |
| Single Unit, Attached | 19 | 3.9% |
| 2 Unit Apartments | 24 | 4.9% |
| 3 or 4 Unit Apartments | 47 | 9.6% |
| 5 to 9 Unit Apartments | 0 | 0.0% |
| 10 or more Apartments | 0 | 0.0% |
| Mobile Home / Other | 0 | 0.0% |
| Total | 489 | 100.0% |
Housing Structures by Occupancy in Simpson
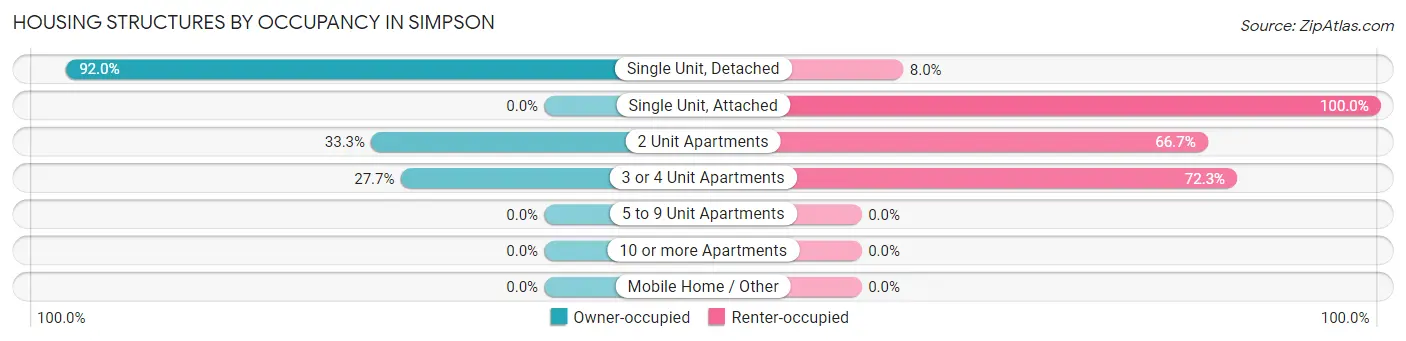
| Structure Type | Owner-occupied | Renter-occupied |
| Single Unit, Detached | 367 (92.0%) | 32 (8.0%) |
| Single Unit, Attached | 0 (0.0%) | 19 (100.0%) |
| 2 Unit Apartments | 8 (33.3%) | 16 (66.7%) |
| 3 or 4 Unit Apartments | 13 (27.7%) | 34 (72.3%) |
| 5 to 9 Unit Apartments | 0 (0.0%) | 0 (0.0%) |
| 10 or more Apartments | 0 (0.0%) | 0 (0.0%) |
| Mobile Home / Other | 0 (0.0%) | 0 (0.0%) |
| Total | 388 (79.3%) | 101 (20.6%) |
Housing Structures by Number of Rooms in Simpson
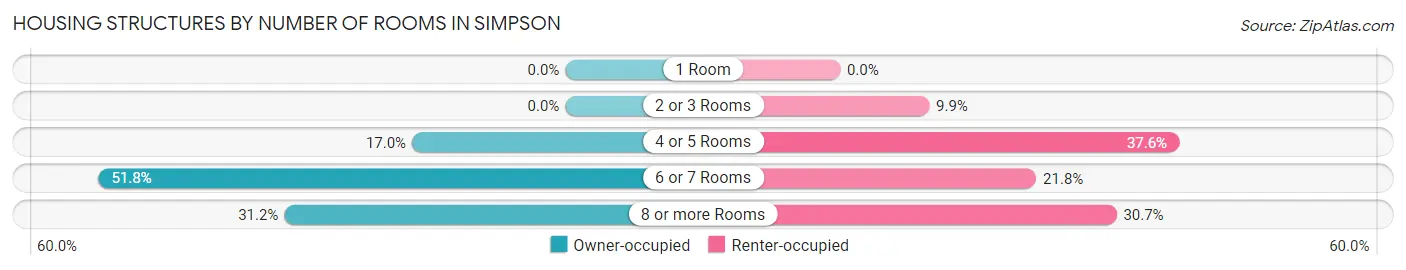
| Number of Rooms | Owner-occupied | Renter-occupied |
| 1 Room | 0 (0.0%) | 0 (0.0%) |
| 2 or 3 Rooms | 0 (0.0%) | 10 (9.9%) |
| 4 or 5 Rooms | 66 (17.0%) | 38 (37.6%) |
| 6 or 7 Rooms | 201 (51.8%) | 22 (21.8%) |
| 8 or more Rooms | 121 (31.2%) | 31 (30.7%) |
| Total | 388 (100.0%) | 101 (100.0%) |
Housing Structure by Heating Type in Simpson
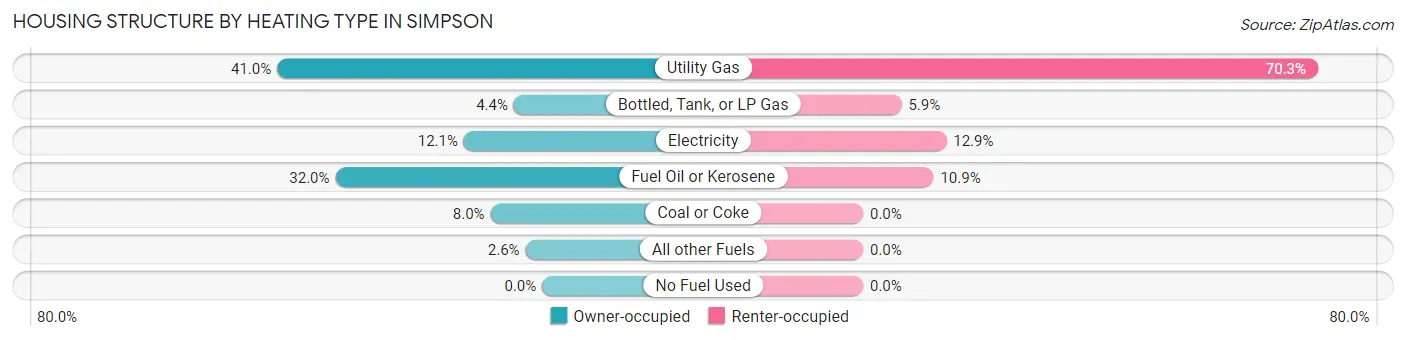
| Heating Type | Owner-occupied | Renter-occupied |
| Utility Gas | 159 (41.0%) | 71 (70.3%) |
| Bottled, Tank, or LP Gas | 17 (4.4%) | 6 (5.9%) |
| Electricity | 47 (12.1%) | 13 (12.9%) |
| Fuel Oil or Kerosene | 124 (32.0%) | 11 (10.9%) |
| Coal or Coke | 31 (8.0%) | 0 (0.0%) |
| All other Fuels | 10 (2.6%) | 0 (0.0%) |
| No Fuel Used | 0 (0.0%) | 0 (0.0%) |
| Total | 388 (100.0%) | 101 (100.0%) |
Household Vehicle Usage in Simpson
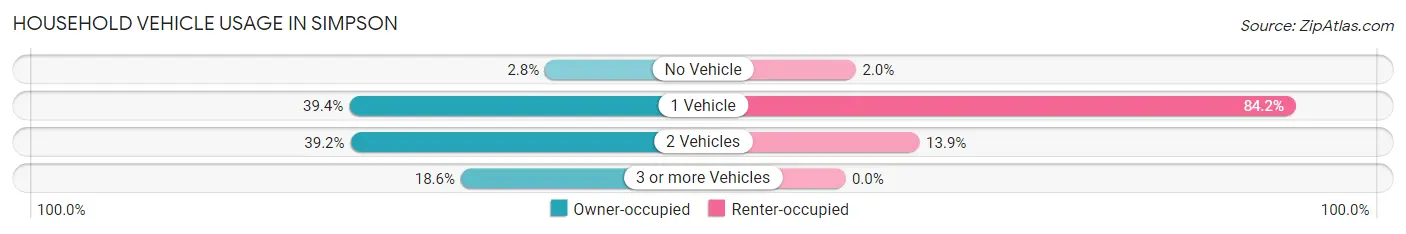
| Vehicles per Household | Owner-occupied | Renter-occupied |
| No Vehicle | 11 (2.8%) | 2 (2.0%) |
| 1 Vehicle | 153 (39.4%) | 85 (84.2%) |
| 2 Vehicles | 152 (39.2%) | 14 (13.9%) |
| 3 or more Vehicles | 72 (18.6%) | 0 (0.0%) |
| Total | 388 (100.0%) | 101 (100.0%) |
Real Estate & Mortgages in Simpson
Real Estate and Mortgage Overview in Simpson
| Characteristic | Without Mortgage | With Mortgage |
| Housing Units | 200 | 188 |
| Median Property Value | $105,800 | $111,900 |
| Median Household Income | $53,100 | $30 |
| Monthly Housing Costs | $604 | $21 |
| Real Estate Taxes | $1,726 | $0 |
Property Value by Mortgage Status in Simpson
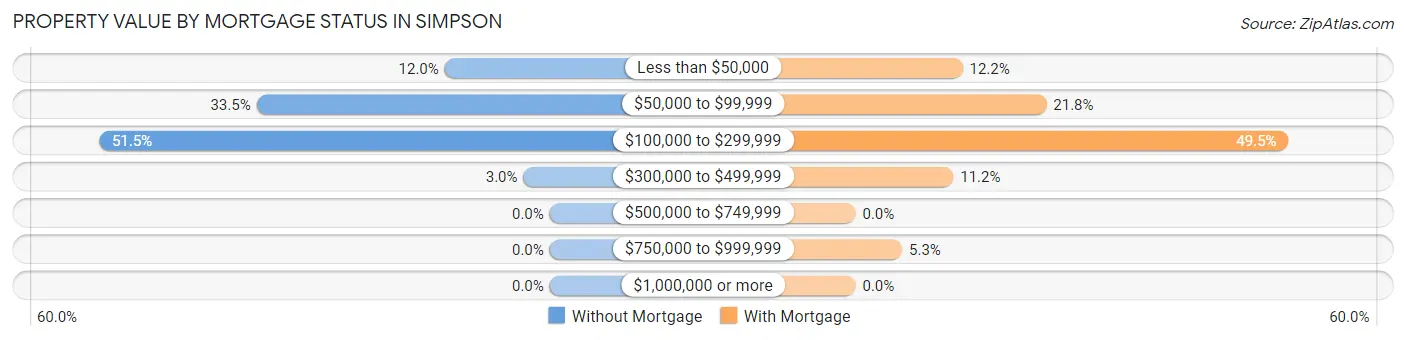
| Property Value | Without Mortgage | With Mortgage |
| Less than $50,000 | 24 (12.0%) | 23 (12.2%) |
| $50,000 to $99,999 | 67 (33.5%) | 41 (21.8%) |
| $100,000 to $299,999 | 103 (51.5%) | 93 (49.5%) |
| $300,000 to $499,999 | 6 (3.0%) | 21 (11.2%) |
| $500,000 to $749,999 | 0 (0.0%) | 0 (0.0%) |
| $750,000 to $999,999 | 0 (0.0%) | 10 (5.3%) |
| $1,000,000 or more | 0 (0.0%) | 0 (0.0%) |
| Total | 200 (100.0%) | 188 (100.0%) |
Household Income by Mortgage Status in Simpson
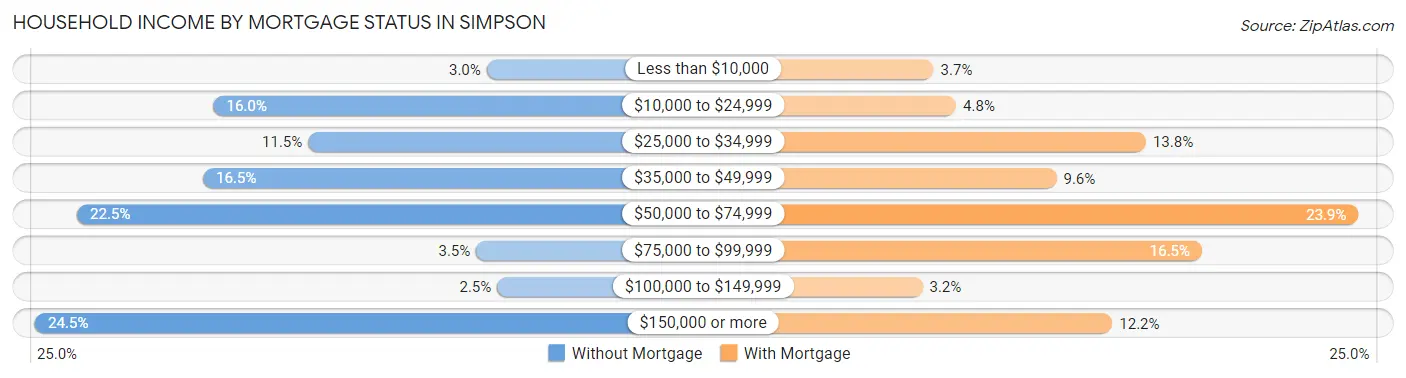
| Household Income | Without Mortgage | With Mortgage |
| Less than $10,000 | 6 (3.0%) | 7 (3.7%) |
| $10,000 to $24,999 | 32 (16.0%) | 9 (4.8%) |
| $25,000 to $34,999 | 23 (11.5%) | 26 (13.8%) |
| $35,000 to $49,999 | 33 (16.5%) | 18 (9.6%) |
| $50,000 to $74,999 | 45 (22.5%) | 45 (23.9%) |
| $75,000 to $99,999 | 7 (3.5%) | 31 (16.5%) |
| $100,000 to $149,999 | 5 (2.5%) | 6 (3.2%) |
| $150,000 or more | 49 (24.5%) | 23 (12.2%) |
| Total | 200 (100.0%) | 188 (100.0%) |
Property Value to Household Income Ratio in Simpson
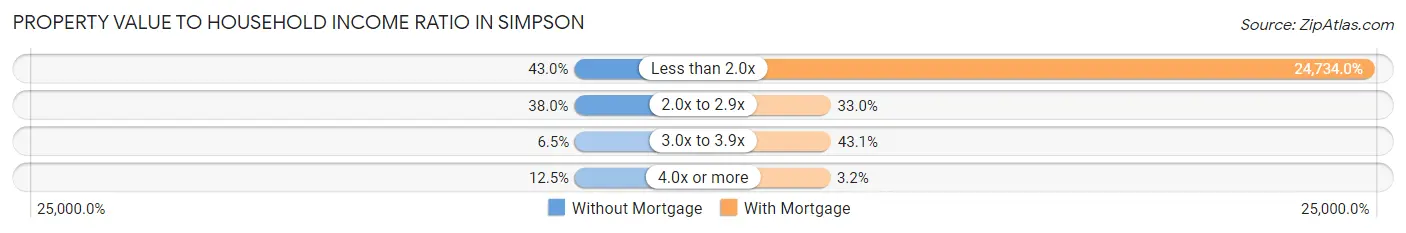
| Value-to-Income Ratio | Without Mortgage | With Mortgage |
| Less than 2.0x | 86 (43.0%) | 46,500 (24,734.0%) |
| 2.0x to 2.9x | 76 (38.0%) | 62 (33.0%) |
| 3.0x to 3.9x | 13 (6.5%) | 81 (43.1%) |
| 4.0x or more | 25 (12.5%) | 6 (3.2%) |
| Total | 200 (100.0%) | 188 (100.0%) |
Real Estate Taxes by Mortgage Status in Simpson
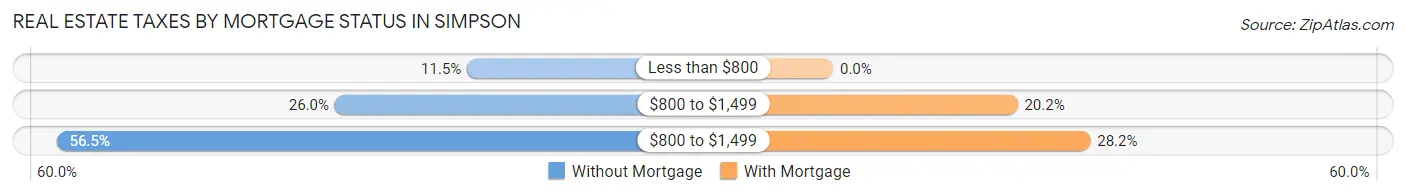
| Property Taxes | Without Mortgage | With Mortgage |
| Less than $800 | 23 (11.5%) | 0 (0.0%) |
| $800 to $1,499 | 52 (26.0%) | 38 (20.2%) |
| $800 to $1,499 | 113 (56.5%) | 53 (28.2%) |
| Total | 200 (100.0%) | 188 (100.0%) |
Health & Disability in Simpson
Health Insurance Coverage by Age in Simpson
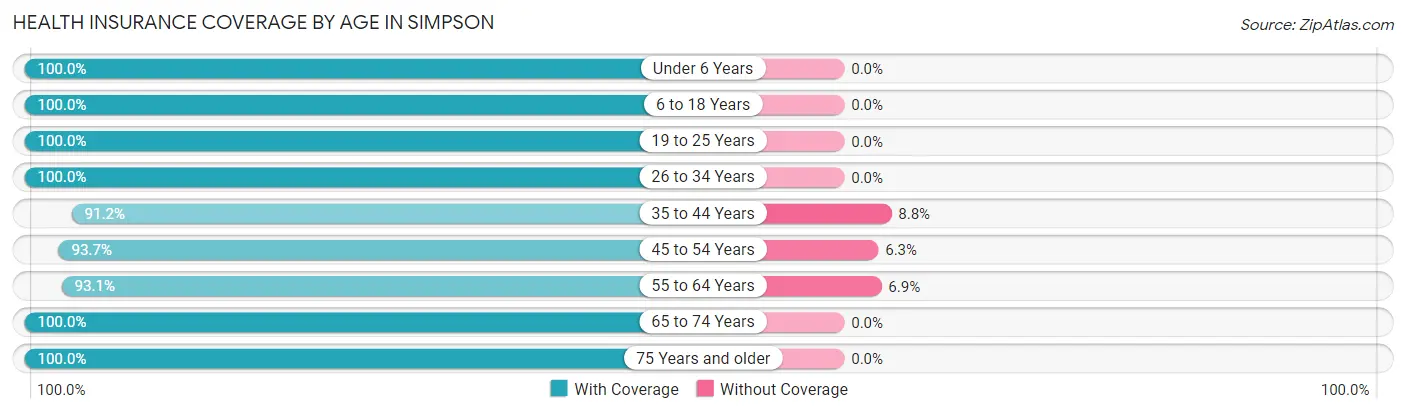
| Age Bracket | With Coverage | Without Coverage |
| Under 6 Years | 60 (100.0%) | 0 (0.0%) |
| 6 to 18 Years | 202 (100.0%) | 0 (0.0%) |
| 19 to 25 Years | 122 (100.0%) | 0 (0.0%) |
| 26 to 34 Years | 76 (100.0%) | 0 (0.0%) |
| 35 to 44 Years | 135 (91.2%) | 13 (8.8%) |
| 45 to 54 Years | 133 (93.7%) | 9 (6.3%) |
| 55 to 64 Years | 148 (93.1%) | 11 (6.9%) |
| 65 to 74 Years | 137 (100.0%) | 0 (0.0%) |
| 75 Years and older | 101 (100.0%) | 0 (0.0%) |
| Total | 1,114 (97.1%) | 33 (2.9%) |
Health Insurance Coverage by Citizenship Status in Simpson
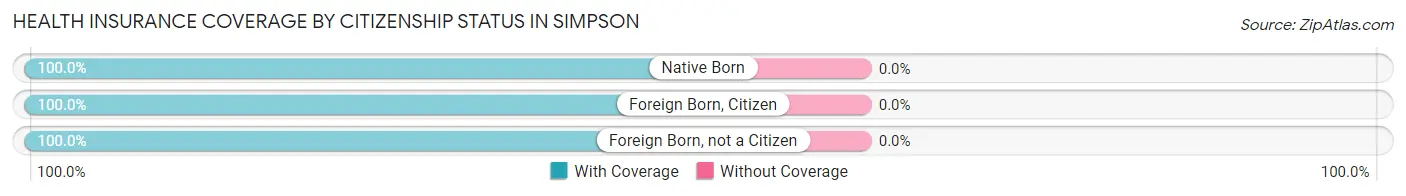
| Citizenship Status | With Coverage | Without Coverage |
| Native Born | 60 (100.0%) | 0 (0.0%) |
| Foreign Born, Citizen | 202 (100.0%) | 0 (0.0%) |
| Foreign Born, not a Citizen | 122 (100.0%) | 0 (0.0%) |
Health Insurance Coverage by Household Income in Simpson
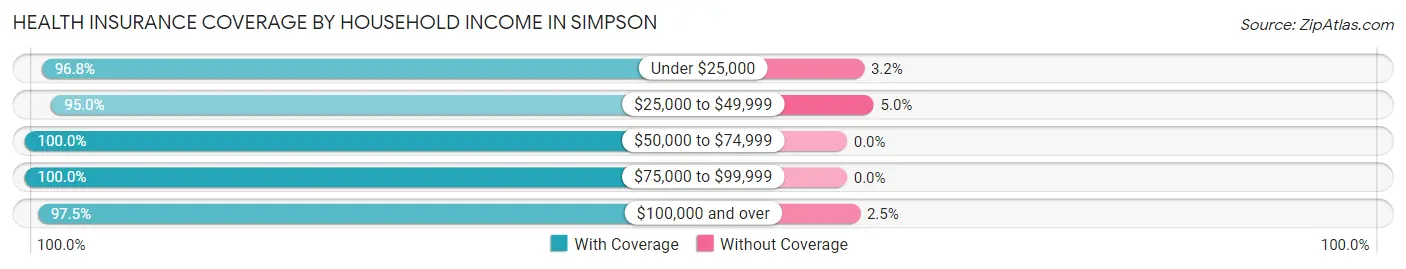
| Household Income | With Coverage | Without Coverage |
| Under $25,000 | 181 (96.8%) | 6 (3.2%) |
| $25,000 to $49,999 | 303 (95.0%) | 16 (5.0%) |
| $50,000 to $74,999 | 147 (100.0%) | 0 (0.0%) |
| $75,000 to $99,999 | 48 (100.0%) | 0 (0.0%) |
| $100,000 and over | 435 (97.5%) | 11 (2.5%) |
Public vs Private Health Insurance Coverage by Age in Simpson
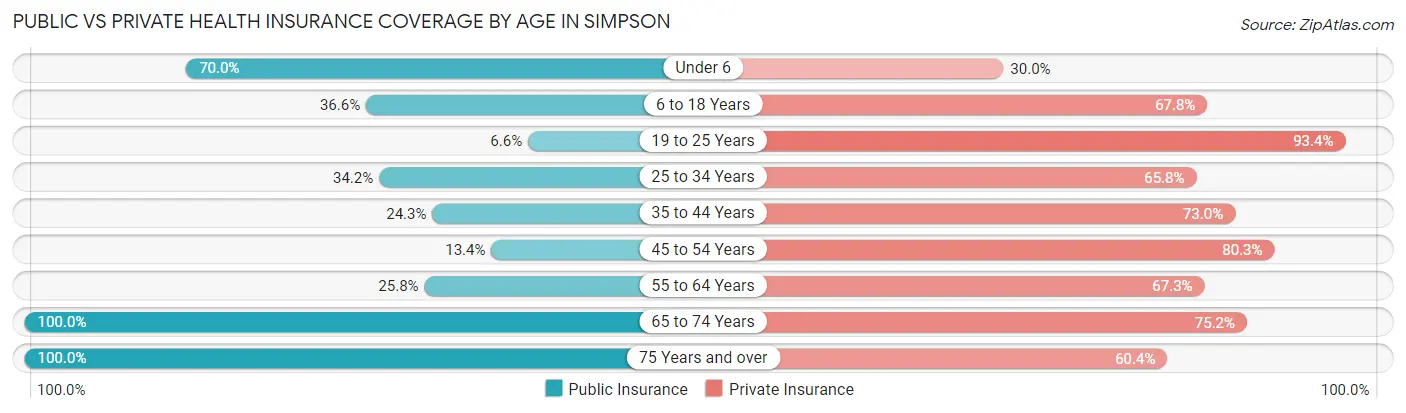
| Age Bracket | Public Insurance | Private Insurance |
| Under 6 | 42 (70.0%) | 18 (30.0%) |
| 6 to 18 Years | 74 (36.6%) | 137 (67.8%) |
| 19 to 25 Years | 8 (6.6%) | 114 (93.4%) |
| 25 to 34 Years | 26 (34.2%) | 50 (65.8%) |
| 35 to 44 Years | 36 (24.3%) | 108 (73.0%) |
| 45 to 54 Years | 19 (13.4%) | 114 (80.3%) |
| 55 to 64 Years | 41 (25.8%) | 107 (67.3%) |
| 65 to 74 Years | 137 (100.0%) | 103 (75.2%) |
| 75 Years and over | 101 (100.0%) | 61 (60.4%) |
| Total | 484 (42.2%) | 812 (70.8%) |
Disability Status by Sex by Age in Simpson
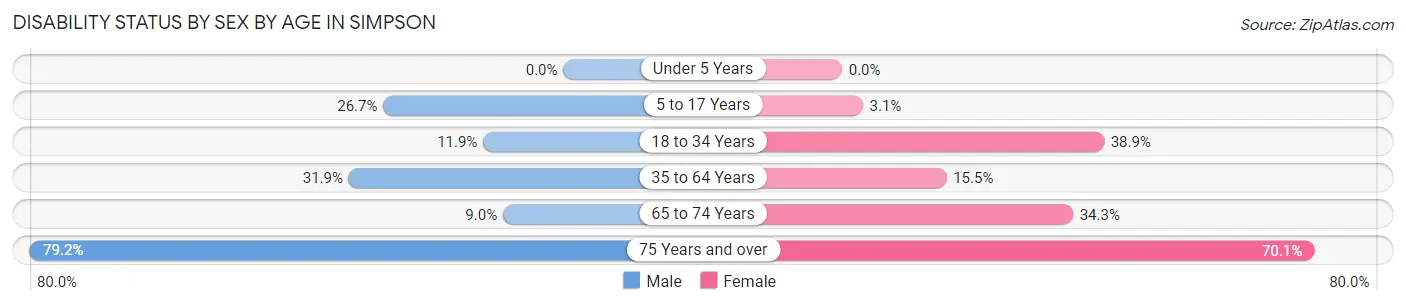
| Age Bracket | Male | Female |
| Under 5 Years | 0 (0.0%) | 0 (0.0%) |
| 5 to 17 Years | 23 (26.7%) | 3 (3.1%) |
| 18 to 34 Years | 20 (11.9%) | 28 (38.9%) |
| 35 to 64 Years | 65 (31.9%) | 38 (15.5%) |
| 65 to 74 Years | 6 (9.0%) | 24 (34.3%) |
| 75 Years and over | 19 (79.2%) | 54 (70.1%) |
Disability Class by Sex by Age in Simpson
Disability Class: Hearing Difficulty
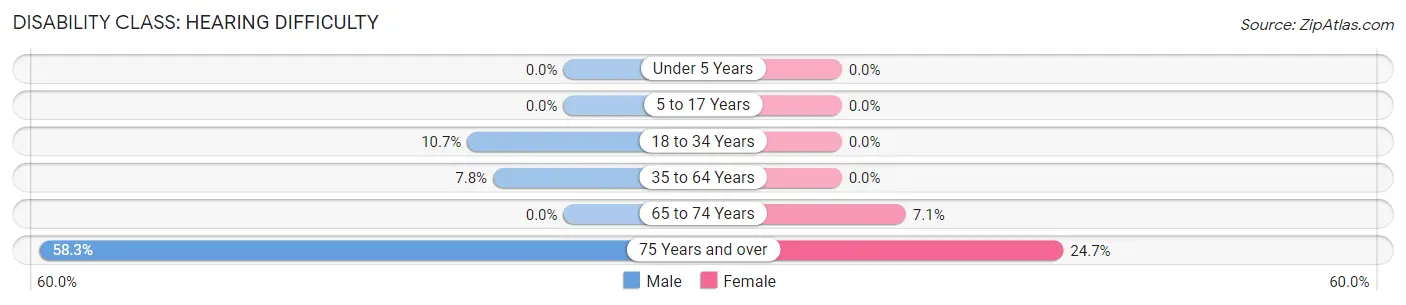
| Age Bracket | Male | Female |
| Under 5 Years | 0 (0.0%) | 0 (0.0%) |
| 5 to 17 Years | 0 (0.0%) | 0 (0.0%) |
| 18 to 34 Years | 18 (10.7%) | 0 (0.0%) |
| 35 to 64 Years | 16 (7.8%) | 0 (0.0%) |
| 65 to 74 Years | 0 (0.0%) | 5 (7.1%) |
| 75 Years and over | 14 (58.3%) | 19 (24.7%) |
Disability Class: Vision Difficulty
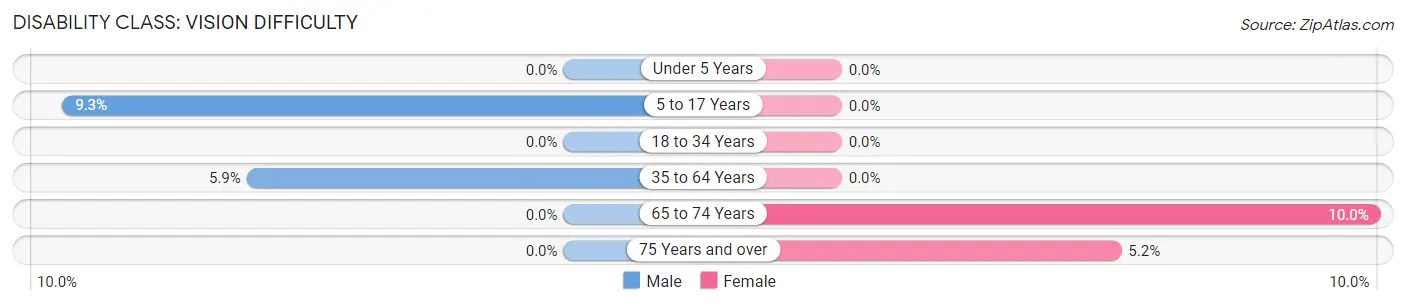
| Age Bracket | Male | Female |
| Under 5 Years | 0 (0.0%) | 0 (0.0%) |
| 5 to 17 Years | 8 (9.3%) | 0 (0.0%) |
| 18 to 34 Years | 0 (0.0%) | 0 (0.0%) |
| 35 to 64 Years | 12 (5.9%) | 0 (0.0%) |
| 65 to 74 Years | 0 (0.0%) | 7 (10.0%) |
| 75 Years and over | 0 (0.0%) | 4 (5.2%) |
Disability Class: Cognitive Difficulty
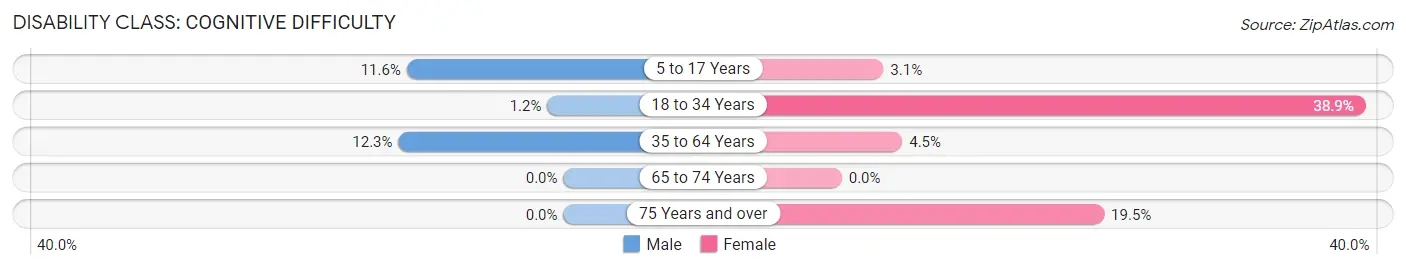
| Age Bracket | Male | Female |
| 5 to 17 Years | 10 (11.6%) | 3 (3.1%) |
| 18 to 34 Years | 2 (1.2%) | 28 (38.9%) |
| 35 to 64 Years | 25 (12.2%) | 11 (4.5%) |
| 65 to 74 Years | 0 (0.0%) | 0 (0.0%) |
| 75 Years and over | 0 (0.0%) | 15 (19.5%) |
Disability Class: Ambulatory Difficulty
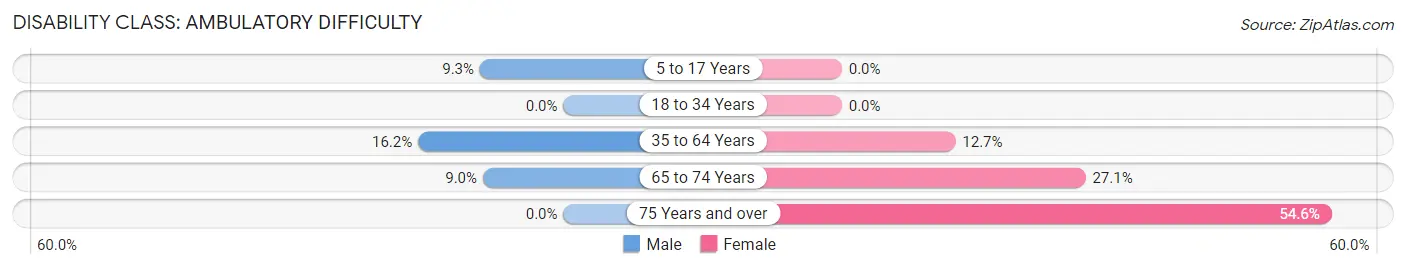
| Age Bracket | Male | Female |
| 5 to 17 Years | 8 (9.3%) | 0 (0.0%) |
| 18 to 34 Years | 0 (0.0%) | 0 (0.0%) |
| 35 to 64 Years | 33 (16.2%) | 31 (12.7%) |
| 65 to 74 Years | 6 (9.0%) | 19 (27.1%) |
| 75 Years and over | 0 (0.0%) | 42 (54.5%) |
Disability Class: Self-Care Difficulty
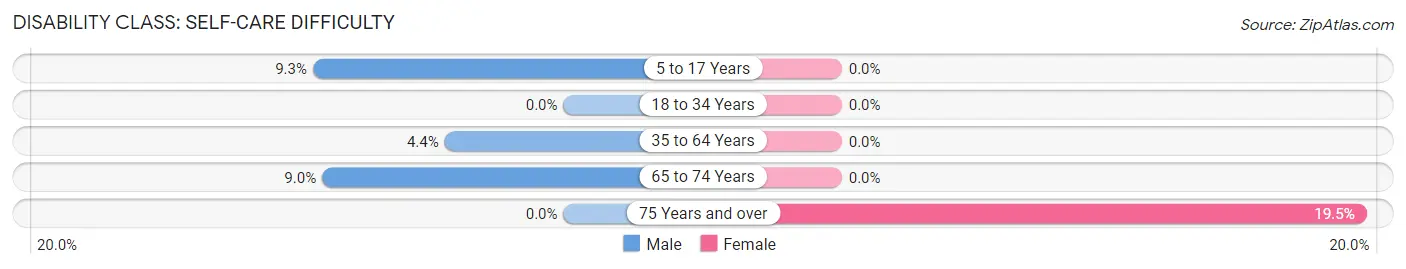
| Age Bracket | Male | Female |
| 5 to 17 Years | 8 (9.3%) | 0 (0.0%) |
| 18 to 34 Years | 0 (0.0%) | 0 (0.0%) |
| 35 to 64 Years | 9 (4.4%) | 0 (0.0%) |
| 65 to 74 Years | 6 (9.0%) | 0 (0.0%) |
| 75 Years and over | 0 (0.0%) | 15 (19.5%) |
Technology Access in Simpson
Computing Device Access in Simpson
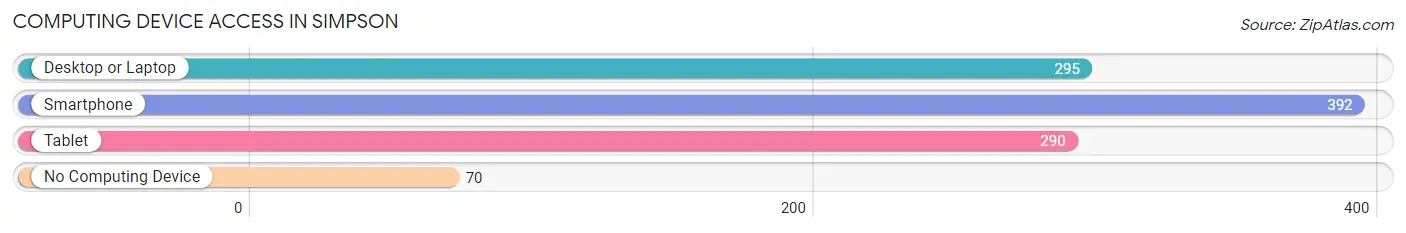
| Device Type | # Households | % Households |
| Desktop or Laptop | 295 | 60.3% |
| Smartphone | 392 | 80.2% |
| Tablet | 290 | 59.3% |
| No Computing Device | 70 | 14.3% |
| Total | 489 | 100.0% |
Internet Access in Simpson
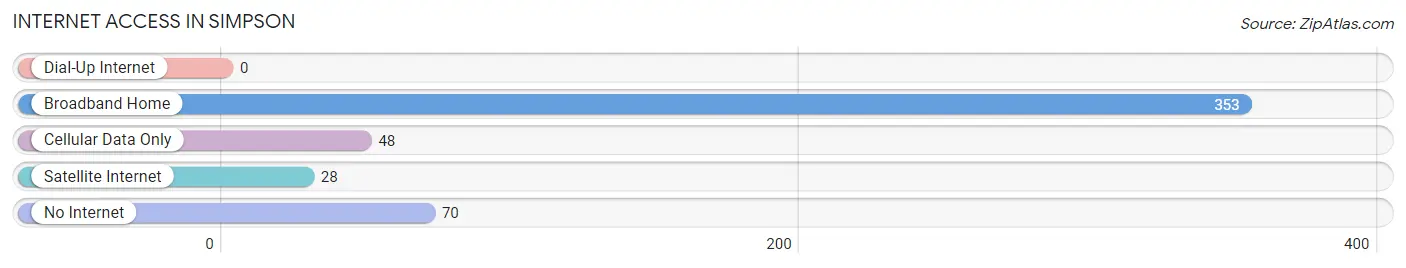
| Internet Type | # Households | % Households |
| Dial-Up Internet | 0 | 0.0% |
| Broadband Home | 353 | 72.2% |
| Cellular Data Only | 48 | 9.8% |
| Satellite Internet | 28 | 5.7% |
| No Internet | 70 | 14.3% |
| Total | 489 | 100.0% |
Simpson Summary
History
Simpson, Pennsylvania is a small borough located in Lackawanna County, Pennsylvania. It was founded in 1845 by John Simpson, a local landowner. The town was originally known as Simpsonville, but the name was changed to Simpson in 1891.
Simpson was a small farming community for much of its history. The town was home to a number of small businesses, including a grist mill, a saw mill, a tannery, and a blacksmith shop. The town also had a post office, a school, and a church.
In the late 19th century, the town began to grow as the coal industry began to expand in the area. The town was home to several coal mines, including the Simpson Coal Company, which operated from 1891 to 1923. The coal industry brought a number of immigrants to the area, including Italians, Poles, and Ukrainians.
The town was also home to a number of other industries, including a brickyard, a glass factory, and a silk mill. The silk mill was the largest employer in the town, employing over 500 people at its peak.
Geography
Simpson is located in Lackawanna County, Pennsylvania. It is situated in the Lackawanna Valley, which is part of the Appalachian Mountains. The town is located at an elevation of 1,068 feet (325 meters) above sea level.
The town is bordered by the boroughs of Carbondale to the north, Archbald to the east, and Blakely to the south. The town is also bordered by the townships of Scott to the west and Fell to the northwest.
The town is located in the Pocono Mountains region of Pennsylvania. The area is known for its scenic beauty, with rolling hills, forests, and streams. The town is also located near several state parks, including Promised Land State Park and Lackawanna State Park.
Economy
Simpson is a small, rural community with a population of just over 1,000 people. The town is home to a number of small businesses, including a grocery store, a hardware store, and a few restaurants.
The town is also home to a number of manufacturing companies, including a plastics manufacturer, a metal fabricator, and a printing company. The town is also home to a number of service-based businesses, including a law firm, a real estate agency, and a financial services company.
The town is also home to a number of tourist attractions, including the Lackawanna Coal Mine Tour, the Steamtown National Historic Site, and the Lackawanna Valley Railroad Museum.
Demographics
As of the 2010 census, the population of Simpson was 1,072. The racial makeup of the town was 97.2% White, 0.9% African American, 0.3% Native American, 0.3% Asian, and 0.9% from two or more races. Hispanic or Latino of any race were 1.2% of the population.
The median household income in Simpson was $41,250, and the median family income was $50,000. The per capita income for the town was $20,845. About 11.2% of families and 14.2% of the population were below the poverty line, including 18.2% of those under age 18 and 8.3% of those age 65 or over.
Common Questions
What is Per Capita Income in Simpson?
Per Capita income in Simpson is $30,010.
What is the Median Family Income in Simpson?
Median Family Income in Simpson is $62,014.
What is the Median Household income in Simpson?
Median Household Income in Simpson is $44,639.
What is Income or Wage Gap in Simpson?
Income or Wage Gap in Simpson is 10.0%.
Women in Simpson earn 90.0 cents for every dollar earned by a man.
What is Inequality or Gini Index in Simpson?
Inequality or Gini Index in Simpson is 0.45.
What is the Total Population of Simpson?
Total Population of Simpson is 1,147.
What is the Total Male Population of Simpson?
Total Male Population of Simpson is 556.
What is the Total Female Population of Simpson?
Total Female Population of Simpson is 591.
What is the Ratio of Males per 100 Females in Simpson?
There are 94.08 Males per 100 Females in Simpson.
What is the Ratio of Females per 100 Males in Simpson?
There are 106.29 Females per 100 Males in Simpson.
What is the Median Population Age in Simpson?
Median Population Age in Simpson is 43.3 Years.
What is the Average Family Size in Simpson
Average Family Size in Simpson is 3.1 People.
What is the Average Household Size in Simpson
Average Household Size in Simpson is 2.4 People.
How Large is the Labor Force in Simpson?
There are 582 People in the Labor Forcein in Simpson.
What is the Percentage of People in the Labor Force in Simpson?
61.5% of People are in the Labor Force in Simpson.
What is the Unemployment Rate in Simpson?
Unemployment Rate in Simpson is 1.9%.