Newville borough, PA Map & Demographics
Newville borough Overview
$26,067
PER CAPITA INCOME
$58,000
AVG FAMILY INCOME
$59,875
AVG HOUSEHOLD INCOME
17.1%
WAGE / INCOME GAP [ % ]
82.9¢/ $1
WAGE / INCOME GAP [ $ ]
0.32
INEQUALITY / GINI INDEX
1,359
TOTAL POPULATION
717
MALE POPULATION
642
FEMALE POPULATION
111.68
MALES / 100 FEMALES
89.54
FEMALES / 100 MALES
35.6
MEDIAN AGE
2.8
AVG FAMILY SIZE
2.5
AVG HOUSEHOLD SIZE
792
LABOR FORCE [ PEOPLE ]
70.6%
PERCENT IN LABOR FORCE
3.3%
UNEMPLOYMENT RATE
Income in Newville borough
Income Overview in Newville borough
Per Capita Income in Newville borough is $26,067, while median incomes of families and households are $58,000 and $59,875 respectively.
| Characteristic | Number | Measure |
| Per Capita Income | 1,359 | $26,067 |
| Median Family Income | 342 | $58,000 |
| Mean Family Income | 342 | $63,675 |
| Median Household Income | 533 | $59,875 |
| Mean Household Income | 533 | $63,902 |
| Income Deficit | 342 | $0 |
| Wage / Income Gap (%) | 1,359 | 17.13% |
| Wage / Income Gap ($) | 1,359 | 82.87¢ per $1 |
| Gini / Inequality Index | 1,359 | 0.32 |
Earnings by Sex in Newville borough
Average Earnings in Newville borough are $31,442, $35,446 for men and $29,375 for women, a difference of 17.1%.
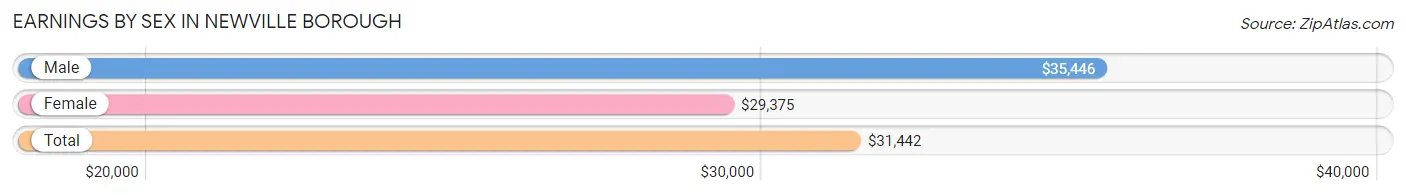
| Sex | Number | Average Earnings |
| Male | 519 (57.3%) | $35,446 |
| Female | 387 (42.7%) | $29,375 |
| Total | 906 (100.0%) | $31,442 |
Earnings by Sex by Income Bracket in Newville borough
The most common earnings brackets in Newville borough are $35,000 to $39,999 for men (85 | 16.4%) and $35,000 to $39,999 for women (62 | 16.0%).
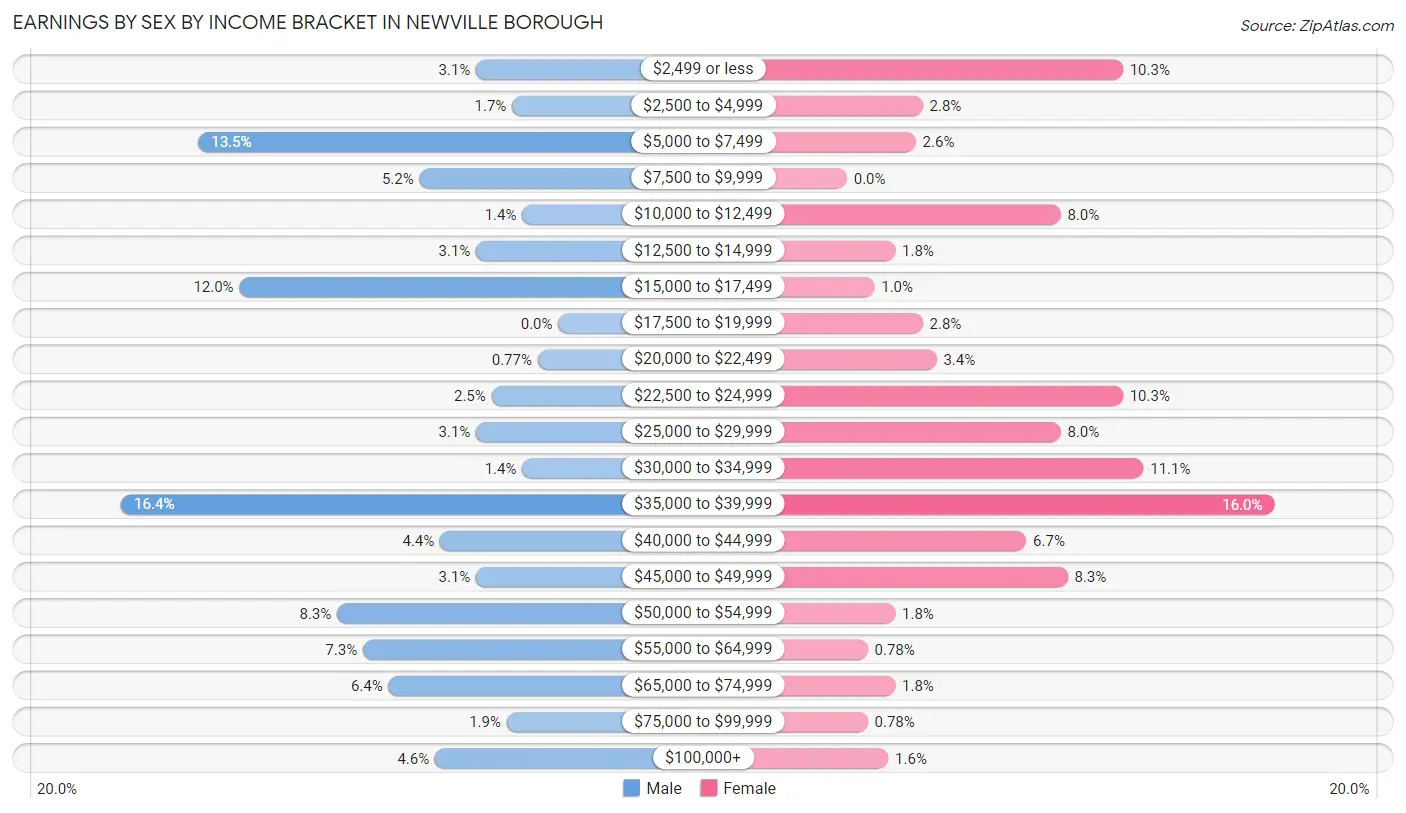
| Income | Male | Female |
| $2,499 or less | 16 (3.1%) | 40 (10.3%) |
| $2,500 to $4,999 | 9 (1.7%) | 11 (2.8%) |
| $5,000 to $7,499 | 70 (13.5%) | 10 (2.6%) |
| $7,500 to $9,999 | 27 (5.2%) | 0 (0.0%) |
| $10,000 to $12,499 | 7 (1.3%) | 31 (8.0%) |
| $12,500 to $14,999 | 16 (3.1%) | 7 (1.8%) |
| $15,000 to $17,499 | 62 (11.9%) | 4 (1.0%) |
| $17,500 to $19,999 | 0 (0.0%) | 11 (2.8%) |
| $20,000 to $22,499 | 4 (0.8%) | 13 (3.4%) |
| $22,500 to $24,999 | 13 (2.5%) | 40 (10.3%) |
| $25,000 to $29,999 | 16 (3.1%) | 31 (8.0%) |
| $30,000 to $34,999 | 7 (1.3%) | 43 (11.1%) |
| $35,000 to $39,999 | 85 (16.4%) | 62 (16.0%) |
| $40,000 to $44,999 | 23 (4.4%) | 26 (6.7%) |
| $45,000 to $49,999 | 16 (3.1%) | 32 (8.3%) |
| $50,000 to $54,999 | 43 (8.3%) | 7 (1.8%) |
| $55,000 to $64,999 | 38 (7.3%) | 3 (0.8%) |
| $65,000 to $74,999 | 33 (6.4%) | 7 (1.8%) |
| $75,000 to $99,999 | 10 (1.9%) | 3 (0.8%) |
| $100,000+ | 24 (4.6%) | 6 (1.5%) |
| Total | 519 (100.0%) | 387 (100.0%) |
Earnings by Sex by Educational Attainment in Newville borough
Average earnings in Newville borough are $43,393 for men and $32,875 for women, a difference of 24.2%. Men with an educational attainment of bachelor's degree enjoy the highest average annual earnings of $68,281, while those with high school diploma education earn the least with $37,385. Women with an educational attainment of graduate degree earn the most with the average annual earnings of $46,563, while those with college or associate's degree education have the smallest earnings of $27,083.
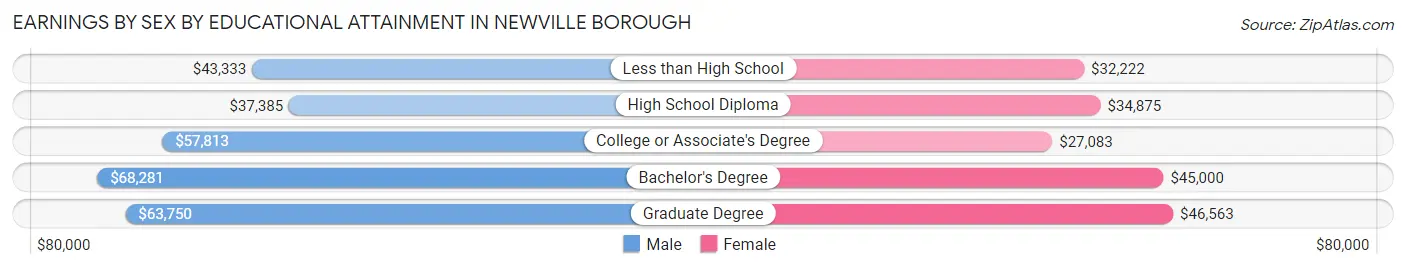
| Educational Attainment | Male Income | Female Income |
| Less than High School | $43,333 | $32,222 |
| High School Diploma | $37,385 | $34,875 |
| College or Associate's Degree | $57,813 | $27,083 |
| Bachelor's Degree | $68,281 | $45,000 |
| Graduate Degree | $63,750 | $46,563 |
| Total | $43,393 | $32,875 |
Family Income in Newville borough
Family Income Brackets in Newville borough
According to the Newville borough family income data, there are 105 families falling into the $50,000 to $74,999 income range, which is the most common income bracket and makes up 30.7% of all families.
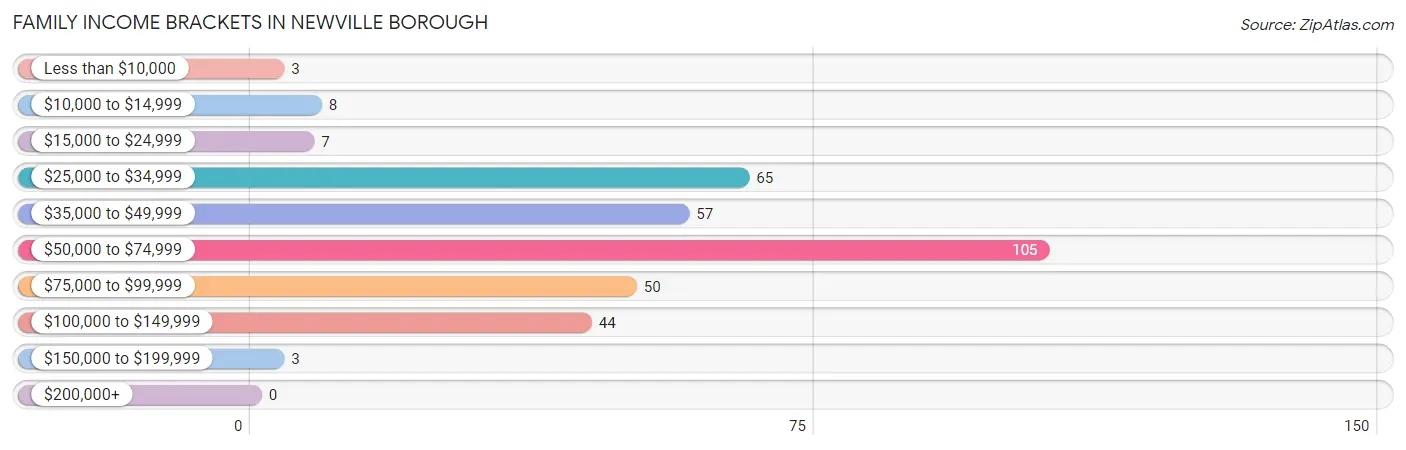
| Income Bracket | # Families | % Families |
| Less than $10,000 | 3 | 0.9% |
| $10,000 to $14,999 | 8 | 2.3% |
| $15,000 to $24,999 | 7 | 2.0% |
| $25,000 to $34,999 | 65 | 19.0% |
| $35,000 to $49,999 | 57 | 16.7% |
| $50,000 to $74,999 | 105 | 30.7% |
| $75,000 to $99,999 | 50 | 14.6% |
| $100,000 to $149,999 | 44 | 12.9% |
| $150,000 to $199,999 | 3 | 0.9% |
| $200,000+ | 0 | 0.0% |
Family Income by Famaliy Size in Newville borough
3-person families (125 | 36.5%) account for the highest median family income in Newville borough with $61,023 per family, while 2-person families (181 | 52.9%) have the highest median income of $21,144 per family member.
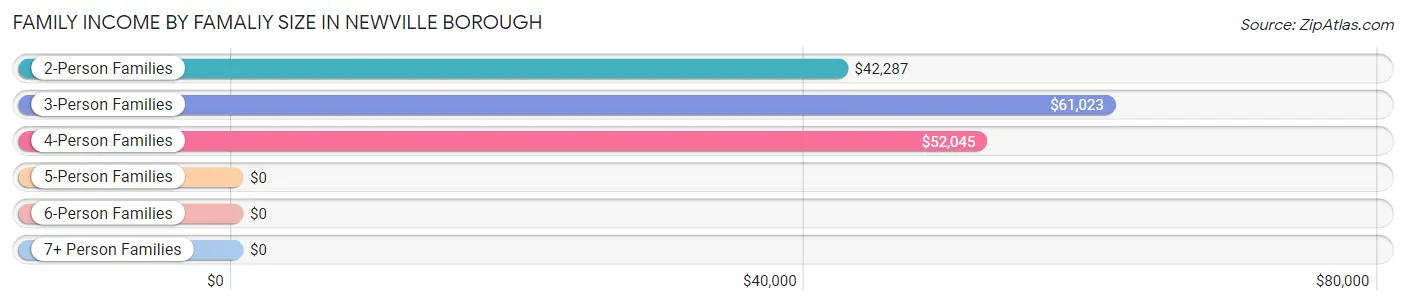
| Income Bracket | # Families | Median Income |
| 2-Person Families | 181 (52.9%) | $42,287 |
| 3-Person Families | 125 (36.5%) | $61,023 |
| 4-Person Families | 22 (6.4%) | $52,045 |
| 5-Person Families | 3 (0.9%) | $0 |
| 6-Person Families | 11 (3.2%) | $0 |
| 7+ Person Families | 0 (0.0%) | $0 |
| Total | 342 (100.0%) | $58,000 |
Family Income by Number of Earners in Newville borough
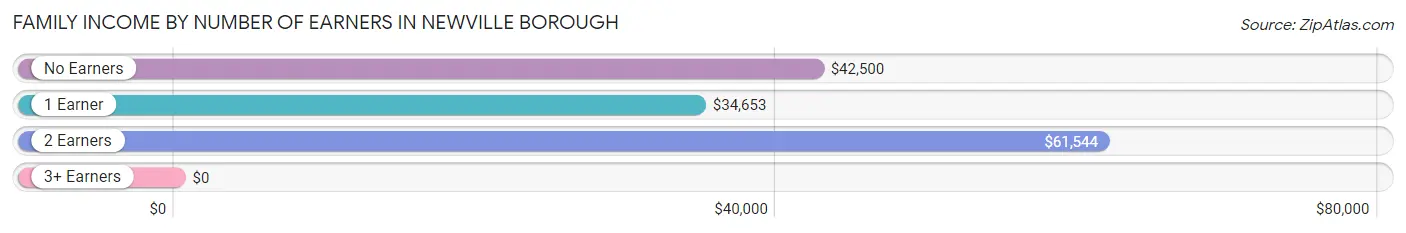
| Number of Earners | # Families | Median Income |
| No Earners | 28 (8.2%) | $42,500 |
| 1 Earner | 103 (30.1%) | $34,653 |
| 2 Earners | 191 (55.8%) | $61,544 |
| 3+ Earners | 20 (5.9%) | $0 |
| Total | 342 (100.0%) | $58,000 |
Household Income in Newville borough
Household Income Brackets in Newville borough
With 149 households falling in the category, the $50,000 to $74,999 income range is the most frequent in Newville borough, accounting for 28.0% of all households.
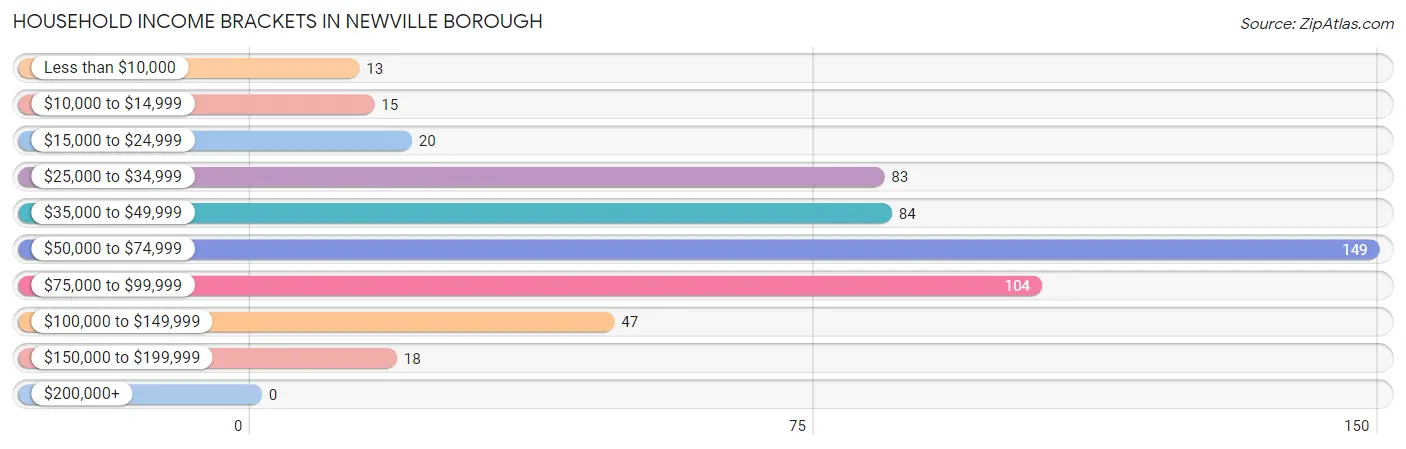
| Income Bracket | # Households | % Households |
| Less than $10,000 | 13 | 2.4% |
| $10,000 to $14,999 | 15 | 2.8% |
| $15,000 to $24,999 | 20 | 3.8% |
| $25,000 to $34,999 | 83 | 15.6% |
| $35,000 to $49,999 | 84 | 15.8% |
| $50,000 to $74,999 | 149 | 28.0% |
| $75,000 to $99,999 | 104 | 19.5% |
| $100,000 to $149,999 | 47 | 8.8% |
| $150,000 to $199,999 | 18 | 3.4% |
| $200,000+ | 0 | 0.0% |
Household Income by Householder Age in Newville borough
The median household income in Newville borough is $59,875, with the highest median household income of $67,222 found in the 45 to 64 years age bracket for the primary householder. A total of 222 households (41.6%) fall into this category. Meanwhile, the 15 to 24 years age bracket for the primary householder has the lowest median household income of $41,964, with 27 households (5.1%) in this group.
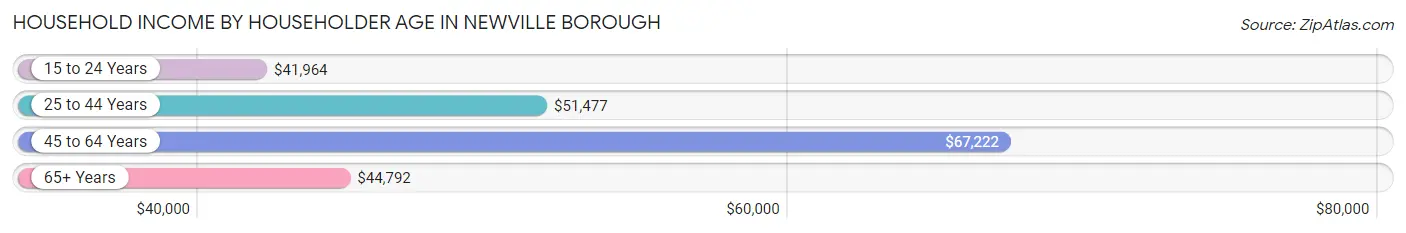
| Income Bracket | # Households | Median Income |
| 15 to 24 Years | 27 (5.1%) | $41,964 |
| 25 to 44 Years | 197 (37.0%) | $51,477 |
| 45 to 64 Years | 222 (41.6%) | $67,222 |
| 65+ Years | 87 (16.3%) | $44,792 |
| Total | 533 (100.0%) | $59,875 |
Poverty in Newville borough
Income Below Poverty by Sex and Age in Newville borough
With 7.7% poverty level for males and 10.9% for females among the residents of Newville borough, under 5 year old males and 18 to 24 year old females are the most vulnerable to poverty, with 14 males (34.2%) and 31 females (35.2%) in their respective age groups living below the poverty level.
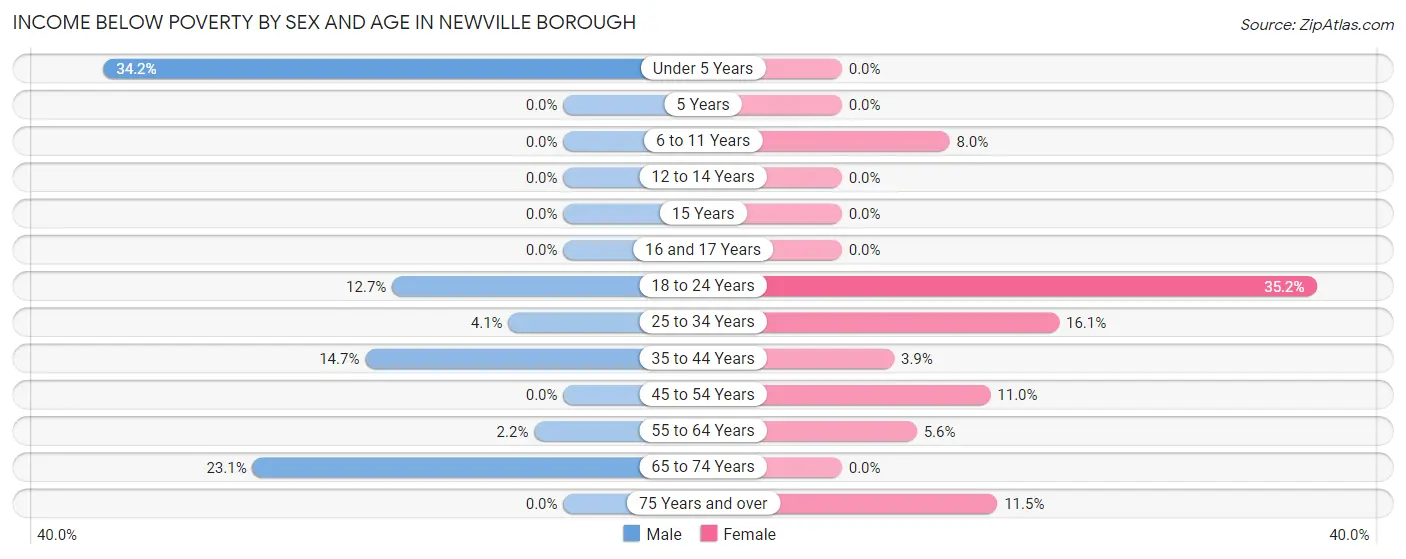
| Age Bracket | Male | Female |
| Under 5 Years | 14 (34.2%) | 0 (0.0%) |
| 5 Years | 0 (0.0%) | 0 (0.0%) |
| 6 to 11 Years | 0 (0.0%) | 4 (8.0%) |
| 12 to 14 Years | 0 (0.0%) | 0 (0.0%) |
| 15 Years | 0 (0.0%) | 0 (0.0%) |
| 16 and 17 Years | 0 (0.0%) | 0 (0.0%) |
| 18 to 24 Years | 15 (12.7%) | 31 (35.2%) |
| 25 to 34 Years | 4 (4.1%) | 10 (16.1%) |
| 35 to 44 Years | 10 (14.7%) | 4 (3.9%) |
| 45 to 54 Years | 0 (0.0%) | 15 (11.0%) |
| 55 to 64 Years | 3 (2.2%) | 3 (5.6%) |
| 65 to 74 Years | 9 (23.1%) | 0 (0.0%) |
| 75 Years and over | 0 (0.0%) | 3 (11.5%) |
| Total | 55 (7.7%) | 70 (10.9%) |
Income Above Poverty by Sex and Age in Newville borough
According to the poverty statistics in Newville borough, males aged 5 years and females aged under 5 years are the age groups that are most secure financially, with 100.0% of males and 100.0% of females in these age groups living above the poverty line.
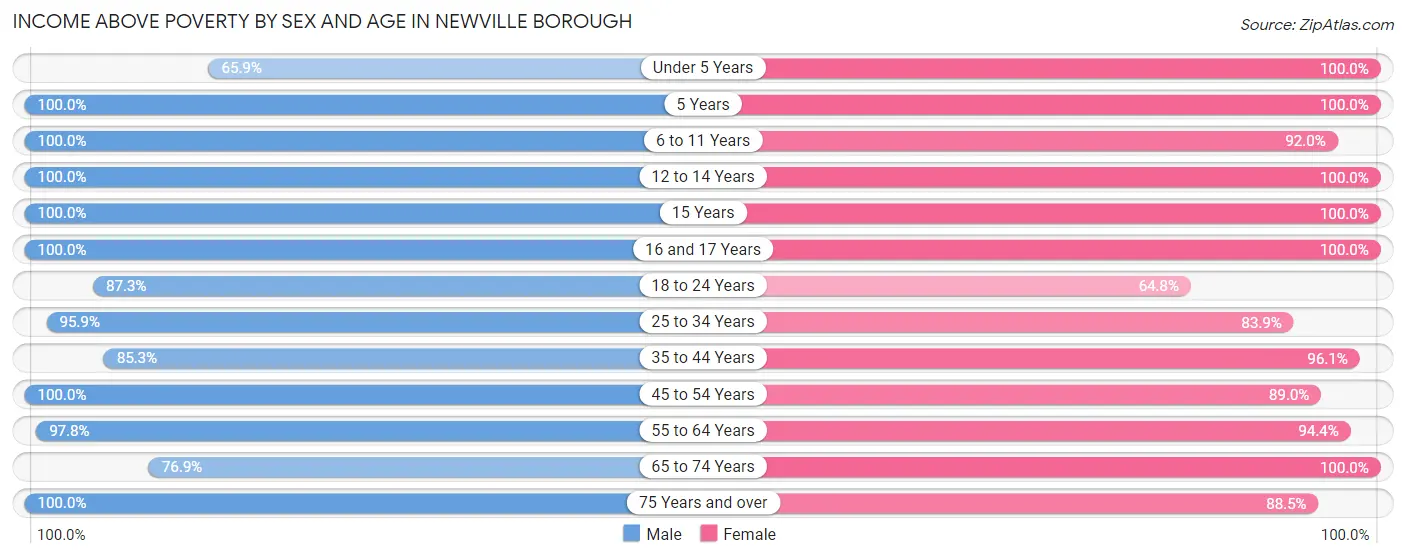
| Age Bracket | Male | Female |
| Under 5 Years | 27 (65.8%) | 32 (100.0%) |
| 5 Years | 4 (100.0%) | 15 (100.0%) |
| 6 to 11 Years | 42 (100.0%) | 46 (92.0%) |
| 12 to 14 Years | 27 (100.0%) | 10 (100.0%) |
| 15 Years | 3 (100.0%) | 13 (100.0%) |
| 16 and 17 Years | 61 (100.0%) | 8 (100.0%) |
| 18 to 24 Years | 103 (87.3%) | 57 (64.8%) |
| 25 to 34 Years | 94 (95.9%) | 52 (83.9%) |
| 35 to 44 Years | 58 (85.3%) | 99 (96.1%) |
| 45 to 54 Years | 56 (100.0%) | 121 (89.0%) |
| 55 to 64 Years | 136 (97.8%) | 51 (94.4%) |
| 65 to 74 Years | 30 (76.9%) | 45 (100.0%) |
| 75 Years and over | 21 (100.0%) | 23 (88.5%) |
| Total | 662 (92.3%) | 572 (89.1%) |
Income Below Poverty Among Married-Couple Families in Newville borough
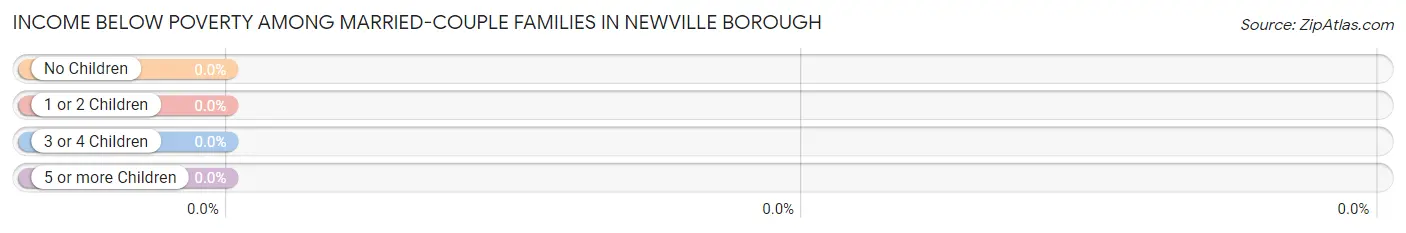
| Children | Above Poverty | Below Poverty |
| No Children | 113 (100.0%) | 0 (0.0%) |
| 1 or 2 Children | 55 (100.0%) | 0 (0.0%) |
| 3 or 4 Children | 14 (100.0%) | 0 (0.0%) |
| 5 or more Children | 0 (0.0%) | 0 (0.0%) |
| Total | 182 (100.0%) | 0 (0.0%) |
Income Below Poverty Among Single-Parent Households in Newville borough
According to the poverty data in Newville borough, 9.1% or 3 single-father households and 6.3% or 8 single-mother households are living below the poverty line. Among single-father households, those with 1 or 2 children have the highest poverty rate, with 3 households (13.6%) experiencing poverty. Likewise, among single-mother households, those with 1 or 2 children have the highest poverty rate, with 8 households (7.5%) falling below the poverty line.
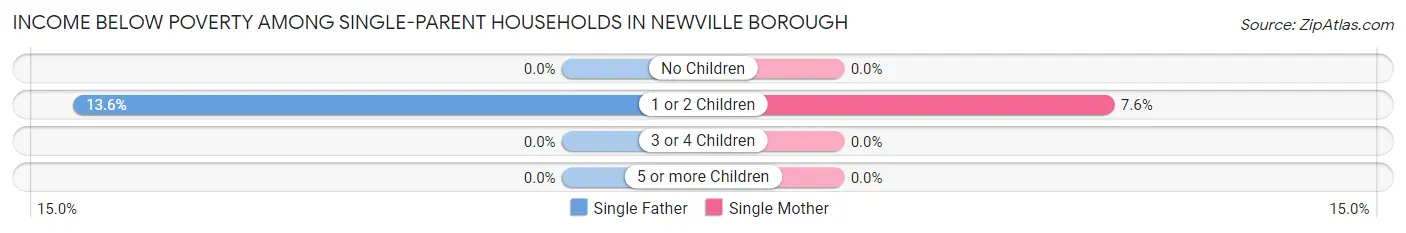
| Children | Single Father | Single Mother |
| No Children | 0 (0.0%) | 0 (0.0%) |
| 1 or 2 Children | 3 (13.6%) | 8 (7.5%) |
| 3 or 4 Children | 0 (0.0%) | 0 (0.0%) |
| 5 or more Children | 0 (0.0%) | 0 (0.0%) |
| Total | 3 (9.1%) | 8 (6.3%) |
Income Below Poverty Among Married-Couple vs Single-Parent Households in Newville borough
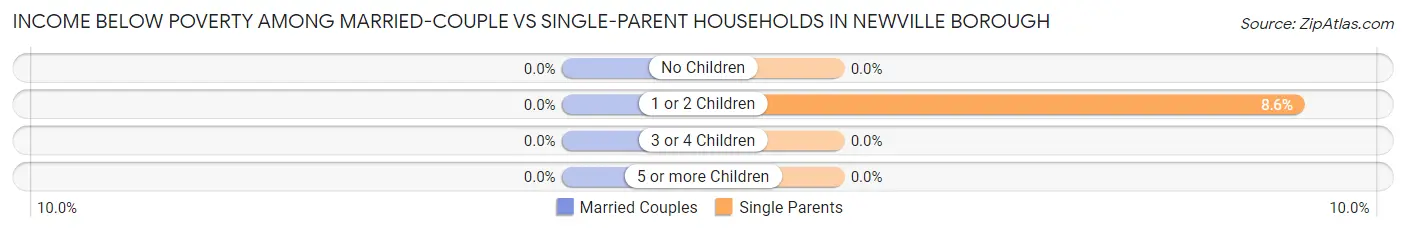
| Children | Married-Couple Families | Single-Parent Households |
| No Children | 0 (0.0%) | 0 (0.0%) |
| 1 or 2 Children | 0 (0.0%) | 11 (8.6%) |
| 3 or 4 Children | 0 (0.0%) | 0 (0.0%) |
| 5 or more Children | 0 (0.0%) | 0 (0.0%) |
| Total | 0 (0.0%) | 11 (6.9%) |
Race in Newville borough
The most populous races in Newville borough are White / Caucasian (1,243 | 91.5%), Hispanic or Latino (68 | 5.0%), and Two or more Races (48 | 3.5%).
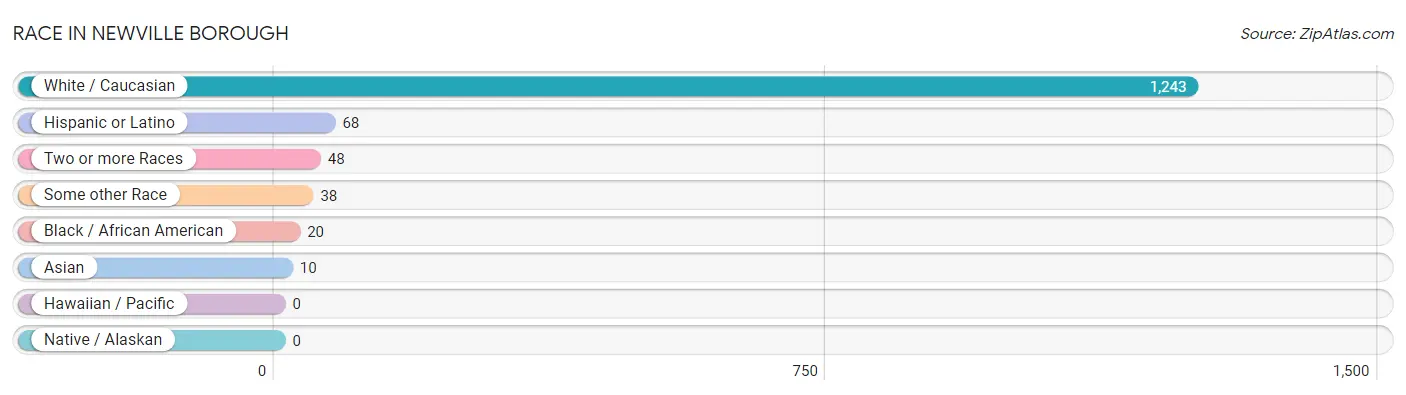
| Race | # Population | % Population |
| Asian | 10 | 0.7% |
| Black / African American | 20 | 1.5% |
| Hawaiian / Pacific | 0 | 0.0% |
| Hispanic or Latino | 68 | 5.0% |
| Native / Alaskan | 0 | 0.0% |
| White / Caucasian | 1,243 | 91.5% |
| Two or more Races | 48 | 3.5% |
| Some other Race | 38 | 2.8% |
| Total | 1,359 | 100.0% |
Ancestry in Newville borough
The most populous ancestries reported in Newville borough are German (458 | 33.7%), American (127 | 9.3%), Irish (104 | 7.6%), English (70 | 5.1%), and Dutch (66 | 4.9%), together accounting for 60.7% of all Newville borough residents.
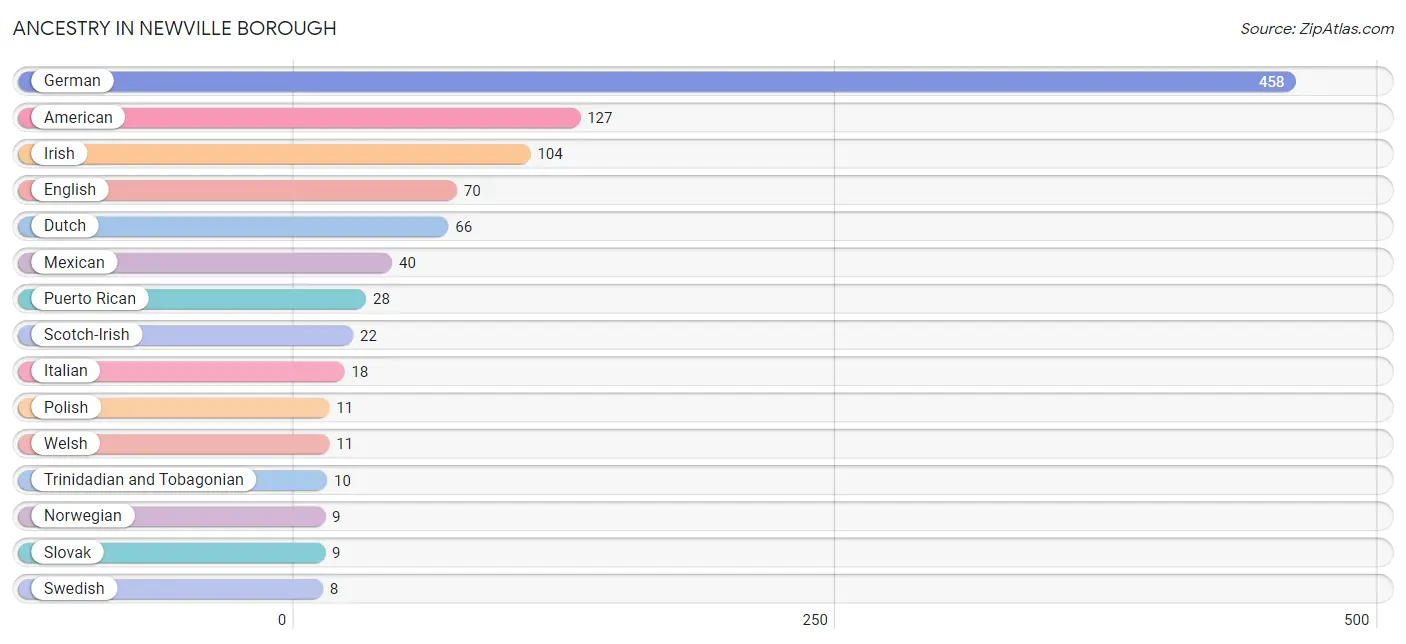
| Ancestry | # Population | % Population |
| American | 127 | 9.3% |
| Arab | 3 | 0.2% |
| British | 3 | 0.2% |
| Dutch | 66 | 4.9% |
| English | 70 | 5.1% |
| European | 4 | 0.3% |
| French | 5 | 0.4% |
| French Canadian | 7 | 0.5% |
| German | 458 | 33.7% |
| Greek | 4 | 0.3% |
| Hungarian | 4 | 0.3% |
| Irish | 104 | 7.6% |
| Italian | 18 | 1.3% |
| Mexican | 40 | 2.9% |
| Norwegian | 9 | 0.7% |
| Pennsylvania German | 3 | 0.2% |
| Polish | 11 | 0.8% |
| Puerto Rican | 28 | 2.1% |
| Romanian | 3 | 0.2% |
| Russian | 4 | 0.3% |
| Scotch-Irish | 22 | 1.6% |
| Scottish | 1 | 0.1% |
| Slovak | 9 | 0.7% |
| Swedish | 8 | 0.6% |
| Swiss | 8 | 0.6% |
| Syrian | 3 | 0.2% |
| Trinidadian and Tobagonian | 10 | 0.7% |
| Ukrainian | 3 | 0.2% |
| Welsh | 11 | 0.8% | View All 29 Rows |
Immigrants in Newville borough
The most numerous immigrant groups reported in Newville borough came from Central America (23 | 1.7%), Latin America (23 | 1.7%), Mexico (23 | 1.7%), Europe (16 | 1.2%), and Eastern Europe (13 | 1.0%), together accounting for 7.2% of all Newville borough residents.
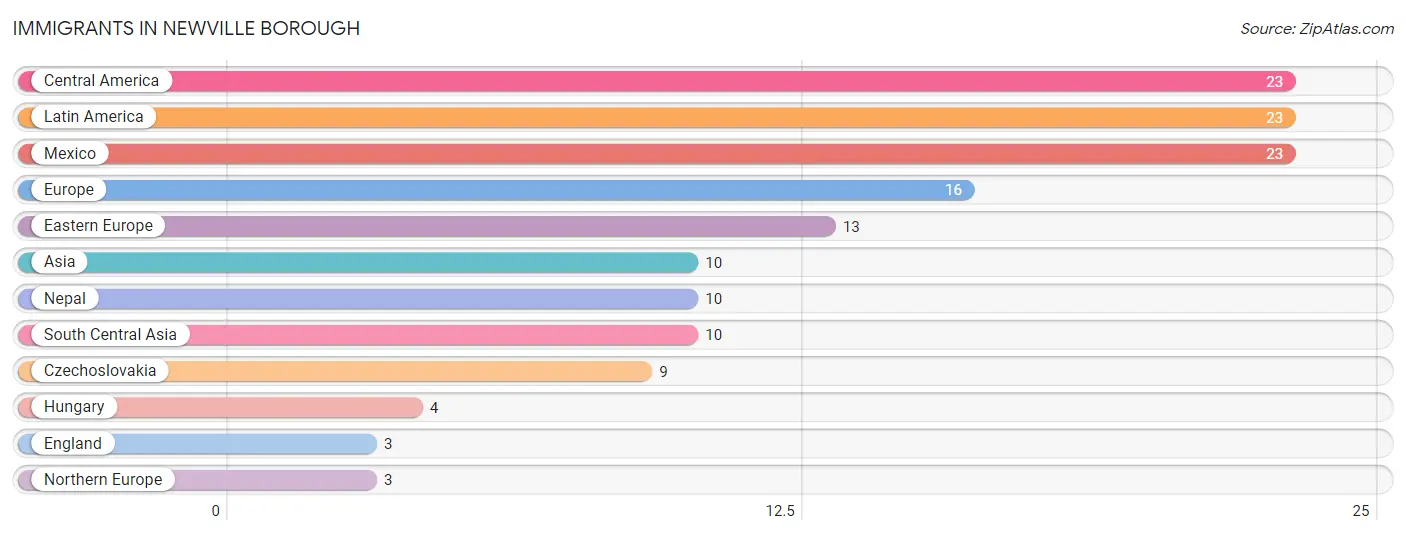
| Immigration Origin | # Population | % Population |
| Asia | 10 | 0.7% |
| Central America | 23 | 1.7% |
| Czechoslovakia | 9 | 0.7% |
| Eastern Europe | 13 | 1.0% |
| England | 3 | 0.2% |
| Europe | 16 | 1.2% |
| Hungary | 4 | 0.3% |
| Latin America | 23 | 1.7% |
| Mexico | 23 | 1.7% |
| Nepal | 10 | 0.7% |
| Northern Europe | 3 | 0.2% |
| South Central Asia | 10 | 0.7% | View All 12 Rows |
Sex and Age in Newville borough
Sex and Age in Newville borough
The most populous age groups in Newville borough are 15 to 19 Years (139 | 19.4%) for men and 20 to 24 Years (78 | 12.1%) for women.
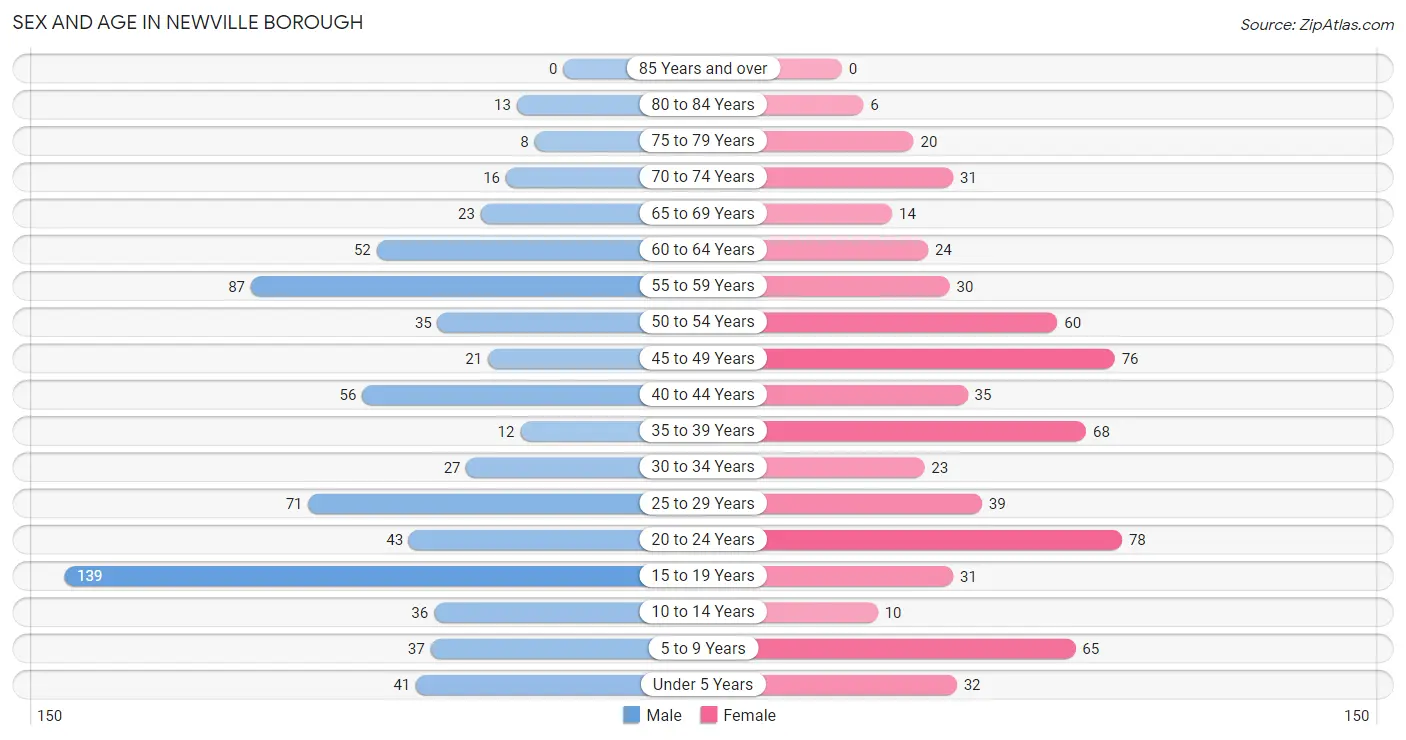
| Age Bracket | Male | Female |
| Under 5 Years | 41 (5.7%) | 32 (5.0%) |
| 5 to 9 Years | 37 (5.2%) | 65 (10.1%) |
| 10 to 14 Years | 36 (5.0%) | 10 (1.6%) |
| 15 to 19 Years | 139 (19.4%) | 31 (4.8%) |
| 20 to 24 Years | 43 (6.0%) | 78 (12.1%) |
| 25 to 29 Years | 71 (9.9%) | 39 (6.1%) |
| 30 to 34 Years | 27 (3.8%) | 23 (3.6%) |
| 35 to 39 Years | 12 (1.7%) | 68 (10.6%) |
| 40 to 44 Years | 56 (7.8%) | 35 (5.4%) |
| 45 to 49 Years | 21 (2.9%) | 76 (11.8%) |
| 50 to 54 Years | 35 (4.9%) | 60 (9.3%) |
| 55 to 59 Years | 87 (12.1%) | 30 (4.7%) |
| 60 to 64 Years | 52 (7.2%) | 24 (3.7%) |
| 65 to 69 Years | 23 (3.2%) | 14 (2.2%) |
| 70 to 74 Years | 16 (2.2%) | 31 (4.8%) |
| 75 to 79 Years | 8 (1.1%) | 20 (3.1%) |
| 80 to 84 Years | 13 (1.8%) | 6 (0.9%) |
| 85 Years and over | 0 (0.0%) | 0 (0.0%) |
| Total | 717 (100.0%) | 642 (100.0%) |
Families and Households in Newville borough
Median Family Size in Newville borough
The median family size in Newville borough is 2.75 persons per family, with married-couple families (182 | 53.2%) accounting for the largest median family size of 2.95 persons per family. On the other hand, single male/father families (33 | 9.7%) represent the smallest median family size with 2.33 persons per family.
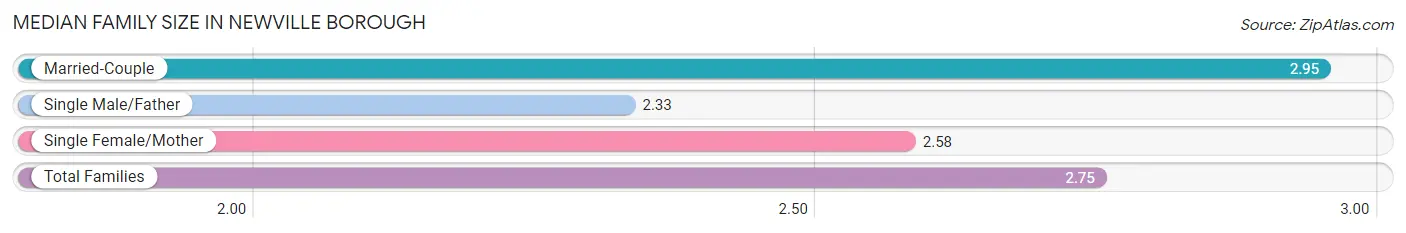
| Family Type | # Families | Family Size |
| Married-Couple | 182 (53.2%) | 2.95 |
| Single Male/Father | 33 (9.7%) | 2.33 |
| Single Female/Mother | 127 (37.1%) | 2.58 |
| Total Families | 342 (100.0%) | 2.75 |
Median Household Size in Newville borough
The median household size in Newville borough is 2.55 persons per household, with single female/mother households (127 | 23.8%) accounting for the largest median household size of 3.61 persons per household. non-family households (191 | 35.8%) represent the smallest median household size with 1.28 persons per household.
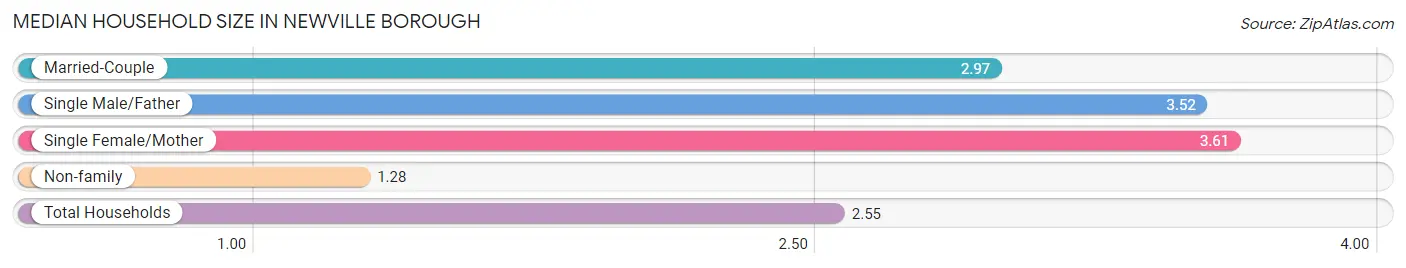
| Household Type | # Households | Household Size |
| Married-Couple | 182 (34.2%) | 2.97 |
| Single Male/Father | 33 (6.2%) | 3.52 |
| Single Female/Mother | 127 (23.8%) | 3.61 |
| Non-family | 191 (35.8%) | 1.28 |
| Total Households | 533 (100.0%) | 2.55 |
Household Size by Marriage Status in Newville borough
Out of a total of 533 households in Newville borough, 342 (64.2%) are family households, while 191 (35.8%) are nonfamily households. The most numerous type of family households are 2-person households, comprising 122, and the most common type of nonfamily households are 1-person households, comprising 142.
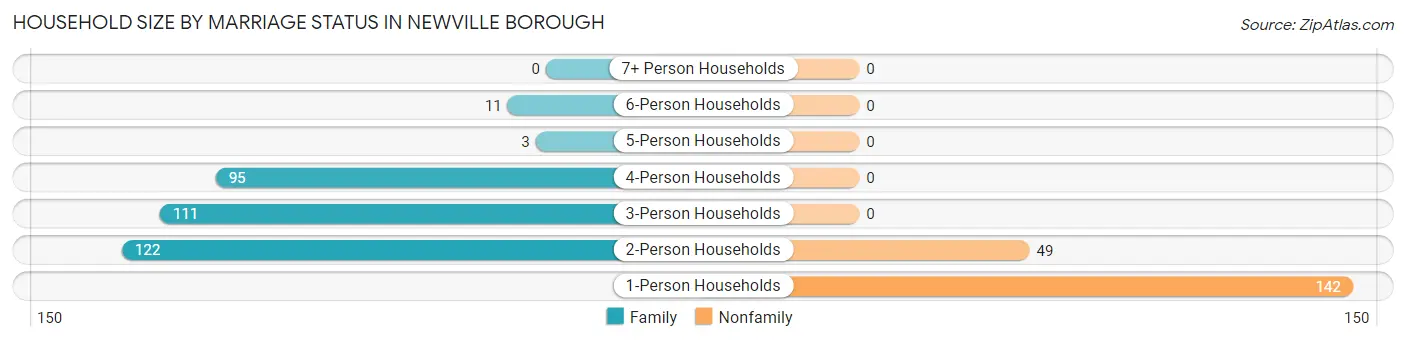
| Household Size | Family Households | Nonfamily Households |
| 1-Person Households | - | 142 (26.6%) |
| 2-Person Households | 122 (22.9%) | 49 (9.2%) |
| 3-Person Households | 111 (20.8%) | 0 (0.0%) |
| 4-Person Households | 95 (17.8%) | 0 (0.0%) |
| 5-Person Households | 3 (0.6%) | 0 (0.0%) |
| 6-Person Households | 11 (2.1%) | 0 (0.0%) |
| 7+ Person Households | 0 (0.0%) | 0 (0.0%) |
| Total | 342 (64.2%) | 191 (35.8%) |
Female Fertility in Newville borough
Fertility by Age in Newville borough
Average fertility rate in Newville borough is 47.0 births per 1,000 women. Women in the age bracket of 20 to 34 years have the highest fertility rate with 121.0 births per 1,000 women. Women in the age bracket of 20 to 34 years acount for 100.0% of all women with births.
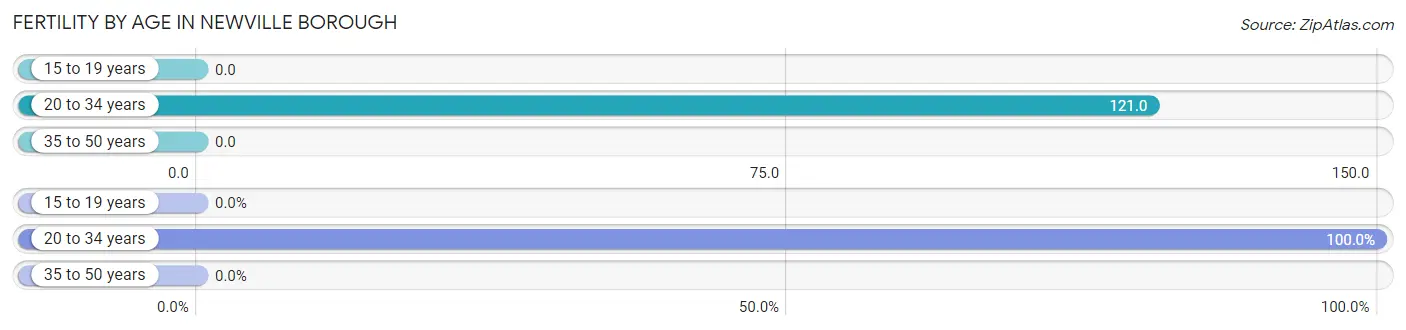
| Age Bracket | Women with Births | Births / 1,000 Women |
| 15 to 19 years | 0 (0.0%) | 0.0 |
| 20 to 34 years | 17 (100.0%) | 121.0 |
| 35 to 50 years | 0 (0.0%) | 0.0 |
| Total | 17 (100.0%) | 47.0 |
Fertility by Age by Marriage Status in Newville borough
58.8% of women with births (17) in Newville borough are married. The highest percentage of unmarried women with births falls into 20 to 34 years age bracket with 41.2% of them unmarried at the time of birth, while the lowest percentage of unmarried women with births belong to 20 to 34 years age bracket with 41.2% of them unmarried.
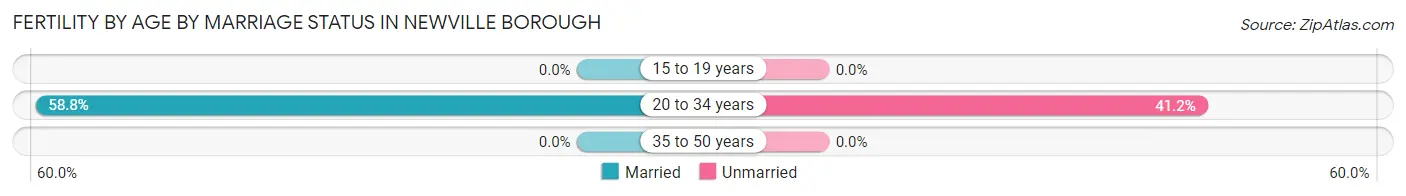
| Age Bracket | Married | Unmarried |
| 15 to 19 years | 0 (0.0%) | 0 (0.0%) |
| 20 to 34 years | 10 (58.8%) | 7 (41.2%) |
| 35 to 50 years | 0 (0.0%) | 0 (0.0%) |
| Total | 10 (58.8%) | 7 (41.2%) |
Fertility by Education in Newville borough
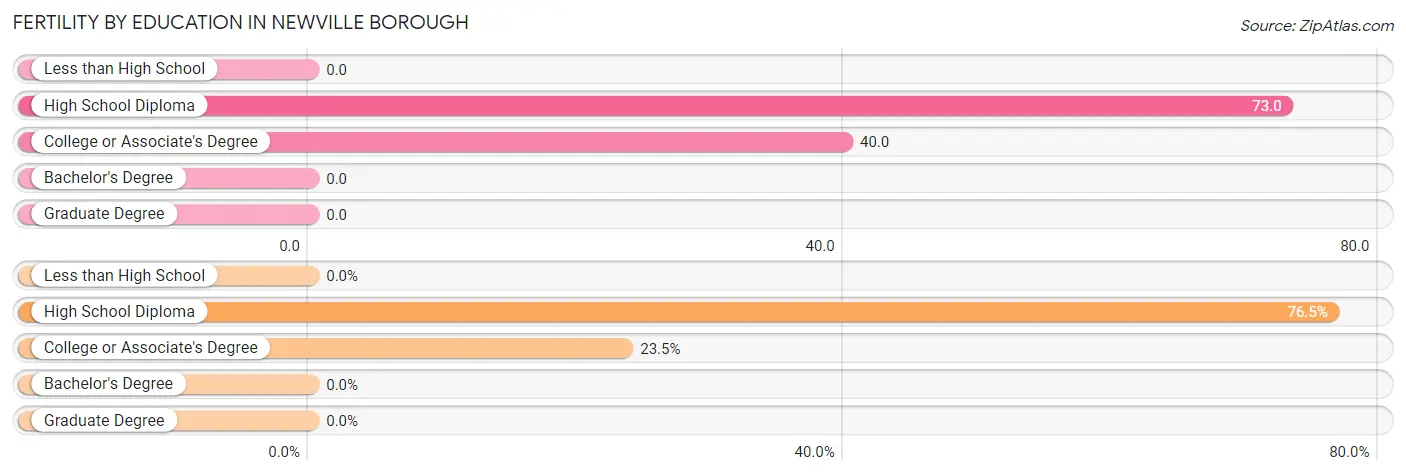
| Educational Attainment | Women with Births | Births / 1,000 Women |
| Less than High School | 0 (0.0%) | 0.0 |
| High School Diploma | 13 (76.5%) | 73.0 |
| College or Associate's Degree | 4 (23.5%) | 40.0 |
| Bachelor's Degree | 0 (0.0%) | 0.0 |
| Graduate Degree | 0 (0.0%) | 0.0 |
| Total | 17 (100.0%) | 47.0 |
Fertility by Education by Marriage Status in Newville borough
41.2% of women with births in Newville borough are unmarried. Women with the educational attainment of high school diploma are most likely to be married with 76.9% of them married at childbirth, while women with the educational attainment of college or associate's degree are least likely to be married with 100.0% of them unmarried at childbirth.
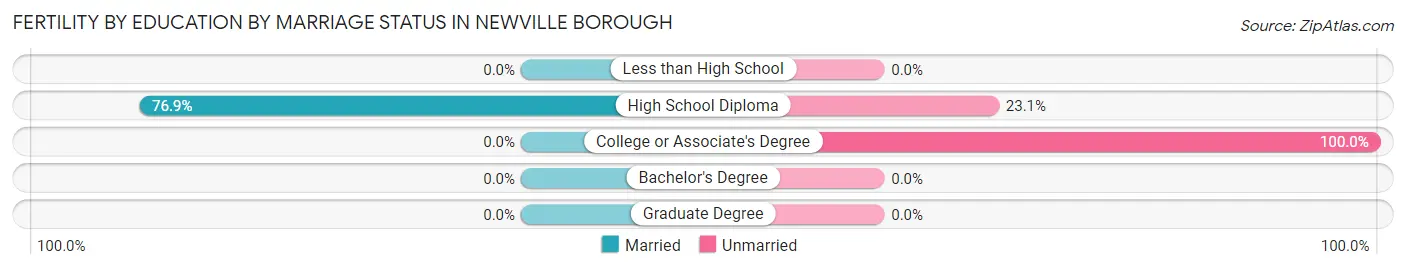
| Educational Attainment | Married | Unmarried |
| Less than High School | 0 (0.0%) | 0 (0.0%) |
| High School Diploma | 10 (76.9%) | 3 (23.1%) |
| College or Associate's Degree | 0 (0.0%) | 4 (100.0%) |
| Bachelor's Degree | 0 (0.0%) | 0 (0.0%) |
| Graduate Degree | 0 (0.0%) | 0 (0.0%) |
| Total | 10 (58.8%) | 7 (41.2%) |
Employment Characteristics in Newville borough
Employment by Class of Employer in Newville borough
Among the 753 employed individuals in Newville borough, private company employees (554 | 73.6%), not-for-profit organizations (103 | 13.7%), and local government employees (43 | 5.7%) make up the most common classes of employment.
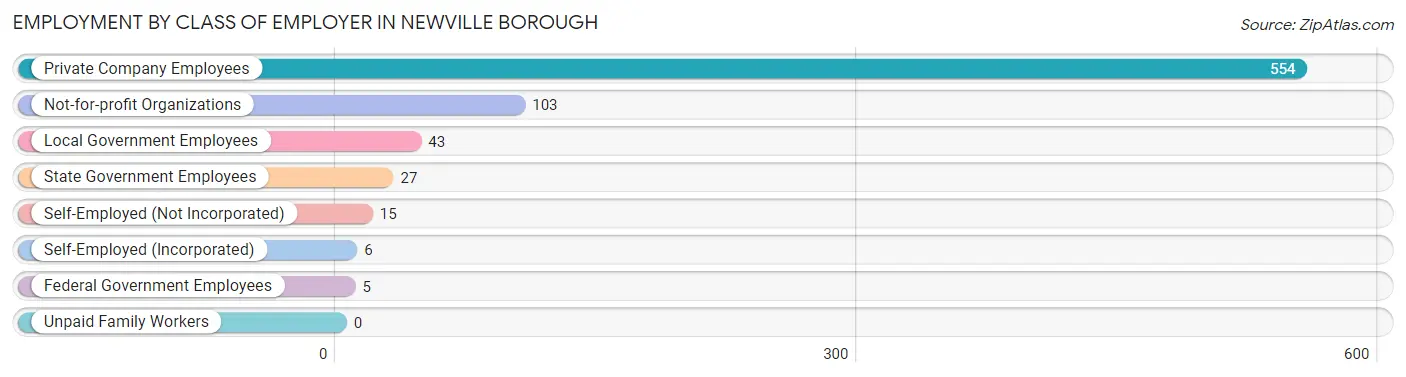
| Employer Class | # Employees | % Employees |
| Private Company Employees | 554 | 73.6% |
| Self-Employed (Incorporated) | 6 | 0.8% |
| Self-Employed (Not Incorporated) | 15 | 2.0% |
| Not-for-profit Organizations | 103 | 13.7% |
| Local Government Employees | 43 | 5.7% |
| State Government Employees | 27 | 3.6% |
| Federal Government Employees | 5 | 0.7% |
| Unpaid Family Workers | 0 | 0.0% |
| Total | 753 | 100.0% |
Employment Status by Age in Newville borough
According to the labor force statistics for Newville borough, out of the total population over 16 years of age (1,122), 70.6% or 792 individuals are in the labor force, with 3.3% or 26 of them unemployed. The age group with the highest labor force participation rate is 25 to 29 years, with 96.4% or 106 individuals in the labor force. Within the labor force, the 65 to 74 years age range has the highest percentage of unemployed individuals, with 66.7% or 4 of them being unemployed.
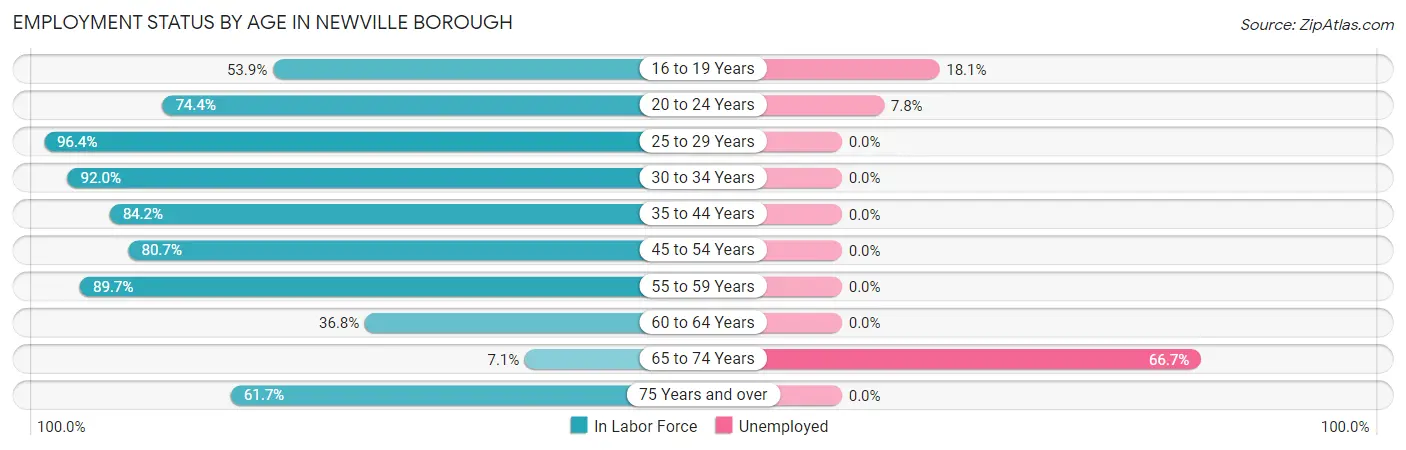
| Age Bracket | In Labor Force | Unemployed |
| 16 to 19 Years | 83 (53.9%) | 15 (18.1%) |
| 20 to 24 Years | 90 (74.4%) | 7 (7.8%) |
| 25 to 29 Years | 106 (96.4%) | 0 (0.0%) |
| 30 to 34 Years | 46 (92.0%) | 0 (0.0%) |
| 35 to 44 Years | 144 (84.2%) | 0 (0.0%) |
| 45 to 54 Years | 155 (80.7%) | 0 (0.0%) |
| 55 to 59 Years | 105 (89.7%) | 0 (0.0%) |
| 60 to 64 Years | 28 (36.8%) | 0 (0.0%) |
| 65 to 74 Years | 6 (7.1%) | 4 (66.7%) |
| 75 Years and over | 29 (61.7%) | 0 (0.0%) |
| Total | 792 (70.6%) | 26 (3.3%) |
Employment Status by Educational Attainment in Newville borough
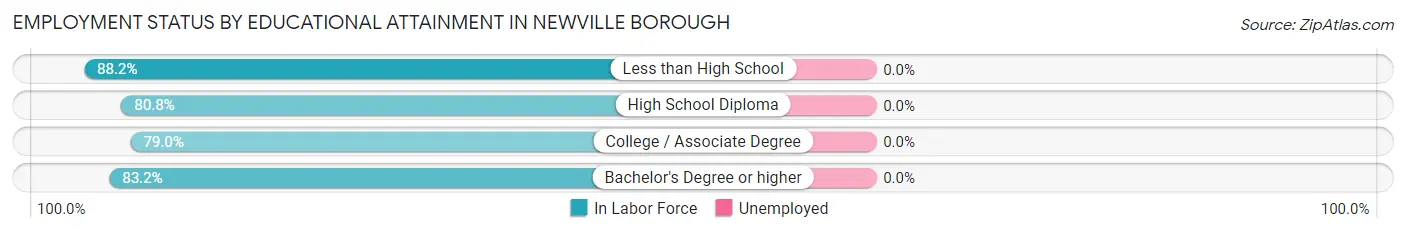
| Educational Attainment | In Labor Force | Unemployed |
| Less than High School | 67 (88.2%) | 0 (0.0%) |
| High School Diploma | 324 (80.8%) | 0 (0.0%) |
| College / Associate Degree | 109 (79.0%) | 0 (0.0%) |
| Bachelor's Degree or higher | 84 (83.2%) | 0 (0.0%) |
| Total | 584 (81.6%) | 0 (0.0%) |
Employment Occupations by Sex in Newville borough
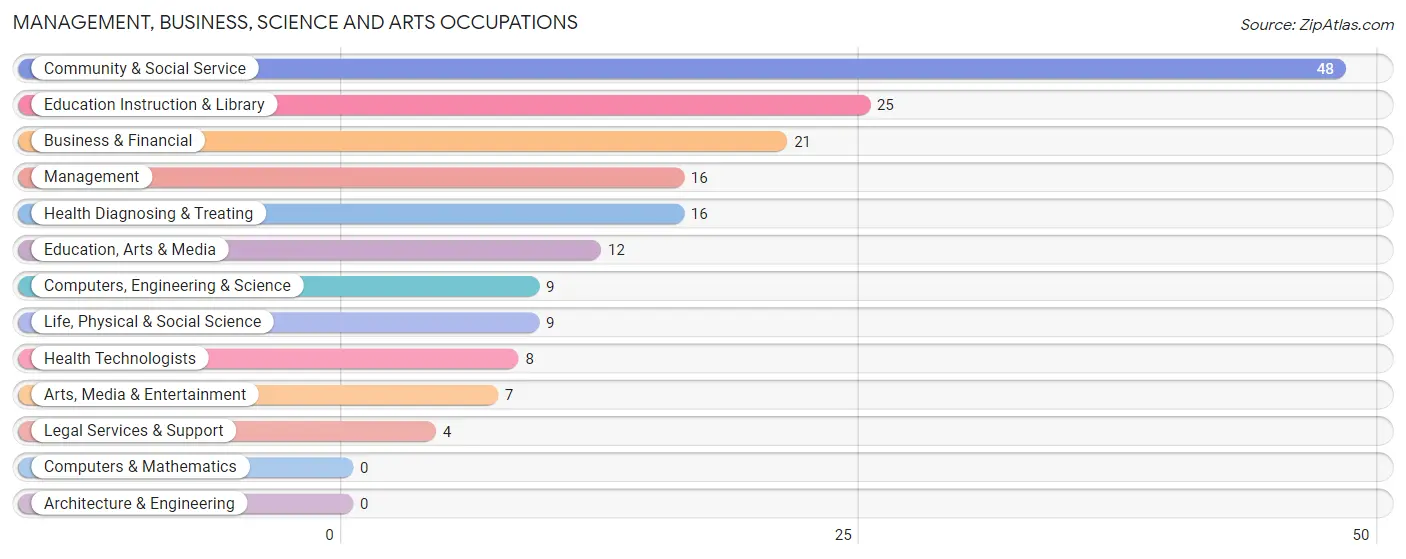
Management, Business, Science and Arts Occupations
The most common Management, Business, Science and Arts occupations in Newville borough are Community & Social Service (48 | 6.3%), Education Instruction & Library (25 | 3.3%), Business & Financial (21 | 2.7%), Management (16 | 2.1%), and Health Diagnosing & Treating (16 | 2.1%).
Management, Business, Science and Arts Occupations by Sex
Within the Management, Business, Science and Arts occupations in Newville borough, the most male-oriented occupations are Management (81.2%), Business & Financial (52.4%), and Education, Arts & Media (50.0%), while the most female-oriented occupations are Legal Services & Support (100.0%), Arts, Media & Entertainment (100.0%), and Health Diagnosing & Treating (75.0%).
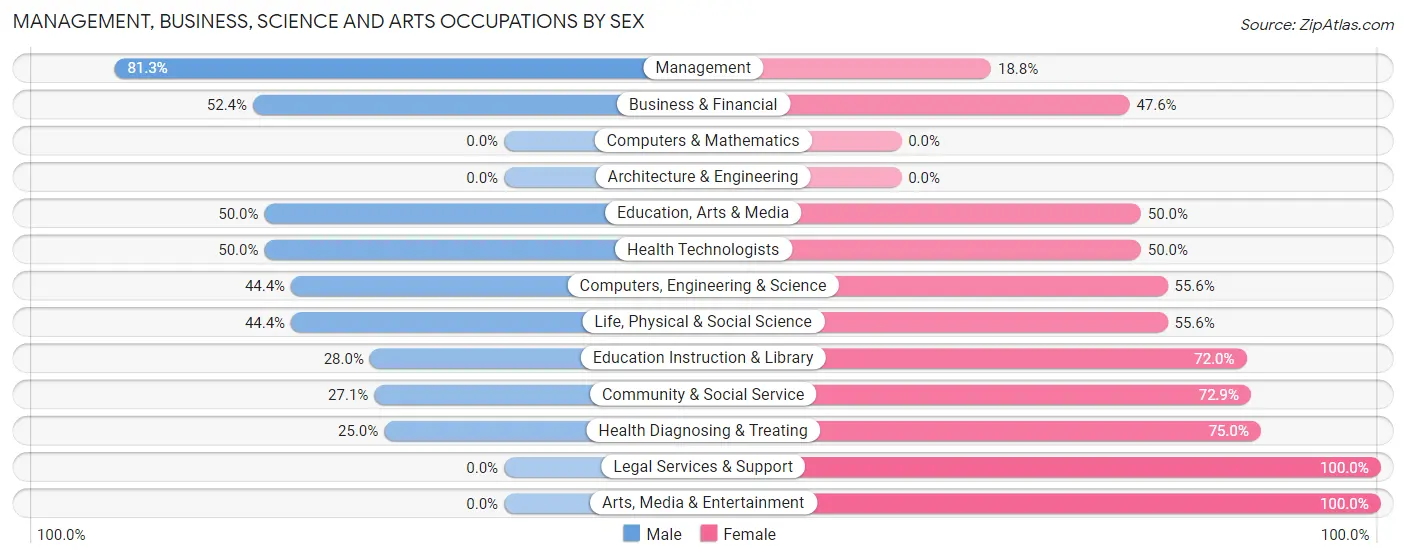
| Occupation | Male | Female |
| Management | 13 (81.2%) | 3 (18.8%) |
| Business & Financial | 11 (52.4%) | 10 (47.6%) |
| Computers, Engineering & Science | 4 (44.4%) | 5 (55.6%) |
| Computers & Mathematics | 0 (0.0%) | 0 (0.0%) |
| Architecture & Engineering | 0 (0.0%) | 0 (0.0%) |
| Life, Physical & Social Science | 4 (44.4%) | 5 (55.6%) |
| Community & Social Service | 13 (27.1%) | 35 (72.9%) |
| Education, Arts & Media | 6 (50.0%) | 6 (50.0%) |
| Legal Services & Support | 0 (0.0%) | 4 (100.0%) |
| Education Instruction & Library | 7 (28.0%) | 18 (72.0%) |
| Arts, Media & Entertainment | 0 (0.0%) | 7 (100.0%) |
| Health Diagnosing & Treating | 4 (25.0%) | 12 (75.0%) |
| Health Technologists | 4 (50.0%) | 4 (50.0%) |
| Total (Category) | 45 (40.9%) | 65 (59.1%) |
| Total (Overall) | 439 (57.3%) | 327 (42.7%) |
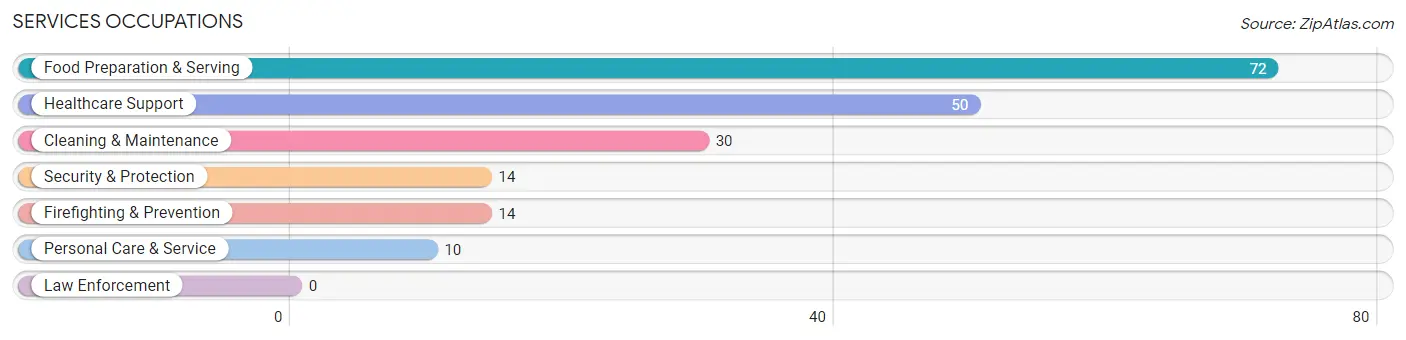
Services Occupations
The most common Services occupations in Newville borough are Food Preparation & Serving (72 | 9.4%), Healthcare Support (50 | 6.5%), Cleaning & Maintenance (30 | 3.9%), Security & Protection (14 | 1.8%), and Firefighting & Prevention (14 | 1.8%).
Services Occupations by Sex
Within the Services occupations in Newville borough, the most male-oriented occupations are Security & Protection (100.0%), Firefighting & Prevention (100.0%), and Food Preparation & Serving (63.9%), while the most female-oriented occupations are Healthcare Support (100.0%), Personal Care & Service (100.0%), and Cleaning & Maintenance (53.3%).
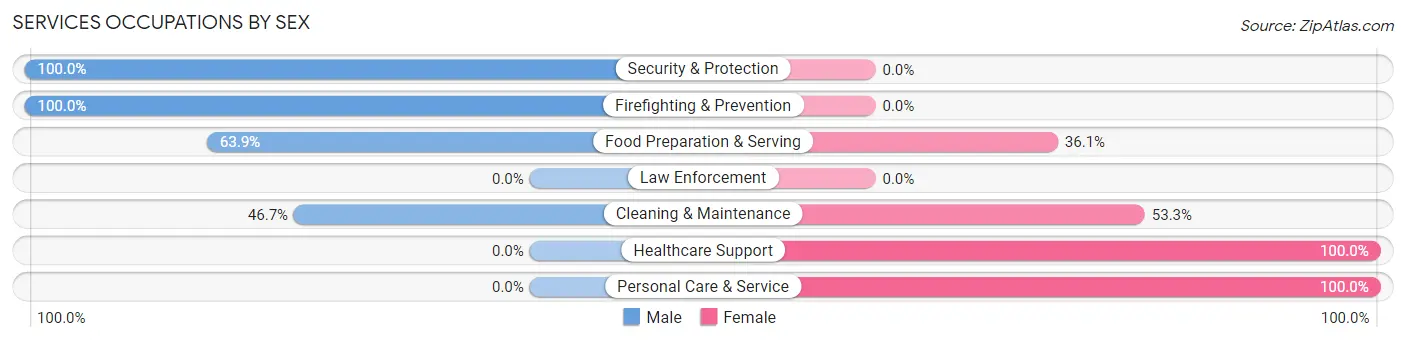
| Occupation | Male | Female |
| Healthcare Support | 0 (0.0%) | 50 (100.0%) |
| Security & Protection | 14 (100.0%) | 0 (0.0%) |
| Firefighting & Prevention | 14 (100.0%) | 0 (0.0%) |
| Law Enforcement | 0 (0.0%) | 0 (0.0%) |
| Food Preparation & Serving | 46 (63.9%) | 26 (36.1%) |
| Cleaning & Maintenance | 14 (46.7%) | 16 (53.3%) |
| Personal Care & Service | 0 (0.0%) | 10 (100.0%) |
| Total (Category) | 74 (42.0%) | 102 (58.0%) |
| Total (Overall) | 439 (57.3%) | 327 (42.7%) |
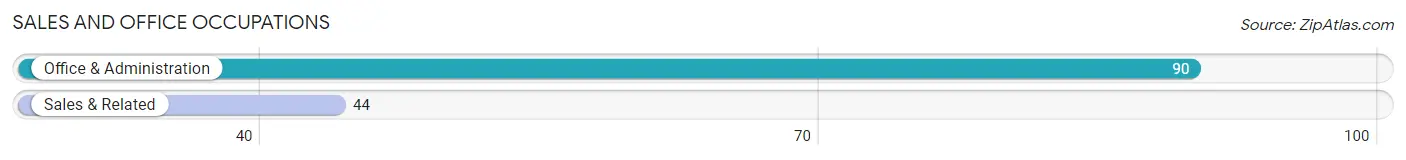
Sales and Office Occupations
The most common Sales and Office occupations in Newville borough are Office & Administration (90 | 11.7%), and Sales & Related (44 | 5.7%).
Sales and Office Occupations by Sex
| Occupation | Male | Female |
| Sales & Related | 26 (59.1%) | 18 (40.9%) |
| Office & Administration | 21 (23.3%) | 69 (76.7%) |
| Total (Category) | 47 (35.1%) | 87 (64.9%) |
| Total (Overall) | 439 (57.3%) | 327 (42.7%) |
Natural Resources, Construction and Maintenance Occupations
The most common Natural Resources, Construction and Maintenance occupations in Newville borough are Construction & Extraction (36 | 4.7%), and Installation, Maintenance & Repair (13 | 1.7%).
Natural Resources, Construction and Maintenance Occupations by Sex
| Occupation | Male | Female |
| Farming, Fishing & Forestry | 0 (0.0%) | 0 (0.0%) |
| Construction & Extraction | 36 (100.0%) | 0 (0.0%) |
| Installation, Maintenance & Repair | 10 (76.9%) | 3 (23.1%) |
| Total (Category) | 46 (93.9%) | 3 (6.1%) |
| Total (Overall) | 439 (57.3%) | 327 (42.7%) |
Production, Transportation and Moving Occupations
The most common Production, Transportation and Moving occupations in Newville borough are Material Moving (237 | 30.9%), Production (34 | 4.4%), and Transportation (26 | 3.4%).
Production, Transportation and Moving Occupations by Sex
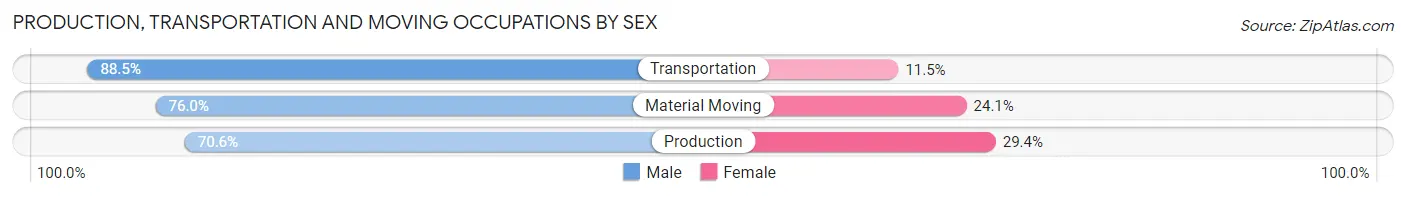
| Occupation | Male | Female |
| Production | 24 (70.6%) | 10 (29.4%) |
| Transportation | 23 (88.5%) | 3 (11.5%) |
| Material Moving | 180 (75.9%) | 57 (24.0%) |
| Total (Category) | 227 (76.4%) | 70 (23.6%) |
| Total (Overall) | 439 (57.3%) | 327 (42.7%) |
Employment Industries by Sex in Newville borough
Employment Industries in Newville borough
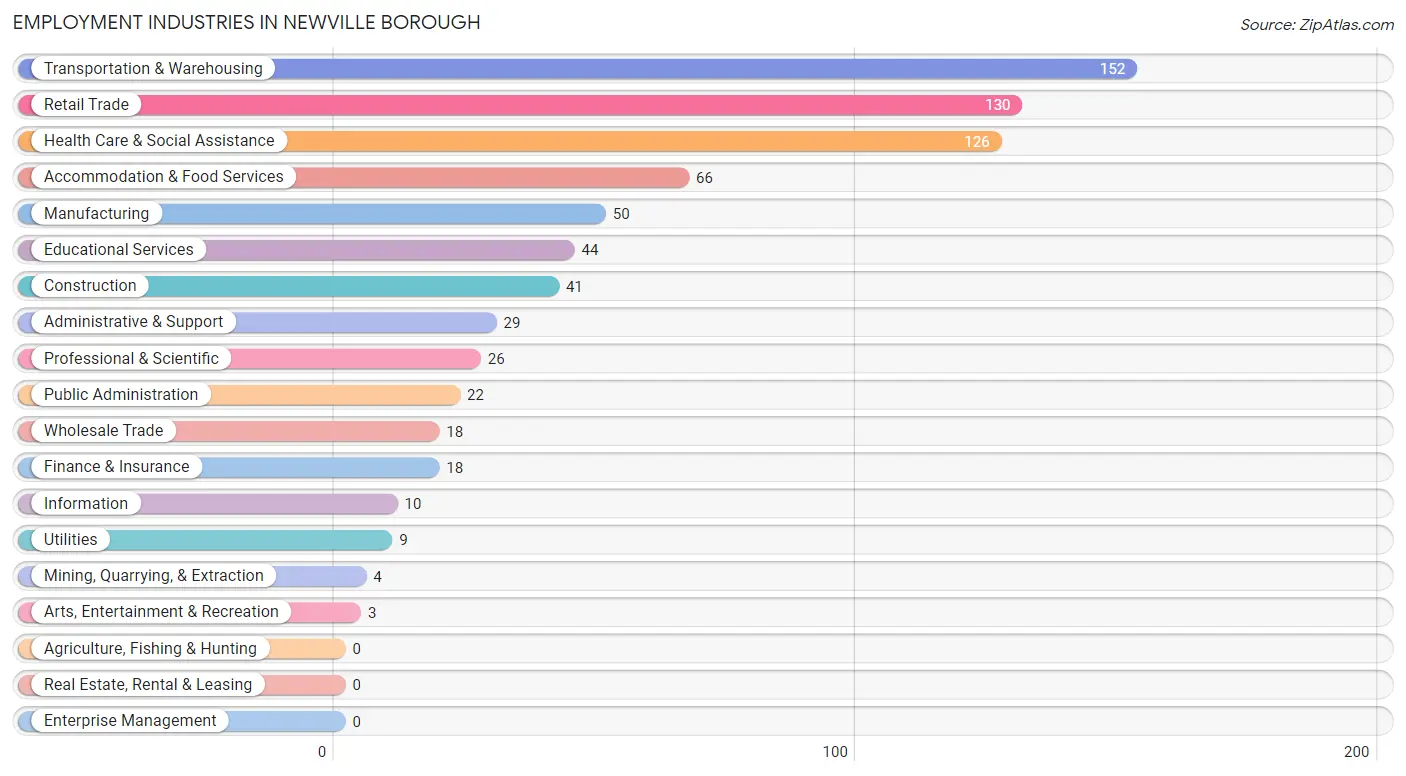
The major employment industries in Newville borough include Transportation & Warehousing (152 | 19.8%), Retail Trade (130 | 17.0%), Health Care & Social Assistance (126 | 16.5%), Accommodation & Food Services (66 | 8.6%), and Manufacturing (50 | 6.5%).
Employment Industries by Sex in Newville borough
The Newville borough industries that see more men than women are Mining, Quarrying, & Extraction (100.0%), Construction (100.0%), and Wholesale Trade (100.0%), whereas the industries that tend to have a higher number of women are Information (100.0%), Arts, Entertainment & Recreation (100.0%), and Health Care & Social Assistance (84.1%).
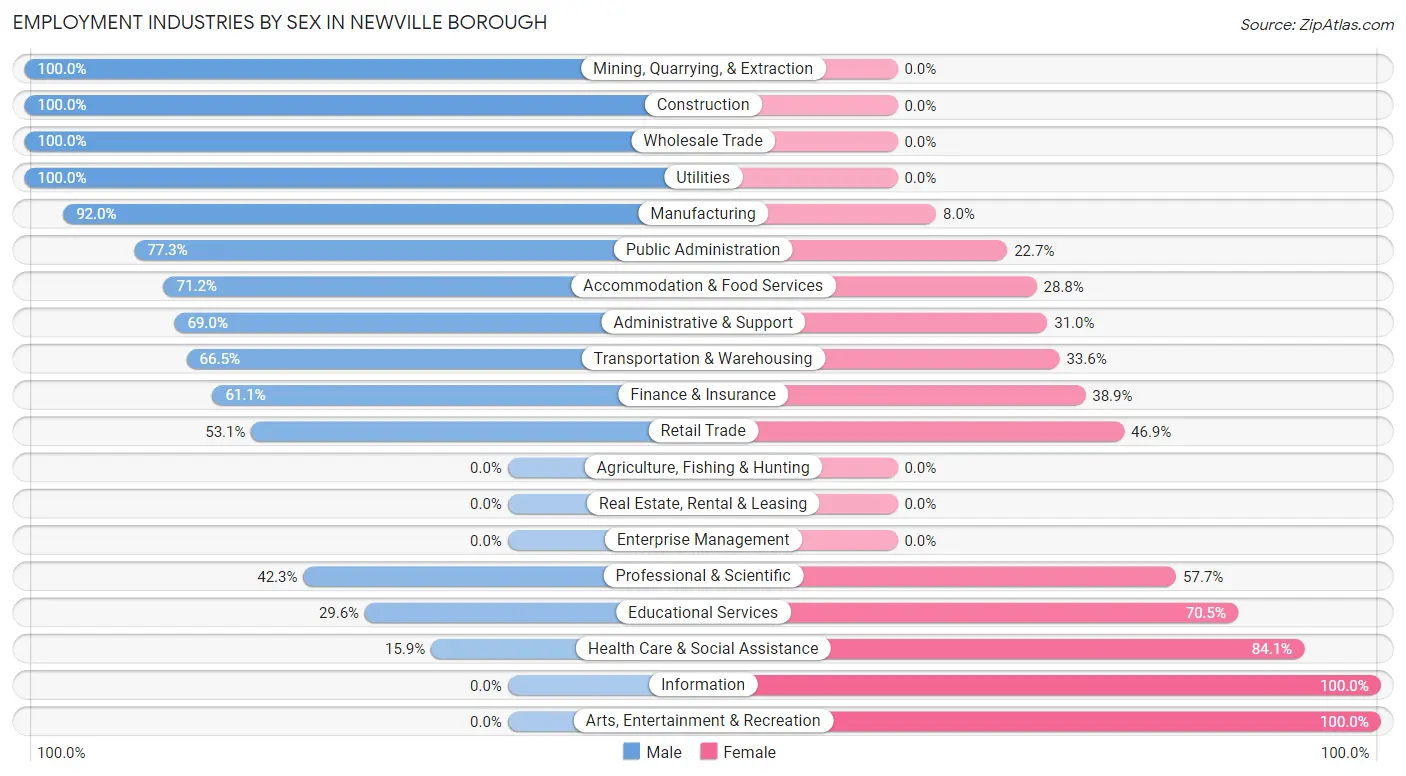
| Industry | Male | Female |
| Agriculture, Fishing & Hunting | 0 (0.0%) | 0 (0.0%) |
| Mining, Quarrying, & Extraction | 4 (100.0%) | 0 (0.0%) |
| Construction | 41 (100.0%) | 0 (0.0%) |
| Manufacturing | 46 (92.0%) | 4 (8.0%) |
| Wholesale Trade | 18 (100.0%) | 0 (0.0%) |
| Retail Trade | 69 (53.1%) | 61 (46.9%) |
| Transportation & Warehousing | 101 (66.4%) | 51 (33.6%) |
| Utilities | 9 (100.0%) | 0 (0.0%) |
| Information | 0 (0.0%) | 10 (100.0%) |
| Finance & Insurance | 11 (61.1%) | 7 (38.9%) |
| Real Estate, Rental & Leasing | 0 (0.0%) | 0 (0.0%) |
| Professional & Scientific | 11 (42.3%) | 15 (57.7%) |
| Enterprise Management | 0 (0.0%) | 0 (0.0%) |
| Administrative & Support | 20 (69.0%) | 9 (31.0%) |
| Educational Services | 13 (29.5%) | 31 (70.5%) |
| Health Care & Social Assistance | 20 (15.9%) | 106 (84.1%) |
| Arts, Entertainment & Recreation | 0 (0.0%) | 3 (100.0%) |
| Accommodation & Food Services | 47 (71.2%) | 19 (28.8%) |
| Public Administration | 17 (77.3%) | 5 (22.7%) |
| Total | 439 (57.3%) | 327 (42.7%) |
Education in Newville borough
School Enrollment in Newville borough
The most common levels of schooling among the 276 students in Newville borough are high school (88 | 31.9%), elementary school (68 | 24.6%), and middle school (43 | 15.6%).
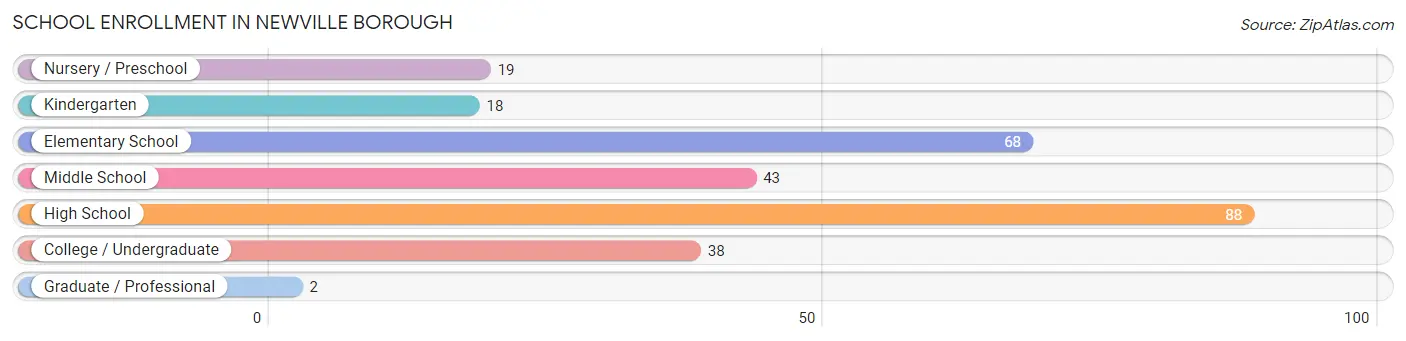
| School Level | # Students | % Students |
| Nursery / Preschool | 19 | 6.9% |
| Kindergarten | 18 | 6.5% |
| Elementary School | 68 | 24.6% |
| Middle School | 43 | 15.6% |
| High School | 88 | 31.9% |
| College / Undergraduate | 38 | 13.8% |
| Graduate / Professional | 2 | 0.7% |
| Total | 276 | 100.0% |
School Enrollment by Age by Funding Source in Newville borough
Out of a total of 276 students who are enrolled in schools in Newville borough, 13 (4.7%) attend a private institution, while the remaining 263 (95.3%) are enrolled in public schools. The age group of 3 to 4 year olds has the highest likelihood of being enrolled in private schools, with 2 (50.0% in the age bracket) enrolled. Conversely, the age group of 10 to 14 year olds has the lowest likelihood of being enrolled in a private school, with 42 (100.0% in the age bracket) attending a public institution.
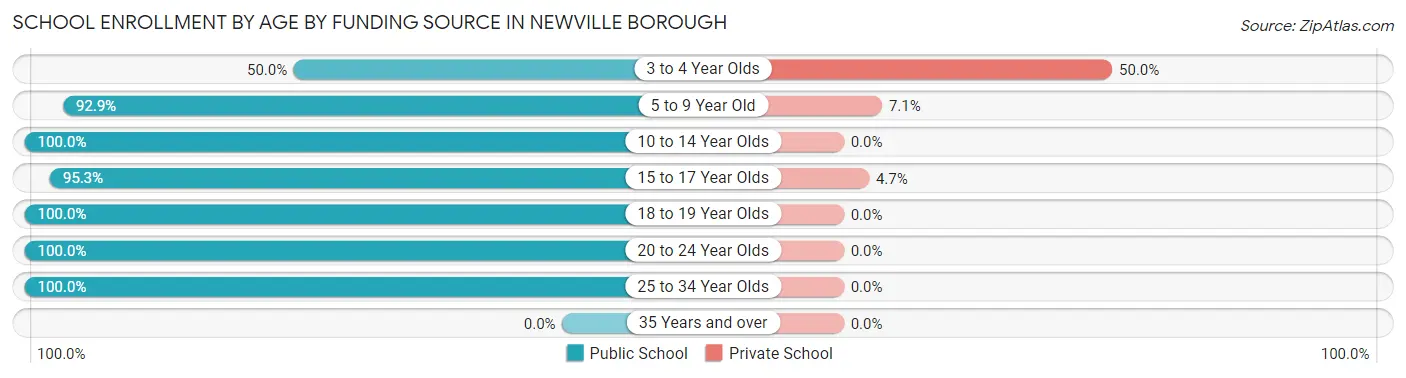
| Age Bracket | Public School | Private School |
| 3 to 4 Year Olds | 2 (50.0%) | 2 (50.0%) |
| 5 to 9 Year Old | 91 (92.9%) | 7 (7.1%) |
| 10 to 14 Year Olds | 42 (100.0%) | 0 (0.0%) |
| 15 to 17 Year Olds | 81 (95.3%) | 4 (4.7%) |
| 18 to 19 Year Olds | 7 (100.0%) | 0 (0.0%) |
| 20 to 24 Year Olds | 38 (100.0%) | 0 (0.0%) |
| 25 to 34 Year Olds | 2 (100.0%) | 0 (0.0%) |
| 35 Years and over | 0 (0.0%) | 0 (0.0%) |
| Total | 263 (95.3%) | 13 (4.7%) |
Educational Attainment by Field of Study in Newville borough
Psychology (26 | 22.0%), bio, nature & agricultural (19 | 16.1%), arts & humanities (18 | 15.2%), education (17 | 14.4%), and business (13 | 11.0%) are the most common fields of study among 118 individuals in Newville borough who have obtained a bachelor's degree or higher.
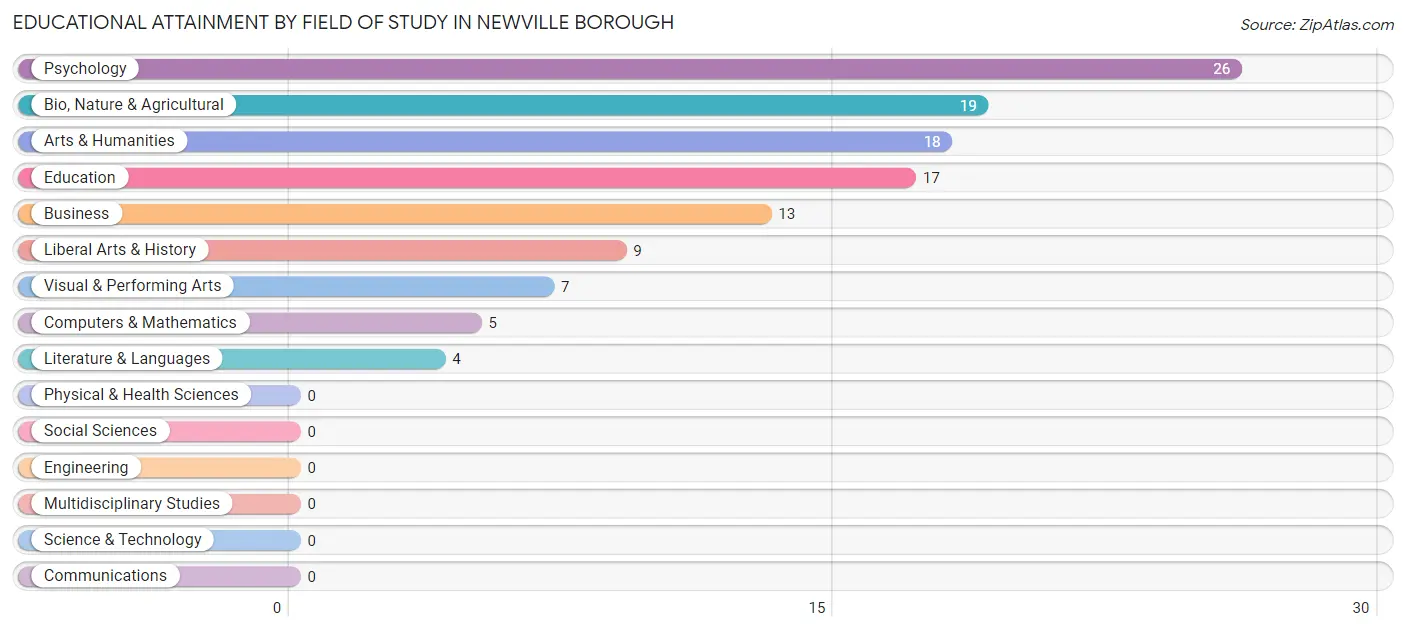
| Field of Study | # Graduates | % Graduates |
| Computers & Mathematics | 5 | 4.2% |
| Bio, Nature & Agricultural | 19 | 16.1% |
| Physical & Health Sciences | 0 | 0.0% |
| Psychology | 26 | 22.0% |
| Social Sciences | 0 | 0.0% |
| Engineering | 0 | 0.0% |
| Multidisciplinary Studies | 0 | 0.0% |
| Science & Technology | 0 | 0.0% |
| Business | 13 | 11.0% |
| Education | 17 | 14.4% |
| Literature & Languages | 4 | 3.4% |
| Liberal Arts & History | 9 | 7.6% |
| Visual & Performing Arts | 7 | 5.9% |
| Communications | 0 | 0.0% |
| Arts & Humanities | 18 | 15.2% |
| Total | 118 | 100.0% |
Transportation & Commute in Newville borough
Vehicle Availability by Sex in Newville borough
The most prevalent vehicle ownership categories in Newville borough are males with 2 vehicles (203, accounting for 47.2%) and females with 2 vehicles (120, making up 62.8%).
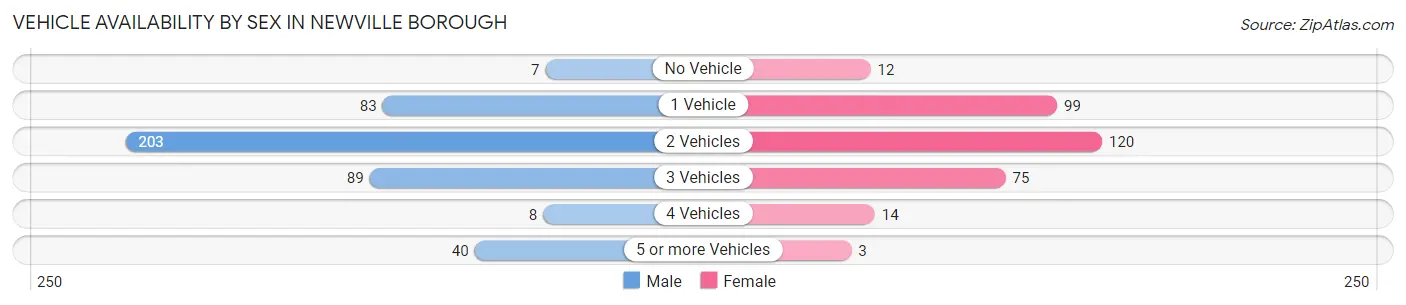
| Vehicles Available | Male | Female |
| No Vehicle | 7 (1.6%) | 12 (3.7%) |
| 1 Vehicle | 83 (19.3%) | 99 (30.6%) |
| 2 Vehicles | 203 (47.2%) | 120 (37.1%) |
| 3 Vehicles | 89 (20.7%) | 75 (23.2%) |
| 4 Vehicles | 8 (1.9%) | 14 (4.3%) |
| 5 or more Vehicles | 40 (9.3%) | 3 (0.9%) |
| Total | 430 (100.0%) | 323 (100.0%) |
Commute Time in Newville borough
The most frequently occuring commute durations in Newville borough are 25 to 29 minutes (161 commuters, 21.9%), 20 to 24 minutes (105 commuters, 14.3%), and 15 to 19 minutes (94 commuters, 12.8%).
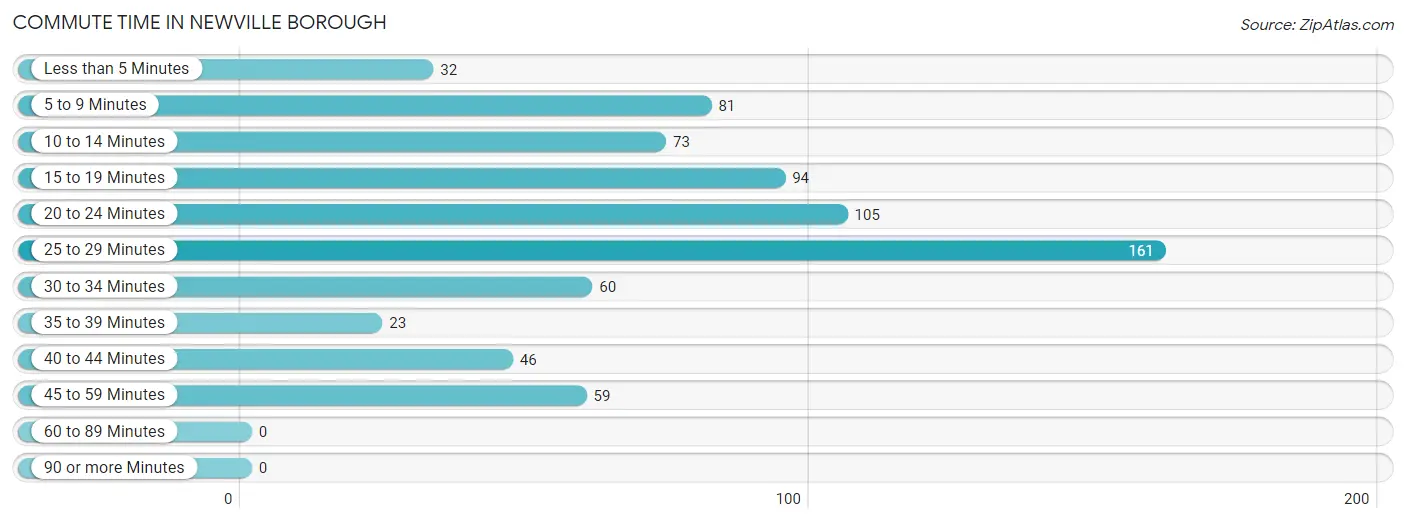
| Commute Time | # Commuters | % Commuters |
| Less than 5 Minutes | 32 | 4.4% |
| 5 to 9 Minutes | 81 | 11.0% |
| 10 to 14 Minutes | 73 | 10.0% |
| 15 to 19 Minutes | 94 | 12.8% |
| 20 to 24 Minutes | 105 | 14.3% |
| 25 to 29 Minutes | 161 | 21.9% |
| 30 to 34 Minutes | 60 | 8.2% |
| 35 to 39 Minutes | 23 | 3.1% |
| 40 to 44 Minutes | 46 | 6.3% |
| 45 to 59 Minutes | 59 | 8.0% |
| 60 to 89 Minutes | 0 | 0.0% |
| 90 or more Minutes | 0 | 0.0% |
Commute Time by Sex in Newville borough
The most common commute times in Newville borough are 25 to 29 minutes (87 commuters, 21.0%) for males and 25 to 29 minutes (74 commuters, 23.2%) for females.
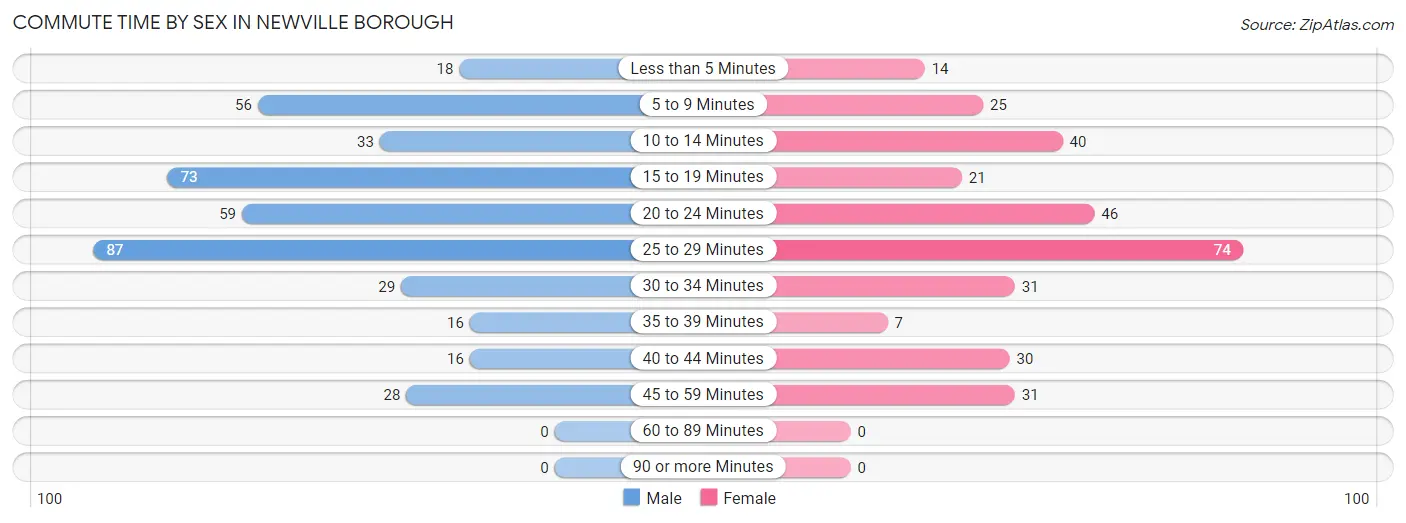
| Commute Time | Male | Female |
| Less than 5 Minutes | 18 (4.3%) | 14 (4.4%) |
| 5 to 9 Minutes | 56 (13.5%) | 25 (7.8%) |
| 10 to 14 Minutes | 33 (8.0%) | 40 (12.5%) |
| 15 to 19 Minutes | 73 (17.6%) | 21 (6.6%) |
| 20 to 24 Minutes | 59 (14.2%) | 46 (14.4%) |
| 25 to 29 Minutes | 87 (21.0%) | 74 (23.2%) |
| 30 to 34 Minutes | 29 (7.0%) | 31 (9.7%) |
| 35 to 39 Minutes | 16 (3.9%) | 7 (2.2%) |
| 40 to 44 Minutes | 16 (3.9%) | 30 (9.4%) |
| 45 to 59 Minutes | 28 (6.8%) | 31 (9.7%) |
| 60 to 89 Minutes | 0 (0.0%) | 0 (0.0%) |
| 90 or more Minutes | 0 (0.0%) | 0 (0.0%) |
Time of Departure to Work by Sex in Newville borough
The most frequent times of departure to work in Newville borough are 12:00 PM to 3:59 PM (129, 31.1%) for males and 6:30 AM to 6:59 AM (66, 20.7%) for females.
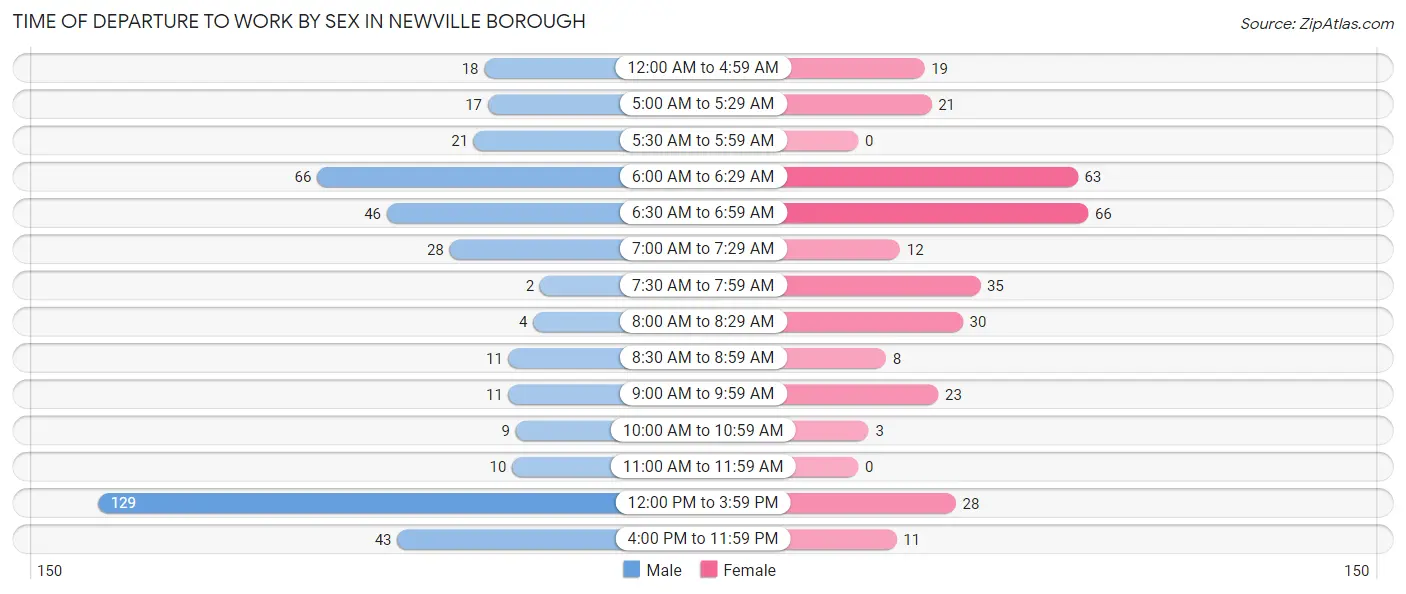
| Time of Departure | Male | Female |
| 12:00 AM to 4:59 AM | 18 (4.3%) | 19 (6.0%) |
| 5:00 AM to 5:29 AM | 17 (4.1%) | 21 (6.6%) |
| 5:30 AM to 5:59 AM | 21 (5.1%) | 0 (0.0%) |
| 6:00 AM to 6:29 AM | 66 (15.9%) | 63 (19.8%) |
| 6:30 AM to 6:59 AM | 46 (11.1%) | 66 (20.7%) |
| 7:00 AM to 7:29 AM | 28 (6.8%) | 12 (3.8%) |
| 7:30 AM to 7:59 AM | 2 (0.5%) | 35 (11.0%) |
| 8:00 AM to 8:29 AM | 4 (1.0%) | 30 (9.4%) |
| 8:30 AM to 8:59 AM | 11 (2.6%) | 8 (2.5%) |
| 9:00 AM to 9:59 AM | 11 (2.6%) | 23 (7.2%) |
| 10:00 AM to 10:59 AM | 9 (2.2%) | 3 (0.9%) |
| 11:00 AM to 11:59 AM | 10 (2.4%) | 0 (0.0%) |
| 12:00 PM to 3:59 PM | 129 (31.1%) | 28 (8.8%) |
| 4:00 PM to 11:59 PM | 43 (10.4%) | 11 (3.5%) |
| Total | 415 (100.0%) | 319 (100.0%) |
Housing Occupancy in Newville borough
Occupancy by Ownership in Newville borough
Of the total 533 dwellings in Newville borough, owner-occupied units account for 285 (53.5%), while renter-occupied units make up 248 (46.5%).
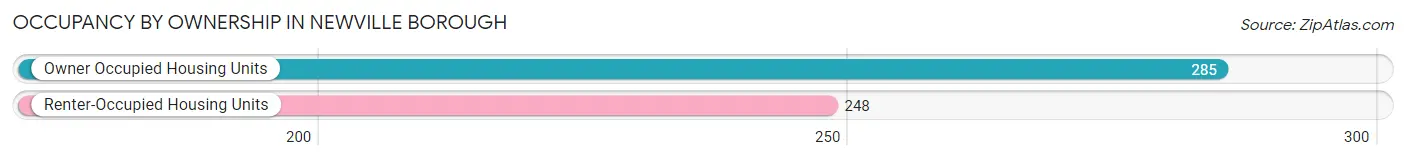
| Occupancy | # Housing Units | % Housing Units |
| Owner Occupied Housing Units | 285 | 53.5% |
| Renter-Occupied Housing Units | 248 | 46.5% |
| Total Occupied Housing Units | 533 | 100.0% |
Occupancy by Household Size in Newville borough
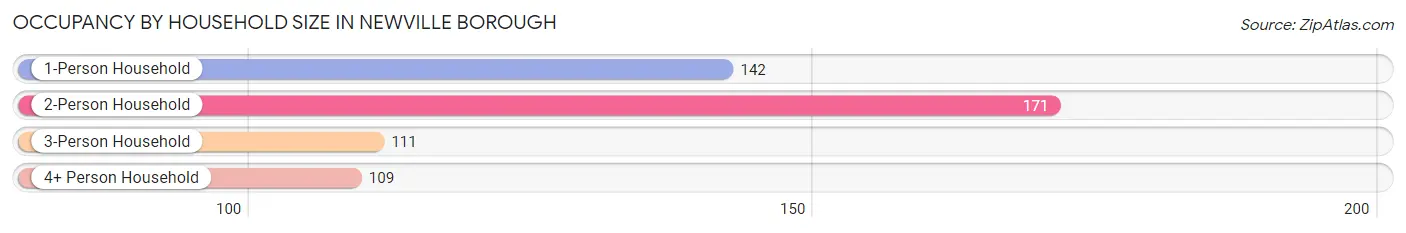
| Household Size | # Housing Units | % Housing Units |
| 1-Person Household | 142 | 26.6% |
| 2-Person Household | 171 | 32.1% |
| 3-Person Household | 111 | 20.8% |
| 4+ Person Household | 109 | 20.4% |
| Total Housing Units | 533 | 100.0% |
Occupancy by Ownership by Household Size in Newville borough
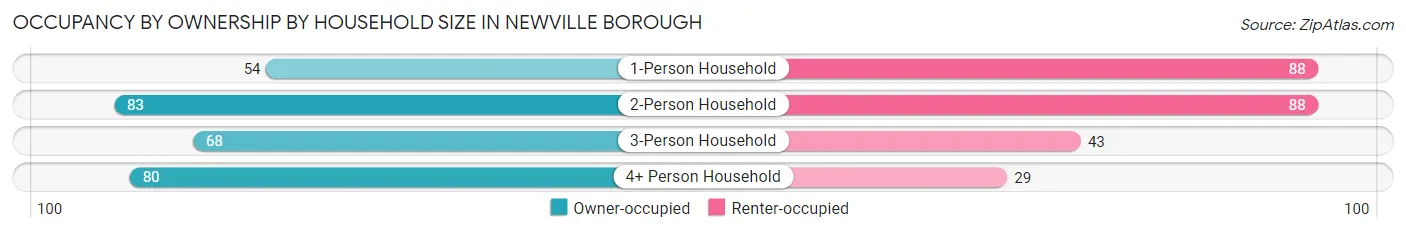
| Household Size | Owner-occupied | Renter-occupied |
| 1-Person Household | 54 (38.0%) | 88 (62.0%) |
| 2-Person Household | 83 (48.5%) | 88 (51.5%) |
| 3-Person Household | 68 (61.3%) | 43 (38.7%) |
| 4+ Person Household | 80 (73.4%) | 29 (26.6%) |
| Total Housing Units | 285 (53.5%) | 248 (46.5%) |
Occupancy by Educational Attainment in Newville borough
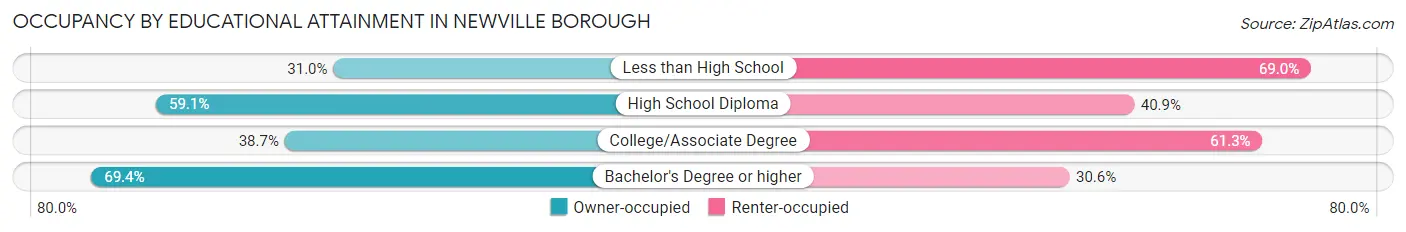
| Household Size | Owner-occupied | Renter-occupied |
| Less than High School | 18 (31.0%) | 40 (69.0%) |
| High School Diploma | 165 (59.1%) | 114 (40.9%) |
| College/Associate Degree | 43 (38.7%) | 68 (61.3%) |
| Bachelor's Degree or higher | 59 (69.4%) | 26 (30.6%) |
Occupancy by Age of Householder in Newville borough
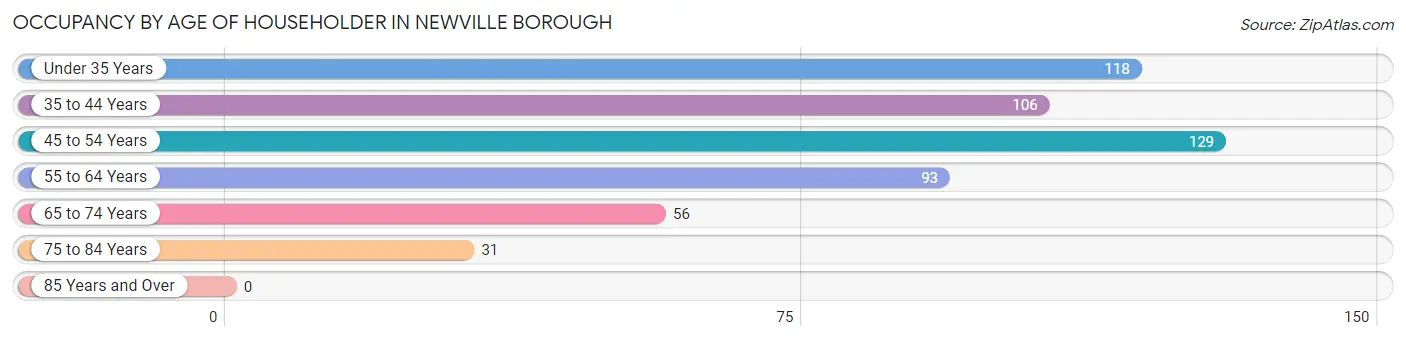
| Age Bracket | # Households | % Households |
| Under 35 Years | 118 | 22.1% |
| 35 to 44 Years | 106 | 19.9% |
| 45 to 54 Years | 129 | 24.2% |
| 55 to 64 Years | 93 | 17.4% |
| 65 to 74 Years | 56 | 10.5% |
| 75 to 84 Years | 31 | 5.8% |
| 85 Years and Over | 0 | 0.0% |
| Total | 533 | 100.0% |
Housing Finances in Newville borough
Median Income by Occupancy in Newville borough
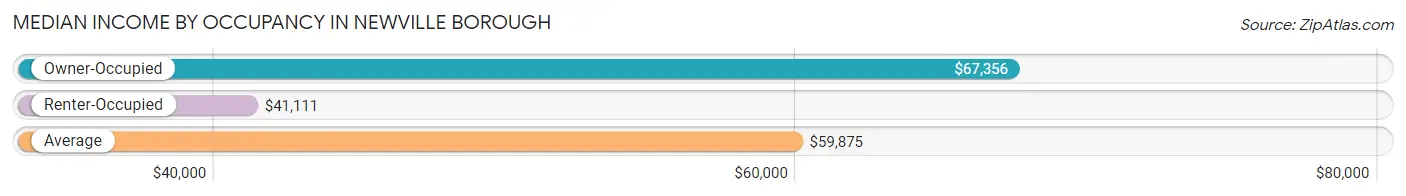
| Occupancy Type | # Households | Median Income |
| Owner-Occupied | 285 (53.5%) | $67,356 |
| Renter-Occupied | 248 (46.5%) | $41,111 |
| Average | 533 (100.0%) | $59,875 |
Occupancy by Householder Income Bracket in Newville borough
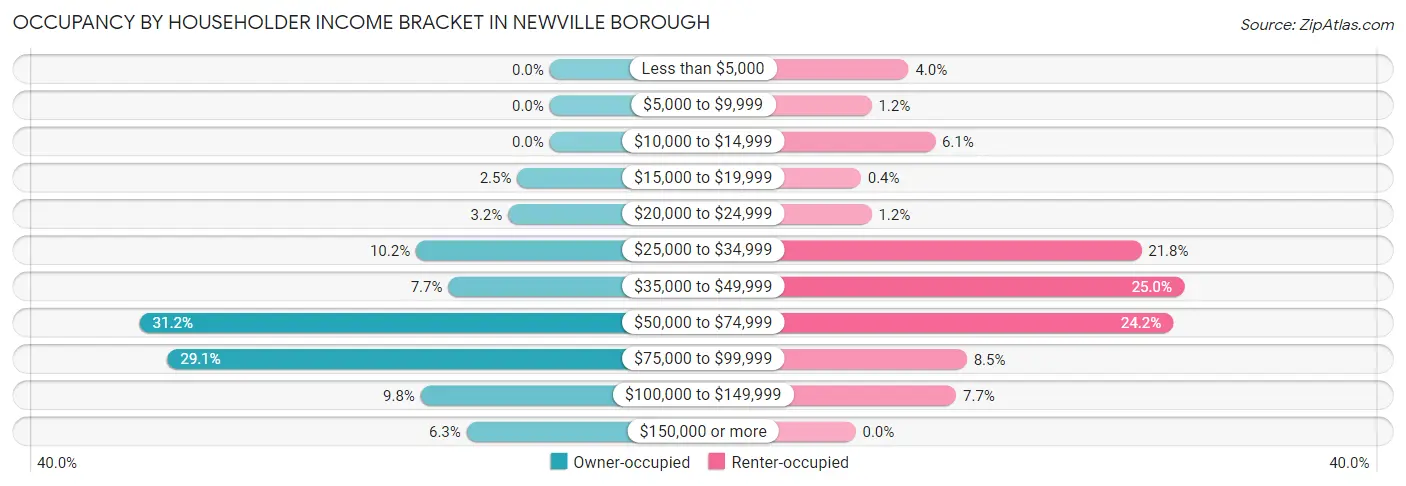
| Income Bracket | Owner-occupied | Renter-occupied |
| Less than $5,000 | 0 (0.0%) | 10 (4.0%) |
| $5,000 to $9,999 | 0 (0.0%) | 3 (1.2%) |
| $10,000 to $14,999 | 0 (0.0%) | 15 (6.0%) |
| $15,000 to $19,999 | 7 (2.5%) | 1 (0.4%) |
| $20,000 to $24,999 | 9 (3.2%) | 3 (1.2%) |
| $25,000 to $34,999 | 29 (10.2%) | 54 (21.8%) |
| $35,000 to $49,999 | 22 (7.7%) | 62 (25.0%) |
| $50,000 to $74,999 | 89 (31.2%) | 60 (24.2%) |
| $75,000 to $99,999 | 83 (29.1%) | 21 (8.5%) |
| $100,000 to $149,999 | 28 (9.8%) | 19 (7.7%) |
| $150,000 or more | 18 (6.3%) | 0 (0.0%) |
| Total | 285 (100.0%) | 248 (100.0%) |
Monthly Housing Cost Tiers in Newville borough
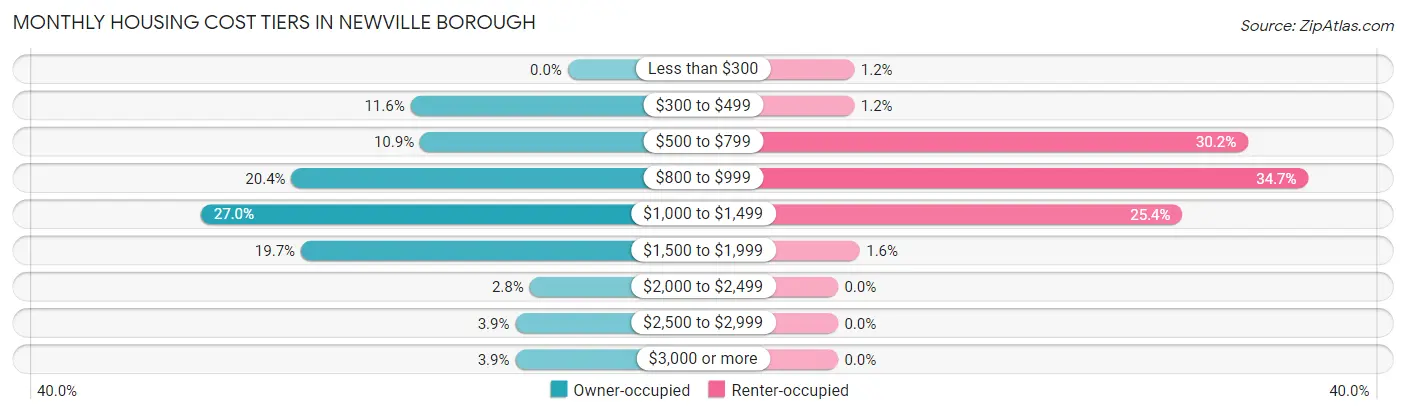
| Monthly Cost | Owner-occupied | Renter-occupied |
| Less than $300 | 0 (0.0%) | 3 (1.2%) |
| $300 to $499 | 33 (11.6%) | 3 (1.2%) |
| $500 to $799 | 31 (10.9%) | 75 (30.2%) |
| $800 to $999 | 58 (20.3%) | 86 (34.7%) |
| $1,000 to $1,499 | 77 (27.0%) | 63 (25.4%) |
| $1,500 to $1,999 | 56 (19.7%) | 4 (1.6%) |
| $2,000 to $2,499 | 8 (2.8%) | 0 (0.0%) |
| $2,500 to $2,999 | 11 (3.9%) | 0 (0.0%) |
| $3,000 or more | 11 (3.9%) | 0 (0.0%) |
| Total | 285 (100.0%) | 248 (100.0%) |
Physical Housing Characteristics in Newville borough
Housing Structures in Newville borough
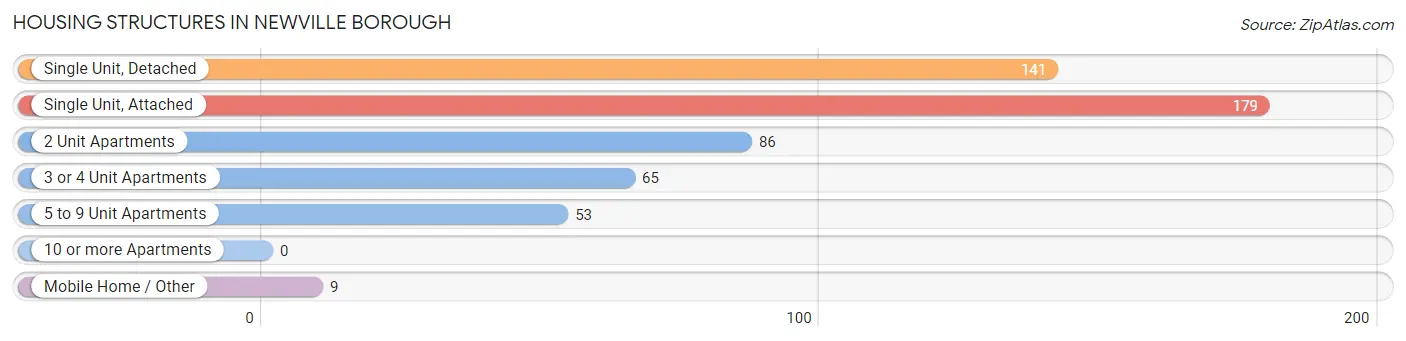
| Structure Type | # Housing Units | % Housing Units |
| Single Unit, Detached | 141 | 26.5% |
| Single Unit, Attached | 179 | 33.6% |
| 2 Unit Apartments | 86 | 16.1% |
| 3 or 4 Unit Apartments | 65 | 12.2% |
| 5 to 9 Unit Apartments | 53 | 9.9% |
| 10 or more Apartments | 0 | 0.0% |
| Mobile Home / Other | 9 | 1.7% |
| Total | 533 | 100.0% |
Housing Structures by Occupancy in Newville borough
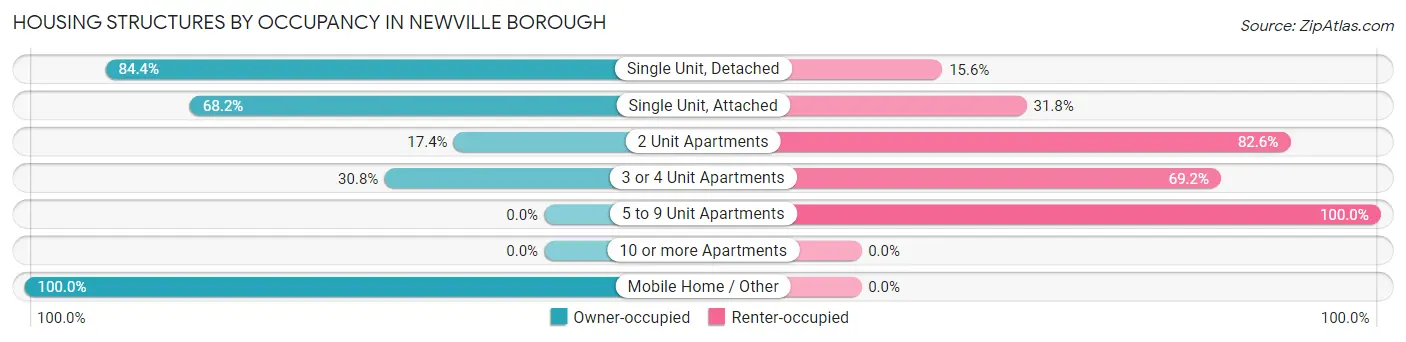
| Structure Type | Owner-occupied | Renter-occupied |
| Single Unit, Detached | 119 (84.4%) | 22 (15.6%) |
| Single Unit, Attached | 122 (68.2%) | 57 (31.8%) |
| 2 Unit Apartments | 15 (17.4%) | 71 (82.6%) |
| 3 or 4 Unit Apartments | 20 (30.8%) | 45 (69.2%) |
| 5 to 9 Unit Apartments | 0 (0.0%) | 53 (100.0%) |
| 10 or more Apartments | 0 (0.0%) | 0 (0.0%) |
| Mobile Home / Other | 9 (100.0%) | 0 (0.0%) |
| Total | 285 (53.5%) | 248 (46.5%) |
Housing Structures by Number of Rooms in Newville borough
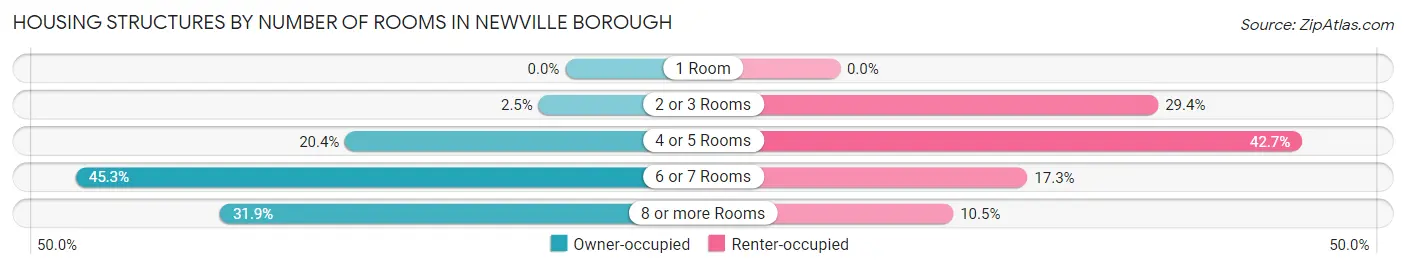
| Number of Rooms | Owner-occupied | Renter-occupied |
| 1 Room | 0 (0.0%) | 0 (0.0%) |
| 2 or 3 Rooms | 7 (2.5%) | 73 (29.4%) |
| 4 or 5 Rooms | 58 (20.3%) | 106 (42.7%) |
| 6 or 7 Rooms | 129 (45.3%) | 43 (17.3%) |
| 8 or more Rooms | 91 (31.9%) | 26 (10.5%) |
| Total | 285 (100.0%) | 248 (100.0%) |
Housing Structure by Heating Type in Newville borough
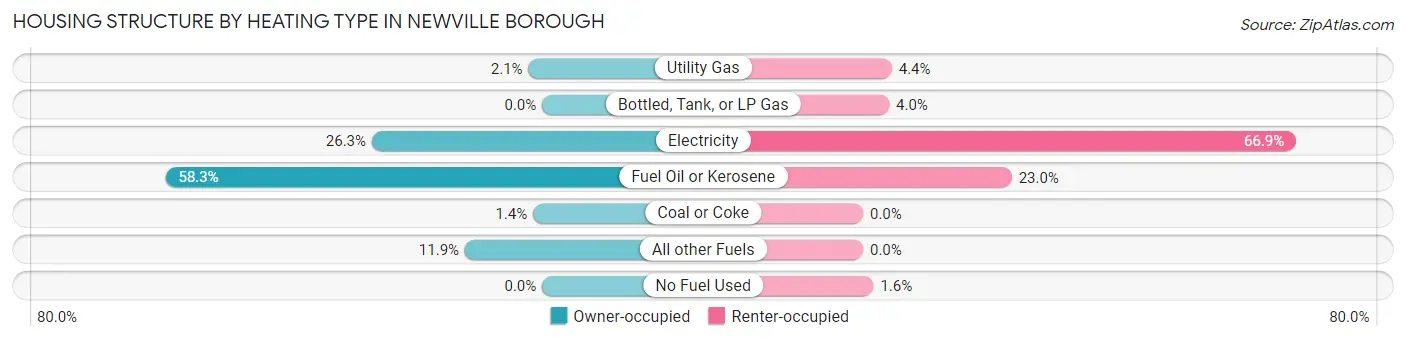
| Heating Type | Owner-occupied | Renter-occupied |
| Utility Gas | 6 (2.1%) | 11 (4.4%) |
| Bottled, Tank, or LP Gas | 0 (0.0%) | 10 (4.0%) |
| Electricity | 75 (26.3%) | 166 (66.9%) |
| Fuel Oil or Kerosene | 166 (58.3%) | 57 (23.0%) |
| Coal or Coke | 4 (1.4%) | 0 (0.0%) |
| All other Fuels | 34 (11.9%) | 0 (0.0%) |
| No Fuel Used | 0 (0.0%) | 4 (1.6%) |
| Total | 285 (100.0%) | 248 (100.0%) |
Household Vehicle Usage in Newville borough
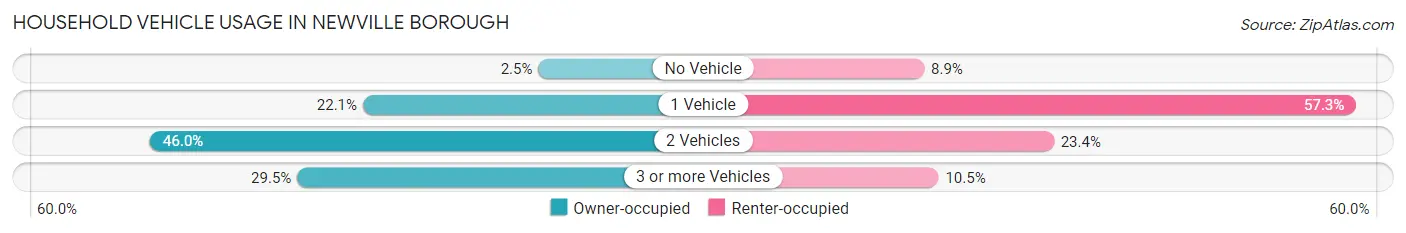
| Vehicles per Household | Owner-occupied | Renter-occupied |
| No Vehicle | 7 (2.5%) | 22 (8.9%) |
| 1 Vehicle | 63 (22.1%) | 142 (57.3%) |
| 2 Vehicles | 131 (46.0%) | 58 (23.4%) |
| 3 or more Vehicles | 84 (29.5%) | 26 (10.5%) |
| Total | 285 (100.0%) | 248 (100.0%) |
Real Estate & Mortgages in Newville borough
Real Estate and Mortgage Overview in Newville borough
| Characteristic | Without Mortgage | With Mortgage |
| Housing Units | 71 | 214 |
| Median Property Value | $134,800 | $152,100 |
| Median Household Income | $61,705 | $14 |
| Monthly Housing Costs | $513 | $11 |
| Real Estate Taxes | $2,333 | $0 |
Property Value by Mortgage Status in Newville borough
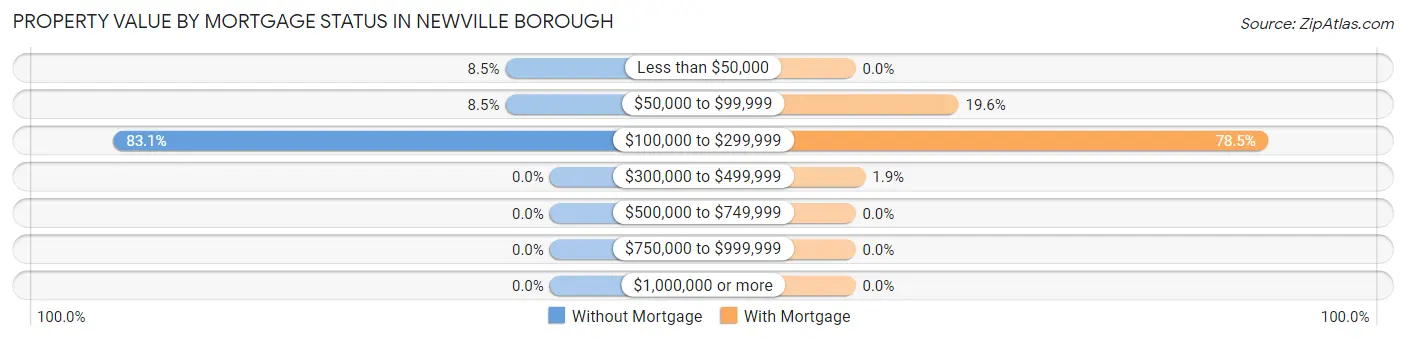
| Property Value | Without Mortgage | With Mortgage |
| Less than $50,000 | 6 (8.5%) | 0 (0.0%) |
| $50,000 to $99,999 | 6 (8.5%) | 42 (19.6%) |
| $100,000 to $299,999 | 59 (83.1%) | 168 (78.5%) |
| $300,000 to $499,999 | 0 (0.0%) | 4 (1.9%) |
| $500,000 to $749,999 | 0 (0.0%) | 0 (0.0%) |
| $750,000 to $999,999 | 0 (0.0%) | 0 (0.0%) |
| $1,000,000 or more | 0 (0.0%) | 0 (0.0%) |
| Total | 71 (100.0%) | 214 (100.0%) |
Household Income by Mortgage Status in Newville borough
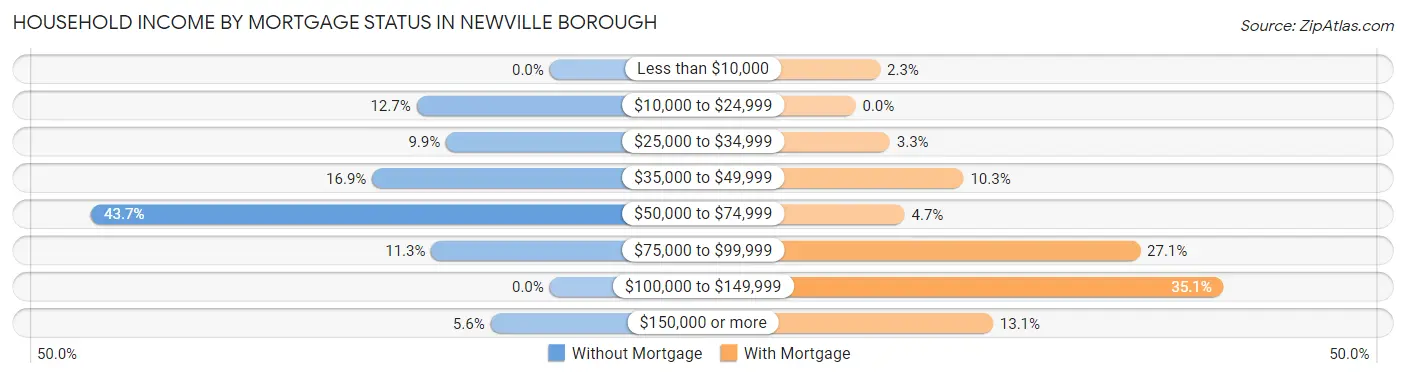
| Household Income | Without Mortgage | With Mortgage |
| Less than $10,000 | 0 (0.0%) | 5 (2.3%) |
| $10,000 to $24,999 | 9 (12.7%) | 0 (0.0%) |
| $25,000 to $34,999 | 7 (9.9%) | 7 (3.3%) |
| $35,000 to $49,999 | 12 (16.9%) | 22 (10.3%) |
| $50,000 to $74,999 | 31 (43.7%) | 10 (4.7%) |
| $75,000 to $99,999 | 8 (11.3%) | 58 (27.1%) |
| $100,000 to $149,999 | 0 (0.0%) | 75 (35.0%) |
| $150,000 or more | 4 (5.6%) | 28 (13.1%) |
| Total | 71 (100.0%) | 214 (100.0%) |
Property Value to Household Income Ratio in Newville borough
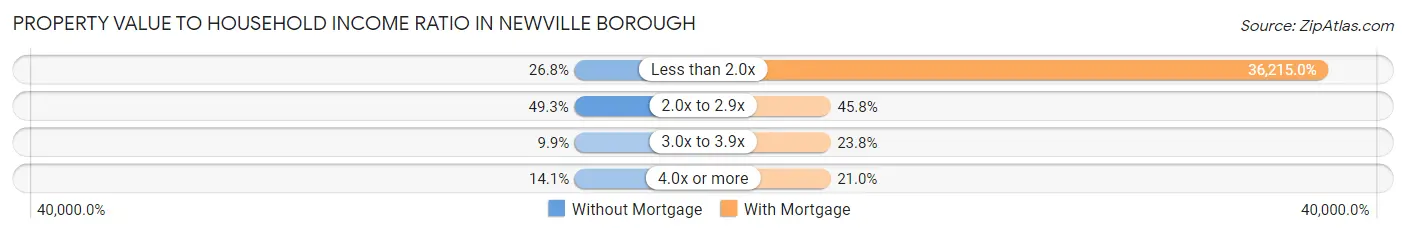
| Value-to-Income Ratio | Without Mortgage | With Mortgage |
| Less than 2.0x | 19 (26.8%) | 77,500 (36,214.9%) |
| 2.0x to 2.9x | 35 (49.3%) | 98 (45.8%) |
| 3.0x to 3.9x | 7 (9.9%) | 51 (23.8%) |
| 4.0x or more | 10 (14.1%) | 45 (21.0%) |
| Total | 71 (100.0%) | 214 (100.0%) |
Real Estate Taxes by Mortgage Status in Newville borough
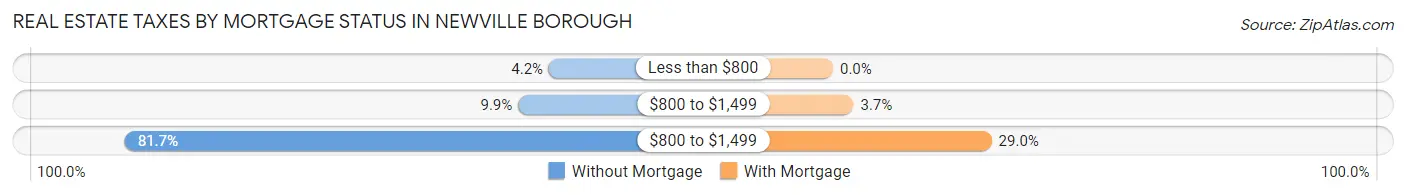
| Property Taxes | Without Mortgage | With Mortgage |
| Less than $800 | 3 (4.2%) | 0 (0.0%) |
| $800 to $1,499 | 7 (9.9%) | 8 (3.7%) |
| $800 to $1,499 | 58 (81.7%) | 62 (29.0%) |
| Total | 71 (100.0%) | 214 (100.0%) |
Health & Disability in Newville borough
Health Insurance Coverage by Age in Newville borough
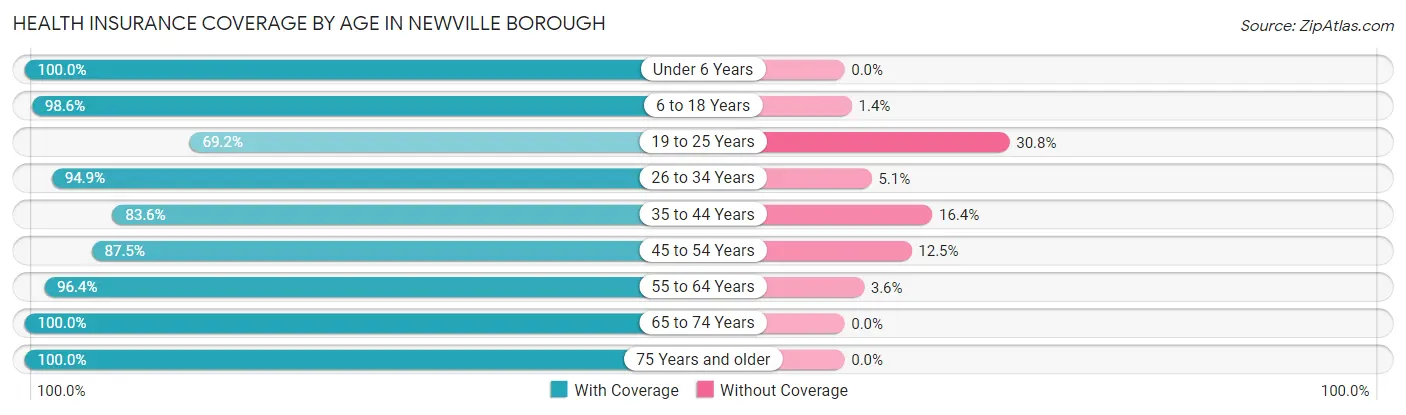
| Age Bracket | With Coverage | Without Coverage |
| Under 6 Years | 92 (100.0%) | 0 (0.0%) |
| 6 to 18 Years | 218 (98.6%) | 3 (1.4%) |
| 19 to 25 Years | 153 (69.2%) | 68 (30.8%) |
| 26 to 34 Years | 131 (94.9%) | 7 (5.1%) |
| 35 to 44 Years | 143 (83.6%) | 28 (16.4%) |
| 45 to 54 Years | 168 (87.5%) | 24 (12.5%) |
| 55 to 64 Years | 186 (96.4%) | 7 (3.6%) |
| 65 to 74 Years | 84 (100.0%) | 0 (0.0%) |
| 75 Years and older | 47 (100.0%) | 0 (0.0%) |
| Total | 1,222 (89.9%) | 137 (10.1%) |
Health Insurance Coverage by Citizenship Status in Newville borough
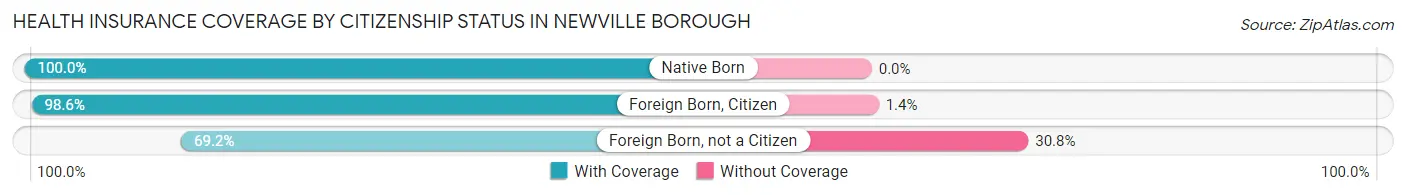
| Citizenship Status | With Coverage | Without Coverage |
| Native Born | 92 (100.0%) | 0 (0.0%) |
| Foreign Born, Citizen | 218 (98.6%) | 3 (1.4%) |
| Foreign Born, not a Citizen | 153 (69.2%) | 68 (30.8%) |
Health Insurance Coverage by Household Income in Newville borough
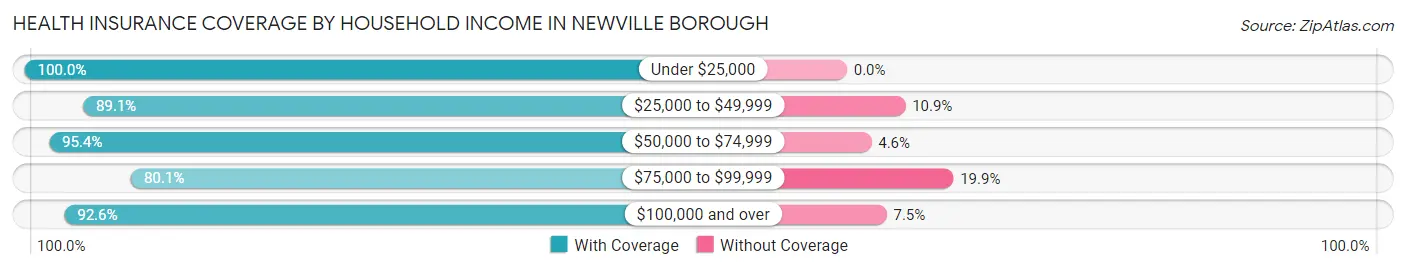
| Household Income | With Coverage | Without Coverage |
| Under $25,000 | 70 (100.0%) | 0 (0.0%) |
| $25,000 to $49,999 | 293 (89.1%) | 36 (10.9%) |
| $50,000 to $74,999 | 416 (95.4%) | 20 (4.6%) |
| $75,000 to $99,999 | 269 (80.1%) | 67 (19.9%) |
| $100,000 and over | 174 (92.5%) | 14 (7.4%) |
Public vs Private Health Insurance Coverage by Age in Newville borough
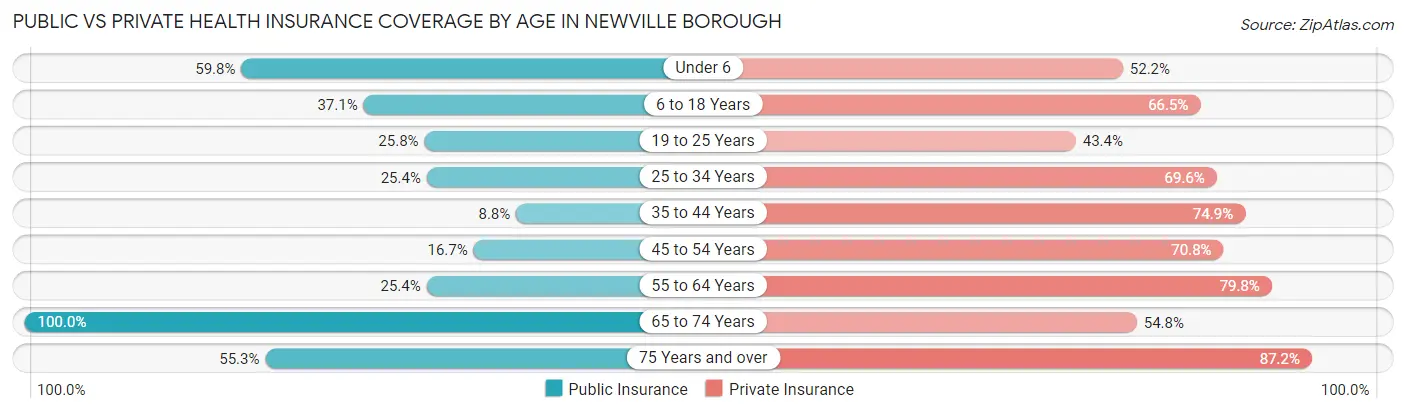
| Age Bracket | Public Insurance | Private Insurance |
| Under 6 | 55 (59.8%) | 48 (52.2%) |
| 6 to 18 Years | 82 (37.1%) | 147 (66.5%) |
| 19 to 25 Years | 57 (25.8%) | 96 (43.4%) |
| 25 to 34 Years | 35 (25.4%) | 96 (69.6%) |
| 35 to 44 Years | 15 (8.8%) | 128 (74.9%) |
| 45 to 54 Years | 32 (16.7%) | 136 (70.8%) |
| 55 to 64 Years | 49 (25.4%) | 154 (79.8%) |
| 65 to 74 Years | 84 (100.0%) | 46 (54.8%) |
| 75 Years and over | 26 (55.3%) | 41 (87.2%) |
| Total | 435 (32.0%) | 892 (65.6%) |
Disability Status by Sex by Age in Newville borough
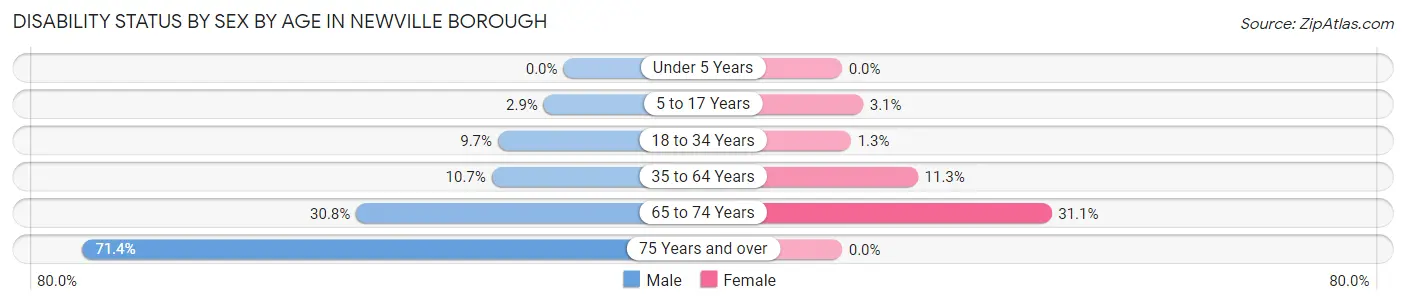
| Age Bracket | Male | Female |
| Under 5 Years | 0 (0.0%) | 0 (0.0%) |
| 5 to 17 Years | 4 (2.9%) | 3 (3.1%) |
| 18 to 34 Years | 21 (9.7%) | 2 (1.3%) |
| 35 to 64 Years | 28 (10.6%) | 33 (11.3%) |
| 65 to 74 Years | 12 (30.8%) | 14 (31.1%) |
| 75 Years and over | 15 (71.4%) | 0 (0.0%) |
Disability Class by Sex by Age in Newville borough
Disability Class: Hearing Difficulty
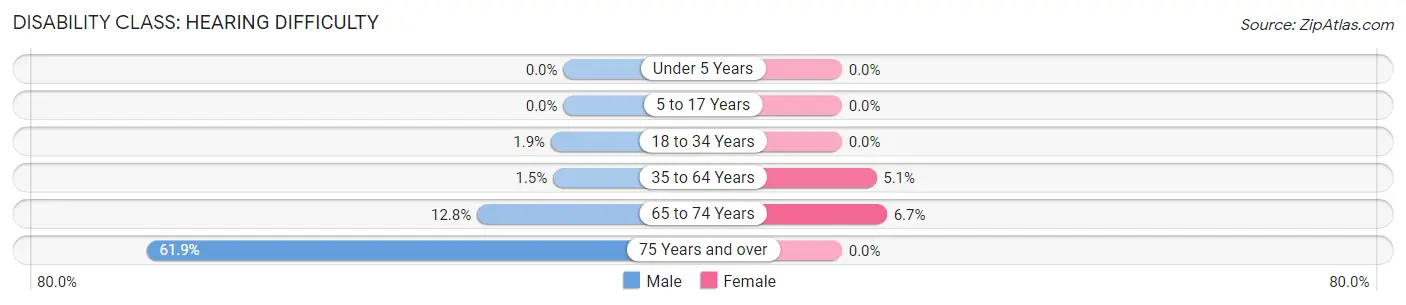
| Age Bracket | Male | Female |
| Under 5 Years | 0 (0.0%) | 0 (0.0%) |
| 5 to 17 Years | 0 (0.0%) | 0 (0.0%) |
| 18 to 34 Years | 4 (1.8%) | 0 (0.0%) |
| 35 to 64 Years | 4 (1.5%) | 15 (5.1%) |
| 65 to 74 Years | 5 (12.8%) | 3 (6.7%) |
| 75 Years and over | 13 (61.9%) | 0 (0.0%) |
Disability Class: Vision Difficulty
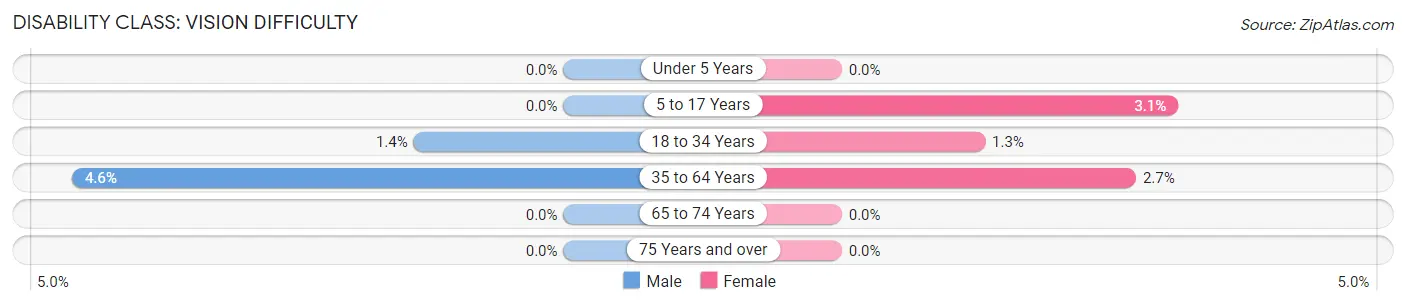
| Age Bracket | Male | Female |
| Under 5 Years | 0 (0.0%) | 0 (0.0%) |
| 5 to 17 Years | 0 (0.0%) | 3 (3.1%) |
| 18 to 34 Years | 3 (1.4%) | 2 (1.3%) |
| 35 to 64 Years | 12 (4.6%) | 8 (2.7%) |
| 65 to 74 Years | 0 (0.0%) | 0 (0.0%) |
| 75 Years and over | 0 (0.0%) | 0 (0.0%) |
Disability Class: Cognitive Difficulty
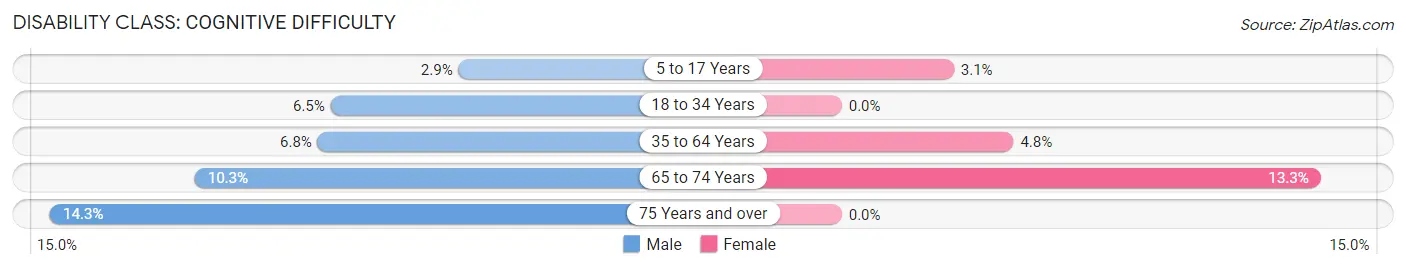
| Age Bracket | Male | Female |
| 5 to 17 Years | 4 (2.9%) | 3 (3.1%) |
| 18 to 34 Years | 14 (6.5%) | 0 (0.0%) |
| 35 to 64 Years | 18 (6.8%) | 14 (4.8%) |
| 65 to 74 Years | 4 (10.3%) | 6 (13.3%) |
| 75 Years and over | 3 (14.3%) | 0 (0.0%) |
Disability Class: Ambulatory Difficulty
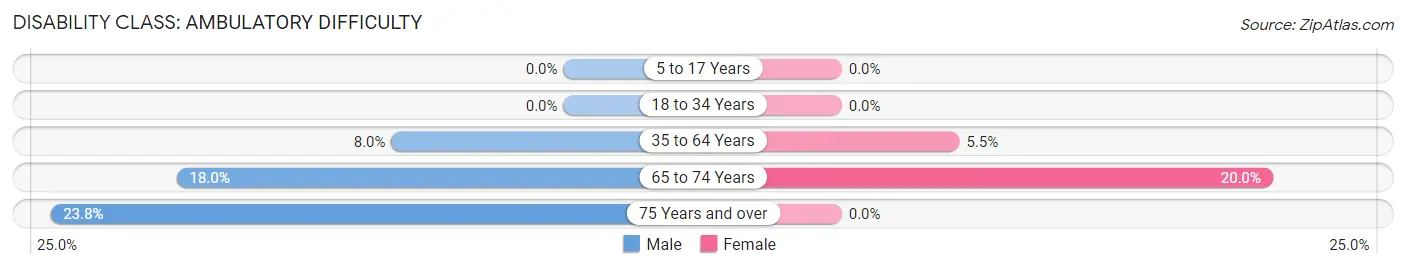
| Age Bracket | Male | Female |
| 5 to 17 Years | 0 (0.0%) | 0 (0.0%) |
| 18 to 34 Years | 0 (0.0%) | 0 (0.0%) |
| 35 to 64 Years | 21 (8.0%) | 16 (5.5%) |
| 65 to 74 Years | 7 (17.9%) | 9 (20.0%) |
| 75 Years and over | 5 (23.8%) | 0 (0.0%) |
Disability Class: Self-Care Difficulty
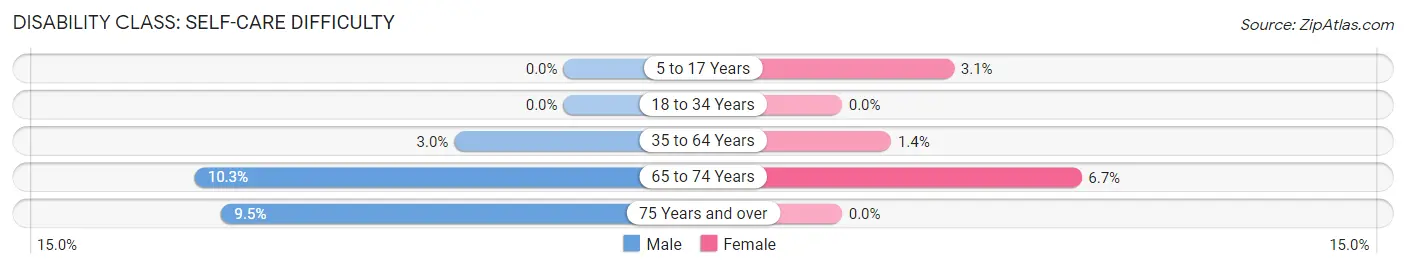
| Age Bracket | Male | Female |
| 5 to 17 Years | 0 (0.0%) | 3 (3.1%) |
| 18 to 34 Years | 0 (0.0%) | 0 (0.0%) |
| 35 to 64 Years | 8 (3.0%) | 4 (1.4%) |
| 65 to 74 Years | 4 (10.3%) | 3 (6.7%) |
| 75 Years and over | 2 (9.5%) | 0 (0.0%) |
Technology Access in Newville borough
Computing Device Access in Newville borough
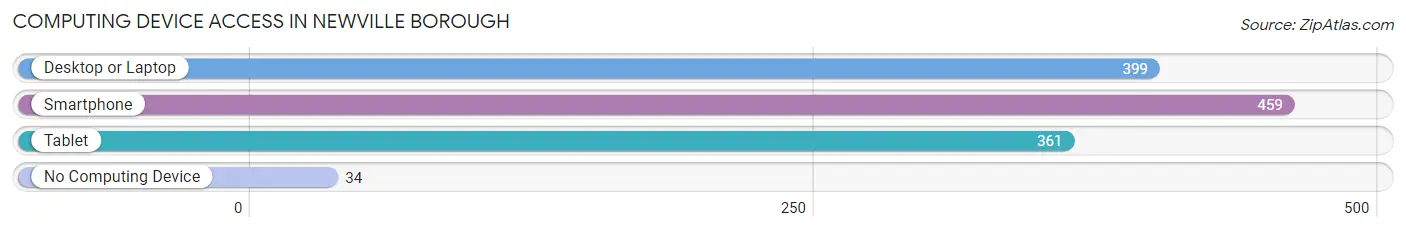
| Device Type | # Households | % Households |
| Desktop or Laptop | 399 | 74.9% |
| Smartphone | 459 | 86.1% |
| Tablet | 361 | 67.7% |
| No Computing Device | 34 | 6.4% |
| Total | 533 | 100.0% |
Internet Access in Newville borough
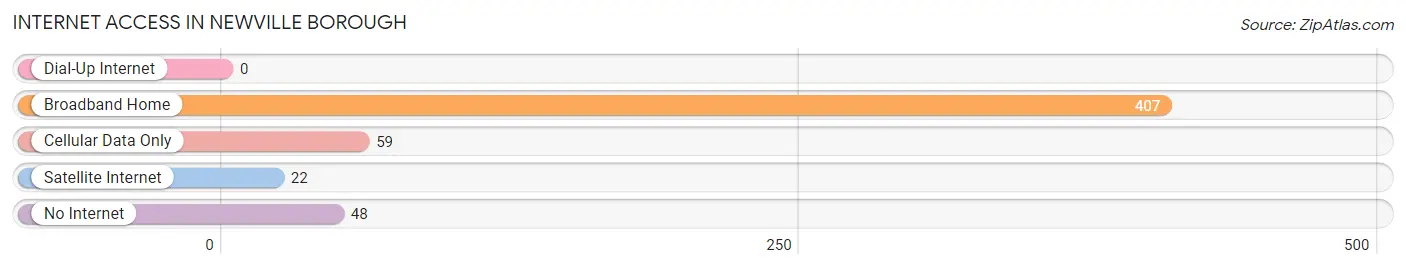
| Internet Type | # Households | % Households |
| Dial-Up Internet | 0 | 0.0% |
| Broadband Home | 407 | 76.4% |
| Cellular Data Only | 59 | 11.1% |
| Satellite Internet | 22 | 4.1% |
| No Internet | 48 | 9.0% |
| Total | 533 | 100.0% |
Newville borough Summary
Newville Borough is a small borough located in Cumberland County, Pennsylvania. It is situated in the south-central part of the state, approximately 20 miles west of Harrisburg, the state capital. The borough is part of the Carlisle Metropolitan Statistical Area and is home to a population of approximately 2,000 people.
History
Newville Borough was founded in 1814 by a group of settlers from Newville, New Jersey. The settlers were attracted to the area due to its fertile soil and abundant natural resources. The borough was officially incorporated in 1820 and was named after its founders’ hometown.
In the early 19th century, Newville was a thriving agricultural community. The borough was home to several mills, including a grist mill, a saw mill, and a woolen mill. The borough also had a tannery, a blacksmith shop, and a general store.
In the late 19th century, the borough began to experience a period of industrialization. The Cumberland Valley Railroad was built through the borough in 1871, connecting it to Harrisburg and other nearby towns. This allowed for the transportation of goods and people, and helped to spur economic growth in the area.
In the early 20th century, Newville Borough experienced a period of growth and development. The borough was home to several factories, including a shirt factory, a shoe factory, and a furniture factory. The borough also had a number of stores, including a grocery store, a hardware store, and a drug store.
Geography
Newville Borough is located in south-central Pennsylvania, approximately 20 miles west of Harrisburg. The borough is situated in the Cumberland Valley, which is part of the Ridge and Valley physiographic province. The borough is bordered by Southampton Township to the north, Shippensburg Township to the east, Southampton Township to the south, and Lurgan Township to the west.
The borough is situated on a plateau, with elevations ranging from 500 to 1,000 feet above sea level. The borough is located in a humid continental climate zone, with hot, humid summers and cold, snowy winters.
Economy
Newville Borough’s economy is largely based on agriculture and manufacturing. The borough is home to several farms, which produce a variety of crops, including corn, soybeans, hay, and wheat. The borough also has several factories, which produce a variety of products, including furniture, clothing, and shoes.
The borough is also home to several small businesses, including restaurants, retail stores, and service providers. The borough is also home to a number of government offices, including the Cumberland County Courthouse and the Newville Borough Hall.
Demographics
As of the 2010 census, Newville Borough had a population of 2,000 people. The racial makeup of the borough was 95.5% White, 1.5% African American, 0.5% Native American, 0.5% Asian, and 2.0% from other races. The median household income was $41,250, and the median family income was $50,000.
The borough is home to a number of churches, including the Newville United Methodist Church, the Newville Presbyterian Church, and the Newville Baptist Church. The borough is also home to a number of schools, including the Newville Elementary School, the Newville Middle School, and the Newville High School.
Conclusion
Newville Borough is a small borough located in Cumberland County, Pennsylvania. It is situated in the south-central part of the state, approximately 20 miles west of Harrisburg, the state capital. The borough is part of the Carlisle Metropolitan Statistical Area and is home to a population of approximately 2,000 people. The borough’s economy is largely based on agriculture and manufacturing, and the borough is home to several small businesses, churches, and schools.
Common Questions
What is Per Capita Income in Newville borough?
Per Capita income in Newville borough is $26,067.
What is the Median Family Income in Newville borough?
Median Family Income in Newville borough is $58,000.
What is the Median Household income in Newville borough?
Median Household Income in Newville borough is $59,875.
What is Income or Wage Gap in Newville borough?
Income or Wage Gap in Newville borough is 17.1%.
Women in Newville borough earn 82.9 cents for every dollar earned by a man.
What is Inequality or Gini Index in Newville borough?
Inequality or Gini Index in Newville borough is 0.32.
What is the Total Population of Newville borough?
Total Population of Newville borough is 1,359.
What is the Total Male Population of Newville borough?
Total Male Population of Newville borough is 717.
What is the Total Female Population of Newville borough?
Total Female Population of Newville borough is 642.
What is the Ratio of Males per 100 Females in Newville borough?
There are 111.68 Males per 100 Females in Newville borough.
What is the Ratio of Females per 100 Males in Newville borough?
There are 89.54 Females per 100 Males in Newville borough.
What is the Median Population Age in Newville borough?
Median Population Age in Newville borough is 35.6 Years.
What is the Average Family Size in Newville borough
Average Family Size in Newville borough is 2.8 People.
What is the Average Household Size in Newville borough
Average Household Size in Newville borough is 2.5 People.
How Large is the Labor Force in Newville borough?
There are 792 People in the Labor Forcein in Newville borough.
What is the Percentage of People in the Labor Force in Newville borough?
70.6% of People are in the Labor Force in Newville borough.
What is the Unemployment Rate in Newville borough?
Unemployment Rate in Newville borough is 3.3%.