Marysville borough, PA Map & Demographics
Marysville borough Overview
$51,270
PER CAPITA INCOME
$95,144
AVG FAMILY INCOME
$65,350
AVG HOUSEHOLD INCOME
7.2%
WAGE / INCOME GAP [ % ]
92.8¢/ $1
WAGE / INCOME GAP [ $ ]
0.52
INEQUALITY / GINI INDEX
2,651
TOTAL POPULATION
1,256
MALE POPULATION
1,395
FEMALE POPULATION
90.04
MALES / 100 FEMALES
111.07
FEMALES / 100 MALES
41.9
MEDIAN AGE
2.9
AVG FAMILY SIZE
2.1
AVG HOUSEHOLD SIZE
1,533
LABOR FORCE [ PEOPLE ]
71.6%
PERCENT IN LABOR FORCE
4.9%
UNEMPLOYMENT RATE
Income in Marysville borough
Income Overview in Marysville borough
Per Capita Income in Marysville borough is $51,270, while median incomes of families and households are $95,144 and $65,350 respectively.
| Characteristic | Number | Measure |
| Per Capita Income | 2,651 | $51,270 |
| Median Family Income | 675 | $95,144 |
| Mean Family Income | 675 | $125,414 |
| Median Household Income | 1,239 | $65,350 |
| Mean Household Income | 1,239 | $103,168 |
| Income Deficit | 675 | $0 |
| Wage / Income Gap (%) | 2,651 | 7.22% |
| Wage / Income Gap ($) | 2,651 | 92.78¢ per $1 |
| Gini / Inequality Index | 2,651 | 0.52 |
Earnings by Sex in Marysville borough
Average Earnings in Marysville borough are $47,094, $50,288 for men and $46,657 for women, a difference of 7.2%.
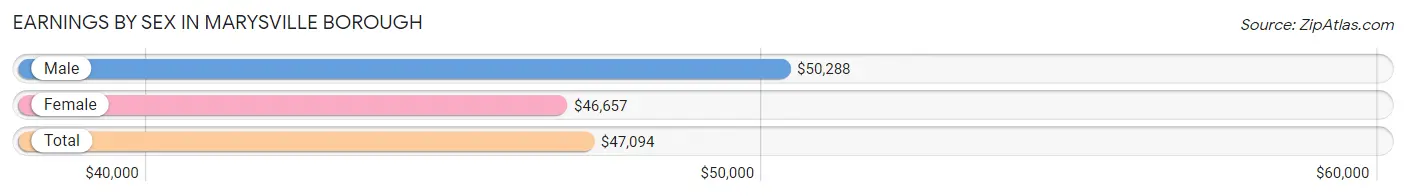
| Sex | Number | Average Earnings |
| Male | 753 (49.3%) | $50,288 |
| Female | 775 (50.7%) | $46,657 |
| Total | 1,528 (100.0%) | $47,094 |
Earnings by Sex by Income Bracket in Marysville borough
The most common earnings brackets in Marysville borough are $100,000+ for men (170 | 22.6%) and $55,000 to $64,999 for women (110 | 14.2%).
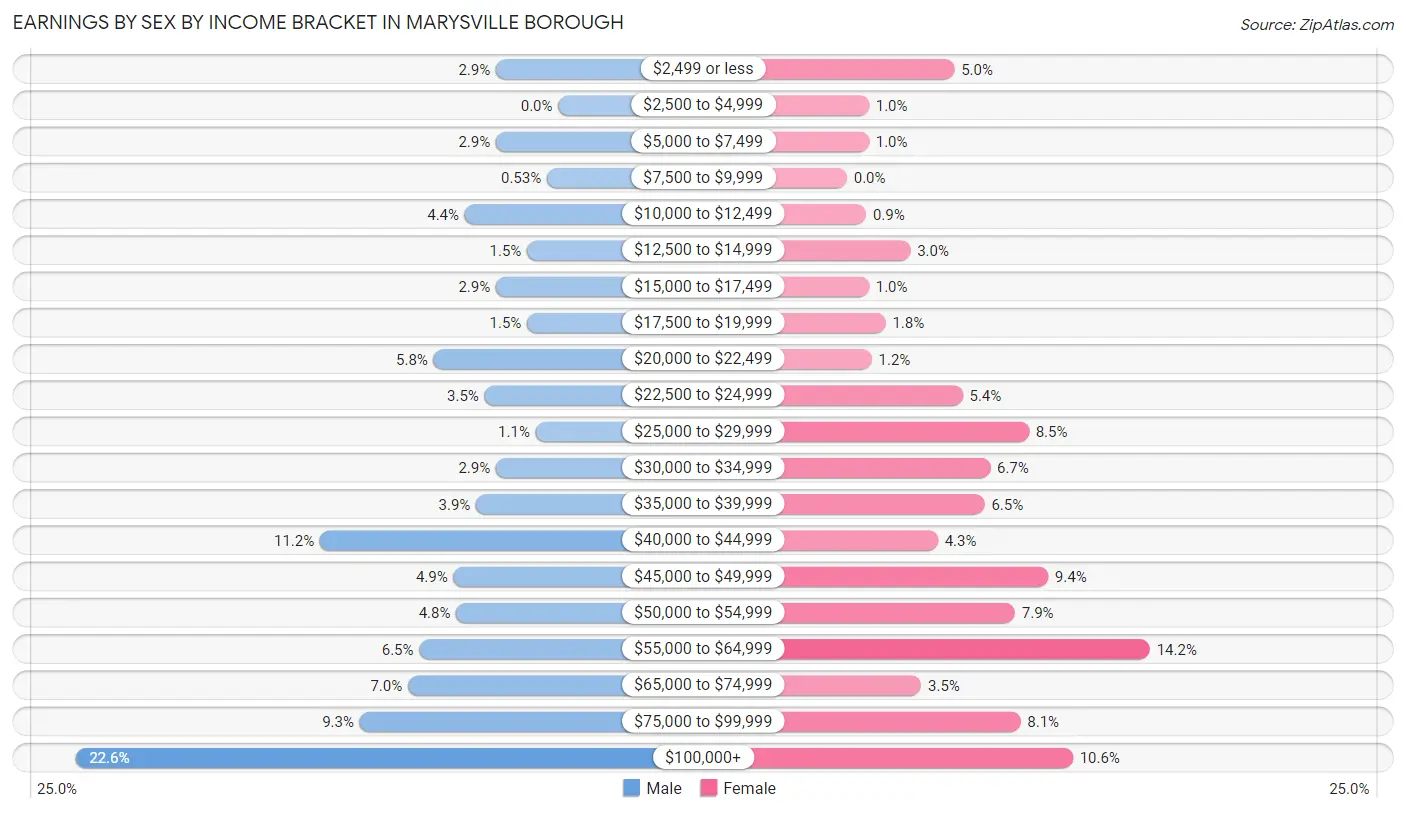
| Income | Male | Female |
| $2,499 or less | 22 (2.9%) | 39 (5.0%) |
| $2,500 to $4,999 | 0 (0.0%) | 8 (1.0%) |
| $5,000 to $7,499 | 22 (2.9%) | 8 (1.0%) |
| $7,500 to $9,999 | 4 (0.5%) | 0 (0.0%) |
| $10,000 to $12,499 | 33 (4.4%) | 7 (0.9%) |
| $12,500 to $14,999 | 11 (1.5%) | 23 (3.0%) |
| $15,000 to $17,499 | 22 (2.9%) | 8 (1.0%) |
| $17,500 to $19,999 | 11 (1.5%) | 14 (1.8%) |
| $20,000 to $22,499 | 44 (5.8%) | 9 (1.2%) |
| $22,500 to $24,999 | 26 (3.5%) | 42 (5.4%) |
| $25,000 to $29,999 | 8 (1.1%) | 66 (8.5%) |
| $30,000 to $34,999 | 22 (2.9%) | 52 (6.7%) |
| $35,000 to $39,999 | 29 (3.8%) | 50 (6.5%) |
| $40,000 to $44,999 | 84 (11.2%) | 33 (4.3%) |
| $45,000 to $49,999 | 37 (4.9%) | 73 (9.4%) |
| $50,000 to $54,999 | 36 (4.8%) | 61 (7.9%) |
| $55,000 to $64,999 | 49 (6.5%) | 110 (14.2%) |
| $65,000 to $74,999 | 53 (7.0%) | 27 (3.5%) |
| $75,000 to $99,999 | 70 (9.3%) | 63 (8.1%) |
| $100,000+ | 170 (22.6%) | 82 (10.6%) |
| Total | 753 (100.0%) | 775 (100.0%) |
Earnings by Sex by Educational Attainment in Marysville borough
Average earnings in Marysville borough are $53,804 for men and $47,238 for women, a difference of 12.2%. Men with an educational attainment of college or associate's degree enjoy the highest average annual earnings of $46,458, while those with high school diploma education earn the least with $41,563. Women with an educational attainment of graduate degree earn the most with the average annual earnings of $101,630, while those with college or associate's degree education have the smallest earnings of $36,450.
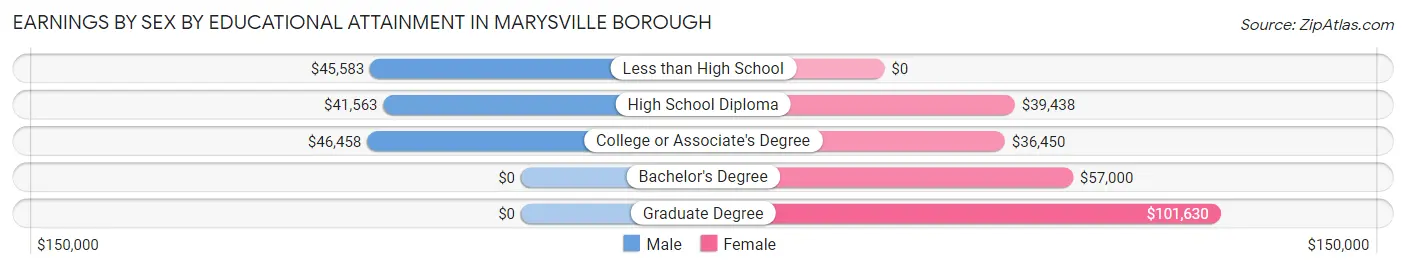
| Educational Attainment | Male Income | Female Income |
| Less than High School | $45,583 | $0 |
| High School Diploma | $41,563 | $39,438 |
| College or Associate's Degree | $46,458 | $36,450 |
| Bachelor's Degree | - | - |
| Graduate Degree | - | - |
| Total | $53,804 | $47,238 |
Family Income in Marysville borough
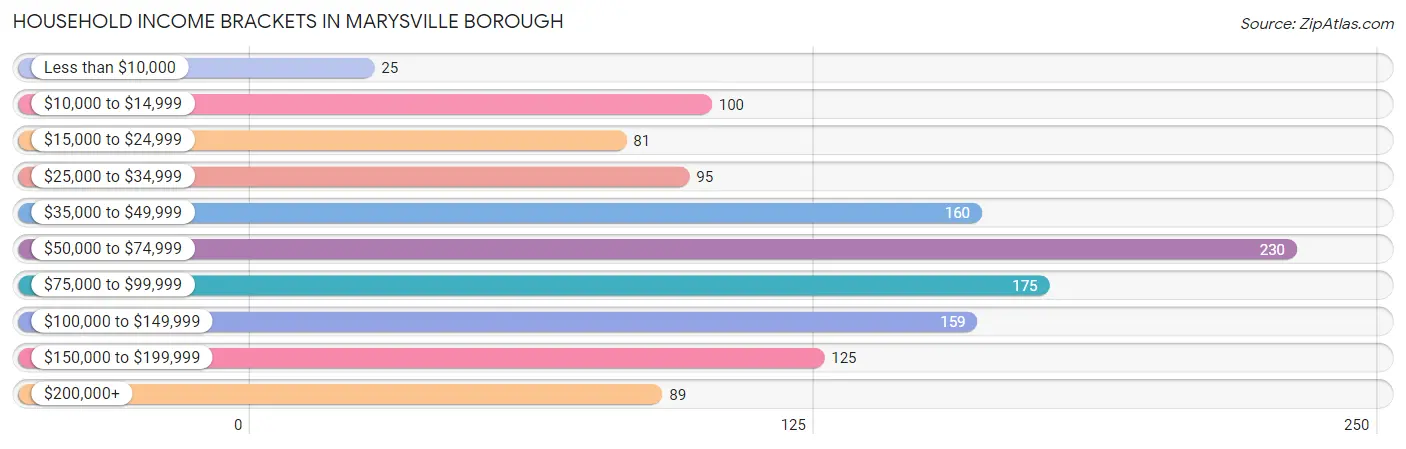
Family Income Brackets in Marysville borough
According to the Marysville borough family income data, there are 132 families falling into the $75,000 to $99,999 income range, which is the most common income bracket and makes up 19.6% of all families.
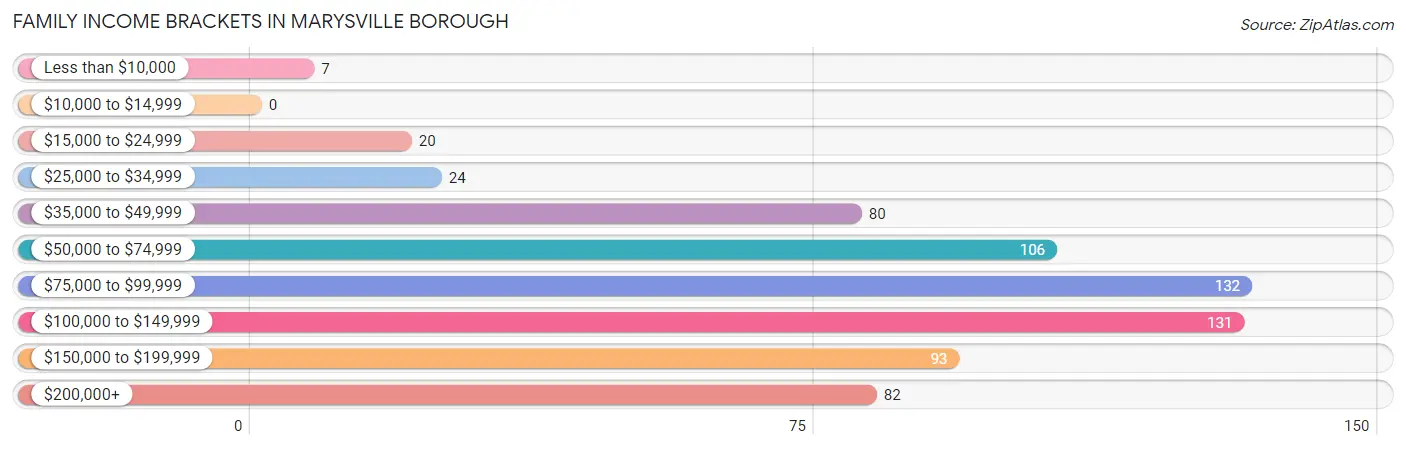
| Income Bracket | # Families | % Families |
| Less than $10,000 | 7 | 1.0% |
| $10,000 to $14,999 | 0 | 0.0% |
| $15,000 to $24,999 | 20 | 3.0% |
| $25,000 to $34,999 | 24 | 3.6% |
| $35,000 to $49,999 | 80 | 11.9% |
| $50,000 to $74,999 | 106 | 15.7% |
| $75,000 to $99,999 | 132 | 19.6% |
| $100,000 to $149,999 | 131 | 19.4% |
| $150,000 to $199,999 | 93 | 13.8% |
| $200,000+ | 82 | 12.1% |
Family Income by Famaliy Size in Marysville borough
3-person families (107 | 15.9%) account for the highest median family income in Marysville borough with $123,194 per family, while 2-person families (400 | 59.3%) have the highest median income of $43,056 per family member.
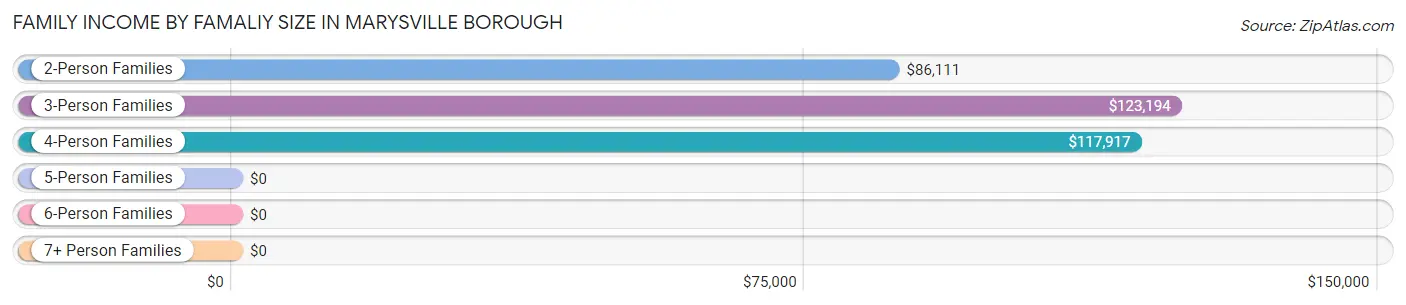
| Income Bracket | # Families | Median Income |
| 2-Person Families | 400 (59.3%) | $86,111 |
| 3-Person Families | 107 (15.9%) | $123,194 |
| 4-Person Families | 103 (15.3%) | $117,917 |
| 5-Person Families | 65 (9.6%) | $0 |
| 6-Person Families | 0 (0.0%) | $0 |
| 7+ Person Families | 0 (0.0%) | $0 |
| Total | 675 (100.0%) | $95,144 |
Family Income by Number of Earners in Marysville borough
The median family income in Marysville borough is $95,144, with families comprising 3+ earners (57) having the highest median family income of $128,203, while families with 1 earner (169) have the lowest median family income of $54,583, accounting for 8.4% and 25.0% of families, respectively.
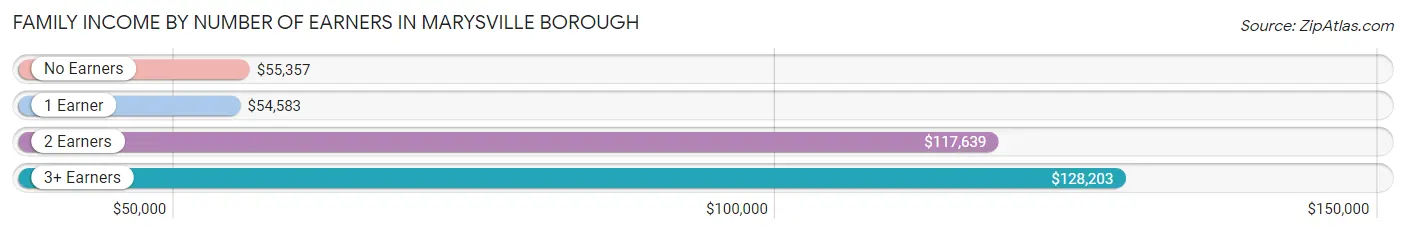
| Number of Earners | # Families | Median Income |
| No Earners | 92 (13.6%) | $55,357 |
| 1 Earner | 169 (25.0%) | $54,583 |
| 2 Earners | 357 (52.9%) | $117,639 |
| 3+ Earners | 57 (8.4%) | $128,203 |
| Total | 675 (100.0%) | $95,144 |
Household Income in Marysville borough
Household Income Brackets in Marysville borough
With 230 households falling in the category, the $50,000 to $74,999 income range is the most frequent in Marysville borough, accounting for 18.6% of all households. In contrast, only 25 households (2.0%) fall into the less than $10,000 income bracket, making it the least populous group.
| Income Bracket | # Households | % Households |
| Less than $10,000 | 25 | 2.0% |
| $10,000 to $14,999 | 100 | 8.1% |
| $15,000 to $24,999 | 81 | 6.5% |
| $25,000 to $34,999 | 95 | 7.7% |
| $35,000 to $49,999 | 160 | 12.9% |
| $50,000 to $74,999 | 230 | 18.6% |
| $75,000 to $99,999 | 175 | 14.1% |
| $100,000 to $149,999 | 159 | 12.8% |
| $150,000 to $199,999 | 125 | 10.1% |
| $200,000+ | 89 | 7.2% |
Household Income by Householder Age in Marysville borough
The median household income in Marysville borough is $65,350, with the highest median household income of $103,594 found in the 45 to 64 years age bracket for the primary householder. A total of 357 households (28.8%) fall into this category. Meanwhile, the 65+ years age bracket for the primary householder has the lowest median household income of $38,688, with 381 households (30.7%) in this group.
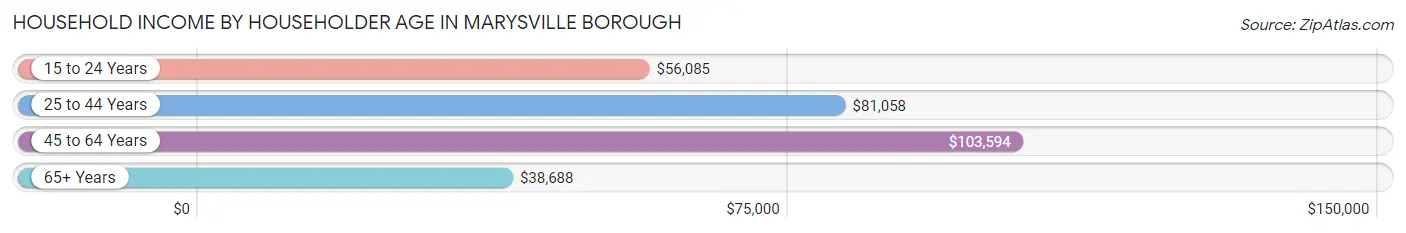
| Income Bracket | # Households | Median Income |
| 15 to 24 Years | 74 (6.0%) | $56,085 |
| 25 to 44 Years | 427 (34.5%) | $81,058 |
| 45 to 64 Years | 357 (28.8%) | $103,594 |
| 65+ Years | 381 (30.7%) | $38,688 |
| Total | 1,239 (100.0%) | $65,350 |
Poverty in Marysville borough
Income Below Poverty by Sex and Age in Marysville borough
With 8.8% poverty level for males and 12.3% for females among the residents of Marysville borough, under 5 year old males and 75 year old and over females are the most vulnerable to poverty, with 8 males (21.6%) and 37 females (35.2%) in their respective age groups living below the poverty level.
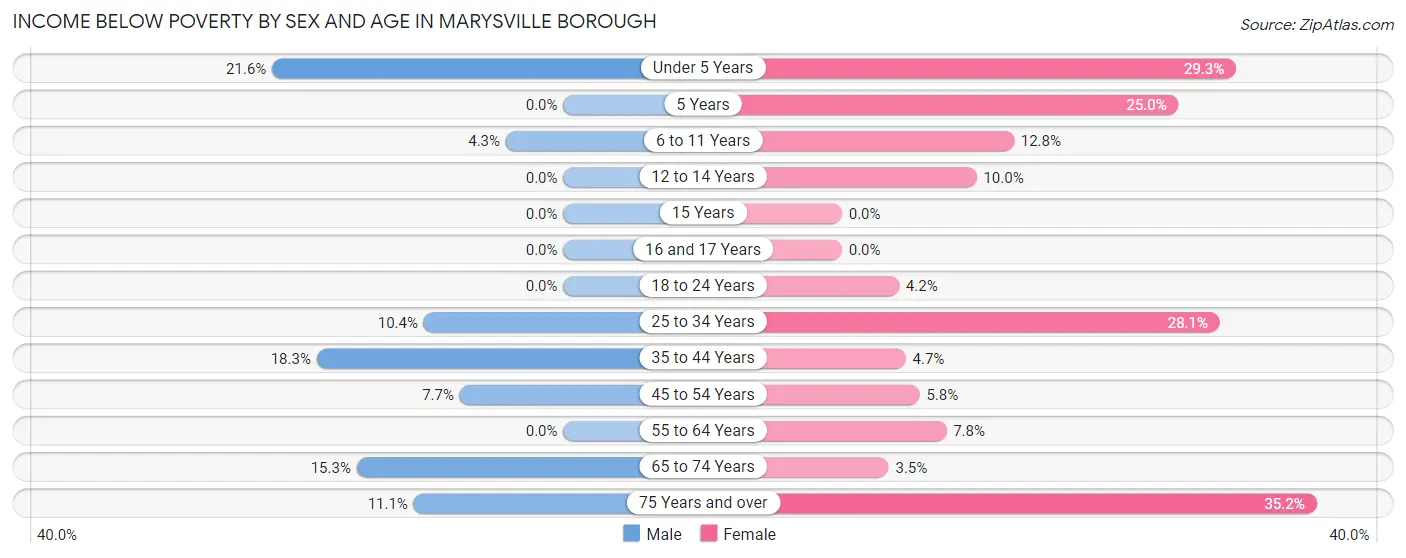
| Age Bracket | Male | Female |
| Under 5 Years | 8 (21.6%) | 12 (29.3%) |
| 5 Years | 0 (0.0%) | 5 (25.0%) |
| 6 to 11 Years | 5 (4.3%) | 12 (12.8%) |
| 12 to 14 Years | 0 (0.0%) | 6 (10.0%) |
| 15 Years | 0 (0.0%) | 0 (0.0%) |
| 16 and 17 Years | 0 (0.0%) | 0 (0.0%) |
| 18 to 24 Years | 0 (0.0%) | 5 (4.2%) |
| 25 to 34 Years | 20 (10.4%) | 55 (28.1%) |
| 35 to 44 Years | 26 (18.3%) | 9 (4.7%) |
| 45 to 54 Years | 19 (7.7%) | 12 (5.8%) |
| 55 to 64 Years | 0 (0.0%) | 11 (7.7%) |
| 65 to 74 Years | 27 (15.3%) | 6 (3.5%) |
| 75 Years and over | 6 (11.1%) | 37 (35.2%) |
| Total | 111 (8.8%) | 170 (12.3%) |
Income Above Poverty by Sex and Age in Marysville borough
According to the poverty statistics in Marysville borough, males aged 5 years and females aged 15 years are the age groups that are most secure financially, with 100.0% of males and 100.0% of females in these age groups living above the poverty line.

| Age Bracket | Male | Female |
| Under 5 Years | 29 (78.4%) | 29 (70.7%) |
| 5 Years | 7 (100.0%) | 15 (75.0%) |
| 6 to 11 Years | 112 (95.7%) | 82 (87.2%) |
| 12 to 14 Years | 25 (100.0%) | 54 (90.0%) |
| 15 Years | 73 (100.0%) | 23 (100.0%) |
| 16 and 17 Years | 0 (0.0%) | 12 (100.0%) |
| 18 to 24 Years | 47 (100.0%) | 113 (95.8%) |
| 25 to 34 Years | 173 (89.6%) | 141 (71.9%) |
| 35 to 44 Years | 116 (81.7%) | 181 (95.3%) |
| 45 to 54 Years | 228 (92.3%) | 196 (94.2%) |
| 55 to 64 Years | 138 (100.0%) | 131 (92.2%) |
| 65 to 74 Years | 149 (84.7%) | 167 (96.5%) |
| 75 Years and over | 48 (88.9%) | 68 (64.8%) |
| Total | 1,145 (91.2%) | 1,212 (87.7%) |
Income Below Poverty Among Married-Couple Families in Marysville borough
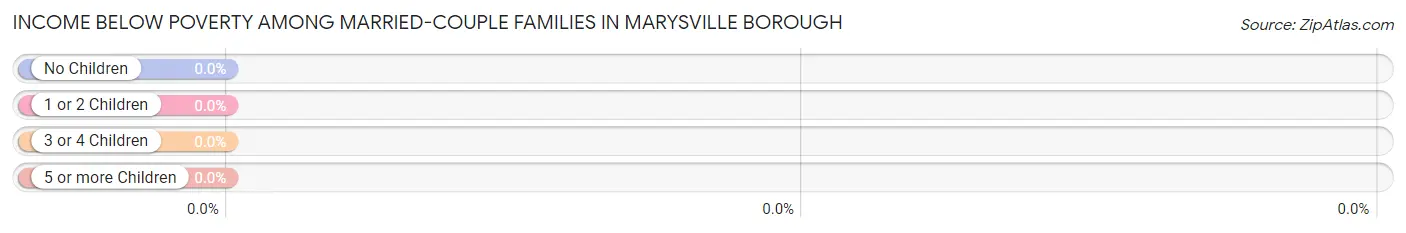
| Children | Above Poverty | Below Poverty |
| No Children | 325 (100.0%) | 0 (0.0%) |
| 1 or 2 Children | 151 (100.0%) | 0 (0.0%) |
| 3 or 4 Children | 36 (100.0%) | 0 (0.0%) |
| 5 or more Children | 0 (0.0%) | 0 (0.0%) |
| Total | 512 (100.0%) | 0 (0.0%) |
Income Below Poverty Among Single-Parent Households in Marysville borough
According to the poverty data in Marysville borough, 10.9% or 6 single-father households and 11.1% or 12 single-mother households are living below the poverty line. Among single-father households, those with 1 or 2 children have the highest poverty rate, with 6 households (15.8%) experiencing poverty. Likewise, among single-mother households, those with 3 or 4 children have the highest poverty rate, with 7 households (24.1%) falling below the poverty line.
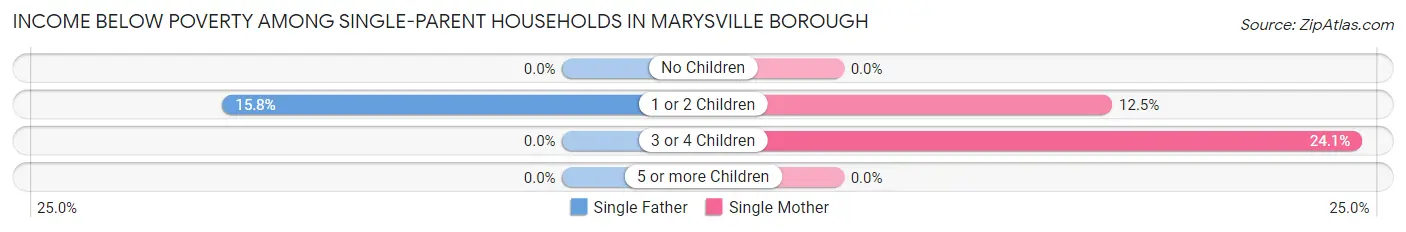
| Children | Single Father | Single Mother |
| No Children | 0 (0.0%) | 0 (0.0%) |
| 1 or 2 Children | 6 (15.8%) | 5 (12.5%) |
| 3 or 4 Children | 0 (0.0%) | 7 (24.1%) |
| 5 or more Children | 0 (0.0%) | 0 (0.0%) |
| Total | 6 (10.9%) | 12 (11.1%) |
Income Below Poverty Among Married-Couple vs Single-Parent Households in Marysville borough
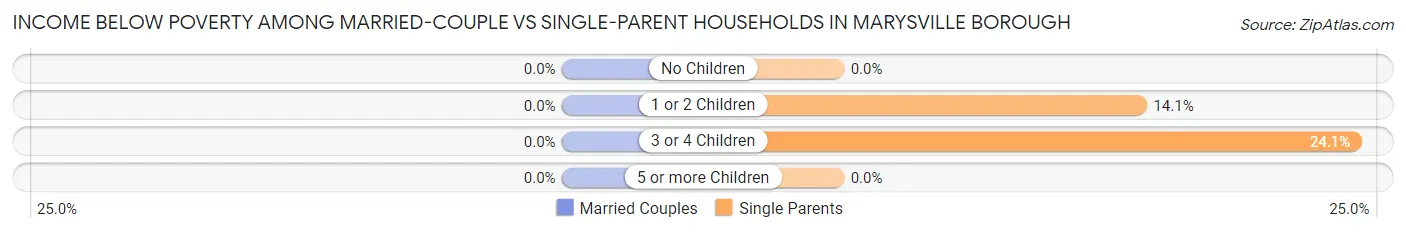
| Children | Married-Couple Families | Single-Parent Households |
| No Children | 0 (0.0%) | 0 (0.0%) |
| 1 or 2 Children | 0 (0.0%) | 11 (14.1%) |
| 3 or 4 Children | 0 (0.0%) | 7 (24.1%) |
| 5 or more Children | 0 (0.0%) | 0 (0.0%) |
| Total | 0 (0.0%) | 18 (11.0%) |
Race in Marysville borough
The most populous races in Marysville borough are White / Caucasian (2,480 | 93.5%), Hispanic or Latino (152 | 5.7%), and Two or more Races (88 | 3.3%).
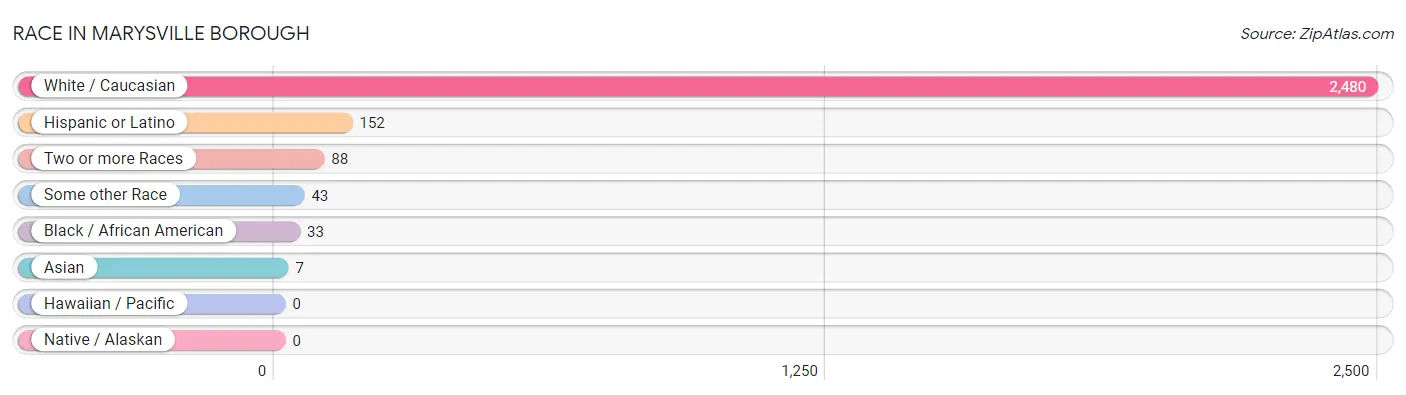
| Race | # Population | % Population |
| Asian | 7 | 0.3% |
| Black / African American | 33 | 1.2% |
| Hawaiian / Pacific | 0 | 0.0% |
| Hispanic or Latino | 152 | 5.7% |
| Native / Alaskan | 0 | 0.0% |
| White / Caucasian | 2,480 | 93.5% |
| Two or more Races | 88 | 3.3% |
| Some other Race | 43 | 1.6% |
| Total | 2,651 | 100.0% |
Ancestry in Marysville borough
The most populous ancestries reported in Marysville borough are German (1,005 | 37.9%), Irish (472 | 17.8%), Polish (353 | 13.3%), American (214 | 8.1%), and Italian (171 | 6.5%), together accounting for 83.5% of all Marysville borough residents.
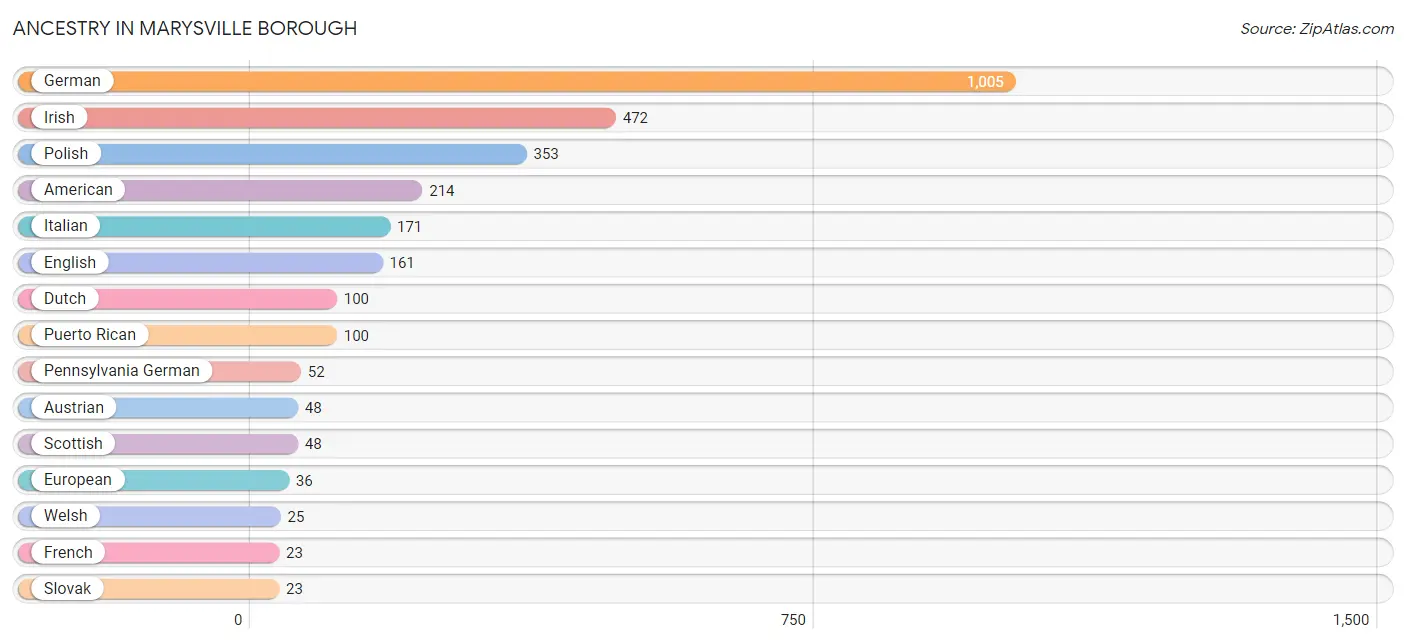
| Ancestry | # Population | % Population |
| American | 214 | 8.1% |
| Austrian | 48 | 1.8% |
| British | 14 | 0.5% |
| Central American | 15 | 0.6% |
| Costa Rican | 7 | 0.3% |
| Czech | 5 | 0.2% |
| Dutch | 100 | 3.8% |
| English | 161 | 6.1% |
| European | 36 | 1.4% |
| Finnish | 6 | 0.2% |
| French | 23 | 0.9% |
| German | 1,005 | 37.9% |
| Greek | 10 | 0.4% |
| Guatemalan | 8 | 0.3% |
| Hungarian | 10 | 0.4% |
| Indian (Asian) | 7 | 0.3% |
| Irish | 472 | 17.8% |
| Italian | 171 | 6.5% |
| Japanese | 7 | 0.3% |
| Malaysian | 7 | 0.3% |
| Mexican | 21 | 0.8% |
| Native Hawaiian | 13 | 0.5% |
| Pennsylvania German | 52 | 2.0% |
| Polish | 353 | 13.3% |
| Puerto Rican | 100 | 3.8% |
| Russian | 11 | 0.4% |
| Scandinavian | 6 | 0.2% |
| Scotch-Irish | 16 | 0.6% |
| Scottish | 48 | 1.8% |
| Slovak | 23 | 0.9% |
| Swiss | 5 | 0.2% |
| Ukrainian | 7 | 0.3% |
| Welsh | 25 | 0.9% | View All 33 Rows |
Immigrants in Marysville borough
The most numerous immigrant groups reported in Marysville borough came from Europe (33 | 1.2%), Eastern Europe (28 | 1.1%), Poland (28 | 1.1%), Central America (23 | 0.9%), and Latin America (23 | 0.9%), together accounting for 5.1% of all Marysville borough residents.
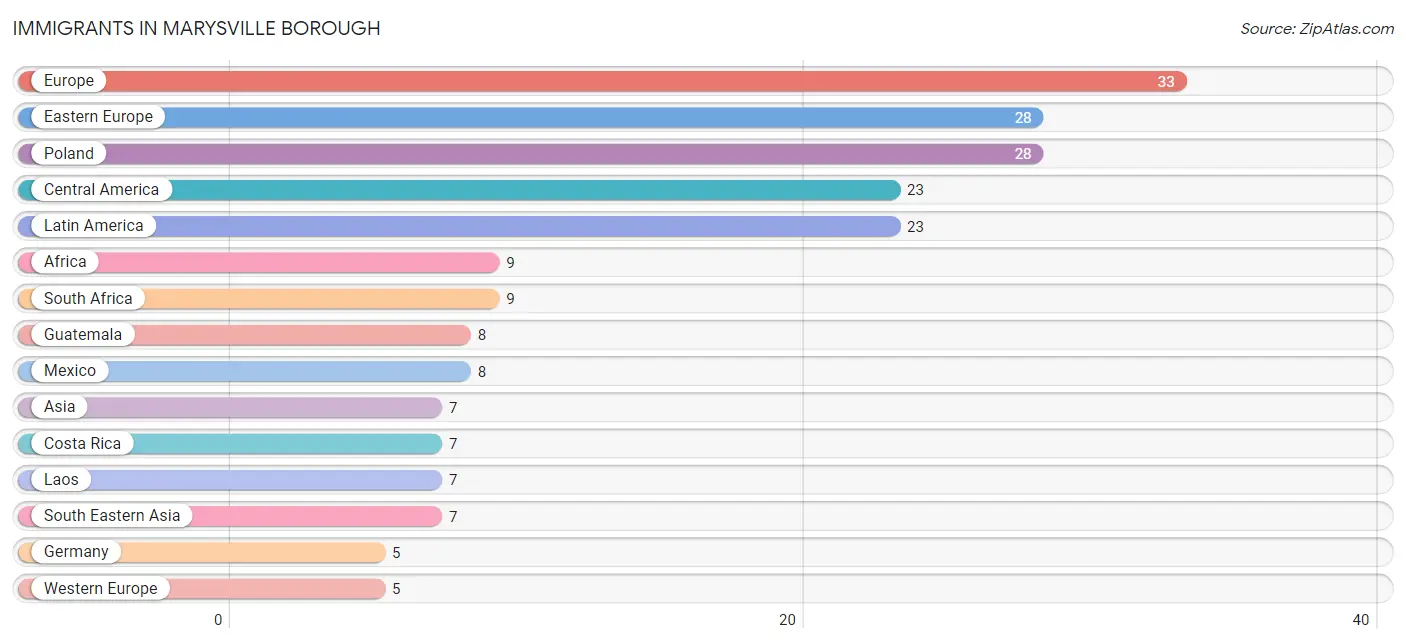
| Immigration Origin | # Population | % Population |
| Africa | 9 | 0.3% |
| Asia | 7 | 0.3% |
| Central America | 23 | 0.9% |
| Costa Rica | 7 | 0.3% |
| Eastern Europe | 28 | 1.1% |
| Europe | 33 | 1.2% |
| Germany | 5 | 0.2% |
| Guatemala | 8 | 0.3% |
| Laos | 7 | 0.3% |
| Latin America | 23 | 0.9% |
| Mexico | 8 | 0.3% |
| Poland | 28 | 1.1% |
| South Africa | 9 | 0.3% |
| South Eastern Asia | 7 | 0.3% |
| Western Europe | 5 | 0.2% | View All 15 Rows |
Sex and Age in Marysville borough
Sex and Age in Marysville borough
The most populous age groups in Marysville borough are 50 to 54 Years (139 | 11.1%) for men and 40 to 44 Years (117 | 8.4%) for women.
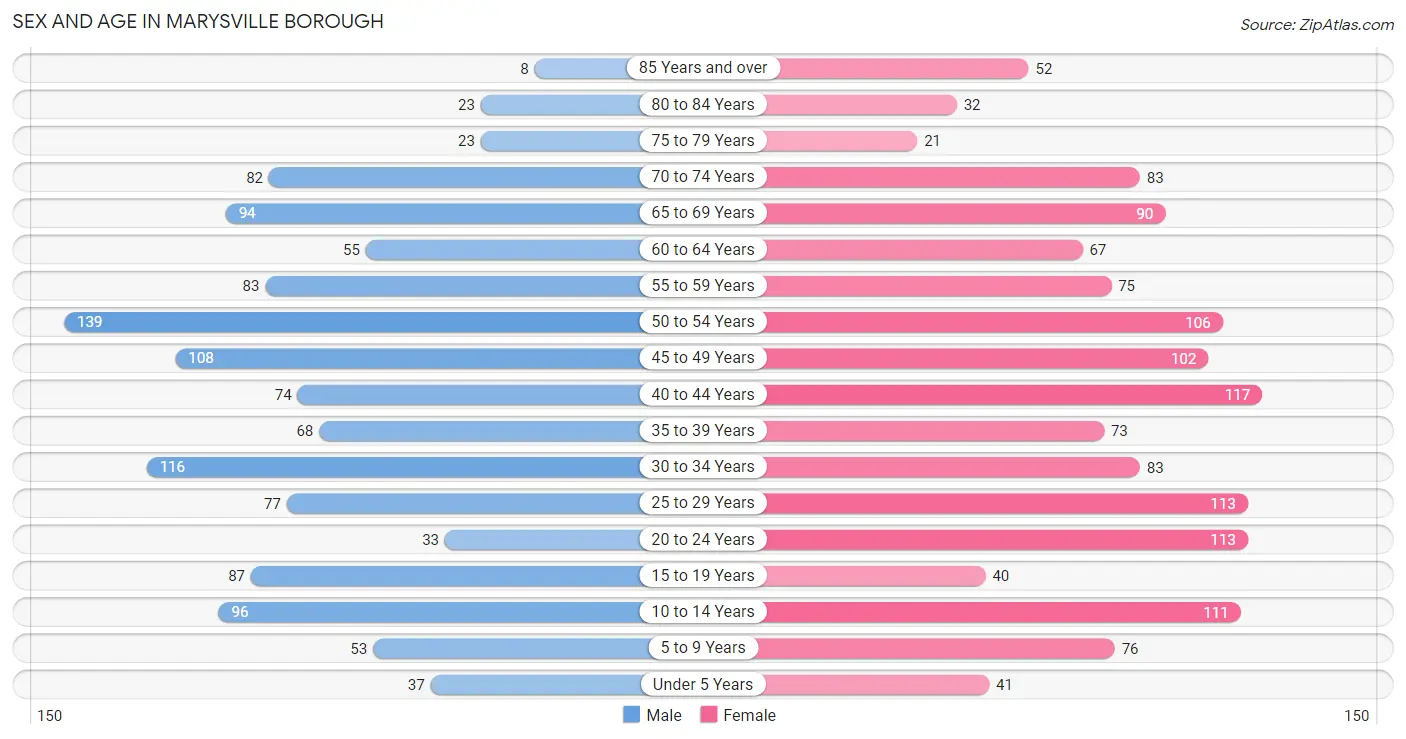
| Age Bracket | Male | Female |
| Under 5 Years | 37 (2.9%) | 41 (2.9%) |
| 5 to 9 Years | 53 (4.2%) | 76 (5.4%) |
| 10 to 14 Years | 96 (7.6%) | 111 (8.0%) |
| 15 to 19 Years | 87 (6.9%) | 40 (2.9%) |
| 20 to 24 Years | 33 (2.6%) | 113 (8.1%) |
| 25 to 29 Years | 77 (6.1%) | 113 (8.1%) |
| 30 to 34 Years | 116 (9.2%) | 83 (5.9%) |
| 35 to 39 Years | 68 (5.4%) | 73 (5.2%) |
| 40 to 44 Years | 74 (5.9%) | 117 (8.4%) |
| 45 to 49 Years | 108 (8.6%) | 102 (7.3%) |
| 50 to 54 Years | 139 (11.1%) | 106 (7.6%) |
| 55 to 59 Years | 83 (6.6%) | 75 (5.4%) |
| 60 to 64 Years | 55 (4.4%) | 67 (4.8%) |
| 65 to 69 Years | 94 (7.5%) | 90 (6.5%) |
| 70 to 74 Years | 82 (6.5%) | 83 (5.9%) |
| 75 to 79 Years | 23 (1.8%) | 21 (1.5%) |
| 80 to 84 Years | 23 (1.8%) | 32 (2.3%) |
| 85 Years and over | 8 (0.6%) | 52 (3.7%) |
| Total | 1,256 (100.0%) | 1,395 (100.0%) |
Families and Households in Marysville borough
Median Family Size in Marysville borough
The median family size in Marysville borough is 2.85 persons per family, with married-couple families (512 | 75.8%) accounting for the largest median family size of 2.87 persons per family. On the other hand, single male/father families (55 | 8.2%) represent the smallest median family size with 2.75 persons per family.
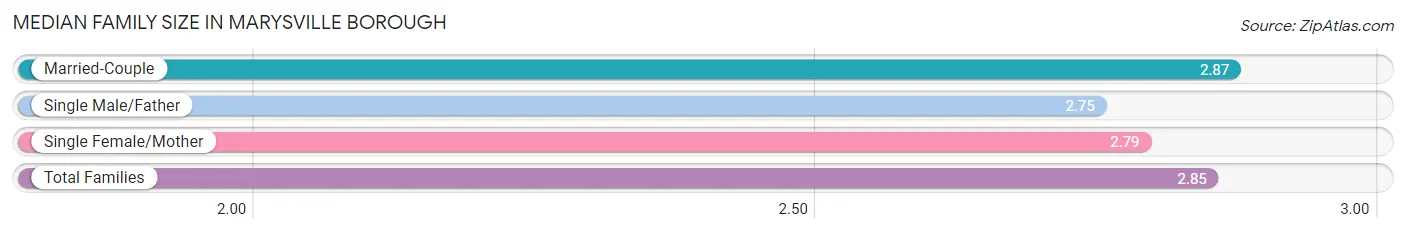
| Family Type | # Families | Family Size |
| Married-Couple | 512 (75.8%) | 2.87 |
| Single Male/Father | 55 (8.2%) | 2.75 |
| Single Female/Mother | 108 (16.0%) | 2.79 |
| Total Families | 675 (100.0%) | 2.85 |
Median Household Size in Marysville borough
The median household size in Marysville borough is 2.14 persons per household, with single male/father households (55 | 4.4%) accounting for the largest median household size of 3.29 persons per household. non-family households (564 | 45.5%) represent the smallest median household size with 1.20 persons per household.
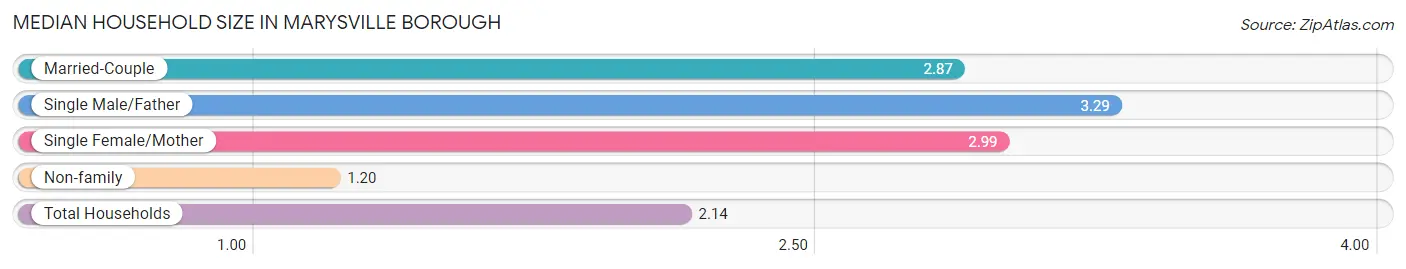
| Household Type | # Households | Household Size |
| Married-Couple | 512 (41.3%) | 2.87 |
| Single Male/Father | 55 (4.4%) | 3.29 |
| Single Female/Mother | 108 (8.7%) | 2.99 |
| Non-family | 564 (45.5%) | 1.20 |
| Total Households | 1,239 (100.0%) | 2.14 |
Household Size by Marriage Status in Marysville borough
Out of a total of 1,239 households in Marysville borough, 675 (54.5%) are family households, while 564 (45.5%) are nonfamily households. The most numerous type of family households are 2-person households, comprising 373, and the most common type of nonfamily households are 1-person households, comprising 490.
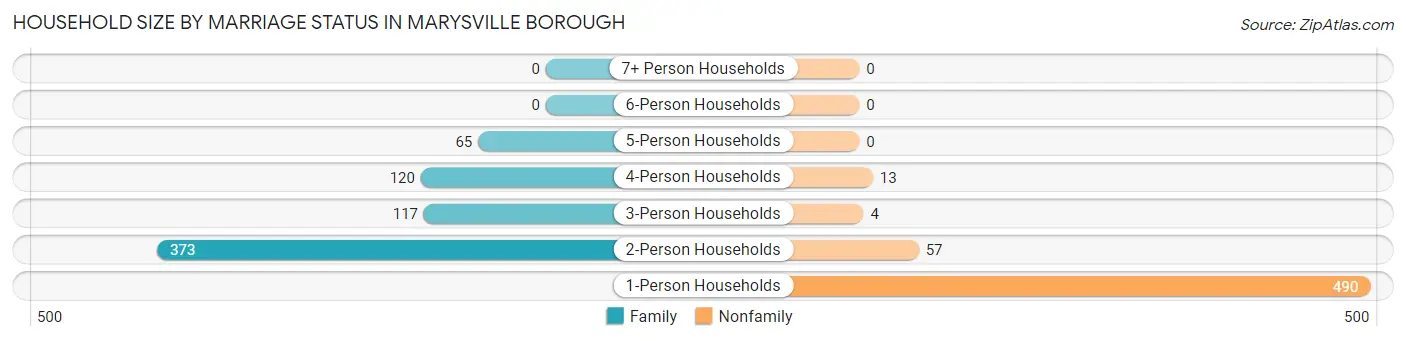
| Household Size | Family Households | Nonfamily Households |
| 1-Person Households | - | 490 (39.6%) |
| 2-Person Households | 373 (30.1%) | 57 (4.6%) |
| 3-Person Households | 117 (9.4%) | 4 (0.3%) |
| 4-Person Households | 120 (9.7%) | 13 (1.1%) |
| 5-Person Households | 65 (5.2%) | 0 (0.0%) |
| 6-Person Households | 0 (0.0%) | 0 (0.0%) |
| 7+ Person Households | 0 (0.0%) | 0 (0.0%) |
| Total | 675 (54.5%) | 564 (45.5%) |
Female Fertility in Marysville borough
Fertility by Age in Marysville borough
Average fertility rate in Marysville borough is 75.0 births per 1,000 women. Women in the age bracket of 15 to 19 years have the highest fertility rate with 125.0 births per 1,000 women. Women in the age bracket of 20 to 34 years acount for 55.1% of all women with births.
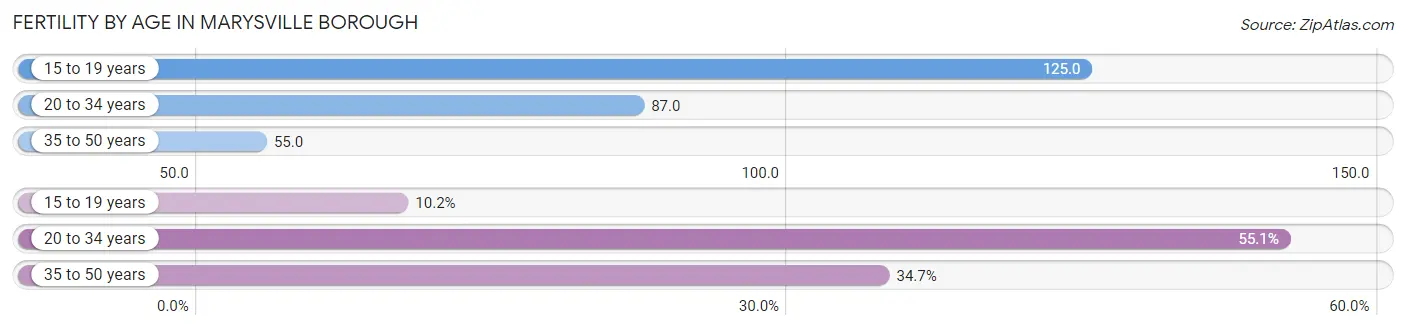
| Age Bracket | Women with Births | Births / 1,000 Women |
| 15 to 19 years | 5 (10.2%) | 125.0 |
| 20 to 34 years | 27 (55.1%) | 87.0 |
| 35 to 50 years | 17 (34.7%) | 55.0 |
| Total | 49 (100.0%) | 75.0 |
Fertility by Age by Marriage Status in Marysville borough
40.8% of women with births (49) in Marysville borough are married. The highest percentage of unmarried women with births falls into 15 to 19 years age bracket with 100.0% of them unmarried at the time of birth, while the lowest percentage of unmarried women with births belong to 20 to 34 years age bracket with 25.9% of them unmarried.
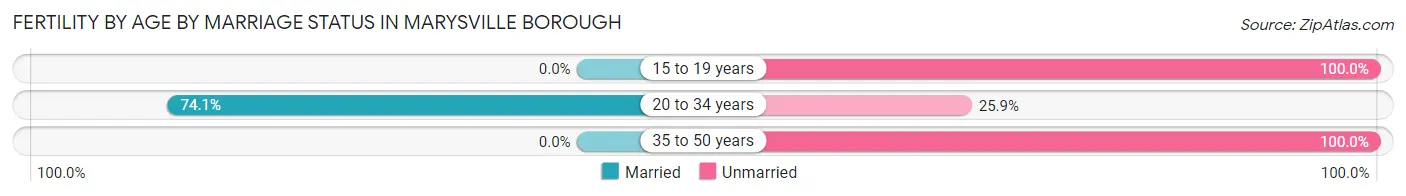
| Age Bracket | Married | Unmarried |
| 15 to 19 years | 0 (0.0%) | 5 (100.0%) |
| 20 to 34 years | 20 (74.1%) | 7 (25.9%) |
| 35 to 50 years | 0 (0.0%) | 17 (100.0%) |
| Total | 20 (40.8%) | 29 (59.2%) |
Fertility by Education in Marysville borough
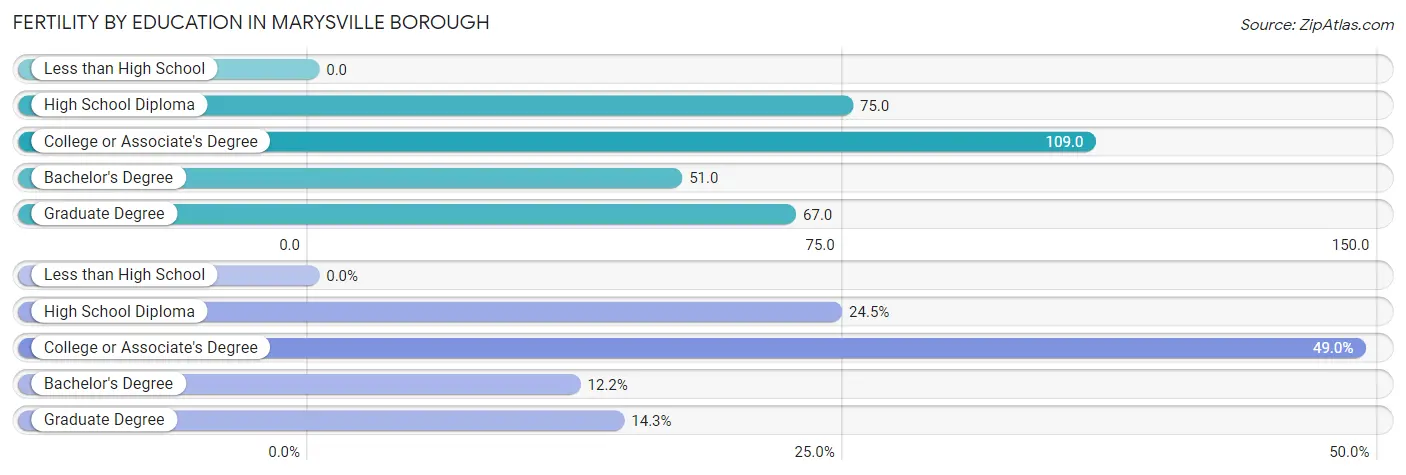
| Educational Attainment | Women with Births | Births / 1,000 Women |
| Less than High School | 0 (0.0%) | 0.0 |
| High School Diploma | 12 (24.5%) | 75.0 |
| College or Associate's Degree | 24 (49.0%) | 109.0 |
| Bachelor's Degree | 6 (12.2%) | 51.0 |
| Graduate Degree | 7 (14.3%) | 67.0 |
| Total | 49 (100.0%) | 75.0 |
Fertility by Education by Marriage Status in Marysville borough
59.2% of women with births in Marysville borough are unmarried. Women with the educational attainment of bachelor's degree are most likely to be married with 100.0% of them married at childbirth, while women with the educational attainment of college or associate's degree are least likely to be married with 100.0% of them unmarried at childbirth.
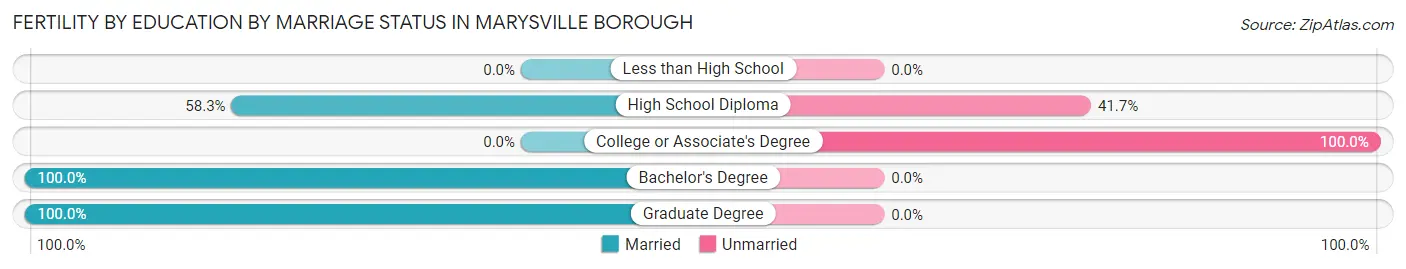
| Educational Attainment | Married | Unmarried |
| Less than High School | 0 (0.0%) | 0 (0.0%) |
| High School Diploma | 7 (58.3%) | 5 (41.7%) |
| College or Associate's Degree | 0 (0.0%) | 24 (100.0%) |
| Bachelor's Degree | 6 (100.0%) | 0 (0.0%) |
| Graduate Degree | 7 (100.0%) | 0 (0.0%) |
| Total | 20 (40.8%) | 29 (59.2%) |
Employment Characteristics in Marysville borough
Employment by Class of Employer in Marysville borough
Among the 1,445 employed individuals in Marysville borough, private company employees (1,001 | 69.3%), state government employees (144 | 10.0%), and local government employees (105 | 7.3%) make up the most common classes of employment.
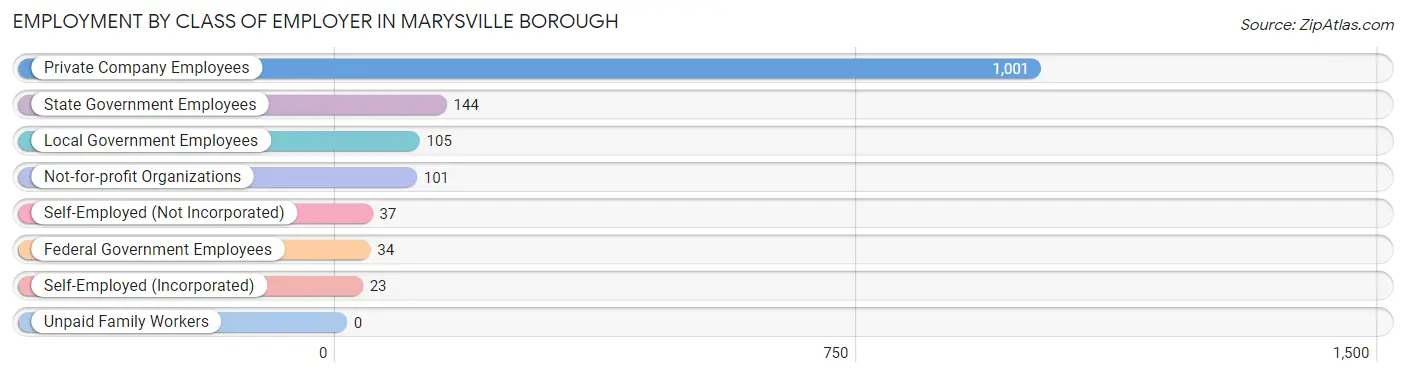
| Employer Class | # Employees | % Employees |
| Private Company Employees | 1,001 | 69.3% |
| Self-Employed (Incorporated) | 23 | 1.6% |
| Self-Employed (Not Incorporated) | 37 | 2.6% |
| Not-for-profit Organizations | 101 | 7.0% |
| Local Government Employees | 105 | 7.3% |
| State Government Employees | 144 | 10.0% |
| Federal Government Employees | 34 | 2.4% |
| Unpaid Family Workers | 0 | 0.0% |
| Total | 1,445 | 100.0% |
Employment Status by Age in Marysville borough
According to the labor force statistics for Marysville borough, out of the total population over 16 years of age (2,141), 71.6% or 1,533 individuals are in the labor force, with 4.9% or 75 of them unemployed. The age group with the highest labor force participation rate is 20 to 24 years, with 100.0% or 146 individuals in the labor force. Within the labor force, the 25 to 29 years age range has the highest percentage of unemployed individuals, with 22.6% or 38 of them being unemployed.
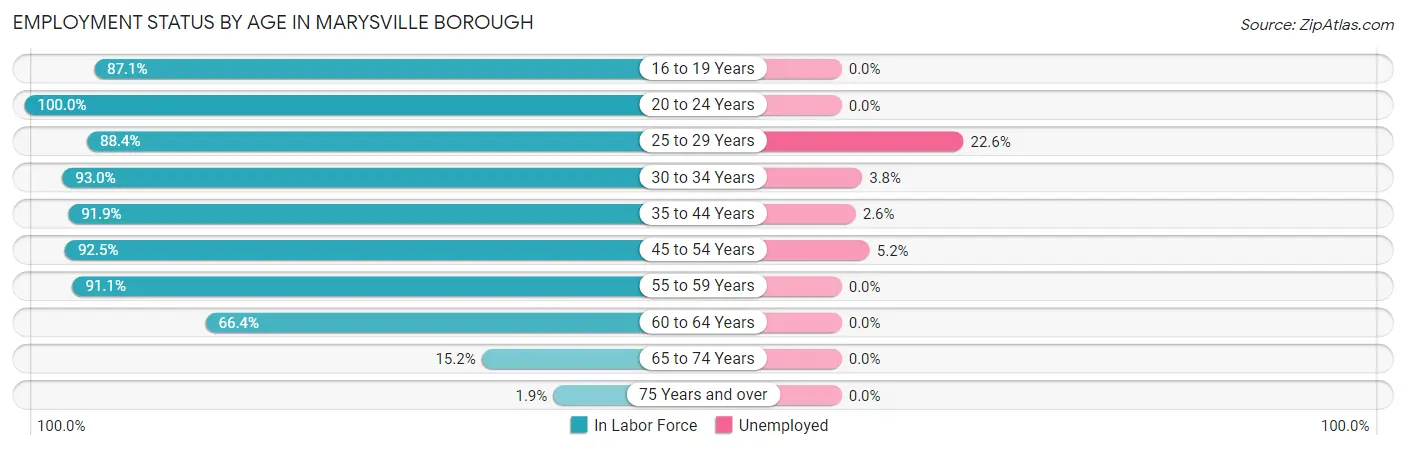
| Age Bracket | In Labor Force | Unemployed |
| 16 to 19 Years | 27 (87.1%) | 0 (0.0%) |
| 20 to 24 Years | 146 (100.0%) | 0 (0.0%) |
| 25 to 29 Years | 168 (88.4%) | 38 (22.6%) |
| 30 to 34 Years | 185 (93.0%) | 7 (3.8%) |
| 35 to 44 Years | 305 (91.9%) | 8 (2.6%) |
| 45 to 54 Years | 421 (92.5%) | 22 (5.2%) |
| 55 to 59 Years | 144 (91.1%) | 0 (0.0%) |
| 60 to 64 Years | 81 (66.4%) | 0 (0.0%) |
| 65 to 74 Years | 53 (15.2%) | 0 (0.0%) |
| 75 Years and over | 3 (1.9%) | 0 (0.0%) |
| Total | 1,533 (71.6%) | 75 (4.9%) |
Employment Status by Educational Attainment in Marysville borough
According to labor force statistics for Marysville borough, 89.6% of individuals (1,305) out of the total population between 25 and 64 years of age (1,456) are in the labor force, with 5.8% or 76 of them being unemployed. The group with the highest labor force participation rate are those with the educational attainment of college / associate degree, with 94.5% or 410 individuals in the labor force. Within the labor force, individuals with high school diploma education have the highest percentage of unemployment, with 11.2% or 46 of them being unemployed.
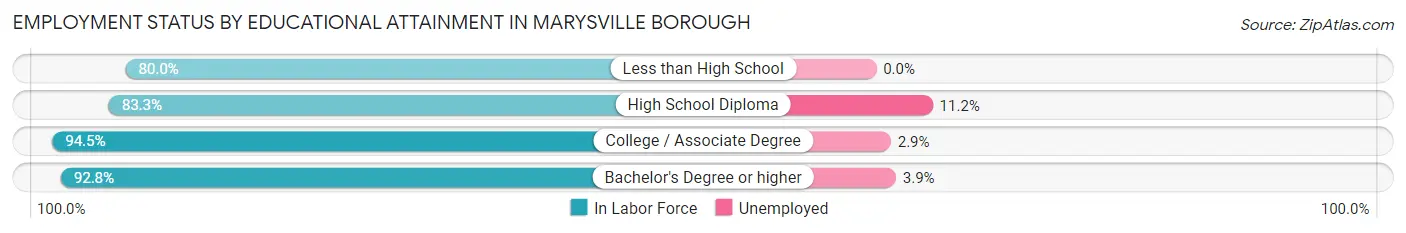
| Educational Attainment | In Labor Force | Unemployed |
| Less than High School | 48 (80.0%) | 0 (0.0%) |
| High School Diploma | 410 (83.3%) | 55 (11.2%) |
| College / Associate Degree | 410 (94.5%) | 13 (2.9%) |
| Bachelor's Degree or higher | 436 (92.8%) | 18 (3.9%) |
| Total | 1,305 (89.6%) | 84 (5.8%) |
Employment Occupations by Sex in Marysville borough
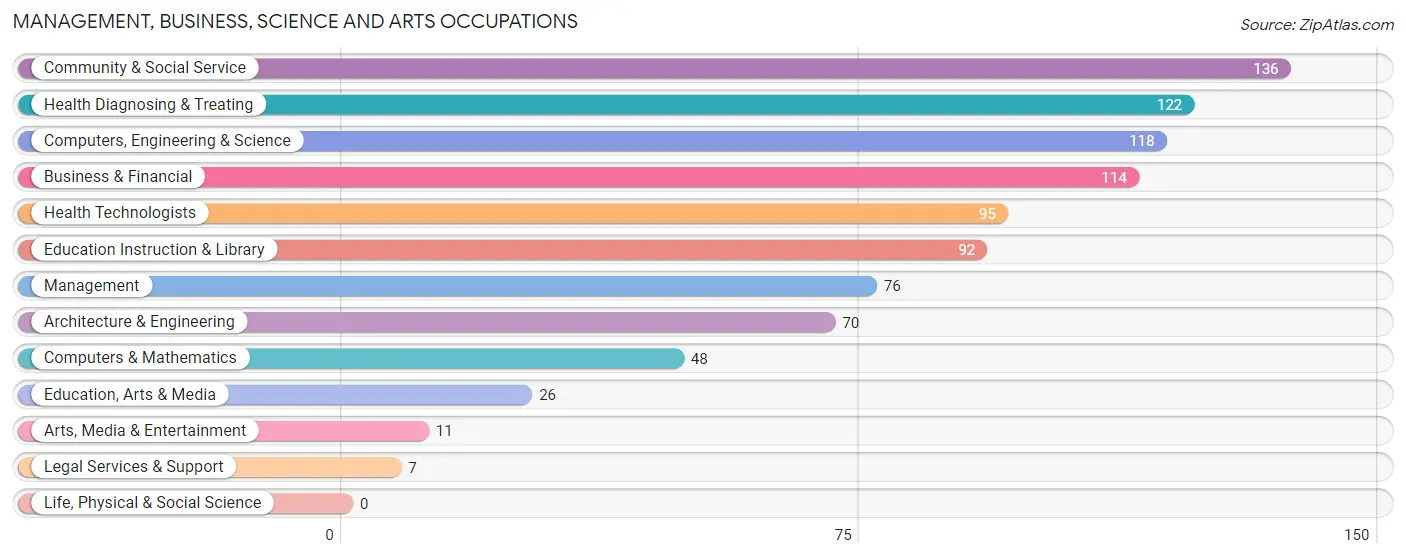
Management, Business, Science and Arts Occupations
The most common Management, Business, Science and Arts occupations in Marysville borough are Community & Social Service (136 | 9.3%), Health Diagnosing & Treating (122 | 8.4%), Computers, Engineering & Science (118 | 8.1%), Business & Financial (114 | 7.8%), and Health Technologists (95 | 6.5%).
Management, Business, Science and Arts Occupations by Sex
Within the Management, Business, Science and Arts occupations in Marysville borough, the most male-oriented occupations are Architecture & Engineering (100.0%), Education, Arts & Media (100.0%), and Computers, Engineering & Science (85.6%), while the most female-oriented occupations are Legal Services & Support (100.0%), Education Instruction & Library (100.0%), and Arts, Media & Entertainment (100.0%).
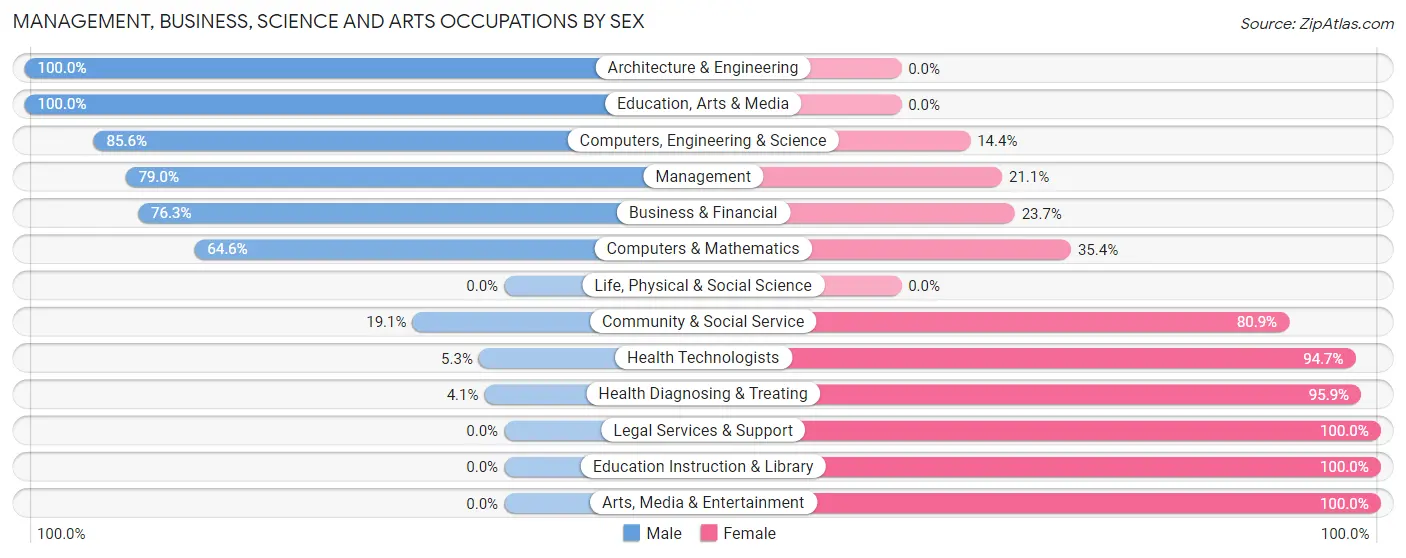
| Occupation | Male | Female |
| Management | 60 (78.9%) | 16 (21.0%) |
| Business & Financial | 87 (76.3%) | 27 (23.7%) |
| Computers, Engineering & Science | 101 (85.6%) | 17 (14.4%) |
| Computers & Mathematics | 31 (64.6%) | 17 (35.4%) |
| Architecture & Engineering | 70 (100.0%) | 0 (0.0%) |
| Life, Physical & Social Science | 0 (0.0%) | 0 (0.0%) |
| Community & Social Service | 26 (19.1%) | 110 (80.9%) |
| Education, Arts & Media | 26 (100.0%) | 0 (0.0%) |
| Legal Services & Support | 0 (0.0%) | 7 (100.0%) |
| Education Instruction & Library | 0 (0.0%) | 92 (100.0%) |
| Arts, Media & Entertainment | 0 (0.0%) | 11 (100.0%) |
| Health Diagnosing & Treating | 5 (4.1%) | 117 (95.9%) |
| Health Technologists | 5 (5.3%) | 90 (94.7%) |
| Total (Category) | 279 (49.3%) | 287 (50.7%) |
| Total (Overall) | 710 (48.7%) | 748 (51.3%) |
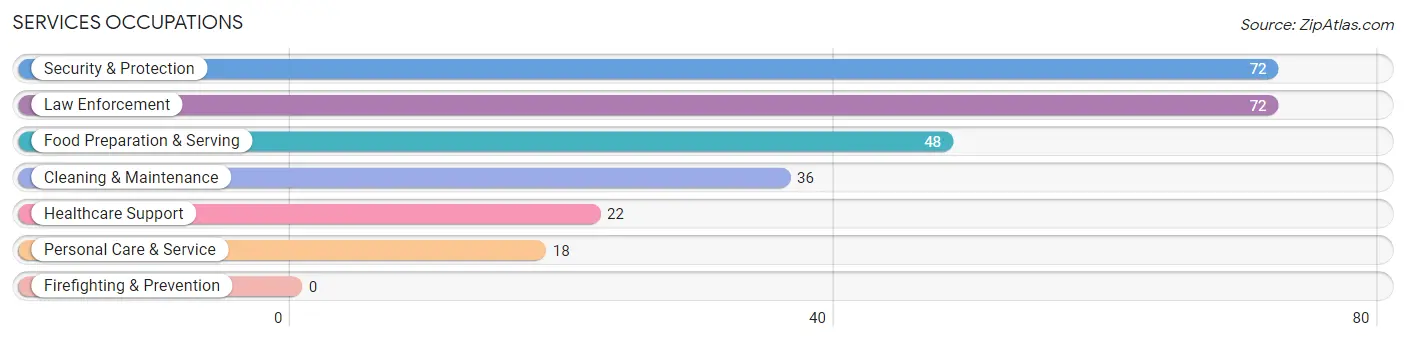
Services Occupations
The most common Services occupations in Marysville borough are Security & Protection (72 | 4.9%), Law Enforcement (72 | 4.9%), Food Preparation & Serving (48 | 3.3%), Cleaning & Maintenance (36 | 2.5%), and Healthcare Support (22 | 1.5%).
Services Occupations by Sex
Within the Services occupations in Marysville borough, the most male-oriented occupations are Cleaning & Maintenance (52.8%), Food Preparation & Serving (16.7%), and Security & Protection (12.5%), while the most female-oriented occupations are Healthcare Support (100.0%), Personal Care & Service (100.0%), and Security & Protection (87.5%).
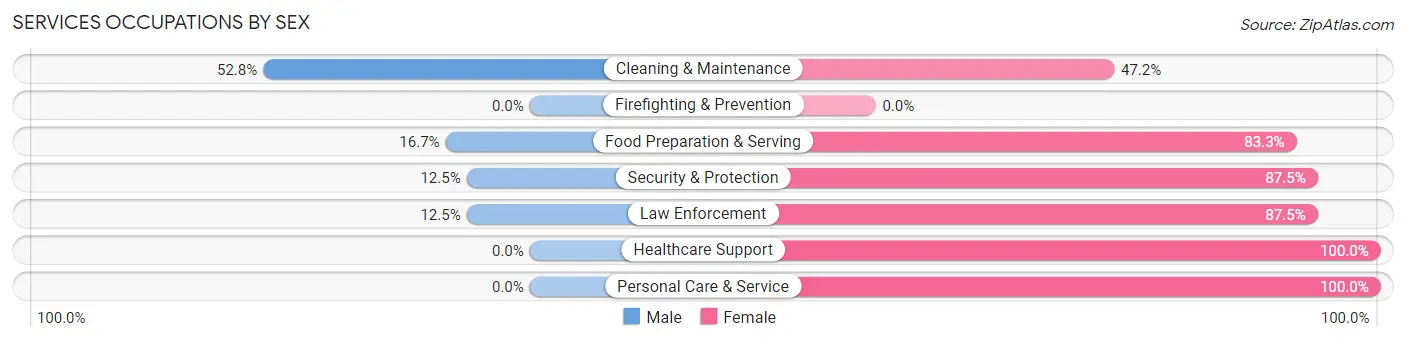
| Occupation | Male | Female |
| Healthcare Support | 0 (0.0%) | 22 (100.0%) |
| Security & Protection | 9 (12.5%) | 63 (87.5%) |
| Firefighting & Prevention | 0 (0.0%) | 0 (0.0%) |
| Law Enforcement | 9 (12.5%) | 63 (87.5%) |
| Food Preparation & Serving | 8 (16.7%) | 40 (83.3%) |
| Cleaning & Maintenance | 19 (52.8%) | 17 (47.2%) |
| Personal Care & Service | 0 (0.0%) | 18 (100.0%) |
| Total (Category) | 36 (18.4%) | 160 (81.6%) |
| Total (Overall) | 710 (48.7%) | 748 (51.3%) |
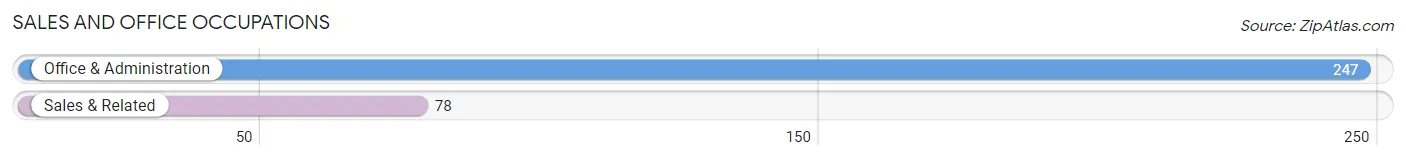
Sales and Office Occupations
The most common Sales and Office occupations in Marysville borough are Office & Administration (247 | 16.9%), and Sales & Related (78 | 5.3%).
Sales and Office Occupations by Sex
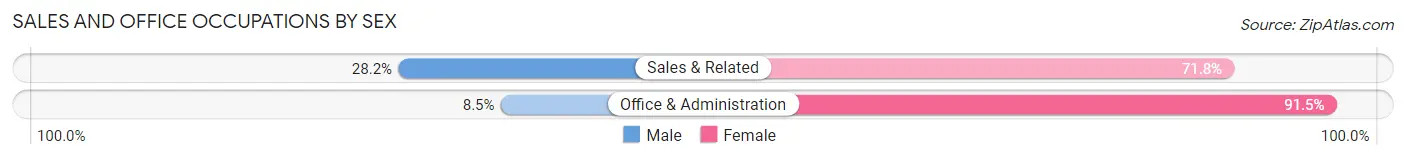
| Occupation | Male | Female |
| Sales & Related | 22 (28.2%) | 56 (71.8%) |
| Office & Administration | 21 (8.5%) | 226 (91.5%) |
| Total (Category) | 43 (13.2%) | 282 (86.8%) |
| Total (Overall) | 710 (48.7%) | 748 (51.3%) |
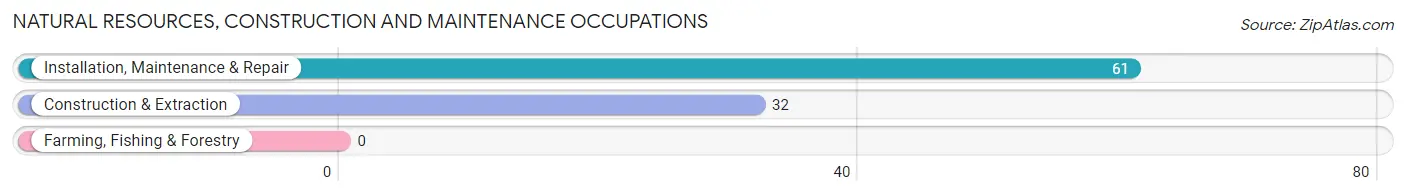
Natural Resources, Construction and Maintenance Occupations
The most common Natural Resources, Construction and Maintenance occupations in Marysville borough are Installation, Maintenance & Repair (61 | 4.2%), and Construction & Extraction (32 | 2.2%).
Natural Resources, Construction and Maintenance Occupations by Sex
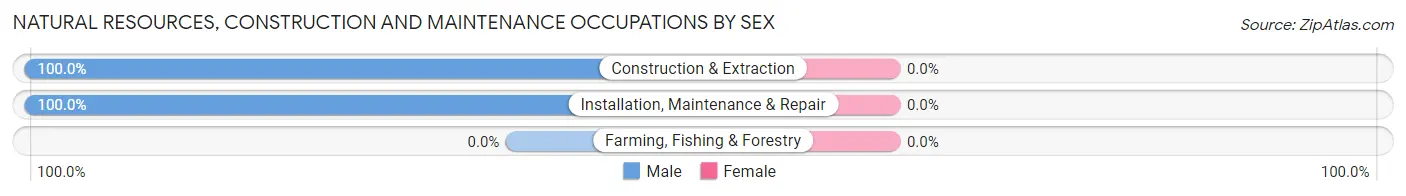
| Occupation | Male | Female |
| Farming, Fishing & Forestry | 0 (0.0%) | 0 (0.0%) |
| Construction & Extraction | 32 (100.0%) | 0 (0.0%) |
| Installation, Maintenance & Repair | 61 (100.0%) | 0 (0.0%) |
| Total (Category) | 93 (100.0%) | 0 (0.0%) |
| Total (Overall) | 710 (48.7%) | 748 (51.3%) |
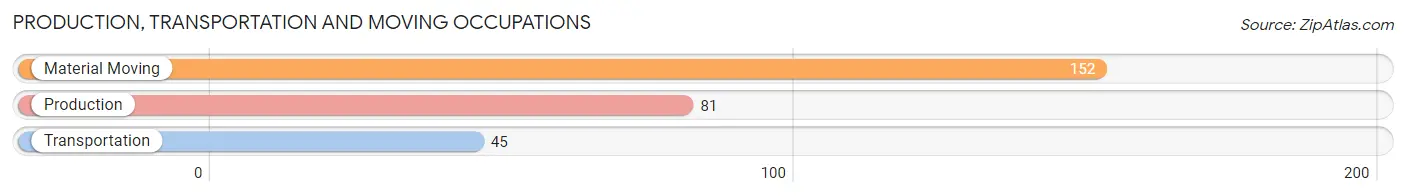
Production, Transportation and Moving Occupations
The most common Production, Transportation and Moving occupations in Marysville borough are Material Moving (152 | 10.4%), Production (81 | 5.6%), and Transportation (45 | 3.1%).
Production, Transportation and Moving Occupations by Sex
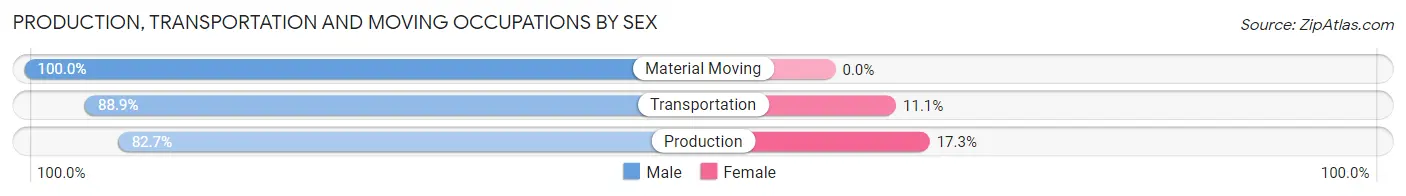
| Occupation | Male | Female |
| Production | 67 (82.7%) | 14 (17.3%) |
| Transportation | 40 (88.9%) | 5 (11.1%) |
| Material Moving | 152 (100.0%) | 0 (0.0%) |
| Total (Category) | 259 (93.2%) | 19 (6.8%) |
| Total (Overall) | 710 (48.7%) | 748 (51.3%) |
Employment Industries by Sex in Marysville borough
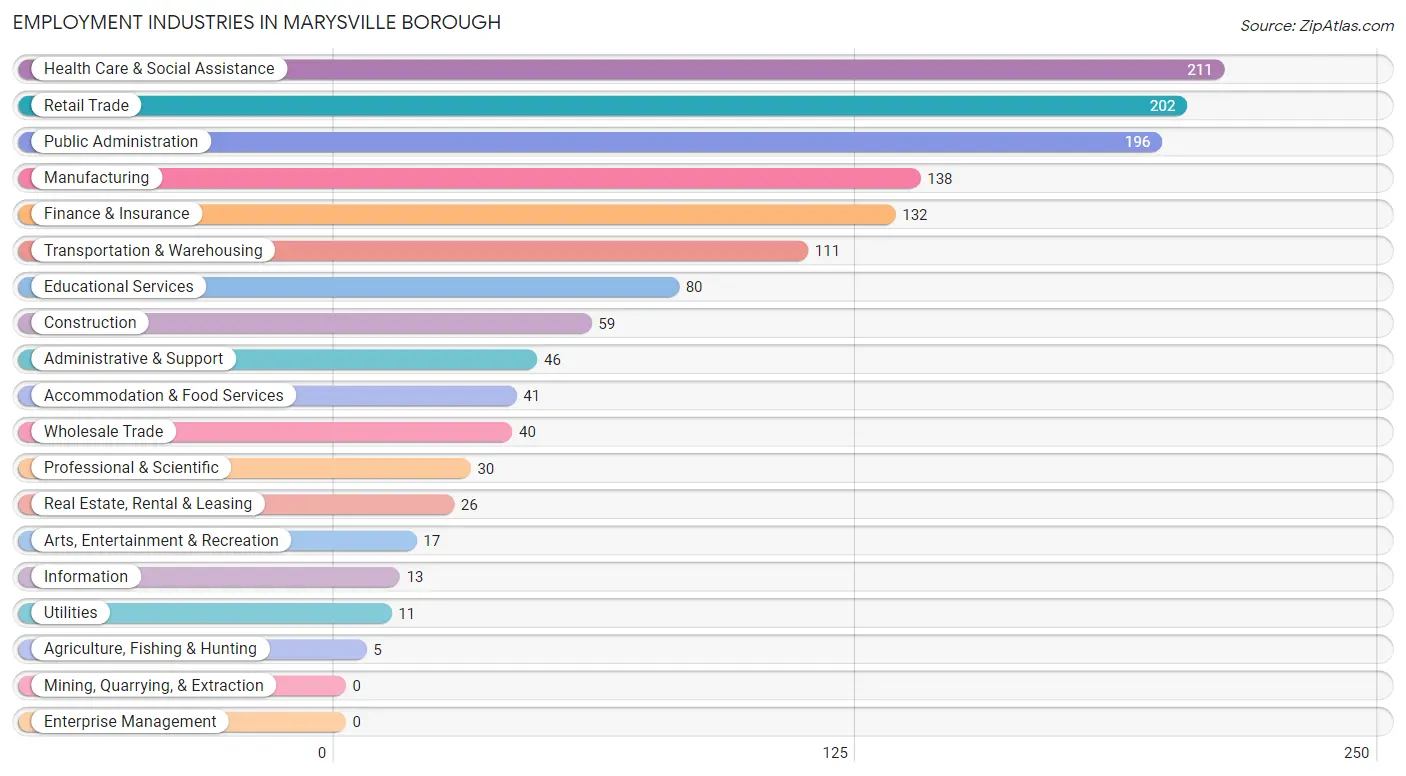
Employment Industries in Marysville borough
The major employment industries in Marysville borough include Health Care & Social Assistance (211 | 14.5%), Retail Trade (202 | 13.9%), Public Administration (196 | 13.4%), Manufacturing (138 | 9.5%), and Finance & Insurance (132 | 9.0%).
Employment Industries by Sex in Marysville borough
The Marysville borough industries that see more men than women are Agriculture, Fishing & Hunting (100.0%), Construction (100.0%), and Utilities (100.0%), whereas the industries that tend to have a higher number of women are Educational Services (100.0%), Arts, Entertainment & Recreation (100.0%), and Health Care & Social Assistance (87.7%).
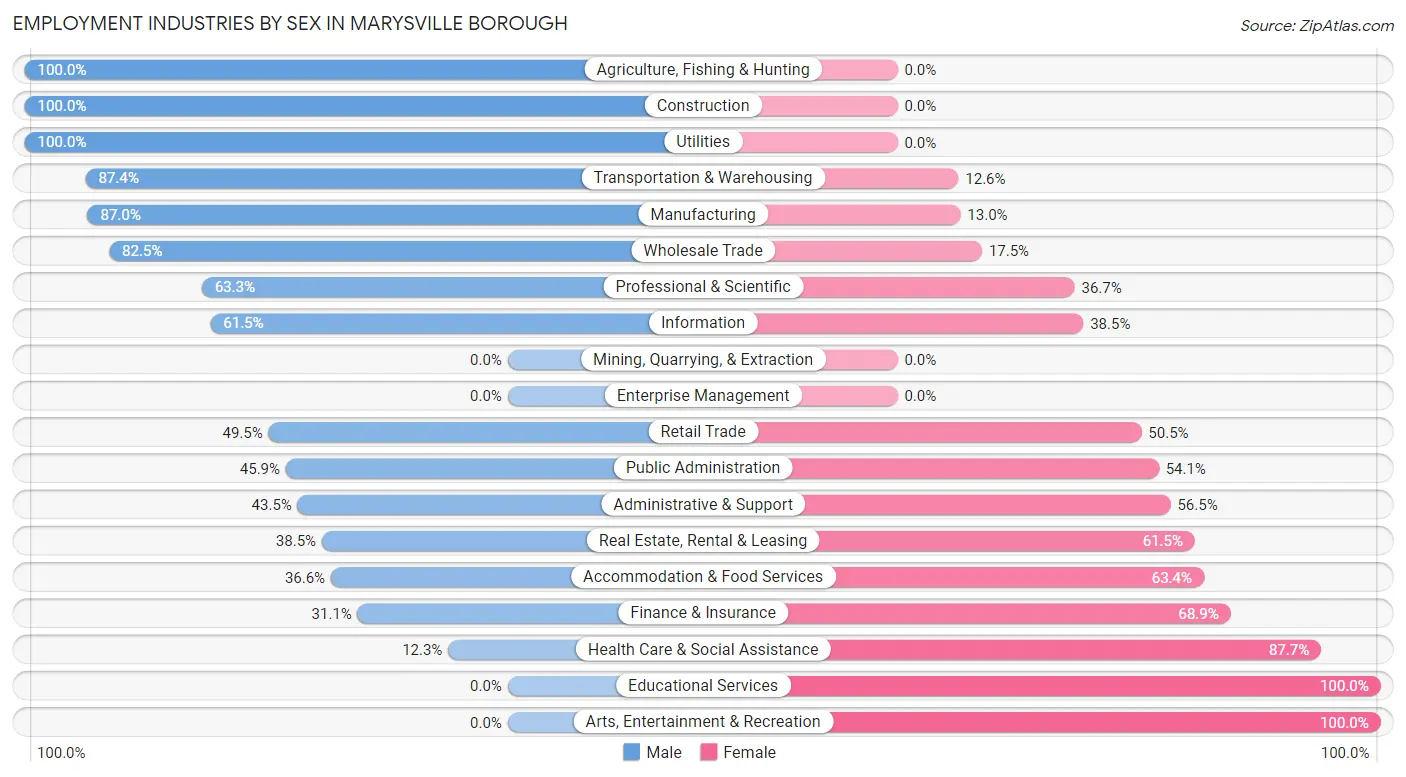
| Industry | Male | Female |
| Agriculture, Fishing & Hunting | 5 (100.0%) | 0 (0.0%) |
| Mining, Quarrying, & Extraction | 0 (0.0%) | 0 (0.0%) |
| Construction | 59 (100.0%) | 0 (0.0%) |
| Manufacturing | 120 (87.0%) | 18 (13.0%) |
| Wholesale Trade | 33 (82.5%) | 7 (17.5%) |
| Retail Trade | 100 (49.5%) | 102 (50.5%) |
| Transportation & Warehousing | 97 (87.4%) | 14 (12.6%) |
| Utilities | 11 (100.0%) | 0 (0.0%) |
| Information | 8 (61.5%) | 5 (38.5%) |
| Finance & Insurance | 41 (31.1%) | 91 (68.9%) |
| Real Estate, Rental & Leasing | 10 (38.5%) | 16 (61.5%) |
| Professional & Scientific | 19 (63.3%) | 11 (36.7%) |
| Enterprise Management | 0 (0.0%) | 0 (0.0%) |
| Administrative & Support | 20 (43.5%) | 26 (56.5%) |
| Educational Services | 0 (0.0%) | 80 (100.0%) |
| Health Care & Social Assistance | 26 (12.3%) | 185 (87.7%) |
| Arts, Entertainment & Recreation | 0 (0.0%) | 17 (100.0%) |
| Accommodation & Food Services | 15 (36.6%) | 26 (63.4%) |
| Public Administration | 90 (45.9%) | 106 (54.1%) |
| Total | 710 (48.7%) | 748 (51.3%) |
Education in Marysville borough
School Enrollment in Marysville borough
The most common levels of schooling among the 533 students in Marysville borough are middle school (205 | 38.5%), high school (103 | 19.3%), and elementary school (97 | 18.2%).
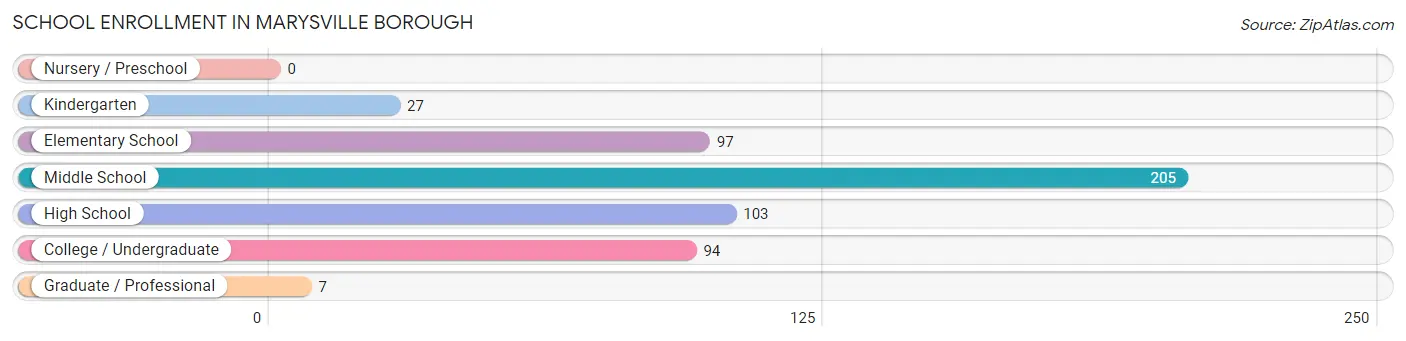
| School Level | # Students | % Students |
| Nursery / Preschool | 0 | 0.0% |
| Kindergarten | 27 | 5.1% |
| Elementary School | 97 | 18.2% |
| Middle School | 205 | 38.5% |
| High School | 103 | 19.3% |
| College / Undergraduate | 94 | 17.6% |
| Graduate / Professional | 7 | 1.3% |
| Total | 533 | 100.0% |
School Enrollment by Age by Funding Source in Marysville borough
Out of a total of 533 students who are enrolled in schools in Marysville borough, 131 (24.6%) attend a private institution, while the remaining 402 (75.4%) are enrolled in public schools. The age group of 15 to 17 year olds has the highest likelihood of being enrolled in private schools, with 61 (56.5% in the age bracket) enrolled. Conversely, the age group of 5 to 9 year old has the lowest likelihood of being enrolled in a private school, with 117 (100.0% in the age bracket) attending a public institution.
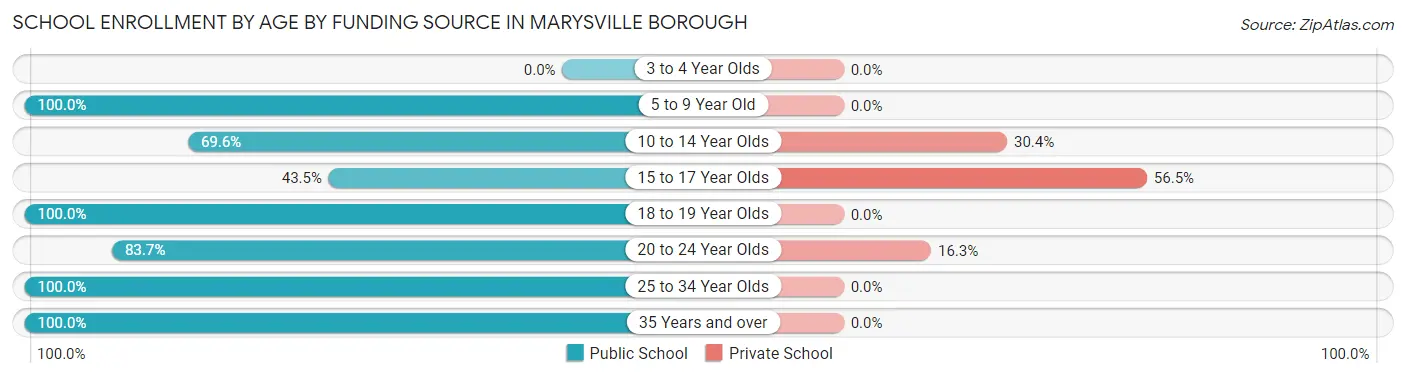
| Age Bracket | Public School | Private School |
| 3 to 4 Year Olds | 0 (0.0%) | 0 (0.0%) |
| 5 to 9 Year Old | 117 (100.0%) | 0 (0.0%) |
| 10 to 14 Year Olds | 144 (69.6%) | 63 (30.4%) |
| 15 to 17 Year Olds | 47 (43.5%) | 61 (56.5%) |
| 18 to 19 Year Olds | 14 (100.0%) | 0 (0.0%) |
| 20 to 24 Year Olds | 36 (83.7%) | 7 (16.3%) |
| 25 to 34 Year Olds | 26 (100.0%) | 0 (0.0%) |
| 35 Years and over | 18 (100.0%) | 0 (0.0%) |
| Total | 402 (75.4%) | 131 (24.6%) |
Educational Attainment by Field of Study in Marysville borough
Science & technology (131 | 22.5%), education (92 | 15.8%), business (80 | 13.7%), arts & humanities (72 | 12.3%), and social sciences (66 | 11.3%) are the most common fields of study among 583 individuals in Marysville borough who have obtained a bachelor's degree or higher.
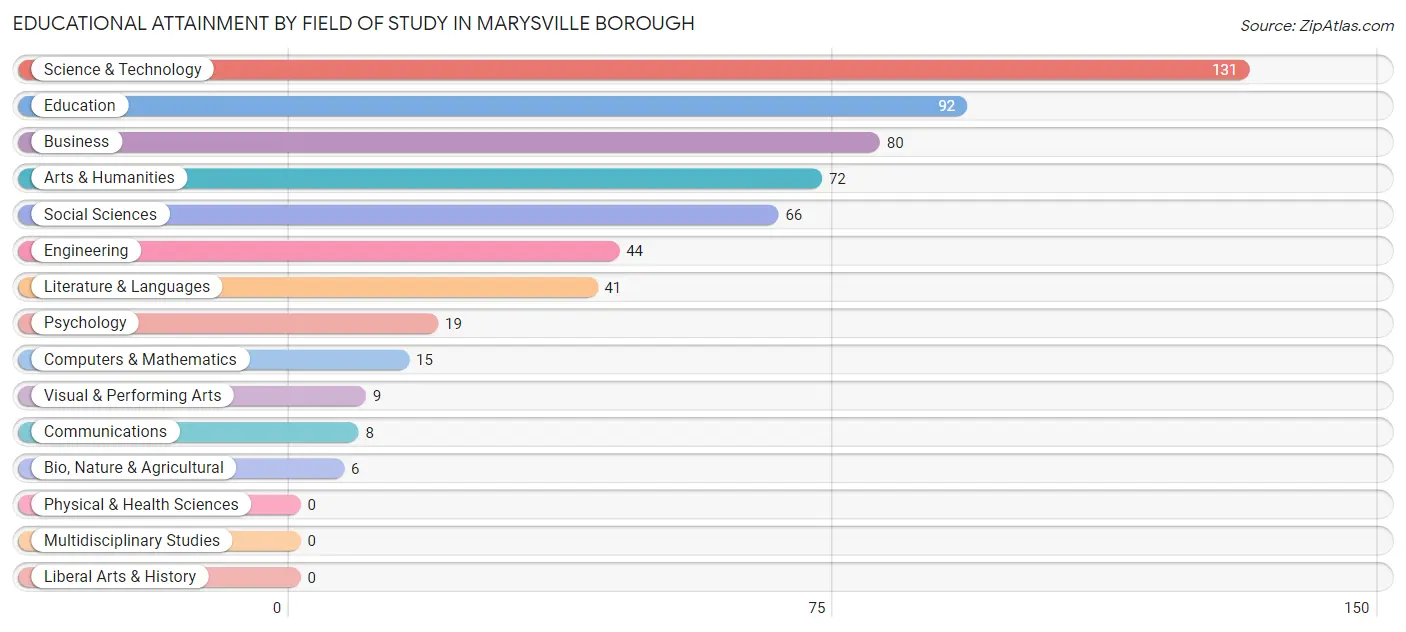
| Field of Study | # Graduates | % Graduates |
| Computers & Mathematics | 15 | 2.6% |
| Bio, Nature & Agricultural | 6 | 1.0% |
| Physical & Health Sciences | 0 | 0.0% |
| Psychology | 19 | 3.3% |
| Social Sciences | 66 | 11.3% |
| Engineering | 44 | 7.5% |
| Multidisciplinary Studies | 0 | 0.0% |
| Science & Technology | 131 | 22.5% |
| Business | 80 | 13.7% |
| Education | 92 | 15.8% |
| Literature & Languages | 41 | 7.0% |
| Liberal Arts & History | 0 | 0.0% |
| Visual & Performing Arts | 9 | 1.5% |
| Communications | 8 | 1.4% |
| Arts & Humanities | 72 | 12.3% |
| Total | 583 | 100.0% |
Transportation & Commute in Marysville borough
Vehicle Availability by Sex in Marysville borough
The most prevalent vehicle ownership categories in Marysville borough are males with 2 vehicles (302, accounting for 42.5%) and females with 2 vehicles (302, making up 41.1%).
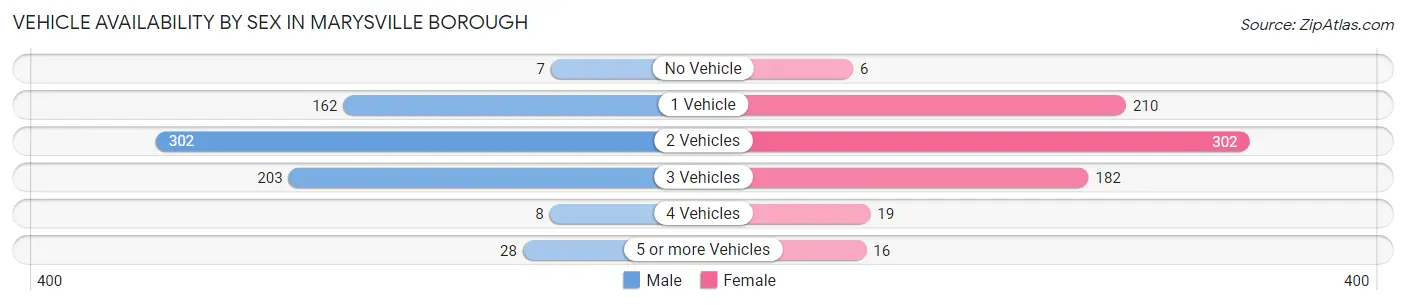
| Vehicles Available | Male | Female |
| No Vehicle | 7 (1.0%) | 6 (0.8%) |
| 1 Vehicle | 162 (22.8%) | 210 (28.6%) |
| 2 Vehicles | 302 (42.5%) | 302 (41.1%) |
| 3 Vehicles | 203 (28.6%) | 182 (24.8%) |
| 4 Vehicles | 8 (1.1%) | 19 (2.6%) |
| 5 or more Vehicles | 28 (3.9%) | 16 (2.2%) |
| Total | 710 (100.0%) | 735 (100.0%) |
Commute Time in Marysville borough
The most frequently occuring commute durations in Marysville borough are 20 to 24 minutes (355 commuters, 28.4%), 15 to 19 minutes (318 commuters, 25.4%), and 30 to 34 minutes (173 commuters, 13.8%).
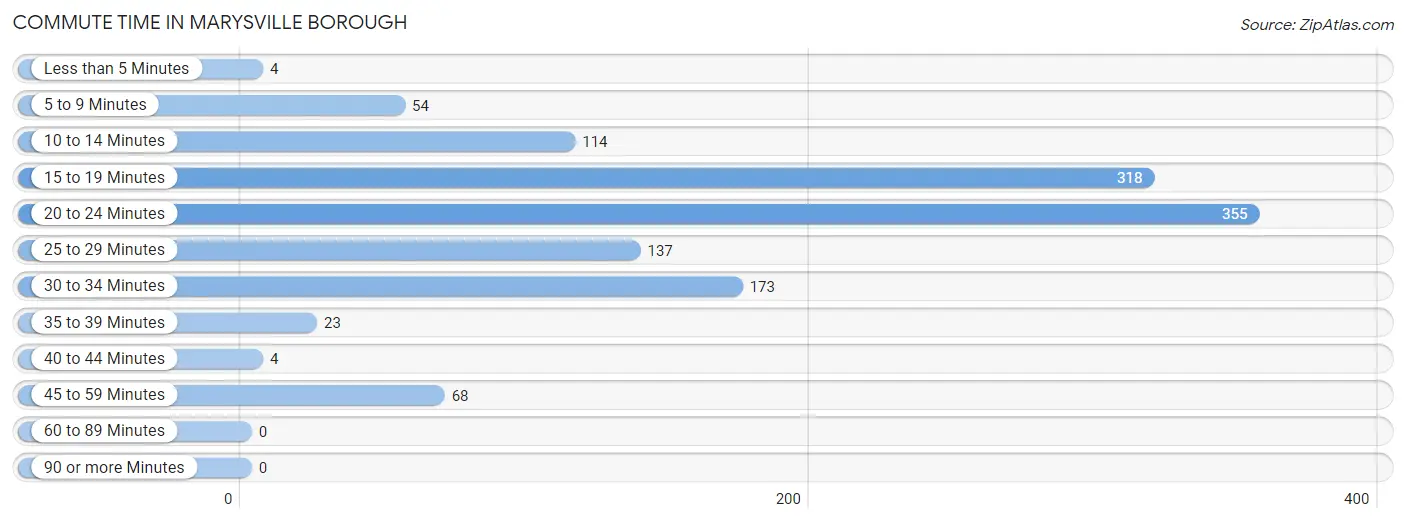
| Commute Time | # Commuters | % Commuters |
| Less than 5 Minutes | 4 | 0.3% |
| 5 to 9 Minutes | 54 | 4.3% |
| 10 to 14 Minutes | 114 | 9.1% |
| 15 to 19 Minutes | 318 | 25.4% |
| 20 to 24 Minutes | 355 | 28.4% |
| 25 to 29 Minutes | 137 | 11.0% |
| 30 to 34 Minutes | 173 | 13.8% |
| 35 to 39 Minutes | 23 | 1.8% |
| 40 to 44 Minutes | 4 | 0.3% |
| 45 to 59 Minutes | 68 | 5.4% |
| 60 to 89 Minutes | 0 | 0.0% |
| 90 or more Minutes | 0 | 0.0% |
Commute Time by Sex in Marysville borough
The most common commute times in Marysville borough are 15 to 19 minutes (175 commuters, 28.8%) for males and 20 to 24 minutes (193 commuters, 30.0%) for females.
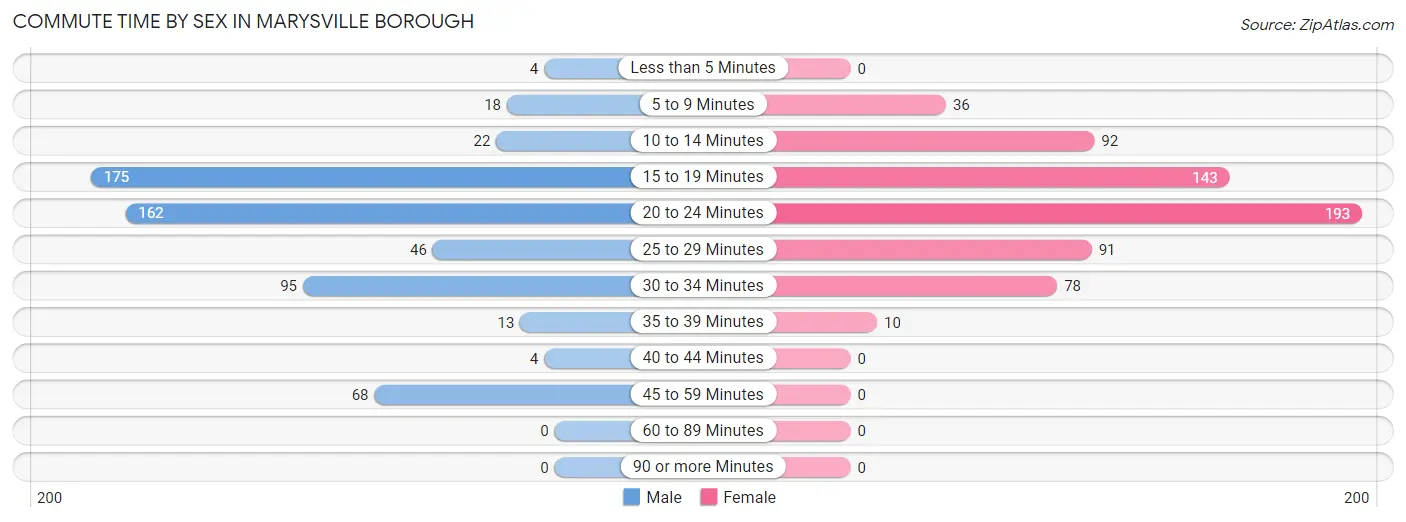
| Commute Time | Male | Female |
| Less than 5 Minutes | 4 (0.7%) | 0 (0.0%) |
| 5 to 9 Minutes | 18 (3.0%) | 36 (5.6%) |
| 10 to 14 Minutes | 22 (3.6%) | 92 (14.3%) |
| 15 to 19 Minutes | 175 (28.8%) | 143 (22.2%) |
| 20 to 24 Minutes | 162 (26.7%) | 193 (30.0%) |
| 25 to 29 Minutes | 46 (7.6%) | 91 (14.1%) |
| 30 to 34 Minutes | 95 (15.7%) | 78 (12.1%) |
| 35 to 39 Minutes | 13 (2.1%) | 10 (1.6%) |
| 40 to 44 Minutes | 4 (0.7%) | 0 (0.0%) |
| 45 to 59 Minutes | 68 (11.2%) | 0 (0.0%) |
| 60 to 89 Minutes | 0 (0.0%) | 0 (0.0%) |
| 90 or more Minutes | 0 (0.0%) | 0 (0.0%) |
Time of Departure to Work by Sex in Marysville borough
The most frequent times of departure to work in Marysville borough are 6:30 AM to 6:59 AM (91, 15.0%) for males and 7:30 AM to 7:59 AM (126, 19.6%) for females.
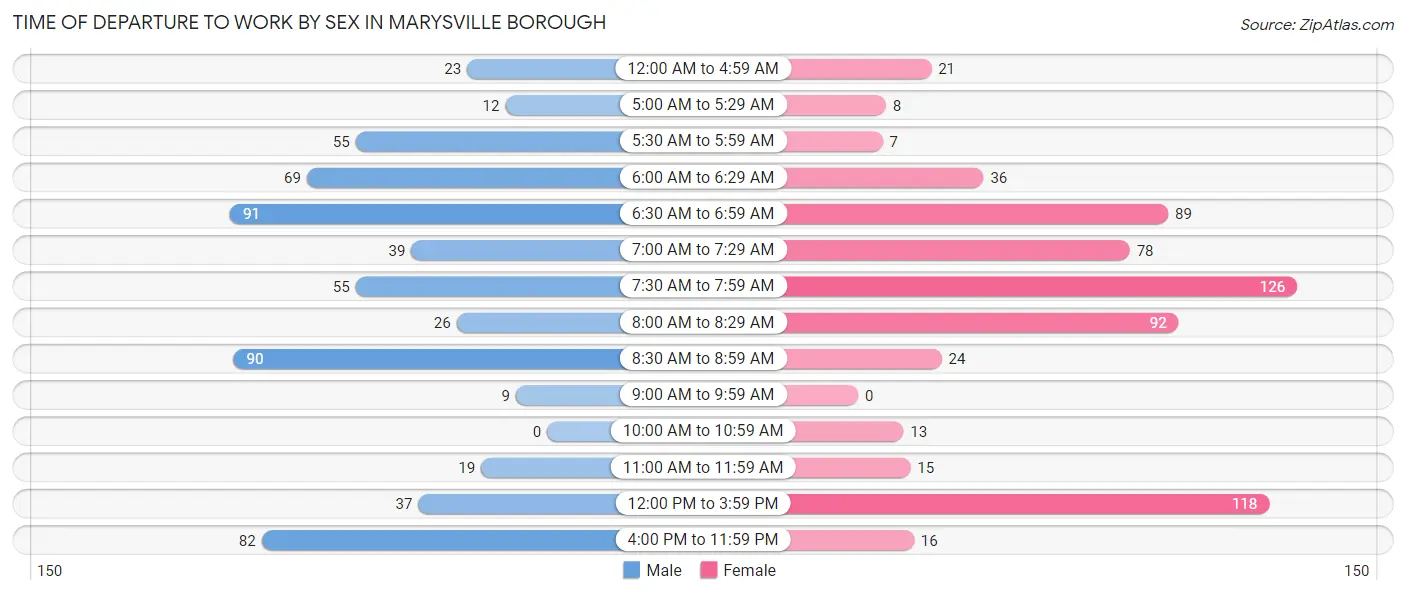
| Time of Departure | Male | Female |
| 12:00 AM to 4:59 AM | 23 (3.8%) | 21 (3.3%) |
| 5:00 AM to 5:29 AM | 12 (2.0%) | 8 (1.2%) |
| 5:30 AM to 5:59 AM | 55 (9.1%) | 7 (1.1%) |
| 6:00 AM to 6:29 AM | 69 (11.4%) | 36 (5.6%) |
| 6:30 AM to 6:59 AM | 91 (15.0%) | 89 (13.8%) |
| 7:00 AM to 7:29 AM | 39 (6.4%) | 78 (12.1%) |
| 7:30 AM to 7:59 AM | 55 (9.1%) | 126 (19.6%) |
| 8:00 AM to 8:29 AM | 26 (4.3%) | 92 (14.3%) |
| 8:30 AM to 8:59 AM | 90 (14.8%) | 24 (3.7%) |
| 9:00 AM to 9:59 AM | 9 (1.5%) | 0 (0.0%) |
| 10:00 AM to 10:59 AM | 0 (0.0%) | 13 (2.0%) |
| 11:00 AM to 11:59 AM | 19 (3.1%) | 15 (2.3%) |
| 12:00 PM to 3:59 PM | 37 (6.1%) | 118 (18.3%) |
| 4:00 PM to 11:59 PM | 82 (13.5%) | 16 (2.5%) |
| Total | 607 (100.0%) | 643 (100.0%) |
Housing Occupancy in Marysville borough
Occupancy by Ownership in Marysville borough
Of the total 1,239 dwellings in Marysville borough, owner-occupied units account for 914 (73.8%), while renter-occupied units make up 325 (26.2%).
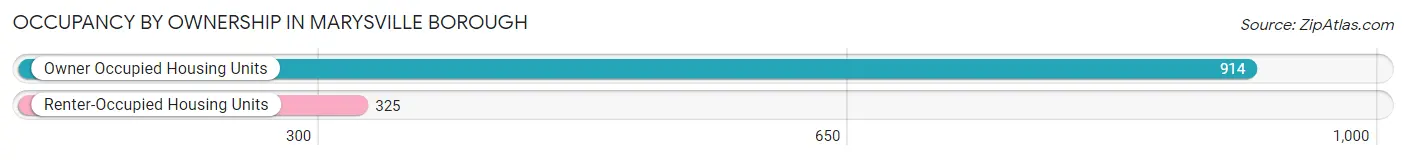
| Occupancy | # Housing Units | % Housing Units |
| Owner Occupied Housing Units | 914 | 73.8% |
| Renter-Occupied Housing Units | 325 | 26.2% |
| Total Occupied Housing Units | 1,239 | 100.0% |
Occupancy by Household Size in Marysville borough
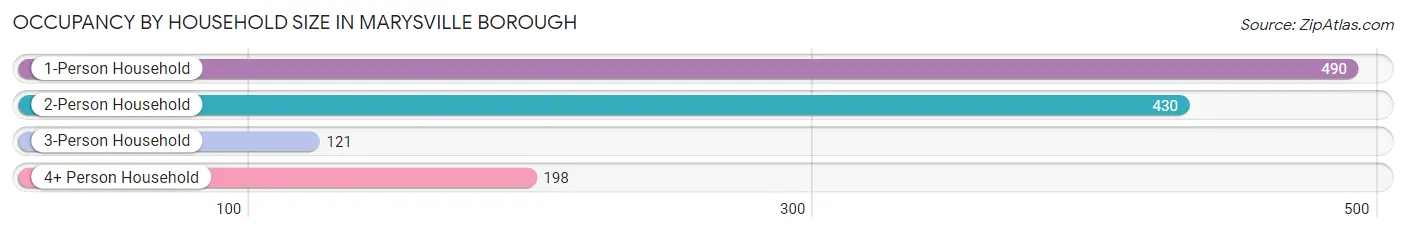
| Household Size | # Housing Units | % Housing Units |
| 1-Person Household | 490 | 39.6% |
| 2-Person Household | 430 | 34.7% |
| 3-Person Household | 121 | 9.8% |
| 4+ Person Household | 198 | 16.0% |
| Total Housing Units | 1,239 | 100.0% |
Occupancy by Ownership by Household Size in Marysville borough
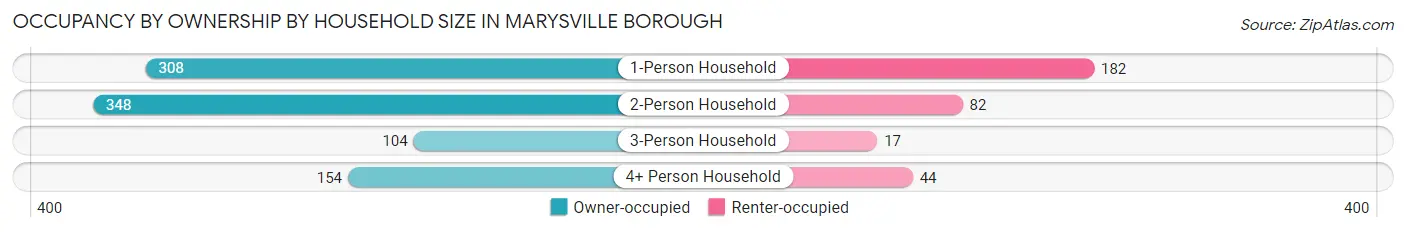
| Household Size | Owner-occupied | Renter-occupied |
| 1-Person Household | 308 (62.9%) | 182 (37.1%) |
| 2-Person Household | 348 (80.9%) | 82 (19.1%) |
| 3-Person Household | 104 (86.0%) | 17 (14.1%) |
| 4+ Person Household | 154 (77.8%) | 44 (22.2%) |
| Total Housing Units | 914 (73.8%) | 325 (26.2%) |
Occupancy by Educational Attainment in Marysville borough
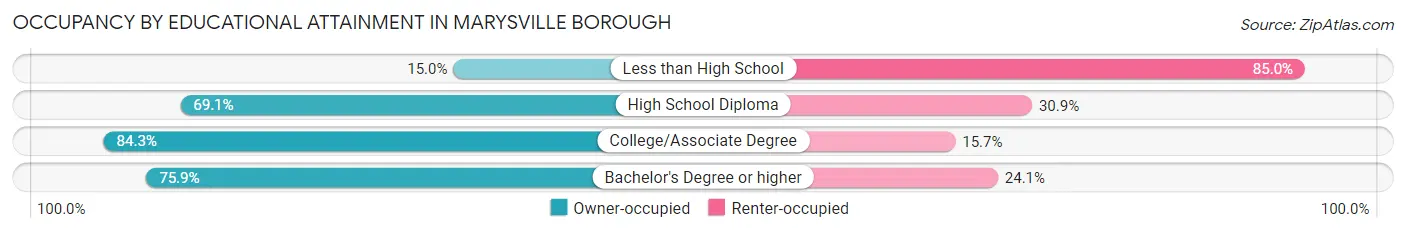
| Household Size | Owner-occupied | Renter-occupied |
| Less than High School | 9 (15.0%) | 51 (85.0%) |
| High School Diploma | 273 (69.1%) | 122 (30.9%) |
| College/Associate Degree | 371 (84.3%) | 69 (15.7%) |
| Bachelor's Degree or higher | 261 (75.9%) | 83 (24.1%) |
Occupancy by Age of Householder in Marysville borough
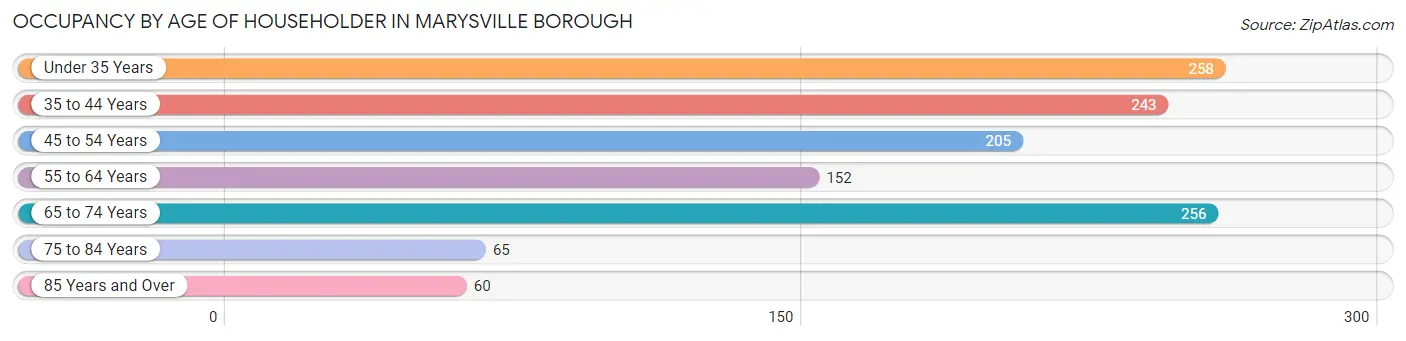
| Age Bracket | # Households | % Households |
| Under 35 Years | 258 | 20.8% |
| 35 to 44 Years | 243 | 19.6% |
| 45 to 54 Years | 205 | 16.6% |
| 55 to 64 Years | 152 | 12.3% |
| 65 to 74 Years | 256 | 20.7% |
| 75 to 84 Years | 65 | 5.2% |
| 85 Years and Over | 60 | 4.8% |
| Total | 1,239 | 100.0% |
Housing Finances in Marysville borough
Median Income by Occupancy in Marysville borough
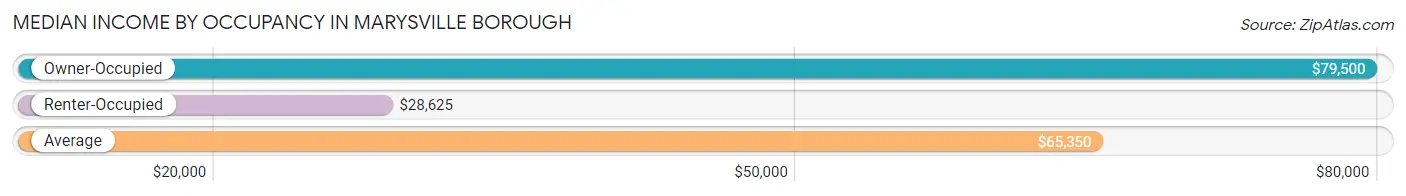
| Occupancy Type | # Households | Median Income |
| Owner-Occupied | 914 (73.8%) | $79,500 |
| Renter-Occupied | 325 (26.2%) | $28,625 |
| Average | 1,239 (100.0%) | $65,350 |
Occupancy by Householder Income Bracket in Marysville borough
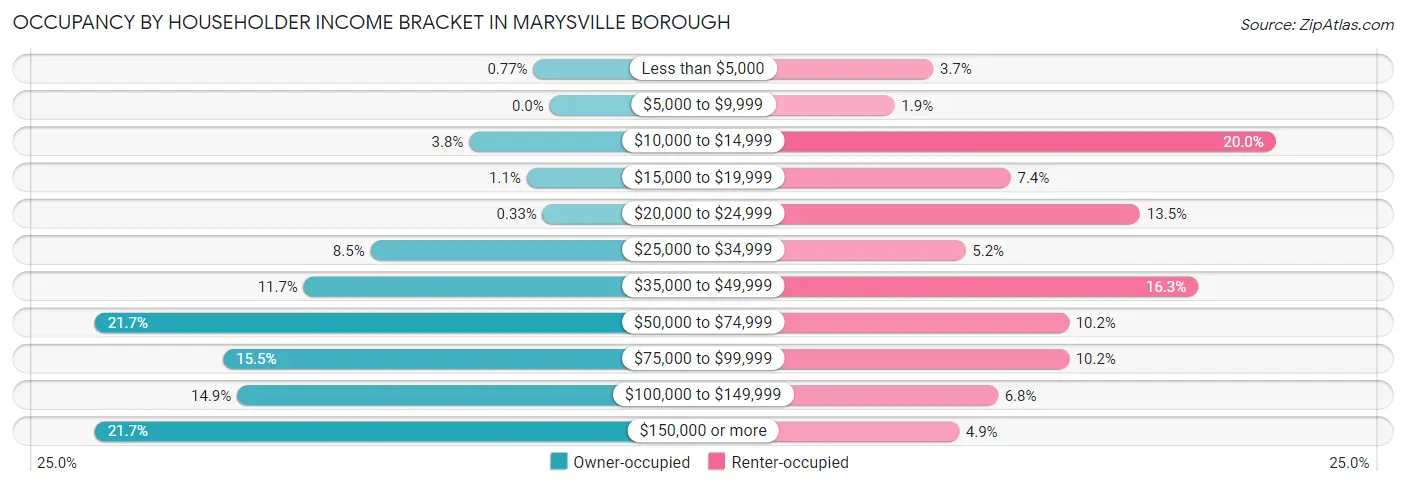
| Income Bracket | Owner-occupied | Renter-occupied |
| Less than $5,000 | 7 (0.8%) | 12 (3.7%) |
| $5,000 to $9,999 | 0 (0.0%) | 6 (1.8%) |
| $10,000 to $14,999 | 35 (3.8%) | 65 (20.0%) |
| $15,000 to $19,999 | 10 (1.1%) | 24 (7.4%) |
| $20,000 to $24,999 | 3 (0.3%) | 44 (13.5%) |
| $25,000 to $34,999 | 78 (8.5%) | 17 (5.2%) |
| $35,000 to $49,999 | 107 (11.7%) | 53 (16.3%) |
| $50,000 to $74,999 | 198 (21.7%) | 33 (10.2%) |
| $75,000 to $99,999 | 142 (15.5%) | 33 (10.2%) |
| $100,000 to $149,999 | 136 (14.9%) | 22 (6.8%) |
| $150,000 or more | 198 (21.7%) | 16 (4.9%) |
| Total | 914 (100.0%) | 325 (100.0%) |
Monthly Housing Cost Tiers in Marysville borough
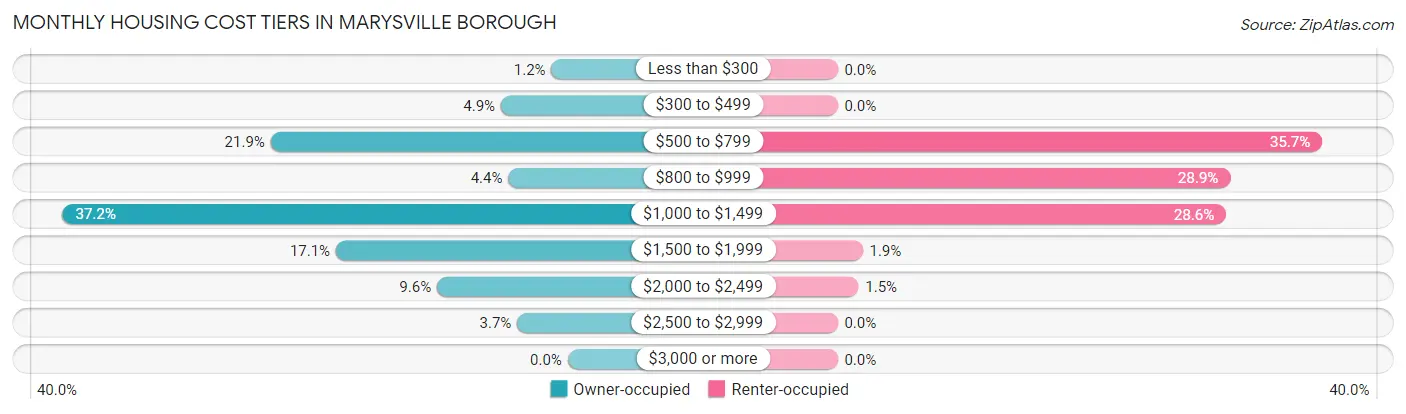
| Monthly Cost | Owner-occupied | Renter-occupied |
| Less than $300 | 11 (1.2%) | 0 (0.0%) |
| $300 to $499 | 45 (4.9%) | 0 (0.0%) |
| $500 to $799 | 200 (21.9%) | 116 (35.7%) |
| $800 to $999 | 40 (4.4%) | 94 (28.9%) |
| $1,000 to $1,499 | 340 (37.2%) | 93 (28.6%) |
| $1,500 to $1,999 | 156 (17.1%) | 6 (1.8%) |
| $2,000 to $2,499 | 88 (9.6%) | 5 (1.5%) |
| $2,500 to $2,999 | 34 (3.7%) | 0 (0.0%) |
| $3,000 or more | 0 (0.0%) | 0 (0.0%) |
| Total | 914 (100.0%) | 325 (100.0%) |
Physical Housing Characteristics in Marysville borough
Housing Structures in Marysville borough
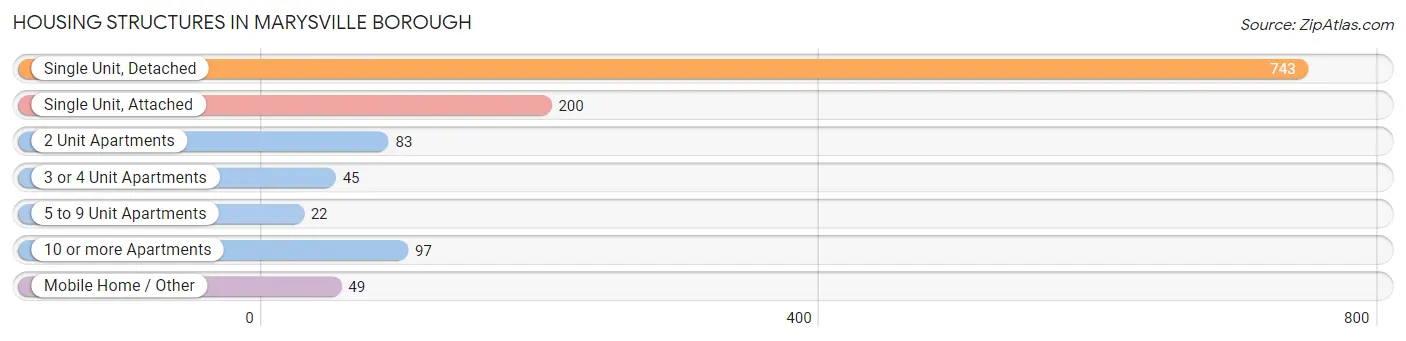
| Structure Type | # Housing Units | % Housing Units |
| Single Unit, Detached | 743 | 60.0% |
| Single Unit, Attached | 200 | 16.1% |
| 2 Unit Apartments | 83 | 6.7% |
| 3 or 4 Unit Apartments | 45 | 3.6% |
| 5 to 9 Unit Apartments | 22 | 1.8% |
| 10 or more Apartments | 97 | 7.8% |
| Mobile Home / Other | 49 | 4.0% |
| Total | 1,239 | 100.0% |
Housing Structures by Occupancy in Marysville borough
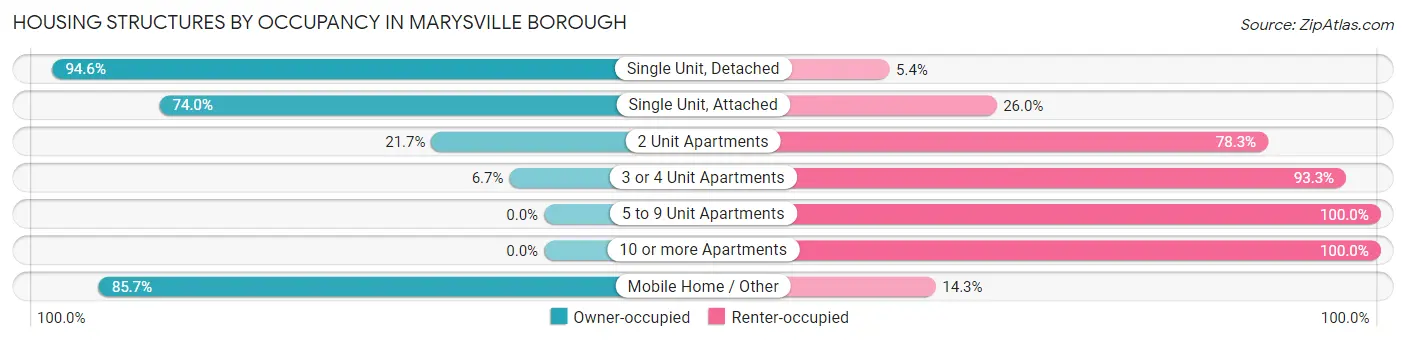
| Structure Type | Owner-occupied | Renter-occupied |
| Single Unit, Detached | 703 (94.6%) | 40 (5.4%) |
| Single Unit, Attached | 148 (74.0%) | 52 (26.0%) |
| 2 Unit Apartments | 18 (21.7%) | 65 (78.3%) |
| 3 or 4 Unit Apartments | 3 (6.7%) | 42 (93.3%) |
| 5 to 9 Unit Apartments | 0 (0.0%) | 22 (100.0%) |
| 10 or more Apartments | 0 (0.0%) | 97 (100.0%) |
| Mobile Home / Other | 42 (85.7%) | 7 (14.3%) |
| Total | 914 (73.8%) | 325 (26.2%) |
Housing Structures by Number of Rooms in Marysville borough
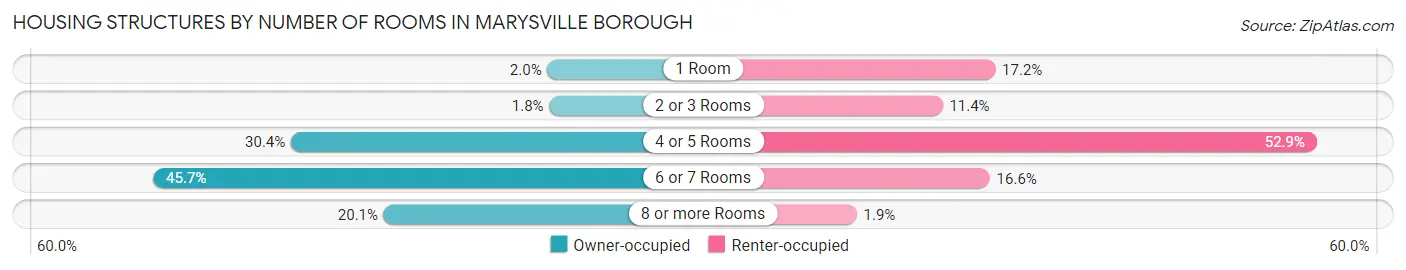
| Number of Rooms | Owner-occupied | Renter-occupied |
| 1 Room | 18 (2.0%) | 56 (17.2%) |
| 2 or 3 Rooms | 16 (1.8%) | 37 (11.4%) |
| 4 or 5 Rooms | 278 (30.4%) | 172 (52.9%) |
| 6 or 7 Rooms | 418 (45.7%) | 54 (16.6%) |
| 8 or more Rooms | 184 (20.1%) | 6 (1.8%) |
| Total | 914 (100.0%) | 325 (100.0%) |
Housing Structure by Heating Type in Marysville borough
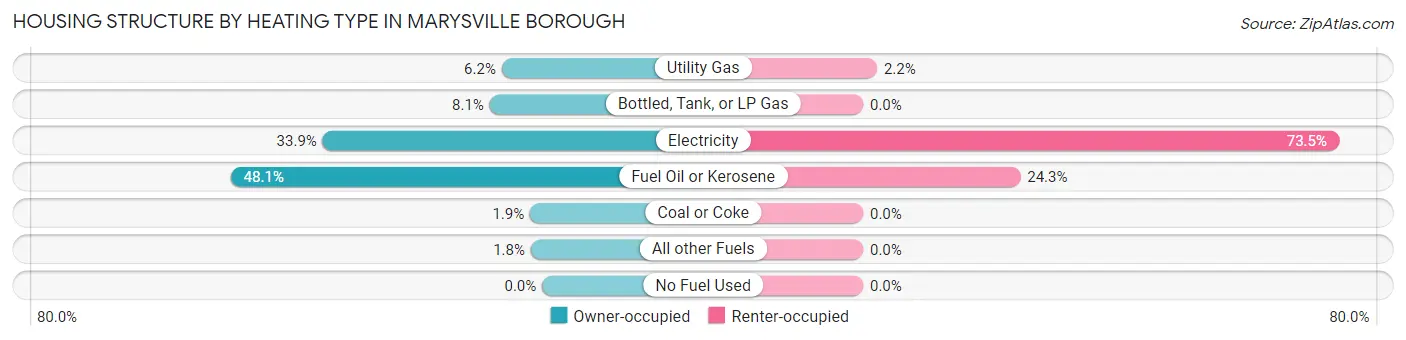
| Heating Type | Owner-occupied | Renter-occupied |
| Utility Gas | 57 (6.2%) | 7 (2.1%) |
| Bottled, Tank, or LP Gas | 74 (8.1%) | 0 (0.0%) |
| Electricity | 310 (33.9%) | 239 (73.5%) |
| Fuel Oil or Kerosene | 440 (48.1%) | 79 (24.3%) |
| Coal or Coke | 17 (1.9%) | 0 (0.0%) |
| All other Fuels | 16 (1.8%) | 0 (0.0%) |
| No Fuel Used | 0 (0.0%) | 0 (0.0%) |
| Total | 914 (100.0%) | 325 (100.0%) |
Household Vehicle Usage in Marysville borough
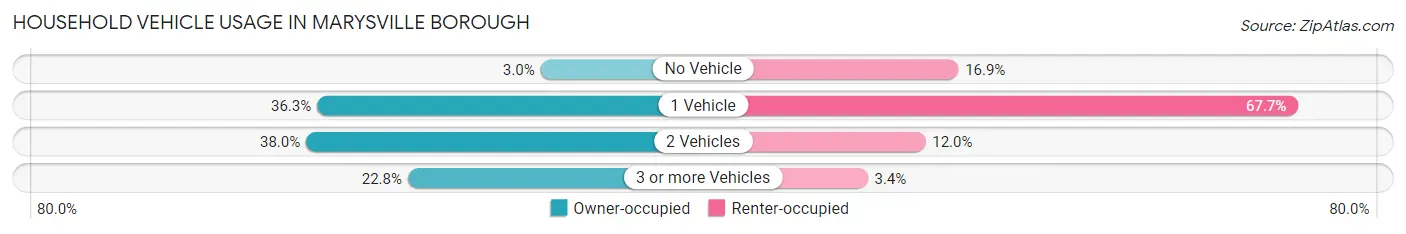
| Vehicles per Household | Owner-occupied | Renter-occupied |
| No Vehicle | 27 (2.9%) | 55 (16.9%) |
| 1 Vehicle | 332 (36.3%) | 220 (67.7%) |
| 2 Vehicles | 347 (38.0%) | 39 (12.0%) |
| 3 or more Vehicles | 208 (22.8%) | 11 (3.4%) |
| Total | 914 (100.0%) | 325 (100.0%) |
Real Estate & Mortgages in Marysville borough
Real Estate and Mortgage Overview in Marysville borough
| Characteristic | Without Mortgage | With Mortgage |
| Housing Units | 272 | 642 |
| Median Property Value | $155,300 | $179,100 |
| Median Household Income | $54,423 | $154 |
| Monthly Housing Costs | $635 | $0 |
| Real Estate Taxes | $2,311 | $15 |
Property Value by Mortgage Status in Marysville borough
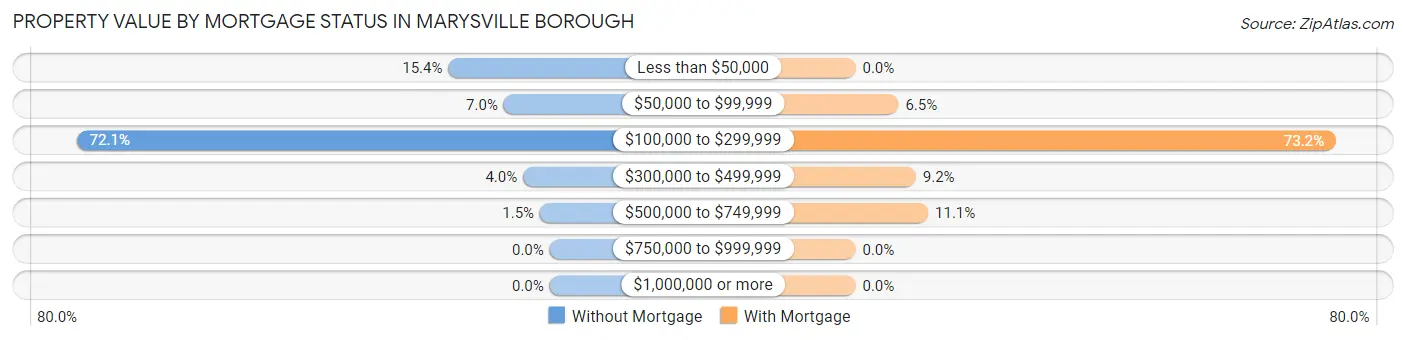
| Property Value | Without Mortgage | With Mortgage |
| Less than $50,000 | 42 (15.4%) | 0 (0.0%) |
| $50,000 to $99,999 | 19 (7.0%) | 42 (6.5%) |
| $100,000 to $299,999 | 196 (72.1%) | 470 (73.2%) |
| $300,000 to $499,999 | 11 (4.0%) | 59 (9.2%) |
| $500,000 to $749,999 | 4 (1.5%) | 71 (11.1%) |
| $750,000 to $999,999 | 0 (0.0%) | 0 (0.0%) |
| $1,000,000 or more | 0 (0.0%) | 0 (0.0%) |
| Total | 272 (100.0%) | 642 (100.0%) |
Household Income by Mortgage Status in Marysville borough
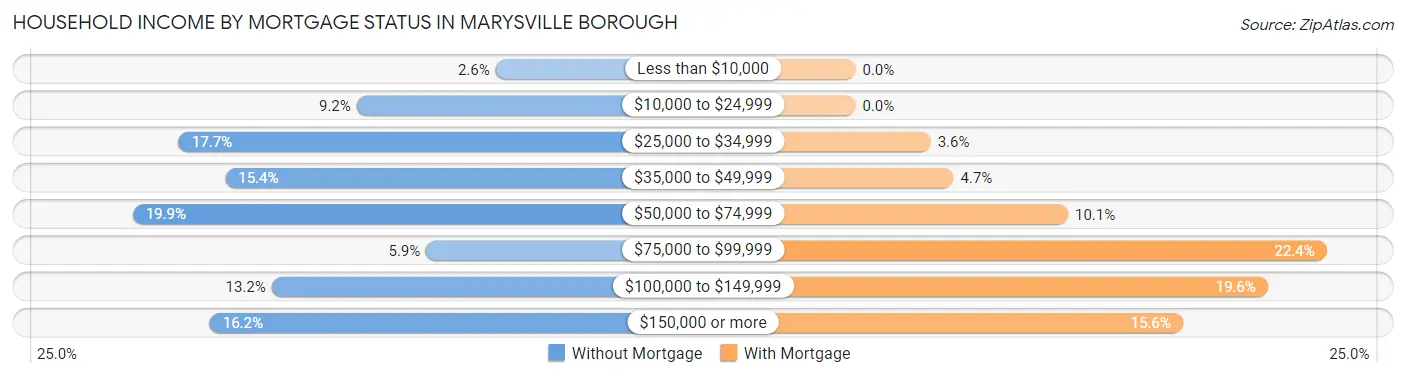
| Household Income | Without Mortgage | With Mortgage |
| Less than $10,000 | 7 (2.6%) | 0 (0.0%) |
| $10,000 to $24,999 | 25 (9.2%) | 0 (0.0%) |
| $25,000 to $34,999 | 48 (17.6%) | 23 (3.6%) |
| $35,000 to $49,999 | 42 (15.4%) | 30 (4.7%) |
| $50,000 to $74,999 | 54 (19.9%) | 65 (10.1%) |
| $75,000 to $99,999 | 16 (5.9%) | 144 (22.4%) |
| $100,000 to $149,999 | 36 (13.2%) | 126 (19.6%) |
| $150,000 or more | 44 (16.2%) | 100 (15.6%) |
| Total | 272 (100.0%) | 642 (100.0%) |
Property Value to Household Income Ratio in Marysville borough
| Value-to-Income Ratio | Without Mortgage | With Mortgage |
| Less than 2.0x | 129 (47.4%) | 85,000 (13,239.9%) |
| 2.0x to 2.9x | 31 (11.4%) | 259 (40.3%) |
| 3.0x to 3.9x | 51 (18.8%) | 249 (38.8%) |
| 4.0x or more | 54 (19.9%) | 66 (10.3%) |
| Total | 272 (100.0%) | 642 (100.0%) |
Real Estate Taxes by Mortgage Status in Marysville borough
| Property Taxes | Without Mortgage | With Mortgage |
| Less than $800 | 36 (13.2%) | 0 (0.0%) |
| $800 to $1,499 | 40 (14.7%) | 30 (4.7%) |
| $800 to $1,499 | 169 (62.1%) | 154 (24.0%) |
| Total | 272 (100.0%) | 642 (100.0%) |
Health & Disability in Marysville borough
Health Insurance Coverage by Age in Marysville borough
| Age Bracket | With Coverage | Without Coverage |
| Under 6 Years | 105 (100.0%) | 0 (0.0%) |
| 6 to 18 Years | 415 (96.3%) | 16 (3.7%) |
| 19 to 25 Years | 184 (95.3%) | 9 (4.7%) |
| 26 to 34 Years | 321 (92.5%) | 26 (7.5%) |
| 35 to 44 Years | 318 (95.8%) | 14 (4.2%) |
| 45 to 54 Years | 440 (96.7%) | 15 (3.3%) |
| 55 to 64 Years | 261 (93.2%) | 19 (6.8%) |
| 65 to 74 Years | 349 (100.0%) | 0 (0.0%) |
| 75 Years and older | 159 (100.0%) | 0 (0.0%) |
| Total | 2,552 (96.3%) | 99 (3.7%) |
Health Insurance Coverage by Citizenship Status in Marysville borough
| Citizenship Status | With Coverage | Without Coverage |
| Native Born | 105 (100.0%) | 0 (0.0%) |
| Foreign Born, Citizen | 415 (96.3%) | 16 (3.7%) |
| Foreign Born, not a Citizen | 184 (95.3%) | 9 (4.7%) |
Health Insurance Coverage by Household Income in Marysville borough
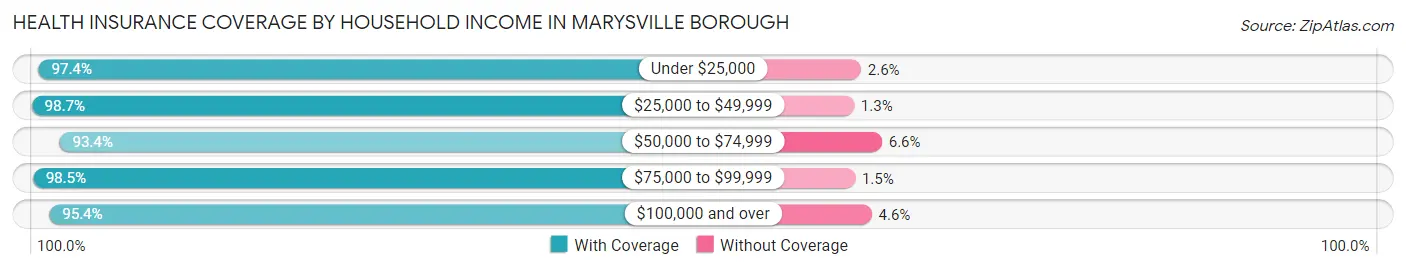
| Household Income | With Coverage | Without Coverage |
| Under $25,000 | 259 (97.4%) | 7 (2.6%) |
| $25,000 to $49,999 | 446 (98.7%) | 6 (1.3%) |
| $50,000 to $74,999 | 413 (93.4%) | 29 (6.6%) |
| $75,000 to $99,999 | 385 (98.5%) | 6 (1.5%) |
| $100,000 and over | 1,049 (95.4%) | 51 (4.6%) |
Public vs Private Health Insurance Coverage by Age in Marysville borough
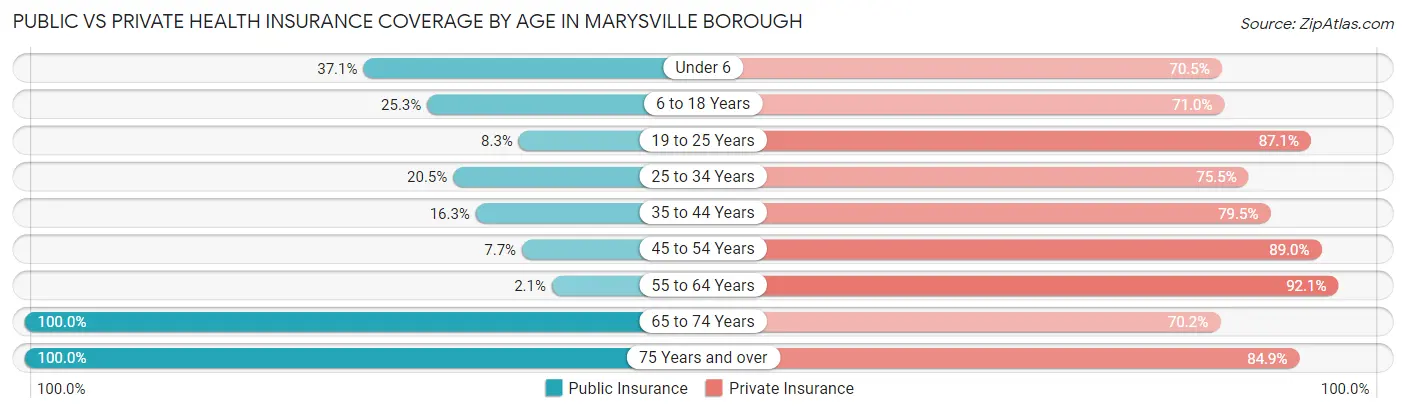
| Age Bracket | Public Insurance | Private Insurance |
| Under 6 | 39 (37.1%) | 74 (70.5%) |
| 6 to 18 Years | 109 (25.3%) | 306 (71.0%) |
| 19 to 25 Years | 16 (8.3%) | 168 (87.1%) |
| 25 to 34 Years | 71 (20.5%) | 262 (75.5%) |
| 35 to 44 Years | 54 (16.3%) | 264 (79.5%) |
| 45 to 54 Years | 35 (7.7%) | 405 (89.0%) |
| 55 to 64 Years | 6 (2.1%) | 258 (92.1%) |
| 65 to 74 Years | 349 (100.0%) | 245 (70.2%) |
| 75 Years and over | 159 (100.0%) | 135 (84.9%) |
| Total | 838 (31.6%) | 2,117 (79.9%) |
Disability Status by Sex by Age in Marysville borough
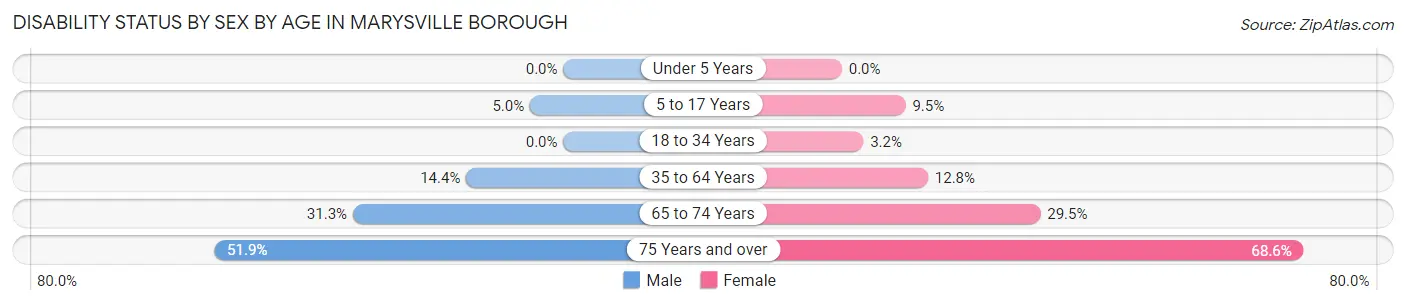
| Age Bracket | Male | Female |
| Under 5 Years | 0 (0.0%) | 0 (0.0%) |
| 5 to 17 Years | 11 (5.0%) | 21 (9.5%) |
| 18 to 34 Years | 0 (0.0%) | 10 (3.2%) |
| 35 to 64 Years | 76 (14.4%) | 69 (12.8%) |
| 65 to 74 Years | 55 (31.2%) | 51 (29.5%) |
| 75 Years and over | 28 (51.8%) | 72 (68.6%) |
Disability Class by Sex by Age in Marysville borough
Disability Class: Hearing Difficulty
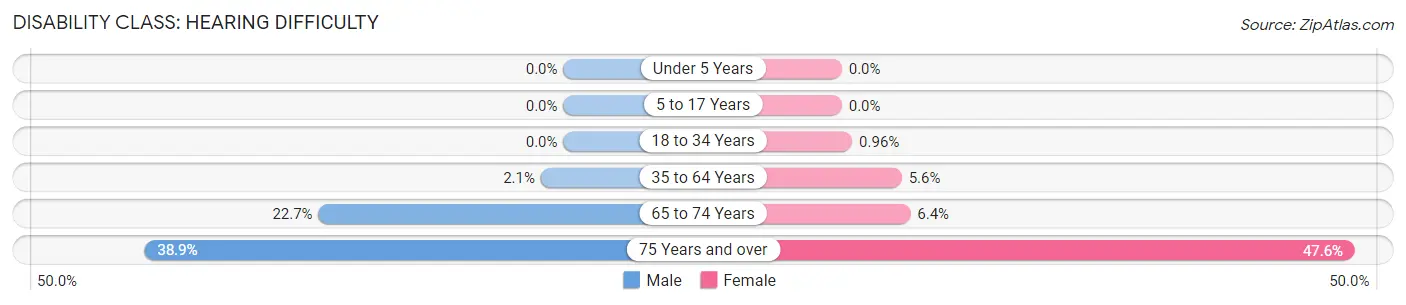
| Age Bracket | Male | Female |
| Under 5 Years | 0 (0.0%) | 0 (0.0%) |
| 5 to 17 Years | 0 (0.0%) | 0 (0.0%) |
| 18 to 34 Years | 0 (0.0%) | 3 (1.0%) |
| 35 to 64 Years | 11 (2.1%) | 30 (5.6%) |
| 65 to 74 Years | 40 (22.7%) | 11 (6.4%) |
| 75 Years and over | 21 (38.9%) | 50 (47.6%) |
Disability Class: Vision Difficulty
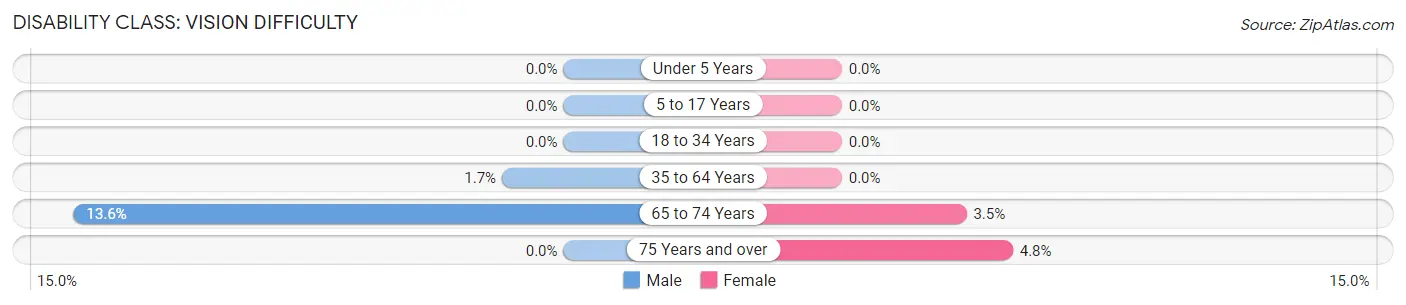
| Age Bracket | Male | Female |
| Under 5 Years | 0 (0.0%) | 0 (0.0%) |
| 5 to 17 Years | 0 (0.0%) | 0 (0.0%) |
| 18 to 34 Years | 0 (0.0%) | 0 (0.0%) |
| 35 to 64 Years | 9 (1.7%) | 0 (0.0%) |
| 65 to 74 Years | 24 (13.6%) | 6 (3.5%) |
| 75 Years and over | 0 (0.0%) | 5 (4.8%) |
Disability Class: Cognitive Difficulty
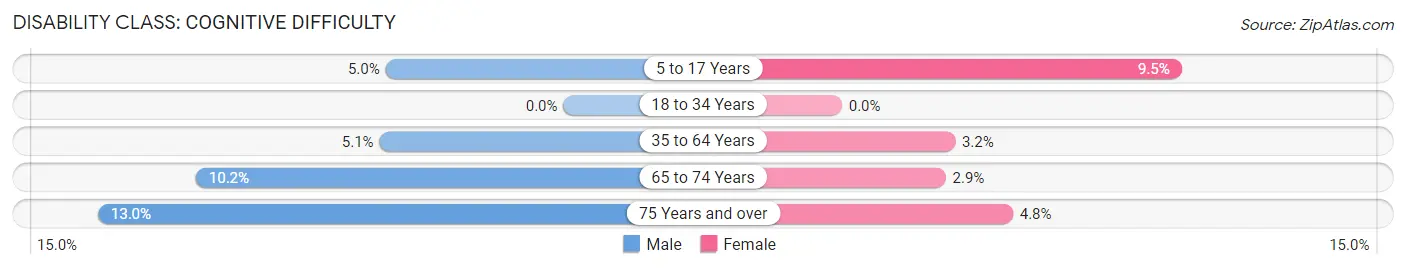
| Age Bracket | Male | Female |
| 5 to 17 Years | 11 (5.0%) | 21 (9.5%) |
| 18 to 34 Years | 0 (0.0%) | 0 (0.0%) |
| 35 to 64 Years | 27 (5.1%) | 17 (3.2%) |
| 65 to 74 Years | 18 (10.2%) | 5 (2.9%) |
| 75 Years and over | 7 (13.0%) | 5 (4.8%) |
Disability Class: Ambulatory Difficulty
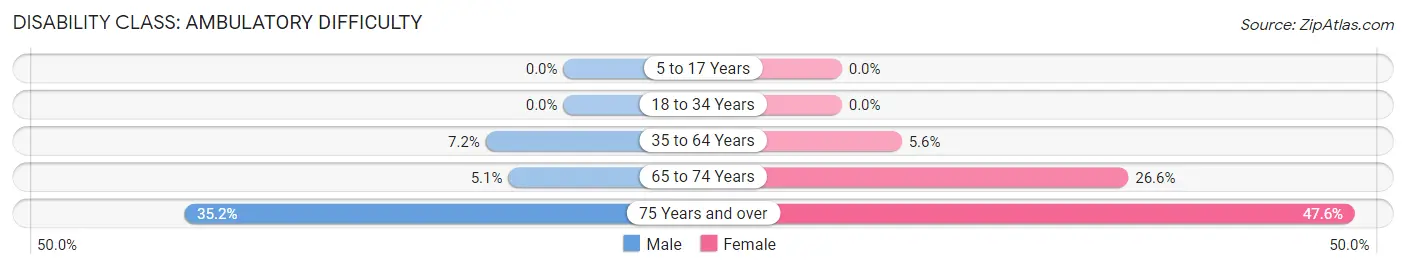
| Age Bracket | Male | Female |
| 5 to 17 Years | 0 (0.0%) | 0 (0.0%) |
| 18 to 34 Years | 0 (0.0%) | 0 (0.0%) |
| 35 to 64 Years | 38 (7.2%) | 30 (5.6%) |
| 65 to 74 Years | 9 (5.1%) | 46 (26.6%) |
| 75 Years and over | 19 (35.2%) | 50 (47.6%) |
Disability Class: Self-Care Difficulty
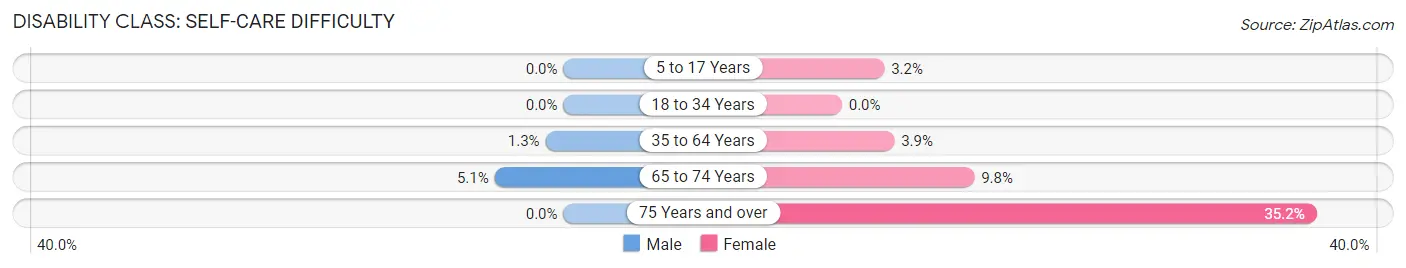
| Age Bracket | Male | Female |
| 5 to 17 Years | 0 (0.0%) | 7 (3.2%) |
| 18 to 34 Years | 0 (0.0%) | 0 (0.0%) |
| 35 to 64 Years | 7 (1.3%) | 21 (3.9%) |
| 65 to 74 Years | 9 (5.1%) | 17 (9.8%) |
| 75 Years and over | 0 (0.0%) | 37 (35.2%) |
Technology Access in Marysville borough
Computing Device Access in Marysville borough
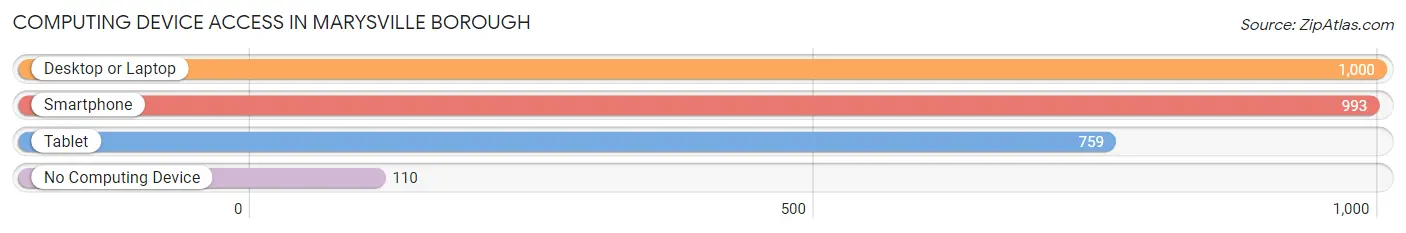
| Device Type | # Households | % Households |
| Desktop or Laptop | 1,000 | 80.7% |
| Smartphone | 993 | 80.1% |
| Tablet | 759 | 61.3% |
| No Computing Device | 110 | 8.9% |
| Total | 1,239 | 100.0% |
Internet Access in Marysville borough
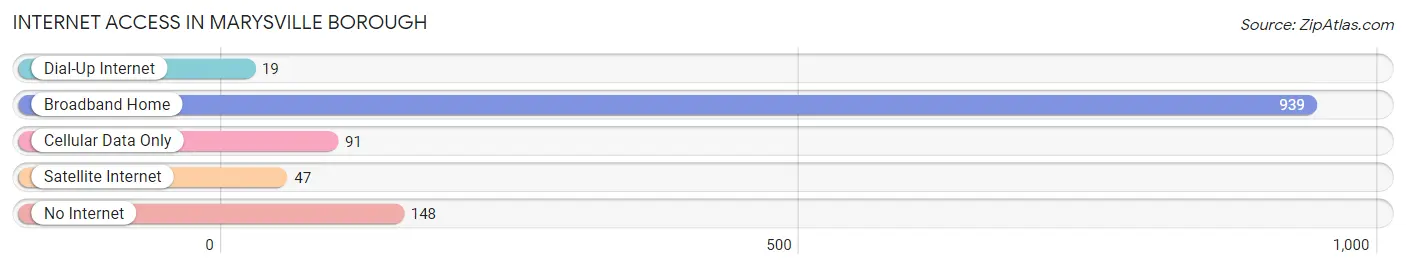
| Internet Type | # Households | % Households |
| Dial-Up Internet | 19 | 1.5% |
| Broadband Home | 939 | 75.8% |
| Cellular Data Only | 91 | 7.3% |
| Satellite Internet | 47 | 3.8% |
| No Internet | 148 | 11.9% |
| Total | 1,239 | 100.0% |
Marysville borough Summary
Marysville Borough is a small borough located in Perry County, Pennsylvania. It is situated along the Susquehanna River, approximately 10 miles northwest of Harrisburg, the state capital. The borough was incorporated in 1851 and has a population of 1,845 as of the 2010 census.
History
Marysville was first settled in 1755 by a group of German immigrants led by John Miller. The town was originally known as Millerstown, but was later renamed Marysville in honor of Mary Miller, the daughter of John Miller. The town was officially incorporated in 1851.
In the late 19th century, Marysville was a thriving industrial center, with several factories and mills located in the area. The town was home to the Marysville Iron Works, which produced iron products for the railroad industry. The town also had a large tannery, a brickyard, and a sawmill.
In the early 20th century, Marysville was a popular tourist destination, with several hotels and resorts located in the area. The town was also home to a large amusement park, which was a popular destination for visitors from Harrisburg and other nearby towns.
Geography
Marysville is located in Perry County, Pennsylvania, along the Susquehanna River. The borough has a total area of 0.9 square miles, all of which is land. The borough is located approximately 10 miles northwest of Harrisburg, the state capital.
The borough is located in the Appalachian Mountains, and is surrounded by rolling hills and forests. The Susquehanna River forms the eastern border of the borough.
Economy
The economy of Marysville is largely based on tourism and manufacturing. The town is home to several small businesses, including restaurants, shops, and hotels. The town is also home to a large amusement park, which is a popular destination for visitors from Harrisburg and other nearby towns.
The town is also home to several manufacturing companies, including a plastics manufacturer, a metal fabrication company, and a printing company.
Demographics
As of the 2010 census, the population of Marysville was 1,845. The racial makeup of the borough was 97.3% White, 0.7% African American, 0.2% Native American, 0.2% Asian, 0.2% from other races, and 1.4% from two or more races. Hispanic or Latino of any race were 0.9% of the population.
The median household income in Marysville was $41,250, and the median family income was $50,000. The per capita income for the borough was $20,845. About 8.3% of families and 10.2% of the population were below the poverty line, including 14.3% of those under age 18 and 8.2% of those age 65 or over.
Common Questions
What is Per Capita Income in Marysville borough?
Per Capita income in Marysville borough is $51,270.
What is the Median Family Income in Marysville borough?
Median Family Income in Marysville borough is $95,144.
What is the Median Household income in Marysville borough?
Median Household Income in Marysville borough is $65,350.
What is Income or Wage Gap in Marysville borough?
Income or Wage Gap in Marysville borough is 7.2%.
Women in Marysville borough earn 92.8 cents for every dollar earned by a man.
What is Inequality or Gini Index in Marysville borough?
Inequality or Gini Index in Marysville borough is 0.52.
What is the Total Population of Marysville borough?
Total Population of Marysville borough is 2,651.
What is the Total Male Population of Marysville borough?
Total Male Population of Marysville borough is 1,256.
What is the Total Female Population of Marysville borough?
Total Female Population of Marysville borough is 1,395.
What is the Ratio of Males per 100 Females in Marysville borough?
There are 90.04 Males per 100 Females in Marysville borough.
What is the Ratio of Females per 100 Males in Marysville borough?
There are 111.07 Females per 100 Males in Marysville borough.
What is the Median Population Age in Marysville borough?
Median Population Age in Marysville borough is 41.9 Years.
What is the Average Family Size in Marysville borough
Average Family Size in Marysville borough is 2.9 People.
What is the Average Household Size in Marysville borough
Average Household Size in Marysville borough is 2.1 People.
How Large is the Labor Force in Marysville borough?
There are 1,533 People in the Labor Forcein in Marysville borough.
What is the Percentage of People in the Labor Force in Marysville borough?
71.6% of People are in the Labor Force in Marysville borough.
What is the Unemployment Rate in Marysville borough?
Unemployment Rate in Marysville borough is 4.9%.