Applewold borough, PA Map & Demographics
Applewold borough Overview
$34,758
PER CAPITA INCOME
$95,658
AVG FAMILY INCOME
$45,750
AVG HOUSEHOLD INCOME
43.6%
WAGE / INCOME GAP [ % ]
56.4¢/ $1
WAGE / INCOME GAP [ $ ]
0.48
INEQUALITY / GINI INDEX
320
TOTAL POPULATION
136
MALE POPULATION
184
FEMALE POPULATION
73.91
MALES / 100 FEMALES
135.29
FEMALES / 100 MALES
40.8
MEDIAN AGE
2.7
AVG FAMILY SIZE
1.9
AVG HOUSEHOLD SIZE
157
LABOR FORCE [ PEOPLE ]
60.6%
PERCENT IN LABOR FORCE
3.2%
UNEMPLOYMENT RATE
Income in Applewold borough
Income Overview in Applewold borough
Per Capita Income in Applewold borough is $34,758, while median incomes of families and households are $95,658 and $45,750 respectively.
| Characteristic | Number | Measure |
| Per Capita Income | 320 | $34,758 |
| Median Family Income | 80 | $95,658 |
| Mean Family Income | 80 | $98,458 |
| Median Household Income | 171 | $45,750 |
| Mean Household Income | 171 | $66,586 |
| Income Deficit | 80 | $0 |
| Wage / Income Gap (%) | 320 | 43.57% |
| Wage / Income Gap ($) | 320 | 56.43¢ per $1 |
| Gini / Inequality Index | 320 | 0.48 |
Earnings by Sex in Applewold borough
Average Earnings in Applewold borough are $37,500, $58,333 for men and $32,917 for women, a difference of 43.6%.
| Sex | Number | Average Earnings |
| Male | 94 (57.3%) | $58,333 |
| Female | 70 (42.7%) | $32,917 |
| Total | 164 (100.0%) | $37,500 |
Earnings by Sex by Income Bracket in Applewold borough
The most common earnings brackets in Applewold borough are $75,000 to $99,999 for men (24 | 25.5%) and $35,000 to $39,999 for women (16 | 22.9%).
| Income | Male | Female |
| $2,499 or less | 6 (6.4%) | 2 (2.9%) |
| $2,500 to $4,999 | 6 (6.4%) | 1 (1.4%) |
| $5,000 to $7,499 | 4 (4.3%) | 6 (8.6%) |
| $7,500 to $9,999 | 0 (0.0%) | 4 (5.7%) |
| $10,000 to $12,499 | 3 (3.2%) | 5 (7.1%) |
| $12,500 to $14,999 | 5 (5.3%) | 4 (5.7%) |
| $15,000 to $17,499 | 0 (0.0%) | 0 (0.0%) |
| $17,500 to $19,999 | 0 (0.0%) | 0 (0.0%) |
| $20,000 to $22,499 | 0 (0.0%) | 3 (4.3%) |
| $22,500 to $24,999 | 4 (4.3%) | 3 (4.3%) |
| $25,000 to $29,999 | 1 (1.1%) | 3 (4.3%) |
| $30,000 to $34,999 | 2 (2.1%) | 9 (12.9%) |
| $35,000 to $39,999 | 0 (0.0%) | 16 (22.9%) |
| $40,000 to $44,999 | 4 (4.3%) | 2 (2.9%) |
| $45,000 to $49,999 | 4 (4.3%) | 3 (4.3%) |
| $50,000 to $54,999 | 5 (5.3%) | 5 (7.1%) |
| $55,000 to $64,999 | 7 (7.4%) | 2 (2.9%) |
| $65,000 to $74,999 | 9 (9.6%) | 0 (0.0%) |
| $75,000 to $99,999 | 24 (25.5%) | 2 (2.9%) |
| $100,000+ | 10 (10.6%) | 0 (0.0%) |
| Total | 94 (100.0%) | 70 (100.0%) |
Earnings by Sex by Educational Attainment in Applewold borough
Average earnings in Applewold borough are $70,313 for men and $33,125 for women, a difference of 52.9%. Men with an educational attainment of graduate degree enjoy the highest average annual earnings of $91,513, while those with bachelor's degree education earn the least with $55,625. Women with an educational attainment of high school diploma earn the most with the average annual earnings of $33,250, while those with bachelor's degree education have the smallest earnings of $28,750.
| Educational Attainment | Male Income | Female Income |
| Less than High School | - | - |
| High School Diploma | - | - |
| College or Associate's Degree | $60,625 | $0 |
| Bachelor's Degree | $55,625 | $28,750 |
| Graduate Degree | $91,513 | $0 |
| Total | $70,313 | $33,125 |
Family Income in Applewold borough
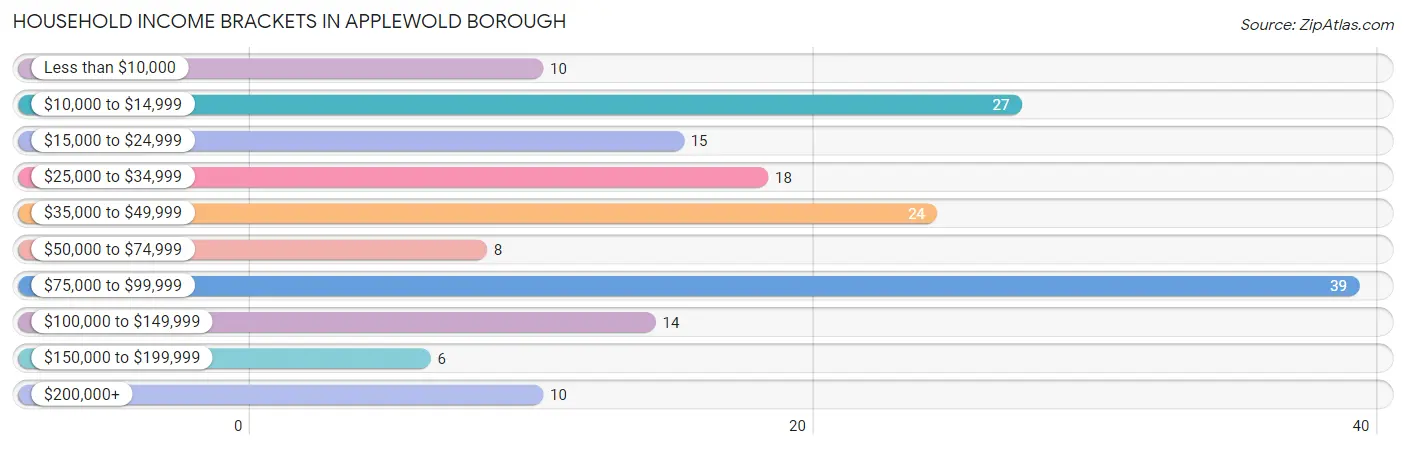
Family Income Brackets in Applewold borough
According to the Applewold borough family income data, there are 28 families falling into the $75,000 to $99,999 income range, which is the most common income bracket and makes up 35.0% of all families. Conversely, the less than $10,000 income bracket is the least frequent group with only 2 families (2.5%) belonging to this category.
| Income Bracket | # Families | % Families |
| Less than $10,000 | 2 | 2.5% |
| $10,000 to $14,999 | 7 | 8.8% |
| $15,000 to $24,999 | 2 | 2.5% |
| $25,000 to $34,999 | 2 | 2.5% |
| $35,000 to $49,999 | 9 | 11.3% |
| $50,000 to $74,999 | 6 | 7.5% |
| $75,000 to $99,999 | 28 | 35.0% |
| $100,000 to $149,999 | 10 | 12.5% |
| $150,000 to $199,999 | 4 | 5.0% |
| $200,000+ | 10 | 12.5% |
Family Income by Famaliy Size in Applewold borough
3-person families (36 | 45.0%) account for the highest median family income in Applewold borough with $96,447 per family, while 2-person families (36 | 45.0%) have the highest median income of $33,125 per family member.
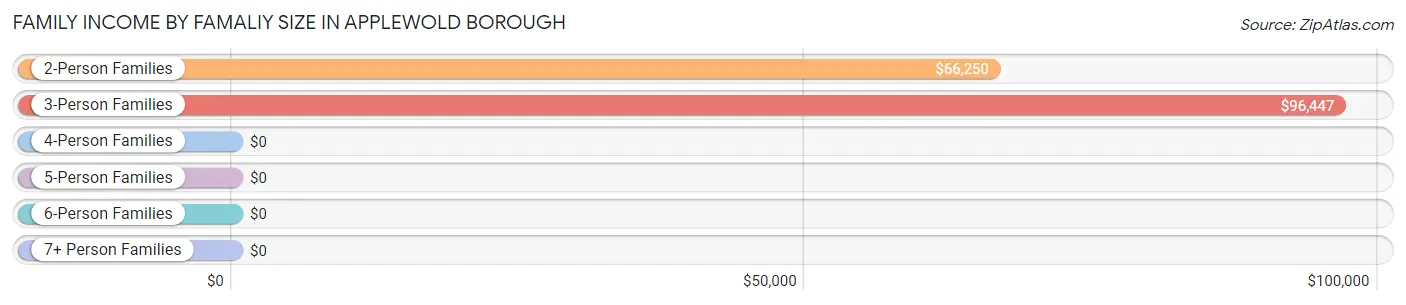
| Income Bracket | # Families | Median Income |
| 2-Person Families | 36 (45.0%) | $66,250 |
| 3-Person Families | 36 (45.0%) | $96,447 |
| 4-Person Families | 4 (5.0%) | $0 |
| 5-Person Families | 3 (3.7%) | $0 |
| 6-Person Families | 1 (1.3%) | $0 |
| 7+ Person Families | 0 (0.0%) | $0 |
| Total | 80 (100.0%) | $95,658 |
Family Income by Number of Earners in Applewold borough
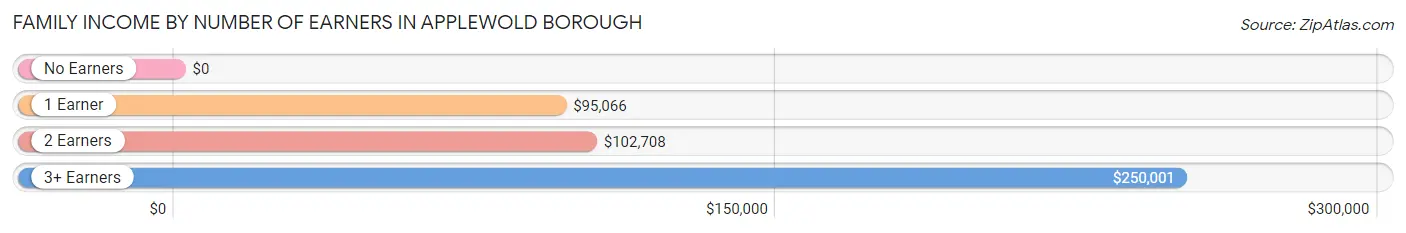
| Number of Earners | # Families | Median Income |
| No Earners | 4 (5.0%) | $0 |
| 1 Earner | 39 (48.7%) | $95,066 |
| 2 Earners | 31 (38.8%) | $102,708 |
| 3+ Earners | 6 (7.5%) | $250,001 |
| Total | 80 (100.0%) | $95,658 |
Household Income in Applewold borough
Household Income Brackets in Applewold borough
With 39 households falling in the category, the $75,000 to $99,999 income range is the most frequent in Applewold borough, accounting for 22.8% of all households. In contrast, only 6 households (3.5%) fall into the $150,000 to $199,999 income bracket, making it the least populous group.
| Income Bracket | # Households | % Households |
| Less than $10,000 | 10 | 5.8% |
| $10,000 to $14,999 | 27 | 15.8% |
| $15,000 to $24,999 | 15 | 8.8% |
| $25,000 to $34,999 | 18 | 10.5% |
| $35,000 to $49,999 | 24 | 14.0% |
| $50,000 to $74,999 | 8 | 4.7% |
| $75,000 to $99,999 | 39 | 22.8% |
| $100,000 to $149,999 | 14 | 8.2% |
| $150,000 to $199,999 | 6 | 3.5% |
| $200,000+ | 10 | 5.8% |
Household Income by Householder Age in Applewold borough
The median household income in Applewold borough is $45,750, with the highest median household income of $103,542 found in the 45 to 64 years age bracket for the primary householder. A total of 31 households (18.1%) fall into this category. Meanwhile, the 15 to 24 years age bracket for the primary householder has the lowest median household income of $0, with 9 households (5.3%) in this group.
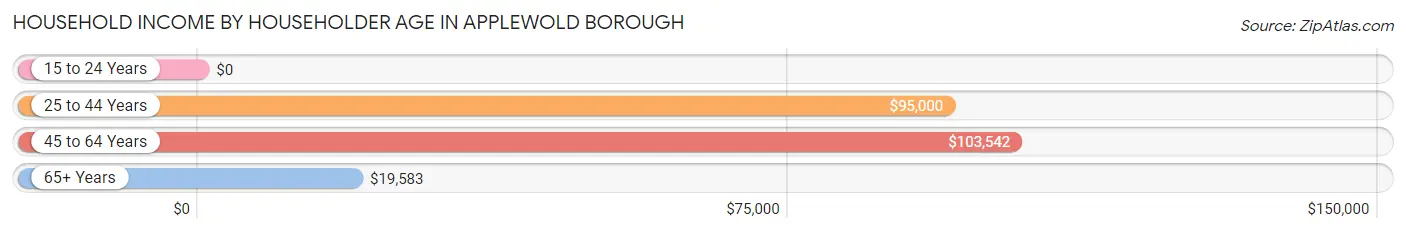
| Income Bracket | # Households | Median Income |
| 15 to 24 Years | 9 (5.3%) | $0 |
| 25 to 44 Years | 54 (31.6%) | $95,000 |
| 45 to 64 Years | 31 (18.1%) | $103,542 |
| 65+ Years | 77 (45.0%) | $19,583 |
| Total | 171 (100.0%) | $45,750 |
Poverty in Applewold borough
Income Below Poverty by Sex and Age in Applewold borough
With 8.8% poverty level for males and 23.9% for females among the residents of Applewold borough, 18 to 24 year old males and under 5 year old females are the most vulnerable to poverty, with 8 males (53.3%) and 10 females (76.9%) in their respective age groups living below the poverty level.
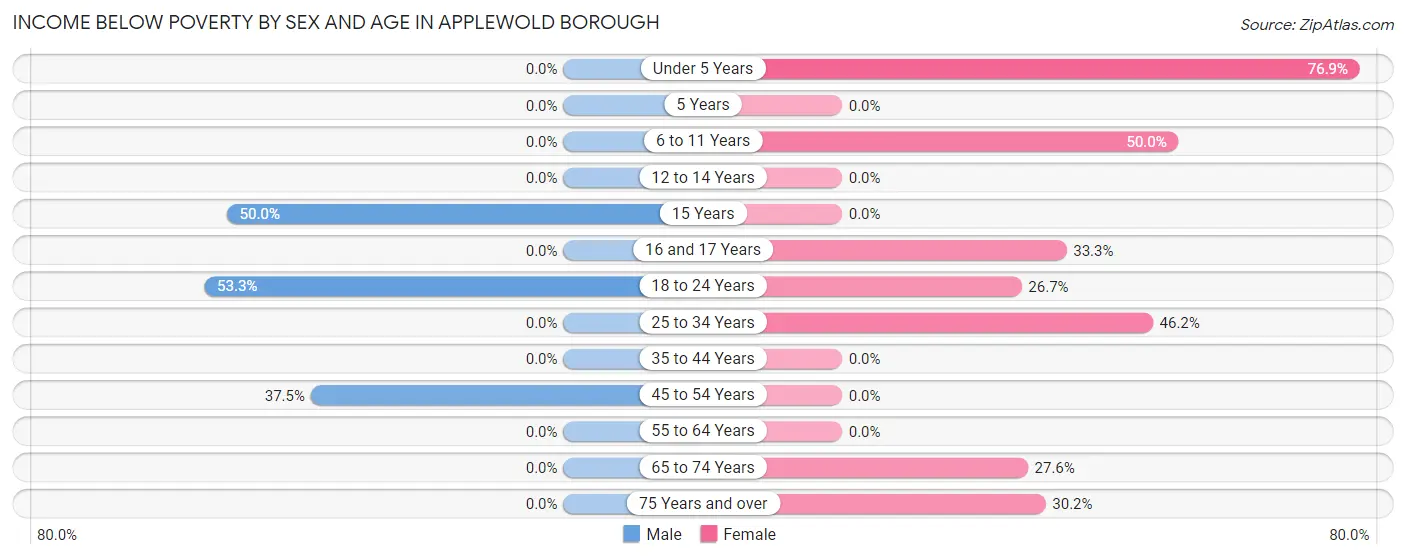
| Age Bracket | Male | Female |
| Under 5 Years | 0 (0.0%) | 10 (76.9%) |
| 5 Years | 0 (0.0%) | 0 (0.0%) |
| 6 to 11 Years | 0 (0.0%) | 1 (50.0%) |
| 12 to 14 Years | 0 (0.0%) | 0 (0.0%) |
| 15 Years | 1 (50.0%) | 0 (0.0%) |
| 16 and 17 Years | 0 (0.0%) | 2 (33.3%) |
| 18 to 24 Years | 8 (53.3%) | 4 (26.7%) |
| 25 to 34 Years | 0 (0.0%) | 6 (46.2%) |
| 35 to 44 Years | 0 (0.0%) | 0 (0.0%) |
| 45 to 54 Years | 3 (37.5%) | 0 (0.0%) |
| 55 to 64 Years | 0 (0.0%) | 0 (0.0%) |
| 65 to 74 Years | 0 (0.0%) | 8 (27.6%) |
| 75 Years and over | 0 (0.0%) | 13 (30.2%) |
| Total | 12 (8.8%) | 44 (23.9%) |
Income Above Poverty by Sex and Age in Applewold borough
According to the poverty statistics in Applewold borough, males aged 5 years and females aged 15 years are the age groups that are most secure financially, with 100.0% of males and 100.0% of females in these age groups living above the poverty line.
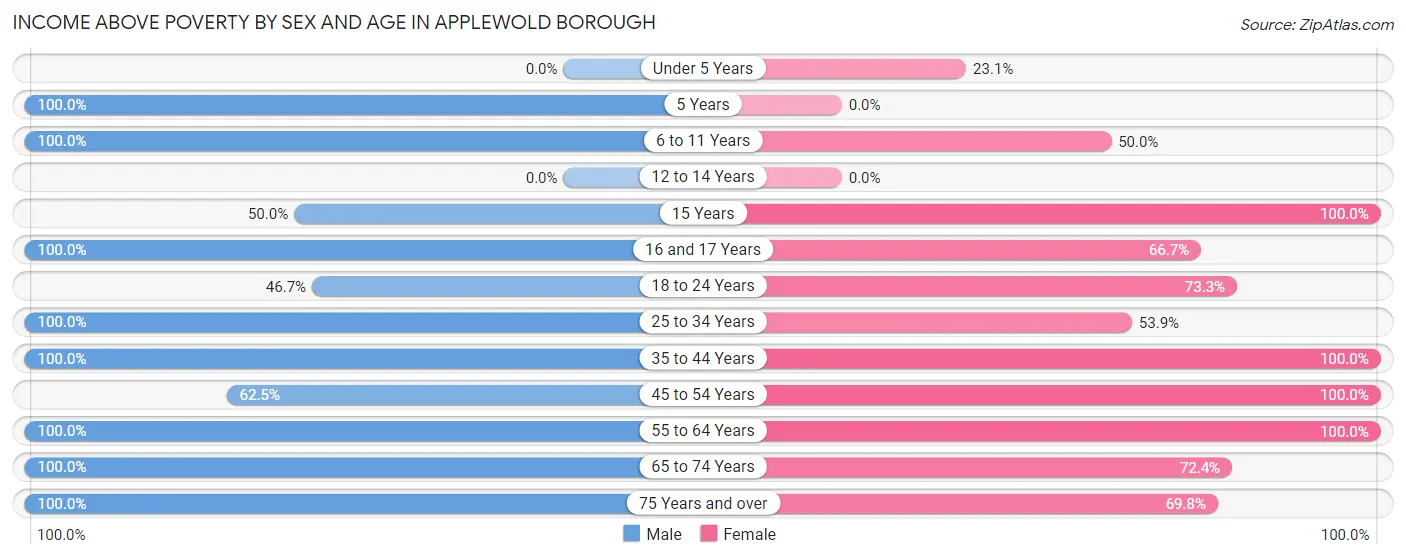
| Age Bracket | Male | Female |
| Under 5 Years | 0 (0.0%) | 3 (23.1%) |
| 5 Years | 2 (100.0%) | 0 (0.0%) |
| 6 to 11 Years | 26 (100.0%) | 1 (50.0%) |
| 12 to 14 Years | 0 (0.0%) | 0 (0.0%) |
| 15 Years | 1 (50.0%) | 16 (100.0%) |
| 16 and 17 Years | 6 (100.0%) | 4 (66.7%) |
| 18 to 24 Years | 7 (46.7%) | 11 (73.3%) |
| 25 to 34 Years | 13 (100.0%) | 7 (53.8%) |
| 35 to 44 Years | 33 (100.0%) | 19 (100.0%) |
| 45 to 54 Years | 5 (62.5%) | 8 (100.0%) |
| 55 to 64 Years | 10 (100.0%) | 20 (100.0%) |
| 65 to 74 Years | 16 (100.0%) | 21 (72.4%) |
| 75 Years and over | 5 (100.0%) | 30 (69.8%) |
| Total | 124 (91.2%) | 140 (76.1%) |
Income Below Poverty Among Married-Couple Families in Applewold borough
The poverty statistics for married-couple families in Applewold borough show that 5.4% or 2 of the total 37 families live below the poverty line. Families with 3 or 4 children have the highest poverty rate of 66.7%, comprising of 2 families. On the other hand, families with no children have the lowest poverty rate of 0.0%, which includes 0 families.
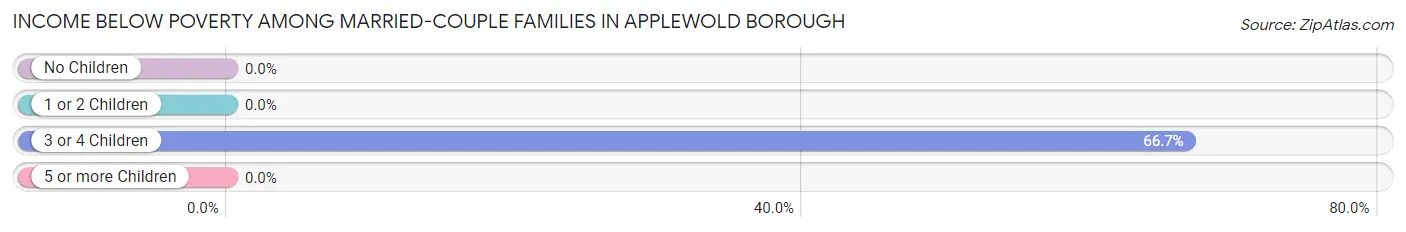
| Children | Above Poverty | Below Poverty |
| No Children | 23 (100.0%) | 0 (0.0%) |
| 1 or 2 Children | 11 (100.0%) | 0 (0.0%) |
| 3 or 4 Children | 1 (33.3%) | 2 (66.7%) |
| 5 or more Children | 0 (0.0%) | 0 (0.0%) |
| Total | 35 (94.6%) | 2 (5.4%) |
Income Below Poverty Among Single-Parent Households in Applewold borough
According to the poverty data in Applewold borough, 11.5% or 3 single-father households and 35.3% or 6 single-mother households are living below the poverty line. Among single-father households, those with 1 or 2 children have the highest poverty rate, with 3 households (13.0%) experiencing poverty. Likewise, among single-mother households, those with 1 or 2 children have the highest poverty rate, with 6 households (50.0%) falling below the poverty line.
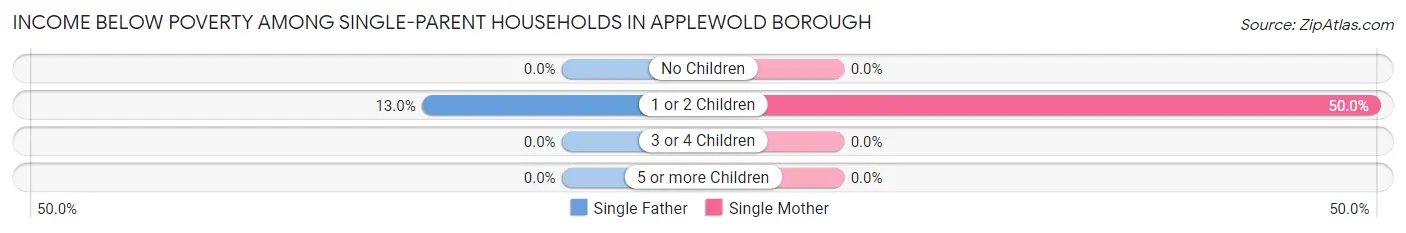
| Children | Single Father | Single Mother |
| No Children | 0 (0.0%) | 0 (0.0%) |
| 1 or 2 Children | 3 (13.0%) | 6 (50.0%) |
| 3 or 4 Children | 0 (0.0%) | 0 (0.0%) |
| 5 or more Children | 0 (0.0%) | 0 (0.0%) |
| Total | 3 (11.5%) | 6 (35.3%) |
Income Below Poverty Among Married-Couple vs Single-Parent Households in Applewold borough
The poverty data for Applewold borough shows that 2 of the married-couple family households (5.4%) and 9 of the single-parent households (20.9%) are living below the poverty level. Within the married-couple family households, those with 3 or 4 children have the highest poverty rate, with 2 households (66.7%) falling below the poverty line. Among the single-parent households, those with 1 or 2 children have the highest poverty rate, with 9 household (25.7%) living below poverty.
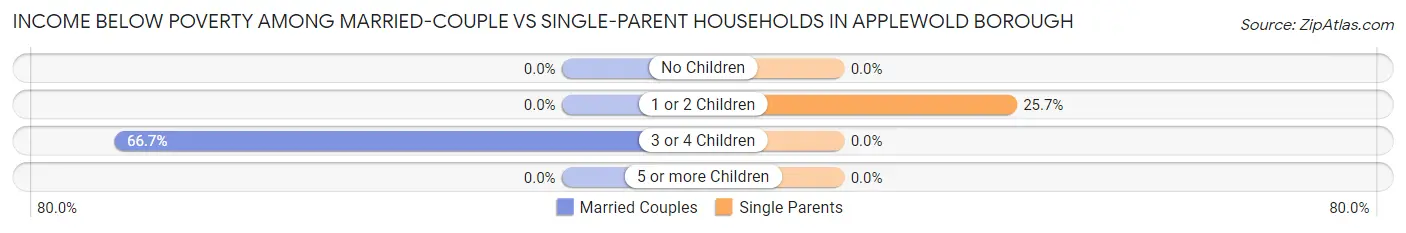
| Children | Married-Couple Families | Single-Parent Households |
| No Children | 0 (0.0%) | 0 (0.0%) |
| 1 or 2 Children | 0 (0.0%) | 9 (25.7%) |
| 3 or 4 Children | 2 (66.7%) | 0 (0.0%) |
| 5 or more Children | 0 (0.0%) | 0 (0.0%) |
| Total | 2 (5.4%) | 9 (20.9%) |
Race in Applewold borough
The most populous races in Applewold borough are White / Caucasian (291 | 90.9%), Two or more Races (19 | 5.9%), and Black / African American (7 | 2.2%).
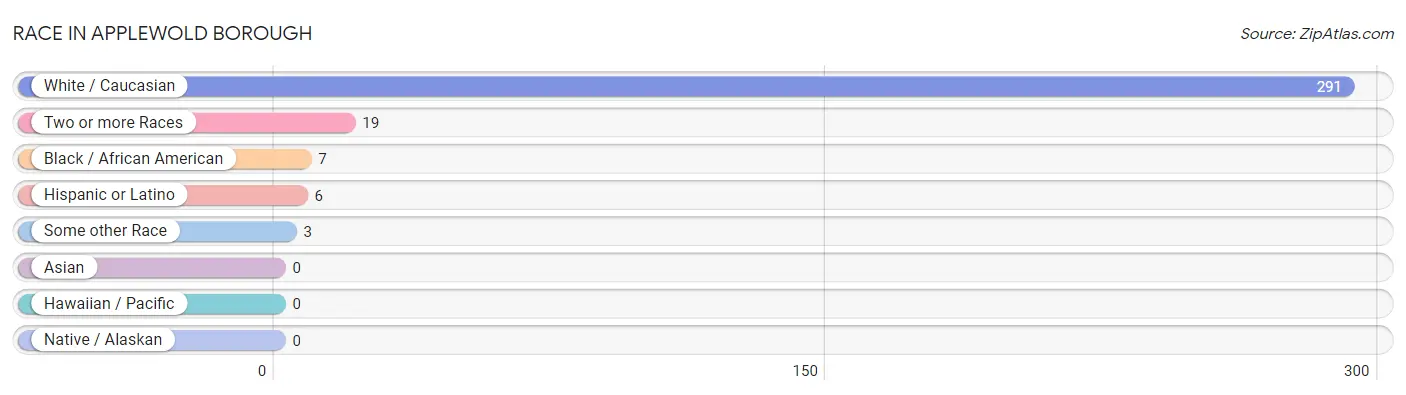
| Race | # Population | % Population |
| Asian | 0 | 0.0% |
| Black / African American | 7 | 2.2% |
| Hawaiian / Pacific | 0 | 0.0% |
| Hispanic or Latino | 6 | 1.9% |
| Native / Alaskan | 0 | 0.0% |
| White / Caucasian | 291 | 90.9% |
| Two or more Races | 19 | 5.9% |
| Some other Race | 3 | 0.9% |
| Total | 320 | 100.0% |
Ancestry in Applewold borough
The most populous ancestries reported in Applewold borough are German (132 | 41.2%), English (36 | 11.3%), Irish (36 | 11.3%), Italian (26 | 8.1%), and French (12 | 3.7%), together accounting for 75.6% of all Applewold borough residents.
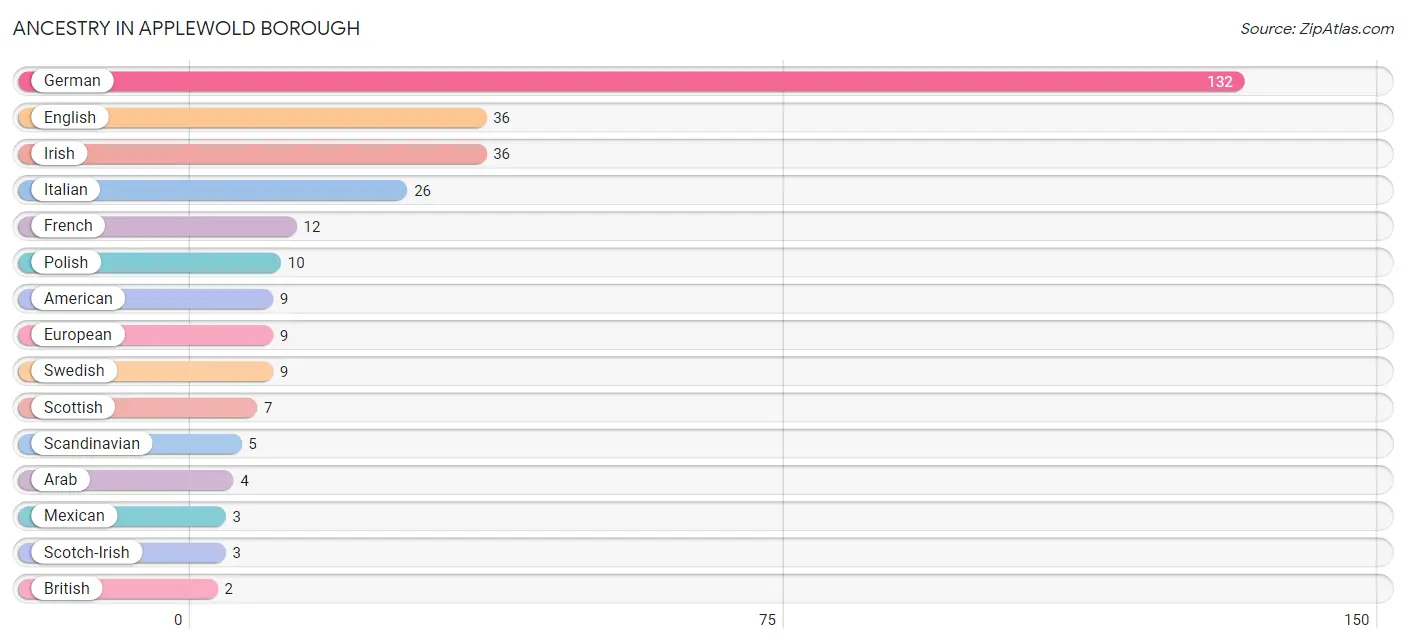
| Ancestry | # Population | % Population |
| American | 9 | 2.8% |
| Arab | 4 | 1.3% |
| British | 2 | 0.6% |
| English | 36 | 11.3% |
| European | 9 | 2.8% |
| French | 12 | 3.7% |
| German | 132 | 41.2% |
| Irish | 36 | 11.3% |
| Italian | 26 | 8.1% |
| Lithuanian | 2 | 0.6% |
| Mexican | 3 | 0.9% |
| Norwegian | 1 | 0.3% |
| Polish | 10 | 3.1% |
| Russian | 2 | 0.6% |
| Scandinavian | 5 | 1.6% |
| Scotch-Irish | 3 | 0.9% |
| Scottish | 7 | 2.2% |
| Slovak | 2 | 0.6% |
| Swedish | 9 | 2.8% |
| Syrian | 2 | 0.6% |
| Ukrainian | 2 | 0.6% | View All 21 Rows |
Immigrants in Applewold borough

| Immigration Origin | # Population | % Population | View All 0 Rows |
Sex and Age in Applewold borough
Sex and Age in Applewold borough
The most populous age groups in Applewold borough are 40 to 44 Years (28 | 20.6%) for men and 85 Years and over (25 | 13.6%) for women.
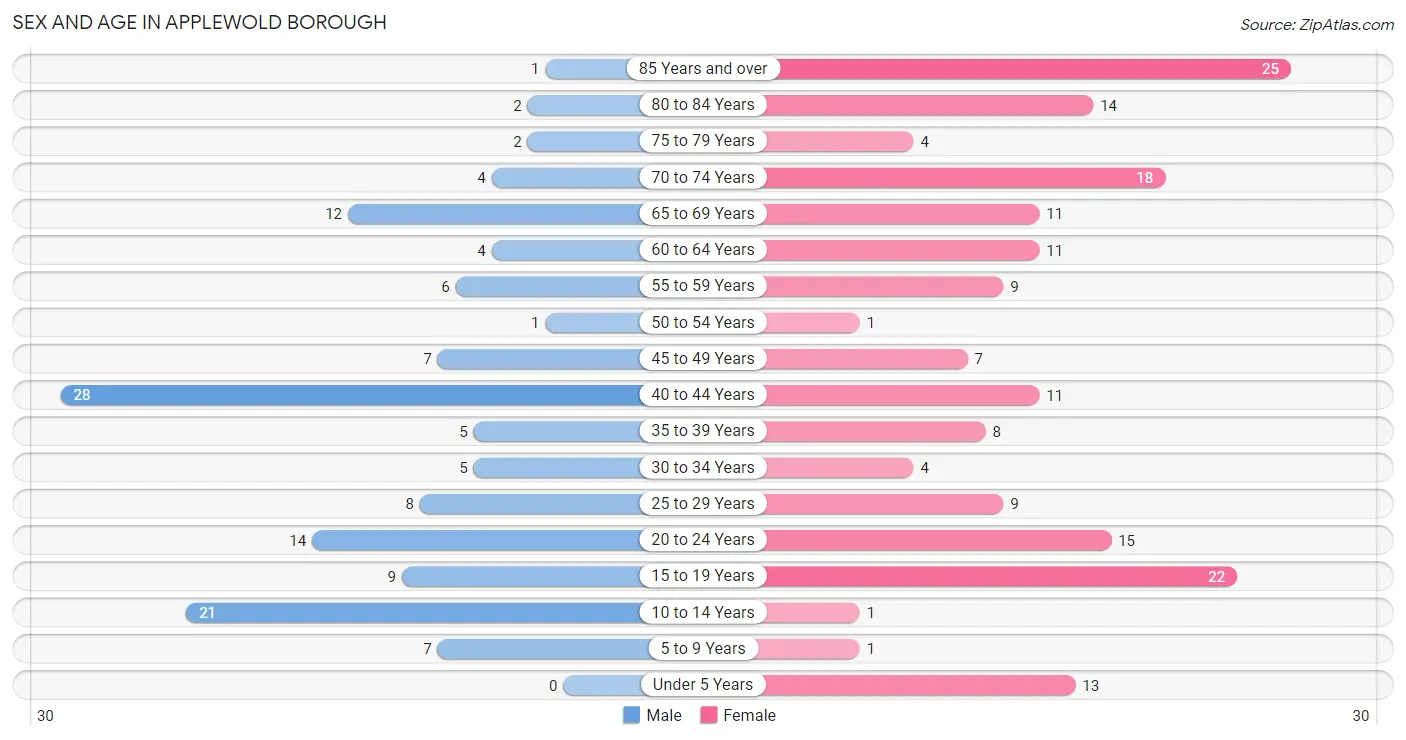
| Age Bracket | Male | Female |
| Under 5 Years | 0 (0.0%) | 13 (7.1%) |
| 5 to 9 Years | 7 (5.1%) | 1 (0.5%) |
| 10 to 14 Years | 21 (15.4%) | 1 (0.5%) |
| 15 to 19 Years | 9 (6.6%) | 22 (12.0%) |
| 20 to 24 Years | 14 (10.3%) | 15 (8.2%) |
| 25 to 29 Years | 8 (5.9%) | 9 (4.9%) |
| 30 to 34 Years | 5 (3.7%) | 4 (2.2%) |
| 35 to 39 Years | 5 (3.7%) | 8 (4.3%) |
| 40 to 44 Years | 28 (20.6%) | 11 (6.0%) |
| 45 to 49 Years | 7 (5.1%) | 7 (3.8%) |
| 50 to 54 Years | 1 (0.7%) | 1 (0.5%) |
| 55 to 59 Years | 6 (4.4%) | 9 (4.9%) |
| 60 to 64 Years | 4 (2.9%) | 11 (6.0%) |
| 65 to 69 Years | 12 (8.8%) | 11 (6.0%) |
| 70 to 74 Years | 4 (2.9%) | 18 (9.8%) |
| 75 to 79 Years | 2 (1.5%) | 4 (2.2%) |
| 80 to 84 Years | 2 (1.5%) | 14 (7.6%) |
| 85 Years and over | 1 (0.7%) | 25 (13.6%) |
| Total | 136 (100.0%) | 184 (100.0%) |
Families and Households in Applewold borough
Median Family Size in Applewold borough
The median family size in Applewold borough is 2.66 persons per family, with married-couple families (37 | 46.3%) accounting for the largest median family size of 3 persons per family. On the other hand, single female/mother families (17 | 21.2%) represent the smallest median family size with 1.88 persons per family.
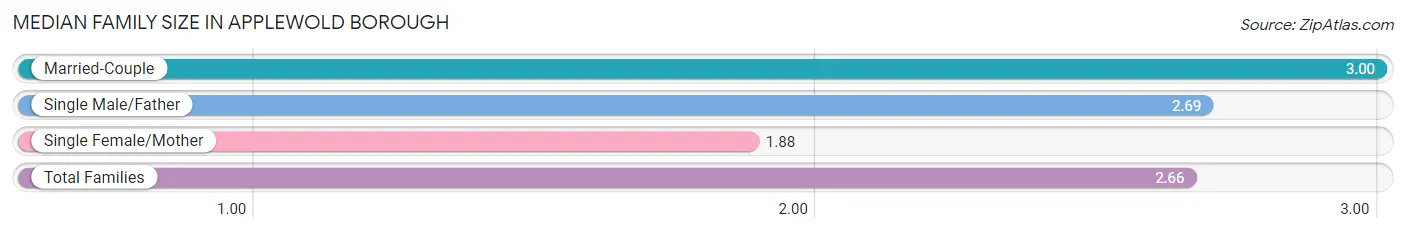
| Family Type | # Families | Family Size |
| Married-Couple | 37 (46.3%) | 3.00 |
| Single Male/Father | 26 (32.5%) | 2.69 |
| Single Female/Mother | 17 (21.2%) | 1.88 |
| Total Families | 80 (100.0%) | 2.66 |
Median Household Size in Applewold borough
The median household size in Applewold borough is 1.87 persons per household, with married-couple households (37 | 21.6%) accounting for the largest median household size of 3 persons per household. non-family households (91 | 53.2%) represent the smallest median household size with 1.13 persons per household.
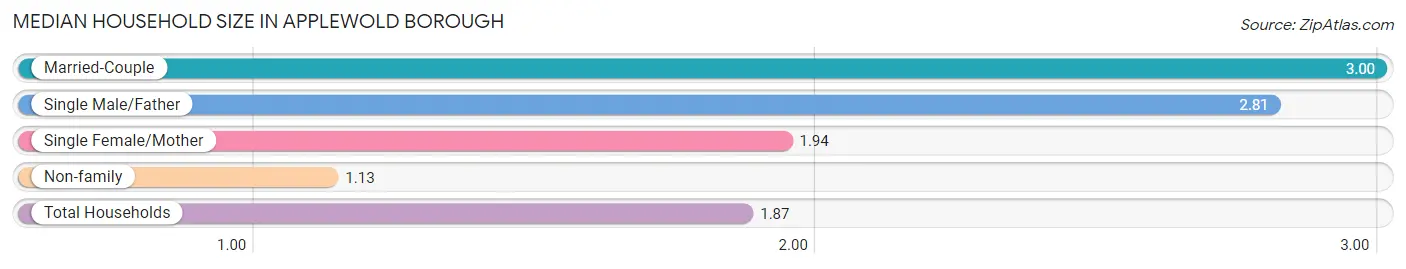
| Household Type | # Households | Household Size |
| Married-Couple | 37 (21.6%) | 3.00 |
| Single Male/Father | 26 (15.2%) | 2.81 |
| Single Female/Mother | 17 (9.9%) | 1.94 |
| Non-family | 91 (53.2%) | 1.13 |
| Total Households | 171 (100.0%) | 1.87 |
Household Size by Marriage Status in Applewold borough
Out of a total of 171 households in Applewold borough, 80 (46.8%) are family households, while 91 (53.2%) are nonfamily households. The most numerous type of family households are 3-person households, comprising 36, and the most common type of nonfamily households are 1-person households, comprising 80.
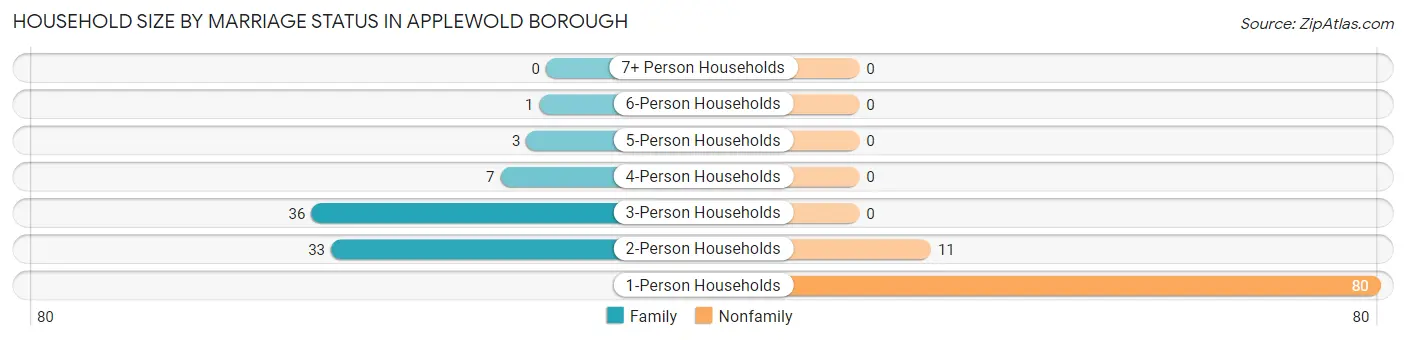
| Household Size | Family Households | Nonfamily Households |
| 1-Person Households | - | 80 (46.8%) |
| 2-Person Households | 33 (19.3%) | 11 (6.4%) |
| 3-Person Households | 36 (21.0%) | 0 (0.0%) |
| 4-Person Households | 7 (4.1%) | 0 (0.0%) |
| 5-Person Households | 3 (1.8%) | 0 (0.0%) |
| 6-Person Households | 1 (0.6%) | 0 (0.0%) |
| 7+ Person Households | 0 (0.0%) | 0 (0.0%) |
| Total | 80 (46.8%) | 91 (53.2%) |
Female Fertility in Applewold borough
Fertility by Age in Applewold borough
Average fertility rate in Applewold borough is 13.0 births per 1,000 women. Women in the age bracket of 20 to 34 years have the highest fertility rate with 36.0 births per 1,000 women. Women in the age bracket of 20 to 34 years acount for 100.0% of all women with births.
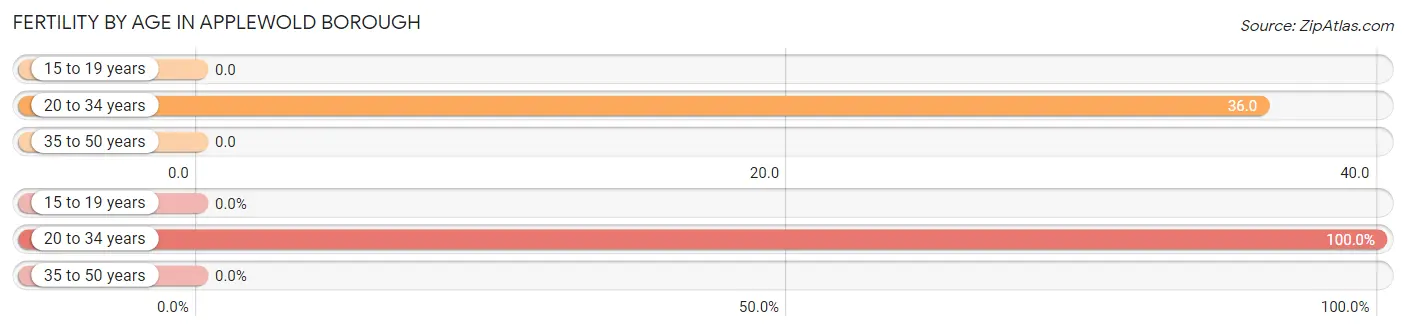
| Age Bracket | Women with Births | Births / 1,000 Women |
| 15 to 19 years | 0 (0.0%) | 0.0 |
| 20 to 34 years | 1 (100.0%) | 36.0 |
| 35 to 50 years | 0 (0.0%) | 0.0 |
| Total | 1 (100.0%) | 13.0 |
Fertility by Age by Marriage Status in Applewold borough
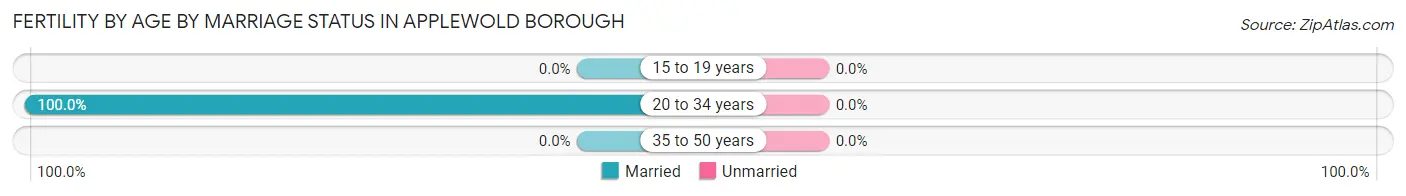
| Age Bracket | Married | Unmarried |
| 15 to 19 years | 0 (0.0%) | 0 (0.0%) |
| 20 to 34 years | 1 (100.0%) | 0 (0.0%) |
| 35 to 50 years | 0 (0.0%) | 0 (0.0%) |
| Total | 1 (100.0%) | 0 (0.0%) |
Fertility by Education in Applewold borough
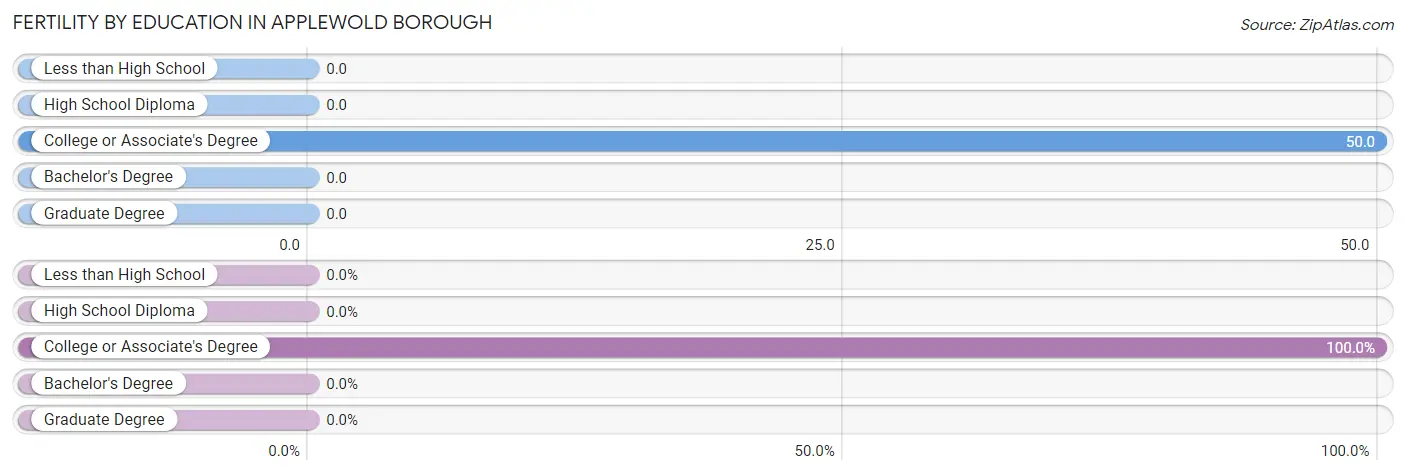
| Educational Attainment | Women with Births | Births / 1,000 Women |
| Less than High School | 0 (0.0%) | 0.0 |
| High School Diploma | 0 (0.0%) | 0.0 |
| College or Associate's Degree | 1 (100.0%) | 50.0 |
| Bachelor's Degree | 0 (0.0%) | 0.0 |
| Graduate Degree | 0 (0.0%) | 0.0 |
| Total | 1 (100.0%) | 13.0 |
Fertility by Education by Marriage Status in Applewold borough
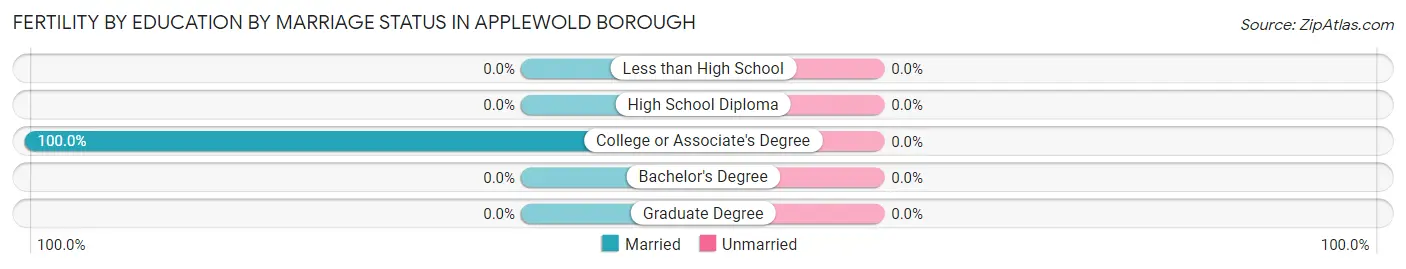
| Educational Attainment | Married | Unmarried |
| Less than High School | 0 (0.0%) | 0 (0.0%) |
| High School Diploma | 0 (0.0%) | 0 (0.0%) |
| College or Associate's Degree | 1 (100.0%) | 0 (0.0%) |
| Bachelor's Degree | 0 (0.0%) | 0 (0.0%) |
| Graduate Degree | 0 (0.0%) | 0 (0.0%) |
| Total | 1 (100.0%) | 0 (0.0%) |
Employment Characteristics in Applewold borough
Employment by Class of Employer in Applewold borough
Among the 152 employed individuals in Applewold borough, private company employees (101 | 66.4%), local government employees (29 | 19.1%), and not-for-profit organizations (19 | 12.5%) make up the most common classes of employment.
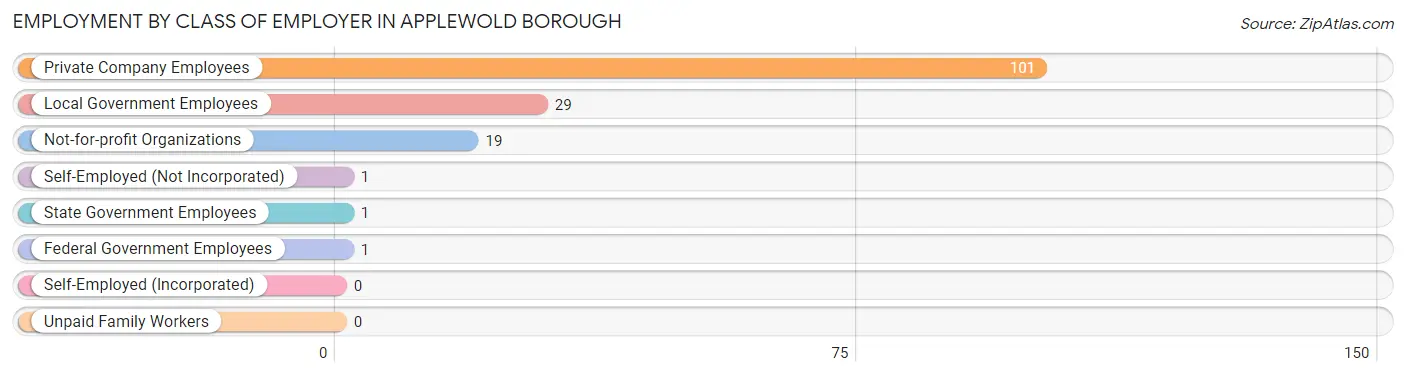
| Employer Class | # Employees | % Employees |
| Private Company Employees | 101 | 66.4% |
| Self-Employed (Incorporated) | 0 | 0.0% |
| Self-Employed (Not Incorporated) | 1 | 0.7% |
| Not-for-profit Organizations | 19 | 12.5% |
| Local Government Employees | 29 | 19.1% |
| State Government Employees | 1 | 0.7% |
| Federal Government Employees | 1 | 0.7% |
| Unpaid Family Workers | 0 | 0.0% |
| Total | 152 | 100.0% |
Employment Status by Age in Applewold borough
According to the labor force statistics for Applewold borough, out of the total population over 16 years of age (259), 60.6% or 157 individuals are in the labor force, with 3.2% or 5 of them unemployed. The age group with the highest labor force participation rate is 25 to 29 years, with 100.0% or 17 individuals in the labor force. Within the labor force, the 45 to 54 years age range has the highest percentage of unemployed individuals, with 18.8% or 3 of them being unemployed.
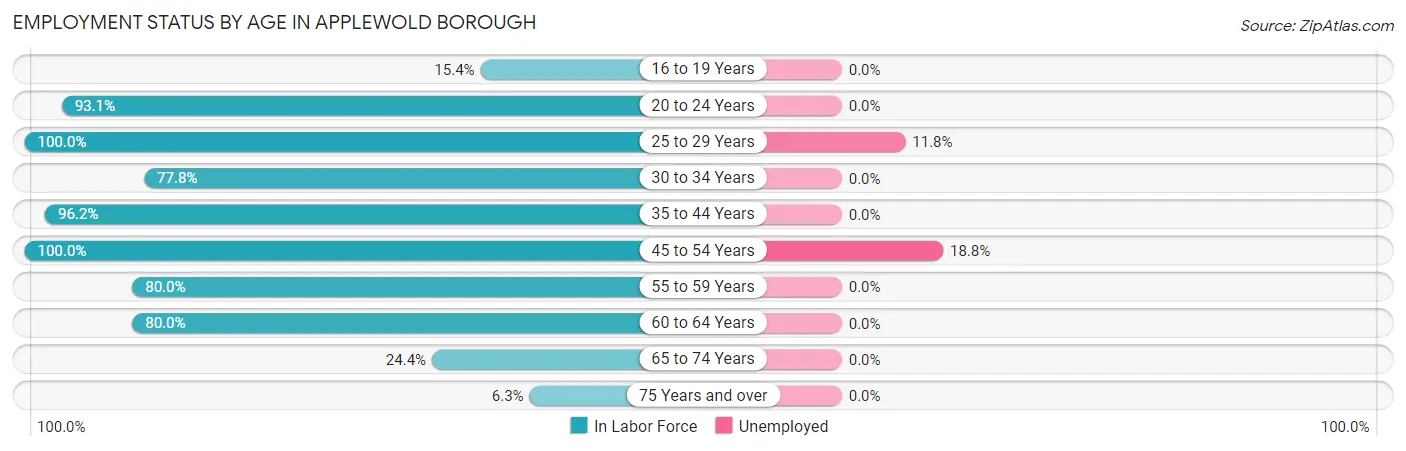
| Age Bracket | In Labor Force | Unemployed |
| 16 to 19 Years | 2 (15.4%) | 0 (0.0%) |
| 20 to 24 Years | 27 (93.1%) | 0 (0.0%) |
| 25 to 29 Years | 17 (100.0%) | 2 (11.8%) |
| 30 to 34 Years | 7 (77.8%) | 0 (0.0%) |
| 35 to 44 Years | 50 (96.2%) | 0 (0.0%) |
| 45 to 54 Years | 16 (100.0%) | 3 (18.8%) |
| 55 to 59 Years | 12 (80.0%) | 0 (0.0%) |
| 60 to 64 Years | 12 (80.0%) | 0 (0.0%) |
| 65 to 74 Years | 11 (24.4%) | 0 (0.0%) |
| 75 Years and over | 3 (6.3%) | 0 (0.0%) |
| Total | 157 (60.6%) | 5 (3.2%) |
Employment Status by Educational Attainment in Applewold borough
According to labor force statistics for Applewold borough, 91.9% of individuals (114) out of the total population between 25 and 64 years of age (124) are in the labor force, with 4.4% or 5 of them being unemployed. The group with the highest labor force participation rate are those with the educational attainment of less than high school, with 100.0% or 3 individuals in the labor force. Within the labor force, individuals with high school diploma education have the highest percentage of unemployment, with 13.0% or 3 of them being unemployed.
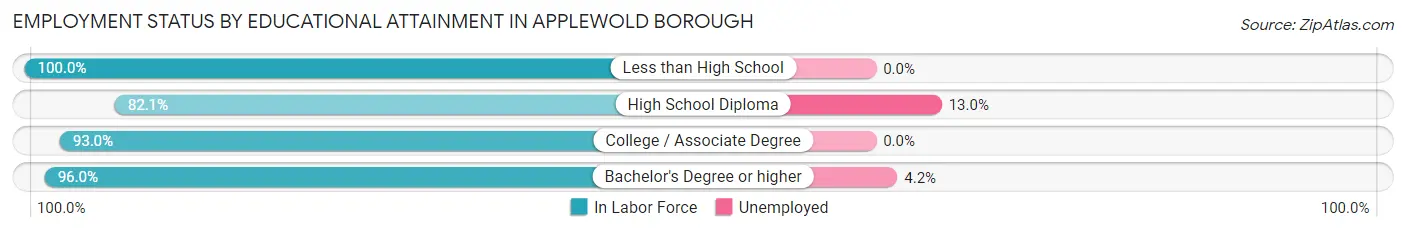
| Educational Attainment | In Labor Force | Unemployed |
| Less than High School | 3 (100.0%) | 0 (0.0%) |
| High School Diploma | 23 (82.1%) | 4 (13.0%) |
| College / Associate Degree | 40 (93.0%) | 0 (0.0%) |
| Bachelor's Degree or higher | 48 (96.0%) | 2 (4.2%) |
| Total | 114 (91.9%) | 5 (4.4%) |
Employment Occupations by Sex in Applewold borough
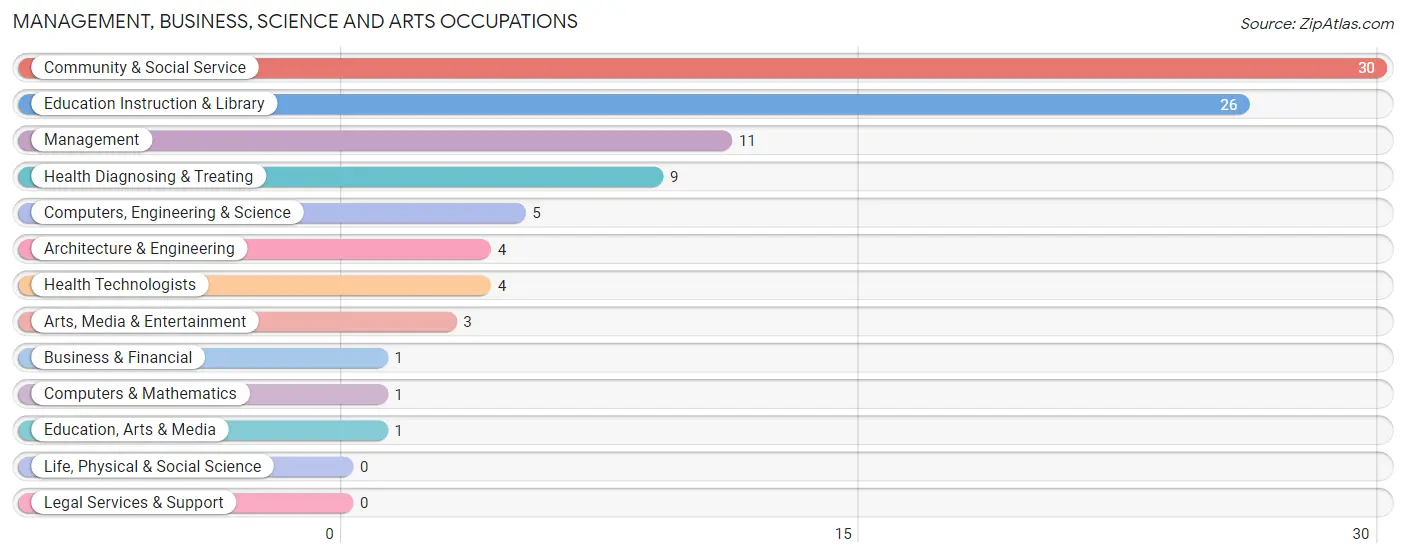
Management, Business, Science and Arts Occupations
The most common Management, Business, Science and Arts occupations in Applewold borough are Community & Social Service (30 | 19.7%), Education Instruction & Library (26 | 17.1%), Management (11 | 7.2%), Health Diagnosing & Treating (9 | 5.9%), and Computers, Engineering & Science (5 | 3.3%).
Management, Business, Science and Arts Occupations by Sex
Within the Management, Business, Science and Arts occupations in Applewold borough, the most male-oriented occupations are Computers, Engineering & Science (100.0%), Computers & Mathematics (100.0%), and Architecture & Engineering (100.0%), while the most female-oriented occupations are Business & Financial (100.0%), Education, Arts & Media (100.0%), and Arts, Media & Entertainment (66.7%).
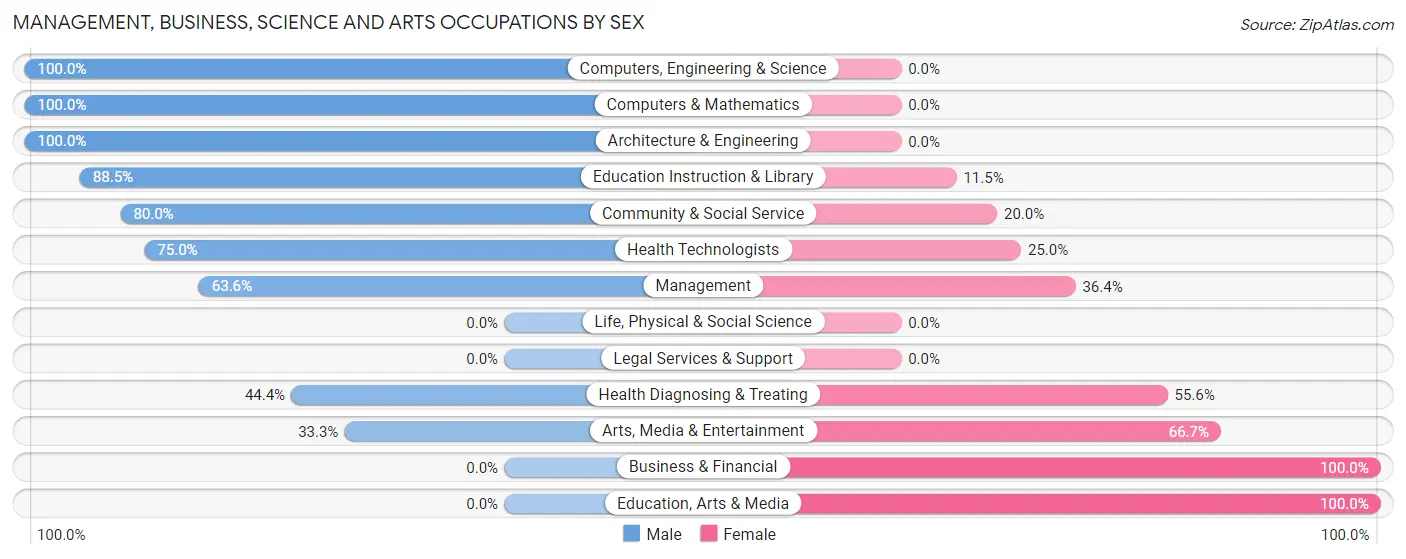
| Occupation | Male | Female |
| Management | 7 (63.6%) | 4 (36.4%) |
| Business & Financial | 0 (0.0%) | 1 (100.0%) |
| Computers, Engineering & Science | 5 (100.0%) | 0 (0.0%) |
| Computers & Mathematics | 1 (100.0%) | 0 (0.0%) |
| Architecture & Engineering | 4 (100.0%) | 0 (0.0%) |
| Life, Physical & Social Science | 0 (0.0%) | 0 (0.0%) |
| Community & Social Service | 24 (80.0%) | 6 (20.0%) |
| Education, Arts & Media | 0 (0.0%) | 1 (100.0%) |
| Legal Services & Support | 0 (0.0%) | 0 (0.0%) |
| Education Instruction & Library | 23 (88.5%) | 3 (11.5%) |
| Arts, Media & Entertainment | 1 (33.3%) | 2 (66.7%) |
| Health Diagnosing & Treating | 4 (44.4%) | 5 (55.6%) |
| Health Technologists | 3 (75.0%) | 1 (25.0%) |
| Total (Category) | 40 (71.4%) | 16 (28.6%) |
| Total (Overall) | 84 (55.3%) | 68 (44.7%) |
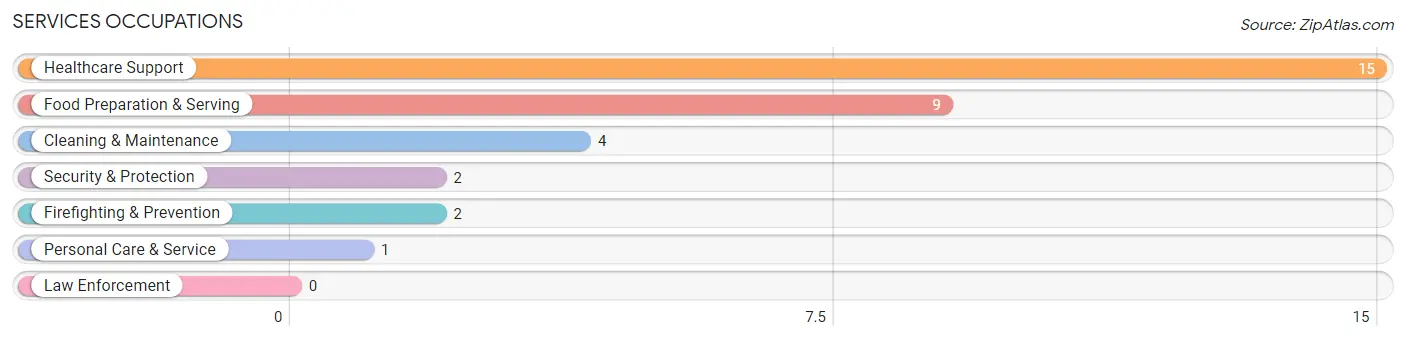
Services Occupations
The most common Services occupations in Applewold borough are Healthcare Support (15 | 9.9%), Food Preparation & Serving (9 | 5.9%), Cleaning & Maintenance (4 | 2.6%), Security & Protection (2 | 1.3%), and Firefighting & Prevention (2 | 1.3%).
Services Occupations by Sex
Within the Services occupations in Applewold borough, the most male-oriented occupations are Security & Protection (100.0%), Firefighting & Prevention (100.0%), and Healthcare Support (33.3%), while the most female-oriented occupations are Personal Care & Service (100.0%), Cleaning & Maintenance (75.0%), and Healthcare Support (66.7%).
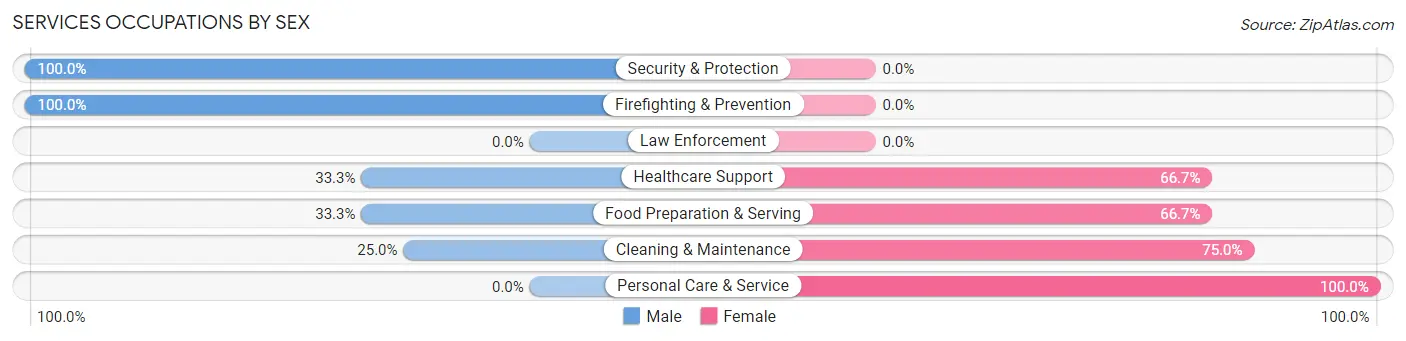
| Occupation | Male | Female |
| Healthcare Support | 5 (33.3%) | 10 (66.7%) |
| Security & Protection | 2 (100.0%) | 0 (0.0%) |
| Firefighting & Prevention | 2 (100.0%) | 0 (0.0%) |
| Law Enforcement | 0 (0.0%) | 0 (0.0%) |
| Food Preparation & Serving | 3 (33.3%) | 6 (66.7%) |
| Cleaning & Maintenance | 1 (25.0%) | 3 (75.0%) |
| Personal Care & Service | 0 (0.0%) | 1 (100.0%) |
| Total (Category) | 11 (35.5%) | 20 (64.5%) |
| Total (Overall) | 84 (55.3%) | 68 (44.7%) |
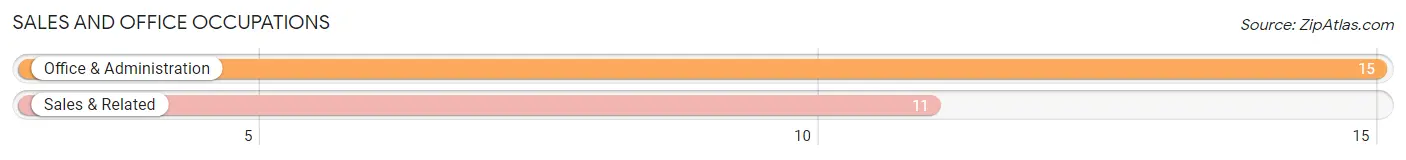
Sales and Office Occupations
The most common Sales and Office occupations in Applewold borough are Office & Administration (15 | 9.9%), and Sales & Related (11 | 7.2%).
Sales and Office Occupations by Sex
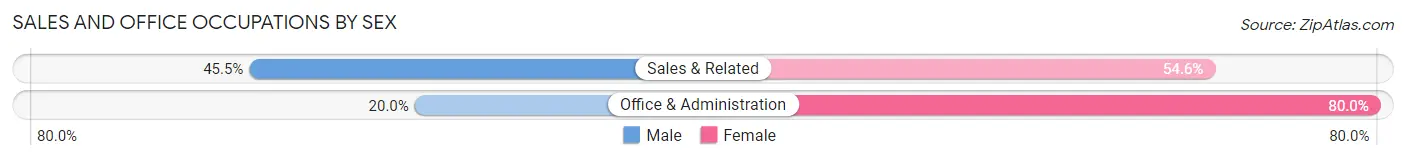
| Occupation | Male | Female |
| Sales & Related | 5 (45.5%) | 6 (54.5%) |
| Office & Administration | 3 (20.0%) | 12 (80.0%) |
| Total (Category) | 8 (30.8%) | 18 (69.2%) |
| Total (Overall) | 84 (55.3%) | 68 (44.7%) |
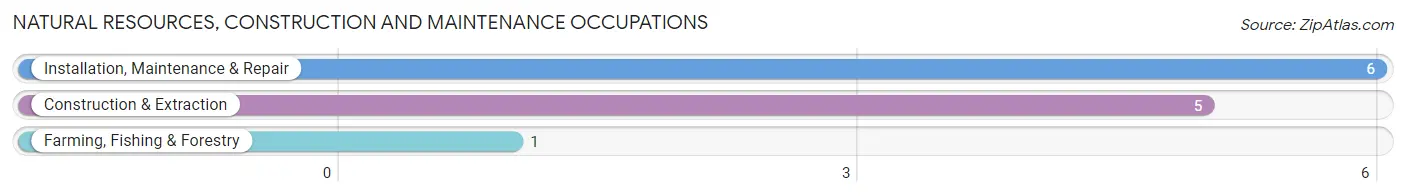
Natural Resources, Construction and Maintenance Occupations
The most common Natural Resources, Construction and Maintenance occupations in Applewold borough are Installation, Maintenance & Repair (6 | 4.0%), Construction & Extraction (5 | 3.3%), and Farming, Fishing & Forestry (1 | 0.7%).
Natural Resources, Construction and Maintenance Occupations by Sex
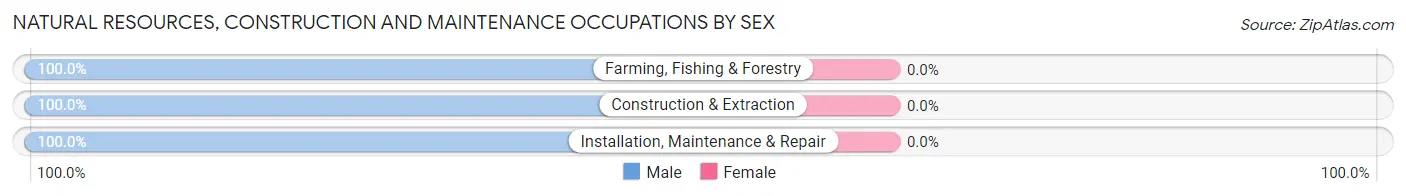
| Occupation | Male | Female |
| Farming, Fishing & Forestry | 1 (100.0%) | 0 (0.0%) |
| Construction & Extraction | 5 (100.0%) | 0 (0.0%) |
| Installation, Maintenance & Repair | 6 (100.0%) | 0 (0.0%) |
| Total (Category) | 12 (100.0%) | 0 (0.0%) |
| Total (Overall) | 84 (55.3%) | 68 (44.7%) |
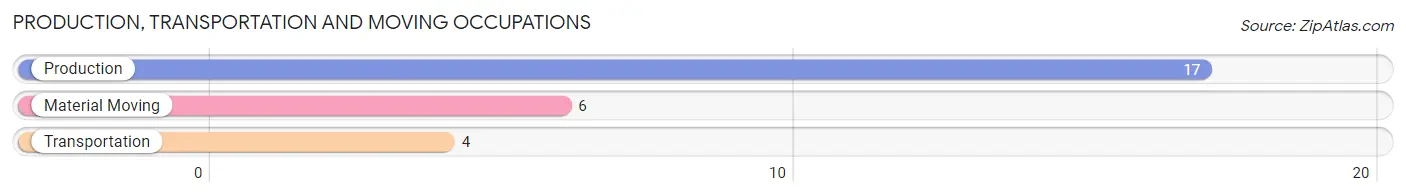
Production, Transportation and Moving Occupations
The most common Production, Transportation and Moving occupations in Applewold borough are Production (17 | 11.2%), Material Moving (6 | 4.0%), and Transportation (4 | 2.6%).
Production, Transportation and Moving Occupations by Sex
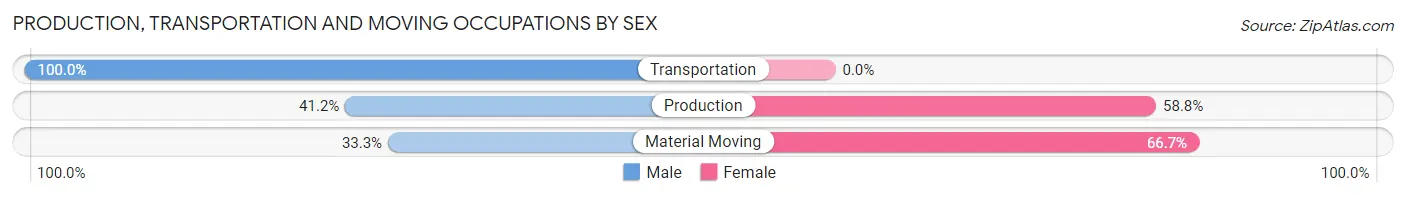
| Occupation | Male | Female |
| Production | 7 (41.2%) | 10 (58.8%) |
| Transportation | 4 (100.0%) | 0 (0.0%) |
| Material Moving | 2 (33.3%) | 4 (66.7%) |
| Total (Category) | 13 (48.1%) | 14 (51.8%) |
| Total (Overall) | 84 (55.3%) | 68 (44.7%) |
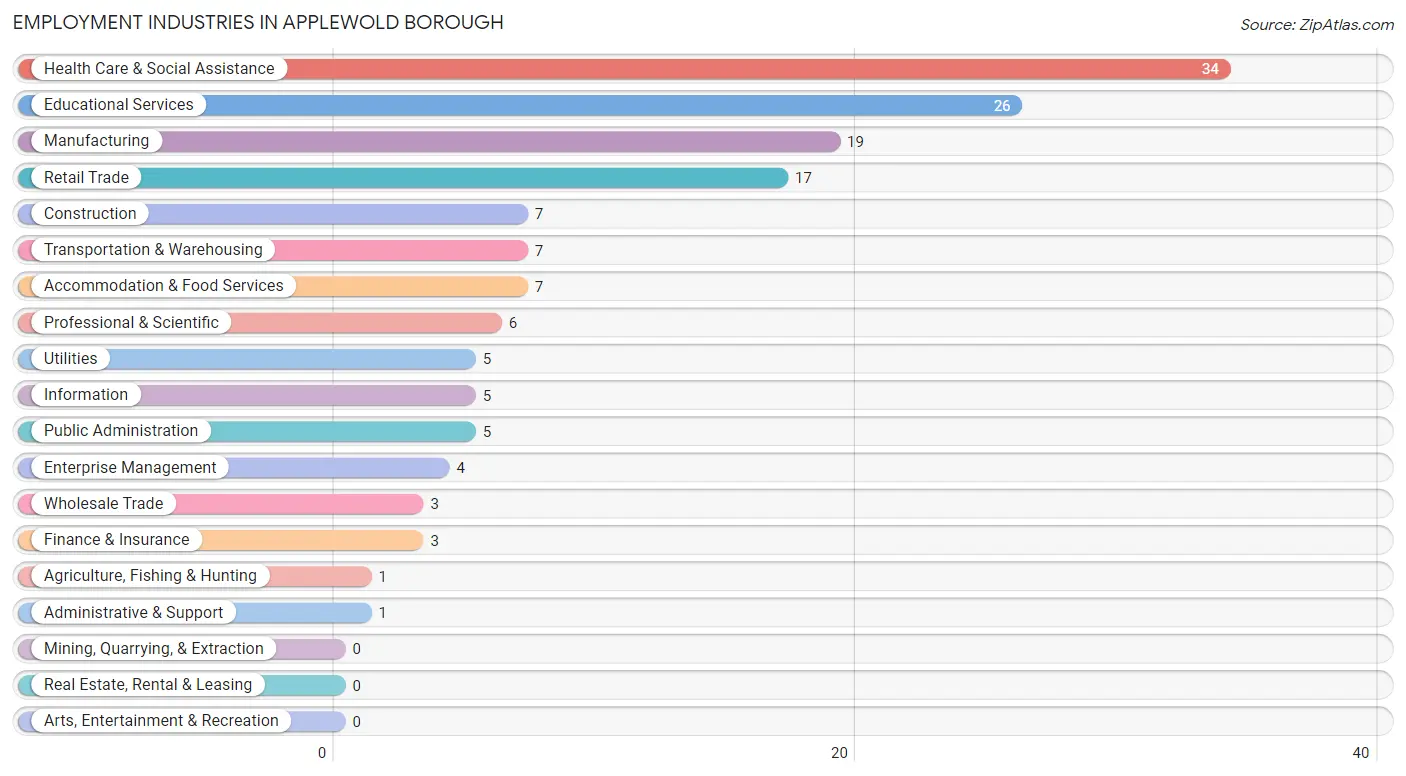
Employment Industries by Sex in Applewold borough
Employment Industries in Applewold borough
The major employment industries in Applewold borough include Health Care & Social Assistance (34 | 22.4%), Educational Services (26 | 17.1%), Manufacturing (19 | 12.5%), Retail Trade (17 | 11.2%), and Construction (7 | 4.6%).
Employment Industries by Sex in Applewold borough
The Applewold borough industries that see more men than women are Agriculture, Fishing & Hunting (100.0%), Construction (100.0%), and Utilities (100.0%), whereas the industries that tend to have a higher number of women are Enterprise Management (100.0%), Accommodation & Food Services (71.4%), and Retail Trade (70.6%).
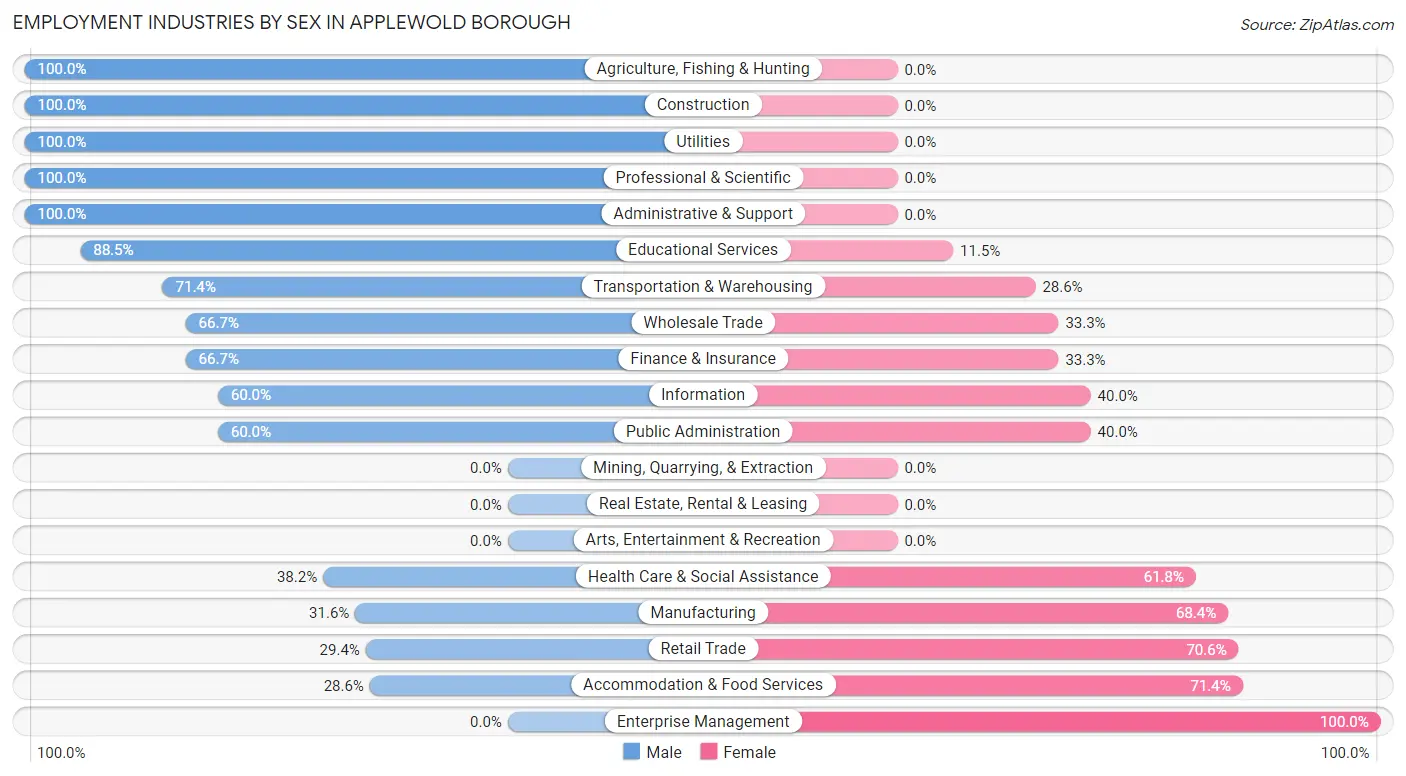
| Industry | Male | Female |
| Agriculture, Fishing & Hunting | 1 (100.0%) | 0 (0.0%) |
| Mining, Quarrying, & Extraction | 0 (0.0%) | 0 (0.0%) |
| Construction | 7 (100.0%) | 0 (0.0%) |
| Manufacturing | 6 (31.6%) | 13 (68.4%) |
| Wholesale Trade | 2 (66.7%) | 1 (33.3%) |
| Retail Trade | 5 (29.4%) | 12 (70.6%) |
| Transportation & Warehousing | 5 (71.4%) | 2 (28.6%) |
| Utilities | 5 (100.0%) | 0 (0.0%) |
| Information | 3 (60.0%) | 2 (40.0%) |
| Finance & Insurance | 2 (66.7%) | 1 (33.3%) |
| Real Estate, Rental & Leasing | 0 (0.0%) | 0 (0.0%) |
| Professional & Scientific | 6 (100.0%) | 0 (0.0%) |
| Enterprise Management | 0 (0.0%) | 4 (100.0%) |
| Administrative & Support | 1 (100.0%) | 0 (0.0%) |
| Educational Services | 23 (88.5%) | 3 (11.5%) |
| Health Care & Social Assistance | 13 (38.2%) | 21 (61.8%) |
| Arts, Entertainment & Recreation | 0 (0.0%) | 0 (0.0%) |
| Accommodation & Food Services | 2 (28.6%) | 5 (71.4%) |
| Public Administration | 3 (60.0%) | 2 (40.0%) |
| Total | 84 (55.3%) | 68 (44.7%) |
Education in Applewold borough
School Enrollment in Applewold borough
The most common levels of schooling among the 68 students in Applewold borough are high school (28 | 41.2%), middle school (22 | 32.4%), and college / undergraduate (9 | 13.2%).

| School Level | # Students | % Students |
| Nursery / Preschool | 3 | 4.4% |
| Kindergarten | 0 | 0.0% |
| Elementary School | 6 | 8.8% |
| Middle School | 22 | 32.4% |
| High School | 28 | 41.2% |
| College / Undergraduate | 9 | 13.2% |
| Graduate / Professional | 0 | 0.0% |
| Total | 68 | 100.0% |
School Enrollment by Age by Funding Source in Applewold borough
Out of a total of 68 students who are enrolled in schools in Applewold borough, 3 (4.4%) attend a private institution, while the remaining 65 (95.6%) are enrolled in public schools. The age group of 3 to 4 year olds has the highest likelihood of being enrolled in private schools, with 1 (100.0% in the age bracket) enrolled. Conversely, the age group of 10 to 14 year olds has the lowest likelihood of being enrolled in a private school, with 22 (100.0% in the age bracket) attending a public institution.
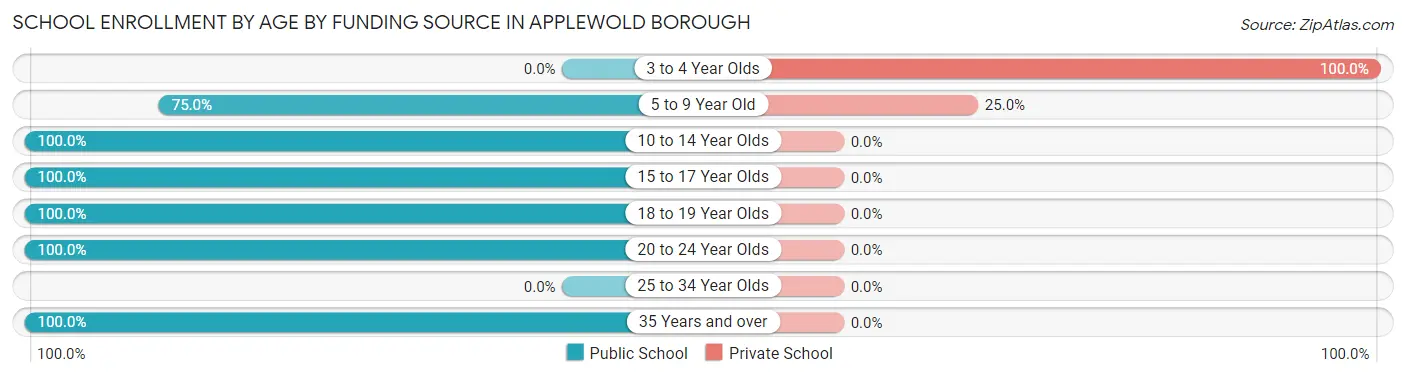
| Age Bracket | Public School | Private School |
| 3 to 4 Year Olds | 0 (0.0%) | 1 (100.0%) |
| 5 to 9 Year Old | 6 (75.0%) | 2 (25.0%) |
| 10 to 14 Year Olds | 22 (100.0%) | 0 (0.0%) |
| 15 to 17 Year Olds | 27 (100.0%) | 0 (0.0%) |
| 18 to 19 Year Olds | 1 (100.0%) | 0 (0.0%) |
| 20 to 24 Year Olds | 4 (100.0%) | 0 (0.0%) |
| 25 to 34 Year Olds | 0 (0.0%) | 0 (0.0%) |
| 35 Years and over | 5 (100.0%) | 0 (0.0%) |
| Total | 65 (95.6%) | 3 (4.4%) |
Educational Attainment by Field of Study in Applewold borough
Social sciences (22 | 28.9%), education (18 | 23.7%), science & technology (8 | 10.5%), engineering (7 | 9.2%), and computers & mathematics (4 | 5.3%) are the most common fields of study among 76 individuals in Applewold borough who have obtained a bachelor's degree or higher.
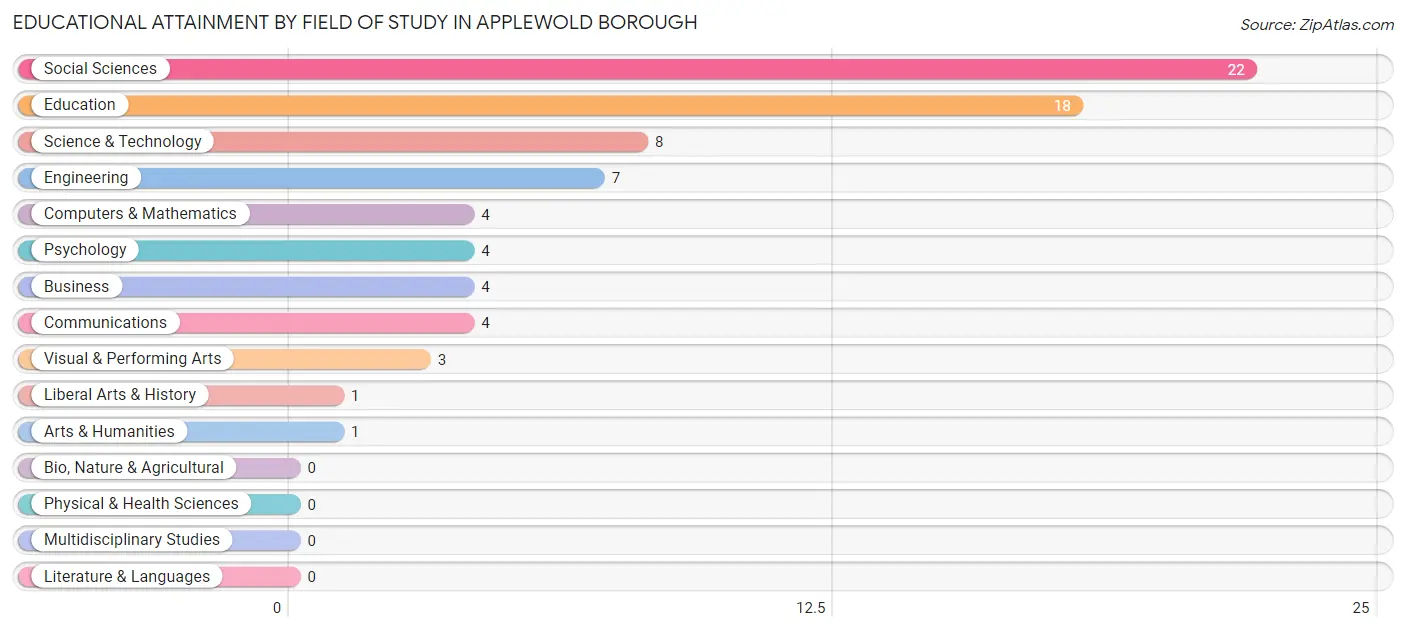
| Field of Study | # Graduates | % Graduates |
| Computers & Mathematics | 4 | 5.3% |
| Bio, Nature & Agricultural | 0 | 0.0% |
| Physical & Health Sciences | 0 | 0.0% |
| Psychology | 4 | 5.3% |
| Social Sciences | 22 | 28.9% |
| Engineering | 7 | 9.2% |
| Multidisciplinary Studies | 0 | 0.0% |
| Science & Technology | 8 | 10.5% |
| Business | 4 | 5.3% |
| Education | 18 | 23.7% |
| Literature & Languages | 0 | 0.0% |
| Liberal Arts & History | 1 | 1.3% |
| Visual & Performing Arts | 3 | 4.0% |
| Communications | 4 | 5.3% |
| Arts & Humanities | 1 | 1.3% |
| Total | 76 | 100.0% |
Transportation & Commute in Applewold borough
Vehicle Availability by Sex in Applewold borough
The most prevalent vehicle ownership categories in Applewold borough are males with 2 vehicles (56, accounting for 66.7%) and females with 2 vehicles (27, making up 82.4%).
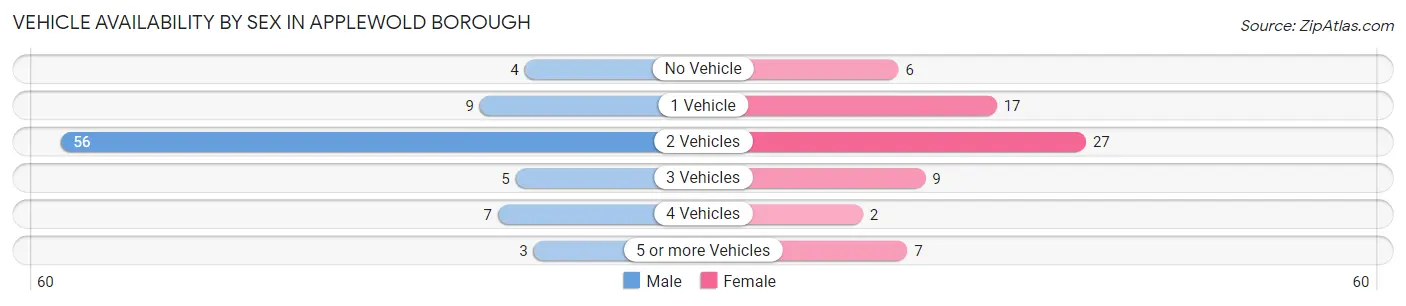
| Vehicles Available | Male | Female |
| No Vehicle | 4 (4.8%) | 6 (8.8%) |
| 1 Vehicle | 9 (10.7%) | 17 (25.0%) |
| 2 Vehicles | 56 (66.7%) | 27 (39.7%) |
| 3 Vehicles | 5 (5.9%) | 9 (13.2%) |
| 4 Vehicles | 7 (8.3%) | 2 (2.9%) |
| 5 or more Vehicles | 3 (3.6%) | 7 (10.3%) |
| Total | 84 (100.0%) | 68 (100.0%) |
Commute Time in Applewold borough
The most frequently occuring commute durations in Applewold borough are 20 to 24 minutes (26 commuters, 17.3%), 5 to 9 minutes (22 commuters, 14.7%), and 10 to 14 minutes (22 commuters, 14.7%).
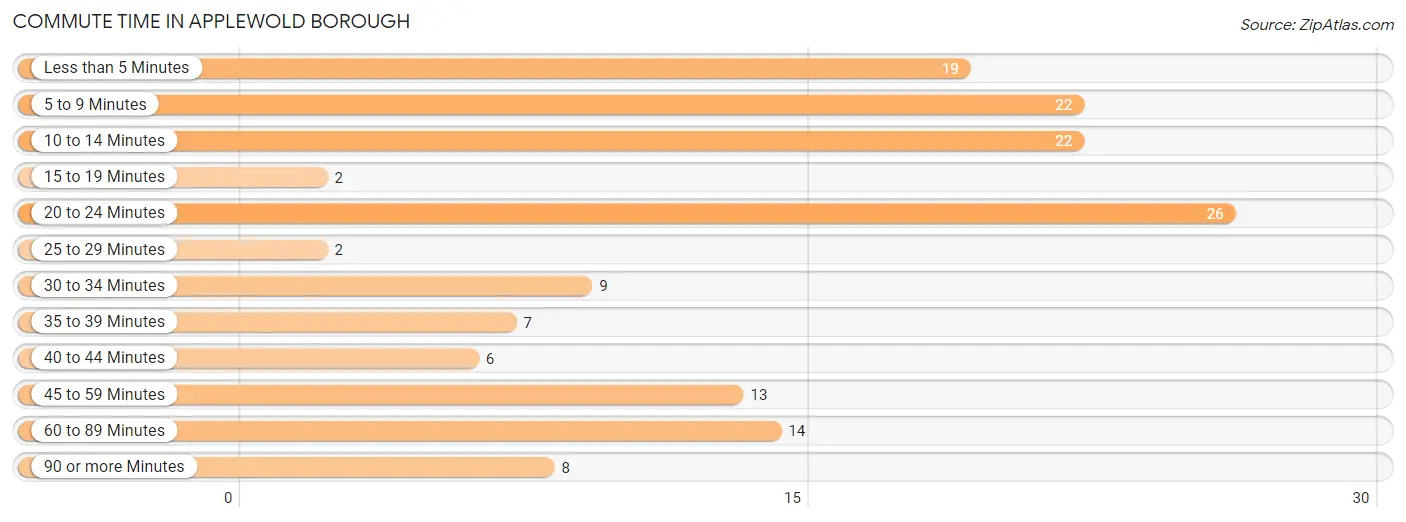
| Commute Time | # Commuters | % Commuters |
| Less than 5 Minutes | 19 | 12.7% |
| 5 to 9 Minutes | 22 | 14.7% |
| 10 to 14 Minutes | 22 | 14.7% |
| 15 to 19 Minutes | 2 | 1.3% |
| 20 to 24 Minutes | 26 | 17.3% |
| 25 to 29 Minutes | 2 | 1.3% |
| 30 to 34 Minutes | 9 | 6.0% |
| 35 to 39 Minutes | 7 | 4.7% |
| 40 to 44 Minutes | 6 | 4.0% |
| 45 to 59 Minutes | 13 | 8.7% |
| 60 to 89 Minutes | 14 | 9.3% |
| 90 or more Minutes | 8 | 5.3% |
Commute Time by Sex in Applewold borough
The most common commute times in Applewold borough are 20 to 24 minutes (23 commuters, 27.4%) for males and 5 to 9 minutes (17 commuters, 25.8%) for females.
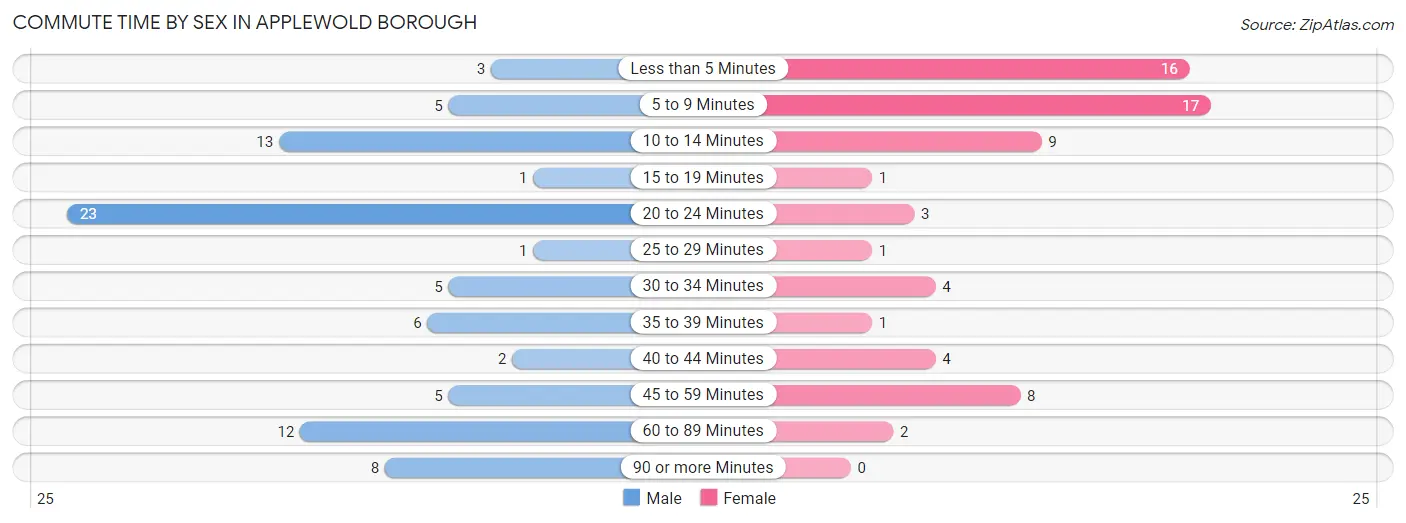
| Commute Time | Male | Female |
| Less than 5 Minutes | 3 (3.6%) | 16 (24.2%) |
| 5 to 9 Minutes | 5 (5.9%) | 17 (25.8%) |
| 10 to 14 Minutes | 13 (15.5%) | 9 (13.6%) |
| 15 to 19 Minutes | 1 (1.2%) | 1 (1.5%) |
| 20 to 24 Minutes | 23 (27.4%) | 3 (4.5%) |
| 25 to 29 Minutes | 1 (1.2%) | 1 (1.5%) |
| 30 to 34 Minutes | 5 (5.9%) | 4 (6.1%) |
| 35 to 39 Minutes | 6 (7.1%) | 1 (1.5%) |
| 40 to 44 Minutes | 2 (2.4%) | 4 (6.1%) |
| 45 to 59 Minutes | 5 (5.9%) | 8 (12.1%) |
| 60 to 89 Minutes | 12 (14.3%) | 2 (3.0%) |
| 90 or more Minutes | 8 (9.5%) | 0 (0.0%) |
Time of Departure to Work by Sex in Applewold borough
The most frequent times of departure to work in Applewold borough are 6:30 AM to 6:59 AM (21, 25.0%) for males and 6:30 AM to 6:59 AM (10, 15.1%) for females.
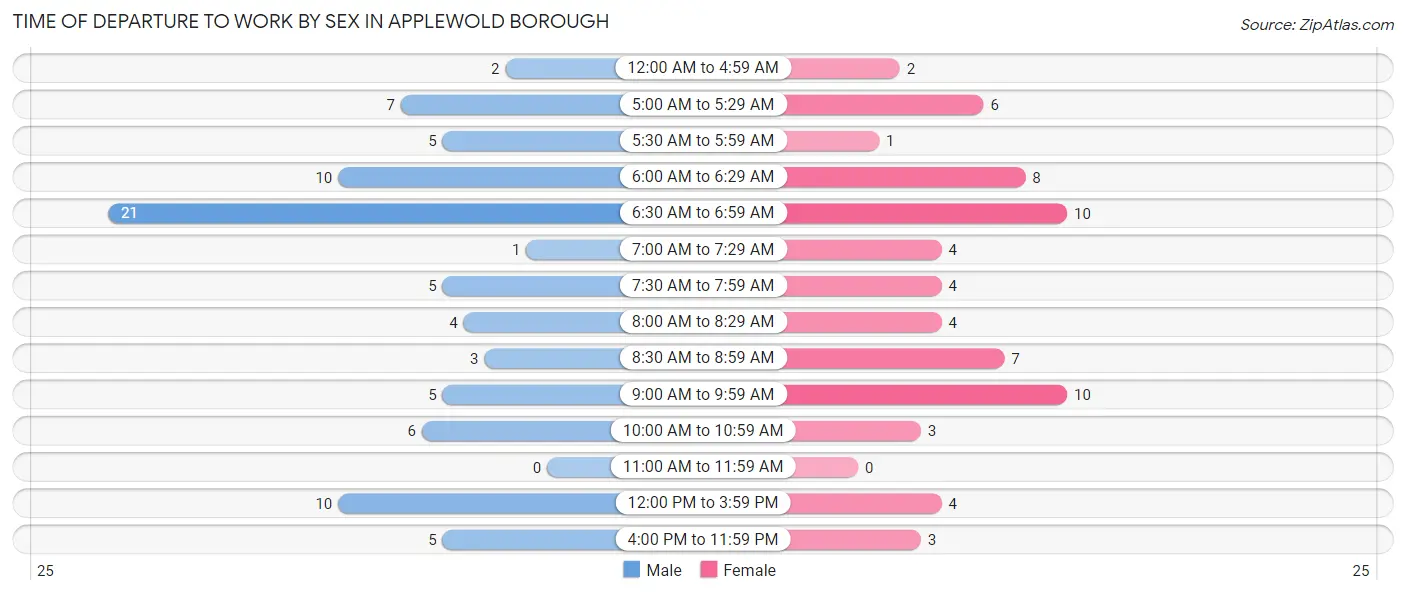
| Time of Departure | Male | Female |
| 12:00 AM to 4:59 AM | 2 (2.4%) | 2 (3.0%) |
| 5:00 AM to 5:29 AM | 7 (8.3%) | 6 (9.1%) |
| 5:30 AM to 5:59 AM | 5 (5.9%) | 1 (1.5%) |
| 6:00 AM to 6:29 AM | 10 (11.9%) | 8 (12.1%) |
| 6:30 AM to 6:59 AM | 21 (25.0%) | 10 (15.1%) |
| 7:00 AM to 7:29 AM | 1 (1.2%) | 4 (6.1%) |
| 7:30 AM to 7:59 AM | 5 (5.9%) | 4 (6.1%) |
| 8:00 AM to 8:29 AM | 4 (4.8%) | 4 (6.1%) |
| 8:30 AM to 8:59 AM | 3 (3.6%) | 7 (10.6%) |
| 9:00 AM to 9:59 AM | 5 (5.9%) | 10 (15.1%) |
| 10:00 AM to 10:59 AM | 6 (7.1%) | 3 (4.5%) |
| 11:00 AM to 11:59 AM | 0 (0.0%) | 0 (0.0%) |
| 12:00 PM to 3:59 PM | 10 (11.9%) | 4 (6.1%) |
| 4:00 PM to 11:59 PM | 5 (5.9%) | 3 (4.5%) |
| Total | 84 (100.0%) | 66 (100.0%) |
Housing Occupancy in Applewold borough
Occupancy by Ownership in Applewold borough
Of the total 171 dwellings in Applewold borough, owner-occupied units account for 88 (51.5%), while renter-occupied units make up 83 (48.5%).
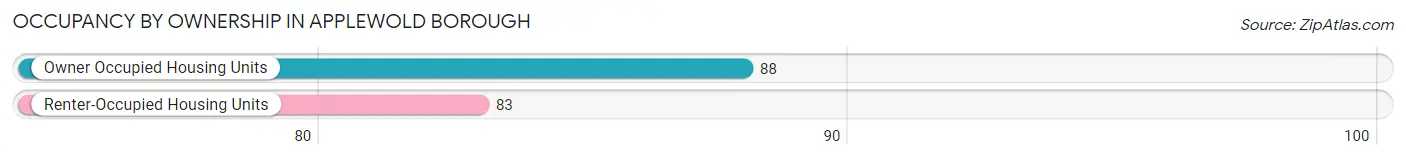
| Occupancy | # Housing Units | % Housing Units |
| Owner Occupied Housing Units | 88 | 51.5% |
| Renter-Occupied Housing Units | 83 | 48.5% |
| Total Occupied Housing Units | 171 | 100.0% |
Occupancy by Household Size in Applewold borough
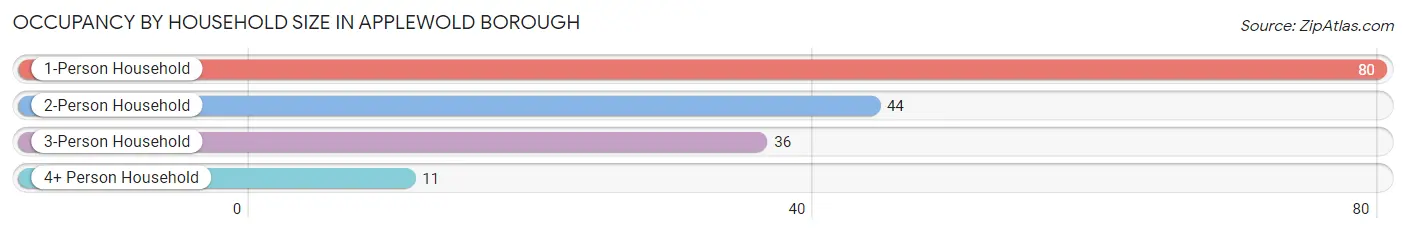
| Household Size | # Housing Units | % Housing Units |
| 1-Person Household | 80 | 46.8% |
| 2-Person Household | 44 | 25.7% |
| 3-Person Household | 36 | 21.0% |
| 4+ Person Household | 11 | 6.4% |
| Total Housing Units | 171 | 100.0% |
Occupancy by Ownership by Household Size in Applewold borough
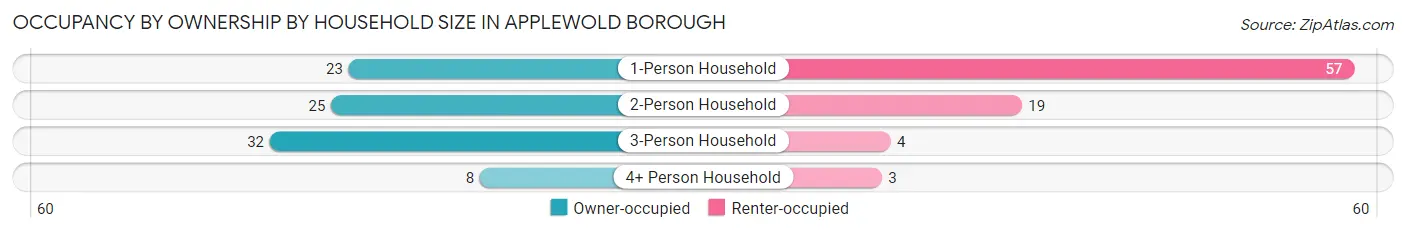
| Household Size | Owner-occupied | Renter-occupied |
| 1-Person Household | 23 (28.7%) | 57 (71.3%) |
| 2-Person Household | 25 (56.8%) | 19 (43.2%) |
| 3-Person Household | 32 (88.9%) | 4 (11.1%) |
| 4+ Person Household | 8 (72.7%) | 3 (27.3%) |
| Total Housing Units | 88 (51.5%) | 83 (48.5%) |
Occupancy by Educational Attainment in Applewold borough
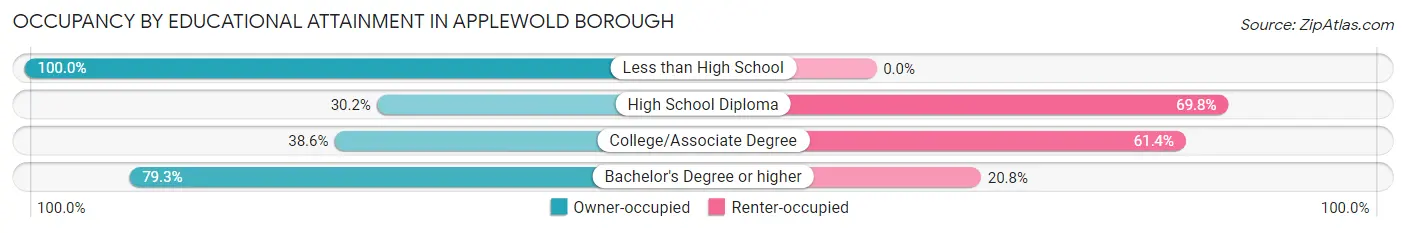
| Household Size | Owner-occupied | Renter-occupied |
| Less than High School | 8 (100.0%) | 0 (0.0%) |
| High School Diploma | 16 (30.2%) | 37 (69.8%) |
| College/Associate Degree | 22 (38.6%) | 35 (61.4%) |
| Bachelor's Degree or higher | 42 (79.2%) | 11 (20.7%) |
Occupancy by Age of Householder in Applewold borough
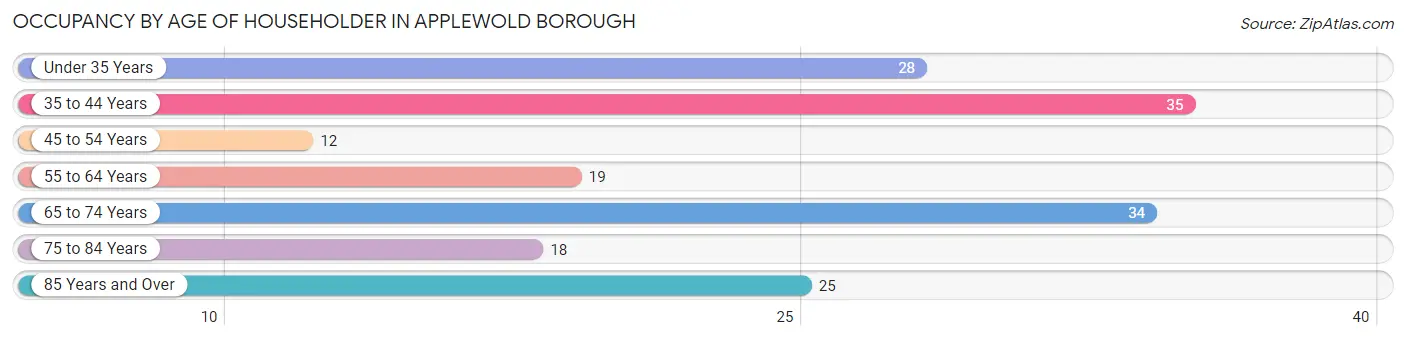
| Age Bracket | # Households | % Households |
| Under 35 Years | 28 | 16.4% |
| 35 to 44 Years | 35 | 20.5% |
| 45 to 54 Years | 12 | 7.0% |
| 55 to 64 Years | 19 | 11.1% |
| 65 to 74 Years | 34 | 19.9% |
| 75 to 84 Years | 18 | 10.5% |
| 85 Years and Over | 25 | 14.6% |
| Total | 171 | 100.0% |
Housing Finances in Applewold borough
Median Income by Occupancy in Applewold borough
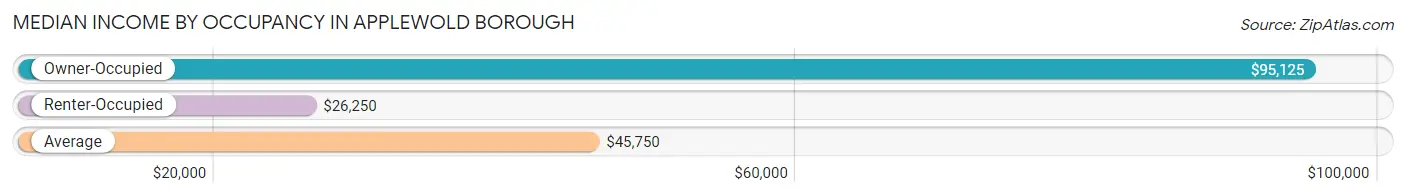
| Occupancy Type | # Households | Median Income |
| Owner-Occupied | 88 (51.5%) | $95,125 |
| Renter-Occupied | 83 (48.5%) | $26,250 |
| Average | 171 (100.0%) | $45,750 |
Occupancy by Householder Income Bracket in Applewold borough
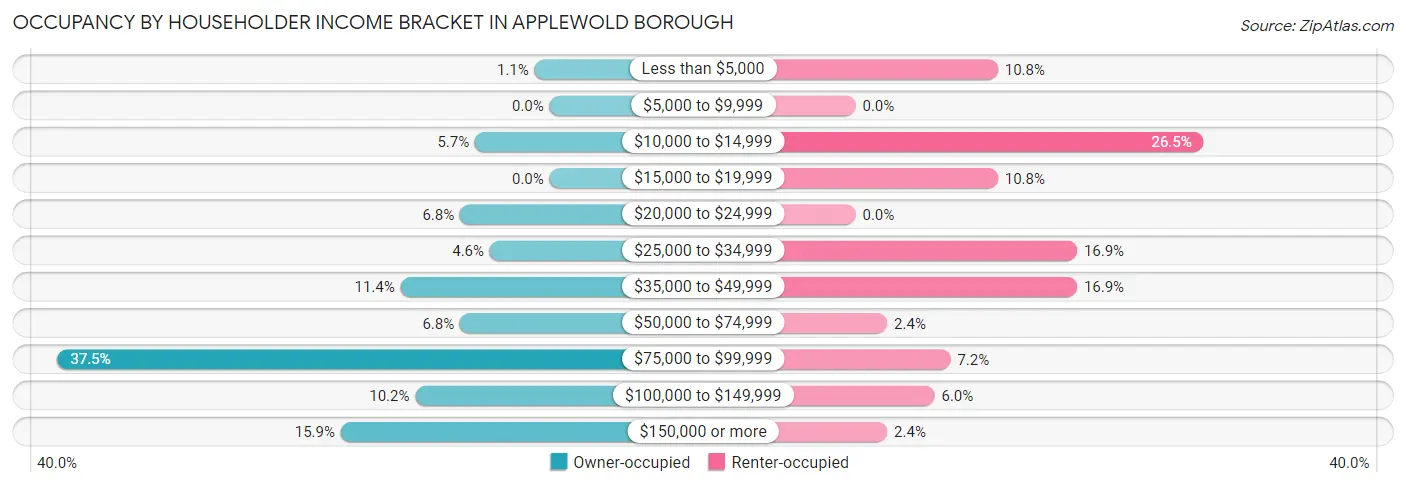
| Income Bracket | Owner-occupied | Renter-occupied |
| Less than $5,000 | 1 (1.1%) | 9 (10.8%) |
| $5,000 to $9,999 | 0 (0.0%) | 0 (0.0%) |
| $10,000 to $14,999 | 5 (5.7%) | 22 (26.5%) |
| $15,000 to $19,999 | 0 (0.0%) | 9 (10.8%) |
| $20,000 to $24,999 | 6 (6.8%) | 0 (0.0%) |
| $25,000 to $34,999 | 4 (4.5%) | 14 (16.9%) |
| $35,000 to $49,999 | 10 (11.4%) | 14 (16.9%) |
| $50,000 to $74,999 | 6 (6.8%) | 2 (2.4%) |
| $75,000 to $99,999 | 33 (37.5%) | 6 (7.2%) |
| $100,000 to $149,999 | 9 (10.2%) | 5 (6.0%) |
| $150,000 or more | 14 (15.9%) | 2 (2.4%) |
| Total | 88 (100.0%) | 83 (100.0%) |
Monthly Housing Cost Tiers in Applewold borough
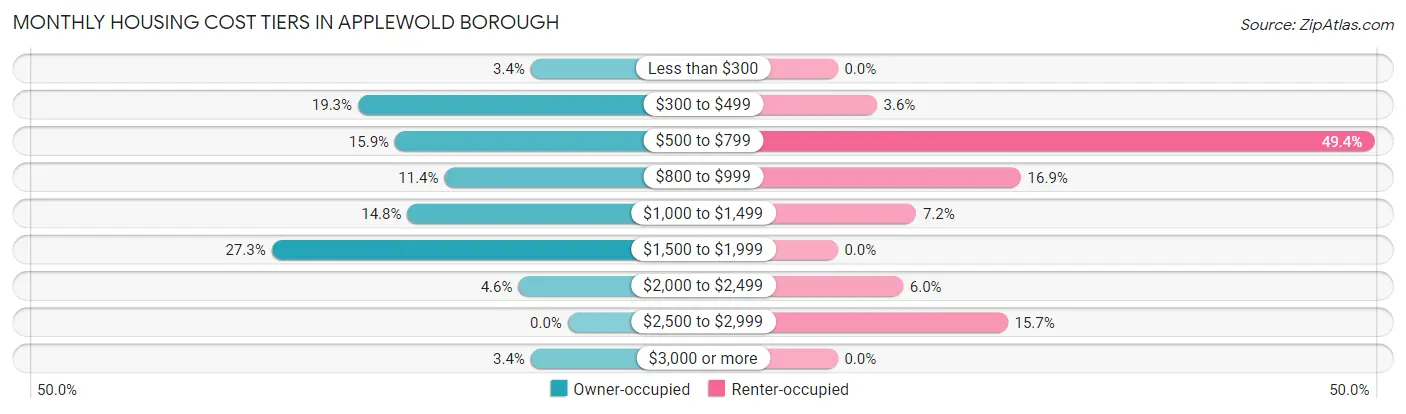
| Monthly Cost | Owner-occupied | Renter-occupied |
| Less than $300 | 3 (3.4%) | 0 (0.0%) |
| $300 to $499 | 17 (19.3%) | 3 (3.6%) |
| $500 to $799 | 14 (15.9%) | 41 (49.4%) |
| $800 to $999 | 10 (11.4%) | 14 (16.9%) |
| $1,000 to $1,499 | 13 (14.8%) | 6 (7.2%) |
| $1,500 to $1,999 | 24 (27.3%) | 0 (0.0%) |
| $2,000 to $2,499 | 4 (4.5%) | 5 (6.0%) |
| $2,500 to $2,999 | 0 (0.0%) | 13 (15.7%) |
| $3,000 or more | 3 (3.4%) | 0 (0.0%) |
| Total | 88 (100.0%) | 83 (100.0%) |
Physical Housing Characteristics in Applewold borough
Housing Structures in Applewold borough
| Structure Type | # Housing Units | % Housing Units |
| Single Unit, Detached | 108 | 63.2% |
| Single Unit, Attached | 6 | 3.5% |
| 2 Unit Apartments | 22 | 12.9% |
| 3 or 4 Unit Apartments | 6 | 3.5% |
| 5 to 9 Unit Apartments | 6 | 3.5% |
| 10 or more Apartments | 23 | 13.5% |
| Mobile Home / Other | 0 | 0.0% |
| Total | 171 | 100.0% |
Housing Structures by Occupancy in Applewold borough
| Structure Type | Owner-occupied | Renter-occupied |
| Single Unit, Detached | 83 (76.8%) | 25 (23.2%) |
| Single Unit, Attached | 2 (33.3%) | 4 (66.7%) |
| 2 Unit Apartments | 0 (0.0%) | 22 (100.0%) |
| 3 or 4 Unit Apartments | 3 (50.0%) | 3 (50.0%) |
| 5 to 9 Unit Apartments | 0 (0.0%) | 6 (100.0%) |
| 10 or more Apartments | 0 (0.0%) | 23 (100.0%) |
| Mobile Home / Other | 0 (0.0%) | 0 (0.0%) |
| Total | 88 (51.5%) | 83 (48.5%) |
Housing Structures by Number of Rooms in Applewold borough
| Number of Rooms | Owner-occupied | Renter-occupied |
| 1 Room | 1 (1.1%) | 28 (33.7%) |
| 2 or 3 Rooms | 0 (0.0%) | 2 (2.4%) |
| 4 or 5 Rooms | 10 (11.4%) | 45 (54.2%) |
| 6 or 7 Rooms | 25 (28.4%) | 8 (9.6%) |
| 8 or more Rooms | 52 (59.1%) | 0 (0.0%) |
| Total | 88 (100.0%) | 83 (100.0%) |
Housing Structure by Heating Type in Applewold borough
| Heating Type | Owner-occupied | Renter-occupied |
| Utility Gas | 87 (98.9%) | 70 (84.3%) |
| Bottled, Tank, or LP Gas | 1 (1.1%) | 4 (4.8%) |
| Electricity | 0 (0.0%) | 9 (10.8%) |
| Fuel Oil or Kerosene | 0 (0.0%) | 0 (0.0%) |
| Coal or Coke | 0 (0.0%) | 0 (0.0%) |
| All other Fuels | 0 (0.0%) | 0 (0.0%) |
| No Fuel Used | 0 (0.0%) | 0 (0.0%) |
| Total | 88 (100.0%) | 83 (100.0%) |
Household Vehicle Usage in Applewold borough
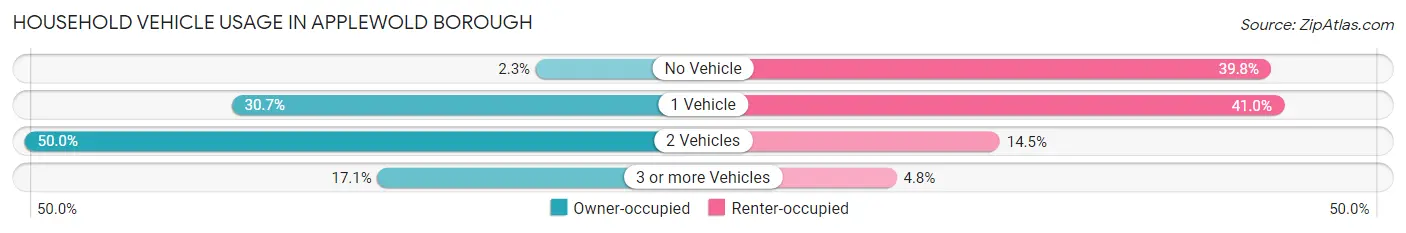
| Vehicles per Household | Owner-occupied | Renter-occupied |
| No Vehicle | 2 (2.3%) | 33 (39.8%) |
| 1 Vehicle | 27 (30.7%) | 34 (41.0%) |
| 2 Vehicles | 44 (50.0%) | 12 (14.5%) |
| 3 or more Vehicles | 15 (17.1%) | 4 (4.8%) |
| Total | 88 (100.0%) | 83 (100.0%) |
Real Estate & Mortgages in Applewold borough
Real Estate and Mortgage Overview in Applewold borough
| Characteristic | Without Mortgage | With Mortgage |
| Housing Units | 30 | 58 |
| Median Property Value | $166,700 | $220,000 |
| Median Household Income | $43,750 | $12 |
| Monthly Housing Costs | $438 | $3 |
| Real Estate Taxes | $2,200 | $1 |
Property Value by Mortgage Status in Applewold borough
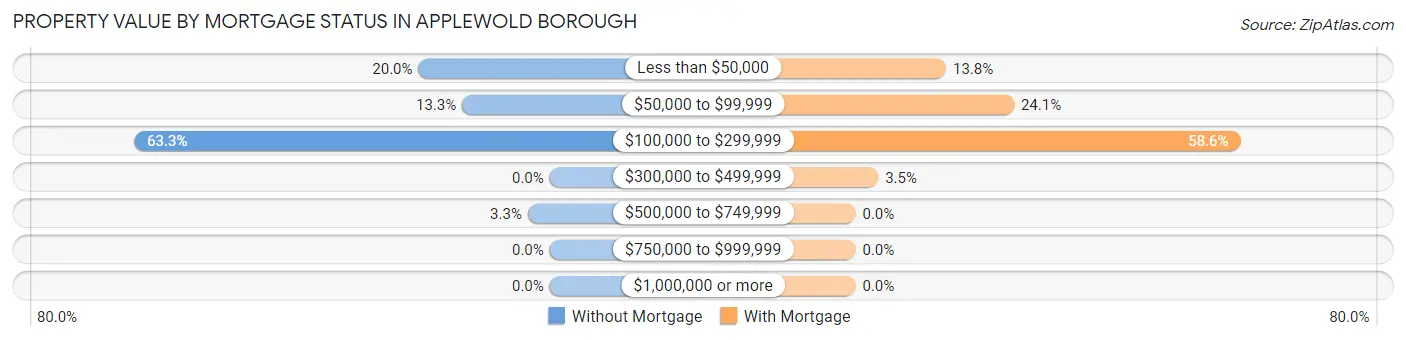
| Property Value | Without Mortgage | With Mortgage |
| Less than $50,000 | 6 (20.0%) | 8 (13.8%) |
| $50,000 to $99,999 | 4 (13.3%) | 14 (24.1%) |
| $100,000 to $299,999 | 19 (63.3%) | 34 (58.6%) |
| $300,000 to $499,999 | 0 (0.0%) | 2 (3.5%) |
| $500,000 to $749,999 | 1 (3.3%) | 0 (0.0%) |
| $750,000 to $999,999 | 0 (0.0%) | 0 (0.0%) |
| $1,000,000 or more | 0 (0.0%) | 0 (0.0%) |
| Total | 30 (100.0%) | 58 (100.0%) |
Household Income by Mortgage Status in Applewold borough
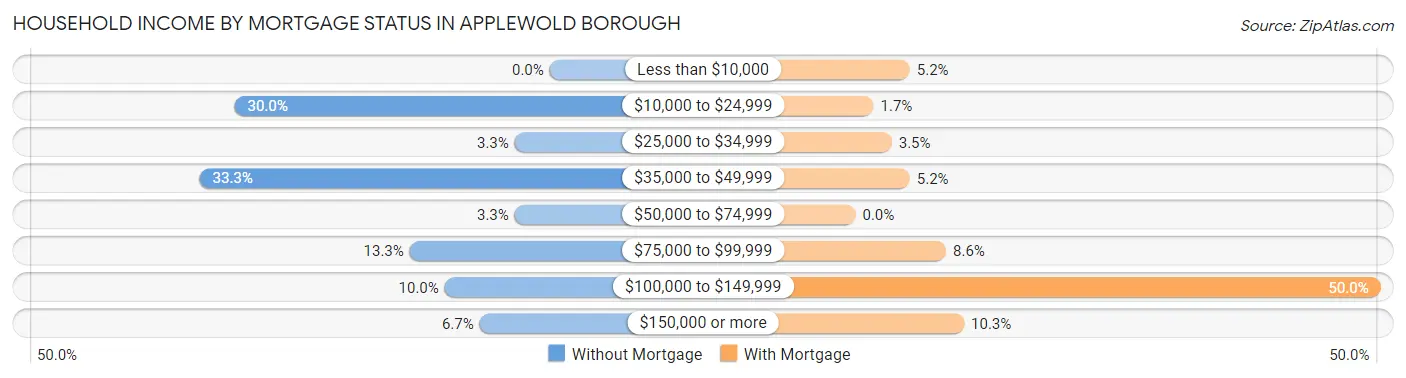
| Household Income | Without Mortgage | With Mortgage |
| Less than $10,000 | 0 (0.0%) | 3 (5.2%) |
| $10,000 to $24,999 | 9 (30.0%) | 1 (1.7%) |
| $25,000 to $34,999 | 1 (3.3%) | 2 (3.5%) |
| $35,000 to $49,999 | 10 (33.3%) | 3 (5.2%) |
| $50,000 to $74,999 | 1 (3.3%) | 0 (0.0%) |
| $75,000 to $99,999 | 4 (13.3%) | 5 (8.6%) |
| $100,000 to $149,999 | 3 (10.0%) | 29 (50.0%) |
| $150,000 or more | 2 (6.7%) | 6 (10.3%) |
| Total | 30 (100.0%) | 58 (100.0%) |
Property Value to Household Income Ratio in Applewold borough
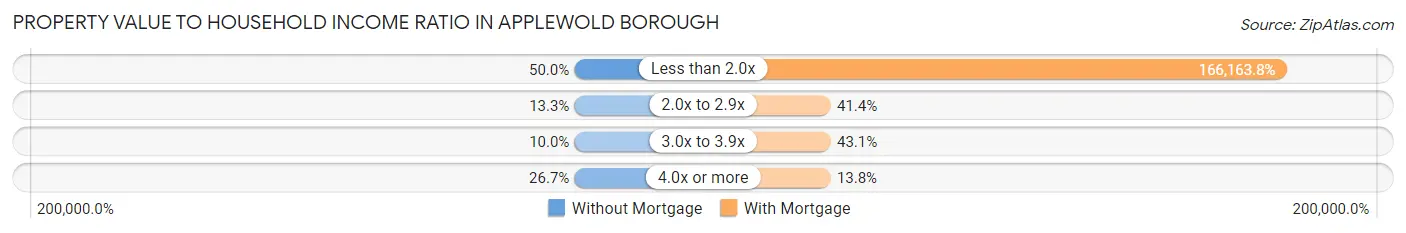
| Value-to-Income Ratio | Without Mortgage | With Mortgage |
| Less than 2.0x | 15 (50.0%) | 96,375 (166,163.8%) |
| 2.0x to 2.9x | 4 (13.3%) | 24 (41.4%) |
| 3.0x to 3.9x | 3 (10.0%) | 25 (43.1%) |
| 4.0x or more | 8 (26.7%) | 8 (13.8%) |
| Total | 30 (100.0%) | 58 (100.0%) |
Real Estate Taxes by Mortgage Status in Applewold borough
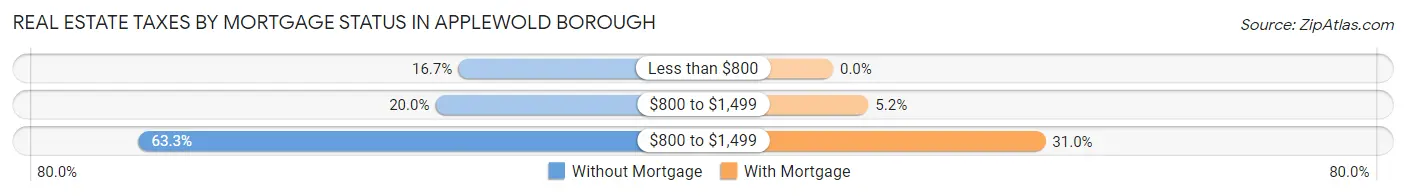
| Property Taxes | Without Mortgage | With Mortgage |
| Less than $800 | 5 (16.7%) | 0 (0.0%) |
| $800 to $1,499 | 6 (20.0%) | 3 (5.2%) |
| $800 to $1,499 | 19 (63.3%) | 18 (31.0%) |
| Total | 30 (100.0%) | 58 (100.0%) |
Health & Disability in Applewold borough
Health Insurance Coverage by Age in Applewold borough
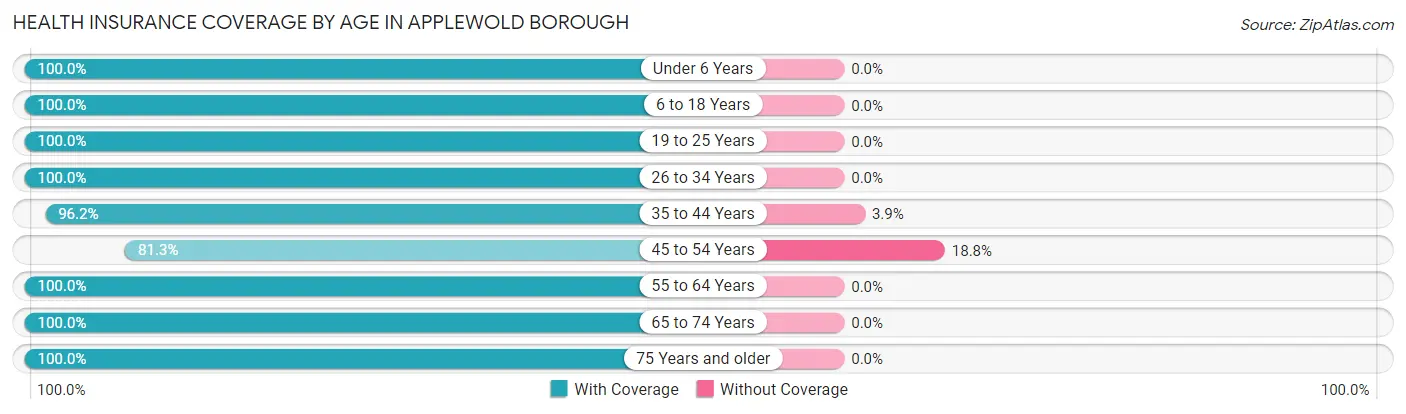
| Age Bracket | With Coverage | Without Coverage |
| Under 6 Years | 15 (100.0%) | 0 (0.0%) |
| 6 to 18 Years | 59 (100.0%) | 0 (0.0%) |
| 19 to 25 Years | 36 (100.0%) | 0 (0.0%) |
| 26 to 34 Years | 19 (100.0%) | 0 (0.0%) |
| 35 to 44 Years | 50 (96.2%) | 2 (3.8%) |
| 45 to 54 Years | 13 (81.2%) | 3 (18.8%) |
| 55 to 64 Years | 30 (100.0%) | 0 (0.0%) |
| 65 to 74 Years | 45 (100.0%) | 0 (0.0%) |
| 75 Years and older | 48 (100.0%) | 0 (0.0%) |
| Total | 315 (98.4%) | 5 (1.6%) |
Health Insurance Coverage by Citizenship Status in Applewold borough
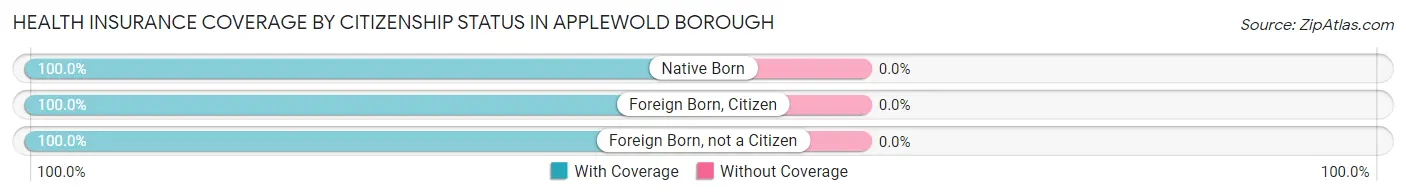
| Citizenship Status | With Coverage | Without Coverage |
| Native Born | 15 (100.0%) | 0 (0.0%) |
| Foreign Born, Citizen | 59 (100.0%) | 0 (0.0%) |
| Foreign Born, not a Citizen | 36 (100.0%) | 0 (0.0%) |
Health Insurance Coverage by Household Income in Applewold borough
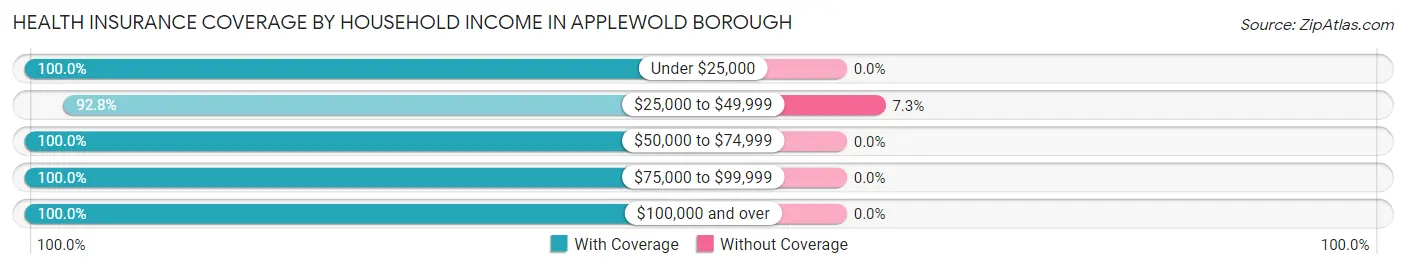
| Household Income | With Coverage | Without Coverage |
| Under $25,000 | 60 (100.0%) | 0 (0.0%) |
| $25,000 to $49,999 | 64 (92.7%) | 5 (7.2%) |
| $50,000 to $74,999 | 16 (100.0%) | 0 (0.0%) |
| $75,000 to $99,999 | 99 (100.0%) | 0 (0.0%) |
| $100,000 and over | 76 (100.0%) | 0 (0.0%) |
Public vs Private Health Insurance Coverage by Age in Applewold borough
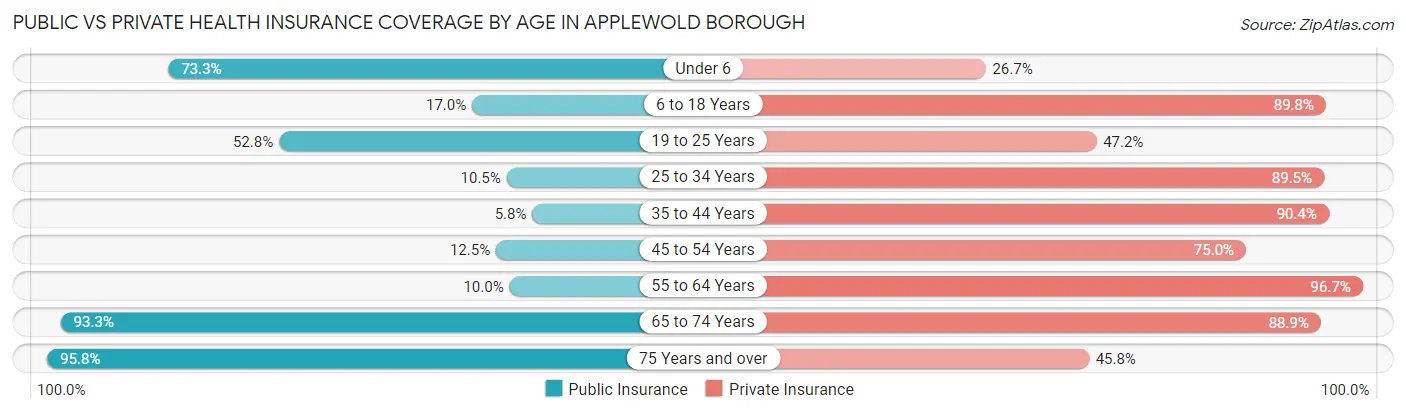
| Age Bracket | Public Insurance | Private Insurance |
| Under 6 | 11 (73.3%) | 4 (26.7%) |
| 6 to 18 Years | 10 (17.0%) | 53 (89.8%) |
| 19 to 25 Years | 19 (52.8%) | 17 (47.2%) |
| 25 to 34 Years | 2 (10.5%) | 17 (89.5%) |
| 35 to 44 Years | 3 (5.8%) | 47 (90.4%) |
| 45 to 54 Years | 2 (12.5%) | 12 (75.0%) |
| 55 to 64 Years | 3 (10.0%) | 29 (96.7%) |
| 65 to 74 Years | 42 (93.3%) | 40 (88.9%) |
| 75 Years and over | 46 (95.8%) | 22 (45.8%) |
| Total | 138 (43.1%) | 241 (75.3%) |
Disability Status by Sex by Age in Applewold borough
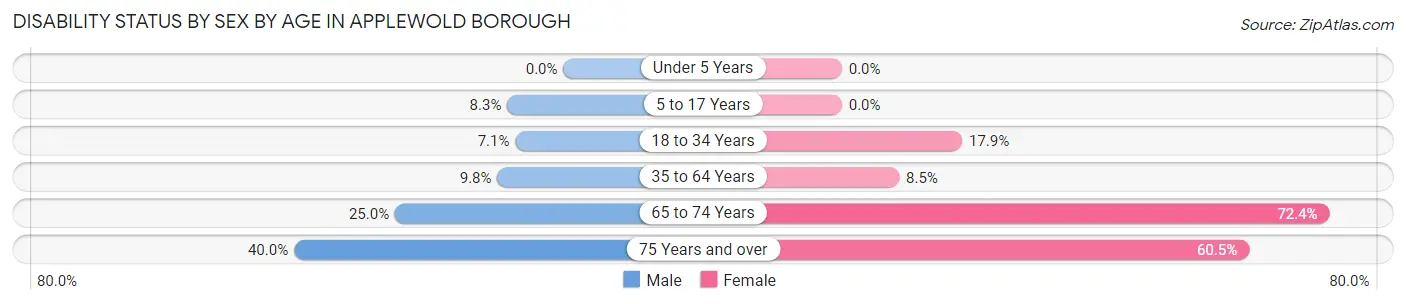
| Age Bracket | Male | Female |
| Under 5 Years | 0 (0.0%) | 0 (0.0%) |
| 5 to 17 Years | 3 (8.3%) | 0 (0.0%) |
| 18 to 34 Years | 2 (7.1%) | 5 (17.9%) |
| 35 to 64 Years | 5 (9.8%) | 4 (8.5%) |
| 65 to 74 Years | 4 (25.0%) | 21 (72.4%) |
| 75 Years and over | 2 (40.0%) | 26 (60.5%) |
Disability Class by Sex by Age in Applewold borough
Disability Class: Hearing Difficulty
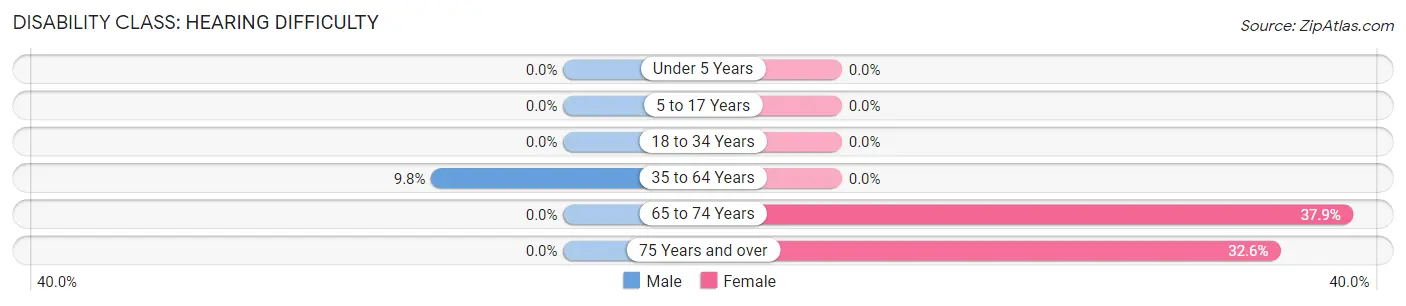
| Age Bracket | Male | Female |
| Under 5 Years | 0 (0.0%) | 0 (0.0%) |
| 5 to 17 Years | 0 (0.0%) | 0 (0.0%) |
| 18 to 34 Years | 0 (0.0%) | 0 (0.0%) |
| 35 to 64 Years | 5 (9.8%) | 0 (0.0%) |
| 65 to 74 Years | 0 (0.0%) | 11 (37.9%) |
| 75 Years and over | 0 (0.0%) | 14 (32.6%) |
Disability Class: Vision Difficulty
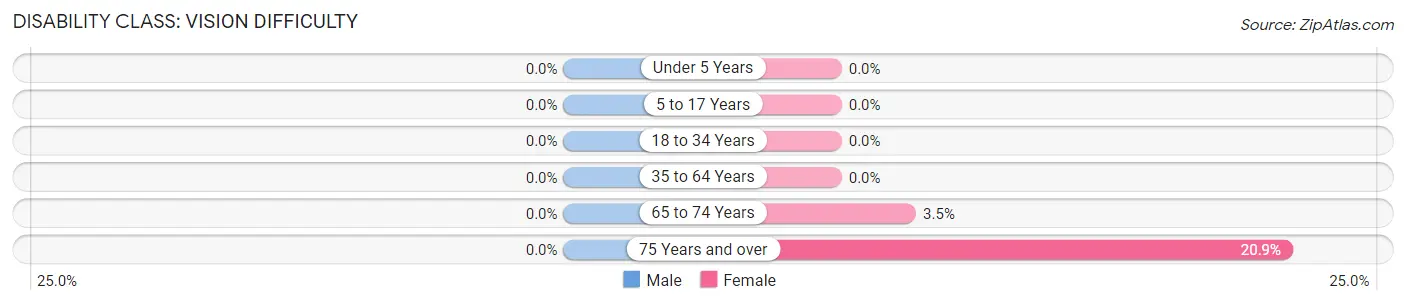
| Age Bracket | Male | Female |
| Under 5 Years | 0 (0.0%) | 0 (0.0%) |
| 5 to 17 Years | 0 (0.0%) | 0 (0.0%) |
| 18 to 34 Years | 0 (0.0%) | 0 (0.0%) |
| 35 to 64 Years | 0 (0.0%) | 0 (0.0%) |
| 65 to 74 Years | 0 (0.0%) | 1 (3.5%) |
| 75 Years and over | 0 (0.0%) | 9 (20.9%) |
Disability Class: Cognitive Difficulty
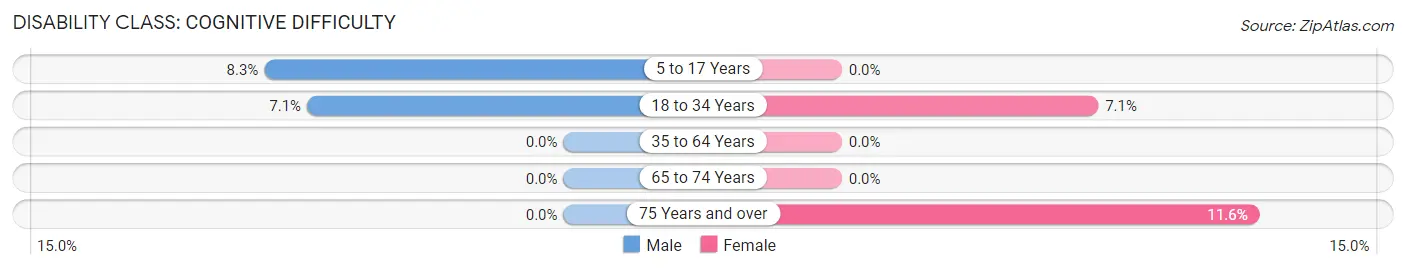
| Age Bracket | Male | Female |
| 5 to 17 Years | 3 (8.3%) | 0 (0.0%) |
| 18 to 34 Years | 2 (7.1%) | 2 (7.1%) |
| 35 to 64 Years | 0 (0.0%) | 0 (0.0%) |
| 65 to 74 Years | 0 (0.0%) | 0 (0.0%) |
| 75 Years and over | 0 (0.0%) | 5 (11.6%) |
Disability Class: Ambulatory Difficulty
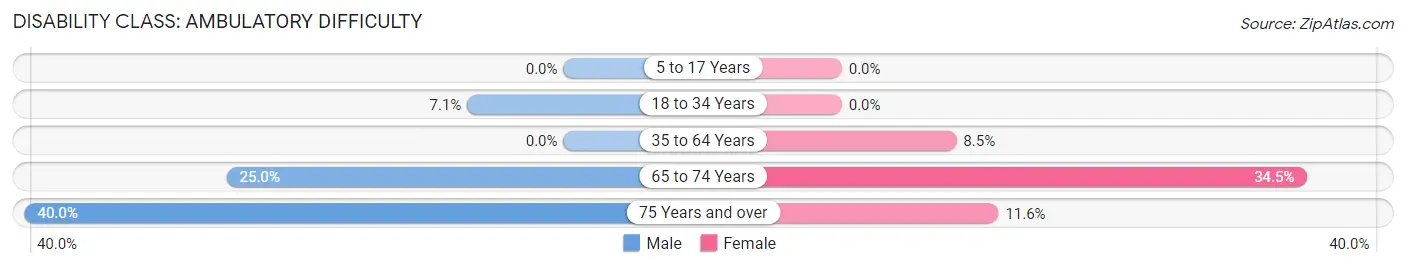
| Age Bracket | Male | Female |
| 5 to 17 Years | 0 (0.0%) | 0 (0.0%) |
| 18 to 34 Years | 2 (7.1%) | 0 (0.0%) |
| 35 to 64 Years | 0 (0.0%) | 4 (8.5%) |
| 65 to 74 Years | 4 (25.0%) | 10 (34.5%) |
| 75 Years and over | 2 (40.0%) | 5 (11.6%) |
Disability Class: Self-Care Difficulty
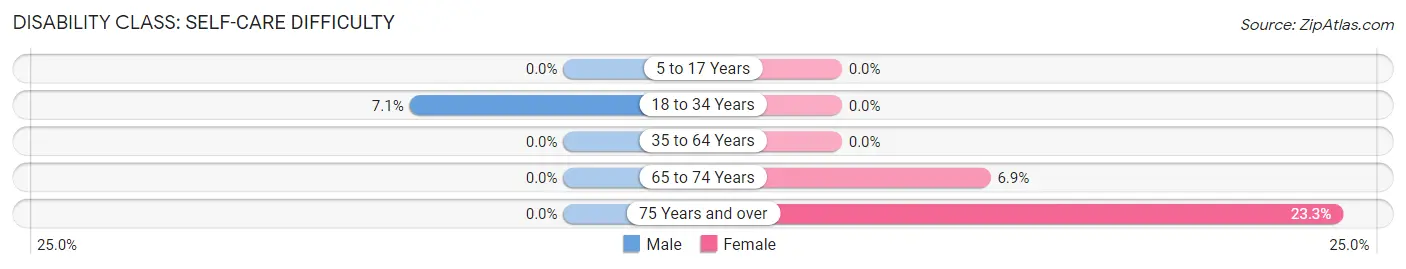
| Age Bracket | Male | Female |
| 5 to 17 Years | 0 (0.0%) | 0 (0.0%) |
| 18 to 34 Years | 2 (7.1%) | 0 (0.0%) |
| 35 to 64 Years | 0 (0.0%) | 0 (0.0%) |
| 65 to 74 Years | 0 (0.0%) | 2 (6.9%) |
| 75 Years and over | 0 (0.0%) | 10 (23.3%) |
Technology Access in Applewold borough
Computing Device Access in Applewold borough
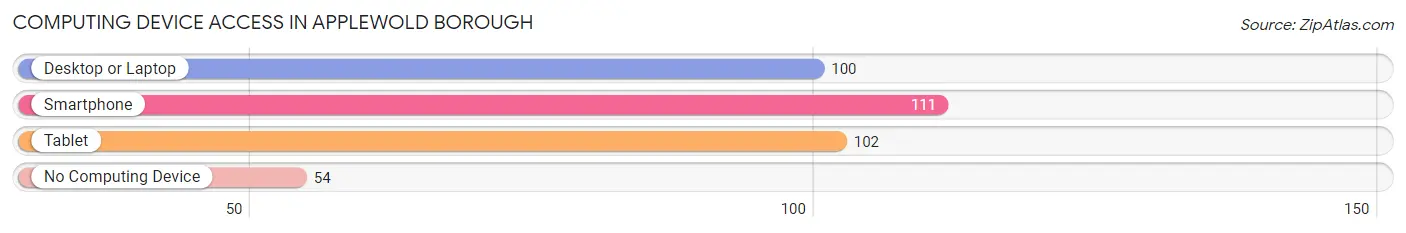
| Device Type | # Households | % Households |
| Desktop or Laptop | 100 | 58.5% |
| Smartphone | 111 | 64.9% |
| Tablet | 102 | 59.7% |
| No Computing Device | 54 | 31.6% |
| Total | 171 | 100.0% |
Internet Access in Applewold borough
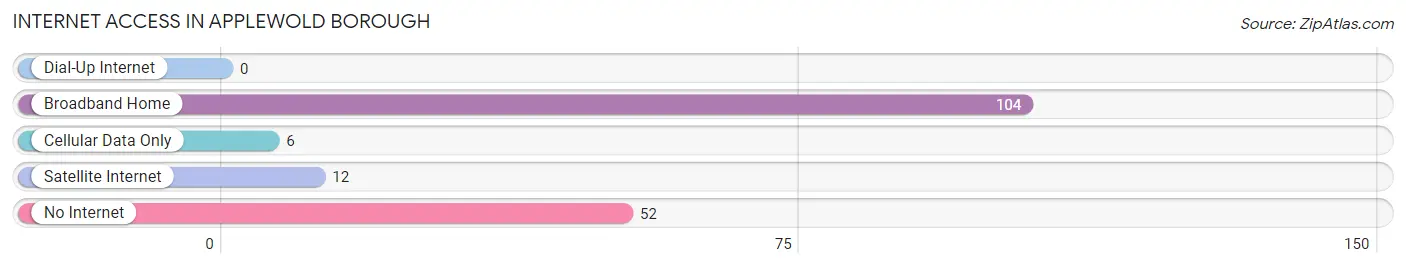
| Internet Type | # Households | % Households |
| Dial-Up Internet | 0 | 0.0% |
| Broadband Home | 104 | 60.8% |
| Cellular Data Only | 6 | 3.5% |
| Satellite Internet | 12 | 7.0% |
| No Internet | 52 | 30.4% |
| Total | 171 | 100.0% |
Applewold borough Summary
Applewold Borough is a small borough located in the state of Pennsylvania. It is situated in the northwestern corner of the state, in the Allegheny Mountains. The borough is bordered by the towns of Clarion, Clarion County, and Venango County. The population of Applewold Borough was 1,845 as of the 2010 census.
Geography
Applewold Borough is located in the northwestern corner of Pennsylvania, in the Allegheny Mountains. The borough is bordered by the towns of Clarion, Clarion County, and Venango County. The borough is situated on the Allegheny River, which is the main source of water for the borough. The borough is also home to several small creeks and streams, including the Clarion River, which flows through the borough. The borough is located at an elevation of 1,845 feet above sea level.
The borough is located in a temperate climate, with temperatures ranging from the low 30s in the winter to the mid-80s in the summer. The borough receives an average of 40 inches of precipitation annually, with most of it falling in the form of snow.
Economy
The economy of Applewold Borough is largely based on the timber industry. The borough is home to several sawmills and lumber companies, which provide employment for many of the borough's residents. The borough is also home to several small businesses, including restaurants, retail stores, and service providers.
Demographics
As of the 2010 census, the population of Applewold Borough was 1,845. The racial makeup of the borough was 97.3% White, 0.7% African American, 0.2% Native American, 0.2% Asian, 0.1% Pacific Islander, 0.3% from other races, and 1.3% from two or more races. Hispanic or Latino of any race were 1.2% of the population.
The median income for a household in the borough was $37,917, and the median income for a family was $45,625. The per capita income for the borough was $19,945. About 11.2% of families and 14.2% of the population were below the poverty line, including 19.2% of those under age 18 and 8.2% of those age 65 or over.
History
Applewold Borough was founded in 1845 by a group of settlers from Clarion County. The borough was named after the apple orchards that were planted in the area by the settlers. The borough was incorporated in 1851 and has remained a small, rural community ever since.
The borough was home to several sawmills and lumber companies in the late 19th and early 20th centuries. The timber industry provided employment for many of the borough's residents. The borough also had several small businesses, including restaurants, retail stores, and service providers.
In the late 20th century, the borough began to experience a decline in population as many of its residents moved away in search of better job opportunities. The borough has since seen a resurgence in population, as many of its former residents have returned to the area.
Common Questions
What is Per Capita Income in Applewold borough?
Per Capita income in Applewold borough is $34,758.
What is the Median Family Income in Applewold borough?
Median Family Income in Applewold borough is $95,658.
What is the Median Household income in Applewold borough?
Median Household Income in Applewold borough is $45,750.
What is Income or Wage Gap in Applewold borough?
Income or Wage Gap in Applewold borough is 43.6%.
Women in Applewold borough earn 56.4 cents for every dollar earned by a man.
What is Inequality or Gini Index in Applewold borough?
Inequality or Gini Index in Applewold borough is 0.48.
What is the Total Population of Applewold borough?
Total Population of Applewold borough is 320.
What is the Total Male Population of Applewold borough?
Total Male Population of Applewold borough is 136.
What is the Total Female Population of Applewold borough?
Total Female Population of Applewold borough is 184.
What is the Ratio of Males per 100 Females in Applewold borough?
There are 73.91 Males per 100 Females in Applewold borough.
What is the Ratio of Females per 100 Males in Applewold borough?
There are 135.29 Females per 100 Males in Applewold borough.
What is the Median Population Age in Applewold borough?
Median Population Age in Applewold borough is 40.8 Years.
What is the Average Family Size in Applewold borough
Average Family Size in Applewold borough is 2.7 People.
What is the Average Household Size in Applewold borough
Average Household Size in Applewold borough is 1.9 People.
How Large is the Labor Force in Applewold borough?
There are 157 People in the Labor Forcein in Applewold borough.
What is the Percentage of People in the Labor Force in Applewold borough?
60.6% of People are in the Labor Force in Applewold borough.
What is the Unemployment Rate in Applewold borough?
Unemployment Rate in Applewold borough is 3.2%.