Mount Pleasant borough, PA Map & Demographics
Mount Pleasant borough Overview
$29,568
PER CAPITA INCOME
$65,648
AVG FAMILY INCOME
$47,407
AVG HOUSEHOLD INCOME
26.2%
WAGE / INCOME GAP [ % ]
73.8¢/ $1
WAGE / INCOME GAP [ $ ]
0.41
INEQUALITY / GINI INDEX
4,242
TOTAL POPULATION
1,797
MALE POPULATION
2,445
FEMALE POPULATION
73.50
MALES / 100 FEMALES
136.06
FEMALES / 100 MALES
51.5
MEDIAN AGE
2.6
AVG FAMILY SIZE
2.0
AVG HOUSEHOLD SIZE
2,040
LABOR FORCE [ PEOPLE ]
55.6%
PERCENT IN LABOR FORCE
6.1%
UNEMPLOYMENT RATE
Income in Mount Pleasant borough
Income Overview in Mount Pleasant borough
Per Capita Income in Mount Pleasant borough is $29,568, while median incomes of families and households are $65,648 and $47,407 respectively.
| Characteristic | Number | Measure |
| Per Capita Income | 4,242 | $29,568 |
| Median Family Income | 1,150 | $65,648 |
| Mean Family Income | 1,150 | $75,108 |
| Median Household Income | 2,041 | $47,407 |
| Mean Household Income | 2,041 | $59,177 |
| Income Deficit | 1,150 | $0 |
| Wage / Income Gap (%) | 4,242 | 26.23% |
| Wage / Income Gap ($) | 4,242 | 73.77¢ per $1 |
| Gini / Inequality Index | 4,242 | 0.41 |
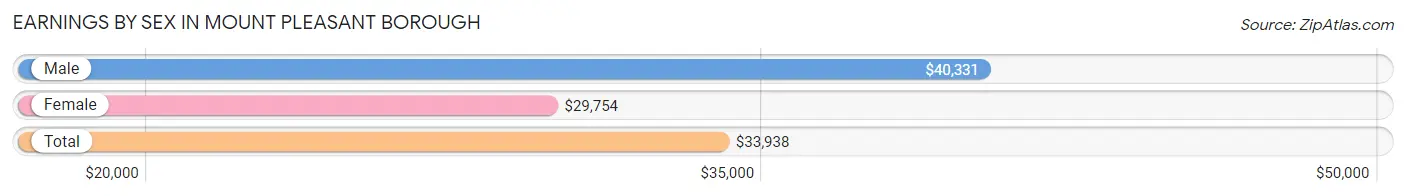
Earnings by Sex in Mount Pleasant borough
Average Earnings in Mount Pleasant borough are $33,938, $40,331 for men and $29,754 for women, a difference of 26.2%.
| Sex | Number | Average Earnings |
| Male | 941 (43.0%) | $40,331 |
| Female | 1,246 (57.0%) | $29,754 |
| Total | 2,187 (100.0%) | $33,938 |
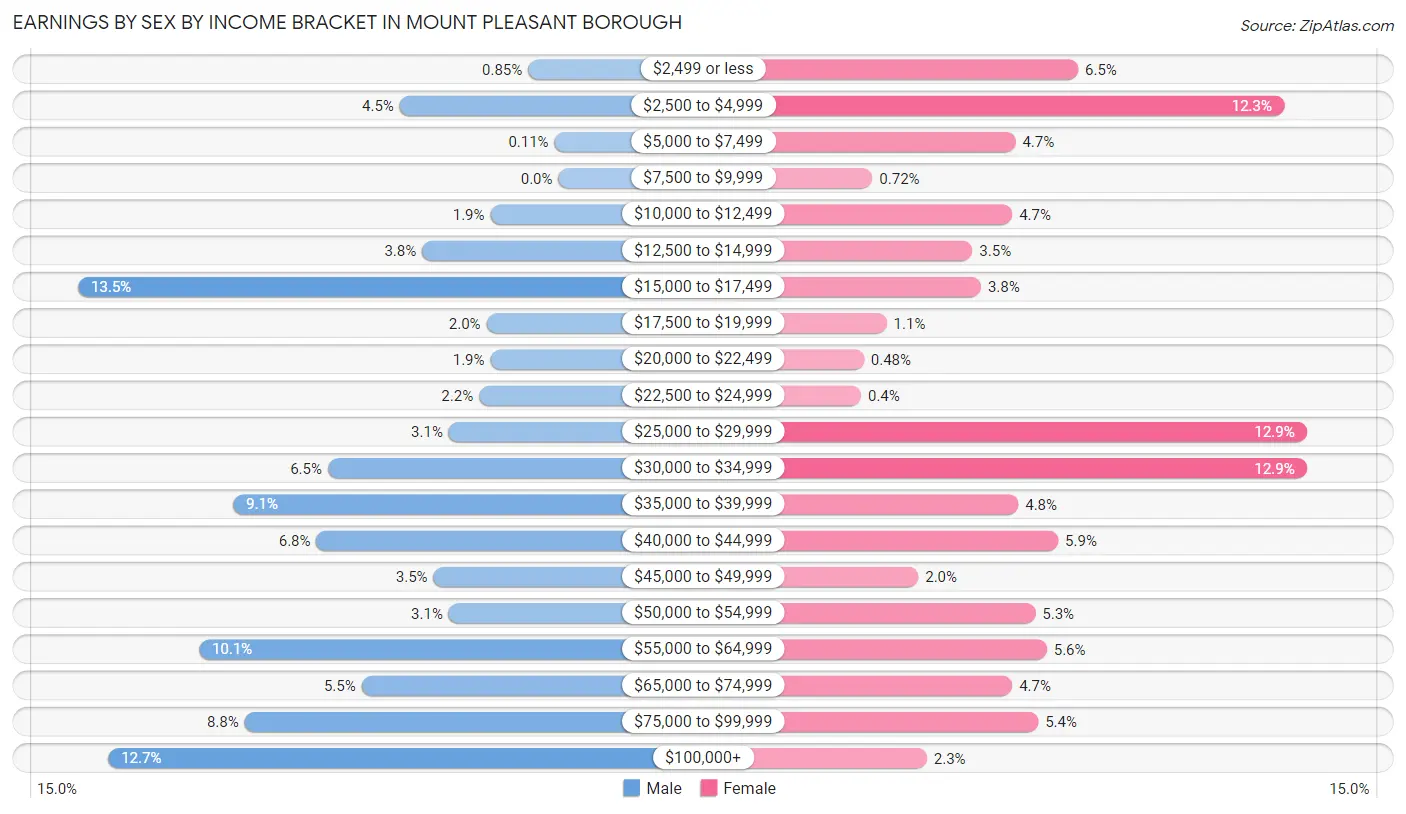
Earnings by Sex by Income Bracket in Mount Pleasant borough
The most common earnings brackets in Mount Pleasant borough are $15,000 to $17,499 for men (127 | 13.5%) and $25,000 to $29,999 for women (161 | 12.9%).
| Income | Male | Female |
| $2,499 or less | 8 (0.9%) | 81 (6.5%) |
| $2,500 to $4,999 | 42 (4.5%) | 153 (12.3%) |
| $5,000 to $7,499 | 1 (0.1%) | 59 (4.7%) |
| $7,500 to $9,999 | 0 (0.0%) | 9 (0.7%) |
| $10,000 to $12,499 | 18 (1.9%) | 58 (4.6%) |
| $12,500 to $14,999 | 36 (3.8%) | 44 (3.5%) |
| $15,000 to $17,499 | 127 (13.5%) | 47 (3.8%) |
| $17,500 to $19,999 | 19 (2.0%) | 14 (1.1%) |
| $20,000 to $22,499 | 18 (1.9%) | 6 (0.5%) |
| $22,500 to $24,999 | 21 (2.2%) | 5 (0.4%) |
| $25,000 to $29,999 | 29 (3.1%) | 161 (12.9%) |
| $30,000 to $34,999 | 61 (6.5%) | 161 (12.9%) |
| $35,000 to $39,999 | 86 (9.1%) | 60 (4.8%) |
| $40,000 to $44,999 | 64 (6.8%) | 74 (5.9%) |
| $45,000 to $49,999 | 33 (3.5%) | 25 (2.0%) |
| $50,000 to $54,999 | 29 (3.1%) | 66 (5.3%) |
| $55,000 to $64,999 | 95 (10.1%) | 70 (5.6%) |
| $65,000 to $74,999 | 52 (5.5%) | 58 (4.6%) |
| $75,000 to $99,999 | 83 (8.8%) | 67 (5.4%) |
| $100,000+ | 119 (12.7%) | 28 (2.2%) |
| Total | 941 (100.0%) | 1,246 (100.0%) |
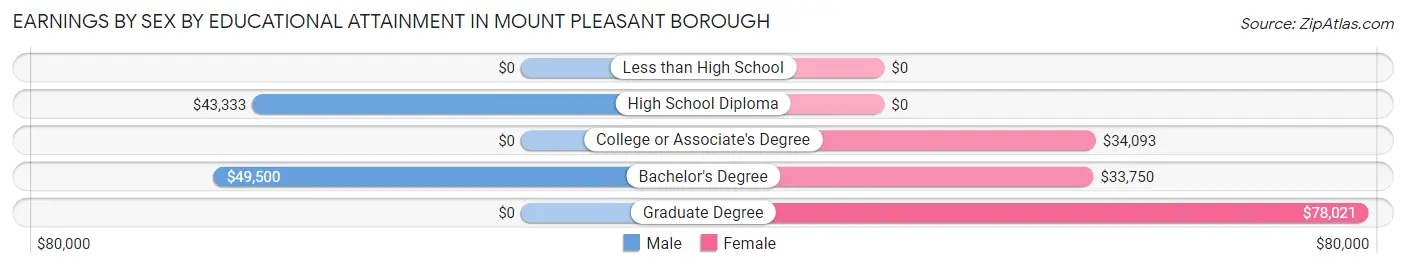
Earnings by Sex by Educational Attainment in Mount Pleasant borough
Average earnings in Mount Pleasant borough are $41,471 for men and $34,049 for women, a difference of 17.9%. Men with an educational attainment of bachelor's degree enjoy the highest average annual earnings of $49,500, while those with high school diploma education earn the least with $43,333. Women with an educational attainment of graduate degree earn the most with the average annual earnings of $78,021, while those with bachelor's degree education have the smallest earnings of $33,750.
| Educational Attainment | Male Income | Female Income |
| Less than High School | - | - |
| High School Diploma | $43,333 | $0 |
| College or Associate's Degree | - | - |
| Bachelor's Degree | $49,500 | $33,750 |
| Graduate Degree | - | - |
| Total | $41,471 | $34,049 |
Family Income in Mount Pleasant borough
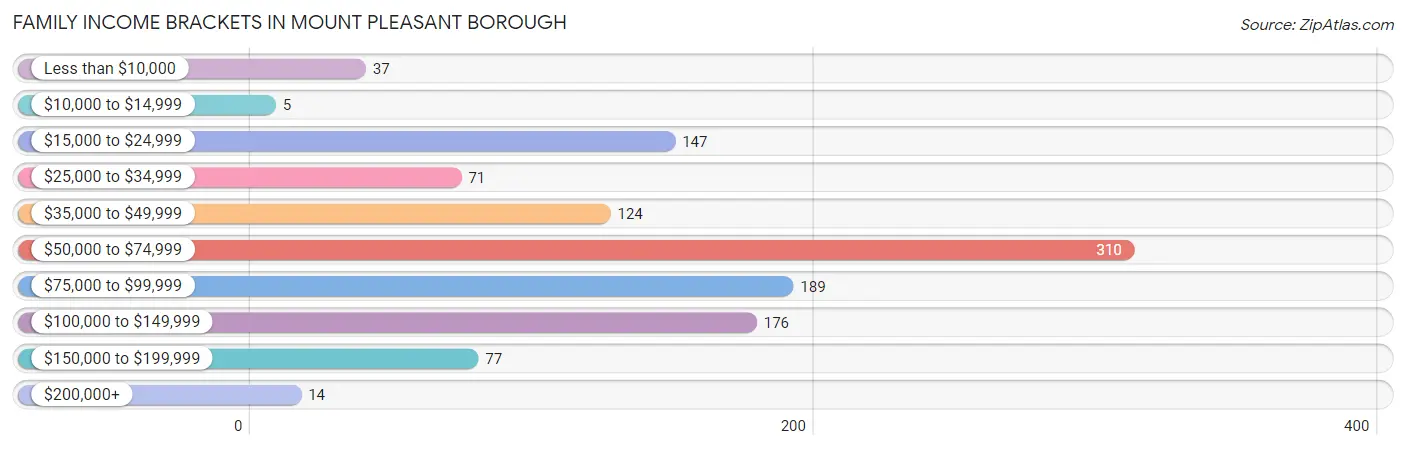
Family Income Brackets in Mount Pleasant borough
According to the Mount Pleasant borough family income data, there are 310 families falling into the $50,000 to $74,999 income range, which is the most common income bracket and makes up 27.0% of all families. Conversely, the $10,000 to $14,999 income bracket is the least frequent group with only 5 families (0.4%) belonging to this category.
| Income Bracket | # Families | % Families |
| Less than $10,000 | 37 | 3.2% |
| $10,000 to $14,999 | 5 | 0.4% |
| $15,000 to $24,999 | 147 | 12.8% |
| $25,000 to $34,999 | 71 | 6.2% |
| $35,000 to $49,999 | 124 | 10.8% |
| $50,000 to $74,999 | 310 | 27.0% |
| $75,000 to $99,999 | 189 | 16.4% |
| $100,000 to $149,999 | 176 | 15.3% |
| $150,000 to $199,999 | 77 | 6.7% |
| $200,000+ | 14 | 1.2% |
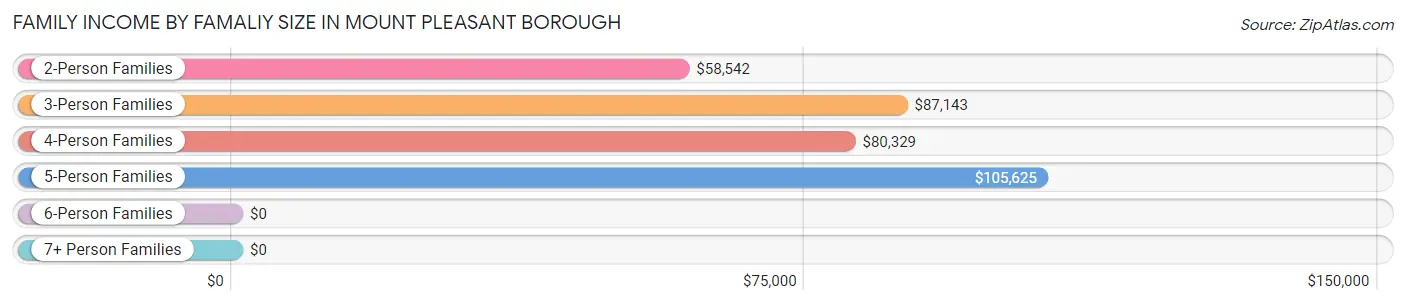
Family Income by Famaliy Size in Mount Pleasant borough
5-person families (50 | 4.3%) account for the highest median family income in Mount Pleasant borough with $105,625 per family, while 2-person families (733 | 63.7%) have the highest median income of $29,271 per family member.
| Income Bracket | # Families | Median Income |
| 2-Person Families | 733 (63.7%) | $58,542 |
| 3-Person Families | 252 (21.9%) | $87,143 |
| 4-Person Families | 91 (7.9%) | $80,329 |
| 5-Person Families | 50 (4.3%) | $105,625 |
| 6-Person Families | 22 (1.9%) | $0 |
| 7+ Person Families | 2 (0.2%) | $0 |
| Total | 1,150 (100.0%) | $65,648 |
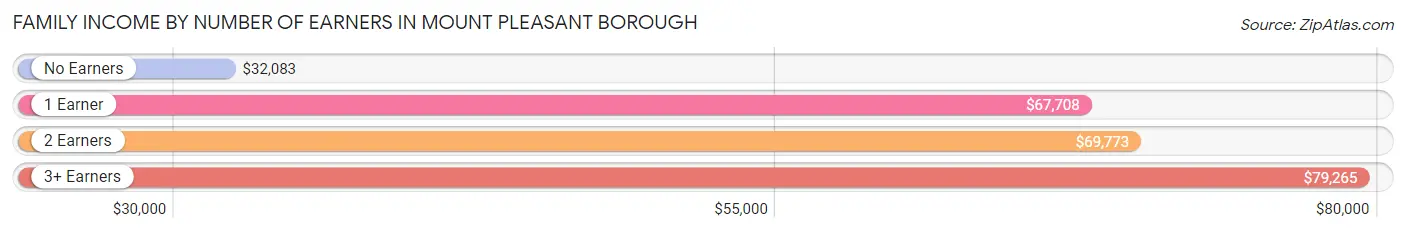
Family Income by Number of Earners in Mount Pleasant borough
The median family income in Mount Pleasant borough is $65,648, with families comprising 3+ earners (92) having the highest median family income of $79,265, while families with no earners (236) have the lowest median family income of $32,083, accounting for 8.0% and 20.5% of families, respectively.
| Number of Earners | # Families | Median Income |
| No Earners | 236 (20.5%) | $32,083 |
| 1 Earner | 248 (21.6%) | $67,708 |
| 2 Earners | 574 (49.9%) | $69,773 |
| 3+ Earners | 92 (8.0%) | $79,265 |
| Total | 1,150 (100.0%) | $65,648 |
Household Income in Mount Pleasant borough
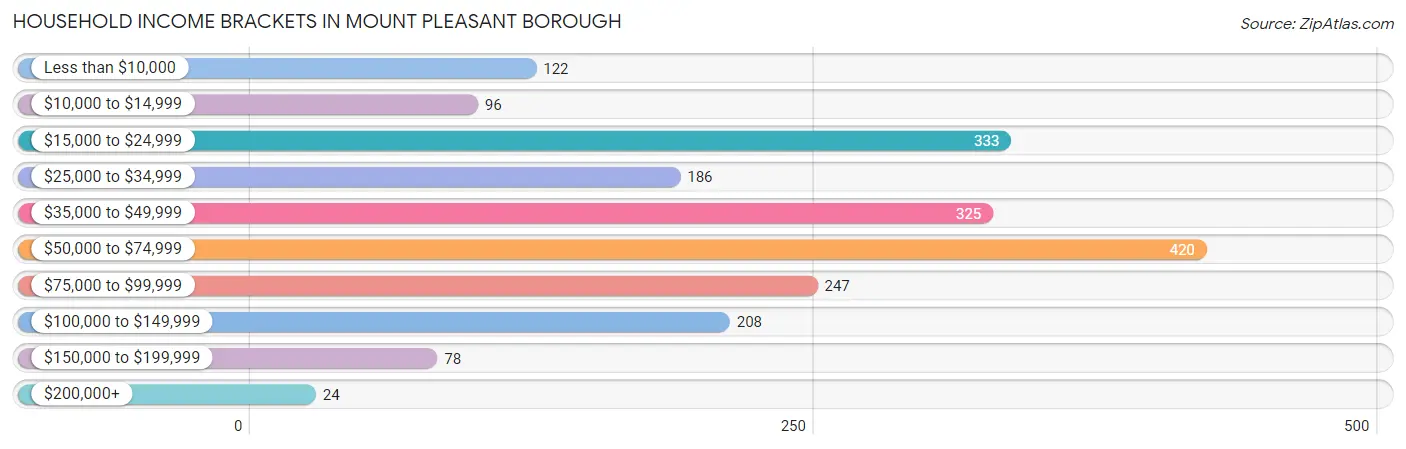
Household Income Brackets in Mount Pleasant borough
With 420 households falling in the category, the $50,000 to $74,999 income range is the most frequent in Mount Pleasant borough, accounting for 20.6% of all households. In contrast, only 24 households (1.2%) fall into the $200,000+ income bracket, making it the least populous group.
| Income Bracket | # Households | % Households |
| Less than $10,000 | 122 | 6.0% |
| $10,000 to $14,999 | 96 | 4.7% |
| $15,000 to $24,999 | 333 | 16.3% |
| $25,000 to $34,999 | 186 | 9.1% |
| $35,000 to $49,999 | 325 | 15.9% |
| $50,000 to $74,999 | 420 | 20.6% |
| $75,000 to $99,999 | 247 | 12.1% |
| $100,000 to $149,999 | 208 | 10.2% |
| $150,000 to $199,999 | 78 | 3.8% |
| $200,000+ | 24 | 1.2% |
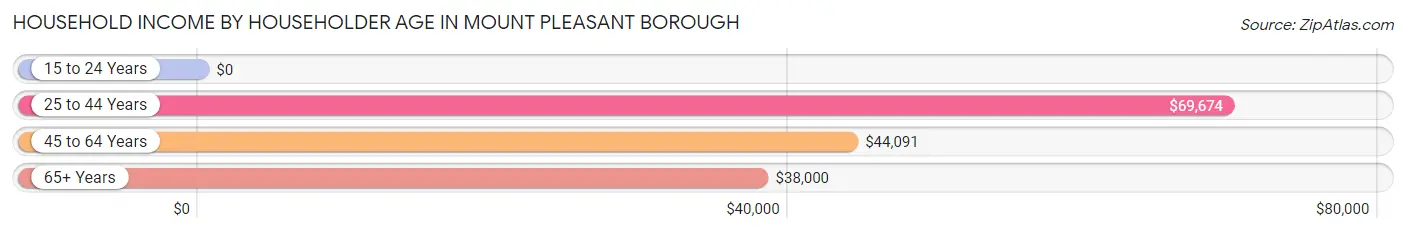
Household Income by Householder Age in Mount Pleasant borough
The median household income in Mount Pleasant borough is $47,407, with the highest median household income of $69,674 found in the 25 to 44 years age bracket for the primary householder. A total of 552 households (27.1%) fall into this category. Meanwhile, the 15 to 24 years age bracket for the primary householder has the lowest median household income of $0, with 55 households (2.7%) in this group.
| Income Bracket | # Households | Median Income |
| 15 to 24 Years | 55 (2.7%) | $0 |
| 25 to 44 Years | 552 (27.1%) | $69,674 |
| 45 to 64 Years | 758 (37.1%) | $44,091 |
| 65+ Years | 676 (33.1%) | $38,000 |
| Total | 2,041 (100.0%) | $47,407 |
Poverty in Mount Pleasant borough
Income Below Poverty by Sex and Age in Mount Pleasant borough
With 10.3% poverty level for males and 13.5% for females among the residents of Mount Pleasant borough, 18 to 24 year old males and under 5 year old females are the most vulnerable to poverty, with 38 males (47.5%) and 26 females (41.9%) in their respective age groups living below the poverty level.
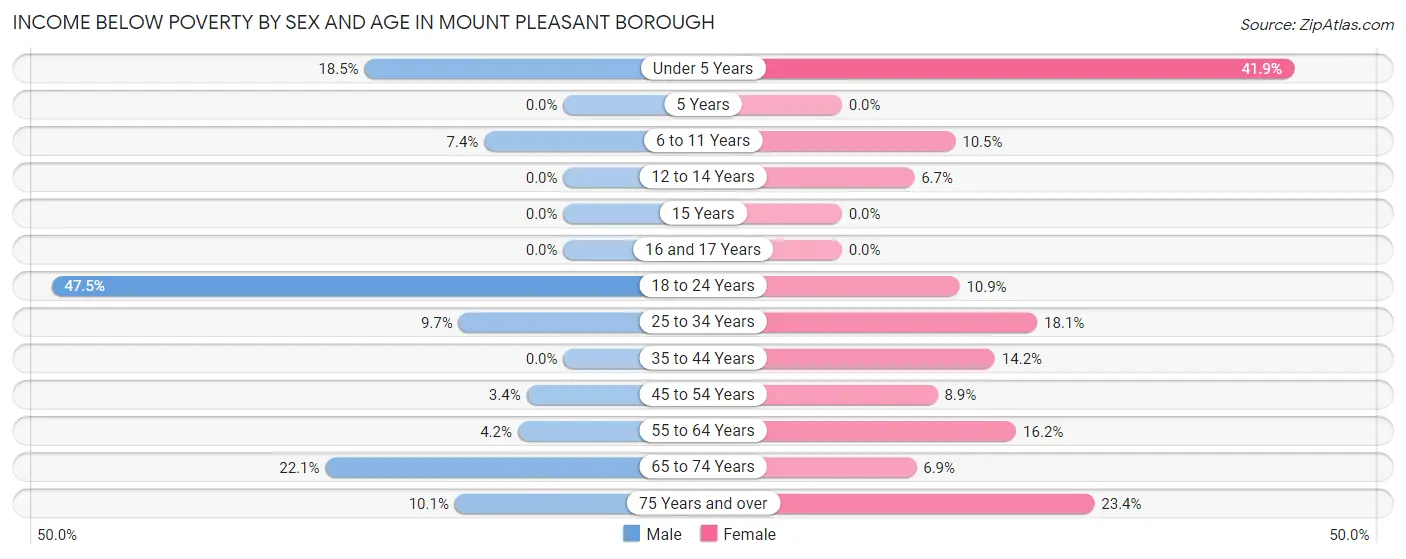
| Age Bracket | Male | Female |
| Under 5 Years | 24 (18.5%) | 26 (41.9%) |
| 5 Years | 0 (0.0%) | 0 (0.0%) |
| 6 to 11 Years | 5 (7.3%) | 10 (10.5%) |
| 12 to 14 Years | 0 (0.0%) | 8 (6.7%) |
| 15 Years | 0 (0.0%) | 0 (0.0%) |
| 16 and 17 Years | 0 (0.0%) | 0 (0.0%) |
| 18 to 24 Years | 38 (47.5%) | 25 (10.9%) |
| 25 to 34 Years | 22 (9.7%) | 33 (18.1%) |
| 35 to 44 Years | 0 (0.0%) | 54 (14.2%) |
| 45 to 54 Years | 8 (3.4%) | 27 (8.9%) |
| 55 to 64 Years | 16 (4.2%) | 56 (16.2%) |
| 65 to 74 Years | 55 (22.1%) | 23 (6.9%) |
| 75 Years and over | 12 (10.1%) | 60 (23.4%) |
| Total | 180 (10.3%) | 322 (13.5%) |
Income Above Poverty by Sex and Age in Mount Pleasant borough
According to the poverty statistics in Mount Pleasant borough, males aged 5 years and females aged 5 years are the age groups that are most secure financially, with 100.0% of males and 100.0% of females in these age groups living above the poverty line.
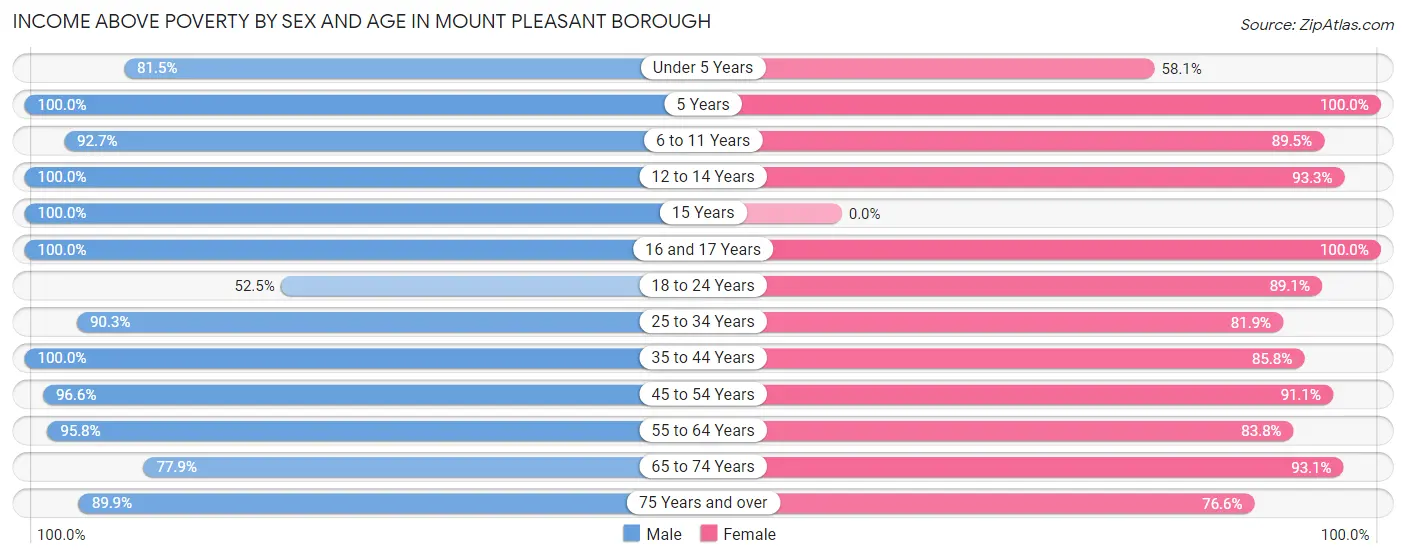
| Age Bracket | Male | Female |
| Under 5 Years | 106 (81.5%) | 36 (58.1%) |
| 5 Years | 6 (100.0%) | 24 (100.0%) |
| 6 to 11 Years | 63 (92.6%) | 85 (89.5%) |
| 12 to 14 Years | 52 (100.0%) | 111 (93.3%) |
| 15 Years | 17 (100.0%) | 0 (0.0%) |
| 16 and 17 Years | 29 (100.0%) | 63 (100.0%) |
| 18 to 24 Years | 42 (52.5%) | 204 (89.1%) |
| 25 to 34 Years | 204 (90.3%) | 149 (81.9%) |
| 35 to 44 Years | 162 (100.0%) | 326 (85.8%) |
| 45 to 54 Years | 226 (96.6%) | 277 (91.1%) |
| 55 to 64 Years | 362 (95.8%) | 290 (83.8%) |
| 65 to 74 Years | 194 (77.9%) | 310 (93.1%) |
| 75 Years and over | 107 (89.9%) | 196 (76.6%) |
| Total | 1,570 (89.7%) | 2,071 (86.5%) |
Income Below Poverty Among Married-Couple Families in Mount Pleasant borough
The poverty statistics for married-couple families in Mount Pleasant borough show that 2.7% or 21 of the total 771 families live below the poverty line. Families with 3 or 4 children have the highest poverty rate of 4.4%, comprising of 2 families. On the other hand, families with 1 or 2 children have the lowest poverty rate of 2.3%, which includes 6 families.
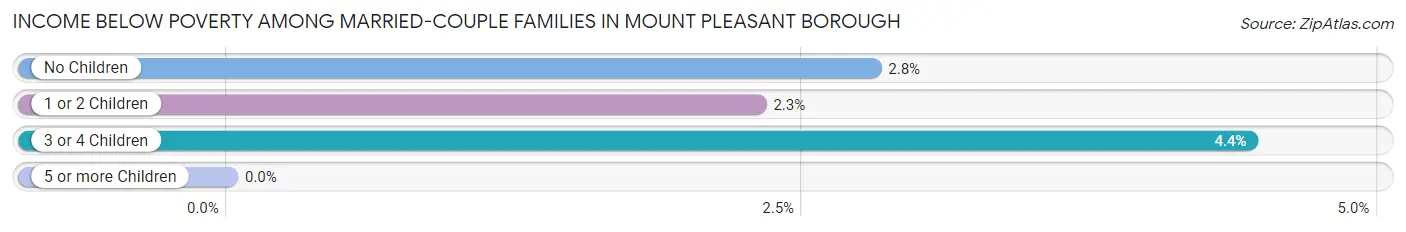
| Children | Above Poverty | Below Poverty |
| No Children | 452 (97.2%) | 13 (2.8%) |
| 1 or 2 Children | 255 (97.7%) | 6 (2.3%) |
| 3 or 4 Children | 43 (95.6%) | 2 (4.4%) |
| 5 or more Children | 0 (0.0%) | 0 (0.0%) |
| Total | 750 (97.3%) | 21 (2.7%) |
Income Below Poverty Among Single-Parent Households in Mount Pleasant borough
According to the poverty data in Mount Pleasant borough, 23.1% or 28 single-father households and 11.2% or 29 single-mother households are living below the poverty line. Among single-father households, those with no children have the highest poverty rate, with 21 households (30.9%) experiencing poverty. Likewise, among single-mother households, those with 1 or 2 children have the highest poverty rate, with 29 households (37.2%) falling below the poverty line.
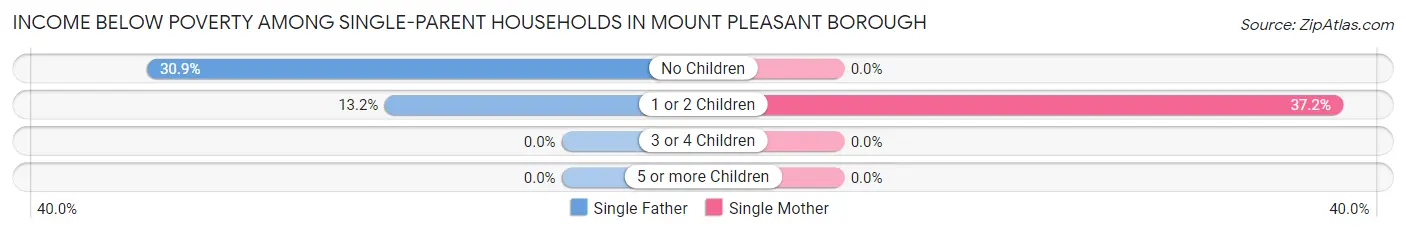
| Children | Single Father | Single Mother |
| No Children | 21 (30.9%) | 0 (0.0%) |
| 1 or 2 Children | 7 (13.2%) | 29 (37.2%) |
| 3 or 4 Children | 0 (0.0%) | 0 (0.0%) |
| 5 or more Children | 0 (0.0%) | 0 (0.0%) |
| Total | 28 (23.1%) | 29 (11.2%) |
Income Below Poverty Among Married-Couple vs Single-Parent Households in Mount Pleasant borough
The poverty data for Mount Pleasant borough shows that 21 of the married-couple family households (2.7%) and 57 of the single-parent households (15.0%) are living below the poverty level. Within the married-couple family households, those with 3 or 4 children have the highest poverty rate, with 2 households (4.4%) falling below the poverty line. Among the single-parent households, those with 1 or 2 children have the highest poverty rate, with 36 household (27.5%) living below poverty.
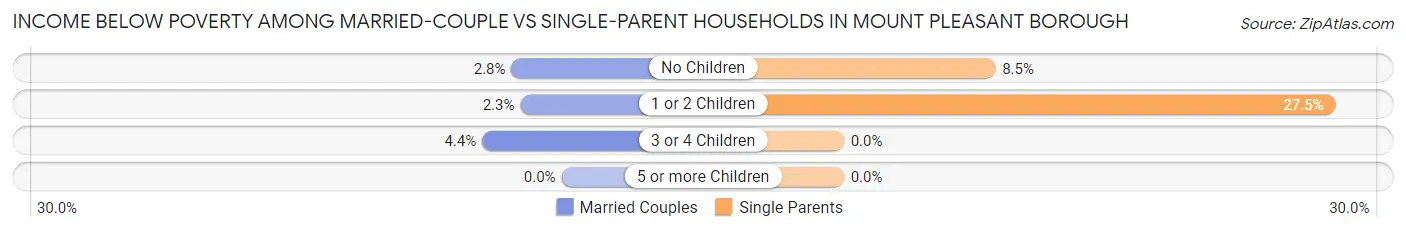
| Children | Married-Couple Families | Single-Parent Households |
| No Children | 13 (2.8%) | 21 (8.5%) |
| 1 or 2 Children | 6 (2.3%) | 36 (27.5%) |
| 3 or 4 Children | 2 (4.4%) | 0 (0.0%) |
| 5 or more Children | 0 (0.0%) | 0 (0.0%) |
| Total | 21 (2.7%) | 57 (15.0%) |
Race in Mount Pleasant borough
The most populous races in Mount Pleasant borough are White / Caucasian (4,133 | 97.4%), Black / African American (72 | 1.7%), and Two or more Races (31 | 0.7%).
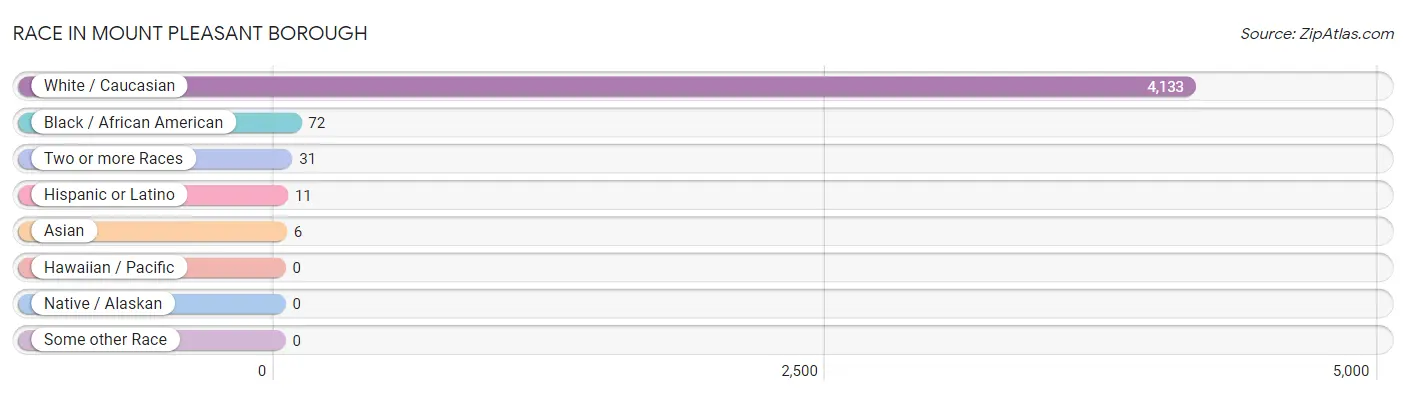
| Race | # Population | % Population |
| Asian | 6 | 0.1% |
| Black / African American | 72 | 1.7% |
| Hawaiian / Pacific | 0 | 0.0% |
| Hispanic or Latino | 11 | 0.3% |
| Native / Alaskan | 0 | 0.0% |
| White / Caucasian | 4,133 | 97.4% |
| Two or more Races | 31 | 0.7% |
| Some other Race | 0 | 0.0% |
| Total | 4,242 | 100.0% |
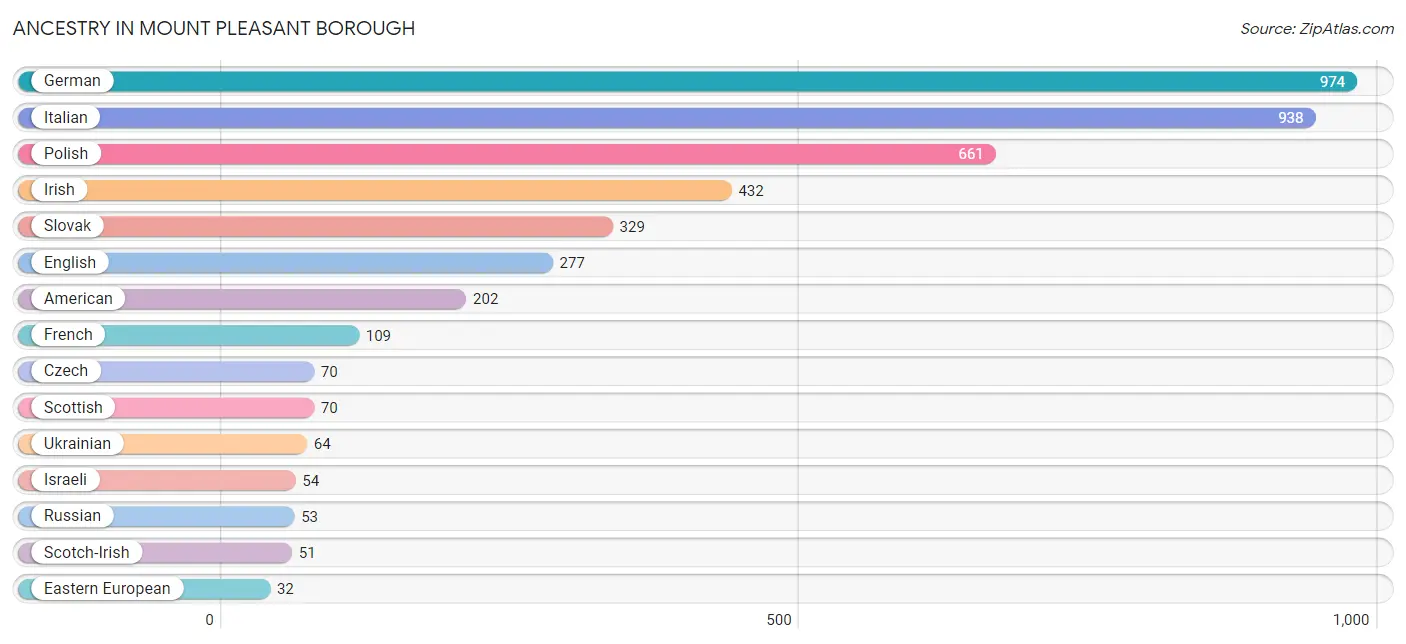
Ancestry in Mount Pleasant borough
The most populous ancestries reported in Mount Pleasant borough are German (974 | 23.0%), Italian (938 | 22.1%), Polish (661 | 15.6%), Irish (432 | 10.2%), and Slovak (329 | 7.8%), together accounting for 78.6% of all Mount Pleasant borough residents.
| Ancestry | # Population | % Population |
| American | 202 | 4.8% |
| Arab | 25 | 0.6% |
| Austrian | 15 | 0.4% |
| British | 18 | 0.4% |
| Canadian | 8 | 0.2% |
| Carpatho Rusyn | 23 | 0.5% |
| Cherokee | 4 | 0.1% |
| Croatian | 7 | 0.2% |
| Czech | 70 | 1.7% |
| Czechoslovakian | 11 | 0.3% |
| Dutch | 31 | 0.7% |
| Eastern European | 32 | 0.7% |
| English | 277 | 6.5% |
| European | 9 | 0.2% |
| French | 109 | 2.6% |
| German | 974 | 23.0% |
| Hungarian | 28 | 0.7% |
| Irish | 432 | 10.2% |
| Israeli | 54 | 1.3% |
| Italian | 938 | 22.1% |
| Korean | 6 | 0.1% |
| Lebanese | 18 | 0.4% |
| Lithuanian | 5 | 0.1% |
| Native Hawaiian | 11 | 0.3% |
| Norwegian | 15 | 0.4% |
| Pennsylvania German | 13 | 0.3% |
| Polish | 661 | 15.6% |
| Romanian | 20 | 0.5% |
| Russian | 53 | 1.3% |
| Scotch-Irish | 51 | 1.2% |
| Scottish | 70 | 1.7% |
| Serbian | 9 | 0.2% |
| Slavic | 28 | 0.7% |
| Slovak | 329 | 7.8% |
| Swedish | 13 | 0.3% |
| Swiss | 9 | 0.2% |
| Ukrainian | 64 | 1.5% |
| Welsh | 8 | 0.2% | View All 38 Rows |
Immigrants in Mount Pleasant borough
The most numerous immigrant groups reported in Mount Pleasant borough came from Europe (36 | 0.9%), Eastern Europe (20 | 0.5%), Romania (20 | 0.5%), Northern Europe (16 | 0.4%), and Canada (8 | 0.2%), together accounting for 2.4% of all Mount Pleasant borough residents.
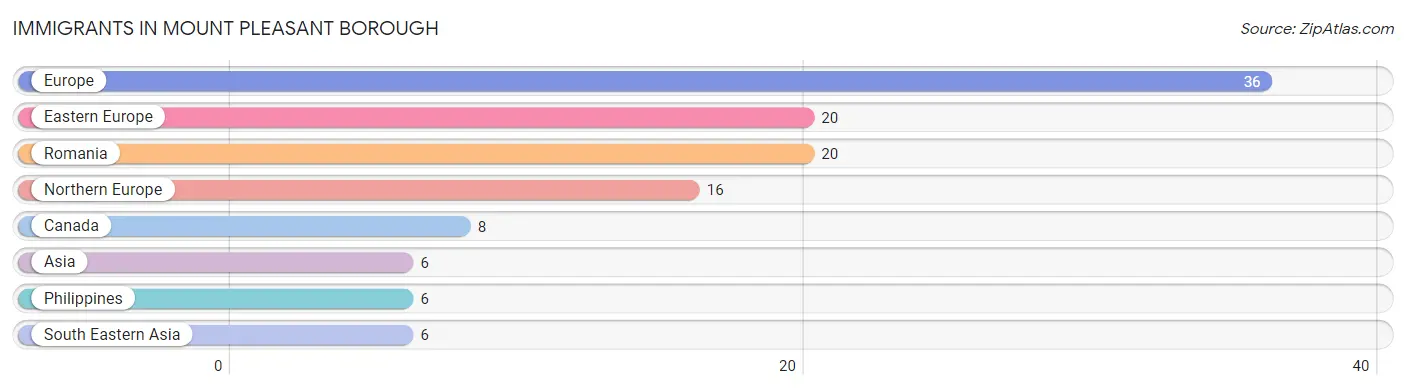
| Immigration Origin | # Population | % Population |
| Asia | 6 | 0.1% |
| Canada | 8 | 0.2% |
| Eastern Europe | 20 | 0.5% |
| Europe | 36 | 0.9% |
| Northern Europe | 16 | 0.4% |
| Philippines | 6 | 0.1% |
| Romania | 20 | 0.5% |
| South Eastern Asia | 6 | 0.1% | View All 8 Rows |
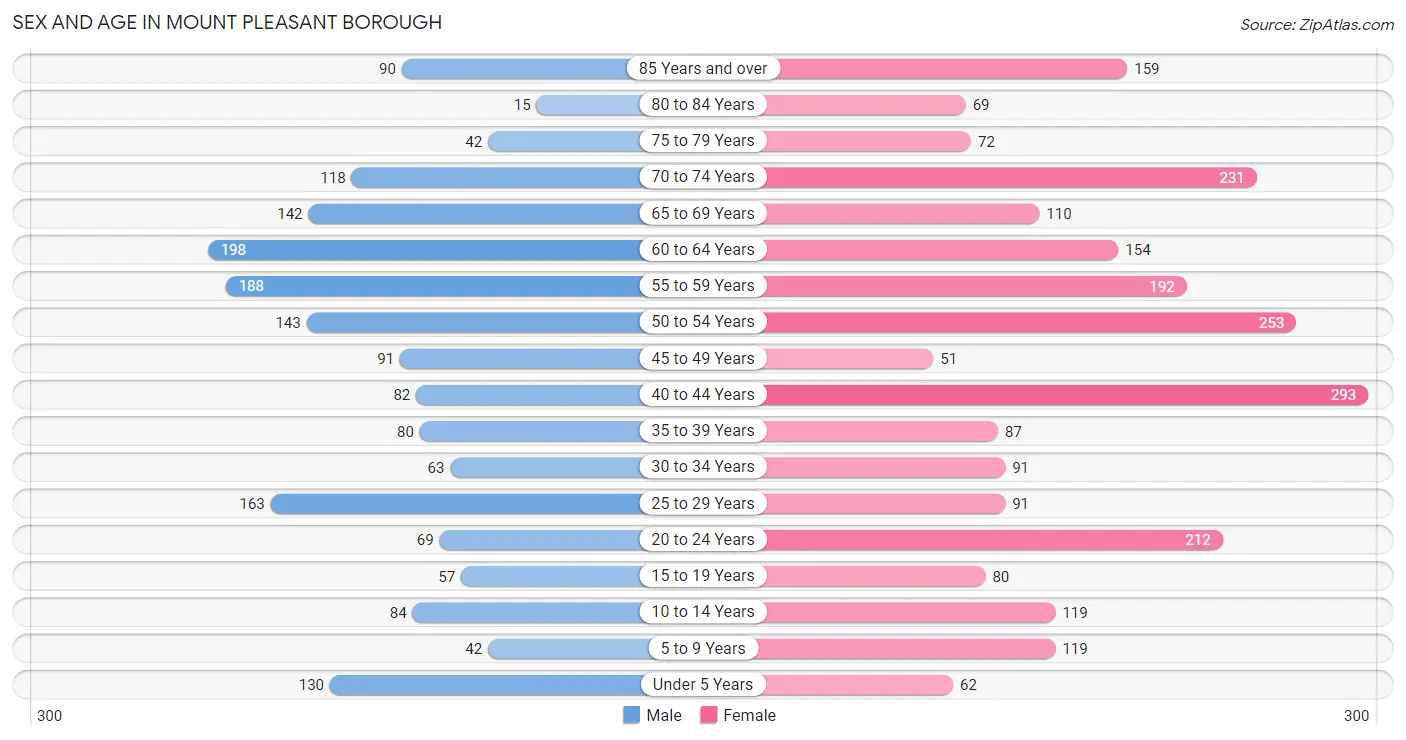
Sex and Age in Mount Pleasant borough
Sex and Age in Mount Pleasant borough
The most populous age groups in Mount Pleasant borough are 60 to 64 Years (198 | 11.0%) for men and 40 to 44 Years (293 | 12.0%) for women.
| Age Bracket | Male | Female |
| Under 5 Years | 130 (7.2%) | 62 (2.5%) |
| 5 to 9 Years | 42 (2.3%) | 119 (4.9%) |
| 10 to 14 Years | 84 (4.7%) | 119 (4.9%) |
| 15 to 19 Years | 57 (3.2%) | 80 (3.3%) |
| 20 to 24 Years | 69 (3.8%) | 212 (8.7%) |
| 25 to 29 Years | 163 (9.1%) | 91 (3.7%) |
| 30 to 34 Years | 63 (3.5%) | 91 (3.7%) |
| 35 to 39 Years | 80 (4.4%) | 87 (3.6%) |
| 40 to 44 Years | 82 (4.6%) | 293 (12.0%) |
| 45 to 49 Years | 91 (5.1%) | 51 (2.1%) |
| 50 to 54 Years | 143 (8.0%) | 253 (10.3%) |
| 55 to 59 Years | 188 (10.5%) | 192 (7.9%) |
| 60 to 64 Years | 198 (11.0%) | 154 (6.3%) |
| 65 to 69 Years | 142 (7.9%) | 110 (4.5%) |
| 70 to 74 Years | 118 (6.6%) | 231 (9.5%) |
| 75 to 79 Years | 42 (2.3%) | 72 (2.9%) |
| 80 to 84 Years | 15 (0.8%) | 69 (2.8%) |
| 85 Years and over | 90 (5.0%) | 159 (6.5%) |
| Total | 1,797 (100.0%) | 2,445 (100.0%) |
Families and Households in Mount Pleasant borough
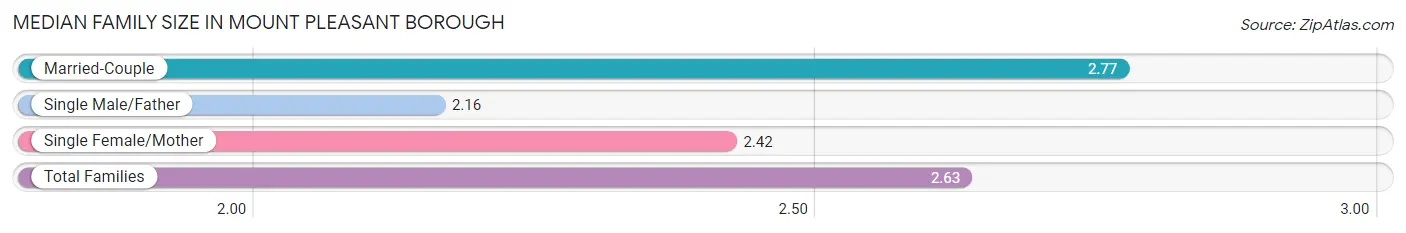
Median Family Size in Mount Pleasant borough
The median family size in Mount Pleasant borough is 2.63 persons per family, with married-couple families (771 | 67.0%) accounting for the largest median family size of 2.77 persons per family. On the other hand, single male/father families (121 | 10.5%) represent the smallest median family size with 2.16 persons per family.
| Family Type | # Families | Family Size |
| Married-Couple | 771 (67.0%) | 2.77 |
| Single Male/Father | 121 (10.5%) | 2.16 |
| Single Female/Mother | 258 (22.4%) | 2.42 |
| Total Families | 1,150 (100.0%) | 2.63 |
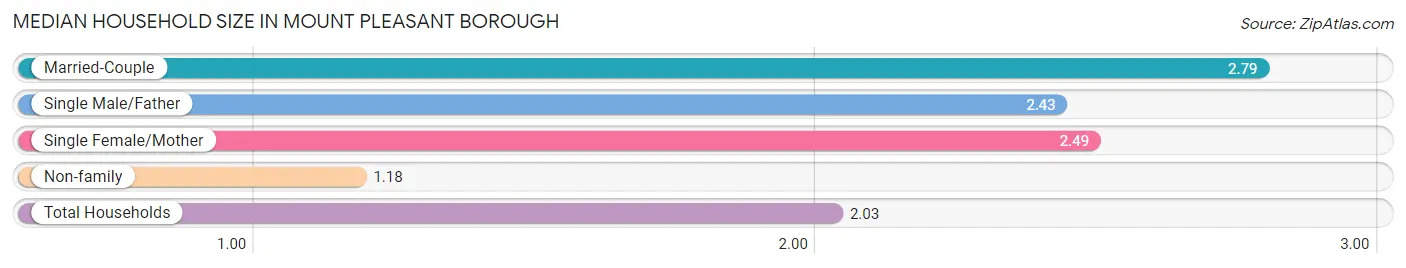
Median Household Size in Mount Pleasant borough
The median household size in Mount Pleasant borough is 2.03 persons per household, with married-couple households (771 | 37.8%) accounting for the largest median household size of 2.79 persons per household. non-family households (891 | 43.7%) represent the smallest median household size with 1.18 persons per household.
| Household Type | # Households | Household Size |
| Married-Couple | 771 (37.8%) | 2.79 |
| Single Male/Father | 121 (5.9%) | 2.43 |
| Single Female/Mother | 258 (12.6%) | 2.49 |
| Non-family | 891 (43.7%) | 1.18 |
| Total Households | 2,041 (100.0%) | 2.03 |
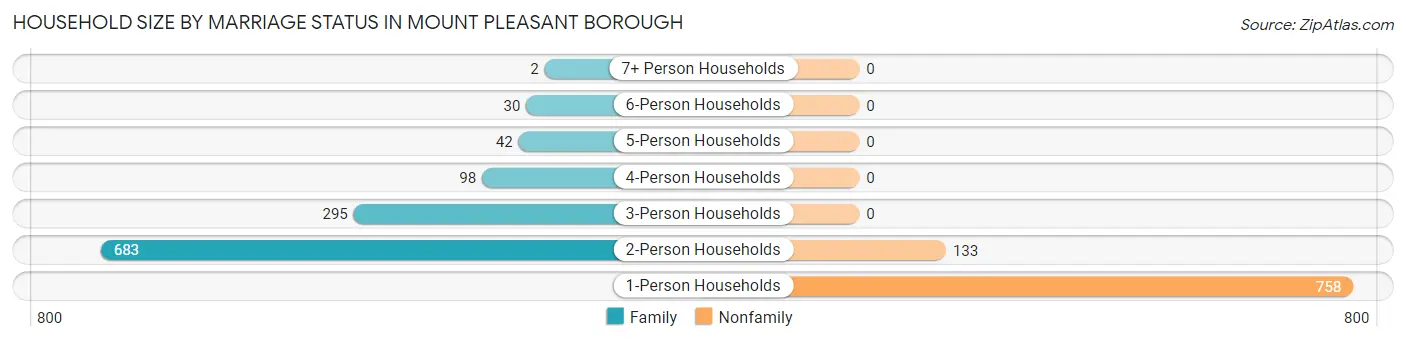
Household Size by Marriage Status in Mount Pleasant borough
Out of a total of 2,041 households in Mount Pleasant borough, 1,150 (56.3%) are family households, while 891 (43.7%) are nonfamily households. The most numerous type of family households are 2-person households, comprising 683, and the most common type of nonfamily households are 1-person households, comprising 758.
| Household Size | Family Households | Nonfamily Households |
| 1-Person Households | - | 758 (37.1%) |
| 2-Person Households | 683 (33.5%) | 133 (6.5%) |
| 3-Person Households | 295 (14.4%) | 0 (0.0%) |
| 4-Person Households | 98 (4.8%) | 0 (0.0%) |
| 5-Person Households | 42 (2.1%) | 0 (0.0%) |
| 6-Person Households | 30 (1.5%) | 0 (0.0%) |
| 7+ Person Households | 2 (0.1%) | 0 (0.0%) |
| Total | 1,150 (56.3%) | 891 (43.7%) |
Female Fertility in Mount Pleasant borough
Fertility by Age in Mount Pleasant borough
Average fertility rate in Mount Pleasant borough is 69.0 births per 1,000 women. Women in the age bracket of 20 to 34 years have the highest fertility rate with 91.0 births per 1,000 women. Women in the age bracket of 20 to 34 years acount for 56.2% of all women with births.
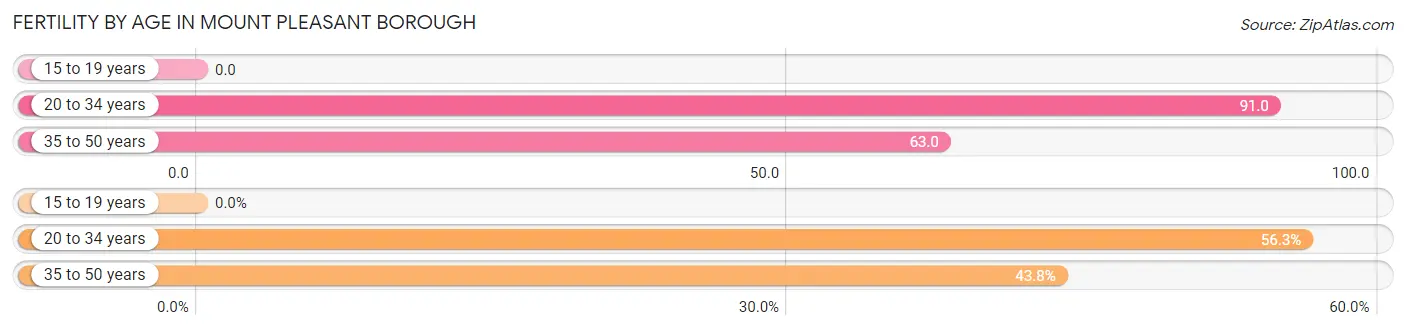
| Age Bracket | Women with Births | Births / 1,000 Women |
| 15 to 19 years | 0 (0.0%) | 0.0 |
| 20 to 34 years | 36 (56.2%) | 91.0 |
| 35 to 50 years | 28 (43.8%) | 63.0 |
| Total | 64 (100.0%) | 69.0 |
Fertility by Age by Marriage Status in Mount Pleasant borough
92.2% of women with births (64) in Mount Pleasant borough are married. The highest percentage of unmarried women with births falls into 20 to 34 years age bracket with 13.9% of them unmarried at the time of birth, while the lowest percentage of unmarried women with births belong to 35 to 50 years age bracket with 0.0% of them unmarried.
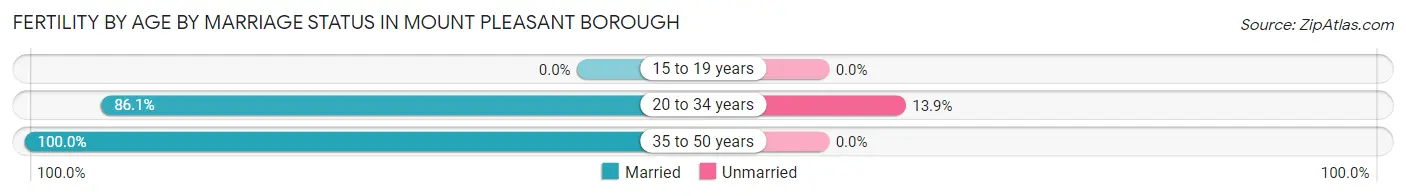
| Age Bracket | Married | Unmarried |
| 15 to 19 years | 0 (0.0%) | 0 (0.0%) |
| 20 to 34 years | 31 (86.1%) | 5 (13.9%) |
| 35 to 50 years | 28 (100.0%) | 0 (0.0%) |
| Total | 59 (92.2%) | 5 (7.8%) |
Fertility by Education in Mount Pleasant borough
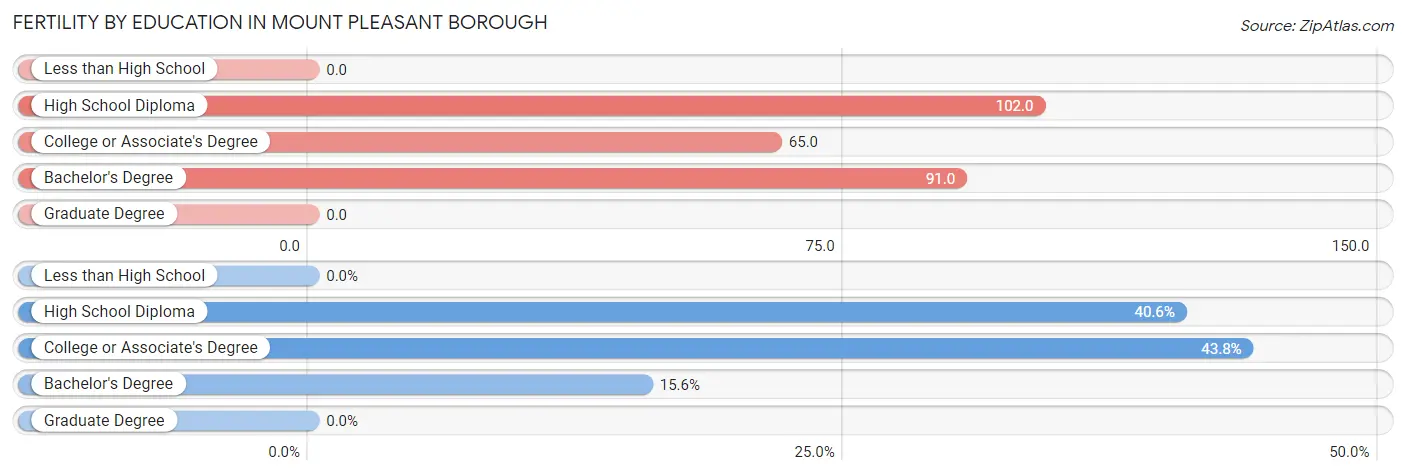
| Educational Attainment | Women with Births | Births / 1,000 Women |
| Less than High School | 0 (0.0%) | 0.0 |
| High School Diploma | 26 (40.6%) | 102.0 |
| College or Associate's Degree | 28 (43.8%) | 65.0 |
| Bachelor's Degree | 10 (15.6%) | 91.0 |
| Graduate Degree | 0 (0.0%) | 0.0 |
| Total | 64 (100.0%) | 69.0 |
Fertility by Education by Marriage Status in Mount Pleasant borough
7.8% of women with births in Mount Pleasant borough are unmarried. Women with the educational attainment of college or associate's degree are most likely to be married with 100.0% of them married at childbirth, while women with the educational attainment of high school diploma are least likely to be married with 19.2% of them unmarried at childbirth.
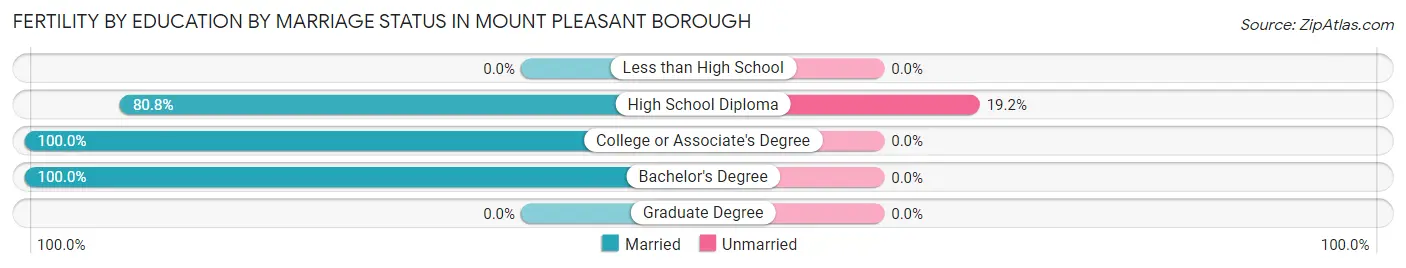
| Educational Attainment | Married | Unmarried |
| Less than High School | 0 (0.0%) | 0 (0.0%) |
| High School Diploma | 21 (80.8%) | 5 (19.2%) |
| College or Associate's Degree | 28 (100.0%) | 0 (0.0%) |
| Bachelor's Degree | 10 (100.0%) | 0 (0.0%) |
| Graduate Degree | 0 (0.0%) | 0 (0.0%) |
| Total | 59 (92.2%) | 5 (7.8%) |
Employment Characteristics in Mount Pleasant borough
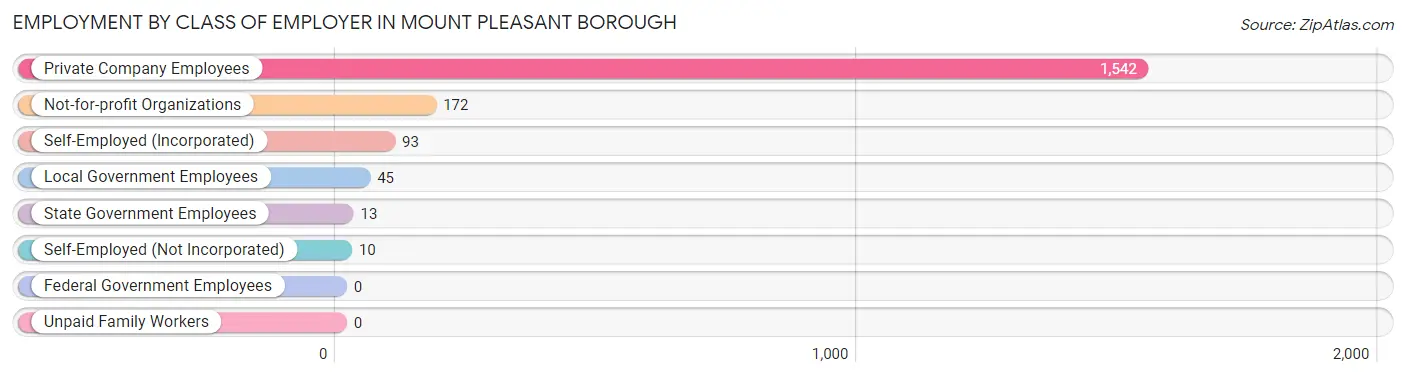
Employment by Class of Employer in Mount Pleasant borough
Among the 1,875 employed individuals in Mount Pleasant borough, private company employees (1,542 | 82.2%), not-for-profit organizations (172 | 9.2%), and self-employed (incorporated) (93 | 5.0%) make up the most common classes of employment.
| Employer Class | # Employees | % Employees |
| Private Company Employees | 1,542 | 82.2% |
| Self-Employed (Incorporated) | 93 | 5.0% |
| Self-Employed (Not Incorporated) | 10 | 0.5% |
| Not-for-profit Organizations | 172 | 9.2% |
| Local Government Employees | 45 | 2.4% |
| State Government Employees | 13 | 0.7% |
| Federal Government Employees | 0 | 0.0% |
| Unpaid Family Workers | 0 | 0.0% |
| Total | 1,875 | 100.0% |
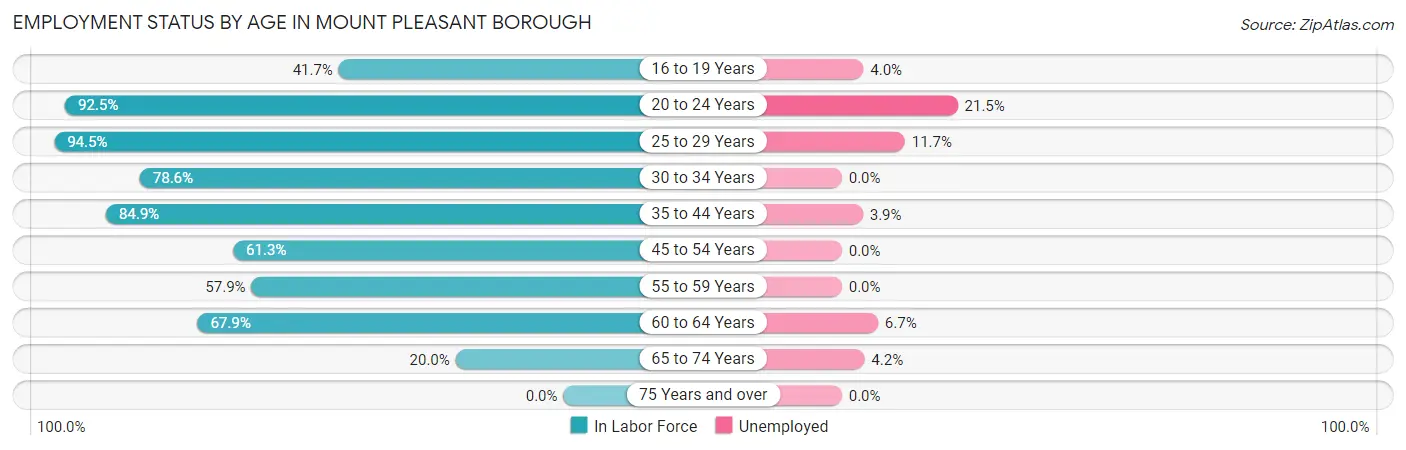
Employment Status by Age in Mount Pleasant borough
According to the labor force statistics for Mount Pleasant borough, out of the total population over 16 years of age (3,669), 55.6% or 2,040 individuals are in the labor force, with 6.1% or 124 of them unemployed. The age group with the highest labor force participation rate is 25 to 29 years, with 94.5% or 240 individuals in the labor force. Within the labor force, the 20 to 24 years age range has the highest percentage of unemployed individuals, with 21.5% or 56 of them being unemployed.
| Age Bracket | In Labor Force | Unemployed |
| 16 to 19 Years | 50 (41.7%) | 2 (4.0%) |
| 20 to 24 Years | 260 (92.5%) | 56 (21.5%) |
| 25 to 29 Years | 240 (94.5%) | 28 (11.7%) |
| 30 to 34 Years | 121 (78.6%) | 0 (0.0%) |
| 35 to 44 Years | 460 (84.9%) | 18 (3.9%) |
| 45 to 54 Years | 330 (61.3%) | 0 (0.0%) |
| 55 to 59 Years | 220 (57.9%) | 0 (0.0%) |
| 60 to 64 Years | 239 (67.9%) | 16 (6.7%) |
| 65 to 74 Years | 120 (20.0%) | 5 (4.2%) |
| 75 Years and over | 0 (0.0%) | 0 (0.0%) |
| Total | 2,040 (55.6%) | 124 (6.1%) |
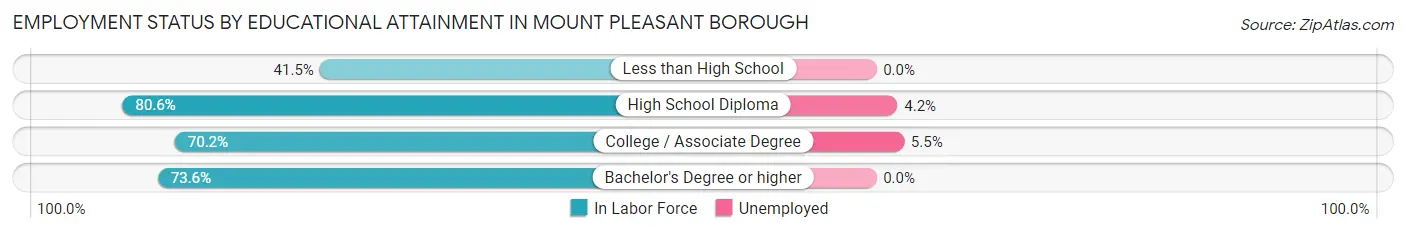
Employment Status by Educational Attainment in Mount Pleasant borough
According to labor force statistics for Mount Pleasant borough, 72.5% of individuals (1,610) out of the total population between 25 and 64 years of age (2,220) are in the labor force, with 3.9% or 63 of them being unemployed. The group with the highest labor force participation rate are those with the educational attainment of high school diploma, with 80.6% or 527 individuals in the labor force. Within the labor force, individuals with college / associate degree education have the highest percentage of unemployment, with 5.5% or 40 of them being unemployed.
| Educational Attainment | In Labor Force | Unemployed |
| Less than High School | 44 (41.5%) | 0 (0.0%) |
| High School Diploma | 527 (80.6%) | 27 (4.2%) |
| College / Associate Degree | 724 (70.2%) | 57 (5.5%) |
| Bachelor's Degree or higher | 315 (73.6%) | 0 (0.0%) |
| Total | 1,610 (72.5%) | 87 (3.9%) |
Employment Occupations by Sex in Mount Pleasant borough
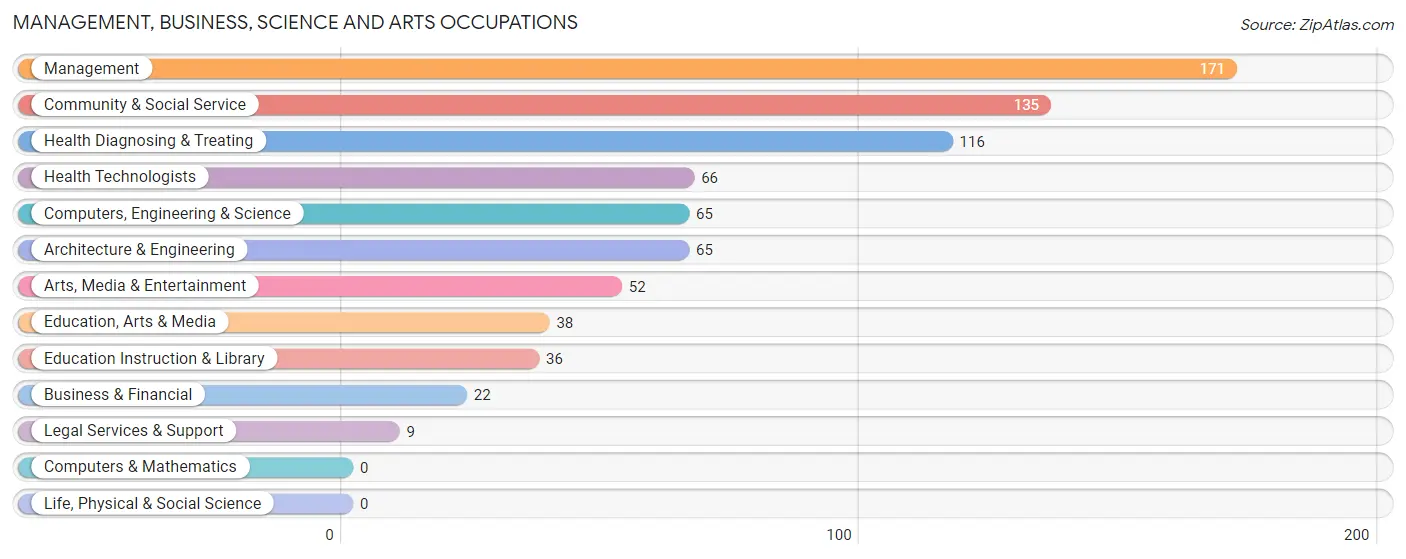
Management, Business, Science and Arts Occupations
The most common Management, Business, Science and Arts occupations in Mount Pleasant borough are Management (171 | 8.9%), Community & Social Service (135 | 7.0%), Health Diagnosing & Treating (116 | 6.1%), Health Technologists (66 | 3.5%), and Computers, Engineering & Science (65 | 3.4%).
Management, Business, Science and Arts Occupations by Sex
Within the Management, Business, Science and Arts occupations in Mount Pleasant borough, the most male-oriented occupations are Legal Services & Support (100.0%), Computers, Engineering & Science (63.1%), and Architecture & Engineering (63.1%), while the most female-oriented occupations are Business & Financial (100.0%), Education Instruction & Library (100.0%), and Health Diagnosing & Treating (81.0%).
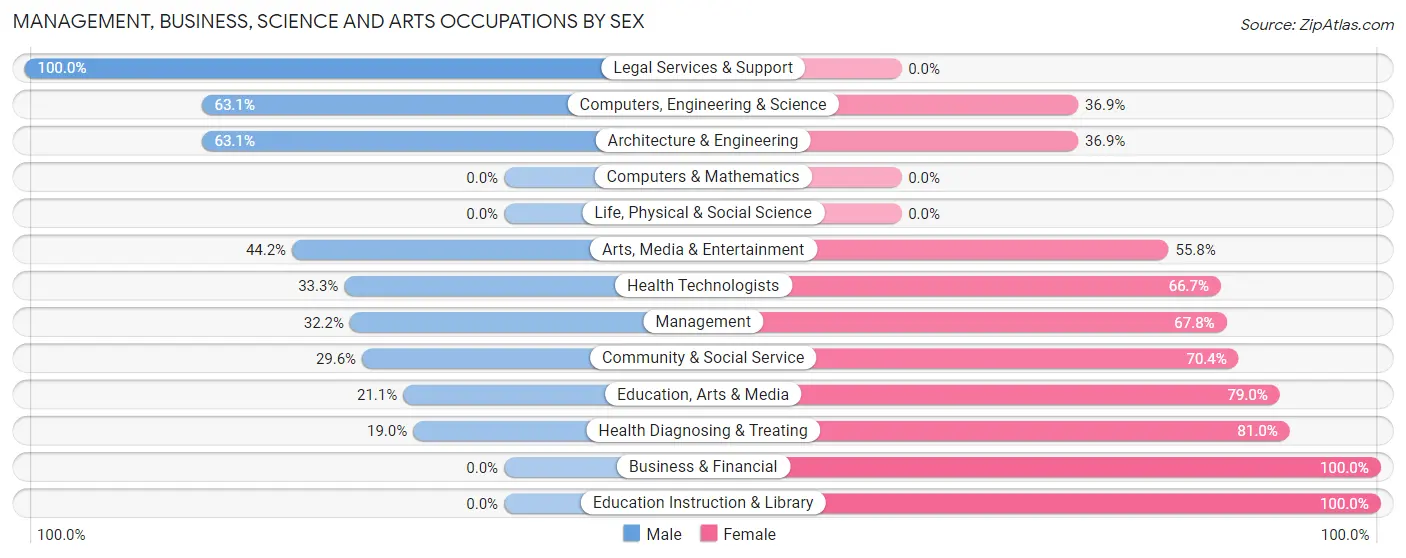
| Occupation | Male | Female |
| Management | 55 (32.2%) | 116 (67.8%) |
| Business & Financial | 0 (0.0%) | 22 (100.0%) |
| Computers, Engineering & Science | 41 (63.1%) | 24 (36.9%) |
| Computers & Mathematics | 0 (0.0%) | 0 (0.0%) |
| Architecture & Engineering | 41 (63.1%) | 24 (36.9%) |
| Life, Physical & Social Science | 0 (0.0%) | 0 (0.0%) |
| Community & Social Service | 40 (29.6%) | 95 (70.4%) |
| Education, Arts & Media | 8 (21.0%) | 30 (78.9%) |
| Legal Services & Support | 9 (100.0%) | 0 (0.0%) |
| Education Instruction & Library | 0 (0.0%) | 36 (100.0%) |
| Arts, Media & Entertainment | 23 (44.2%) | 29 (55.8%) |
| Health Diagnosing & Treating | 22 (19.0%) | 94 (81.0%) |
| Health Technologists | 22 (33.3%) | 44 (66.7%) |
| Total (Category) | 158 (31.0%) | 351 (69.0%) |
| Total (Overall) | 901 (47.0%) | 1,014 (52.9%) |
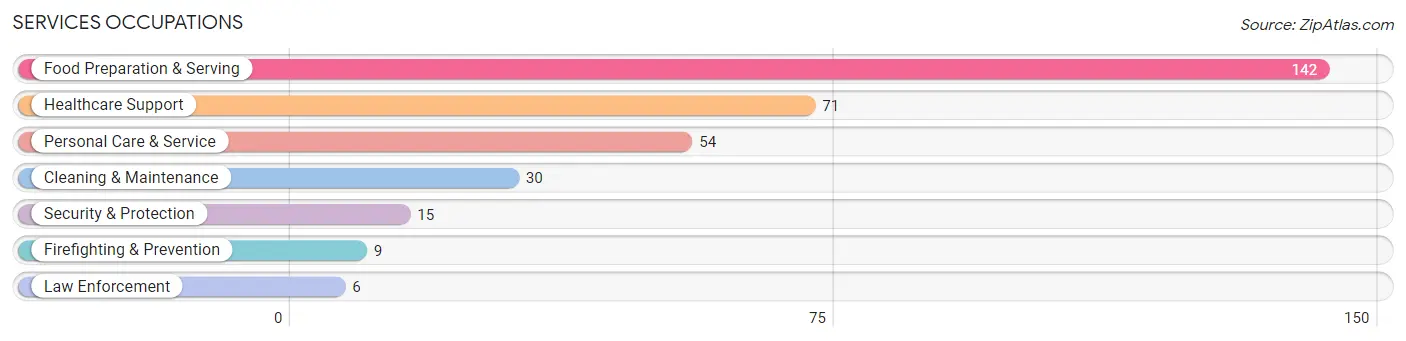
Services Occupations
The most common Services occupations in Mount Pleasant borough are Food Preparation & Serving (142 | 7.4%), Healthcare Support (71 | 3.7%), Personal Care & Service (54 | 2.8%), Cleaning & Maintenance (30 | 1.6%), and Security & Protection (15 | 0.8%).
Services Occupations by Sex
Within the Services occupations in Mount Pleasant borough, the most male-oriented occupations are Security & Protection (100.0%), Firefighting & Prevention (100.0%), and Law Enforcement (100.0%), while the most female-oriented occupations are Healthcare Support (100.0%), Personal Care & Service (100.0%), and Food Preparation & Serving (60.6%).
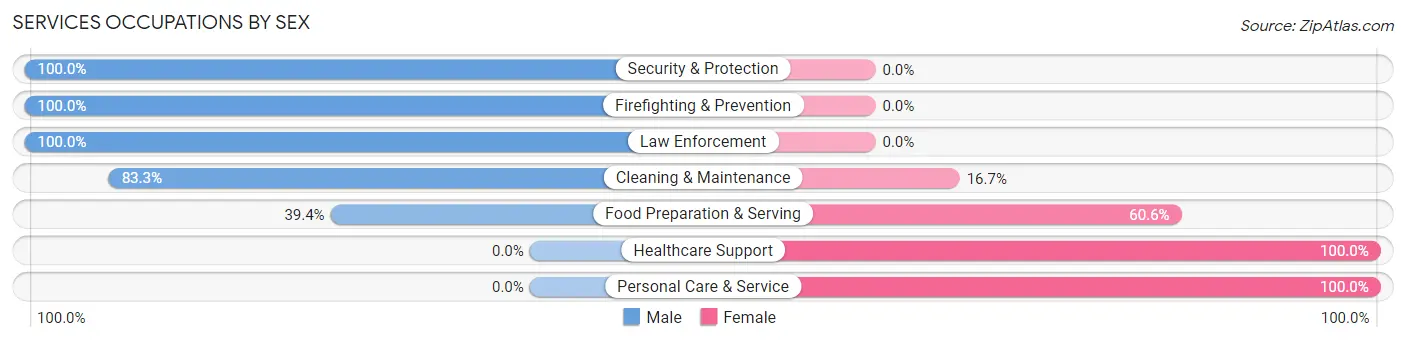
| Occupation | Male | Female |
| Healthcare Support | 0 (0.0%) | 71 (100.0%) |
| Security & Protection | 15 (100.0%) | 0 (0.0%) |
| Firefighting & Prevention | 9 (100.0%) | 0 (0.0%) |
| Law Enforcement | 6 (100.0%) | 0 (0.0%) |
| Food Preparation & Serving | 56 (39.4%) | 86 (60.6%) |
| Cleaning & Maintenance | 25 (83.3%) | 5 (16.7%) |
| Personal Care & Service | 0 (0.0%) | 54 (100.0%) |
| Total (Category) | 96 (30.8%) | 216 (69.2%) |
| Total (Overall) | 901 (47.0%) | 1,014 (52.9%) |
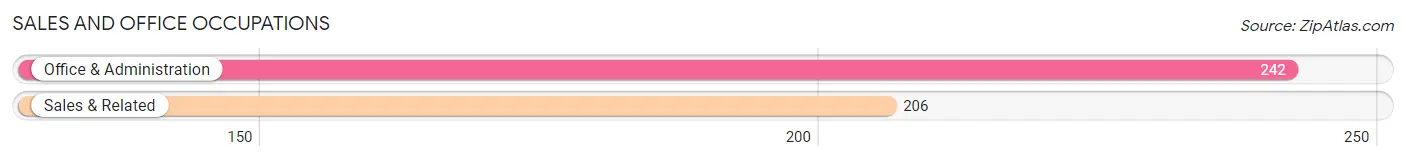
Sales and Office Occupations
The most common Sales and Office occupations in Mount Pleasant borough are Office & Administration (242 | 12.6%), and Sales & Related (206 | 10.8%).
Sales and Office Occupations by Sex
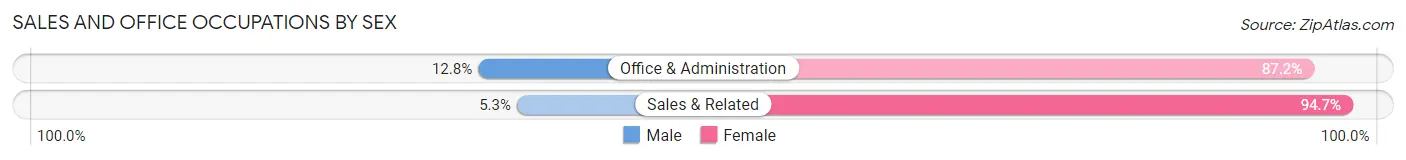
| Occupation | Male | Female |
| Sales & Related | 11 (5.3%) | 195 (94.7%) |
| Office & Administration | 31 (12.8%) | 211 (87.2%) |
| Total (Category) | 42 (9.4%) | 406 (90.6%) |
| Total (Overall) | 901 (47.0%) | 1,014 (52.9%) |
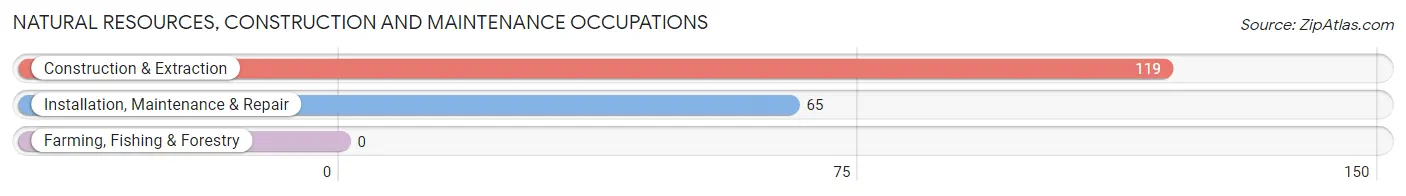
Natural Resources, Construction and Maintenance Occupations
The most common Natural Resources, Construction and Maintenance occupations in Mount Pleasant borough are Construction & Extraction (119 | 6.2%), and Installation, Maintenance & Repair (65 | 3.4%).
Natural Resources, Construction and Maintenance Occupations by Sex
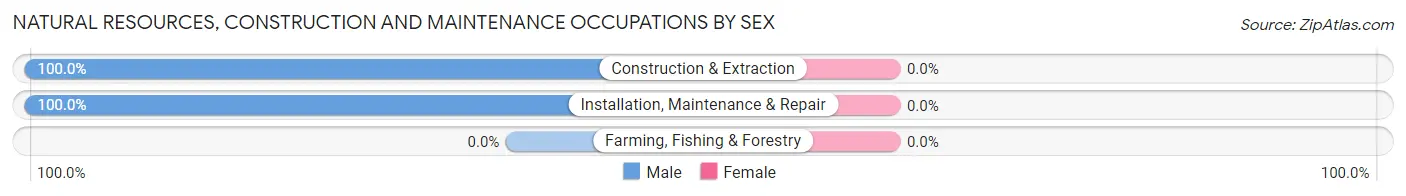
| Occupation | Male | Female |
| Farming, Fishing & Forestry | 0 (0.0%) | 0 (0.0%) |
| Construction & Extraction | 119 (100.0%) | 0 (0.0%) |
| Installation, Maintenance & Repair | 65 (100.0%) | 0 (0.0%) |
| Total (Category) | 184 (100.0%) | 0 (0.0%) |
| Total (Overall) | 901 (47.0%) | 1,014 (52.9%) |
Production, Transportation and Moving Occupations
The most common Production, Transportation and Moving occupations in Mount Pleasant borough are Material Moving (195 | 10.2%), Transportation (157 | 8.2%), and Production (110 | 5.7%).
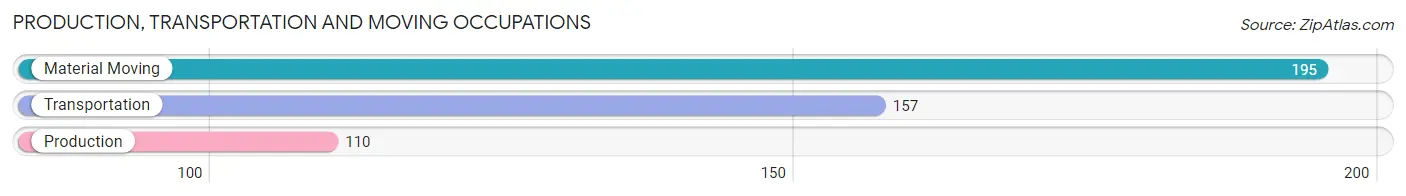
Production, Transportation and Moving Occupations by Sex
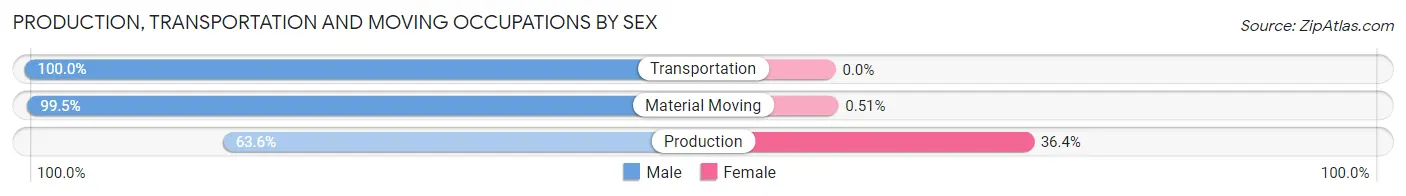
| Occupation | Male | Female |
| Production | 70 (63.6%) | 40 (36.4%) |
| Transportation | 157 (100.0%) | 0 (0.0%) |
| Material Moving | 194 (99.5%) | 1 (0.5%) |
| Total (Category) | 421 (91.1%) | 41 (8.9%) |
| Total (Overall) | 901 (47.0%) | 1,014 (52.9%) |
Employment Industries by Sex in Mount Pleasant borough
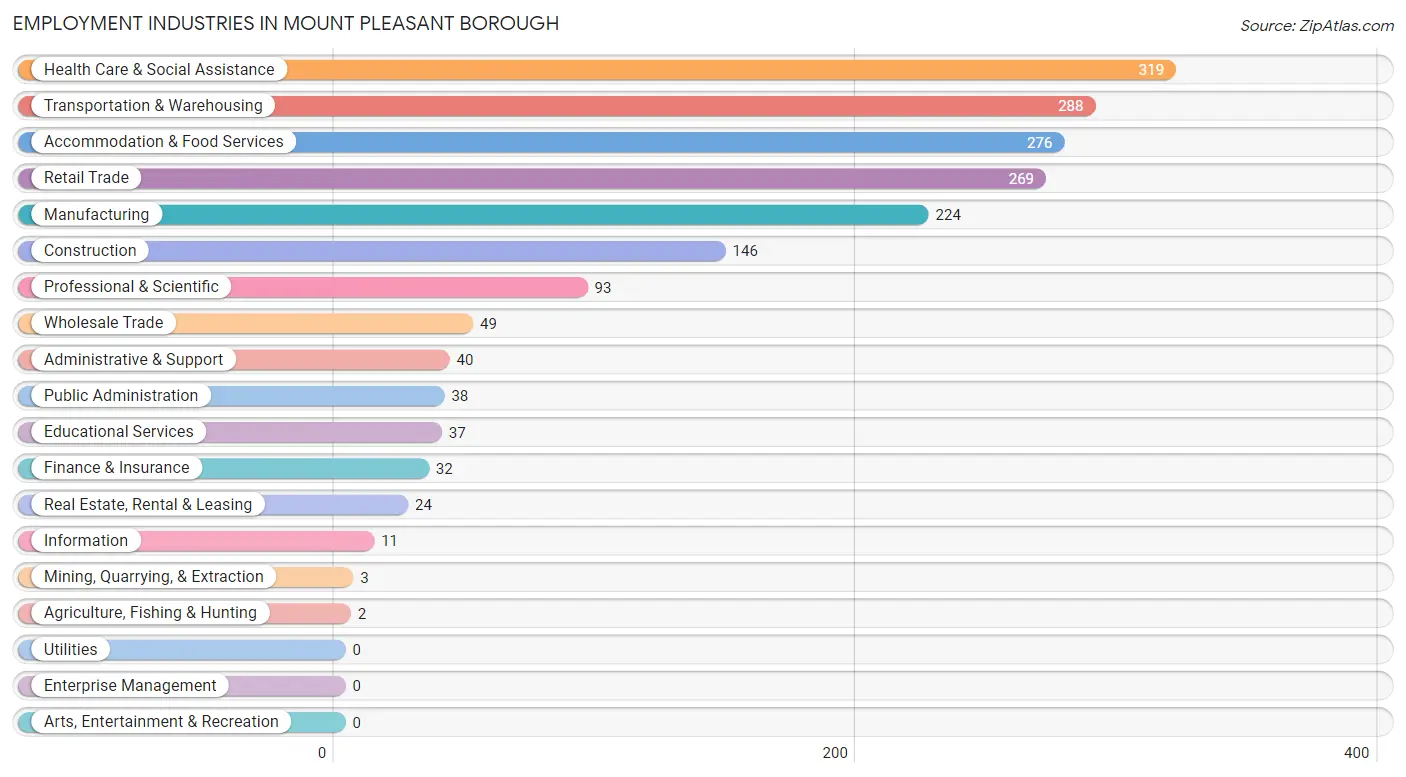
Employment Industries in Mount Pleasant borough
The major employment industries in Mount Pleasant borough include Health Care & Social Assistance (319 | 16.7%), Transportation & Warehousing (288 | 15.0%), Accommodation & Food Services (276 | 14.4%), Retail Trade (269 | 14.1%), and Manufacturing (224 | 11.7%).
Employment Industries by Sex in Mount Pleasant borough
The Mount Pleasant borough industries that see more men than women are Mining, Quarrying, & Extraction (100.0%), Information (100.0%), and Real Estate, Rental & Leasing (100.0%), whereas the industries that tend to have a higher number of women are Agriculture, Fishing & Hunting (100.0%), Educational Services (100.0%), and Health Care & Social Assistance (97.5%).
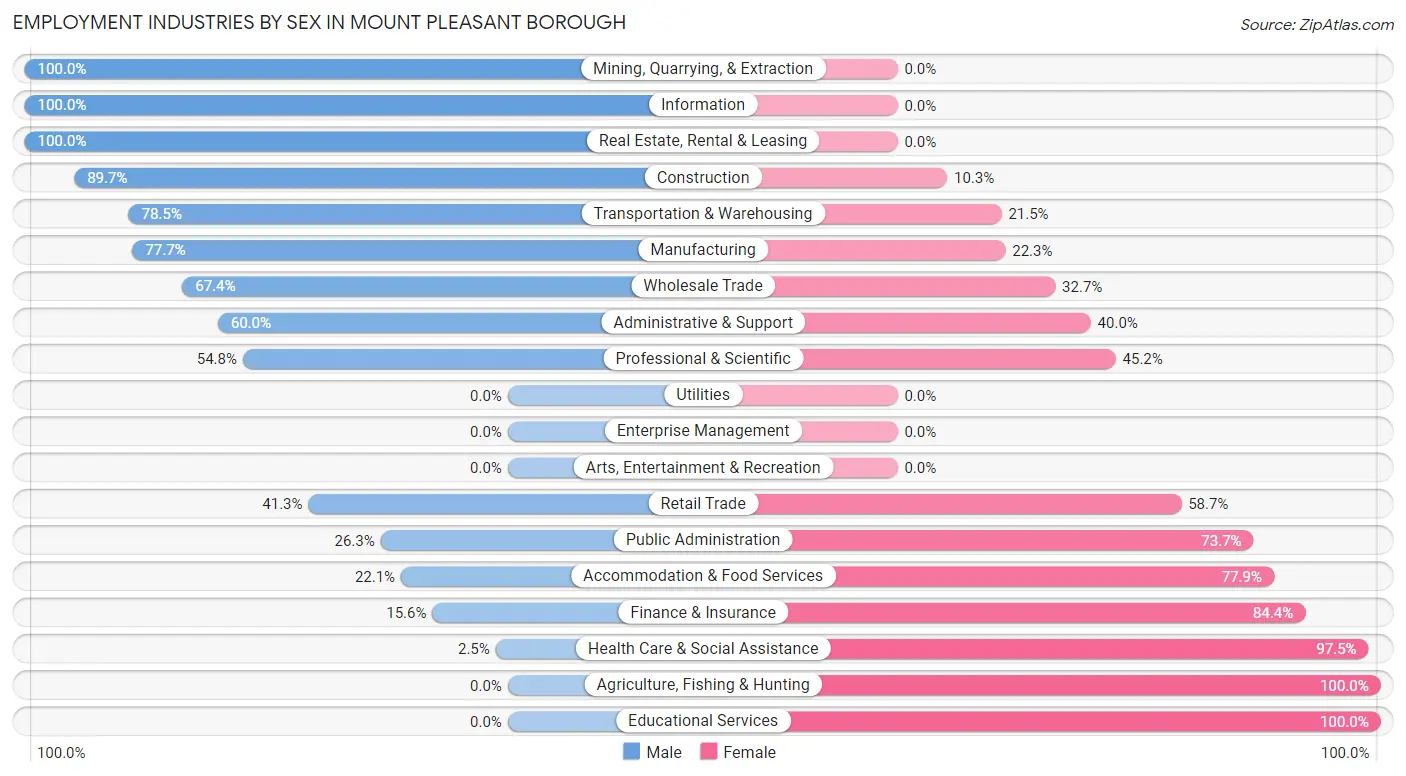
| Industry | Male | Female |
| Agriculture, Fishing & Hunting | 0 (0.0%) | 2 (100.0%) |
| Mining, Quarrying, & Extraction | 3 (100.0%) | 0 (0.0%) |
| Construction | 131 (89.7%) | 15 (10.3%) |
| Manufacturing | 174 (77.7%) | 50 (22.3%) |
| Wholesale Trade | 33 (67.3%) | 16 (32.7%) |
| Retail Trade | 111 (41.3%) | 158 (58.7%) |
| Transportation & Warehousing | 226 (78.5%) | 62 (21.5%) |
| Utilities | 0 (0.0%) | 0 (0.0%) |
| Information | 11 (100.0%) | 0 (0.0%) |
| Finance & Insurance | 5 (15.6%) | 27 (84.4%) |
| Real Estate, Rental & Leasing | 24 (100.0%) | 0 (0.0%) |
| Professional & Scientific | 51 (54.8%) | 42 (45.2%) |
| Enterprise Management | 0 (0.0%) | 0 (0.0%) |
| Administrative & Support | 24 (60.0%) | 16 (40.0%) |
| Educational Services | 0 (0.0%) | 37 (100.0%) |
| Health Care & Social Assistance | 8 (2.5%) | 311 (97.5%) |
| Arts, Entertainment & Recreation | 0 (0.0%) | 0 (0.0%) |
| Accommodation & Food Services | 61 (22.1%) | 215 (77.9%) |
| Public Administration | 10 (26.3%) | 28 (73.7%) |
| Total | 901 (47.0%) | 1,014 (52.9%) |
Education in Mount Pleasant borough
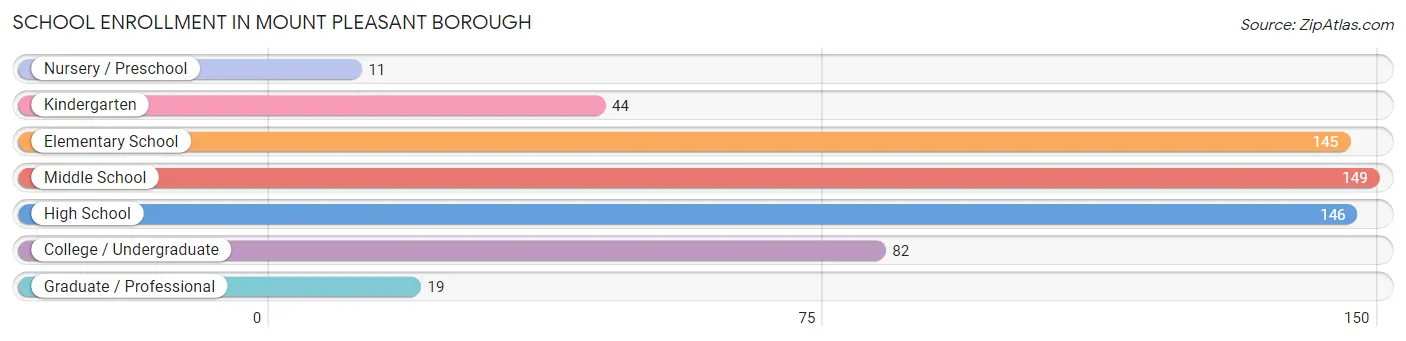
School Enrollment in Mount Pleasant borough
The most common levels of schooling among the 596 students in Mount Pleasant borough are middle school (149 | 25.0%), high school (146 | 24.5%), and elementary school (145 | 24.3%).
| School Level | # Students | % Students |
| Nursery / Preschool | 11 | 1.8% |
| Kindergarten | 44 | 7.4% |
| Elementary School | 145 | 24.3% |
| Middle School | 149 | 25.0% |
| High School | 146 | 24.5% |
| College / Undergraduate | 82 | 13.8% |
| Graduate / Professional | 19 | 3.2% |
| Total | 596 | 100.0% |
School Enrollment by Age by Funding Source in Mount Pleasant borough
Out of a total of 596 students who are enrolled in schools in Mount Pleasant borough, 93 (15.6%) attend a private institution, while the remaining 503 (84.4%) are enrolled in public schools. The age group of 3 to 4 year olds has the highest likelihood of being enrolled in private schools, with 7 (100.0% in the age bracket) enrolled. Conversely, the age group of 10 to 14 year olds has the lowest likelihood of being enrolled in a private school, with 199 (98.0% in the age bracket) attending a public institution.
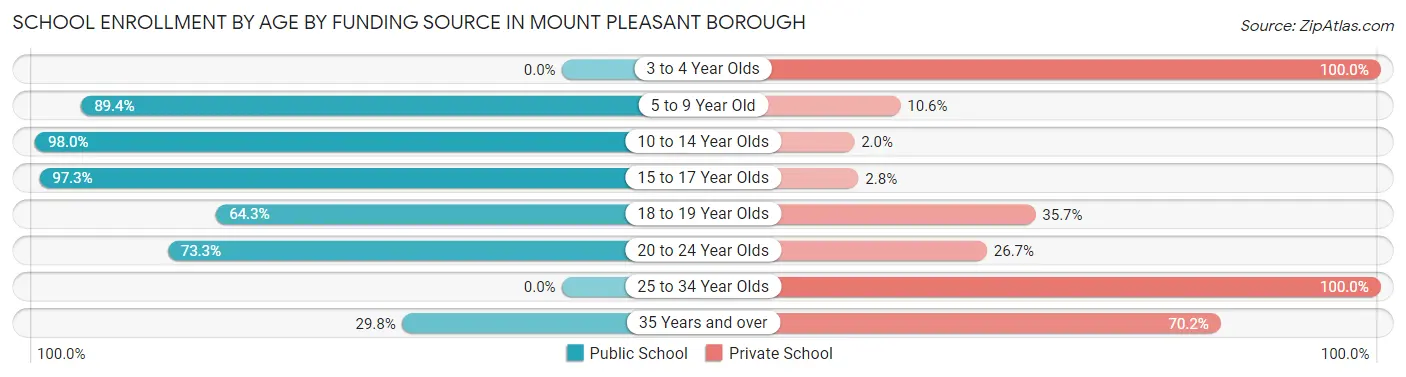
| Age Bracket | Public School | Private School |
| 3 to 4 Year Olds | 0 (0.0%) | 7 (100.0%) |
| 5 to 9 Year Old | 144 (89.4%) | 17 (10.6%) |
| 10 to 14 Year Olds | 199 (98.0%) | 4 (2.0%) |
| 15 to 17 Year Olds | 106 (97.3%) | 3 (2.8%) |
| 18 to 19 Year Olds | 18 (64.3%) | 10 (35.7%) |
| 20 to 24 Year Olds | 22 (73.3%) | 8 (26.7%) |
| 25 to 34 Year Olds | 0 (0.0%) | 11 (100.0%) |
| 35 Years and over | 14 (29.8%) | 33 (70.2%) |
| Total | 503 (84.4%) | 93 (15.6%) |
Educational Attainment by Field of Study in Mount Pleasant borough
Business (134 | 22.1%), psychology (71 | 11.7%), education (69 | 11.4%), engineering (67 | 11.1%), and science & technology (61 | 10.1%) are the most common fields of study among 606 individuals in Mount Pleasant borough who have obtained a bachelor's degree or higher.
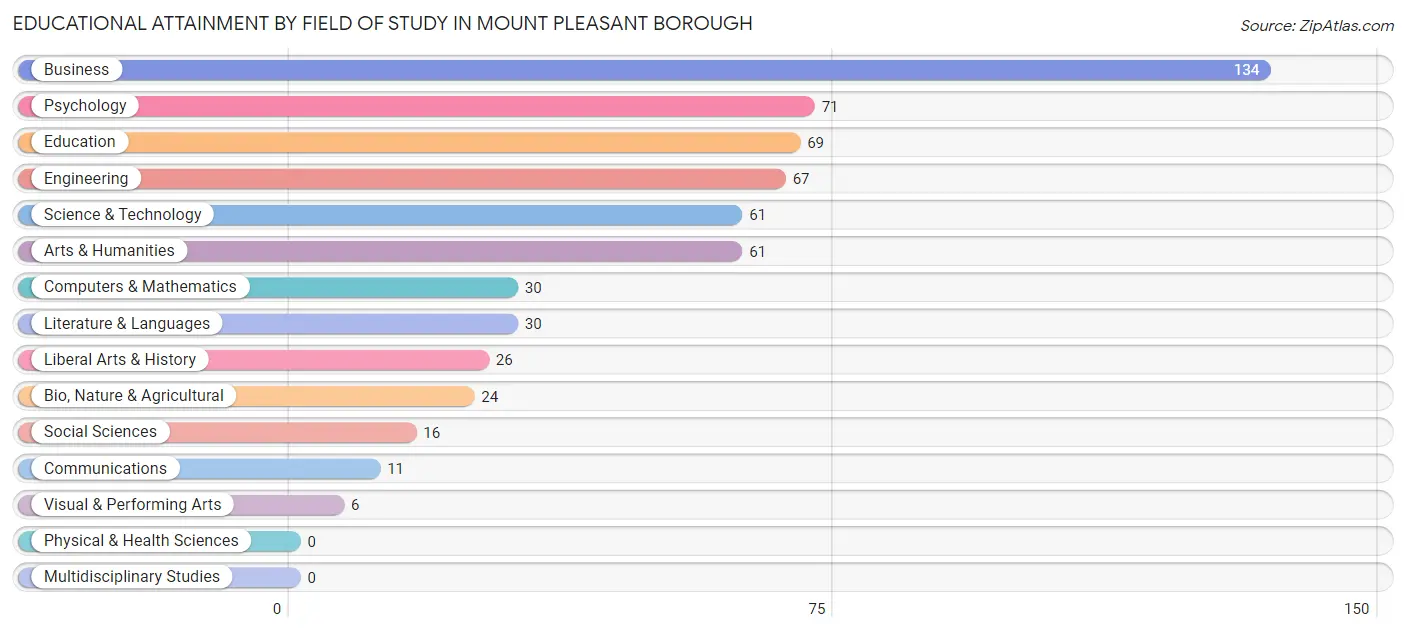
| Field of Study | # Graduates | % Graduates |
| Computers & Mathematics | 30 | 5.0% |
| Bio, Nature & Agricultural | 24 | 4.0% |
| Physical & Health Sciences | 0 | 0.0% |
| Psychology | 71 | 11.7% |
| Social Sciences | 16 | 2.6% |
| Engineering | 67 | 11.1% |
| Multidisciplinary Studies | 0 | 0.0% |
| Science & Technology | 61 | 10.1% |
| Business | 134 | 22.1% |
| Education | 69 | 11.4% |
| Literature & Languages | 30 | 5.0% |
| Liberal Arts & History | 26 | 4.3% |
| Visual & Performing Arts | 6 | 1.0% |
| Communications | 11 | 1.8% |
| Arts & Humanities | 61 | 10.1% |
| Total | 606 | 100.0% |
Transportation & Commute in Mount Pleasant borough
Vehicle Availability by Sex in Mount Pleasant borough
The most prevalent vehicle ownership categories in Mount Pleasant borough are males with 2 vehicles (549, accounting for 61.0%) and females with 2 vehicles (599, making up 56.3%).
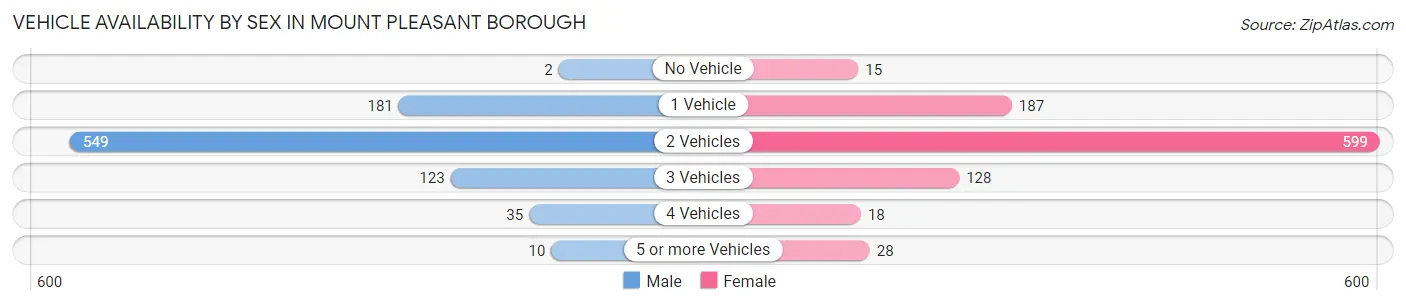
| Vehicles Available | Male | Female |
| No Vehicle | 2 (0.2%) | 15 (1.5%) |
| 1 Vehicle | 181 (20.1%) | 187 (19.2%) |
| 2 Vehicles | 549 (61.0%) | 599 (61.4%) |
| 3 Vehicles | 123 (13.7%) | 128 (13.1%) |
| 4 Vehicles | 35 (3.9%) | 18 (1.8%) |
| 5 or more Vehicles | 10 (1.1%) | 28 (2.9%) |
| Total | 900 (100.0%) | 975 (100.0%) |
Commute Time in Mount Pleasant borough
The most frequently occuring commute durations in Mount Pleasant borough are 15 to 19 minutes (392 commuters, 22.0%), 20 to 24 minutes (365 commuters, 20.5%), and 30 to 34 minutes (356 commuters, 20.0%).
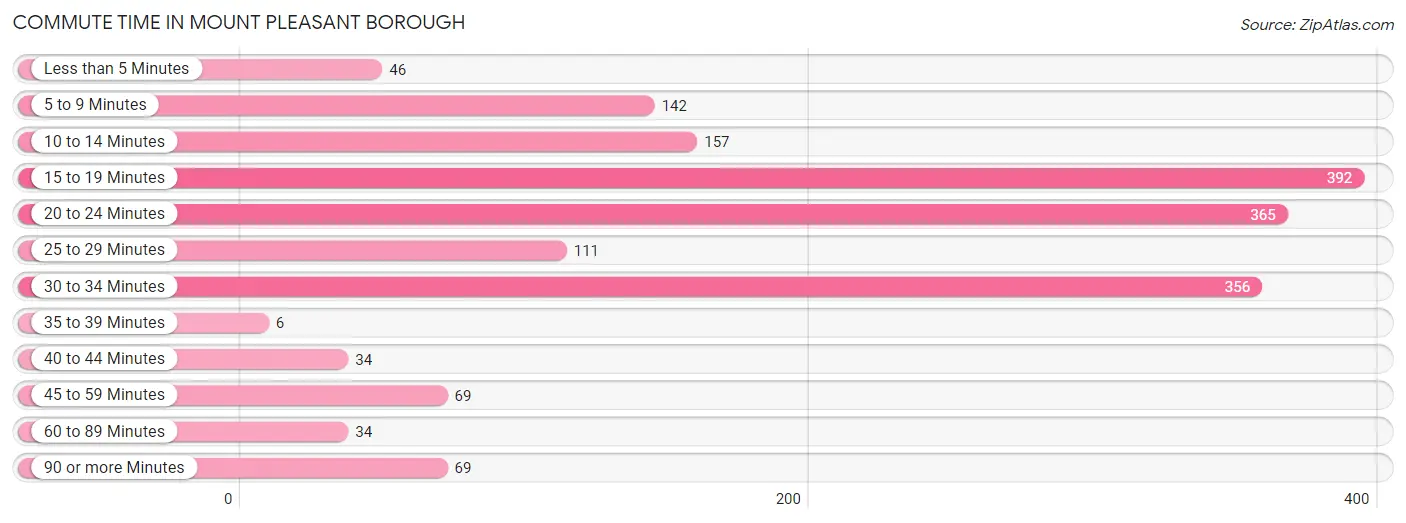
| Commute Time | # Commuters | % Commuters |
| Less than 5 Minutes | 46 | 2.6% |
| 5 to 9 Minutes | 142 | 8.0% |
| 10 to 14 Minutes | 157 | 8.8% |
| 15 to 19 Minutes | 392 | 22.0% |
| 20 to 24 Minutes | 365 | 20.5% |
| 25 to 29 Minutes | 111 | 6.2% |
| 30 to 34 Minutes | 356 | 20.0% |
| 35 to 39 Minutes | 6 | 0.3% |
| 40 to 44 Minutes | 34 | 1.9% |
| 45 to 59 Minutes | 69 | 3.9% |
| 60 to 89 Minutes | 34 | 1.9% |
| 90 or more Minutes | 69 | 3.9% |
Commute Time by Sex in Mount Pleasant borough
The most common commute times in Mount Pleasant borough are 15 to 19 minutes (205 commuters, 23.9%) for males and 30 to 34 minutes (278 commuters, 30.1%) for females.
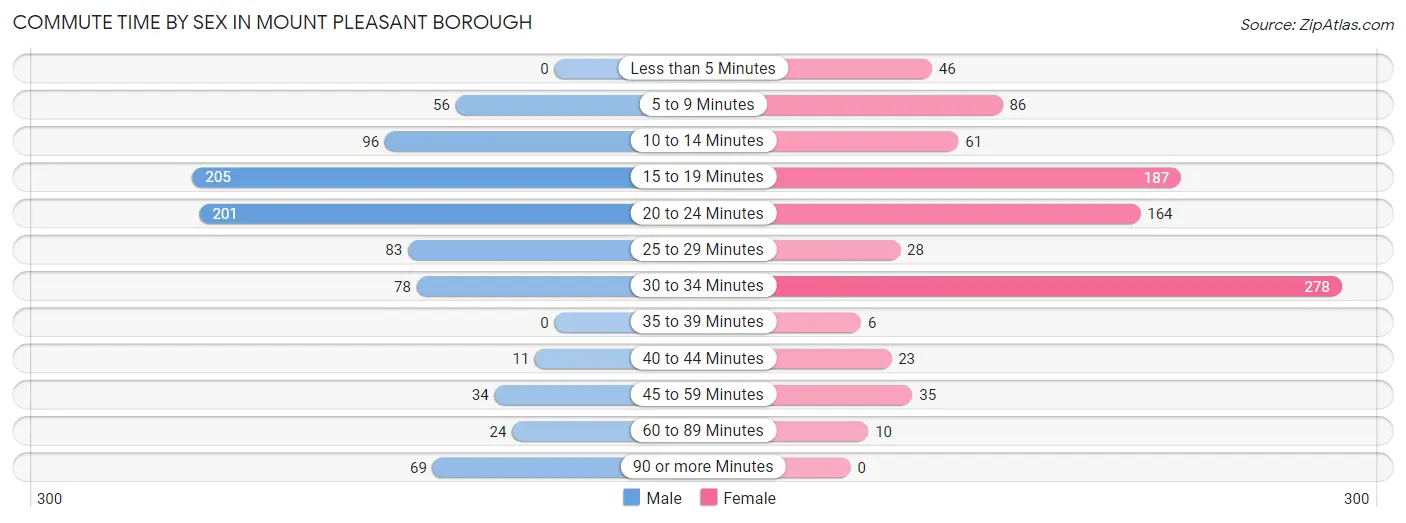
| Commute Time | Male | Female |
| Less than 5 Minutes | 0 (0.0%) | 46 (5.0%) |
| 5 to 9 Minutes | 56 (6.5%) | 86 (9.3%) |
| 10 to 14 Minutes | 96 (11.2%) | 61 (6.6%) |
| 15 to 19 Minutes | 205 (23.9%) | 187 (20.2%) |
| 20 to 24 Minutes | 201 (23.4%) | 164 (17.7%) |
| 25 to 29 Minutes | 83 (9.7%) | 28 (3.0%) |
| 30 to 34 Minutes | 78 (9.1%) | 278 (30.1%) |
| 35 to 39 Minutes | 0 (0.0%) | 6 (0.6%) |
| 40 to 44 Minutes | 11 (1.3%) | 23 (2.5%) |
| 45 to 59 Minutes | 34 (4.0%) | 35 (3.8%) |
| 60 to 89 Minutes | 24 (2.8%) | 10 (1.1%) |
| 90 or more Minutes | 69 (8.1%) | 0 (0.0%) |
Time of Departure to Work by Sex in Mount Pleasant borough
The most frequent times of departure to work in Mount Pleasant borough are 6:30 AM to 6:59 AM (144, 16.8%) for males and 7:00 AM to 7:29 AM (418, 45.2%) for females.
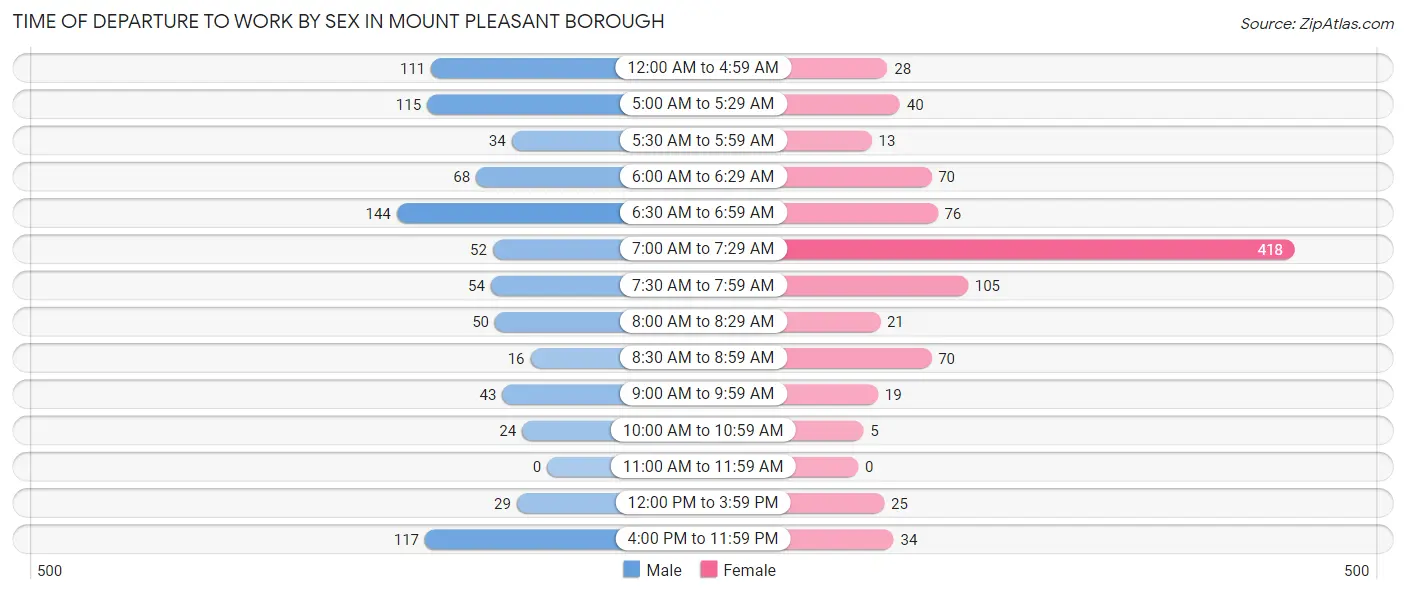
| Time of Departure | Male | Female |
| 12:00 AM to 4:59 AM | 111 (13.0%) | 28 (3.0%) |
| 5:00 AM to 5:29 AM | 115 (13.4%) | 40 (4.3%) |
| 5:30 AM to 5:59 AM | 34 (4.0%) | 13 (1.4%) |
| 6:00 AM to 6:29 AM | 68 (7.9%) | 70 (7.6%) |
| 6:30 AM to 6:59 AM | 144 (16.8%) | 76 (8.2%) |
| 7:00 AM to 7:29 AM | 52 (6.1%) | 418 (45.2%) |
| 7:30 AM to 7:59 AM | 54 (6.3%) | 105 (11.4%) |
| 8:00 AM to 8:29 AM | 50 (5.8%) | 21 (2.3%) |
| 8:30 AM to 8:59 AM | 16 (1.9%) | 70 (7.6%) |
| 9:00 AM to 9:59 AM | 43 (5.0%) | 19 (2.1%) |
| 10:00 AM to 10:59 AM | 24 (2.8%) | 5 (0.5%) |
| 11:00 AM to 11:59 AM | 0 (0.0%) | 0 (0.0%) |
| 12:00 PM to 3:59 PM | 29 (3.4%) | 25 (2.7%) |
| 4:00 PM to 11:59 PM | 117 (13.7%) | 34 (3.7%) |
| Total | 857 (100.0%) | 924 (100.0%) |
Housing Occupancy in Mount Pleasant borough
Occupancy by Ownership in Mount Pleasant borough
Of the total 2,041 dwellings in Mount Pleasant borough, owner-occupied units account for 1,368 (67.0%), while renter-occupied units make up 673 (33.0%).
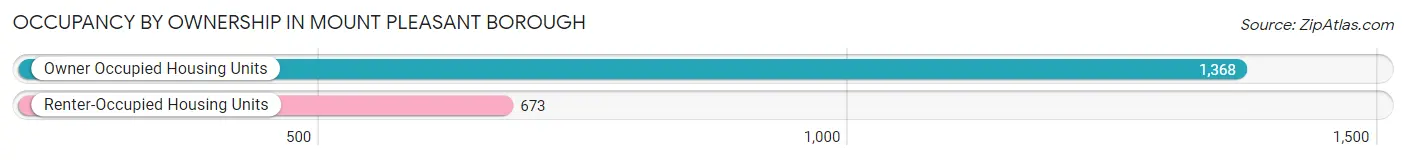
| Occupancy | # Housing Units | % Housing Units |
| Owner Occupied Housing Units | 1,368 | 67.0% |
| Renter-Occupied Housing Units | 673 | 33.0% |
| Total Occupied Housing Units | 2,041 | 100.0% |
Occupancy by Household Size in Mount Pleasant borough
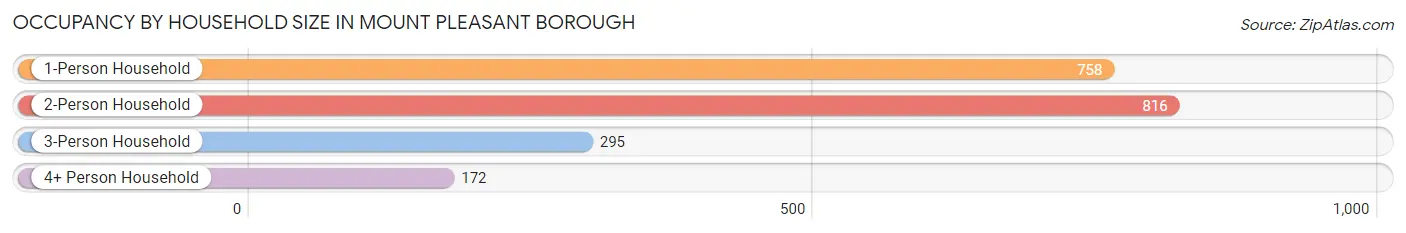
| Household Size | # Housing Units | % Housing Units |
| 1-Person Household | 758 | 37.1% |
| 2-Person Household | 816 | 40.0% |
| 3-Person Household | 295 | 14.4% |
| 4+ Person Household | 172 | 8.4% |
| Total Housing Units | 2,041 | 100.0% |
Occupancy by Ownership by Household Size in Mount Pleasant borough
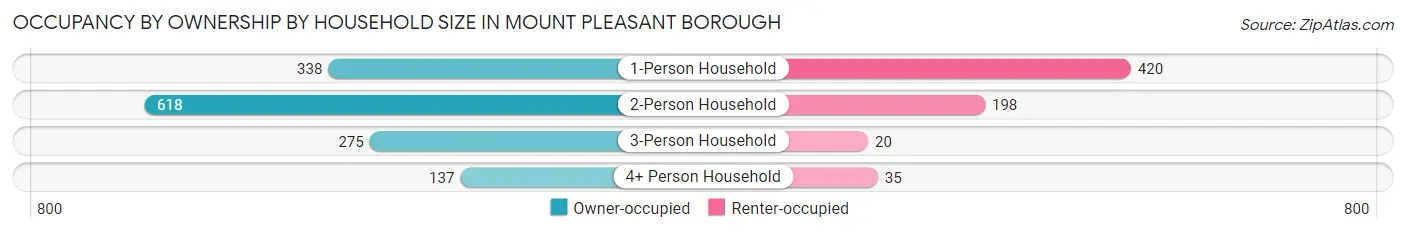
| Household Size | Owner-occupied | Renter-occupied |
| 1-Person Household | 338 (44.6%) | 420 (55.4%) |
| 2-Person Household | 618 (75.7%) | 198 (24.3%) |
| 3-Person Household | 275 (93.2%) | 20 (6.8%) |
| 4+ Person Household | 137 (79.6%) | 35 (20.3%) |
| Total Housing Units | 1,368 (67.0%) | 673 (33.0%) |
Occupancy by Educational Attainment in Mount Pleasant borough
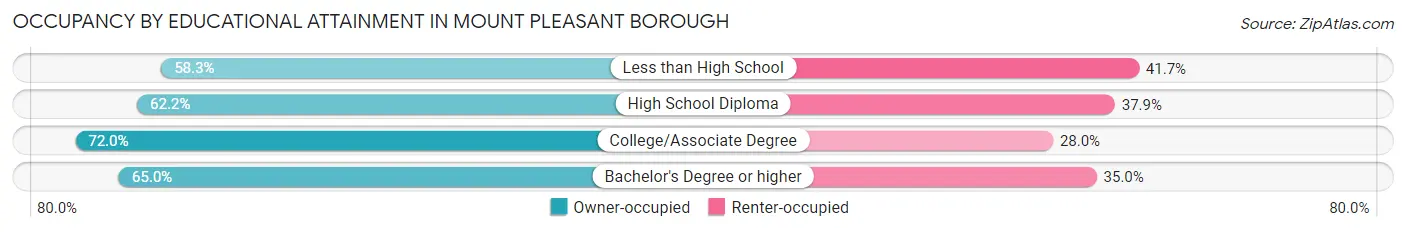
| Household Size | Owner-occupied | Renter-occupied |
| Less than High School | 49 (58.3%) | 35 (41.7%) |
| High School Diploma | 404 (62.2%) | 246 (37.9%) |
| College/Associate Degree | 675 (72.0%) | 263 (28.0%) |
| Bachelor's Degree or higher | 240 (65.0%) | 129 (35.0%) |
Occupancy by Age of Householder in Mount Pleasant borough
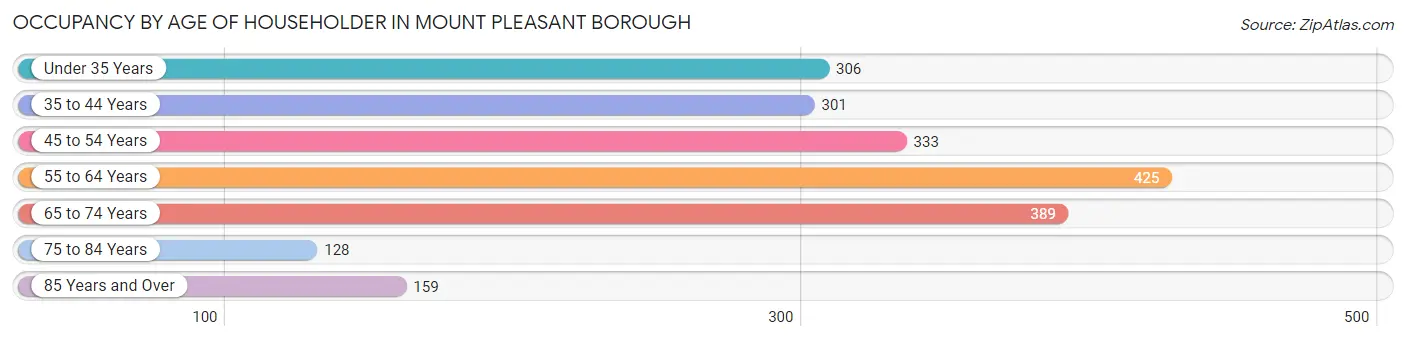
| Age Bracket | # Households | % Households |
| Under 35 Years | 306 | 15.0% |
| 35 to 44 Years | 301 | 14.7% |
| 45 to 54 Years | 333 | 16.3% |
| 55 to 64 Years | 425 | 20.8% |
| 65 to 74 Years | 389 | 19.1% |
| 75 to 84 Years | 128 | 6.3% |
| 85 Years and Over | 159 | 7.8% |
| Total | 2,041 | 100.0% |
Housing Finances in Mount Pleasant borough
Median Income by Occupancy in Mount Pleasant borough
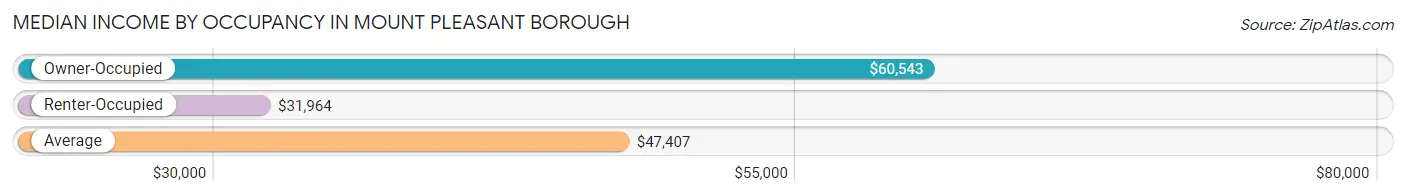
| Occupancy Type | # Households | Median Income |
| Owner-Occupied | 1,368 (67.0%) | $60,543 |
| Renter-Occupied | 673 (33.0%) | $31,964 |
| Average | 2,041 (100.0%) | $47,407 |
Occupancy by Householder Income Bracket in Mount Pleasant borough
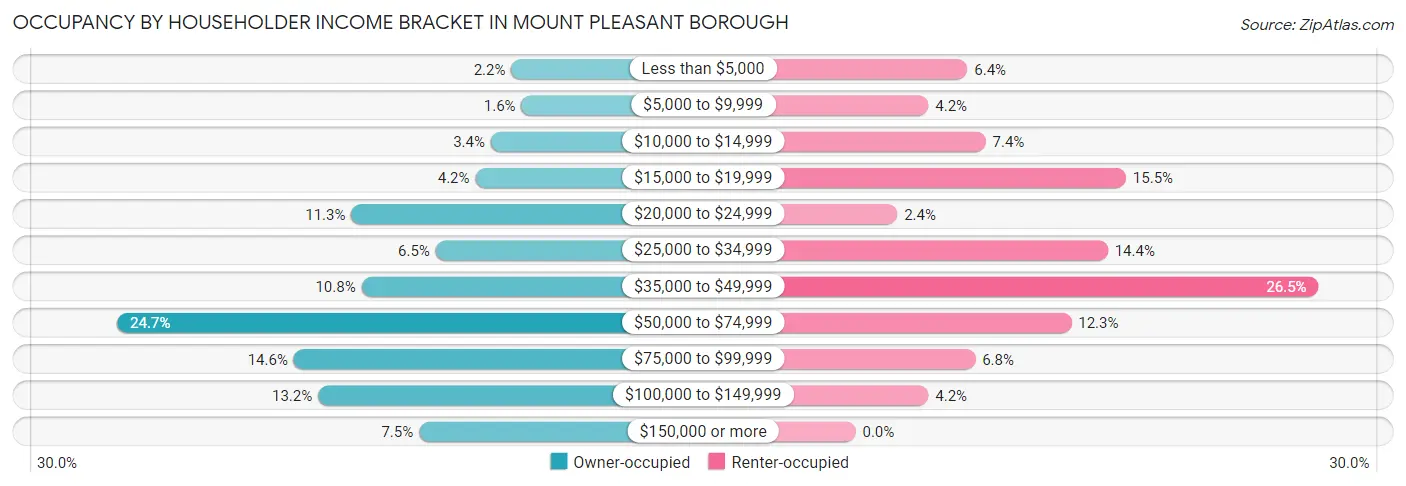
| Income Bracket | Owner-occupied | Renter-occupied |
| Less than $5,000 | 30 (2.2%) | 43 (6.4%) |
| $5,000 to $9,999 | 22 (1.6%) | 28 (4.2%) |
| $10,000 to $14,999 | 46 (3.4%) | 50 (7.4%) |
| $15,000 to $19,999 | 58 (4.2%) | 104 (15.4%) |
| $20,000 to $24,999 | 155 (11.3%) | 16 (2.4%) |
| $25,000 to $34,999 | 89 (6.5%) | 97 (14.4%) |
| $35,000 to $49,999 | 147 (10.7%) | 178 (26.5%) |
| $50,000 to $74,999 | 338 (24.7%) | 83 (12.3%) |
| $75,000 to $99,999 | 200 (14.6%) | 46 (6.8%) |
| $100,000 to $149,999 | 181 (13.2%) | 28 (4.2%) |
| $150,000 or more | 102 (7.5%) | 0 (0.0%) |
| Total | 1,368 (100.0%) | 673 (100.0%) |
Monthly Housing Cost Tiers in Mount Pleasant borough
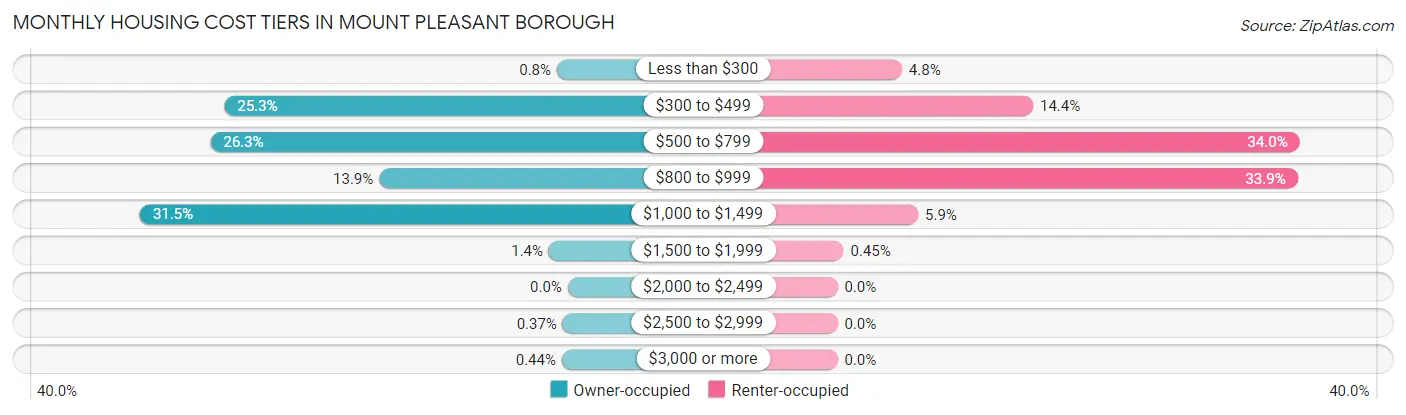
| Monthly Cost | Owner-occupied | Renter-occupied |
| Less than $300 | 11 (0.8%) | 32 (4.8%) |
| $300 to $499 | 346 (25.3%) | 97 (14.4%) |
| $500 to $799 | 360 (26.3%) | 229 (34.0%) |
| $800 to $999 | 190 (13.9%) | 228 (33.9%) |
| $1,000 to $1,499 | 431 (31.5%) | 40 (5.9%) |
| $1,500 to $1,999 | 19 (1.4%) | 3 (0.4%) |
| $2,000 to $2,499 | 0 (0.0%) | 0 (0.0%) |
| $2,500 to $2,999 | 5 (0.4%) | 0 (0.0%) |
| $3,000 or more | 6 (0.4%) | 0 (0.0%) |
| Total | 1,368 (100.0%) | 673 (100.0%) |
Physical Housing Characteristics in Mount Pleasant borough
Housing Structures in Mount Pleasant borough
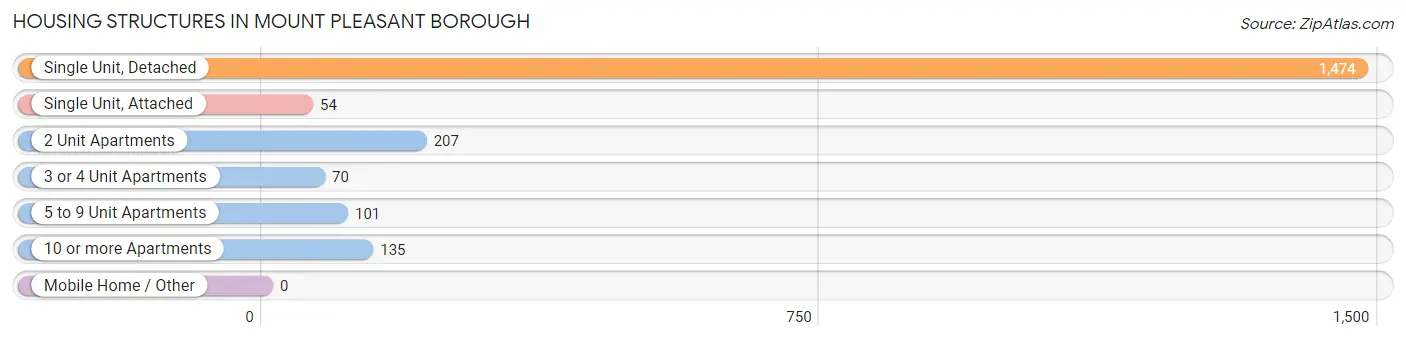
| Structure Type | # Housing Units | % Housing Units |
| Single Unit, Detached | 1,474 | 72.2% |
| Single Unit, Attached | 54 | 2.6% |
| 2 Unit Apartments | 207 | 10.1% |
| 3 or 4 Unit Apartments | 70 | 3.4% |
| 5 to 9 Unit Apartments | 101 | 5.0% |
| 10 or more Apartments | 135 | 6.6% |
| Mobile Home / Other | 0 | 0.0% |
| Total | 2,041 | 100.0% |
Housing Structures by Occupancy in Mount Pleasant borough
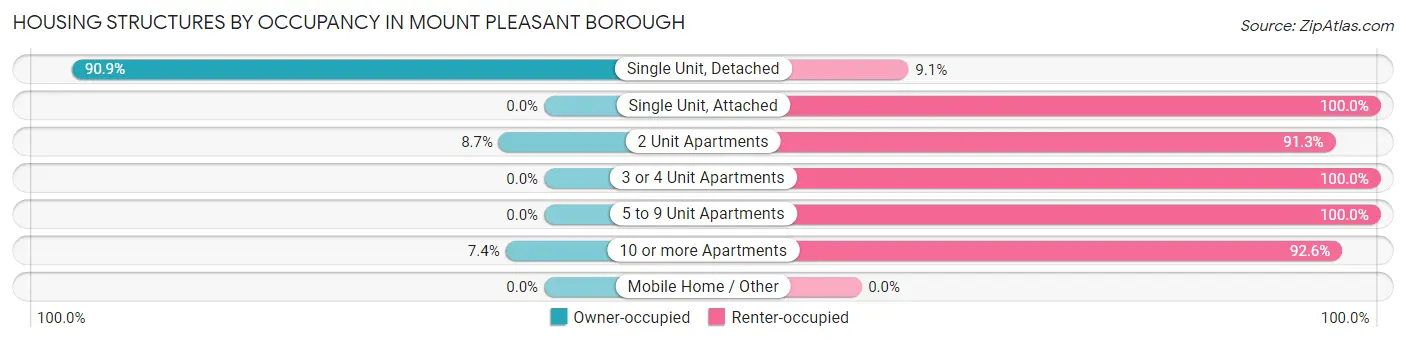
| Structure Type | Owner-occupied | Renter-occupied |
| Single Unit, Detached | 1,340 (90.9%) | 134 (9.1%) |
| Single Unit, Attached | 0 (0.0%) | 54 (100.0%) |
| 2 Unit Apartments | 18 (8.7%) | 189 (91.3%) |
| 3 or 4 Unit Apartments | 0 (0.0%) | 70 (100.0%) |
| 5 to 9 Unit Apartments | 0 (0.0%) | 101 (100.0%) |
| 10 or more Apartments | 10 (7.4%) | 125 (92.6%) |
| Mobile Home / Other | 0 (0.0%) | 0 (0.0%) |
| Total | 1,368 (67.0%) | 673 (33.0%) |
Housing Structures by Number of Rooms in Mount Pleasant borough
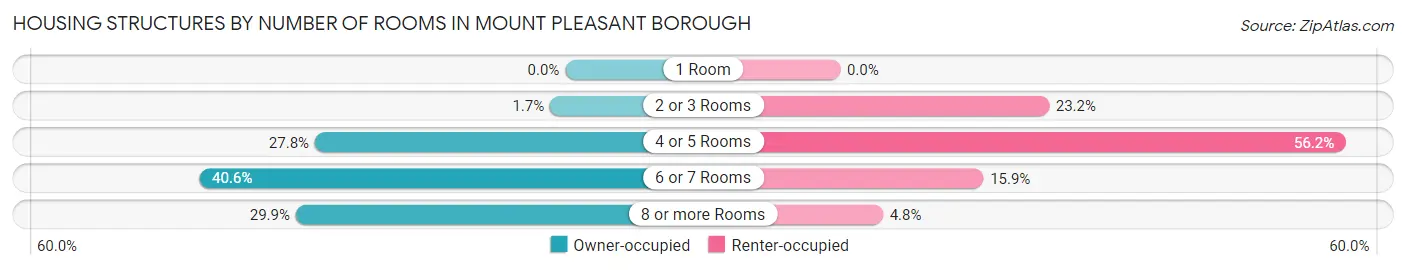
| Number of Rooms | Owner-occupied | Renter-occupied |
| 1 Room | 0 (0.0%) | 0 (0.0%) |
| 2 or 3 Rooms | 23 (1.7%) | 156 (23.2%) |
| 4 or 5 Rooms | 380 (27.8%) | 378 (56.2%) |
| 6 or 7 Rooms | 556 (40.6%) | 107 (15.9%) |
| 8 or more Rooms | 409 (29.9%) | 32 (4.8%) |
| Total | 1,368 (100.0%) | 673 (100.0%) |
Housing Structure by Heating Type in Mount Pleasant borough
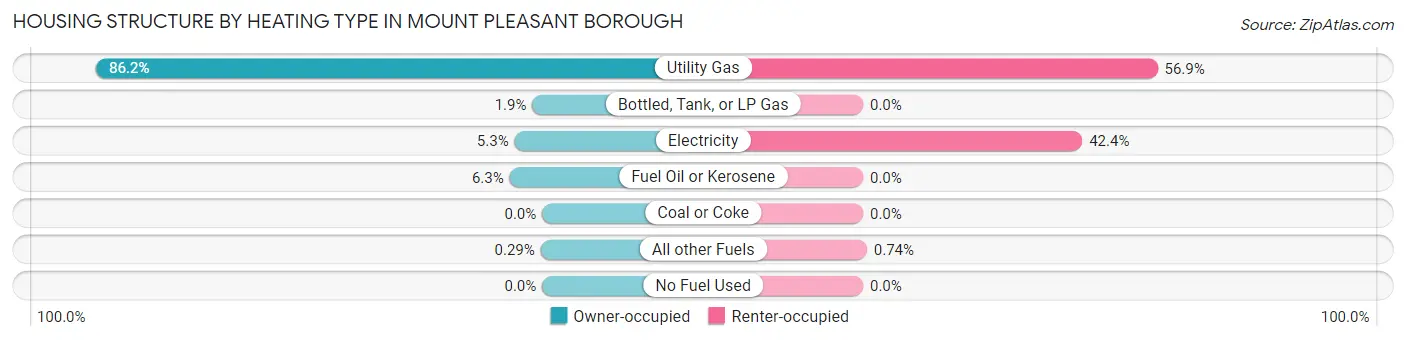
| Heating Type | Owner-occupied | Renter-occupied |
| Utility Gas | 1,179 (86.2%) | 383 (56.9%) |
| Bottled, Tank, or LP Gas | 26 (1.9%) | 0 (0.0%) |
| Electricity | 73 (5.3%) | 285 (42.3%) |
| Fuel Oil or Kerosene | 86 (6.3%) | 0 (0.0%) |
| Coal or Coke | 0 (0.0%) | 0 (0.0%) |
| All other Fuels | 4 (0.3%) | 5 (0.7%) |
| No Fuel Used | 0 (0.0%) | 0 (0.0%) |
| Total | 1,368 (100.0%) | 673 (100.0%) |
Household Vehicle Usage in Mount Pleasant borough
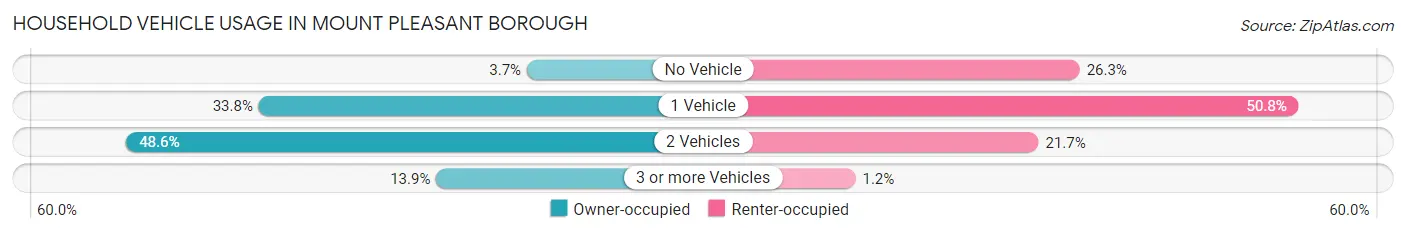
| Vehicles per Household | Owner-occupied | Renter-occupied |
| No Vehicle | 51 (3.7%) | 177 (26.3%) |
| 1 Vehicle | 462 (33.8%) | 342 (50.8%) |
| 2 Vehicles | 665 (48.6%) | 146 (21.7%) |
| 3 or more Vehicles | 190 (13.9%) | 8 (1.2%) |
| Total | 1,368 (100.0%) | 673 (100.0%) |
Real Estate & Mortgages in Mount Pleasant borough
Real Estate and Mortgage Overview in Mount Pleasant borough
| Characteristic | Without Mortgage | With Mortgage |
| Housing Units | 631 | 737 |
| Median Property Value | $116,700 | $128,200 |
| Median Household Income | $46,146 | $44 |
| Monthly Housing Costs | $489 | $6 |
| Real Estate Taxes | $1,555 | $12 |
Property Value by Mortgage Status in Mount Pleasant borough
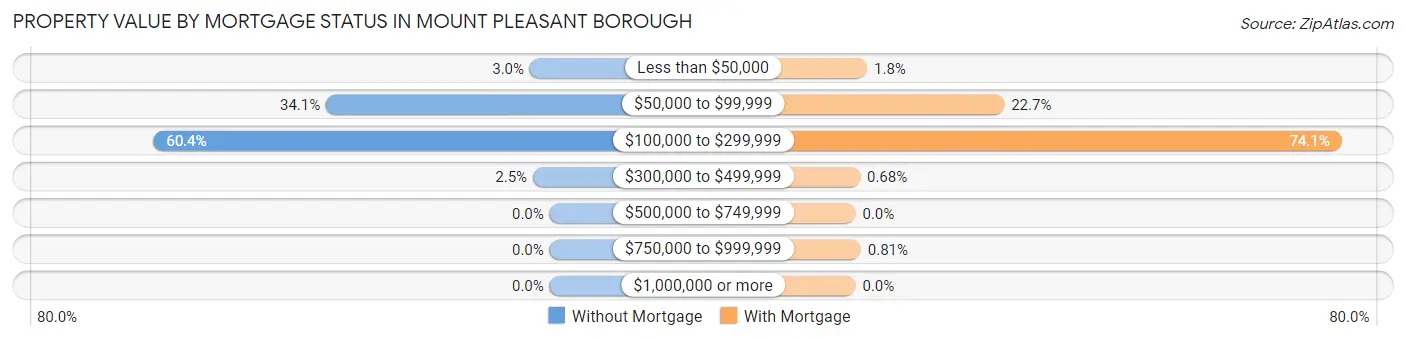
| Property Value | Without Mortgage | With Mortgage |
| Less than $50,000 | 19 (3.0%) | 13 (1.8%) |
| $50,000 to $99,999 | 215 (34.1%) | 167 (22.7%) |
| $100,000 to $299,999 | 381 (60.4%) | 546 (74.1%) |
| $300,000 to $499,999 | 16 (2.5%) | 5 (0.7%) |
| $500,000 to $749,999 | 0 (0.0%) | 0 (0.0%) |
| $750,000 to $999,999 | 0 (0.0%) | 6 (0.8%) |
| $1,000,000 or more | 0 (0.0%) | 0 (0.0%) |
| Total | 631 (100.0%) | 737 (100.0%) |
Household Income by Mortgage Status in Mount Pleasant borough
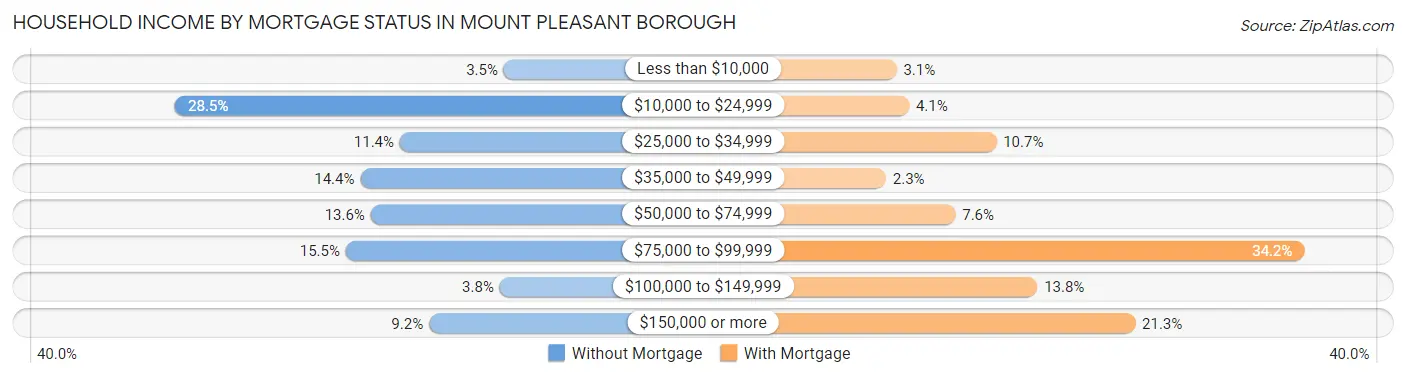
| Household Income | Without Mortgage | With Mortgage |
| Less than $10,000 | 22 (3.5%) | 23 (3.1%) |
| $10,000 to $24,999 | 180 (28.5%) | 30 (4.1%) |
| $25,000 to $34,999 | 72 (11.4%) | 79 (10.7%) |
| $35,000 to $49,999 | 91 (14.4%) | 17 (2.3%) |
| $50,000 to $74,999 | 86 (13.6%) | 56 (7.6%) |
| $75,000 to $99,999 | 98 (15.5%) | 252 (34.2%) |
| $100,000 to $149,999 | 24 (3.8%) | 102 (13.8%) |
| $150,000 or more | 58 (9.2%) | 157 (21.3%) |
| Total | 631 (100.0%) | 737 (100.0%) |
Property Value to Household Income Ratio in Mount Pleasant borough
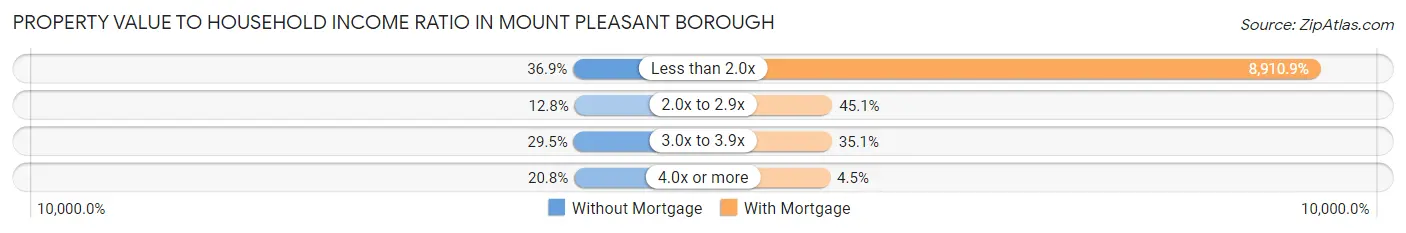
| Value-to-Income Ratio | Without Mortgage | With Mortgage |
| Less than 2.0x | 233 (36.9%) | 65,673 (8,910.9%) |
| 2.0x to 2.9x | 81 (12.8%) | 332 (45.1%) |
| 3.0x to 3.9x | 186 (29.5%) | 259 (35.1%) |
| 4.0x or more | 131 (20.8%) | 33 (4.5%) |
| Total | 631 (100.0%) | 737 (100.0%) |
Real Estate Taxes by Mortgage Status in Mount Pleasant borough
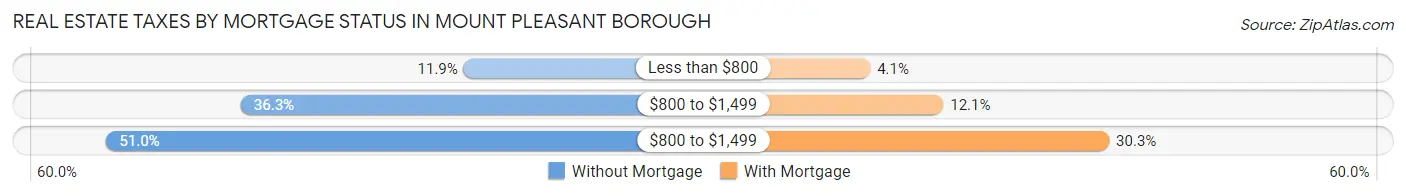
| Property Taxes | Without Mortgage | With Mortgage |
| Less than $800 | 75 (11.9%) | 30 (4.1%) |
| $800 to $1,499 | 229 (36.3%) | 89 (12.1%) |
| $800 to $1,499 | 322 (51.0%) | 223 (30.3%) |
| Total | 631 (100.0%) | 737 (100.0%) |
Health & Disability in Mount Pleasant borough
Health Insurance Coverage by Age in Mount Pleasant borough
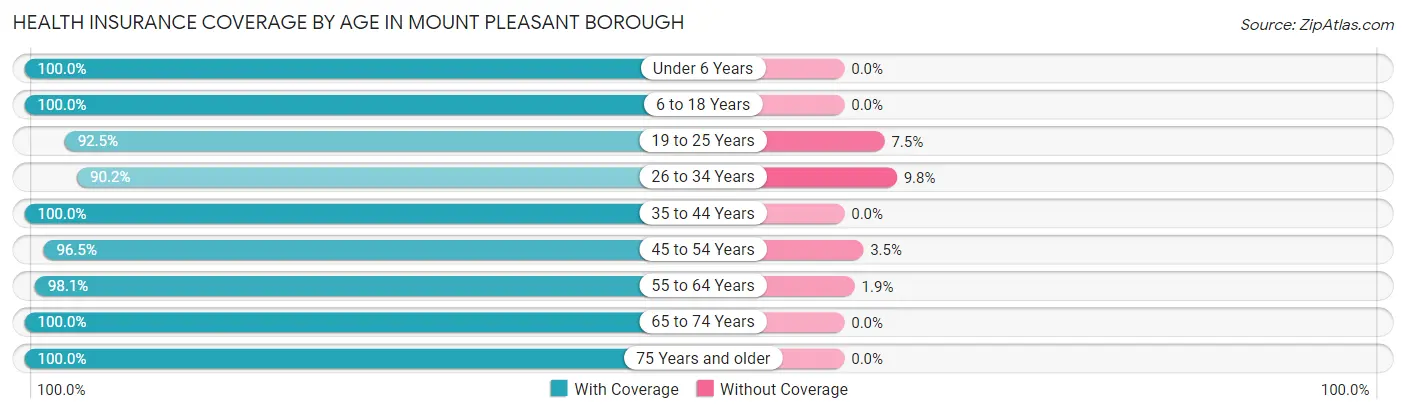
| Age Bracket | With Coverage | Without Coverage |
| Under 6 Years | 222 (100.0%) | 0 (0.0%) |
| 6 to 18 Years | 458 (100.0%) | 0 (0.0%) |
| 19 to 25 Years | 309 (92.5%) | 25 (7.5%) |
| 26 to 34 Years | 332 (90.2%) | 36 (9.8%) |
| 35 to 44 Years | 542 (100.0%) | 0 (0.0%) |
| 45 to 54 Years | 519 (96.5%) | 19 (3.5%) |
| 55 to 64 Years | 710 (98.1%) | 14 (1.9%) |
| 65 to 74 Years | 582 (100.0%) | 0 (0.0%) |
| 75 Years and older | 375 (100.0%) | 0 (0.0%) |
| Total | 4,049 (97.7%) | 94 (2.3%) |
Health Insurance Coverage by Citizenship Status in Mount Pleasant borough
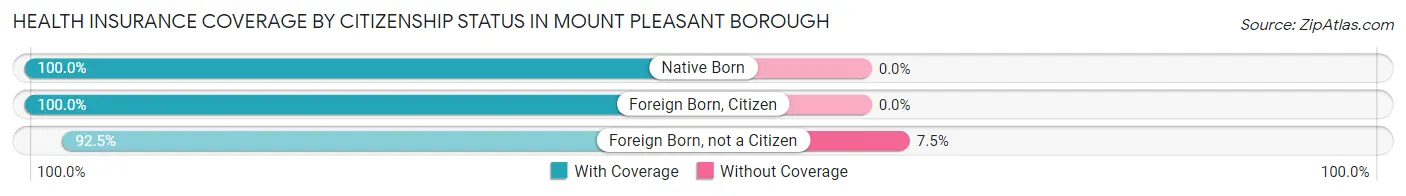
| Citizenship Status | With Coverage | Without Coverage |
| Native Born | 222 (100.0%) | 0 (0.0%) |
| Foreign Born, Citizen | 458 (100.0%) | 0 (0.0%) |
| Foreign Born, not a Citizen | 309 (92.5%) | 25 (7.5%) |
Health Insurance Coverage by Household Income in Mount Pleasant borough
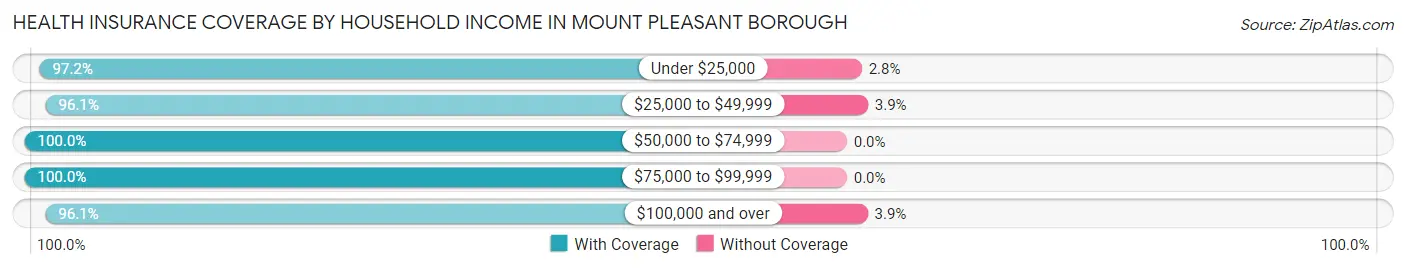
| Household Income | With Coverage | Without Coverage |
| Under $25,000 | 763 (97.2%) | 22 (2.8%) |
| $25,000 to $49,999 | 853 (96.1%) | 35 (3.9%) |
| $50,000 to $74,999 | 949 (100.0%) | 0 (0.0%) |
| $75,000 to $99,999 | 564 (100.0%) | 0 (0.0%) |
| $100,000 and over | 913 (96.1%) | 37 (3.9%) |
Public vs Private Health Insurance Coverage by Age in Mount Pleasant borough
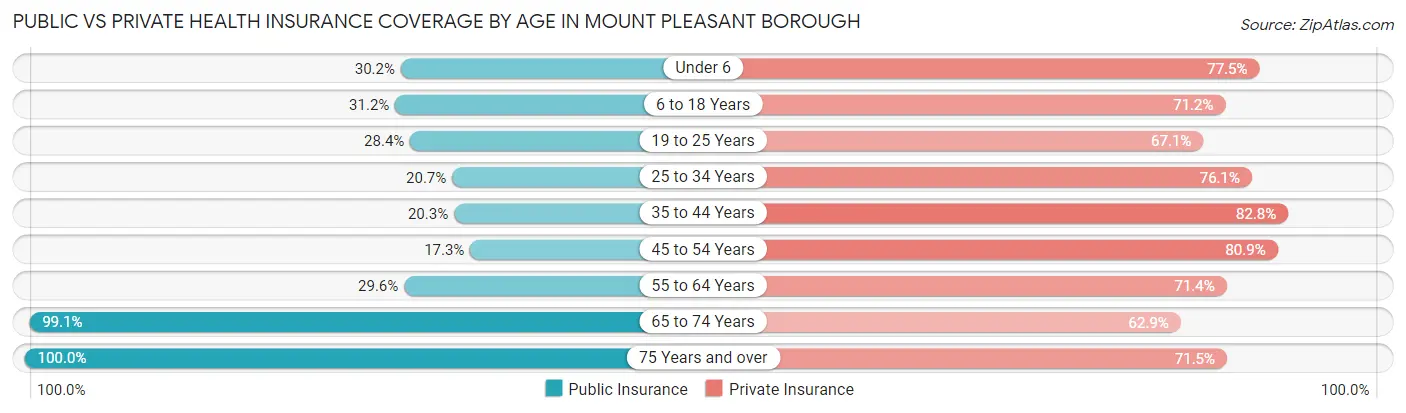
| Age Bracket | Public Insurance | Private Insurance |
| Under 6 | 67 (30.2%) | 172 (77.5%) |
| 6 to 18 Years | 143 (31.2%) | 326 (71.2%) |
| 19 to 25 Years | 95 (28.4%) | 224 (67.1%) |
| 25 to 34 Years | 76 (20.6%) | 280 (76.1%) |
| 35 to 44 Years | 110 (20.3%) | 449 (82.8%) |
| 45 to 54 Years | 93 (17.3%) | 435 (80.9%) |
| 55 to 64 Years | 214 (29.6%) | 517 (71.4%) |
| 65 to 74 Years | 577 (99.1%) | 366 (62.9%) |
| 75 Years and over | 375 (100.0%) | 268 (71.5%) |
| Total | 1,750 (42.2%) | 3,037 (73.3%) |
Disability Status by Sex by Age in Mount Pleasant borough
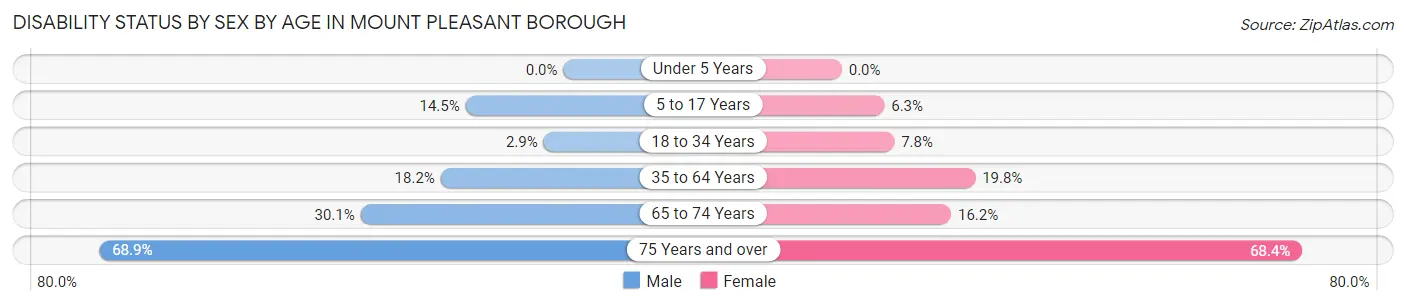
| Age Bracket | Male | Female |
| Under 5 Years | 0 (0.0%) | 0 (0.0%) |
| 5 to 17 Years | 25 (14.5%) | 19 (6.3%) |
| 18 to 34 Years | 9 (2.9%) | 32 (7.8%) |
| 35 to 64 Years | 141 (18.2%) | 204 (19.8%) |
| 65 to 74 Years | 75 (30.1%) | 54 (16.2%) |
| 75 Years and over | 82 (68.9%) | 175 (68.4%) |
Disability Class by Sex by Age in Mount Pleasant borough
Disability Class: Hearing Difficulty
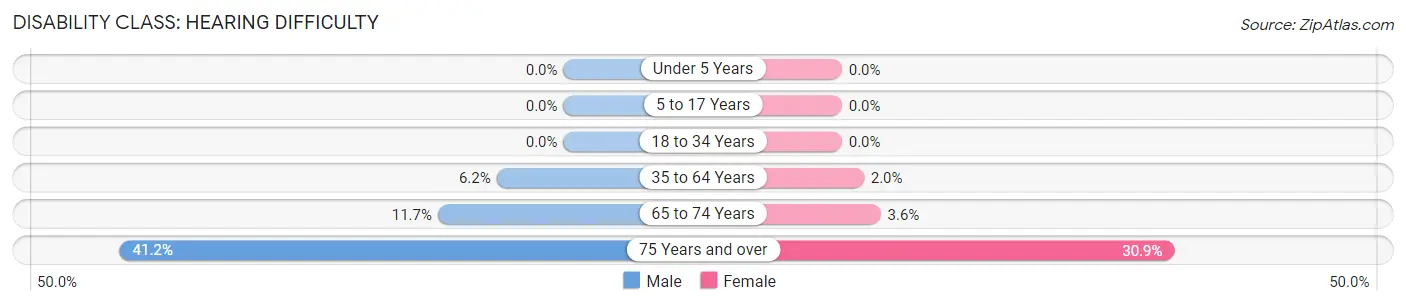
| Age Bracket | Male | Female |
| Under 5 Years | 0 (0.0%) | 0 (0.0%) |
| 5 to 17 Years | 0 (0.0%) | 0 (0.0%) |
| 18 to 34 Years | 0 (0.0%) | 0 (0.0%) |
| 35 to 64 Years | 48 (6.2%) | 21 (2.0%) |
| 65 to 74 Years | 29 (11.7%) | 12 (3.6%) |
| 75 Years and over | 49 (41.2%) | 79 (30.9%) |
Disability Class: Vision Difficulty
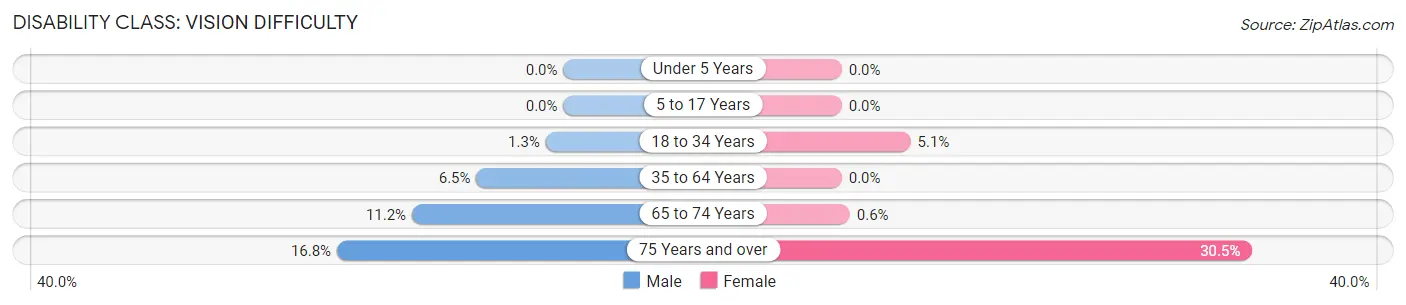
| Age Bracket | Male | Female |
| Under 5 Years | 0 (0.0%) | 0 (0.0%) |
| 5 to 17 Years | 0 (0.0%) | 0 (0.0%) |
| 18 to 34 Years | 4 (1.3%) | 21 (5.1%) |
| 35 to 64 Years | 50 (6.5%) | 0 (0.0%) |
| 65 to 74 Years | 28 (11.2%) | 2 (0.6%) |
| 75 Years and over | 20 (16.8%) | 78 (30.5%) |
Disability Class: Cognitive Difficulty
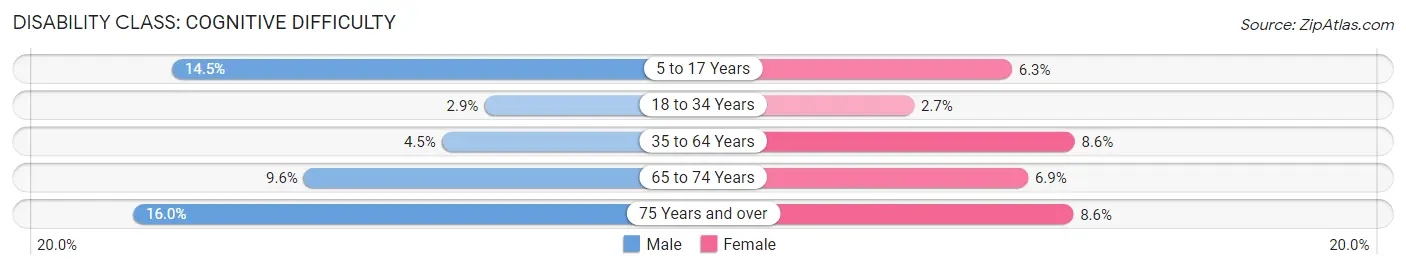
| Age Bracket | Male | Female |
| 5 to 17 Years | 25 (14.5%) | 19 (6.3%) |
| 18 to 34 Years | 9 (2.9%) | 11 (2.7%) |
| 35 to 64 Years | 35 (4.5%) | 89 (8.6%) |
| 65 to 74 Years | 24 (9.6%) | 23 (6.9%) |
| 75 Years and over | 19 (16.0%) | 22 (8.6%) |
Disability Class: Ambulatory Difficulty
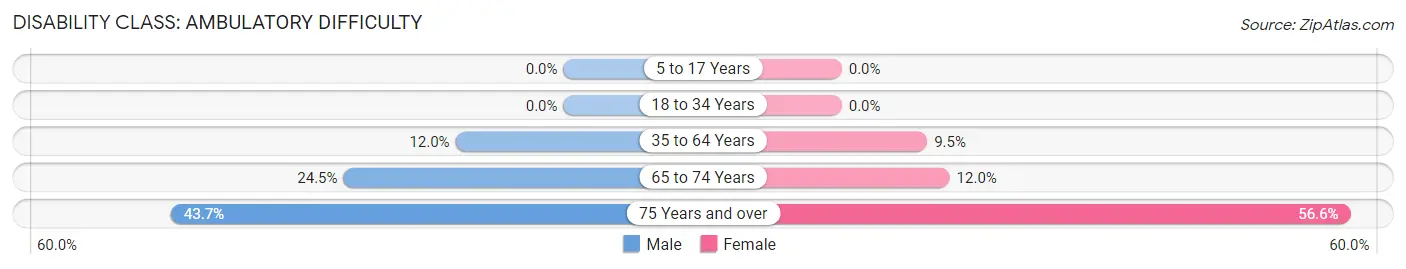
| Age Bracket | Male | Female |
| 5 to 17 Years | 0 (0.0%) | 0 (0.0%) |
| 18 to 34 Years | 0 (0.0%) | 0 (0.0%) |
| 35 to 64 Years | 93 (12.0%) | 98 (9.5%) |
| 65 to 74 Years | 61 (24.5%) | 40 (12.0%) |
| 75 Years and over | 52 (43.7%) | 145 (56.6%) |
Disability Class: Self-Care Difficulty
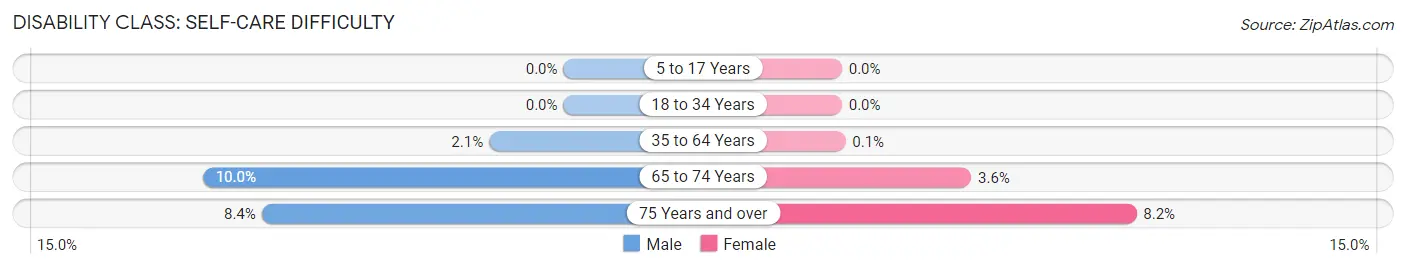
| Age Bracket | Male | Female |
| 5 to 17 Years | 0 (0.0%) | 0 (0.0%) |
| 18 to 34 Years | 0 (0.0%) | 0 (0.0%) |
| 35 to 64 Years | 16 (2.1%) | 1 (0.1%) |
| 65 to 74 Years | 25 (10.0%) | 12 (3.6%) |
| 75 Years and over | 10 (8.4%) | 21 (8.2%) |
Technology Access in Mount Pleasant borough
Computing Device Access in Mount Pleasant borough
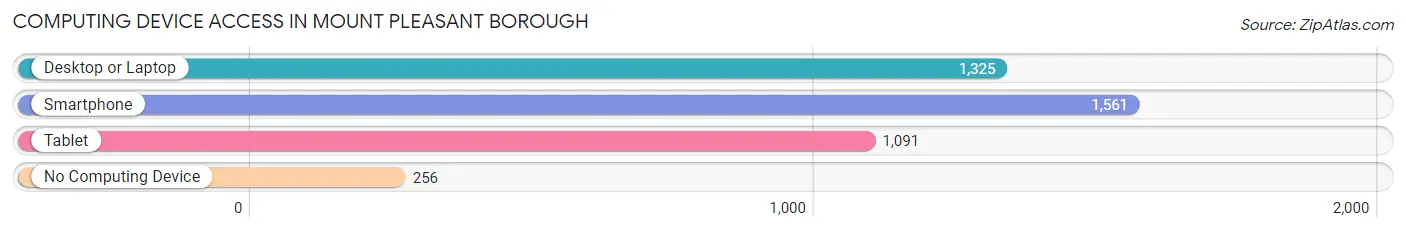
| Device Type | # Households | % Households |
| Desktop or Laptop | 1,325 | 64.9% |
| Smartphone | 1,561 | 76.5% |
| Tablet | 1,091 | 53.4% |
| No Computing Device | 256 | 12.5% |
| Total | 2,041 | 100.0% |
Internet Access in Mount Pleasant borough
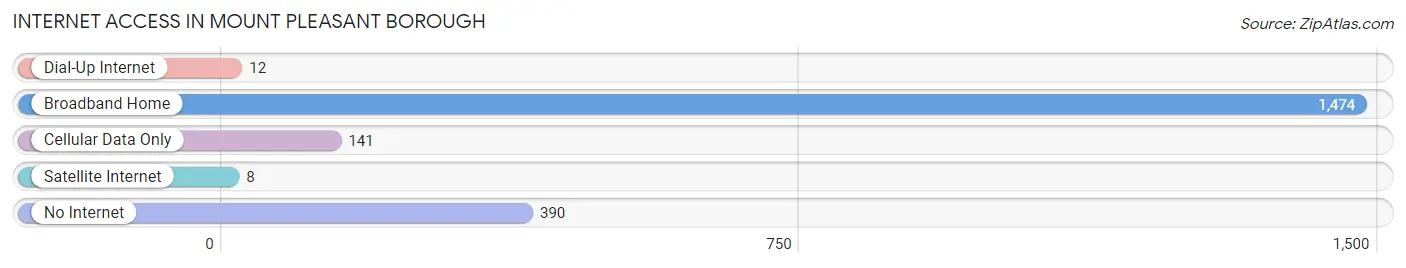
| Internet Type | # Households | % Households |
| Dial-Up Internet | 12 | 0.6% |
| Broadband Home | 1,474 | 72.2% |
| Cellular Data Only | 141 | 6.9% |
| Satellite Internet | 8 | 0.4% |
| No Internet | 390 | 19.1% |
| Total | 2,041 | 100.0% |
Mount Pleasant borough Summary
Introduction
Mount Pleasant Borough is a borough located in Westmoreland County, Pennsylvania. It is situated in the Laurel Highlands region of the state, and is part of the Pittsburgh metropolitan area. The borough was incorporated in 1842 and has a population of approximately 4,500 people. The borough is known for its historic architecture, its scenic views, and its vibrant community.
History
The area that is now Mount Pleasant Borough was first settled in the late 1700s by German and Scots-Irish immigrants. The first settlers were attracted to the area due to its fertile soil and abundant natural resources. The area was originally known as “Mount Pleasant” due to its scenic views of the surrounding mountains.
In 1842, the area was officially incorporated as a borough. The borough was named after the nearby Mount Pleasant Presbyterian Church, which was founded in 1809. The church is still in operation today and is the oldest church in the borough.
The borough grew steadily throughout the 19th century, and by the early 20th century, it had become a thriving industrial center. The borough was home to several factories, including a steel mill, a glass factory, and a brickyard. The borough also had a thriving coal mining industry, which provided jobs for many of the borough’s residents.
The borough experienced a period of decline in the mid-20th century, as many of the factories and mines closed. However, the borough has since experienced a resurgence, and today it is a vibrant community with a strong sense of identity.
Geography
Mount Pleasant Borough is located in Westmoreland County, Pennsylvania. It is situated in the Laurel Highlands region of the state, and is part of the Pittsburgh metropolitan area. The borough is located in the foothills of the Allegheny Mountains, and is surrounded by rolling hills and lush forests.
The borough covers an area of approximately 1.5 square miles, and is home to several parks and recreational areas. The borough is also home to several historic sites, including the Mount Pleasant Presbyterian Church, the Mount Pleasant Cemetery, and the Mount Pleasant Historic District.
Economy
The economy of Mount Pleasant Borough is largely based on tourism and retail. The borough is home to several small businesses, including restaurants, shops, and galleries. The borough is also home to several historic sites, which attract visitors from all over the region.
The borough is also home to several manufacturing companies, including a steel mill, a glass factory, and a brickyard. The borough also has a thriving coal mining industry, which provides jobs for many of the borough’s residents.
Demographics
As of the 2010 census, the population of Mount Pleasant Borough was 4,500. The racial makeup of the borough was 95.3% White, 1.7% African American, 0.2% Native American, 0.7% Asian, 0.1% Pacific Islander, and 1.9% from other races. Hispanic or Latino of any race were 2.2% of the population.
The median household income in the borough was $41,250, and the median family income was $50,000. The per capita income in the borough was $20,945. About 11.3% of the population was below the poverty line.
Conclusion
Mount Pleasant Borough is a vibrant community located in Westmoreland County, Pennsylvania. The borough is known for its historic architecture, its scenic views, and its vibrant community. The borough has a strong economy based on tourism and retail, and is home to several manufacturing companies. The borough has a population of approximately 4,500 people, and the median household income is $41,250. Mount Pleasant Borough is a great place to live, work, and visit.
Common Questions
What is Per Capita Income in Mount Pleasant borough?
Per Capita income in Mount Pleasant borough is $29,568.
What is the Median Family Income in Mount Pleasant borough?
Median Family Income in Mount Pleasant borough is $65,648.
What is the Median Household income in Mount Pleasant borough?
Median Household Income in Mount Pleasant borough is $47,407.
What is Income or Wage Gap in Mount Pleasant borough?
Income or Wage Gap in Mount Pleasant borough is 26.2%.
Women in Mount Pleasant borough earn 73.8 cents for every dollar earned by a man.
What is Inequality or Gini Index in Mount Pleasant borough?
Inequality or Gini Index in Mount Pleasant borough is 0.41.
What is the Total Population of Mount Pleasant borough?
Total Population of Mount Pleasant borough is 4,242.
What is the Total Male Population of Mount Pleasant borough?
Total Male Population of Mount Pleasant borough is 1,797.
What is the Total Female Population of Mount Pleasant borough?
Total Female Population of Mount Pleasant borough is 2,445.
What is the Ratio of Males per 100 Females in Mount Pleasant borough?
There are 73.50 Males per 100 Females in Mount Pleasant borough.
What is the Ratio of Females per 100 Males in Mount Pleasant borough?
There are 136.06 Females per 100 Males in Mount Pleasant borough.
What is the Median Population Age in Mount Pleasant borough?
Median Population Age in Mount Pleasant borough is 51.5 Years.
What is the Average Family Size in Mount Pleasant borough
Average Family Size in Mount Pleasant borough is 2.6 People.
What is the Average Household Size in Mount Pleasant borough
Average Household Size in Mount Pleasant borough is 2.0 People.
How Large is the Labor Force in Mount Pleasant borough?
There are 2,040 People in the Labor Forcein in Mount Pleasant borough.
What is the Percentage of People in the Labor Force in Mount Pleasant borough?
55.6% of People are in the Labor Force in Mount Pleasant borough.
What is the Unemployment Rate in Mount Pleasant borough?
Unemployment Rate in Mount Pleasant borough is 6.1%.