Milton borough, PA Map & Demographics
Milton borough Overview
$28,126
PER CAPITA INCOME
$63,365
AVG FAMILY INCOME
$50,431
AVG HOUSEHOLD INCOME
41.2%
WAGE / INCOME GAP [ % ]
58.8¢/ $1
WAGE / INCOME GAP [ $ ]
0.40
INEQUALITY / GINI INDEX
6,610
TOTAL POPULATION
3,424
MALE POPULATION
3,186
FEMALE POPULATION
107.47
MALES / 100 FEMALES
93.05
FEMALES / 100 MALES
36.1
MEDIAN AGE
3.0
AVG FAMILY SIZE
2.4
AVG HOUSEHOLD SIZE
3,656
LABOR FORCE [ PEOPLE ]
70.3%
PERCENT IN LABOR FORCE
7.0%
UNEMPLOYMENT RATE
Income in Milton borough
Income Overview in Milton borough
Per Capita Income in Milton borough is $28,126, while median incomes of families and households are $63,365 and $50,431 respectively.
| Characteristic | Number | Measure |
| Per Capita Income | 6,610 | $28,126 |
| Median Family Income | 1,593 | $63,365 |
| Mean Family Income | 1,593 | $71,953 |
| Median Household Income | 2,745 | $50,431 |
| Mean Household Income | 2,745 | $66,331 |
| Income Deficit | 1,593 | $0 |
| Wage / Income Gap (%) | 6,610 | 41.19% |
| Wage / Income Gap ($) | 6,610 | 58.81¢ per $1 |
| Gini / Inequality Index | 6,610 | 0.40 |
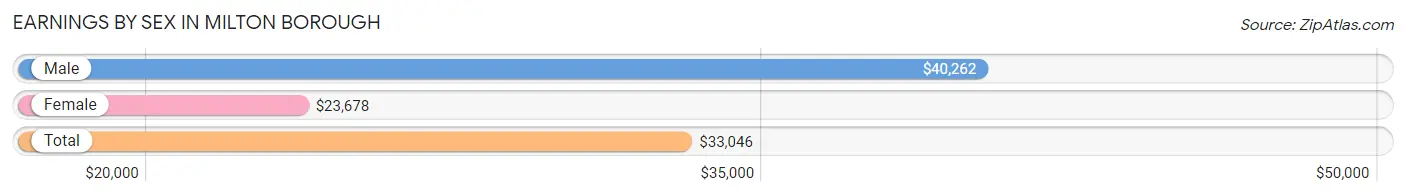
Earnings by Sex in Milton borough
Average Earnings in Milton borough are $33,046, $40,262 for men and $23,678 for women, a difference of 41.2%.
| Sex | Number | Average Earnings |
| Male | 2,160 (58.9%) | $40,262 |
| Female | 1,509 (41.1%) | $23,678 |
| Total | 3,669 (100.0%) | $33,046 |
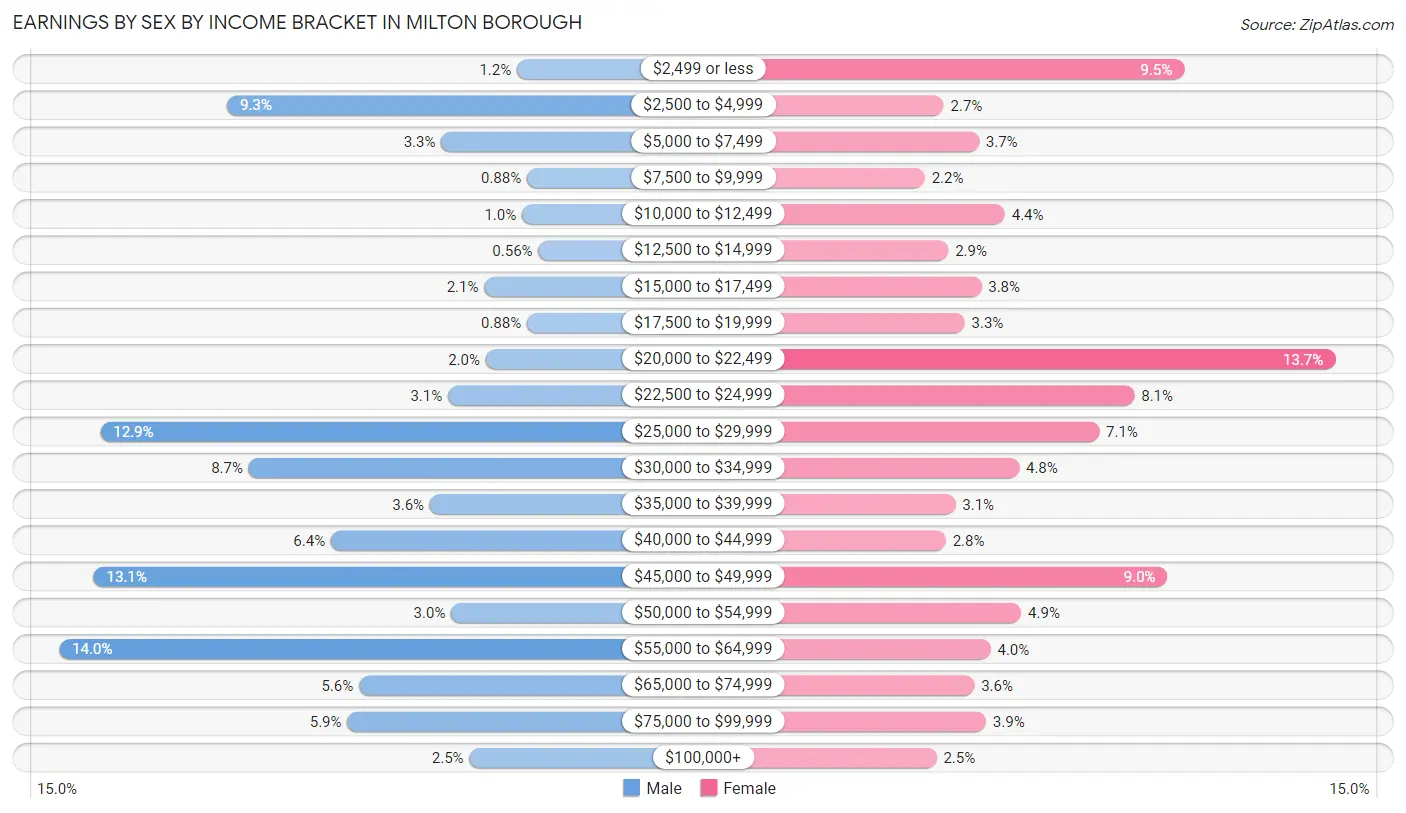
Earnings by Sex by Income Bracket in Milton borough
The most common earnings brackets in Milton borough are $55,000 to $64,999 for men (303 | 14.0%) and $20,000 to $22,499 for women (207 | 13.7%).
| Income | Male | Female |
| $2,499 or less | 25 (1.2%) | 143 (9.5%) |
| $2,500 to $4,999 | 201 (9.3%) | 41 (2.7%) |
| $5,000 to $7,499 | 71 (3.3%) | 56 (3.7%) |
| $7,500 to $9,999 | 19 (0.9%) | 33 (2.2%) |
| $10,000 to $12,499 | 22 (1.0%) | 67 (4.4%) |
| $12,500 to $14,999 | 12 (0.6%) | 43 (2.9%) |
| $15,000 to $17,499 | 45 (2.1%) | 57 (3.8%) |
| $17,500 to $19,999 | 19 (0.9%) | 50 (3.3%) |
| $20,000 to $22,499 | 44 (2.0%) | 207 (13.7%) |
| $22,500 to $24,999 | 67 (3.1%) | 122 (8.1%) |
| $25,000 to $29,999 | 278 (12.9%) | 107 (7.1%) |
| $30,000 to $34,999 | 188 (8.7%) | 73 (4.8%) |
| $35,000 to $39,999 | 78 (3.6%) | 46 (3.0%) |
| $40,000 to $44,999 | 138 (6.4%) | 42 (2.8%) |
| $45,000 to $49,999 | 282 (13.1%) | 136 (9.0%) |
| $50,000 to $54,999 | 65 (3.0%) | 74 (4.9%) |
| $55,000 to $64,999 | 303 (14.0%) | 61 (4.0%) |
| $65,000 to $74,999 | 121 (5.6%) | 54 (3.6%) |
| $75,000 to $99,999 | 128 (5.9%) | 59 (3.9%) |
| $100,000+ | 54 (2.5%) | 38 (2.5%) |
| Total | 2,160 (100.0%) | 1,509 (100.0%) |
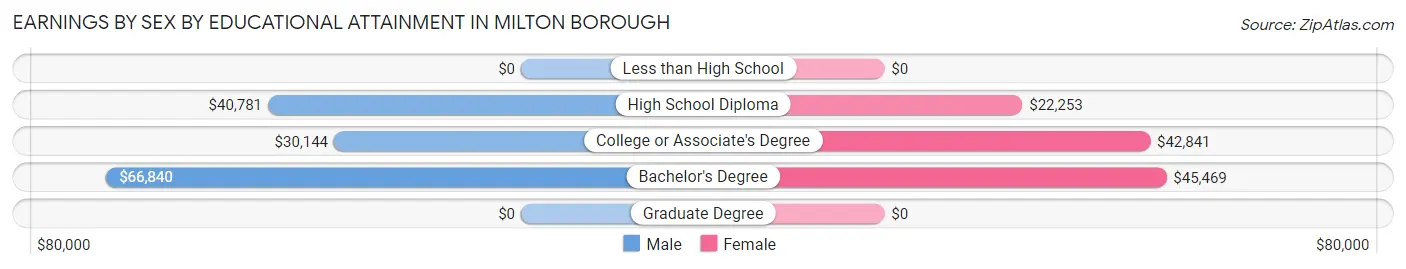
Earnings by Sex by Educational Attainment in Milton borough
Average earnings in Milton borough are $40,571 for men and $25,163 for women, a difference of 38.0%. Men with an educational attainment of bachelor's degree enjoy the highest average annual earnings of $66,840, while those with college or associate's degree education earn the least with $30,144. Women with an educational attainment of bachelor's degree earn the most with the average annual earnings of $45,469, while those with high school diploma education have the smallest earnings of $22,253.
| Educational Attainment | Male Income | Female Income |
| Less than High School | - | - |
| High School Diploma | $40,781 | $22,253 |
| College or Associate's Degree | $30,144 | $42,841 |
| Bachelor's Degree | $66,840 | $45,469 |
| Graduate Degree | - | - |
| Total | $40,571 | $25,163 |
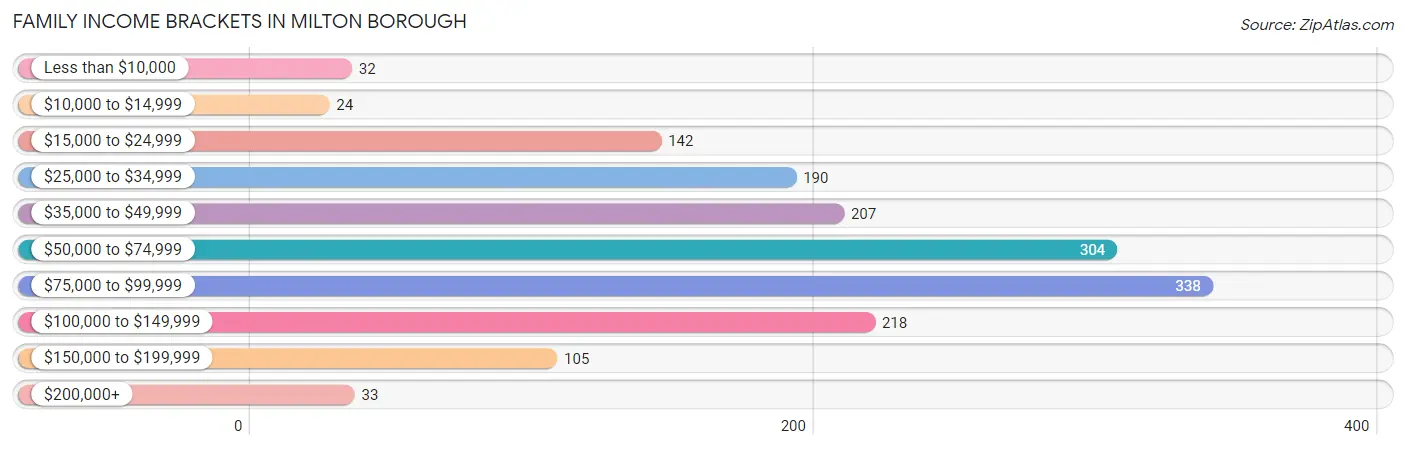
Family Income in Milton borough
Family Income Brackets in Milton borough
According to the Milton borough family income data, there are 338 families falling into the $75,000 to $99,999 income range, which is the most common income bracket and makes up 21.2% of all families. Conversely, the $10,000 to $14,999 income bracket is the least frequent group with only 24 families (1.5%) belonging to this category.
| Income Bracket | # Families | % Families |
| Less than $10,000 | 32 | 2.0% |
| $10,000 to $14,999 | 24 | 1.5% |
| $15,000 to $24,999 | 142 | 8.9% |
| $25,000 to $34,999 | 190 | 11.9% |
| $35,000 to $49,999 | 207 | 13.0% |
| $50,000 to $74,999 | 304 | 19.1% |
| $75,000 to $99,999 | 338 | 21.2% |
| $100,000 to $149,999 | 218 | 13.7% |
| $150,000 to $199,999 | 105 | 6.6% |
| $200,000+ | 33 | 2.1% |
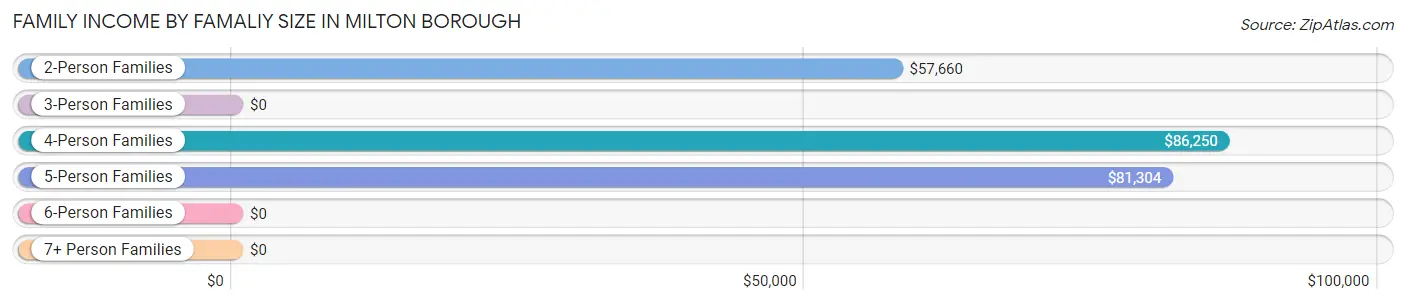
Family Income by Famaliy Size in Milton borough
4-person families (184 | 11.6%) account for the highest median family income in Milton borough with $86,250 per family, while 2-person families (724 | 45.5%) have the highest median income of $28,830 per family member.
| Income Bracket | # Families | Median Income |
| 2-Person Families | 724 (45.5%) | $57,660 |
| 3-Person Families | 522 (32.8%) | $0 |
| 4-Person Families | 184 (11.6%) | $86,250 |
| 5-Person Families | 58 (3.6%) | $81,304 |
| 6-Person Families | 63 (4.0%) | $0 |
| 7+ Person Families | 42 (2.6%) | $0 |
| Total | 1,593 (100.0%) | $63,365 |
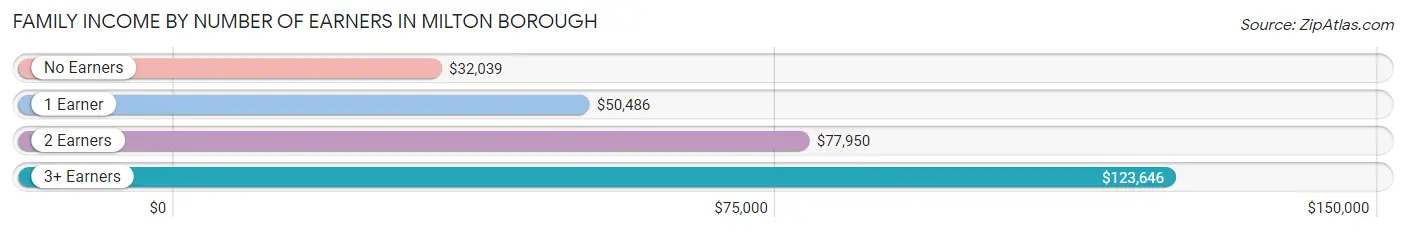
Family Income by Number of Earners in Milton borough
The median family income in Milton borough is $63,365, with families comprising 3+ earners (187) having the highest median family income of $123,646, while families with no earners (157) have the lowest median family income of $32,039, accounting for 11.7% and 9.9% of families, respectively.
| Number of Earners | # Families | Median Income |
| No Earners | 157 (9.9%) | $32,039 |
| 1 Earner | 701 (44.0%) | $50,486 |
| 2 Earners | 548 (34.4%) | $77,950 |
| 3+ Earners | 187 (11.7%) | $123,646 |
| Total | 1,593 (100.0%) | $63,365 |
Household Income in Milton borough
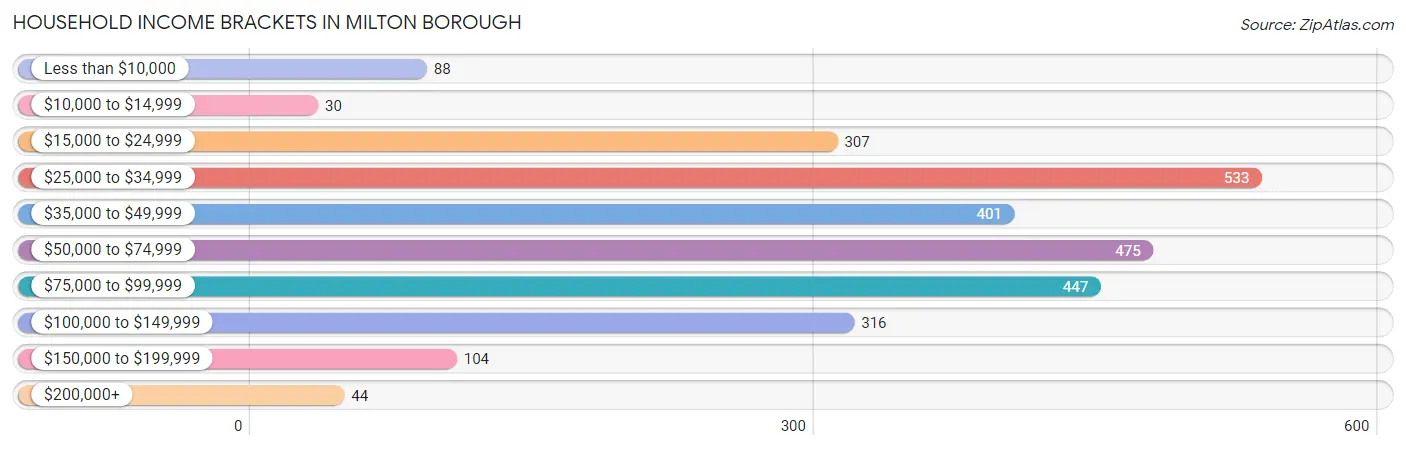
Household Income Brackets in Milton borough
With 533 households falling in the category, the $25,000 to $34,999 income range is the most frequent in Milton borough, accounting for 19.4% of all households. In contrast, only 30 households (1.1%) fall into the $10,000 to $14,999 income bracket, making it the least populous group.
| Income Bracket | # Households | % Households |
| Less than $10,000 | 88 | 3.2% |
| $10,000 to $14,999 | 30 | 1.1% |
| $15,000 to $24,999 | 307 | 11.2% |
| $25,000 to $34,999 | 533 | 19.4% |
| $35,000 to $49,999 | 401 | 14.6% |
| $50,000 to $74,999 | 475 | 17.3% |
| $75,000 to $99,999 | 447 | 16.3% |
| $100,000 to $149,999 | 316 | 11.5% |
| $150,000 to $199,999 | 104 | 3.8% |
| $200,000+ | 44 | 1.6% |
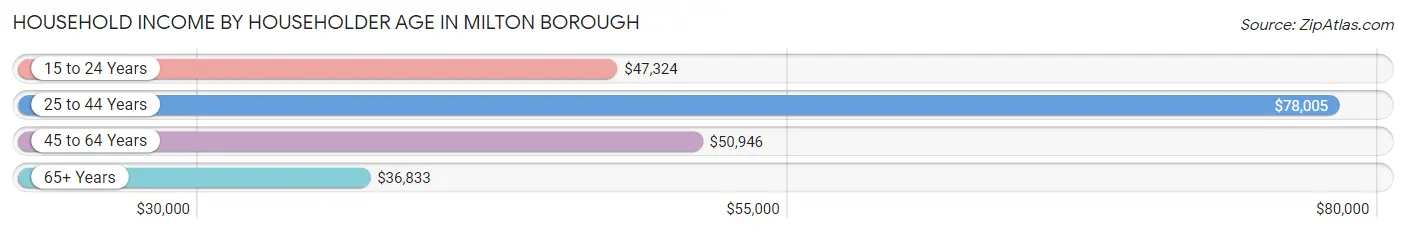
Household Income by Householder Age in Milton borough
The median household income in Milton borough is $50,431, with the highest median household income of $78,005 found in the 25 to 44 years age bracket for the primary householder. A total of 830 households (30.2%) fall into this category. Meanwhile, the 65+ years age bracket for the primary householder has the lowest median household income of $36,833, with 686 households (25.0%) in this group.
| Income Bracket | # Households | Median Income |
| 15 to 24 Years | 294 (10.7%) | $47,324 |
| 25 to 44 Years | 830 (30.2%) | $78,005 |
| 45 to 64 Years | 935 (34.1%) | $50,946 |
| 65+ Years | 686 (25.0%) | $36,833 |
| Total | 2,745 (100.0%) | $50,431 |
Poverty in Milton borough
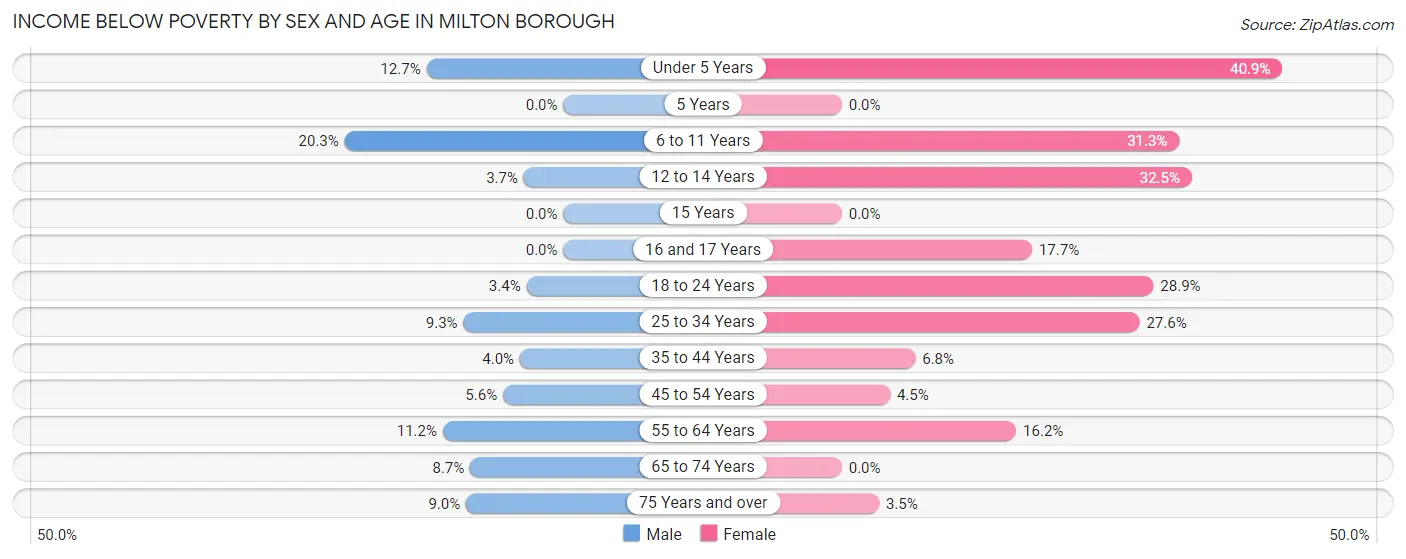
Income Below Poverty by Sex and Age in Milton borough
With 7.6% poverty level for males and 18.3% for females among the residents of Milton borough, 6 to 11 year old males and under 5 year old females are the most vulnerable to poverty, with 41 males (20.3%) and 112 females (40.9%) in their respective age groups living below the poverty level.
| Age Bracket | Male | Female |
| Under 5 Years | 16 (12.7%) | 112 (40.9%) |
| 5 Years | 0 (0.0%) | 0 (0.0%) |
| 6 to 11 Years | 41 (20.3%) | 62 (31.3%) |
| 12 to 14 Years | 9 (3.7%) | 76 (32.5%) |
| 15 Years | 0 (0.0%) | 0 (0.0%) |
| 16 and 17 Years | 0 (0.0%) | 15 (17.6%) |
| 18 to 24 Years | 20 (3.4%) | 72 (28.9%) |
| 25 to 34 Years | 43 (9.3%) | 118 (27.6%) |
| 35 to 44 Years | 11 (4.0%) | 24 (6.8%) |
| 45 to 54 Years | 26 (5.6%) | 11 (4.5%) |
| 55 to 64 Years | 49 (11.2%) | 66 (16.2%) |
| 65 to 74 Years | 18 (8.6%) | 0 (0.0%) |
| 75 Years and over | 26 (9.0%) | 11 (3.5%) |
| Total | 259 (7.6%) | 567 (18.3%) |
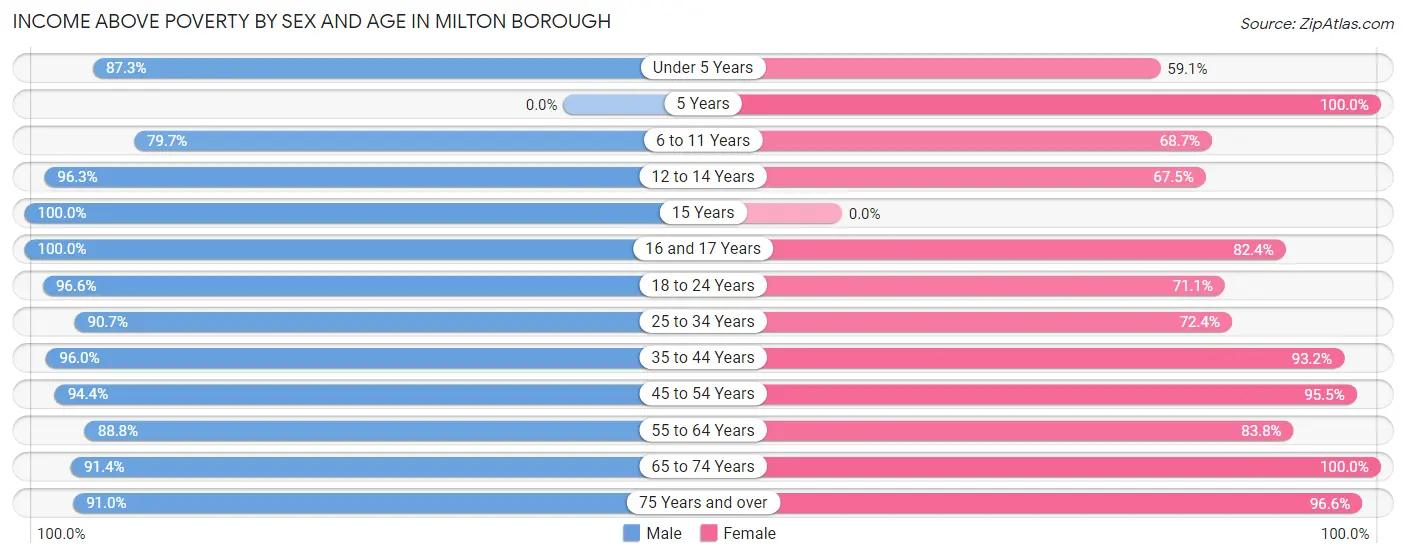
Income Above Poverty by Sex and Age in Milton borough
According to the poverty statistics in Milton borough, males aged 15 years and females aged 5 years are the age groups that are most secure financially, with 100.0% of males and 100.0% of females in these age groups living above the poverty line.
| Age Bracket | Male | Female |
| Under 5 Years | 110 (87.3%) | 162 (59.1%) |
| 5 Years | 0 (0.0%) | 34 (100.0%) |
| 6 to 11 Years | 161 (79.7%) | 136 (68.7%) |
| 12 to 14 Years | 236 (96.3%) | 158 (67.5%) |
| 15 Years | 75 (100.0%) | 0 (0.0%) |
| 16 and 17 Years | 28 (100.0%) | 70 (82.4%) |
| 18 to 24 Years | 565 (96.6%) | 177 (71.1%) |
| 25 to 34 Years | 421 (90.7%) | 309 (72.4%) |
| 35 to 44 Years | 262 (96.0%) | 328 (93.2%) |
| 45 to 54 Years | 438 (94.4%) | 235 (95.5%) |
| 55 to 64 Years | 389 (88.8%) | 342 (83.8%) |
| 65 to 74 Years | 190 (91.3%) | 277 (100.0%) |
| 75 Years and over | 262 (91.0%) | 308 (96.6%) |
| Total | 3,137 (92.4%) | 2,536 (81.7%) |
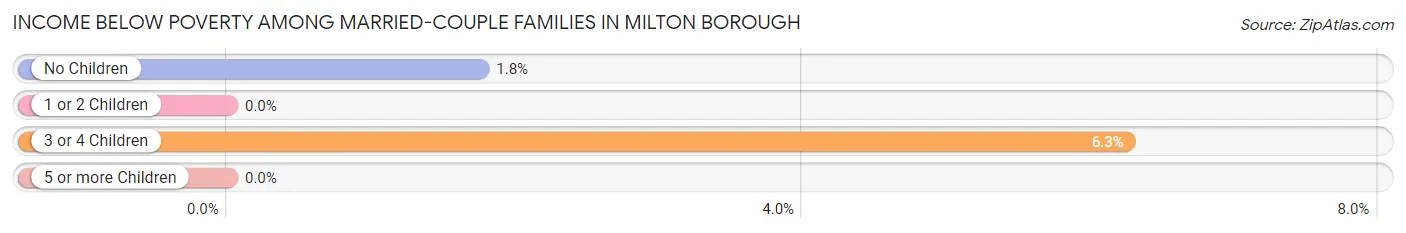
Income Below Poverty Among Married-Couple Families in Milton borough
The poverty statistics for married-couple families in Milton borough show that 1.8% or 19 of the total 1,059 families live below the poverty line. Families with 3 or 4 children have the highest poverty rate of 6.2%, comprising of 8 families. On the other hand, families with 1 or 2 children have the lowest poverty rate of 0.0%, which includes 0 families.
| Children | Above Poverty | Below Poverty |
| No Children | 619 (98.3%) | 11 (1.8%) |
| 1 or 2 Children | 301 (100.0%) | 0 (0.0%) |
| 3 or 4 Children | 120 (93.8%) | 8 (6.2%) |
| 5 or more Children | 0 (0.0%) | 0 (0.0%) |
| Total | 1,040 (98.2%) | 19 (1.8%) |
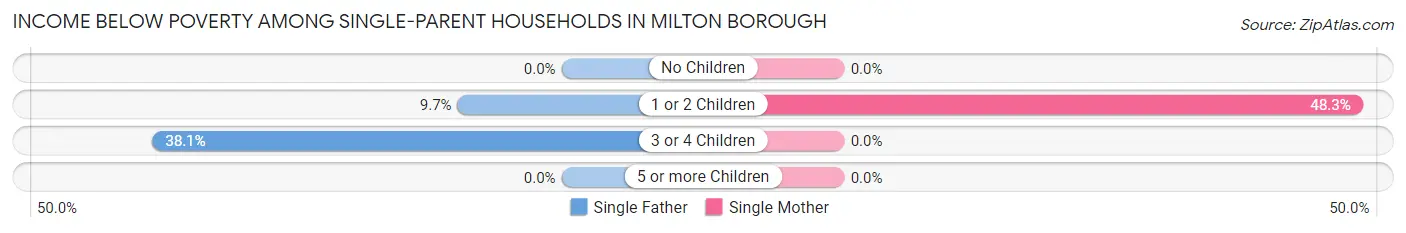
Income Below Poverty Among Single-Parent Households in Milton borough
According to the poverty data in Milton borough, 15.9% or 43 single-father households and 27.3% or 72 single-mother households are living below the poverty line. Among single-father households, those with 3 or 4 children have the highest poverty rate, with 24 households (38.1%) experiencing poverty. Likewise, among single-mother households, those with 1 or 2 children have the highest poverty rate, with 72 households (48.3%) falling below the poverty line.
| Children | Single Father | Single Mother |
| No Children | 0 (0.0%) | 0 (0.0%) |
| 1 or 2 Children | 19 (9.7%) | 72 (48.3%) |
| 3 or 4 Children | 24 (38.1%) | 0 (0.0%) |
| 5 or more Children | 0 (0.0%) | 0 (0.0%) |
| Total | 43 (15.9%) | 72 (27.3%) |
Income Below Poverty Among Married-Couple vs Single-Parent Households in Milton borough
The poverty data for Milton borough shows that 19 of the married-couple family households (1.8%) and 115 of the single-parent households (21.5%) are living below the poverty level. Within the married-couple family households, those with 3 or 4 children have the highest poverty rate, with 8 households (6.2%) falling below the poverty line. Among the single-parent households, those with 3 or 4 children have the highest poverty rate, with 24 household (38.1%) living below poverty.
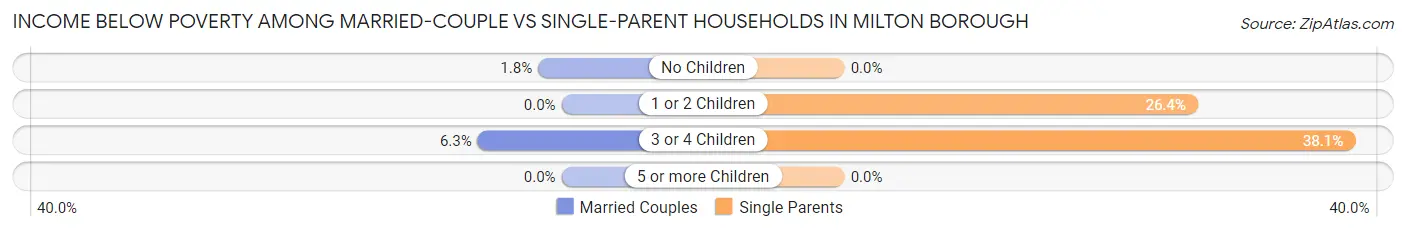
| Children | Married-Couple Families | Single-Parent Households |
| No Children | 11 (1.8%) | 0 (0.0%) |
| 1 or 2 Children | 0 (0.0%) | 91 (26.4%) |
| 3 or 4 Children | 8 (6.2%) | 24 (38.1%) |
| 5 or more Children | 0 (0.0%) | 0 (0.0%) |
| Total | 19 (1.8%) | 115 (21.5%) |
Race in Milton borough
The most populous races in Milton borough are White / Caucasian (6,286 | 95.1%), Hispanic or Latino (602 | 9.1%), and Some other Race (161 | 2.4%).
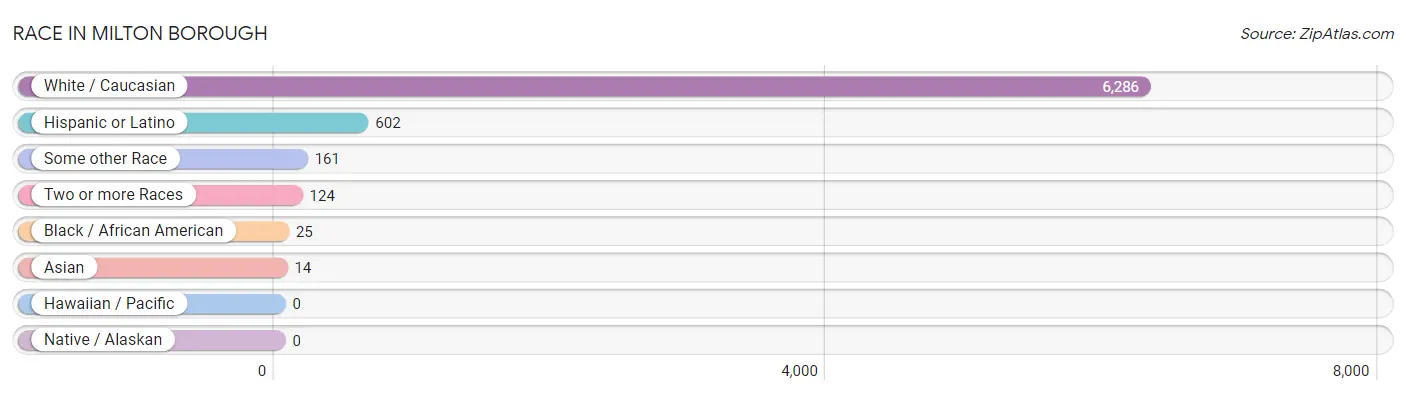
| Race | # Population | % Population |
| Asian | 14 | 0.2% |
| Black / African American | 25 | 0.4% |
| Hawaiian / Pacific | 0 | 0.0% |
| Hispanic or Latino | 602 | 9.1% |
| Native / Alaskan | 0 | 0.0% |
| White / Caucasian | 6,286 | 95.1% |
| Two or more Races | 124 | 1.9% |
| Some other Race | 161 | 2.4% |
| Total | 6,610 | 100.0% |
Ancestry in Milton borough
The most populous ancestries reported in Milton borough are German (2,479 | 37.5%), English (795 | 12.0%), Irish (634 | 9.6%), Scottish (541 | 8.2%), and Italian (289 | 4.4%), together accounting for 71.7% of all Milton borough residents.
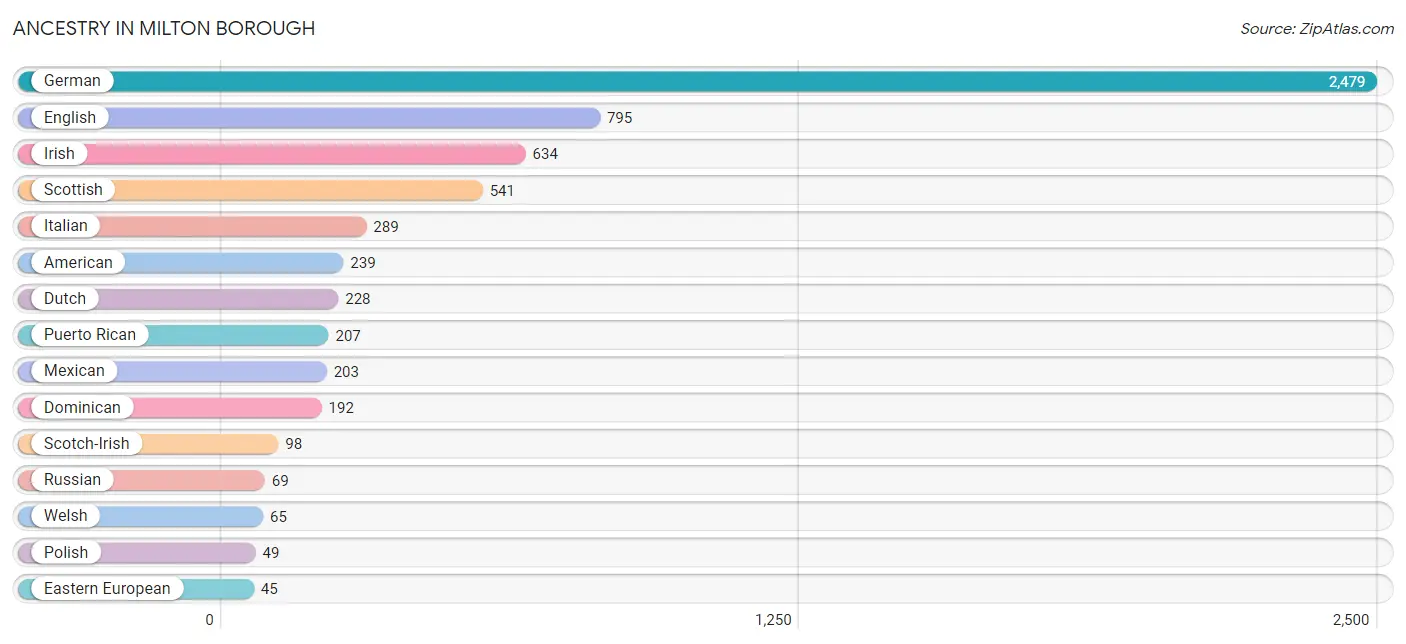
| Ancestry | # Population | % Population |
| African | 17 | 0.3% |
| American | 239 | 3.6% |
| Blackfeet | 38 | 0.6% |
| British | 24 | 0.4% |
| Dominican | 192 | 2.9% |
| Dutch | 228 | 3.5% |
| Eastern European | 45 | 0.7% |
| English | 795 | 12.0% |
| European | 18 | 0.3% |
| French | 6 | 0.1% |
| German | 2,479 | 37.5% |
| Greek | 5 | 0.1% |
| Guyanese | 22 | 0.3% |
| Hungarian | 20 | 0.3% |
| Irish | 634 | 9.6% |
| Italian | 289 | 4.4% |
| Jamaican | 11 | 0.2% |
| Korean | 14 | 0.2% |
| Lithuanian | 12 | 0.2% |
| Mexican | 203 | 3.1% |
| Northern European | 17 | 0.3% |
| Pennsylvania German | 30 | 0.4% |
| Polish | 49 | 0.7% |
| Puerto Rican | 207 | 3.1% |
| Russian | 69 | 1.0% |
| Scandinavian | 23 | 0.4% |
| Scotch-Irish | 98 | 1.5% |
| Scottish | 541 | 8.2% |
| Slovak | 35 | 0.5% |
| Subsaharan African | 17 | 0.3% |
| Welsh | 65 | 1.0% | View All 31 Rows |
Immigrants in Milton borough
The most numerous immigrant groups reported in Milton borough came from Latin America (229 | 3.5%), Caribbean (203 | 3.1%), Dominican Republic (192 | 2.9%), Asia (27 | 0.4%), and South America (26 | 0.4%), together accounting for 10.2% of all Milton borough residents.
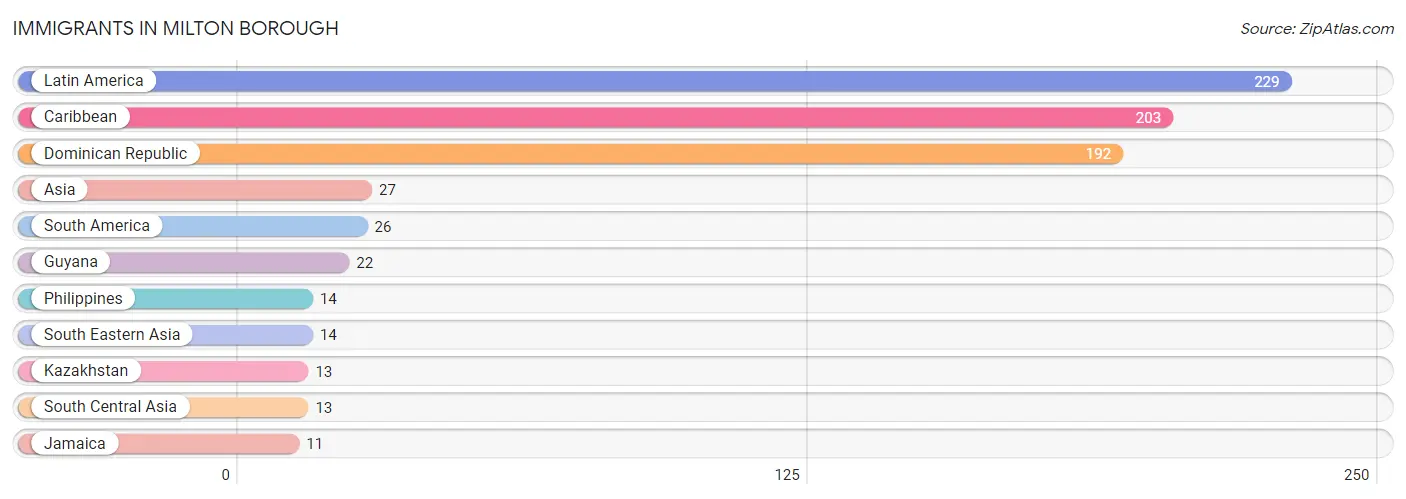
| Immigration Origin | # Population | % Population |
| Asia | 27 | 0.4% |
| Caribbean | 203 | 3.1% |
| Dominican Republic | 192 | 2.9% |
| Guyana | 22 | 0.3% |
| Jamaica | 11 | 0.2% |
| Kazakhstan | 13 | 0.2% |
| Latin America | 229 | 3.5% |
| Philippines | 14 | 0.2% |
| South America | 26 | 0.4% |
| South Central Asia | 13 | 0.2% |
| South Eastern Asia | 14 | 0.2% | View All 11 Rows |
Sex and Age in Milton borough
Sex and Age in Milton borough
The most populous age groups in Milton borough are 20 to 24 Years (515 | 15.0%) for men and 10 to 14 Years (306 | 9.6%) for women.
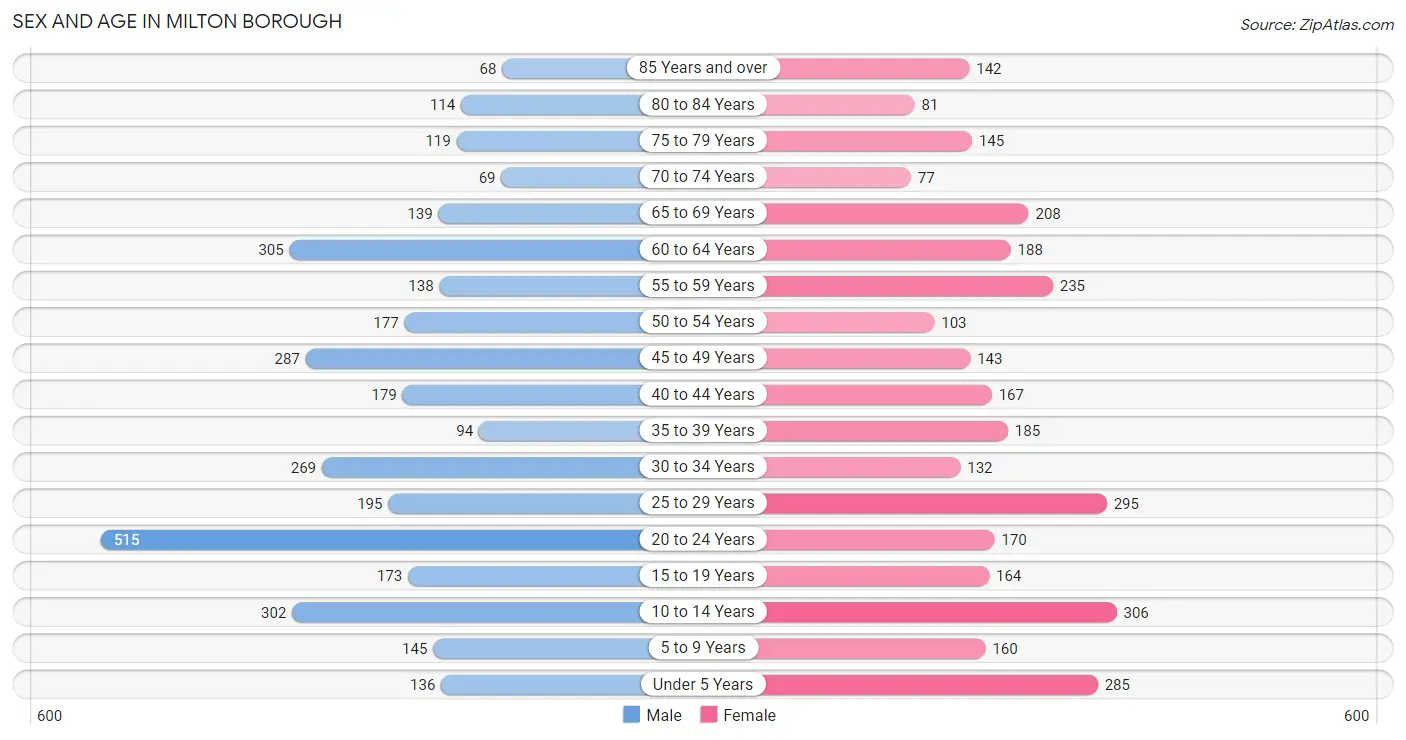
| Age Bracket | Male | Female |
| Under 5 Years | 136 (4.0%) | 285 (8.9%) |
| 5 to 9 Years | 145 (4.2%) | 160 (5.0%) |
| 10 to 14 Years | 302 (8.8%) | 306 (9.6%) |
| 15 to 19 Years | 173 (5.1%) | 164 (5.1%) |
| 20 to 24 Years | 515 (15.0%) | 170 (5.3%) |
| 25 to 29 Years | 195 (5.7%) | 295 (9.3%) |
| 30 to 34 Years | 269 (7.9%) | 132 (4.1%) |
| 35 to 39 Years | 94 (2.8%) | 185 (5.8%) |
| 40 to 44 Years | 179 (5.2%) | 167 (5.2%) |
| 45 to 49 Years | 287 (8.4%) | 143 (4.5%) |
| 50 to 54 Years | 177 (5.2%) | 103 (3.2%) |
| 55 to 59 Years | 138 (4.0%) | 235 (7.4%) |
| 60 to 64 Years | 305 (8.9%) | 188 (5.9%) |
| 65 to 69 Years | 139 (4.1%) | 208 (6.5%) |
| 70 to 74 Years | 69 (2.0%) | 77 (2.4%) |
| 75 to 79 Years | 119 (3.5%) | 145 (4.5%) |
| 80 to 84 Years | 114 (3.3%) | 81 (2.5%) |
| 85 Years and over | 68 (2.0%) | 142 (4.5%) |
| Total | 3,424 (100.0%) | 3,186 (100.0%) |
Families and Households in Milton borough
Median Family Size in Milton borough
The median family size in Milton borough is 3.04 persons per family, with married-couple families (1,059 | 66.5%) accounting for the largest median family size of 3.18 persons per family. On the other hand, single male/father families (270 | 17.0%) represent the smallest median family size with 2.68 persons per family.
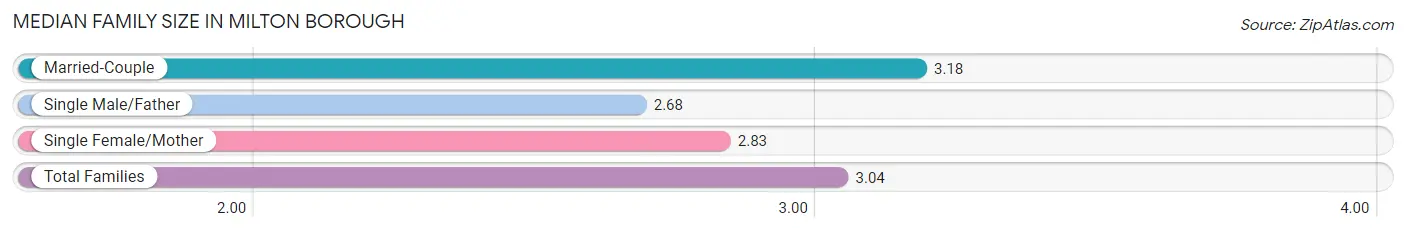
| Family Type | # Families | Family Size |
| Married-Couple | 1,059 (66.5%) | 3.18 |
| Single Male/Father | 270 (17.0%) | 2.68 |
| Single Female/Mother | 264 (16.6%) | 2.83 |
| Total Families | 1,593 (100.0%) | 3.04 |
Median Household Size in Milton borough
The median household size in Milton borough is 2.36 persons per household, with single female/mother households (264 | 9.6%) accounting for the largest median household size of 3.33 persons per household. non-family households (1,152 | 42.0%) represent the smallest median household size with 1.17 persons per household.
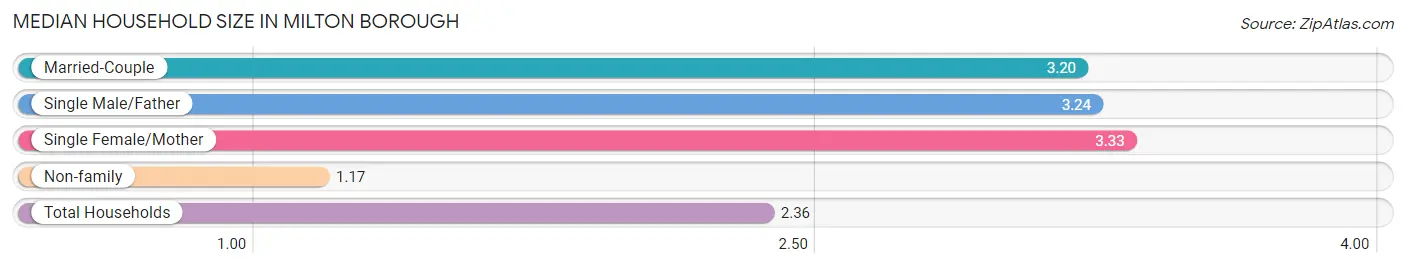
| Household Type | # Households | Household Size |
| Married-Couple | 1,059 (38.6%) | 3.20 |
| Single Male/Father | 270 (9.8%) | 3.24 |
| Single Female/Mother | 264 (9.6%) | 3.33 |
| Non-family | 1,152 (42.0%) | 1.17 |
| Total Households | 2,745 (100.0%) | 2.36 |
Household Size by Marriage Status in Milton borough
Out of a total of 2,745 households in Milton borough, 1,593 (58.0%) are family households, while 1,152 (42.0%) are nonfamily households. The most numerous type of family households are 2-person households, comprising 652, and the most common type of nonfamily households are 1-person households, comprising 967.
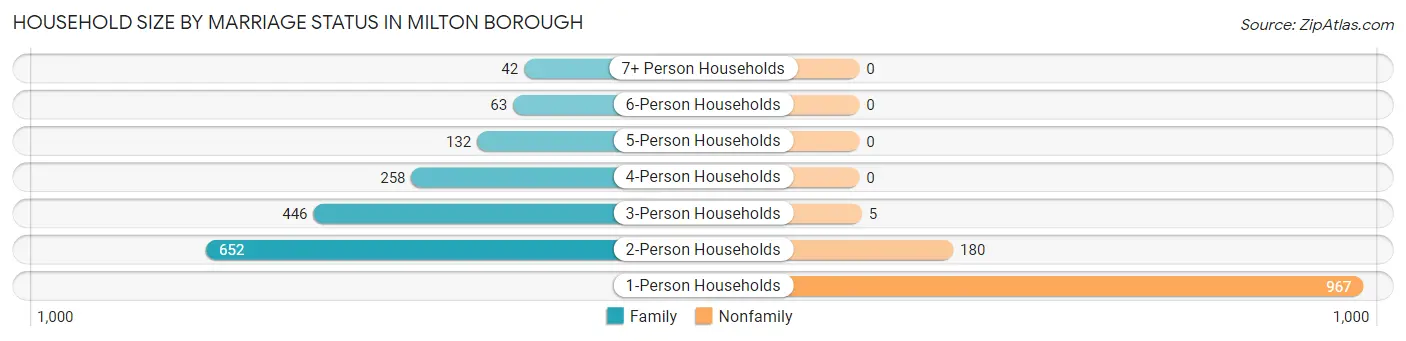
| Household Size | Family Households | Nonfamily Households |
| 1-Person Households | - | 967 (35.2%) |
| 2-Person Households | 652 (23.7%) | 180 (6.6%) |
| 3-Person Households | 446 (16.3%) | 5 (0.2%) |
| 4-Person Households | 258 (9.4%) | 0 (0.0%) |
| 5-Person Households | 132 (4.8%) | 0 (0.0%) |
| 6-Person Households | 63 (2.3%) | 0 (0.0%) |
| 7+ Person Households | 42 (1.5%) | 0 (0.0%) |
| Total | 1,593 (58.0%) | 1,152 (42.0%) |
Female Fertility in Milton borough
Fertility by Age in Milton borough
Average fertility rate in Milton borough is 92.0 births per 1,000 women. Women in the age bracket of 20 to 34 years have the highest fertility rate with 193.0 births per 1,000 women. Women in the age bracket of 20 to 34 years acount for 100.0% of all women with births.
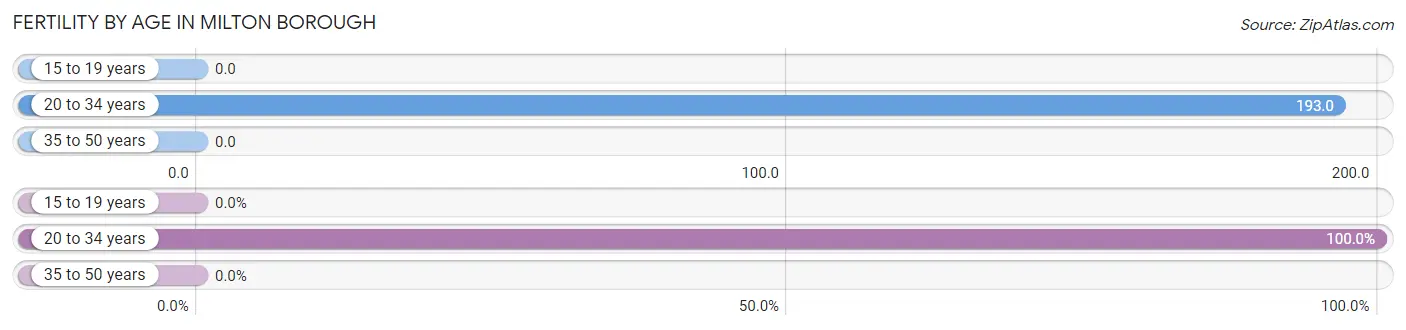
| Age Bracket | Women with Births | Births / 1,000 Women |
| 15 to 19 years | 0 (0.0%) | 0.0 |
| 20 to 34 years | 115 (100.0%) | 193.0 |
| 35 to 50 years | 0 (0.0%) | 0.0 |
| Total | 115 (100.0%) | 92.0 |
Fertility by Age by Marriage Status in Milton borough
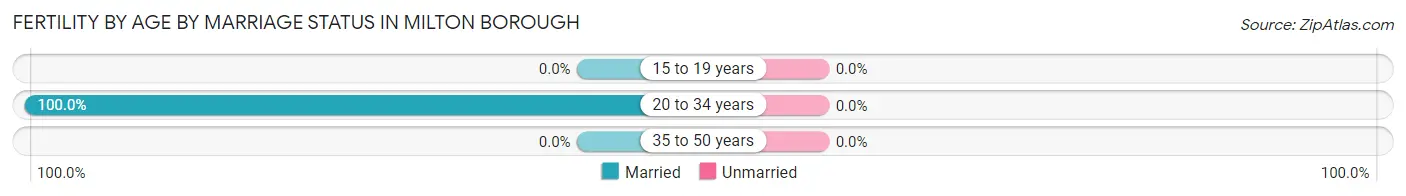
| Age Bracket | Married | Unmarried |
| 15 to 19 years | 0 (0.0%) | 0 (0.0%) |
| 20 to 34 years | 115 (100.0%) | 0 (0.0%) |
| 35 to 50 years | 0 (0.0%) | 0 (0.0%) |
| Total | 115 (100.0%) | 0 (0.0%) |
Fertility by Education in Milton borough
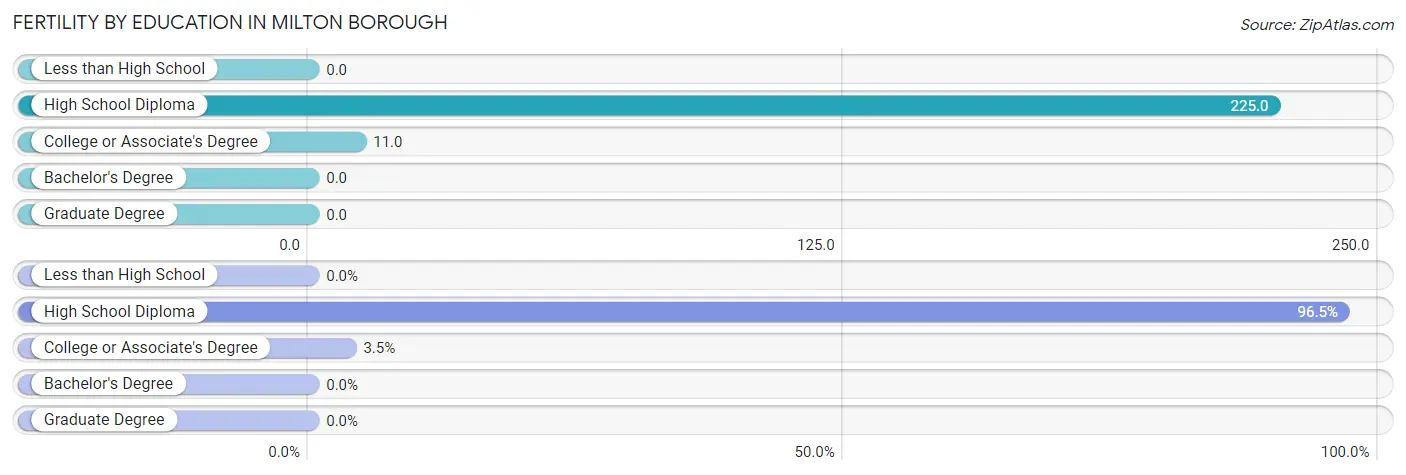
| Educational Attainment | Women with Births | Births / 1,000 Women |
| Less than High School | 0 (0.0%) | 0.0 |
| High School Diploma | 111 (96.5%) | 225.0 |
| College or Associate's Degree | 4 (3.5%) | 11.0 |
| Bachelor's Degree | 0 (0.0%) | 0.0 |
| Graduate Degree | 0 (0.0%) | 0.0 |
| Total | 115 (100.0%) | 92.0 |
Fertility by Education by Marriage Status in Milton borough
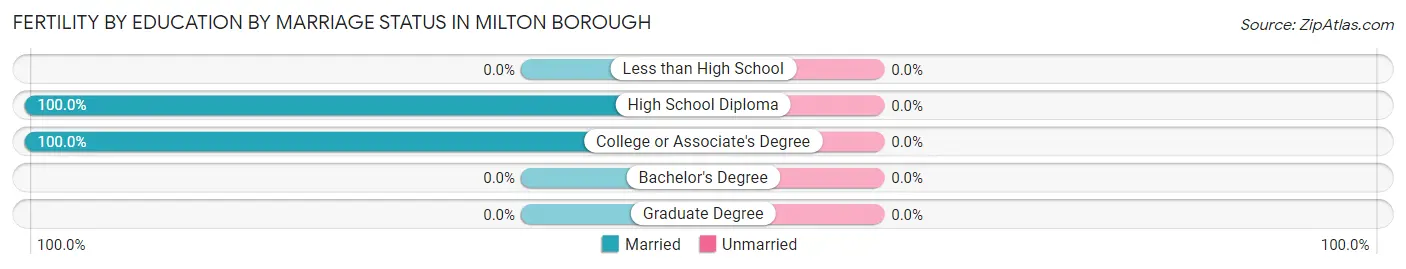
| Educational Attainment | Married | Unmarried |
| Less than High School | 0 (0.0%) | 0 (0.0%) |
| High School Diploma | 111 (100.0%) | 0 (0.0%) |
| College or Associate's Degree | 4 (100.0%) | 0 (0.0%) |
| Bachelor's Degree | 0 (0.0%) | 0 (0.0%) |
| Graduate Degree | 0 (0.0%) | 0 (0.0%) |
| Total | 115 (100.0%) | 0 (0.0%) |
Employment Characteristics in Milton borough
Employment by Class of Employer in Milton borough
Among the 3,287 employed individuals in Milton borough, private company employees (2,246 | 68.3%), not-for-profit organizations (524 | 15.9%), and self-employed (not incorporated) (222 | 6.8%) make up the most common classes of employment.
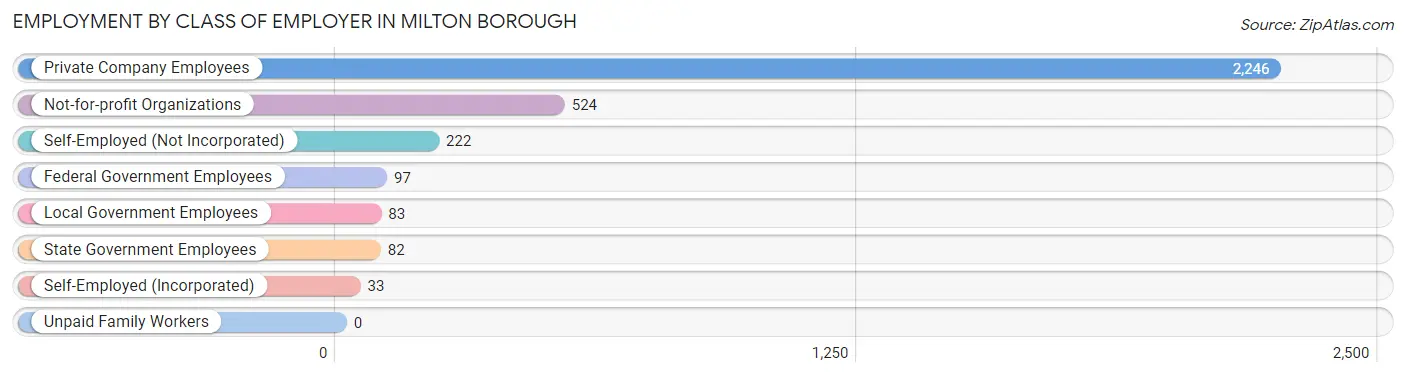
| Employer Class | # Employees | % Employees |
| Private Company Employees | 2,246 | 68.3% |
| Self-Employed (Incorporated) | 33 | 1.0% |
| Self-Employed (Not Incorporated) | 222 | 6.8% |
| Not-for-profit Organizations | 524 | 15.9% |
| Local Government Employees | 83 | 2.5% |
| State Government Employees | 82 | 2.5% |
| Federal Government Employees | 97 | 2.9% |
| Unpaid Family Workers | 0 | 0.0% |
| Total | 3,287 | 100.0% |
Employment Status by Age in Milton borough
According to the labor force statistics for Milton borough, out of the total population over 16 years of age (5,201), 70.3% or 3,656 individuals are in the labor force, with 7.0% or 256 of them unemployed. The age group with the highest labor force participation rate is 20 to 24 years, with 95.3% or 653 individuals in the labor force. Within the labor force, the 60 to 64 years age range has the highest percentage of unemployed individuals, with 16.3% or 60 of them being unemployed.
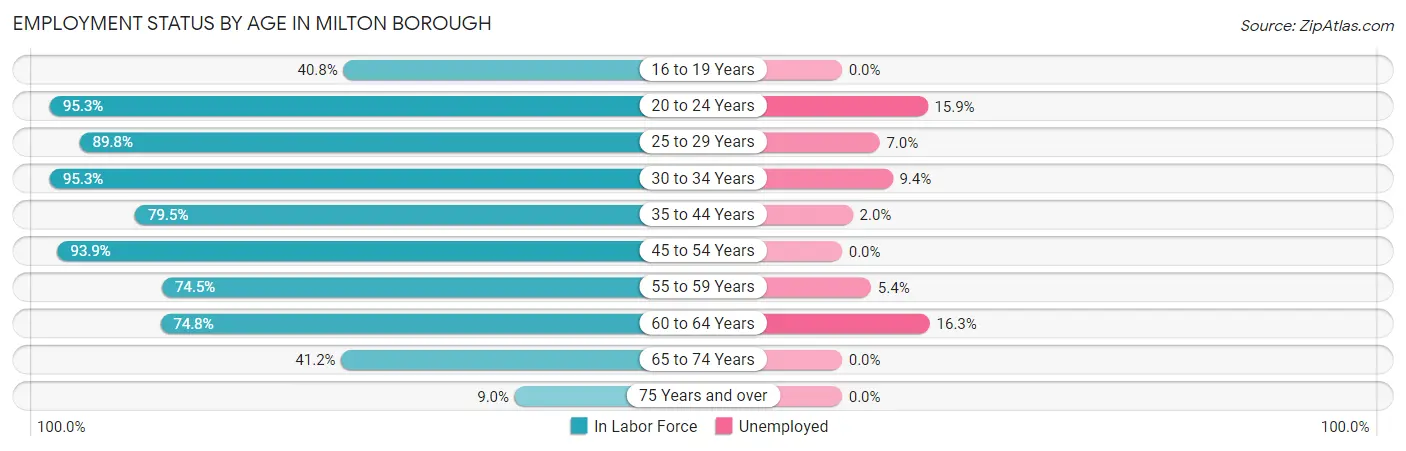
| Age Bracket | In Labor Force | Unemployed |
| 16 to 19 Years | 107 (40.8%) | 0 (0.0%) |
| 20 to 24 Years | 653 (95.3%) | 104 (15.9%) |
| 25 to 29 Years | 440 (89.8%) | 31 (7.0%) |
| 30 to 34 Years | 382 (95.3%) | 36 (9.4%) |
| 35 to 44 Years | 497 (79.5%) | 10 (2.0%) |
| 45 to 54 Years | 667 (93.9%) | 0 (0.0%) |
| 55 to 59 Years | 278 (74.5%) | 15 (5.4%) |
| 60 to 64 Years | 369 (74.8%) | 60 (16.3%) |
| 65 to 74 Years | 203 (41.2%) | 0 (0.0%) |
| 75 Years and over | 60 (9.0%) | 0 (0.0%) |
| Total | 3,656 (70.3%) | 256 (7.0%) |
Employment Status by Educational Attainment in Milton borough
According to labor force statistics for Milton borough, 85.2% of individuals (2,634) out of the total population between 25 and 64 years of age (3,092) are in the labor force, with 5.8% or 153 of them being unemployed. The group with the highest labor force participation rate are those with the educational attainment of college / associate degree, with 92.8% or 931 individuals in the labor force. Within the labor force, individuals with college / associate degree education have the highest percentage of unemployment, with 11.4% or 106 of them being unemployed.
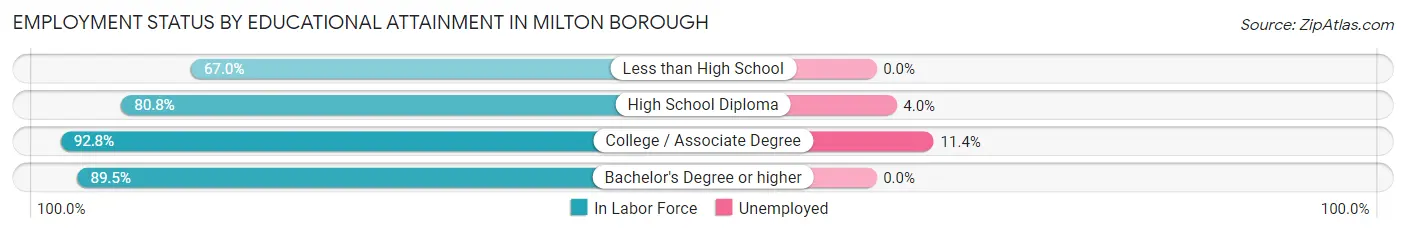
| Educational Attainment | In Labor Force | Unemployed |
| Less than High School | 136 (67.0%) | 0 (0.0%) |
| High School Diploma | 1,138 (80.8%) | 56 (4.0%) |
| College / Associate Degree | 931 (92.8%) | 114 (11.4%) |
| Bachelor's Degree or higher | 428 (89.5%) | 0 (0.0%) |
| Total | 2,634 (85.2%) | 179 (5.8%) |
Employment Occupations by Sex in Milton borough
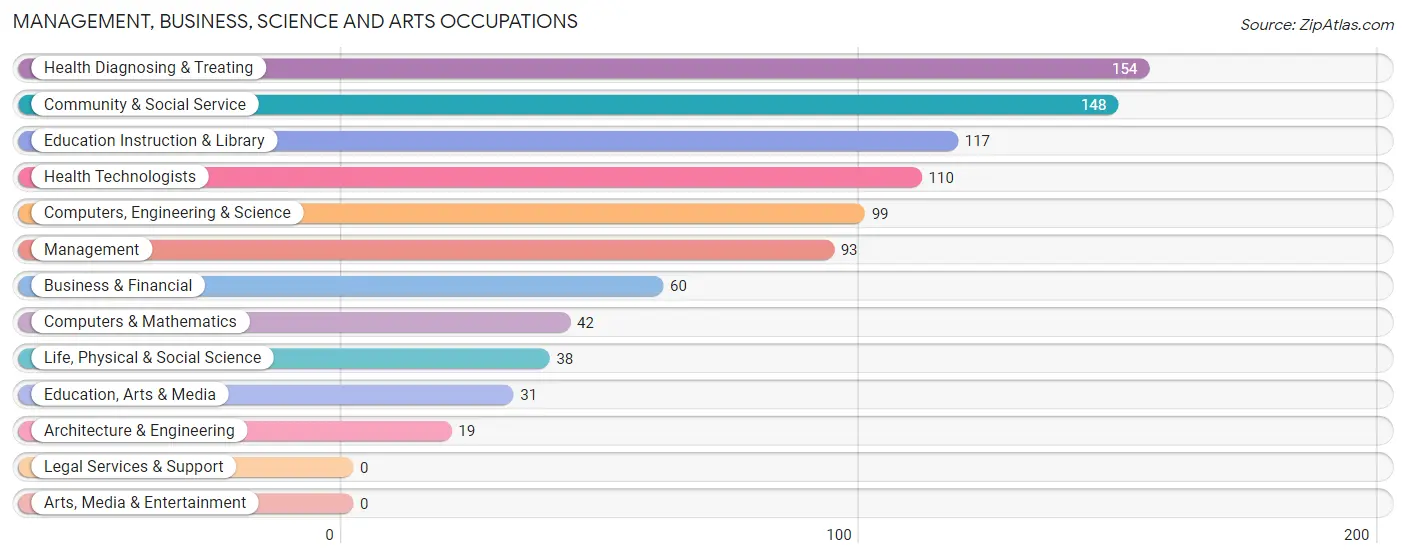
Management, Business, Science and Arts Occupations
The most common Management, Business, Science and Arts occupations in Milton borough are Health Diagnosing & Treating (154 | 4.5%), Community & Social Service (148 | 4.3%), Education Instruction & Library (117 | 3.4%), Health Technologists (110 | 3.2%), and Computers, Engineering & Science (99 | 2.9%).
Management, Business, Science and Arts Occupations by Sex
Within the Management, Business, Science and Arts occupations in Milton borough, the most male-oriented occupations are Computers & Mathematics (100.0%), Life, Physical & Social Science (100.0%), and Computers, Engineering & Science (91.9%), while the most female-oriented occupations are Health Diagnosing & Treating (88.3%), Health Technologists (88.2%), and Education Instruction & Library (83.8%).
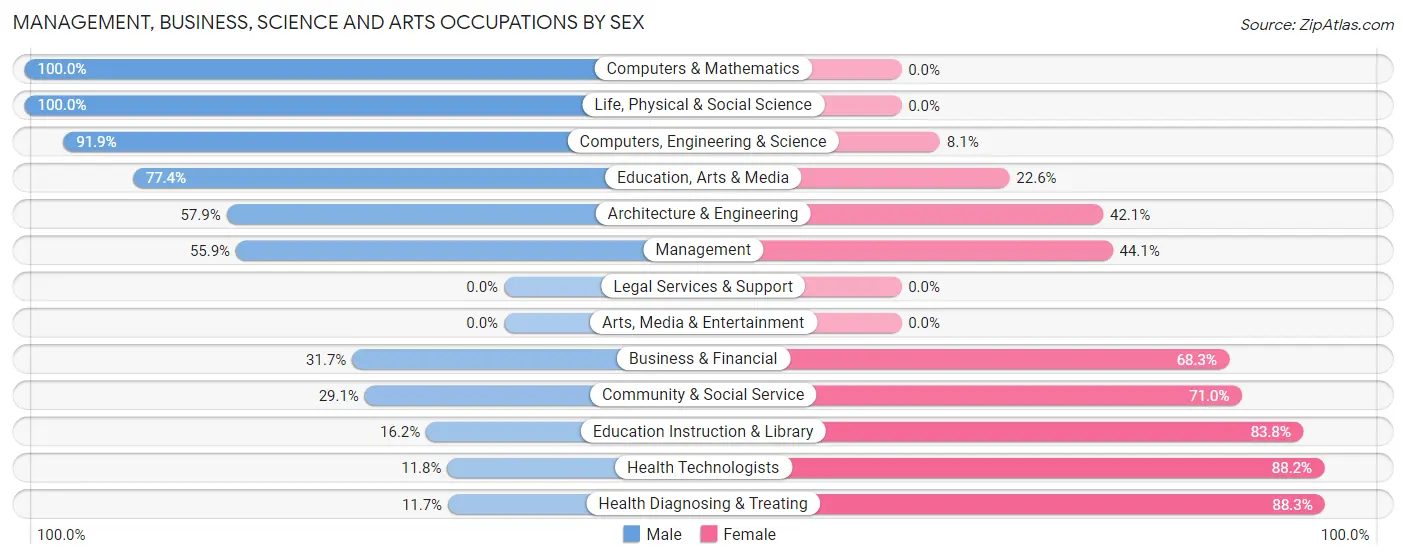
| Occupation | Male | Female |
| Management | 52 (55.9%) | 41 (44.1%) |
| Business & Financial | 19 (31.7%) | 41 (68.3%) |
| Computers, Engineering & Science | 91 (91.9%) | 8 (8.1%) |
| Computers & Mathematics | 42 (100.0%) | 0 (0.0%) |
| Architecture & Engineering | 11 (57.9%) | 8 (42.1%) |
| Life, Physical & Social Science | 38 (100.0%) | 0 (0.0%) |
| Community & Social Service | 43 (29.0%) | 105 (71.0%) |
| Education, Arts & Media | 24 (77.4%) | 7 (22.6%) |
| Legal Services & Support | 0 (0.0%) | 0 (0.0%) |
| Education Instruction & Library | 19 (16.2%) | 98 (83.8%) |
| Arts, Media & Entertainment | 0 (0.0%) | 0 (0.0%) |
| Health Diagnosing & Treating | 18 (11.7%) | 136 (88.3%) |
| Health Technologists | 13 (11.8%) | 97 (88.2%) |
| Total (Category) | 223 (40.3%) | 331 (59.8%) |
| Total (Overall) | 1,915 (56.3%) | 1,485 (43.7%) |
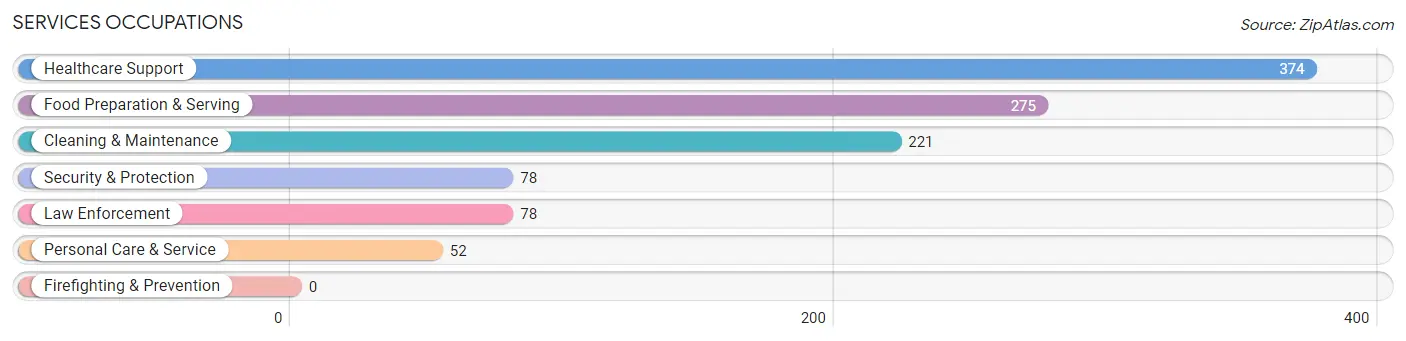
Services Occupations
The most common Services occupations in Milton borough are Healthcare Support (374 | 11.0%), Food Preparation & Serving (275 | 8.1%), Cleaning & Maintenance (221 | 6.5%), Security & Protection (78 | 2.3%), and Law Enforcement (78 | 2.3%).
Services Occupations by Sex
Within the Services occupations in Milton borough, the most male-oriented occupations are Security & Protection (67.9%), Law Enforcement (67.9%), and Food Preparation & Serving (41.1%), while the most female-oriented occupations are Personal Care & Service (100.0%), Healthcare Support (94.4%), and Cleaning & Maintenance (62.0%).
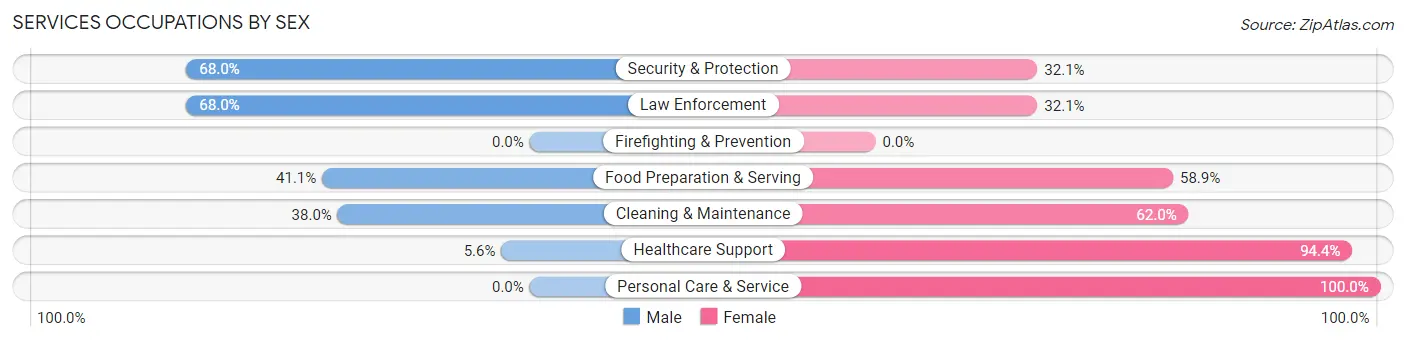
| Occupation | Male | Female |
| Healthcare Support | 21 (5.6%) | 353 (94.4%) |
| Security & Protection | 53 (67.9%) | 25 (32.1%) |
| Firefighting & Prevention | 0 (0.0%) | 0 (0.0%) |
| Law Enforcement | 53 (67.9%) | 25 (32.1%) |
| Food Preparation & Serving | 113 (41.1%) | 162 (58.9%) |
| Cleaning & Maintenance | 84 (38.0%) | 137 (62.0%) |
| Personal Care & Service | 0 (0.0%) | 52 (100.0%) |
| Total (Category) | 271 (27.1%) | 729 (72.9%) |
| Total (Overall) | 1,915 (56.3%) | 1,485 (43.7%) |
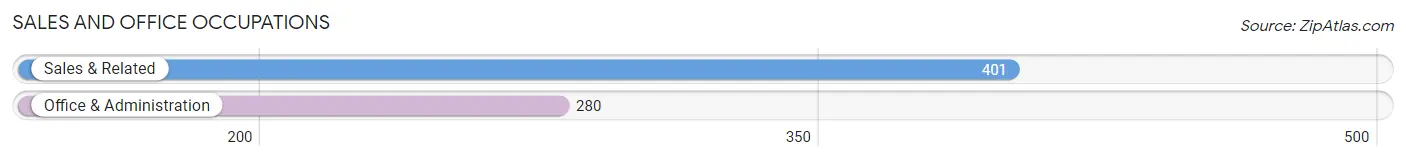
Sales and Office Occupations
The most common Sales and Office occupations in Milton borough are Sales & Related (401 | 11.8%), and Office & Administration (280 | 8.2%).
Sales and Office Occupations by Sex
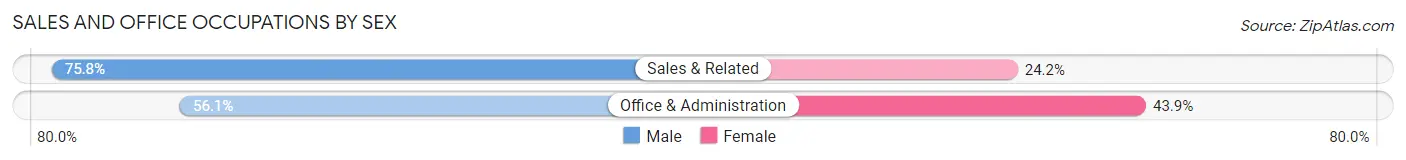
| Occupation | Male | Female |
| Sales & Related | 304 (75.8%) | 97 (24.2%) |
| Office & Administration | 157 (56.1%) | 123 (43.9%) |
| Total (Category) | 461 (67.7%) | 220 (32.3%) |
| Total (Overall) | 1,915 (56.3%) | 1,485 (43.7%) |
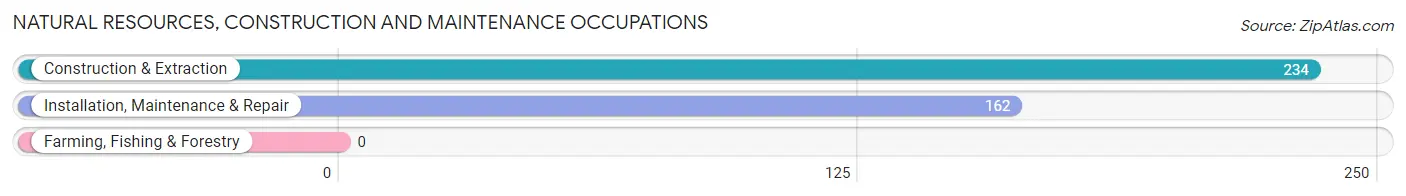
Natural Resources, Construction and Maintenance Occupations
The most common Natural Resources, Construction and Maintenance occupations in Milton borough are Construction & Extraction (234 | 6.9%), and Installation, Maintenance & Repair (162 | 4.8%).
Natural Resources, Construction and Maintenance Occupations by Sex
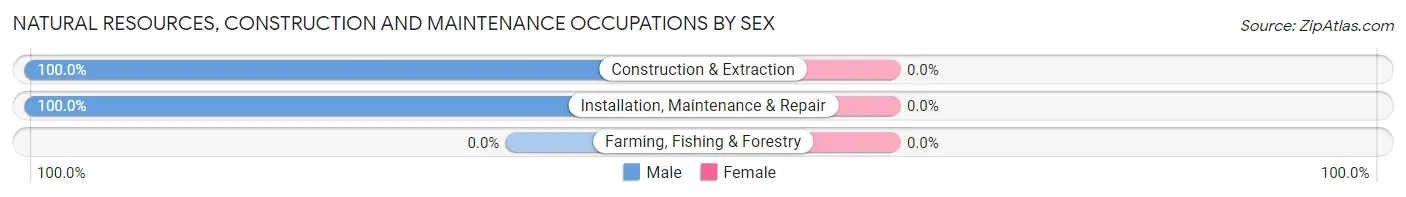
| Occupation | Male | Female |
| Farming, Fishing & Forestry | 0 (0.0%) | 0 (0.0%) |
| Construction & Extraction | 234 (100.0%) | 0 (0.0%) |
| Installation, Maintenance & Repair | 162 (100.0%) | 0 (0.0%) |
| Total (Category) | 396 (100.0%) | 0 (0.0%) |
| Total (Overall) | 1,915 (56.3%) | 1,485 (43.7%) |
Production, Transportation and Moving Occupations
The most common Production, Transportation and Moving occupations in Milton borough are Material Moving (396 | 11.7%), Production (296 | 8.7%), and Transportation (77 | 2.3%).
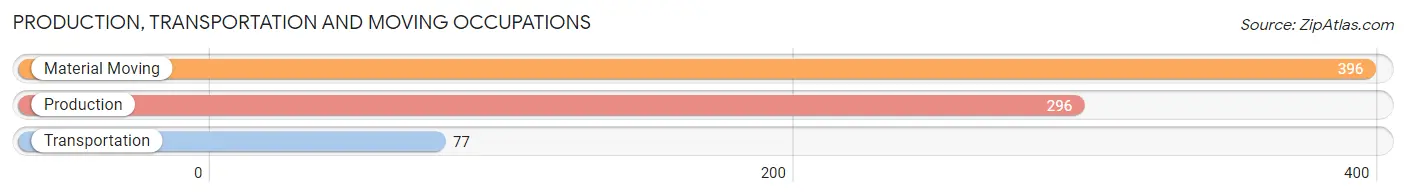
Production, Transportation and Moving Occupations by Sex
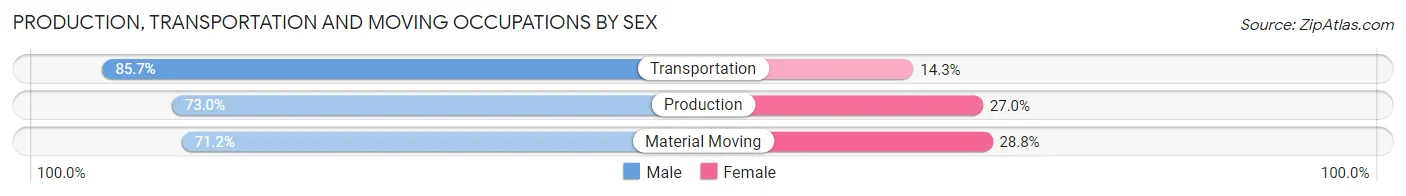
| Occupation | Male | Female |
| Production | 216 (73.0%) | 80 (27.0%) |
| Transportation | 66 (85.7%) | 11 (14.3%) |
| Material Moving | 282 (71.2%) | 114 (28.8%) |
| Total (Category) | 564 (73.3%) | 205 (26.7%) |
| Total (Overall) | 1,915 (56.3%) | 1,485 (43.7%) |
Employment Industries by Sex in Milton borough
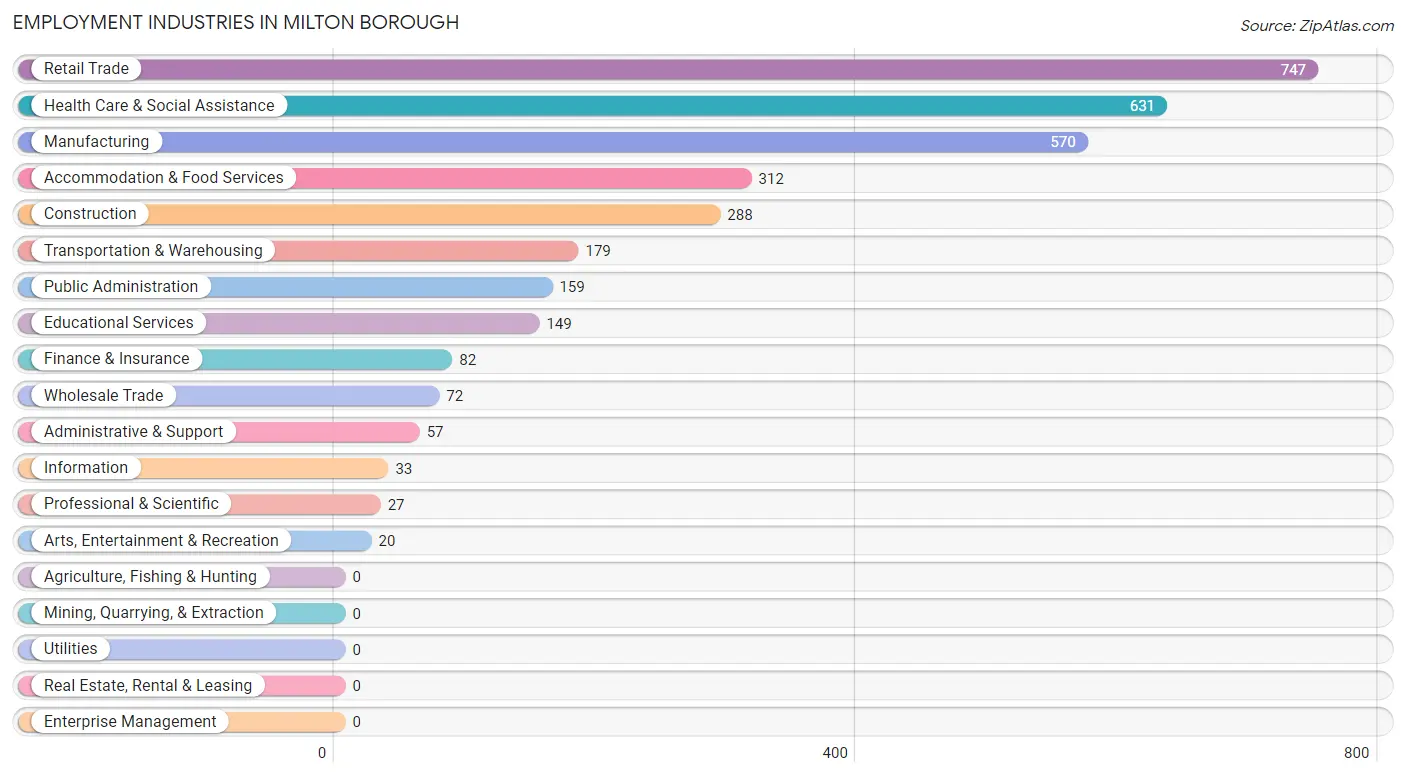
Employment Industries in Milton borough
The major employment industries in Milton borough include Retail Trade (747 | 22.0%), Health Care & Social Assistance (631 | 18.6%), Manufacturing (570 | 16.8%), Accommodation & Food Services (312 | 9.2%), and Construction (288 | 8.5%).
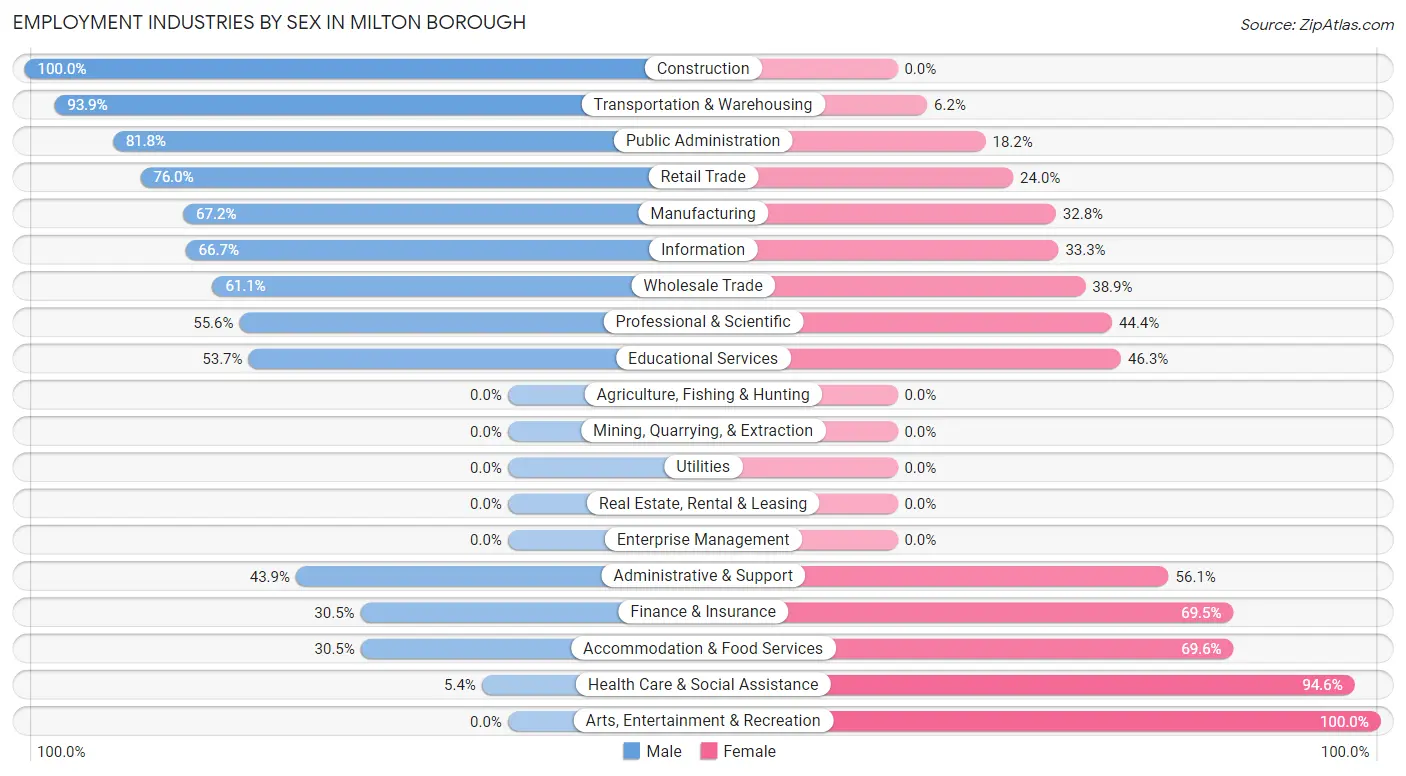
Employment Industries by Sex in Milton borough
The Milton borough industries that see more men than women are Construction (100.0%), Transportation & Warehousing (93.9%), and Public Administration (81.8%), whereas the industries that tend to have a higher number of women are Arts, Entertainment & Recreation (100.0%), Health Care & Social Assistance (94.6%), and Accommodation & Food Services (69.6%).
| Industry | Male | Female |
| Agriculture, Fishing & Hunting | 0 (0.0%) | 0 (0.0%) |
| Mining, Quarrying, & Extraction | 0 (0.0%) | 0 (0.0%) |
| Construction | 288 (100.0%) | 0 (0.0%) |
| Manufacturing | 383 (67.2%) | 187 (32.8%) |
| Wholesale Trade | 44 (61.1%) | 28 (38.9%) |
| Retail Trade | 568 (76.0%) | 179 (24.0%) |
| Transportation & Warehousing | 168 (93.9%) | 11 (6.1%) |
| Utilities | 0 (0.0%) | 0 (0.0%) |
| Information | 22 (66.7%) | 11 (33.3%) |
| Finance & Insurance | 25 (30.5%) | 57 (69.5%) |
| Real Estate, Rental & Leasing | 0 (0.0%) | 0 (0.0%) |
| Professional & Scientific | 15 (55.6%) | 12 (44.4%) |
| Enterprise Management | 0 (0.0%) | 0 (0.0%) |
| Administrative & Support | 25 (43.9%) | 32 (56.1%) |
| Educational Services | 80 (53.7%) | 69 (46.3%) |
| Health Care & Social Assistance | 34 (5.4%) | 597 (94.6%) |
| Arts, Entertainment & Recreation | 0 (0.0%) | 20 (100.0%) |
| Accommodation & Food Services | 95 (30.4%) | 217 (69.6%) |
| Public Administration | 130 (81.8%) | 29 (18.2%) |
| Total | 1,915 (56.3%) | 1,485 (43.7%) |
Education in Milton borough
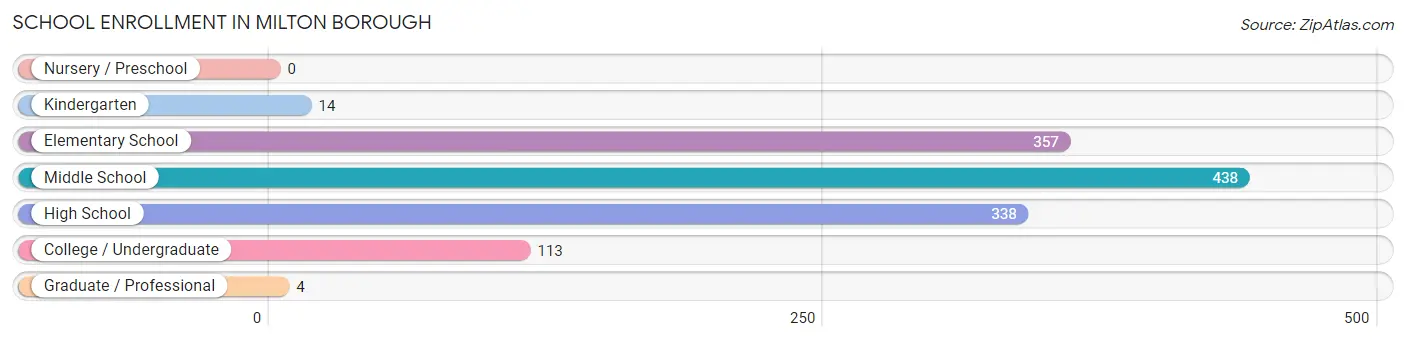
School Enrollment in Milton borough
The most common levels of schooling among the 1,264 students in Milton borough are middle school (438 | 34.6%), elementary school (357 | 28.2%), and high school (338 | 26.7%).
| School Level | # Students | % Students |
| Nursery / Preschool | 0 | 0.0% |
| Kindergarten | 14 | 1.1% |
| Elementary School | 357 | 28.2% |
| Middle School | 438 | 34.6% |
| High School | 338 | 26.7% |
| College / Undergraduate | 113 | 8.9% |
| Graduate / Professional | 4 | 0.3% |
| Total | 1,264 | 100.0% |
School Enrollment by Age by Funding Source in Milton borough
Out of a total of 1,264 students who are enrolled in schools in Milton borough, 61 (4.8%) attend a private institution, while the remaining 1,203 (95.2%) are enrolled in public schools. The age group of 25 to 34 year olds has the highest likelihood of being enrolled in private schools, with 7 (100.0% in the age bracket) enrolled. Conversely, the age group of 5 to 9 year old has the lowest likelihood of being enrolled in a private school, with 305 (100.0% in the age bracket) attending a public institution.
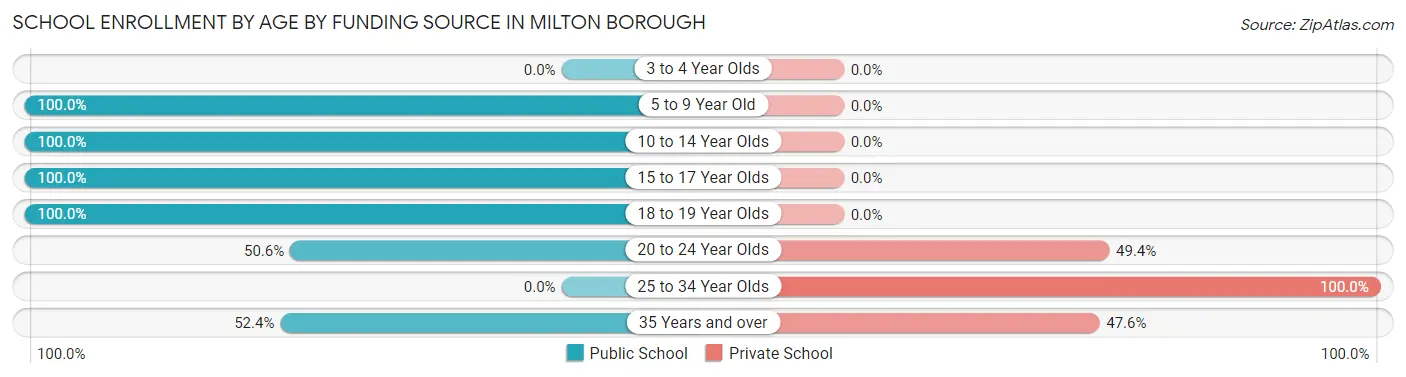
| Age Bracket | Public School | Private School |
| 3 to 4 Year Olds | 0 (0.0%) | 0 (0.0%) |
| 5 to 9 Year Old | 305 (100.0%) | 0 (0.0%) |
| 10 to 14 Year Olds | 592 (100.0%) | 0 (0.0%) |
| 15 to 17 Year Olds | 188 (100.0%) | 0 (0.0%) |
| 18 to 19 Year Olds | 62 (100.0%) | 0 (0.0%) |
| 20 to 24 Year Olds | 45 (50.6%) | 44 (49.4%) |
| 25 to 34 Year Olds | 0 (0.0%) | 7 (100.0%) |
| 35 Years and over | 11 (52.4%) | 10 (47.6%) |
| Total | 1,203 (95.2%) | 61 (4.8%) |
Educational Attainment by Field of Study in Milton borough
Education (152 | 24.6%), bio, nature & agricultural (83 | 13.4%), business (81 | 13.1%), science & technology (78 | 12.6%), and arts & humanities (72 | 11.7%) are the most common fields of study among 618 individuals in Milton borough who have obtained a bachelor's degree or higher.
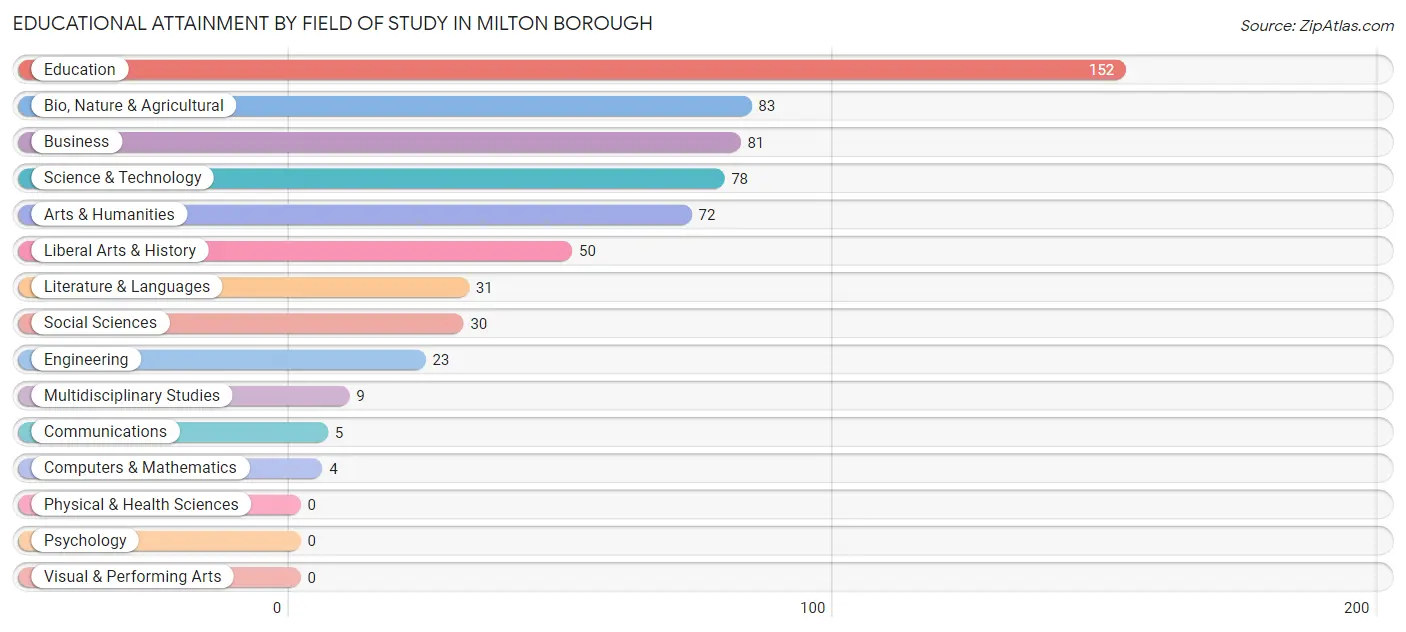
| Field of Study | # Graduates | % Graduates |
| Computers & Mathematics | 4 | 0.6% |
| Bio, Nature & Agricultural | 83 | 13.4% |
| Physical & Health Sciences | 0 | 0.0% |
| Psychology | 0 | 0.0% |
| Social Sciences | 30 | 4.9% |
| Engineering | 23 | 3.7% |
| Multidisciplinary Studies | 9 | 1.5% |
| Science & Technology | 78 | 12.6% |
| Business | 81 | 13.1% |
| Education | 152 | 24.6% |
| Literature & Languages | 31 | 5.0% |
| Liberal Arts & History | 50 | 8.1% |
| Visual & Performing Arts | 0 | 0.0% |
| Communications | 5 | 0.8% |
| Arts & Humanities | 72 | 11.7% |
| Total | 618 | 100.0% |
Transportation & Commute in Milton borough
Vehicle Availability by Sex in Milton borough
The most prevalent vehicle ownership categories in Milton borough are males with 2 vehicles (677, accounting for 35.6%) and females with 2 vehicles (576, making up 48.9%).
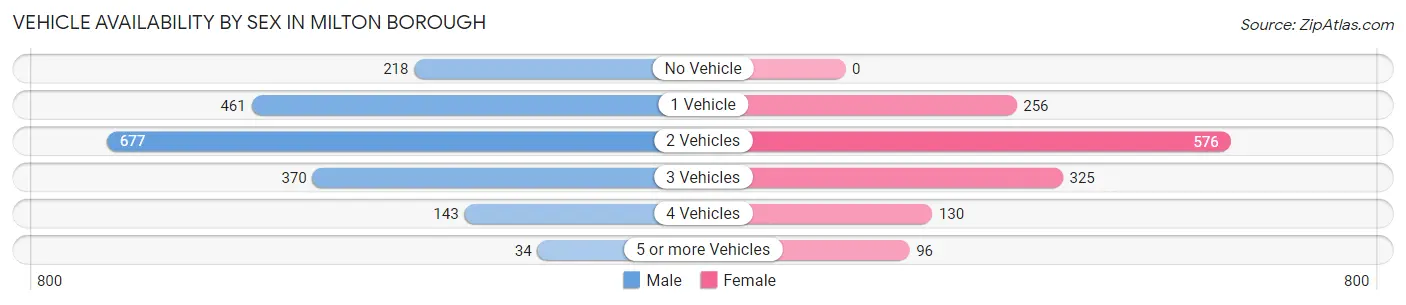
| Vehicles Available | Male | Female |
| No Vehicle | 218 (11.5%) | 0 (0.0%) |
| 1 Vehicle | 461 (24.2%) | 256 (18.5%) |
| 2 Vehicles | 677 (35.6%) | 576 (41.6%) |
| 3 Vehicles | 370 (19.4%) | 325 (23.5%) |
| 4 Vehicles | 143 (7.5%) | 130 (9.4%) |
| 5 or more Vehicles | 34 (1.8%) | 96 (6.9%) |
| Total | 1,903 (100.0%) | 1,383 (100.0%) |
Commute Time in Milton borough
The most frequently occuring commute durations in Milton borough are 10 to 14 minutes (707 commuters, 23.2%), 20 to 24 minutes (594 commuters, 19.5%), and 30 to 34 minutes (490 commuters, 16.1%).
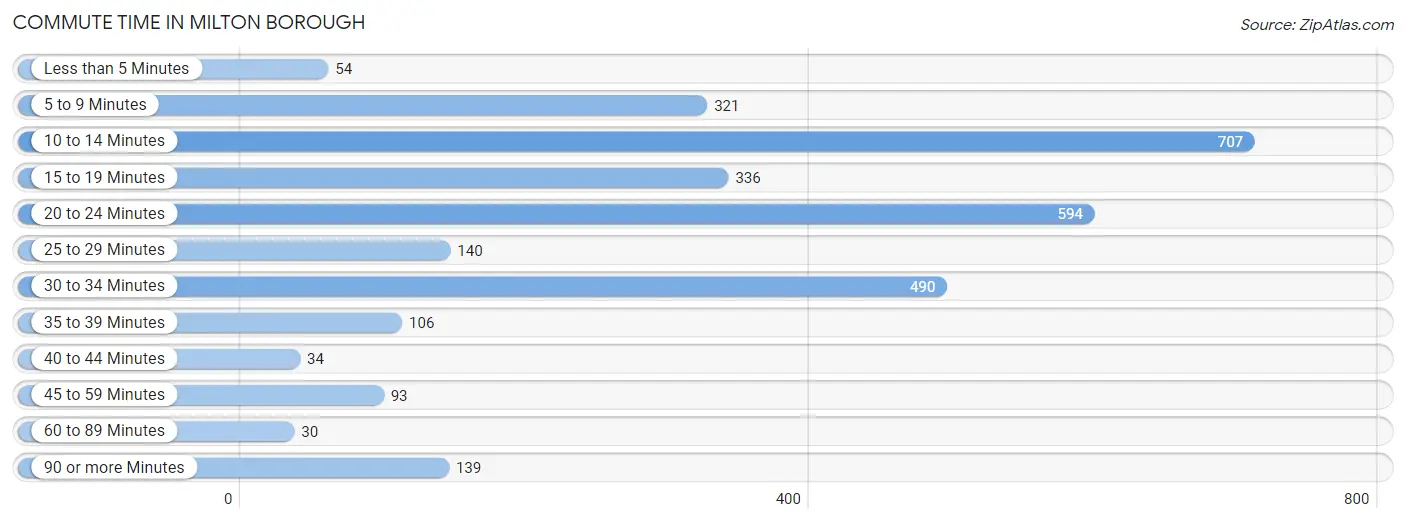
| Commute Time | # Commuters | % Commuters |
| Less than 5 Minutes | 54 | 1.8% |
| 5 to 9 Minutes | 321 | 10.5% |
| 10 to 14 Minutes | 707 | 23.2% |
| 15 to 19 Minutes | 336 | 11.0% |
| 20 to 24 Minutes | 594 | 19.5% |
| 25 to 29 Minutes | 140 | 4.6% |
| 30 to 34 Minutes | 490 | 16.1% |
| 35 to 39 Minutes | 106 | 3.5% |
| 40 to 44 Minutes | 34 | 1.1% |
| 45 to 59 Minutes | 93 | 3.1% |
| 60 to 89 Minutes | 30 | 1.0% |
| 90 or more Minutes | 139 | 4.6% |
Commute Time by Sex in Milton borough
The most common commute times in Milton borough are 20 to 24 minutes (345 commuters, 19.9%) for males and 10 to 14 minutes (411 commuters, 31.3%) for females.
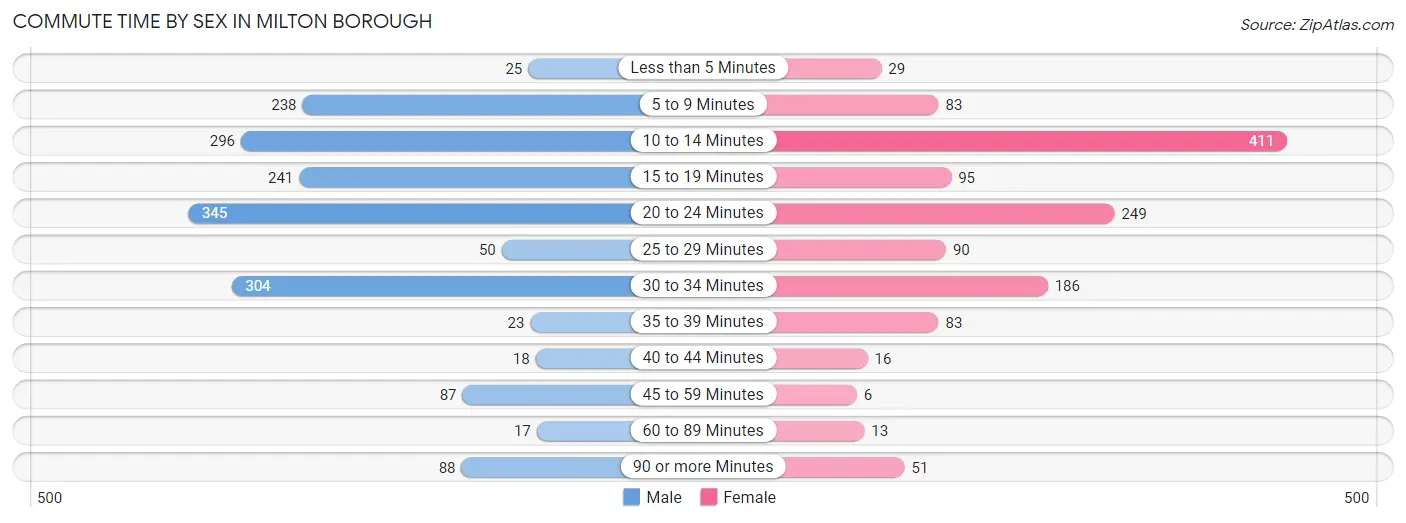
| Commute Time | Male | Female |
| Less than 5 Minutes | 25 (1.4%) | 29 (2.2%) |
| 5 to 9 Minutes | 238 (13.7%) | 83 (6.3%) |
| 10 to 14 Minutes | 296 (17.1%) | 411 (31.3%) |
| 15 to 19 Minutes | 241 (13.9%) | 95 (7.2%) |
| 20 to 24 Minutes | 345 (19.9%) | 249 (19.0%) |
| 25 to 29 Minutes | 50 (2.9%) | 90 (6.9%) |
| 30 to 34 Minutes | 304 (17.5%) | 186 (14.2%) |
| 35 to 39 Minutes | 23 (1.3%) | 83 (6.3%) |
| 40 to 44 Minutes | 18 (1.0%) | 16 (1.2%) |
| 45 to 59 Minutes | 87 (5.0%) | 6 (0.5%) |
| 60 to 89 Minutes | 17 (1.0%) | 13 (1.0%) |
| 90 or more Minutes | 88 (5.1%) | 51 (3.9%) |
Time of Departure to Work by Sex in Milton borough
The most frequent times of departure to work in Milton borough are 7:00 AM to 7:29 AM (309, 17.8%) for males and 7:00 AM to 7:29 AM (262, 20.0%) for females.
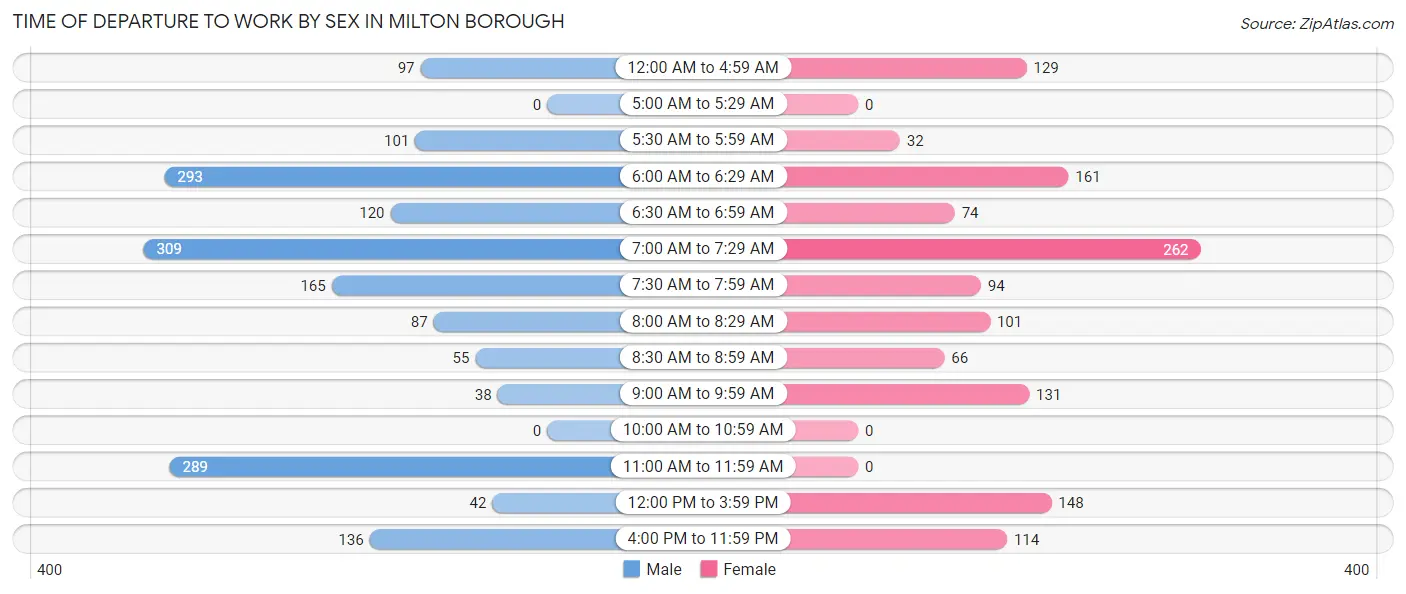
| Time of Departure | Male | Female |
| 12:00 AM to 4:59 AM | 97 (5.6%) | 129 (9.8%) |
| 5:00 AM to 5:29 AM | 0 (0.0%) | 0 (0.0%) |
| 5:30 AM to 5:59 AM | 101 (5.8%) | 32 (2.4%) |
| 6:00 AM to 6:29 AM | 293 (16.9%) | 161 (12.3%) |
| 6:30 AM to 6:59 AM | 120 (6.9%) | 74 (5.6%) |
| 7:00 AM to 7:29 AM | 309 (17.8%) | 262 (20.0%) |
| 7:30 AM to 7:59 AM | 165 (9.5%) | 94 (7.2%) |
| 8:00 AM to 8:29 AM | 87 (5.0%) | 101 (7.7%) |
| 8:30 AM to 8:59 AM | 55 (3.2%) | 66 (5.0%) |
| 9:00 AM to 9:59 AM | 38 (2.2%) | 131 (10.0%) |
| 10:00 AM to 10:59 AM | 0 (0.0%) | 0 (0.0%) |
| 11:00 AM to 11:59 AM | 289 (16.7%) | 0 (0.0%) |
| 12:00 PM to 3:59 PM | 42 (2.4%) | 148 (11.3%) |
| 4:00 PM to 11:59 PM | 136 (7.9%) | 114 (8.7%) |
| Total | 1,732 (100.0%) | 1,312 (100.0%) |
Housing Occupancy in Milton borough
Occupancy by Ownership in Milton borough
Of the total 2,745 dwellings in Milton borough, owner-occupied units account for 1,187 (43.2%), while renter-occupied units make up 1,558 (56.8%).
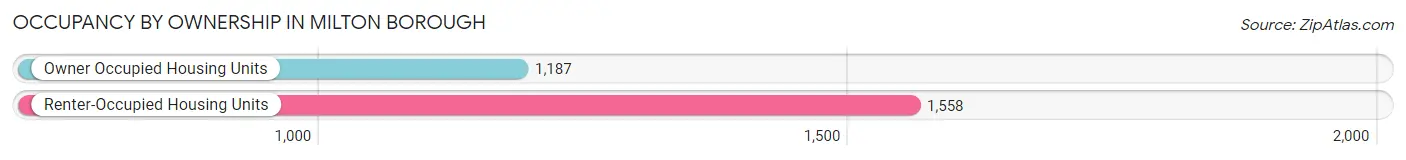
| Occupancy | # Housing Units | % Housing Units |
| Owner Occupied Housing Units | 1,187 | 43.2% |
| Renter-Occupied Housing Units | 1,558 | 56.8% |
| Total Occupied Housing Units | 2,745 | 100.0% |
Occupancy by Household Size in Milton borough
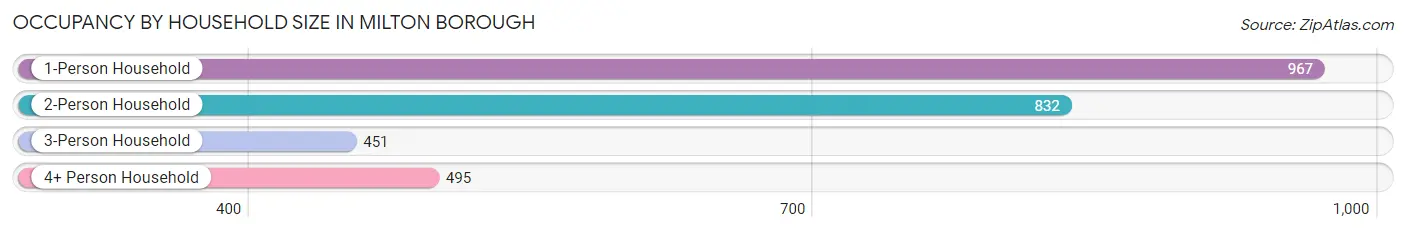
| Household Size | # Housing Units | % Housing Units |
| 1-Person Household | 967 | 35.2% |
| 2-Person Household | 832 | 30.3% |
| 3-Person Household | 451 | 16.4% |
| 4+ Person Household | 495 | 18.0% |
| Total Housing Units | 2,745 | 100.0% |
Occupancy by Ownership by Household Size in Milton borough
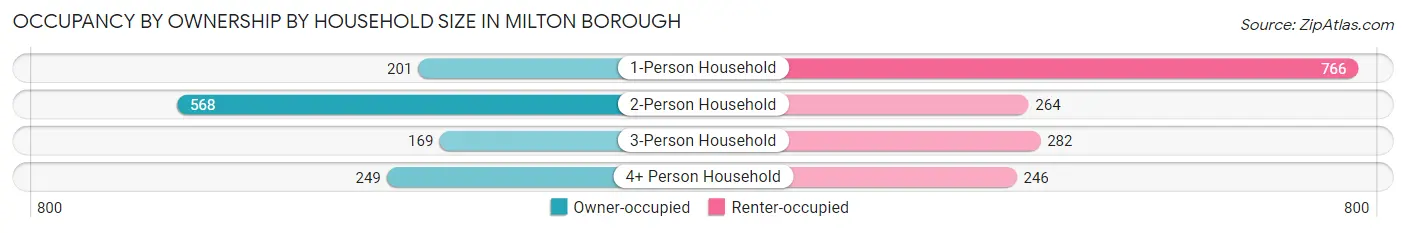
| Household Size | Owner-occupied | Renter-occupied |
| 1-Person Household | 201 (20.8%) | 766 (79.2%) |
| 2-Person Household | 568 (68.3%) | 264 (31.7%) |
| 3-Person Household | 169 (37.5%) | 282 (62.5%) |
| 4+ Person Household | 249 (50.3%) | 246 (49.7%) |
| Total Housing Units | 1,187 (43.2%) | 1,558 (56.8%) |
Occupancy by Educational Attainment in Milton borough
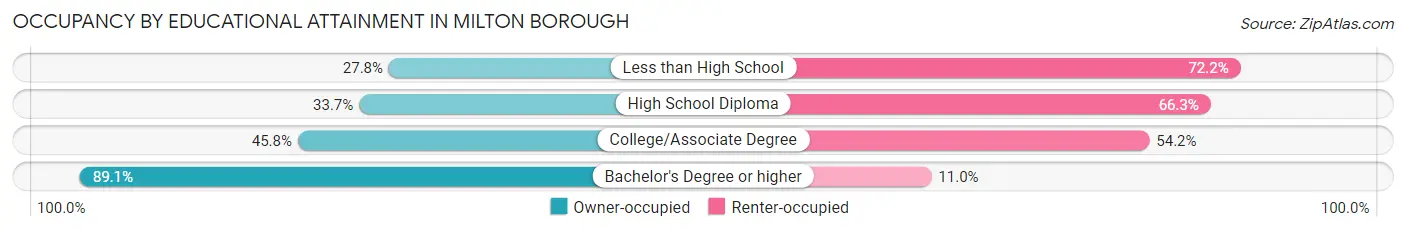
| Household Size | Owner-occupied | Renter-occupied |
| Less than High School | 50 (27.8%) | 130 (72.2%) |
| High School Diploma | 512 (33.7%) | 1,008 (66.3%) |
| College/Associate Degree | 324 (45.8%) | 383 (54.2%) |
| Bachelor's Degree or higher | 301 (89.0%) | 37 (11.0%) |
Occupancy by Age of Householder in Milton borough
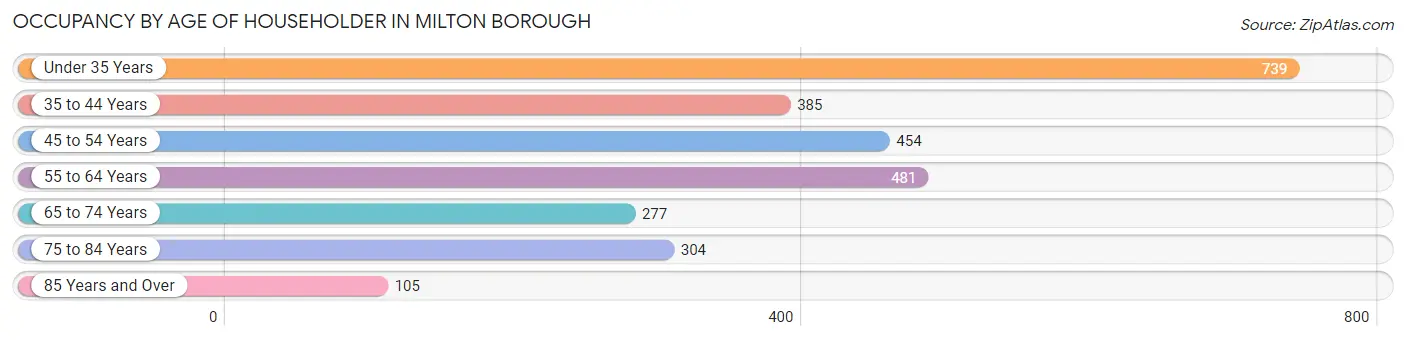
| Age Bracket | # Households | % Households |
| Under 35 Years | 739 | 26.9% |
| 35 to 44 Years | 385 | 14.0% |
| 45 to 54 Years | 454 | 16.5% |
| 55 to 64 Years | 481 | 17.5% |
| 65 to 74 Years | 277 | 10.1% |
| 75 to 84 Years | 304 | 11.1% |
| 85 Years and Over | 105 | 3.8% |
| Total | 2,745 | 100.0% |
Housing Finances in Milton borough
Median Income by Occupancy in Milton borough
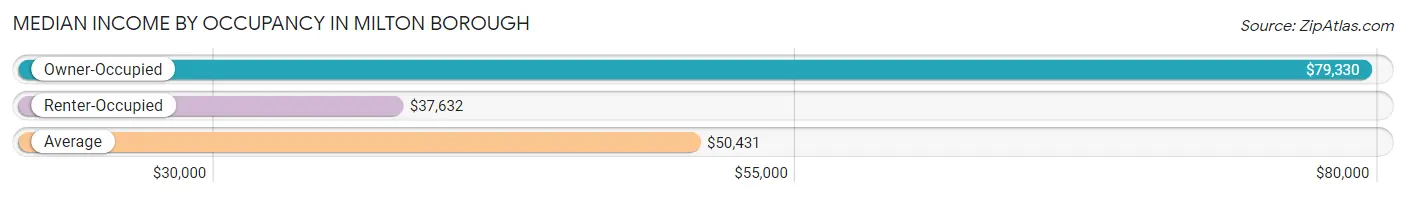
| Occupancy Type | # Households | Median Income |
| Owner-Occupied | 1,187 (43.2%) | $79,330 |
| Renter-Occupied | 1,558 (56.8%) | $37,632 |
| Average | 2,745 (100.0%) | $50,431 |
Occupancy by Householder Income Bracket in Milton borough
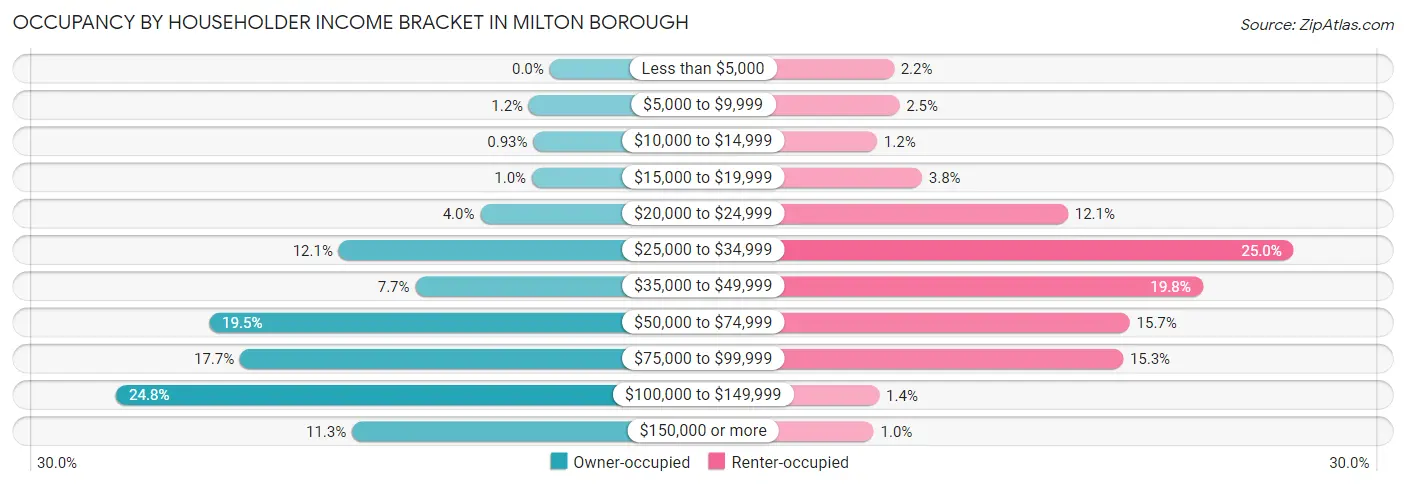
| Income Bracket | Owner-occupied | Renter-occupied |
| Less than $5,000 | 0 (0.0%) | 34 (2.2%) |
| $5,000 to $9,999 | 14 (1.2%) | 39 (2.5%) |
| $10,000 to $14,999 | 11 (0.9%) | 19 (1.2%) |
| $15,000 to $19,999 | 12 (1.0%) | 59 (3.8%) |
| $20,000 to $24,999 | 47 (4.0%) | 189 (12.1%) |
| $25,000 to $34,999 | 143 (12.0%) | 390 (25.0%) |
| $35,000 to $49,999 | 91 (7.7%) | 309 (19.8%) |
| $50,000 to $74,999 | 231 (19.5%) | 244 (15.7%) |
| $75,000 to $99,999 | 210 (17.7%) | 238 (15.3%) |
| $100,000 to $149,999 | 294 (24.8%) | 21 (1.3%) |
| $150,000 or more | 134 (11.3%) | 16 (1.0%) |
| Total | 1,187 (100.0%) | 1,558 (100.0%) |
Monthly Housing Cost Tiers in Milton borough
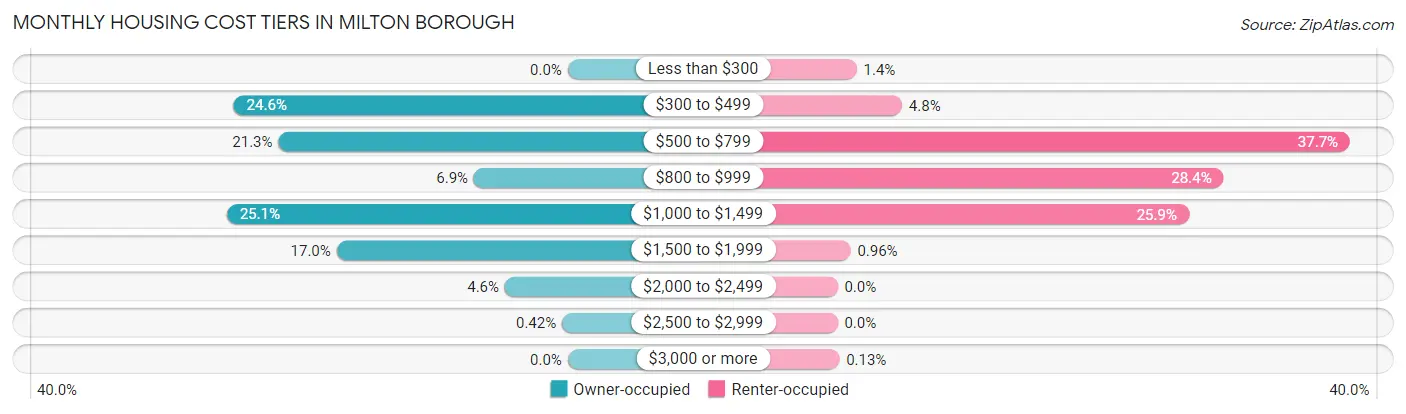
| Monthly Cost | Owner-occupied | Renter-occupied |
| Less than $300 | 0 (0.0%) | 22 (1.4%) |
| $300 to $499 | 292 (24.6%) | 74 (4.8%) |
| $500 to $799 | 253 (21.3%) | 588 (37.7%) |
| $800 to $999 | 82 (6.9%) | 443 (28.4%) |
| $1,000 to $1,499 | 298 (25.1%) | 403 (25.9%) |
| $1,500 to $1,999 | 202 (17.0%) | 15 (1.0%) |
| $2,000 to $2,499 | 55 (4.6%) | 0 (0.0%) |
| $2,500 to $2,999 | 5 (0.4%) | 0 (0.0%) |
| $3,000 or more | 0 (0.0%) | 2 (0.1%) |
| Total | 1,187 (100.0%) | 1,558 (100.0%) |
Physical Housing Characteristics in Milton borough
Housing Structures in Milton borough
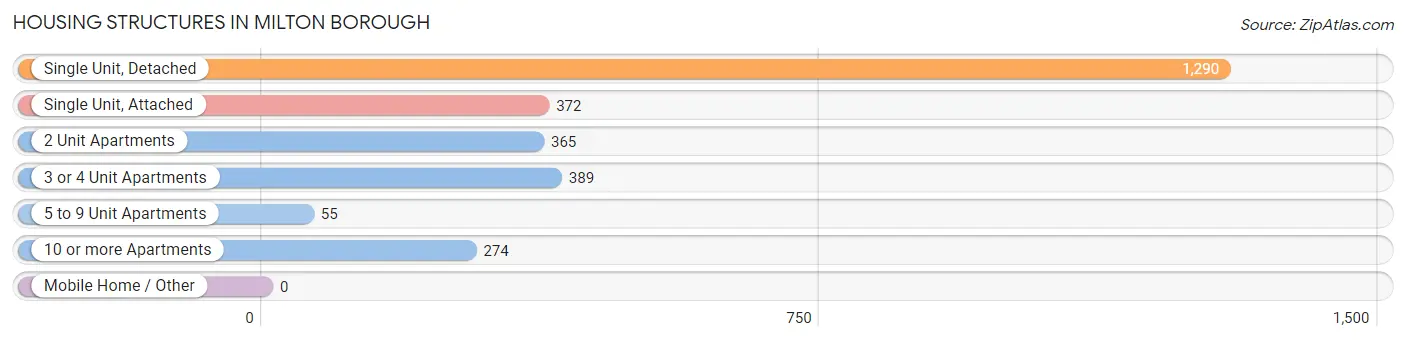
| Structure Type | # Housing Units | % Housing Units |
| Single Unit, Detached | 1,290 | 47.0% |
| Single Unit, Attached | 372 | 13.6% |
| 2 Unit Apartments | 365 | 13.3% |
| 3 or 4 Unit Apartments | 389 | 14.2% |
| 5 to 9 Unit Apartments | 55 | 2.0% |
| 10 or more Apartments | 274 | 10.0% |
| Mobile Home / Other | 0 | 0.0% |
| Total | 2,745 | 100.0% |
Housing Structures by Occupancy in Milton borough
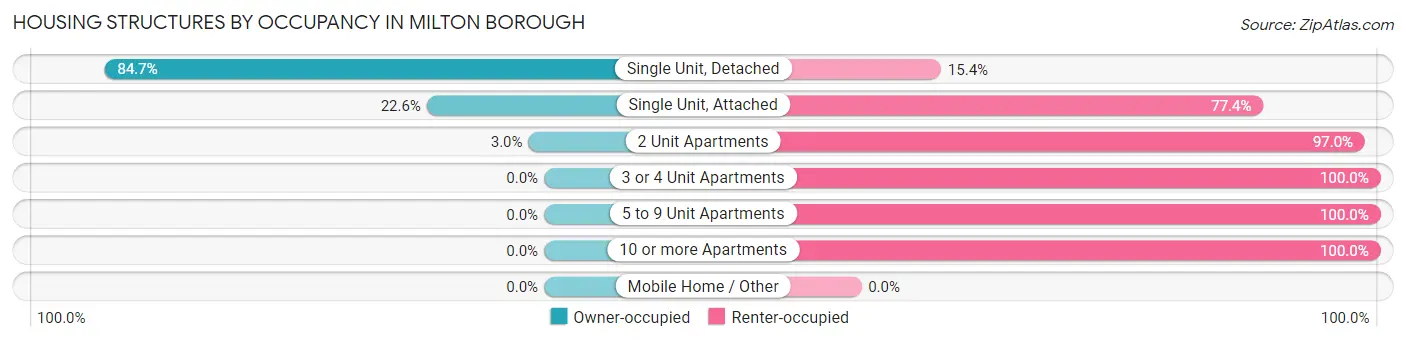
| Structure Type | Owner-occupied | Renter-occupied |
| Single Unit, Detached | 1,092 (84.7%) | 198 (15.3%) |
| Single Unit, Attached | 84 (22.6%) | 288 (77.4%) |
| 2 Unit Apartments | 11 (3.0%) | 354 (97.0%) |
| 3 or 4 Unit Apartments | 0 (0.0%) | 389 (100.0%) |
| 5 to 9 Unit Apartments | 0 (0.0%) | 55 (100.0%) |
| 10 or more Apartments | 0 (0.0%) | 274 (100.0%) |
| Mobile Home / Other | 0 (0.0%) | 0 (0.0%) |
| Total | 1,187 (43.2%) | 1,558 (56.8%) |
Housing Structures by Number of Rooms in Milton borough
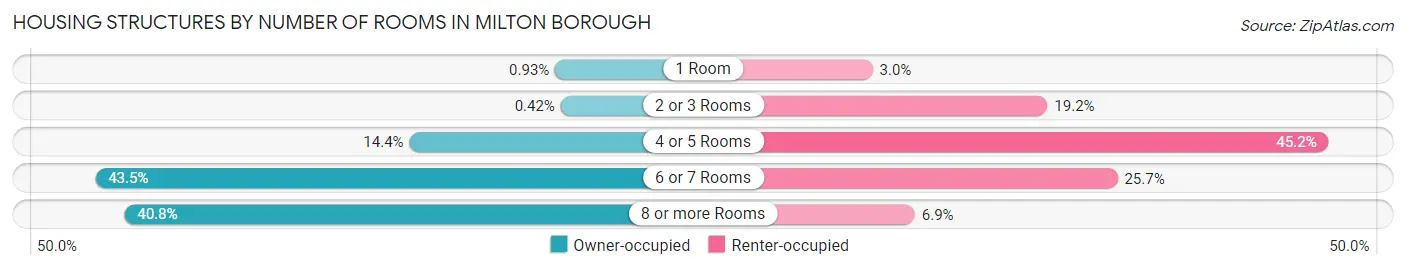
| Number of Rooms | Owner-occupied | Renter-occupied |
| 1 Room | 11 (0.9%) | 47 (3.0%) |
| 2 or 3 Rooms | 5 (0.4%) | 299 (19.2%) |
| 4 or 5 Rooms | 171 (14.4%) | 704 (45.2%) |
| 6 or 7 Rooms | 516 (43.5%) | 400 (25.7%) |
| 8 or more Rooms | 484 (40.8%) | 108 (6.9%) |
| Total | 1,187 (100.0%) | 1,558 (100.0%) |
Housing Structure by Heating Type in Milton borough
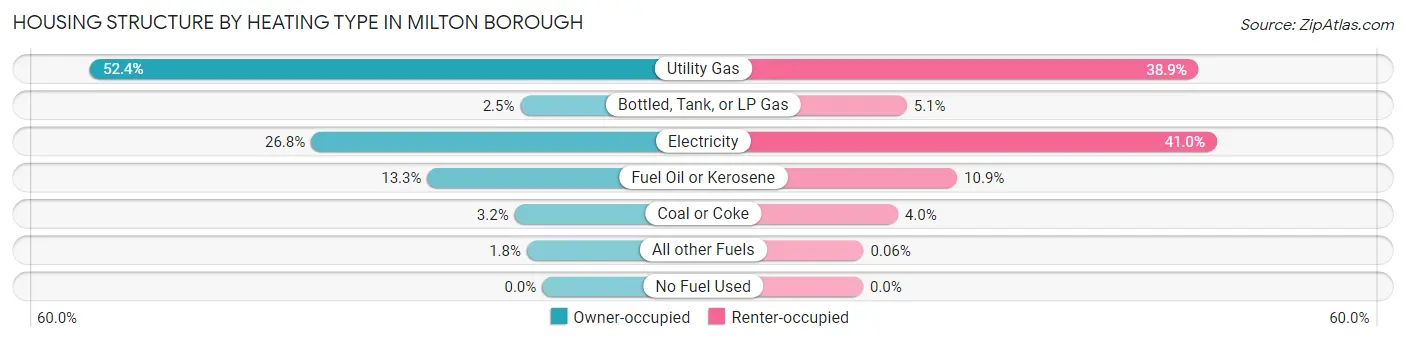
| Heating Type | Owner-occupied | Renter-occupied |
| Utility Gas | 622 (52.4%) | 606 (38.9%) |
| Bottled, Tank, or LP Gas | 30 (2.5%) | 79 (5.1%) |
| Electricity | 318 (26.8%) | 639 (41.0%) |
| Fuel Oil or Kerosene | 158 (13.3%) | 170 (10.9%) |
| Coal or Coke | 38 (3.2%) | 63 (4.0%) |
| All other Fuels | 21 (1.8%) | 1 (0.1%) |
| No Fuel Used | 0 (0.0%) | 0 (0.0%) |
| Total | 1,187 (100.0%) | 1,558 (100.0%) |
Household Vehicle Usage in Milton borough
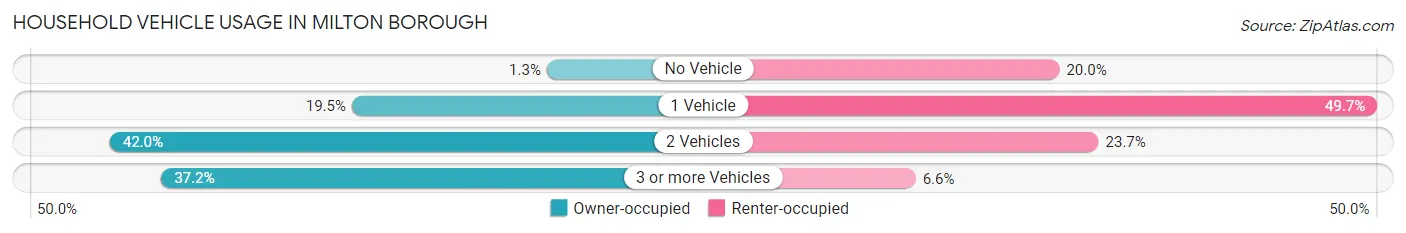
| Vehicles per Household | Owner-occupied | Renter-occupied |
| No Vehicle | 15 (1.3%) | 312 (20.0%) |
| 1 Vehicle | 231 (19.5%) | 774 (49.7%) |
| 2 Vehicles | 499 (42.0%) | 369 (23.7%) |
| 3 or more Vehicles | 442 (37.2%) | 103 (6.6%) |
| Total | 1,187 (100.0%) | 1,558 (100.0%) |
Real Estate & Mortgages in Milton borough
Real Estate and Mortgage Overview in Milton borough
| Characteristic | Without Mortgage | With Mortgage |
| Housing Units | 555 | 632 |
| Median Property Value | $168,900 | $151,600 |
| Median Household Income | $54,464 | $111 |
| Monthly Housing Costs | $503 | $0 |
| Real Estate Taxes | $2,245 | $0 |
Property Value by Mortgage Status in Milton borough
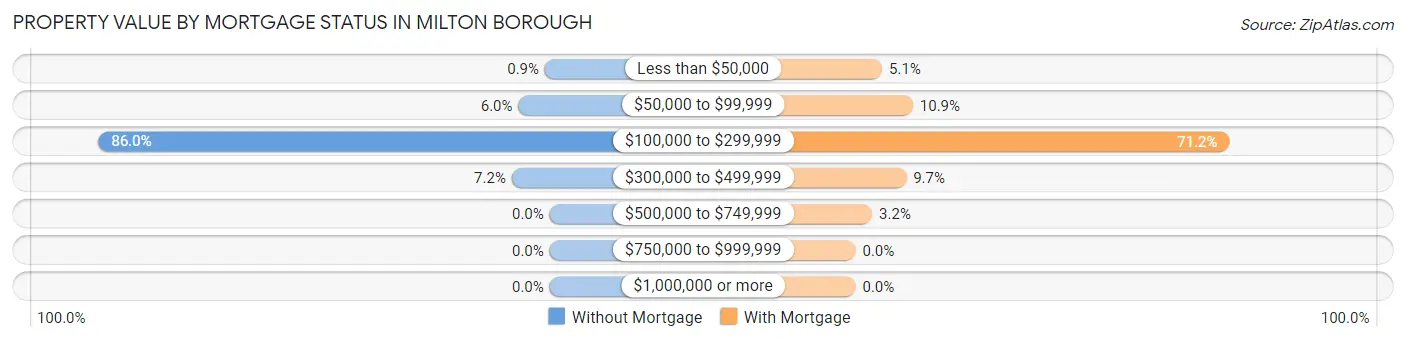
| Property Value | Without Mortgage | With Mortgage |
| Less than $50,000 | 5 (0.9%) | 32 (5.1%) |
| $50,000 to $99,999 | 33 (5.9%) | 69 (10.9%) |
| $100,000 to $299,999 | 477 (86.0%) | 450 (71.2%) |
| $300,000 to $499,999 | 40 (7.2%) | 61 (9.7%) |
| $500,000 to $749,999 | 0 (0.0%) | 20 (3.2%) |
| $750,000 to $999,999 | 0 (0.0%) | 0 (0.0%) |
| $1,000,000 or more | 0 (0.0%) | 0 (0.0%) |
| Total | 555 (100.0%) | 632 (100.0%) |
Household Income by Mortgage Status in Milton borough
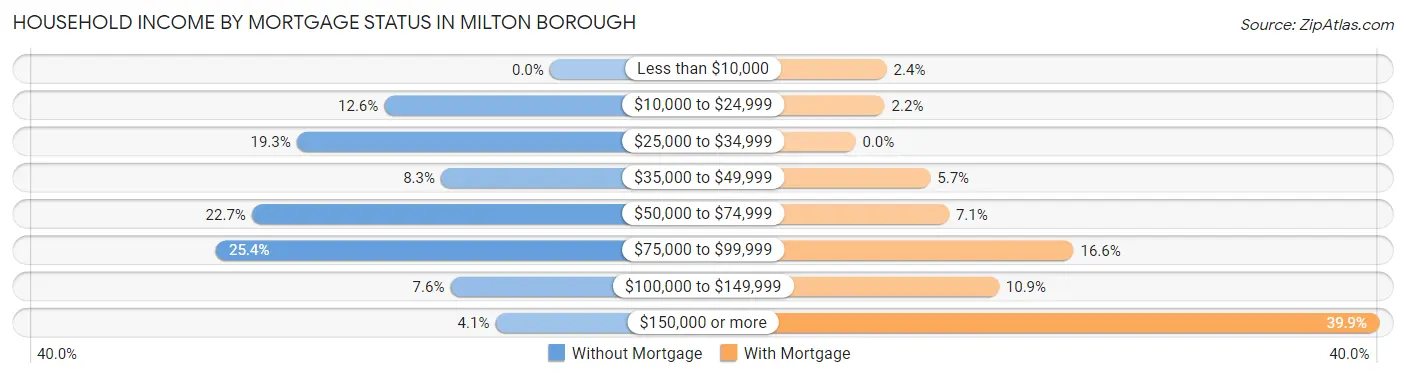
| Household Income | Without Mortgage | With Mortgage |
| Less than $10,000 | 0 (0.0%) | 15 (2.4%) |
| $10,000 to $24,999 | 70 (12.6%) | 14 (2.2%) |
| $25,000 to $34,999 | 107 (19.3%) | 0 (0.0%) |
| $35,000 to $49,999 | 46 (8.3%) | 36 (5.7%) |
| $50,000 to $74,999 | 126 (22.7%) | 45 (7.1%) |
| $75,000 to $99,999 | 141 (25.4%) | 105 (16.6%) |
| $100,000 to $149,999 | 42 (7.6%) | 69 (10.9%) |
| $150,000 or more | 23 (4.1%) | 252 (39.9%) |
| Total | 555 (100.0%) | 632 (100.0%) |
Property Value to Household Income Ratio in Milton borough
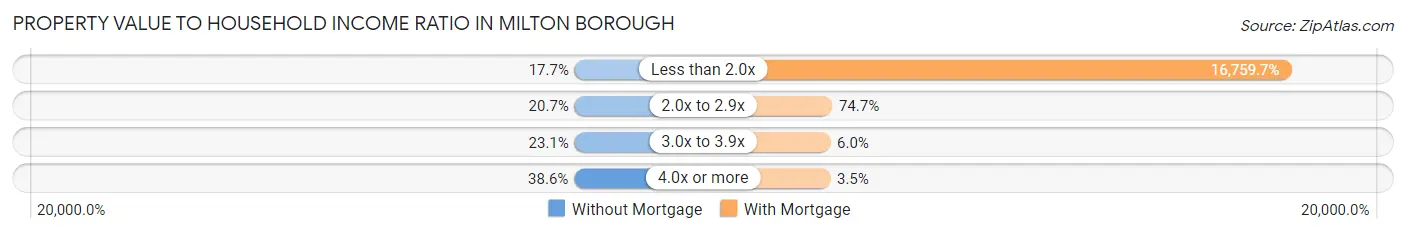
| Value-to-Income Ratio | Without Mortgage | With Mortgage |
| Less than 2.0x | 98 (17.7%) | 105,921 (16,759.6%) |
| 2.0x to 2.9x | 115 (20.7%) | 472 (74.7%) |
| 3.0x to 3.9x | 128 (23.1%) | 38 (6.0%) |
| 4.0x or more | 214 (38.6%) | 22 (3.5%) |
| Total | 555 (100.0%) | 632 (100.0%) |
Real Estate Taxes by Mortgage Status in Milton borough
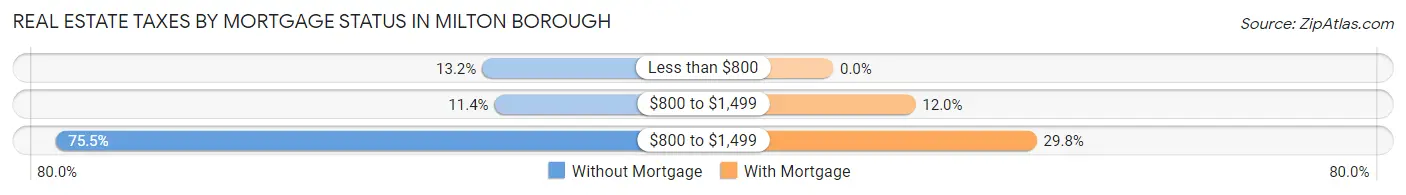
| Property Taxes | Without Mortgage | With Mortgage |
| Less than $800 | 73 (13.2%) | 0 (0.0%) |
| $800 to $1,499 | 63 (11.4%) | 76 (12.0%) |
| $800 to $1,499 | 419 (75.5%) | 188 (29.7%) |
| Total | 555 (100.0%) | 632 (100.0%) |
Health & Disability in Milton borough
Health Insurance Coverage by Age in Milton borough
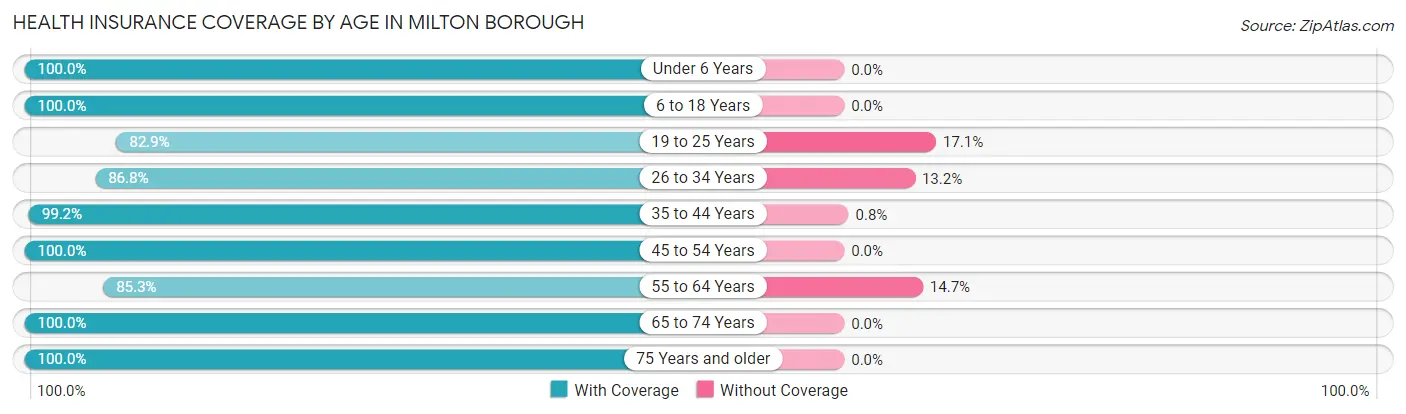
| Age Bracket | With Coverage | Without Coverage |
| Under 6 Years | 455 (100.0%) | 0 (0.0%) |
| 6 to 18 Years | 1,129 (100.0%) | 0 (0.0%) |
| 19 to 25 Years | 693 (82.9%) | 143 (17.1%) |
| 26 to 34 Years | 718 (86.8%) | 109 (13.2%) |
| 35 to 44 Years | 620 (99.2%) | 5 (0.8%) |
| 45 to 54 Years | 710 (100.0%) | 0 (0.0%) |
| 55 to 64 Years | 722 (85.3%) | 124 (14.7%) |
| 65 to 74 Years | 485 (100.0%) | 0 (0.0%) |
| 75 Years and older | 607 (100.0%) | 0 (0.0%) |
| Total | 6,139 (94.2%) | 381 (5.8%) |
Health Insurance Coverage by Citizenship Status in Milton borough
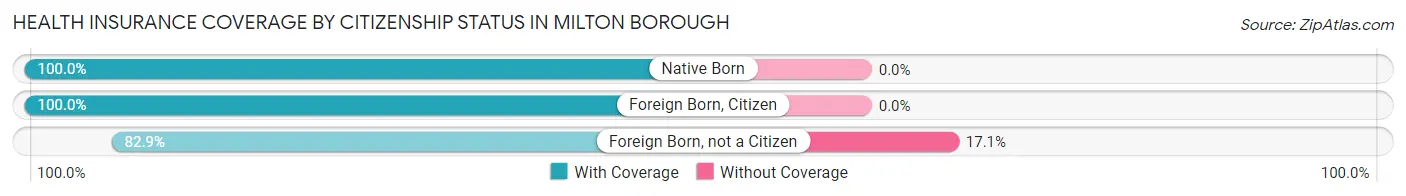
| Citizenship Status | With Coverage | Without Coverage |
| Native Born | 455 (100.0%) | 0 (0.0%) |
| Foreign Born, Citizen | 1,129 (100.0%) | 0 (0.0%) |
| Foreign Born, not a Citizen | 693 (82.9%) | 143 (17.1%) |
Health Insurance Coverage by Household Income in Milton borough
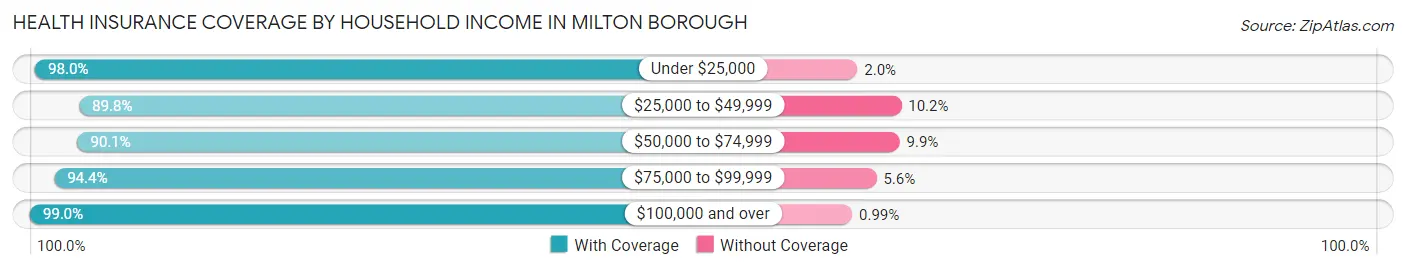
| Household Income | With Coverage | Without Coverage |
| Under $25,000 | 742 (98.0%) | 15 (2.0%) |
| $25,000 to $49,999 | 1,486 (89.8%) | 169 (10.2%) |
| $50,000 to $74,999 | 820 (90.1%) | 90 (9.9%) |
| $75,000 to $99,999 | 1,562 (94.4%) | 92 (5.6%) |
| $100,000 and over | 1,496 (99.0%) | 15 (1.0%) |
Public vs Private Health Insurance Coverage by Age in Milton borough
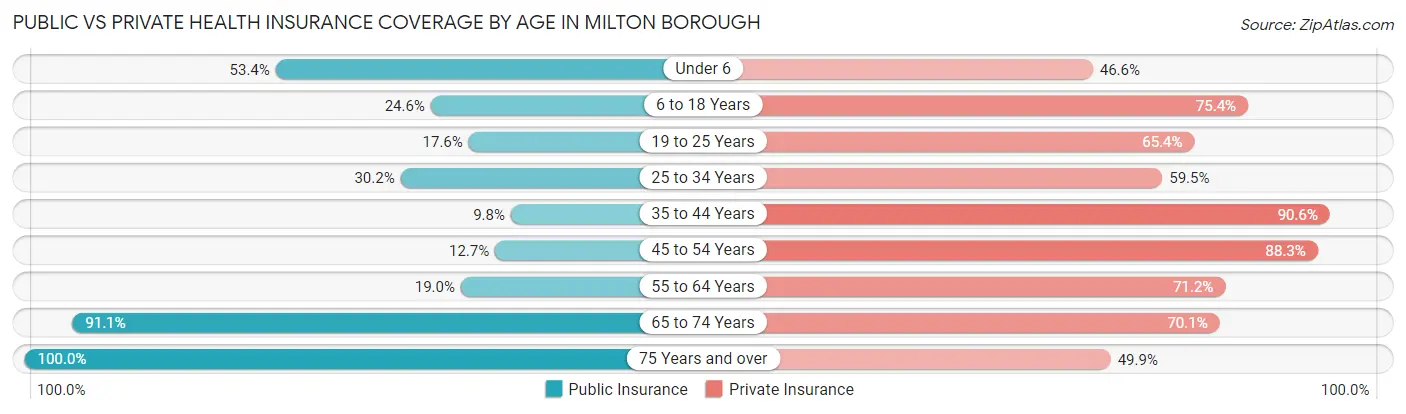
| Age Bracket | Public Insurance | Private Insurance |
| Under 6 | 243 (53.4%) | 212 (46.6%) |
| 6 to 18 Years | 278 (24.6%) | 851 (75.4%) |
| 19 to 25 Years | 147 (17.6%) | 547 (65.4%) |
| 25 to 34 Years | 250 (30.2%) | 492 (59.5%) |
| 35 to 44 Years | 61 (9.8%) | 566 (90.6%) |
| 45 to 54 Years | 90 (12.7%) | 627 (88.3%) |
| 55 to 64 Years | 161 (19.0%) | 602 (71.2%) |
| 65 to 74 Years | 442 (91.1%) | 340 (70.1%) |
| 75 Years and over | 607 (100.0%) | 303 (49.9%) |
| Total | 2,279 (34.9%) | 4,540 (69.6%) |
Disability Status by Sex by Age in Milton borough
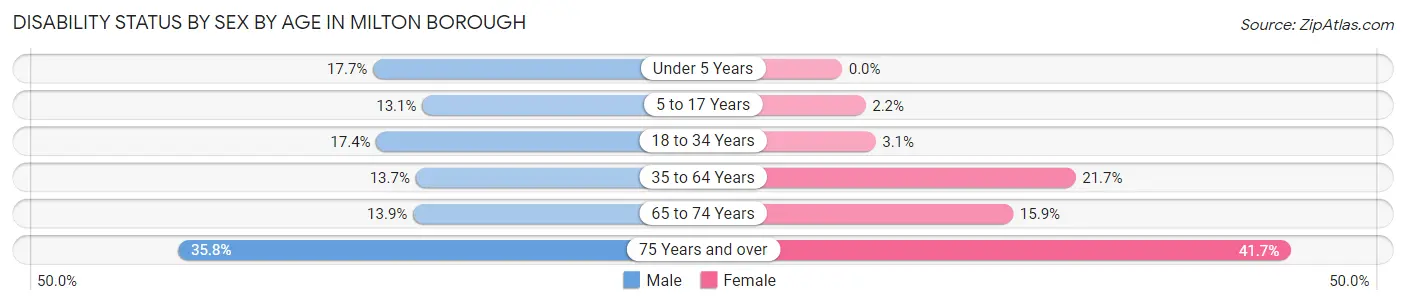
| Age Bracket | Male | Female |
| Under 5 Years | 24 (17.6%) | 0 (0.0%) |
| 5 to 17 Years | 72 (13.1%) | 12 (2.2%) |
| 18 to 34 Years | 182 (17.3%) | 21 (3.1%) |
| 35 to 64 Years | 161 (13.7%) | 218 (21.7%) |
| 65 to 74 Years | 29 (13.9%) | 44 (15.9%) |
| 75 Years and over | 103 (35.8%) | 133 (41.7%) |
Disability Class by Sex by Age in Milton borough
Disability Class: Hearing Difficulty
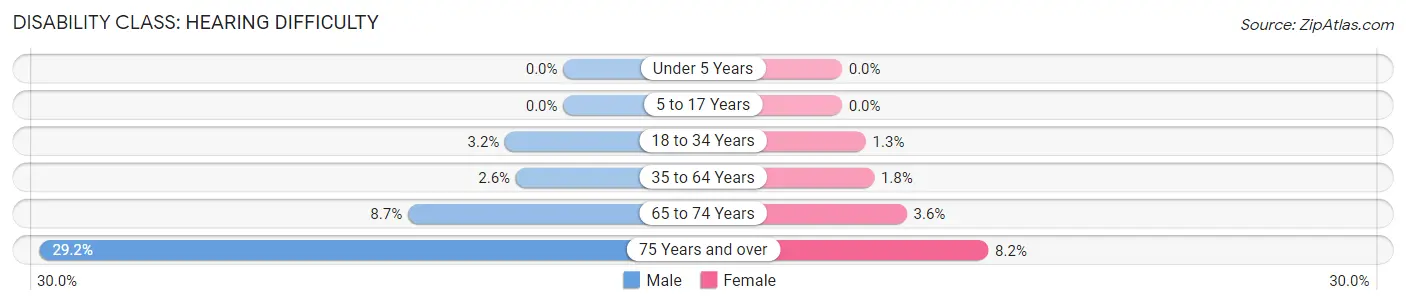
| Age Bracket | Male | Female |
| Under 5 Years | 0 (0.0%) | 0 (0.0%) |
| 5 to 17 Years | 0 (0.0%) | 0 (0.0%) |
| 18 to 34 Years | 34 (3.2%) | 9 (1.3%) |
| 35 to 64 Years | 31 (2.6%) | 18 (1.8%) |
| 65 to 74 Years | 18 (8.6%) | 10 (3.6%) |
| 75 Years and over | 84 (29.2%) | 26 (8.2%) |
Disability Class: Vision Difficulty
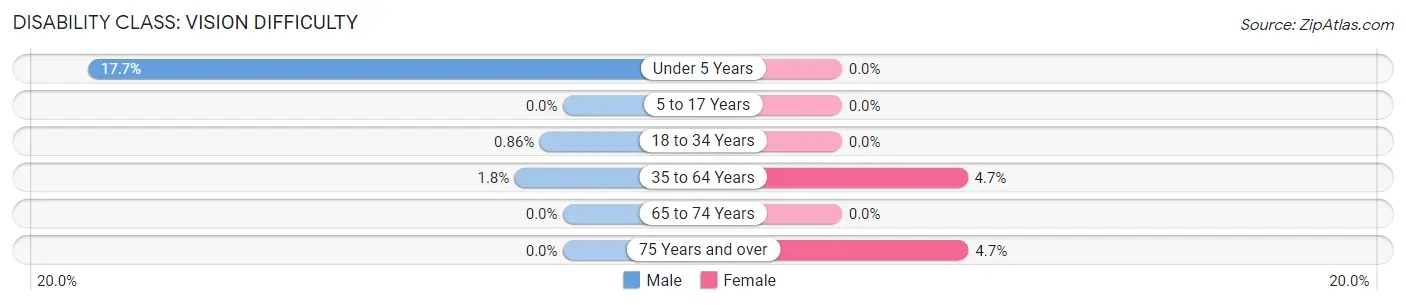
| Age Bracket | Male | Female |
| Under 5 Years | 24 (17.6%) | 0 (0.0%) |
| 5 to 17 Years | 0 (0.0%) | 0 (0.0%) |
| 18 to 34 Years | 9 (0.9%) | 0 (0.0%) |
| 35 to 64 Years | 21 (1.8%) | 47 (4.7%) |
| 65 to 74 Years | 0 (0.0%) | 0 (0.0%) |
| 75 Years and over | 0 (0.0%) | 15 (4.7%) |
Disability Class: Cognitive Difficulty
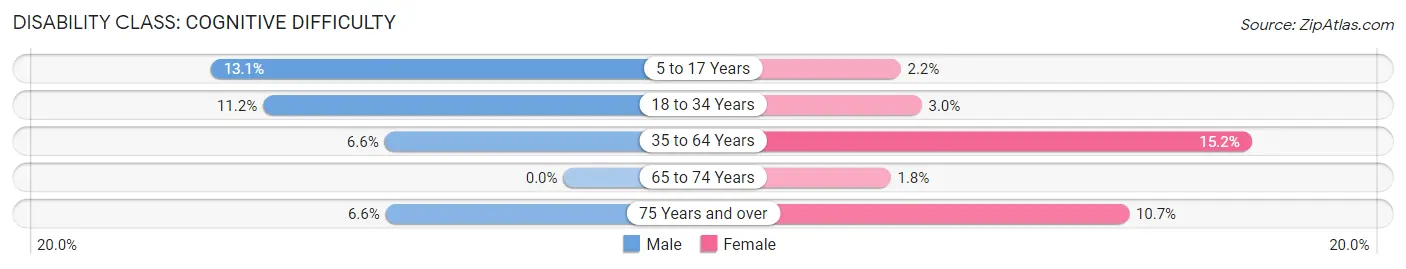
| Age Bracket | Male | Female |
| 5 to 17 Years | 72 (13.1%) | 12 (2.2%) |
| 18 to 34 Years | 117 (11.2%) | 20 (3.0%) |
| 35 to 64 Years | 78 (6.6%) | 153 (15.2%) |
| 65 to 74 Years | 0 (0.0%) | 5 (1.8%) |
| 75 Years and over | 19 (6.6%) | 34 (10.7%) |
Disability Class: Ambulatory Difficulty
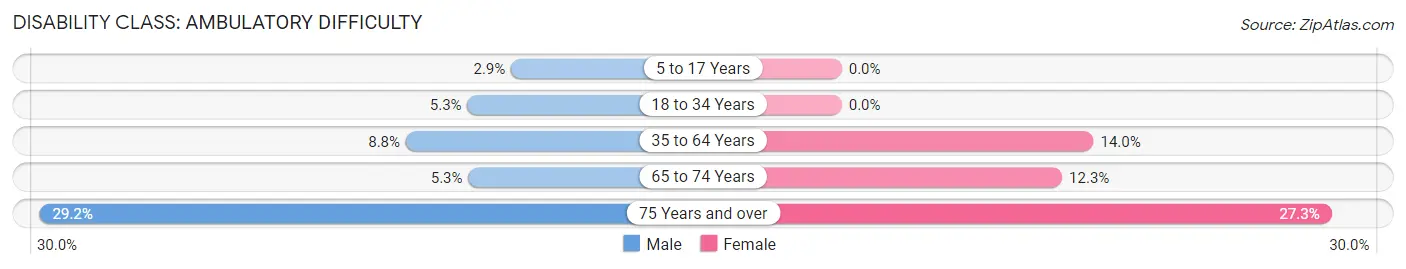
| Age Bracket | Male | Female |
| 5 to 17 Years | 16 (2.9%) | 0 (0.0%) |
| 18 to 34 Years | 56 (5.3%) | 0 (0.0%) |
| 35 to 64 Years | 103 (8.8%) | 141 (14.0%) |
| 65 to 74 Years | 11 (5.3%) | 34 (12.3%) |
| 75 Years and over | 84 (29.2%) | 87 (27.3%) |
Disability Class: Self-Care Difficulty
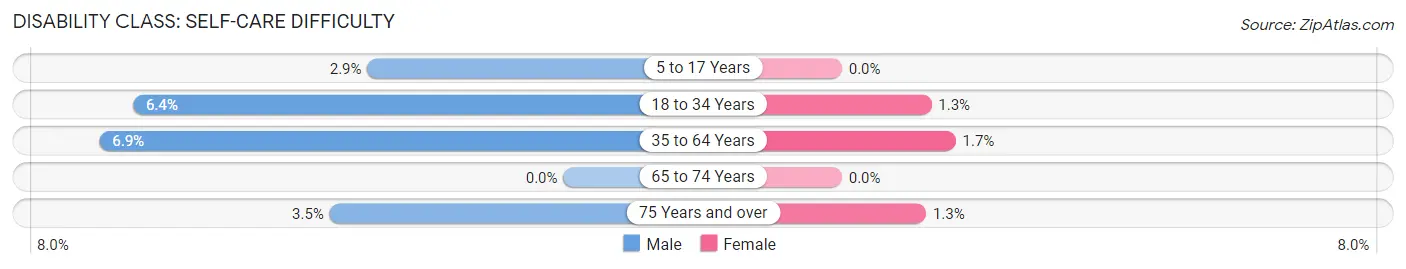
| Age Bracket | Male | Female |
| 5 to 17 Years | 16 (2.9%) | 0 (0.0%) |
| 18 to 34 Years | 67 (6.4%) | 9 (1.3%) |
| 35 to 64 Years | 81 (6.9%) | 17 (1.7%) |
| 65 to 74 Years | 0 (0.0%) | 0 (0.0%) |
| 75 Years and over | 10 (3.5%) | 4 (1.3%) |
Technology Access in Milton borough
Computing Device Access in Milton borough
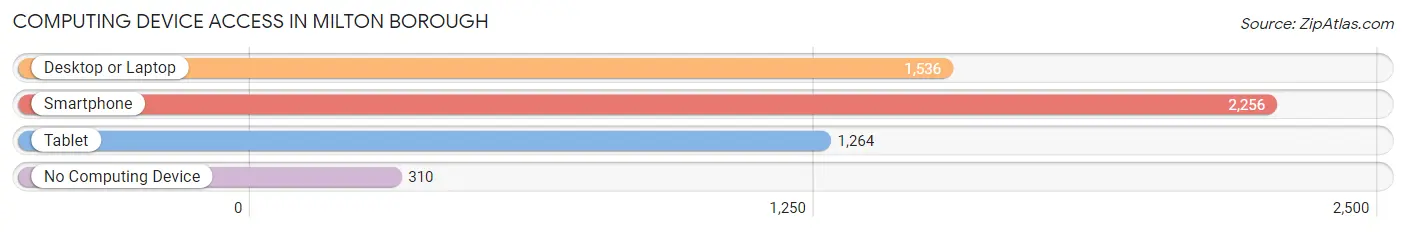
| Device Type | # Households | % Households |
| Desktop or Laptop | 1,536 | 56.0% |
| Smartphone | 2,256 | 82.2% |
| Tablet | 1,264 | 46.1% |
| No Computing Device | 310 | 11.3% |
| Total | 2,745 | 100.0% |
Internet Access in Milton borough
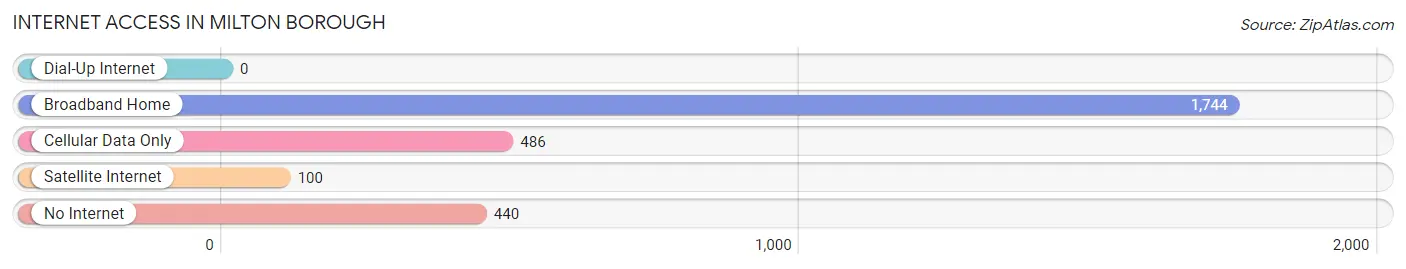
| Internet Type | # Households | % Households |
| Dial-Up Internet | 0 | 0.0% |
| Broadband Home | 1,744 | 63.5% |
| Cellular Data Only | 486 | 17.7% |
| Satellite Internet | 100 | 3.6% |
| No Internet | 440 | 16.0% |
| Total | 2,745 | 100.0% |
Milton borough Summary
Milton Borough is a small borough located in Northumberland County, Pennsylvania. It is situated along the Susquehanna River, approximately 10 miles north of the city of Sunbury. The borough was incorporated in 1864 and has a population of approximately 2,500 people.
History
Milton Borough was first settled in 1772 by a group of German immigrants. The town was originally known as Milltown, due to the presence of several mills along the Susquehanna River. In 1864, the town was officially incorporated as Milton Borough.
The town was an important stop along the Susquehanna Canal, which was built in the early 1800s. The canal was used to transport goods and people between the towns of Sunbury and Northumberland. The canal was eventually replaced by the Pennsylvania Railroad in the late 1800s.
The town was also home to several industries, including a paper mill, a tannery, and a brickyard. These industries provided employment for many of the town’s residents.
Geography
Milton Borough is located in Northumberland County, Pennsylvania. It is situated along the Susquehanna River, approximately 10 miles north of the city of Sunbury. The borough is bordered by the townships of Turbot, Limestone, and Upper Augusta.
The borough has a total area of 1.2 square miles, all of which is land. The terrain is mostly flat, with some rolling hills. The climate is humid continental, with hot summers and cold winters.
Economy
Milton Borough’s economy is largely based on tourism and retail. The town is home to several small businesses, including restaurants, shops, and galleries. The town also has a small industrial park, which is home to several manufacturing companies.
The town is also home to several educational institutions, including a community college and a technical school. These institutions provide employment for many of the town’s residents.
Demographics
As of the 2010 census, Milton Borough had a population of 2,500 people. The racial makeup of the town was 97.2% White, 0.8% African American, 0.4% Native American, 0.4% Asian, and 1.2% from other races.
The median household income in Milton Borough was $37,500, and the median family income was $45,000. The per capita income was $19,000. Approximately 11.2% of the population was below the poverty line.
Milton Borough is a small, rural town with a rich history and a diverse population. The town is home to several small businesses and educational institutions, providing employment and educational opportunities for its residents. The town is also a popular tourist destination, with its scenic views of the Susquehanna River and its proximity to the city of Sunbury.
Common Questions
What is Per Capita Income in Milton borough?
Per Capita income in Milton borough is $28,126.
What is the Median Family Income in Milton borough?
Median Family Income in Milton borough is $63,365.
What is the Median Household income in Milton borough?
Median Household Income in Milton borough is $50,431.
What is Income or Wage Gap in Milton borough?
Income or Wage Gap in Milton borough is 41.2%.
Women in Milton borough earn 58.8 cents for every dollar earned by a man.
What is Inequality or Gini Index in Milton borough?
Inequality or Gini Index in Milton borough is 0.40.
What is the Total Population of Milton borough?
Total Population of Milton borough is 6,610.
What is the Total Male Population of Milton borough?
Total Male Population of Milton borough is 3,424.
What is the Total Female Population of Milton borough?
Total Female Population of Milton borough is 3,186.
What is the Ratio of Males per 100 Females in Milton borough?
There are 107.47 Males per 100 Females in Milton borough.
What is the Ratio of Females per 100 Males in Milton borough?
There are 93.05 Females per 100 Males in Milton borough.
What is the Median Population Age in Milton borough?
Median Population Age in Milton borough is 36.1 Years.
What is the Average Family Size in Milton borough
Average Family Size in Milton borough is 3.0 People.
What is the Average Household Size in Milton borough
Average Household Size in Milton borough is 2.4 People.
How Large is the Labor Force in Milton borough?
There are 3,656 People in the Labor Forcein in Milton borough.
What is the Percentage of People in the Labor Force in Milton borough?
70.3% of People are in the Labor Force in Milton borough.
What is the Unemployment Rate in Milton borough?
Unemployment Rate in Milton borough is 7.0%.