Waterford borough, PA Map & Demographics
Waterford borough Overview
$31,524
PER CAPITA INCOME
$73,438
AVG FAMILY INCOME
$48,393
AVG HOUSEHOLD INCOME
31.5%
WAGE / INCOME GAP [ % ]
68.5¢/ $1
WAGE / INCOME GAP [ $ ]
0.44
INEQUALITY / GINI INDEX
1,244
TOTAL POPULATION
540
MALE POPULATION
704
FEMALE POPULATION
76.70
MALES / 100 FEMALES
130.37
FEMALES / 100 MALES
48.3
MEDIAN AGE
2.9
AVG FAMILY SIZE
2.2
AVG HOUSEHOLD SIZE
625
LABOR FORCE [ PEOPLE ]
62.8%
PERCENT IN LABOR FORCE
9.2%
UNEMPLOYMENT RATE
Income in Waterford borough
Income Overview in Waterford borough
Per Capita Income in Waterford borough is $31,524, while median incomes of families and households are $73,438 and $48,393 respectively.
| Characteristic | Number | Measure |
| Per Capita Income | 1,244 | $31,524 |
| Median Family Income | 327 | $73,438 |
| Mean Family Income | 327 | $84,144 |
| Median Household Income | 565 | $48,393 |
| Mean Household Income | 565 | $65,910 |
| Income Deficit | 327 | $0 |
| Wage / Income Gap (%) | 1,244 | 31.55% |
| Wage / Income Gap ($) | 1,244 | 68.45¢ per $1 |
| Gini / Inequality Index | 1,244 | 0.44 |
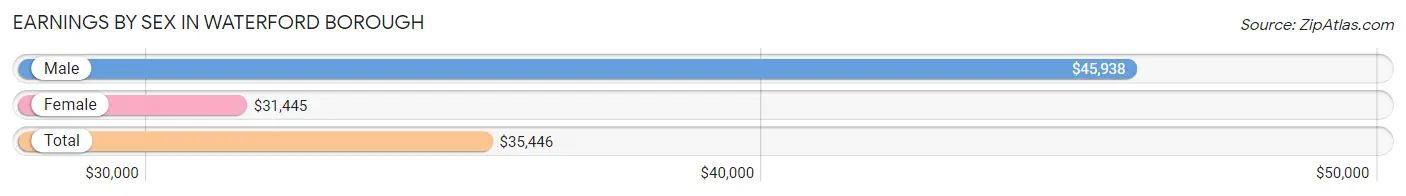
Earnings by Sex in Waterford borough
Average Earnings in Waterford borough are $35,446, $45,938 for men and $31,445 for women, a difference of 31.6%.
| Sex | Number | Average Earnings |
| Male | 331 (53.6%) | $45,938 |
| Female | 287 (46.4%) | $31,445 |
| Total | 618 (100.0%) | $35,446 |
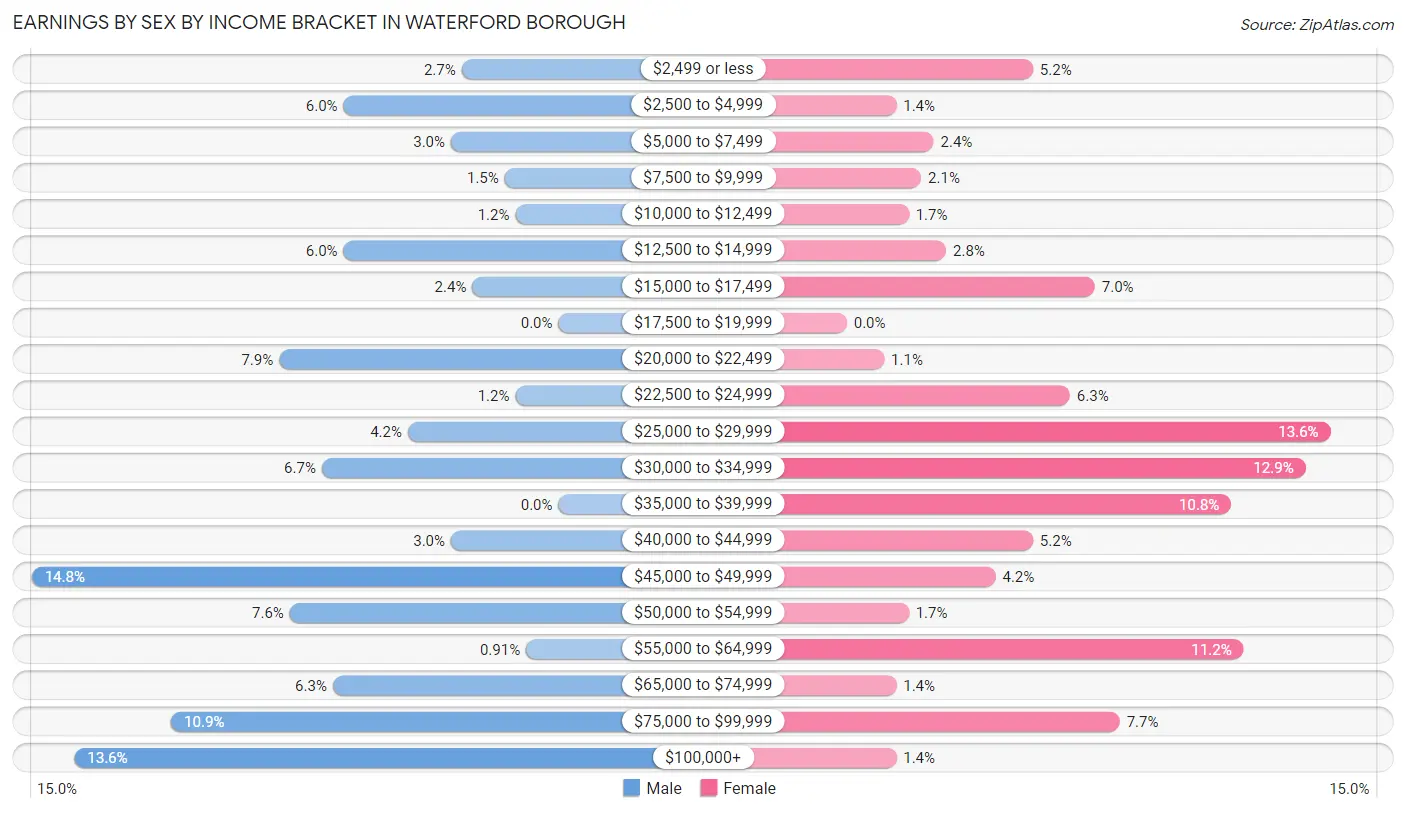
Earnings by Sex by Income Bracket in Waterford borough
The most common earnings brackets in Waterford borough are $45,000 to $49,999 for men (49 | 14.8%) and $25,000 to $29,999 for women (39 | 13.6%).
| Income | Male | Female |
| $2,499 or less | 9 (2.7%) | 15 (5.2%) |
| $2,500 to $4,999 | 20 (6.0%) | 4 (1.4%) |
| $5,000 to $7,499 | 10 (3.0%) | 7 (2.4%) |
| $7,500 to $9,999 | 5 (1.5%) | 6 (2.1%) |
| $10,000 to $12,499 | 4 (1.2%) | 5 (1.7%) |
| $12,500 to $14,999 | 20 (6.0%) | 8 (2.8%) |
| $15,000 to $17,499 | 8 (2.4%) | 20 (7.0%) |
| $17,500 to $19,999 | 0 (0.0%) | 0 (0.0%) |
| $20,000 to $22,499 | 26 (7.9%) | 3 (1.1%) |
| $22,500 to $24,999 | 4 (1.2%) | 18 (6.3%) |
| $25,000 to $29,999 | 14 (4.2%) | 39 (13.6%) |
| $30,000 to $34,999 | 22 (6.7%) | 37 (12.9%) |
| $35,000 to $39,999 | 0 (0.0%) | 31 (10.8%) |
| $40,000 to $44,999 | 10 (3.0%) | 15 (5.2%) |
| $45,000 to $49,999 | 49 (14.8%) | 12 (4.2%) |
| $50,000 to $54,999 | 25 (7.5%) | 5 (1.7%) |
| $55,000 to $64,999 | 3 (0.9%) | 32 (11.2%) |
| $65,000 to $74,999 | 21 (6.3%) | 4 (1.4%) |
| $75,000 to $99,999 | 36 (10.9%) | 22 (7.7%) |
| $100,000+ | 45 (13.6%) | 4 (1.4%) |
| Total | 331 (100.0%) | 287 (100.0%) |
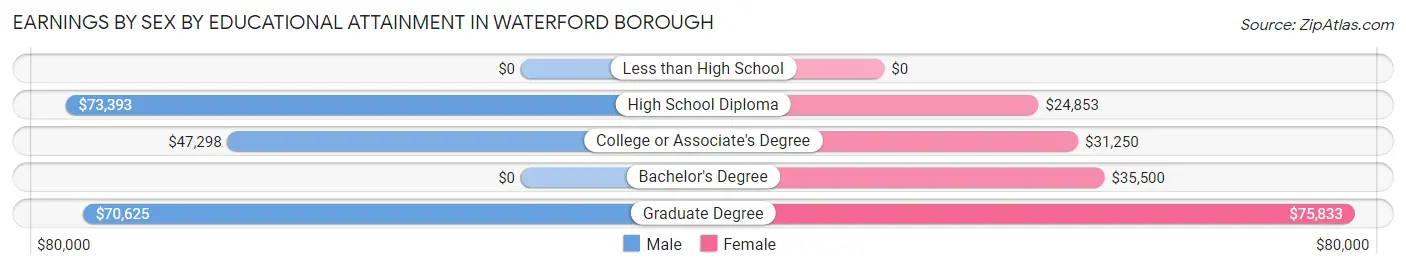
Earnings by Sex by Educational Attainment in Waterford borough
Average earnings in Waterford borough are $48,365 for men and $31,797 for women, a difference of 34.3%. Men with an educational attainment of high school diploma enjoy the highest average annual earnings of $73,393, while those with college or associate's degree education earn the least with $47,298. Women with an educational attainment of graduate degree earn the most with the average annual earnings of $75,833, while those with high school diploma education have the smallest earnings of $24,853.
| Educational Attainment | Male Income | Female Income |
| Less than High School | - | - |
| High School Diploma | $73,393 | $24,853 |
| College or Associate's Degree | $47,298 | $31,250 |
| Bachelor's Degree | - | - |
| Graduate Degree | $70,625 | $75,833 |
| Total | $48,365 | $31,797 |
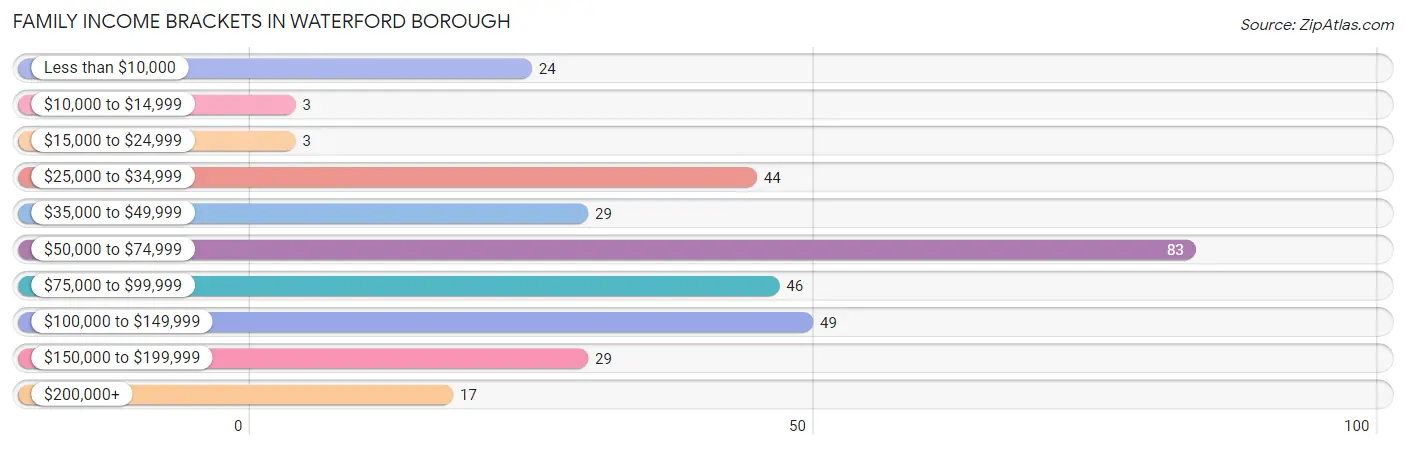
Family Income in Waterford borough
Family Income Brackets in Waterford borough
According to the Waterford borough family income data, there are 83 families falling into the $50,000 to $74,999 income range, which is the most common income bracket and makes up 25.4% of all families. Conversely, the $10,000 to $14,999 income bracket is the least frequent group with only 3 families (0.9%) belonging to this category.
| Income Bracket | # Families | % Families |
| Less than $10,000 | 24 | 7.3% |
| $10,000 to $14,999 | 3 | 0.9% |
| $15,000 to $24,999 | 3 | 0.9% |
| $25,000 to $34,999 | 44 | 13.5% |
| $35,000 to $49,999 | 29 | 8.9% |
| $50,000 to $74,999 | 83 | 25.4% |
| $75,000 to $99,999 | 46 | 14.1% |
| $100,000 to $149,999 | 49 | 15.0% |
| $150,000 to $199,999 | 29 | 8.9% |
| $200,000+ | 17 | 5.2% |
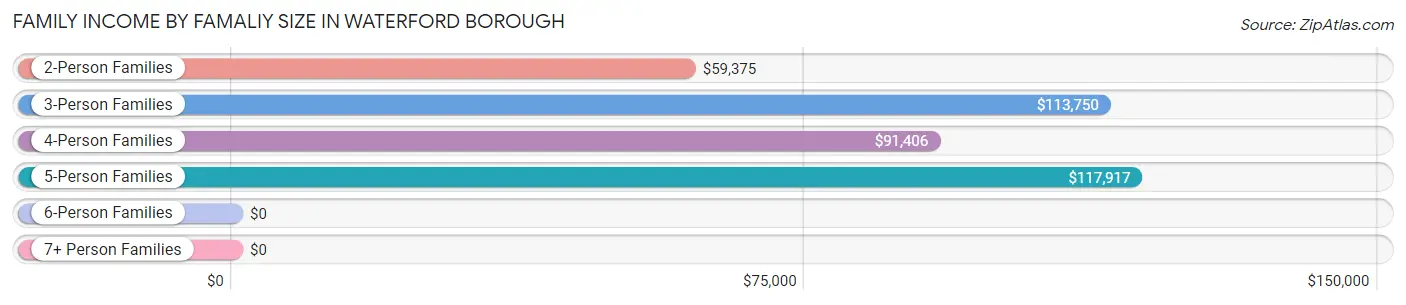
Family Income by Famaliy Size in Waterford borough
5-person families (21 | 6.4%) account for the highest median family income in Waterford borough with $117,917 per family, while 3-person families (44 | 13.5%) have the highest median income of $37,917 per family member.
| Income Bracket | # Families | Median Income |
| 2-Person Families | 185 (56.6%) | $59,375 |
| 3-Person Families | 44 (13.5%) | $113,750 |
| 4-Person Families | 75 (22.9%) | $91,406 |
| 5-Person Families | 21 (6.4%) | $117,917 |
| 6-Person Families | 2 (0.6%) | $0 |
| 7+ Person Families | 0 (0.0%) | $0 |
| Total | 327 (100.0%) | $73,438 |
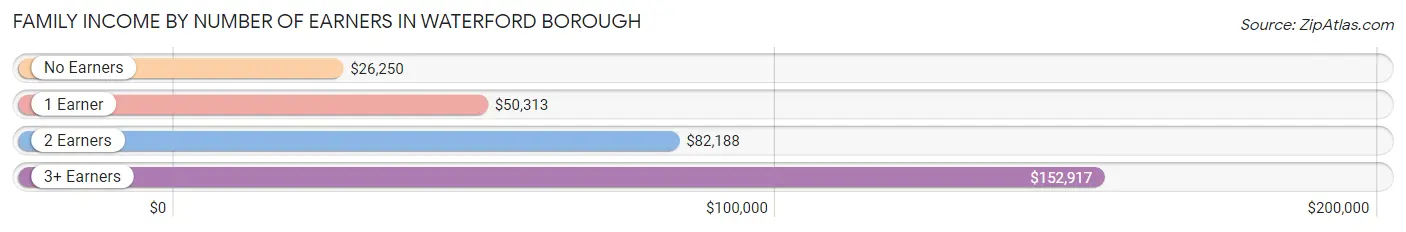
Family Income by Number of Earners in Waterford borough
The median family income in Waterford borough is $73,438, with families comprising 3+ earners (28) having the highest median family income of $152,917, while families with no earners (58) have the lowest median family income of $26,250, accounting for 8.6% and 17.7% of families, respectively.
| Number of Earners | # Families | Median Income |
| No Earners | 58 (17.7%) | $26,250 |
| 1 Earner | 98 (30.0%) | $50,313 |
| 2 Earners | 143 (43.7%) | $82,188 |
| 3+ Earners | 28 (8.6%) | $152,917 |
| Total | 327 (100.0%) | $73,438 |
Household Income in Waterford borough
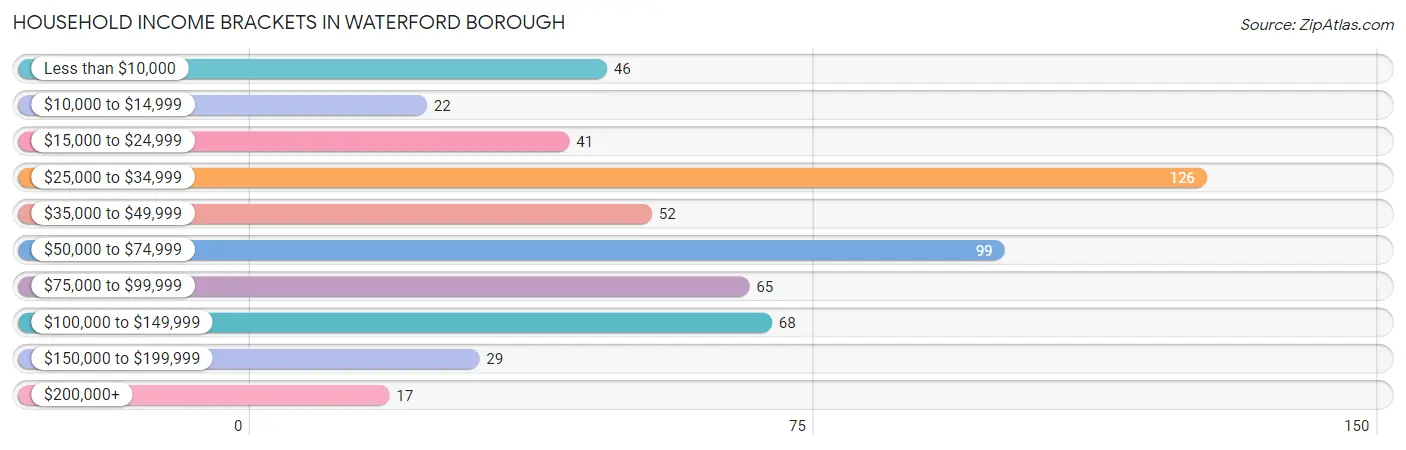
Household Income Brackets in Waterford borough
With 126 households falling in the category, the $25,000 to $34,999 income range is the most frequent in Waterford borough, accounting for 22.3% of all households. In contrast, only 17 households (3.0%) fall into the $200,000+ income bracket, making it the least populous group.
| Income Bracket | # Households | % Households |
| Less than $10,000 | 46 | 8.1% |
| $10,000 to $14,999 | 22 | 3.9% |
| $15,000 to $24,999 | 41 | 7.3% |
| $25,000 to $34,999 | 126 | 22.3% |
| $35,000 to $49,999 | 52 | 9.2% |
| $50,000 to $74,999 | 99 | 17.5% |
| $75,000 to $99,999 | 65 | 11.5% |
| $100,000 to $149,999 | 68 | 12.0% |
| $150,000 to $199,999 | 29 | 5.1% |
| $200,000+ | 17 | 3.0% |
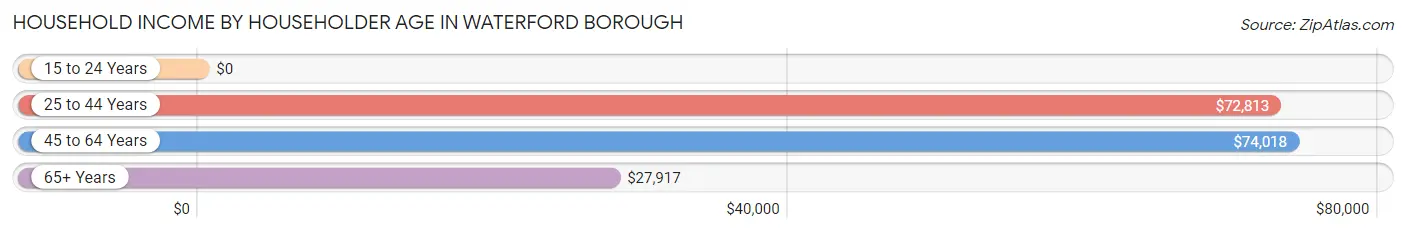
Household Income by Householder Age in Waterford borough
The median household income in Waterford borough is $48,393, with the highest median household income of $74,018 found in the 45 to 64 years age bracket for the primary householder. A total of 226 households (40.0%) fall into this category. Meanwhile, the 15 to 24 years age bracket for the primary householder has the lowest median household income of $0, with 20 households (3.5%) in this group.
| Income Bracket | # Households | Median Income |
| 15 to 24 Years | 20 (3.5%) | $0 |
| 25 to 44 Years | 130 (23.0%) | $72,813 |
| 45 to 64 Years | 226 (40.0%) | $74,018 |
| 65+ Years | 189 (33.5%) | $27,917 |
| Total | 565 (100.0%) | $48,393 |
Poverty in Waterford borough
Income Below Poverty by Sex and Age in Waterford borough
With 10.6% poverty level for males and 10.5% for females among the residents of Waterford borough, 15 year old males and 65 to 74 year old females are the most vulnerable to poverty, with 9 males (81.8%) and 13 females (19.1%) in their respective age groups living below the poverty level.
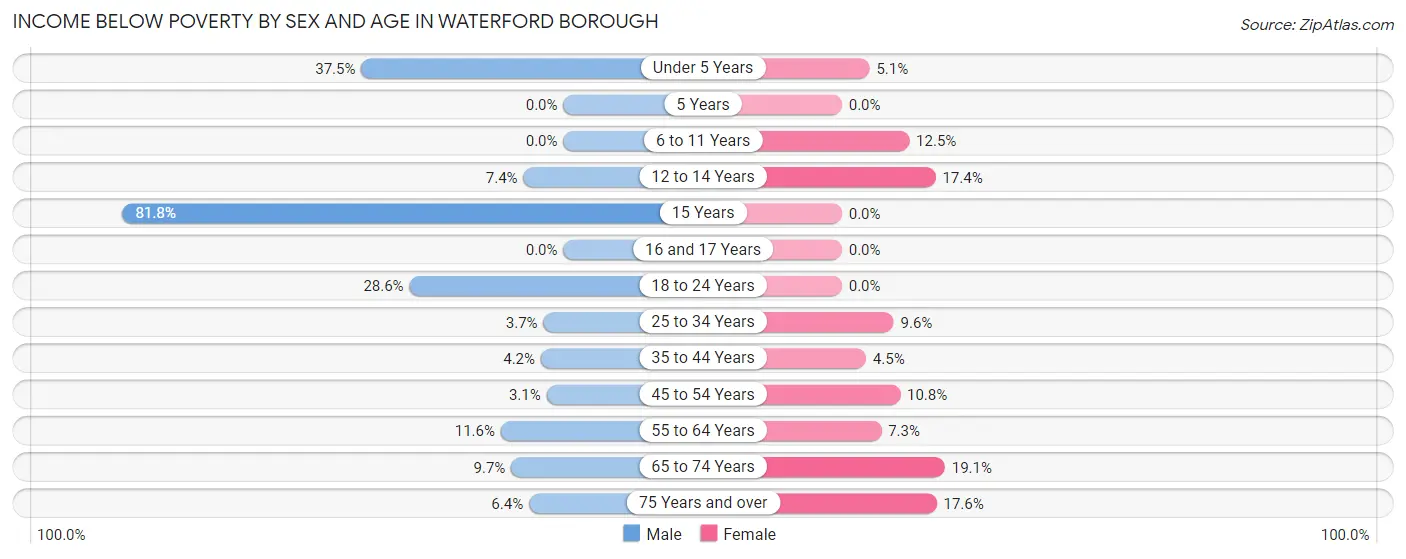
| Age Bracket | Male | Female |
| Under 5 Years | 6 (37.5%) | 2 (5.1%) |
| 5 Years | 0 (0.0%) | 0 (0.0%) |
| 6 to 11 Years | 0 (0.0%) | 10 (12.5%) |
| 12 to 14 Years | 2 (7.4%) | 4 (17.4%) |
| 15 Years | 9 (81.8%) | 0 (0.0%) |
| 16 and 17 Years | 0 (0.0%) | 0 (0.0%) |
| 18 to 24 Years | 14 (28.6%) | 0 (0.0%) |
| 25 to 34 Years | 2 (3.7%) | 5 (9.6%) |
| 35 to 44 Years | 3 (4.2%) | 3 (4.5%) |
| 45 to 54 Years | 2 (3.1%) | 8 (10.8%) |
| 55 to 64 Years | 13 (11.6%) | 12 (7.3%) |
| 65 to 74 Years | 3 (9.7%) | 13 (19.1%) |
| 75 Years and over | 3 (6.4%) | 16 (17.6%) |
| Total | 57 (10.6%) | 73 (10.5%) |
Income Above Poverty by Sex and Age in Waterford borough
According to the poverty statistics in Waterford borough, males aged 6 to 11 years and females aged 15 years are the age groups that are most secure financially, with 100.0% of males and 100.0% of females in these age groups living above the poverty line.
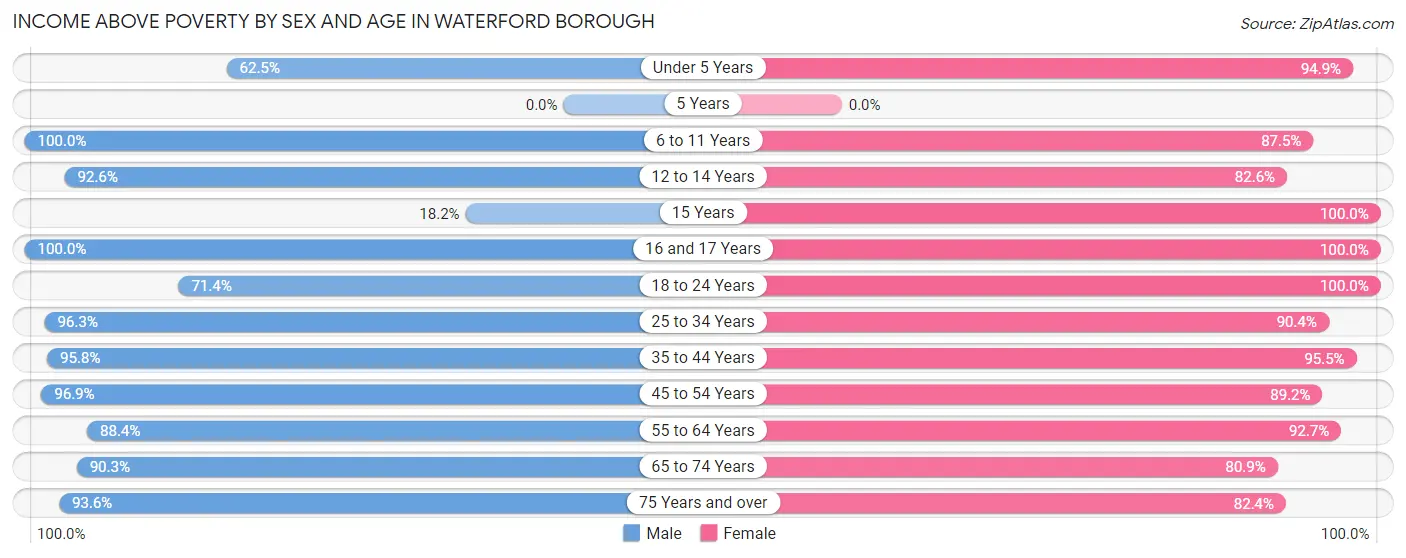
| Age Bracket | Male | Female |
| Under 5 Years | 10 (62.5%) | 37 (94.9%) |
| 5 Years | 0 (0.0%) | 0 (0.0%) |
| 6 to 11 Years | 36 (100.0%) | 70 (87.5%) |
| 12 to 14 Years | 25 (92.6%) | 19 (82.6%) |
| 15 Years | 2 (18.2%) | 5 (100.0%) |
| 16 and 17 Years | 21 (100.0%) | 13 (100.0%) |
| 18 to 24 Years | 35 (71.4%) | 17 (100.0%) |
| 25 to 34 Years | 52 (96.3%) | 47 (90.4%) |
| 35 to 44 Years | 69 (95.8%) | 64 (95.5%) |
| 45 to 54 Years | 62 (96.9%) | 66 (89.2%) |
| 55 to 64 Years | 99 (88.4%) | 152 (92.7%) |
| 65 to 74 Years | 28 (90.3%) | 55 (80.9%) |
| 75 Years and over | 44 (93.6%) | 75 (82.4%) |
| Total | 483 (89.4%) | 620 (89.5%) |
Income Below Poverty Among Married-Couple Families in Waterford borough
The poverty statistics for married-couple families in Waterford borough show that 6.2% or 15 of the total 243 families live below the poverty line. Families with 3 or 4 children have the highest poverty rate of 10.0%, comprising of 2 families. On the other hand, families with 1 or 2 children have the lowest poverty rate of 3.4%, which includes 2 families.
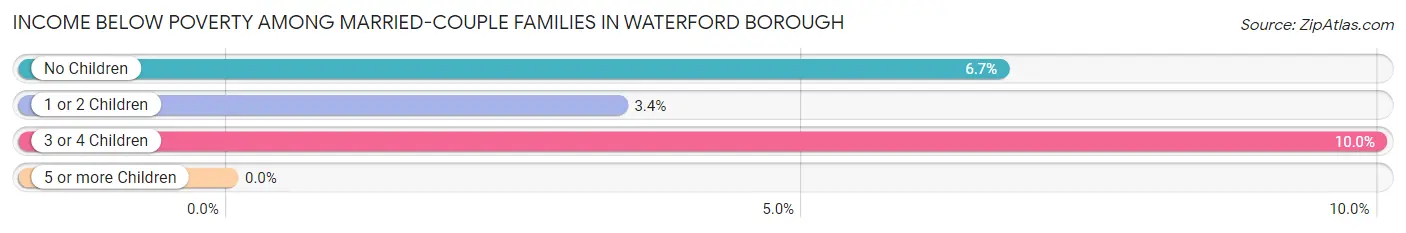
| Children | Above Poverty | Below Poverty |
| No Children | 153 (93.3%) | 11 (6.7%) |
| 1 or 2 Children | 57 (96.6%) | 2 (3.4%) |
| 3 or 4 Children | 18 (90.0%) | 2 (10.0%) |
| 5 or more Children | 0 (0.0%) | 0 (0.0%) |
| Total | 228 (93.8%) | 15 (6.2%) |
Income Below Poverty Among Single-Parent Households in Waterford borough
According to the poverty data in Waterford borough, 20.0% or 4 single-father households and 17.2% or 11 single-mother households are living below the poverty line. Among single-father households, those with 1 or 2 children have the highest poverty rate, with 4 households (20.0%) experiencing poverty. Likewise, among single-mother households, those with 3 or 4 children have the highest poverty rate, with 3 households (18.8%) falling below the poverty line.
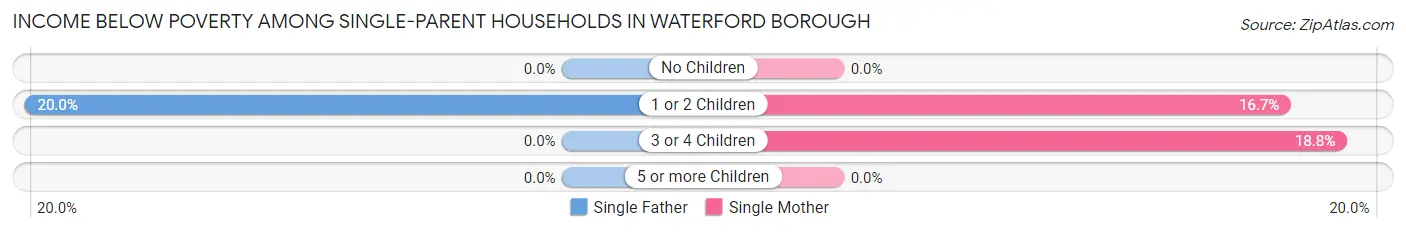
| Children | Single Father | Single Mother |
| No Children | 0 (0.0%) | 0 (0.0%) |
| 1 or 2 Children | 4 (20.0%) | 8 (16.7%) |
| 3 or 4 Children | 0 (0.0%) | 3 (18.8%) |
| 5 or more Children | 0 (0.0%) | 0 (0.0%) |
| Total | 4 (20.0%) | 11 (17.2%) |
Income Below Poverty Among Married-Couple vs Single-Parent Households in Waterford borough
The poverty data for Waterford borough shows that 15 of the married-couple family households (6.2%) and 15 of the single-parent households (17.9%) are living below the poverty level. Within the married-couple family households, those with 3 or 4 children have the highest poverty rate, with 2 households (10.0%) falling below the poverty line. Among the single-parent households, those with 3 or 4 children have the highest poverty rate, with 3 household (18.8%) living below poverty.
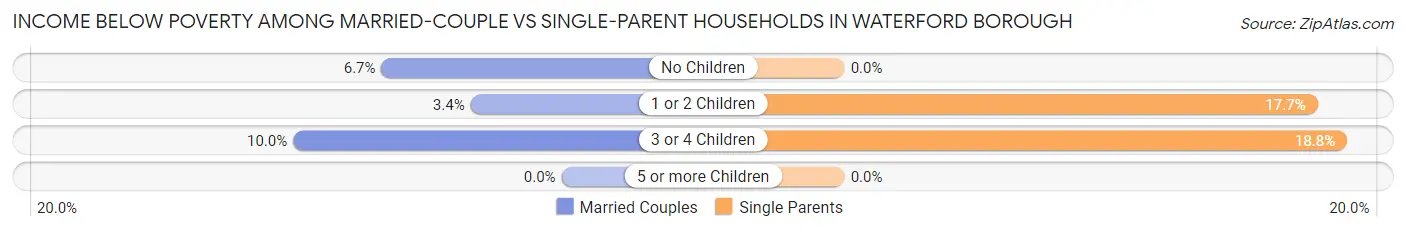
| Children | Married-Couple Families | Single-Parent Households |
| No Children | 11 (6.7%) | 0 (0.0%) |
| 1 or 2 Children | 2 (3.4%) | 12 (17.6%) |
| 3 or 4 Children | 2 (10.0%) | 3 (18.8%) |
| 5 or more Children | 0 (0.0%) | 0 (0.0%) |
| Total | 15 (6.2%) | 15 (17.9%) |
Race in Waterford borough
The most populous races in Waterford borough are White / Caucasian (1,135 | 91.2%), Two or more Races (109 | 8.8%), and Hispanic or Latino (94 | 7.6%).
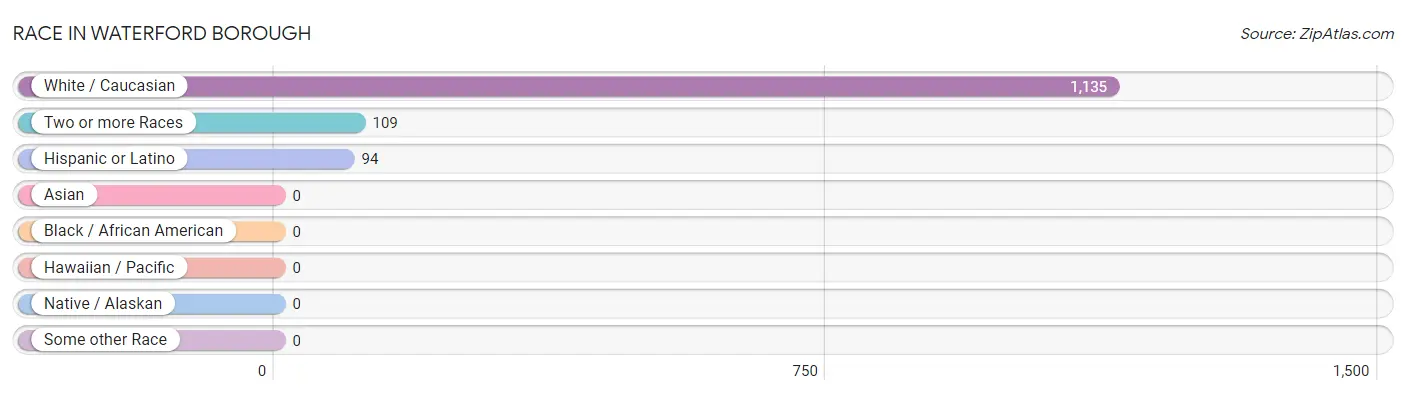
| Race | # Population | % Population |
| Asian | 0 | 0.0% |
| Black / African American | 0 | 0.0% |
| Hawaiian / Pacific | 0 | 0.0% |
| Hispanic or Latino | 94 | 7.6% |
| Native / Alaskan | 0 | 0.0% |
| White / Caucasian | 1,135 | 91.2% |
| Two or more Races | 109 | 8.8% |
| Some other Race | 0 | 0.0% |
| Total | 1,244 | 100.0% |
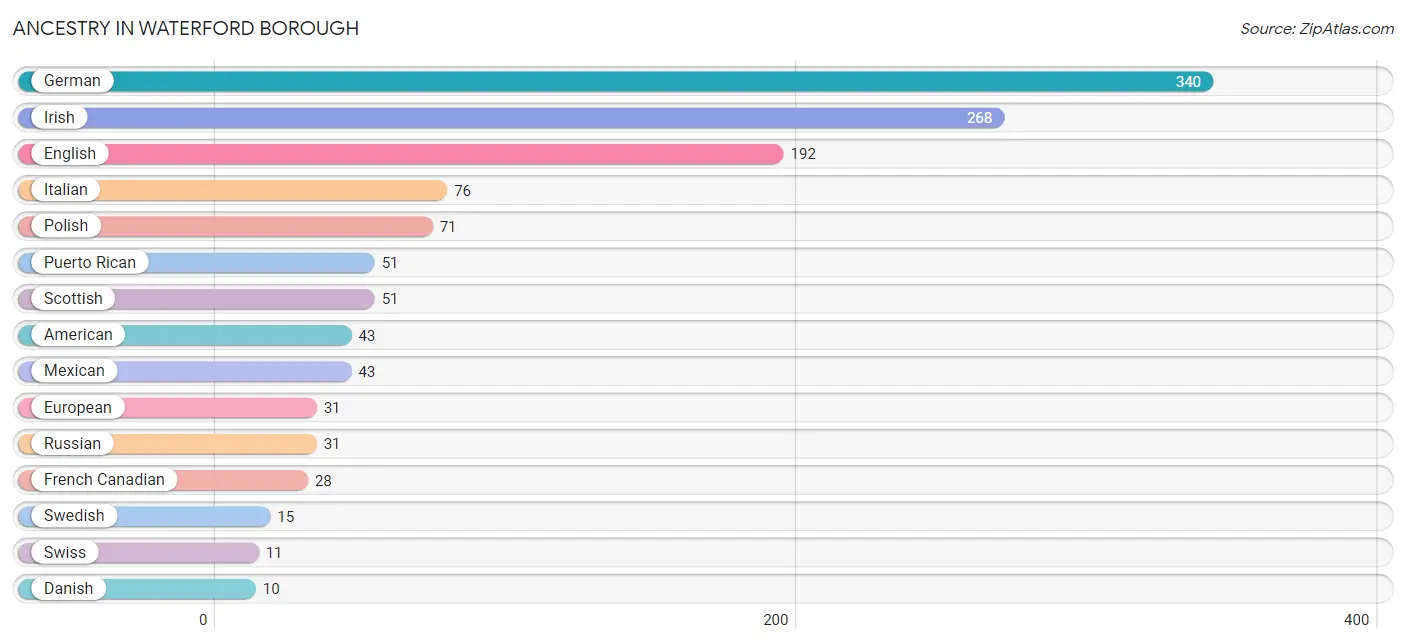
Ancestry in Waterford borough
The most populous ancestries reported in Waterford borough are German (340 | 27.3%), Irish (268 | 21.5%), English (192 | 15.4%), Italian (76 | 6.1%), and Polish (71 | 5.7%), together accounting for 76.1% of all Waterford borough residents.
| Ancestry | # Population | % Population |
| American | 43 | 3.5% |
| British | 3 | 0.2% |
| Cherokee | 2 | 0.2% |
| Danish | 10 | 0.8% |
| Dutch | 8 | 0.6% |
| English | 192 | 15.4% |
| European | 31 | 2.5% |
| French | 5 | 0.4% |
| French Canadian | 28 | 2.2% |
| German | 340 | 27.3% |
| Greek | 3 | 0.2% |
| Irish | 268 | 21.5% |
| Italian | 76 | 6.1% |
| Lithuanian | 4 | 0.3% |
| Mexican | 43 | 3.5% |
| Polish | 71 | 5.7% |
| Puerto Rican | 51 | 4.1% |
| Russian | 31 | 2.5% |
| Scotch-Irish | 10 | 0.8% |
| Scottish | 51 | 4.1% |
| Slovak | 5 | 0.4% |
| Swedish | 15 | 1.2% |
| Swiss | 11 | 0.9% |
| Welsh | 9 | 0.7% | View All 24 Rows |
Immigrants in Waterford borough
The most numerous immigrant groups reported in Waterford borough came from Europe (2 | 0.2%), Northern Europe (2 | 0.2%), and Scotland (2 | 0.2%), together accounting for 0.5% of all Waterford borough residents.
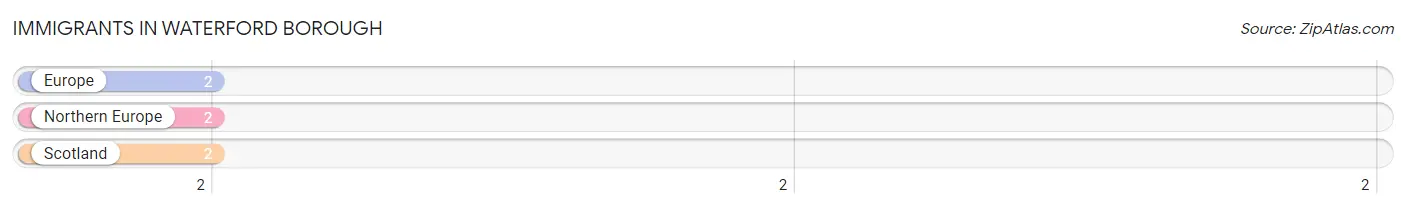
| Immigration Origin | # Population | % Population |
| Europe | 2 | 0.2% |
| Northern Europe | 2 | 0.2% |
| Scotland | 2 | 0.2% | View All 3 Rows |
Sex and Age in Waterford borough
Sex and Age in Waterford borough
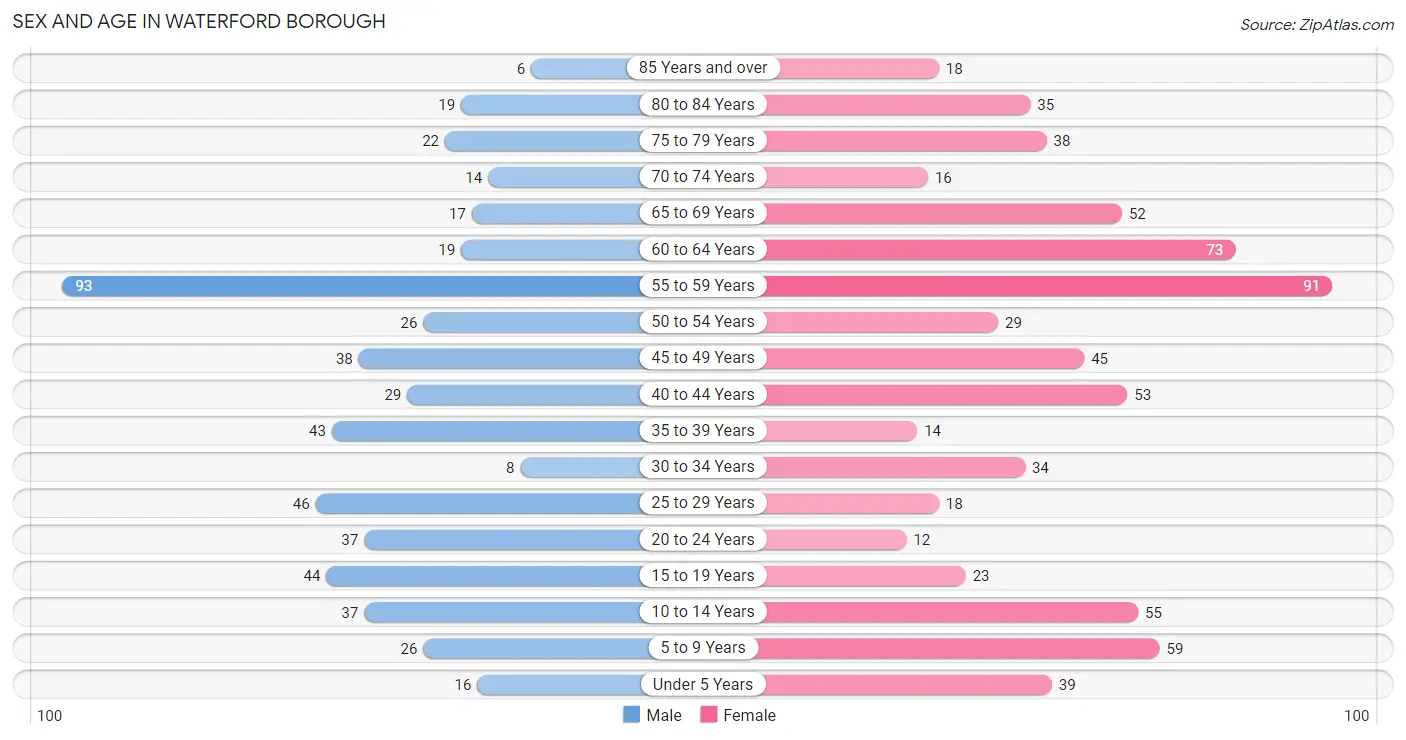
The most populous age groups in Waterford borough are 55 to 59 Years (93 | 17.2%) for men and 55 to 59 Years (91 | 12.9%) for women.
| Age Bracket | Male | Female |
| Under 5 Years | 16 (3.0%) | 39 (5.5%) |
| 5 to 9 Years | 26 (4.8%) | 59 (8.4%) |
| 10 to 14 Years | 37 (6.9%) | 55 (7.8%) |
| 15 to 19 Years | 44 (8.2%) | 23 (3.3%) |
| 20 to 24 Years | 37 (6.9%) | 12 (1.7%) |
| 25 to 29 Years | 46 (8.5%) | 18 (2.6%) |
| 30 to 34 Years | 8 (1.5%) | 34 (4.8%) |
| 35 to 39 Years | 43 (8.0%) | 14 (2.0%) |
| 40 to 44 Years | 29 (5.4%) | 53 (7.5%) |
| 45 to 49 Years | 38 (7.0%) | 45 (6.4%) |
| 50 to 54 Years | 26 (4.8%) | 29 (4.1%) |
| 55 to 59 Years | 93 (17.2%) | 91 (12.9%) |
| 60 to 64 Years | 19 (3.5%) | 73 (10.4%) |
| 65 to 69 Years | 17 (3.2%) | 52 (7.4%) |
| 70 to 74 Years | 14 (2.6%) | 16 (2.3%) |
| 75 to 79 Years | 22 (4.1%) | 38 (5.4%) |
| 80 to 84 Years | 19 (3.5%) | 35 (5.0%) |
| 85 Years and over | 6 (1.1%) | 18 (2.6%) |
| Total | 540 (100.0%) | 704 (100.0%) |
Families and Households in Waterford borough
Median Family Size in Waterford borough
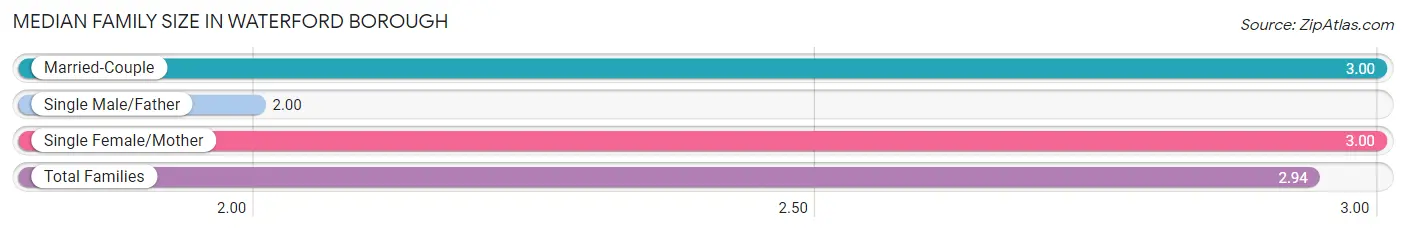
The median family size in Waterford borough is 2.94 persons per family, with married-couple families (243 | 74.3%) accounting for the largest median family size of 3 persons per family. On the other hand, single male/father families (20 | 6.1%) represent the smallest median family size with 2.00 persons per family.
| Family Type | # Families | Family Size |
| Married-Couple | 243 (74.3%) | 3.00 |
| Single Male/Father | 20 (6.1%) | 2.00 |
| Single Female/Mother | 64 (19.6%) | 3.00 |
| Total Families | 327 (100.0%) | 2.94 |
Median Household Size in Waterford borough
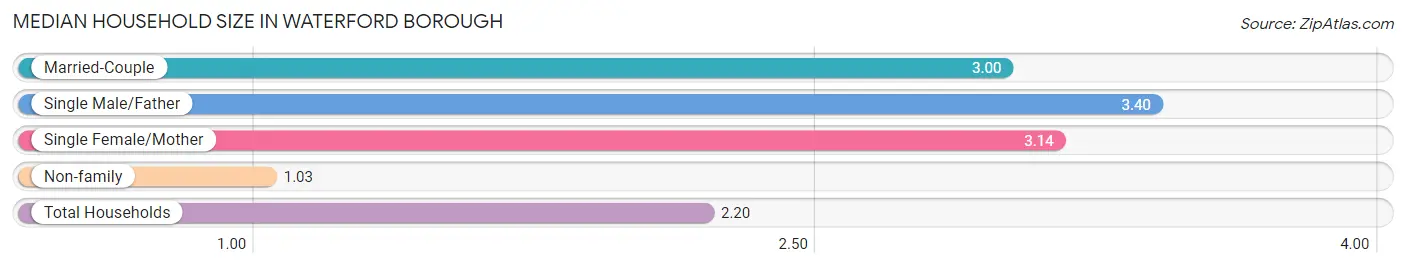
The median household size in Waterford borough is 2.20 persons per household, with single male/father households (20 | 3.5%) accounting for the largest median household size of 3.4 persons per household. non-family households (238 | 42.1%) represent the smallest median household size with 1.03 persons per household.
| Household Type | # Households | Household Size |
| Married-Couple | 243 (43.0%) | 3.00 |
| Single Male/Father | 20 (3.5%) | 3.40 |
| Single Female/Mother | 64 (11.3%) | 3.14 |
| Non-family | 238 (42.1%) | 1.03 |
| Total Households | 565 (100.0%) | 2.20 |
Household Size by Marriage Status in Waterford borough
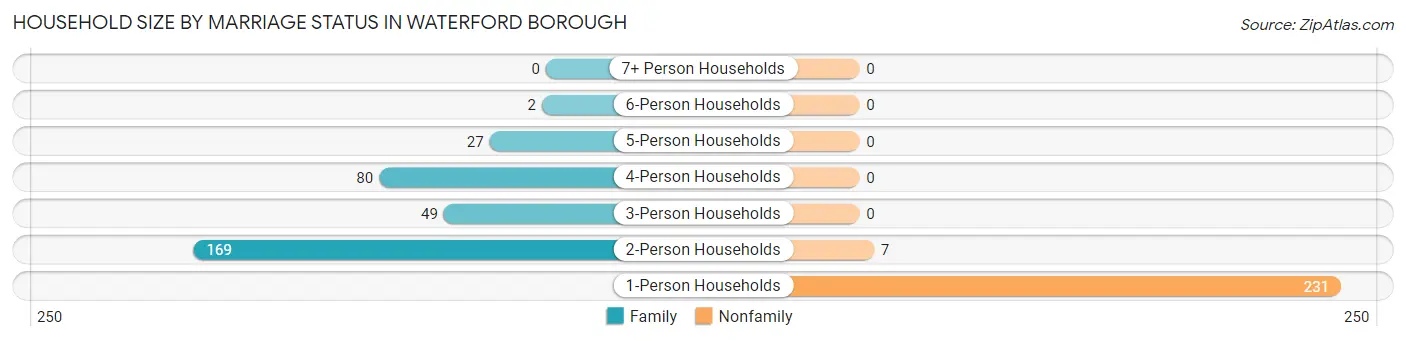
Out of a total of 565 households in Waterford borough, 327 (57.9%) are family households, while 238 (42.1%) are nonfamily households. The most numerous type of family households are 2-person households, comprising 169, and the most common type of nonfamily households are 1-person households, comprising 231.
| Household Size | Family Households | Nonfamily Households |
| 1-Person Households | - | 231 (40.9%) |
| 2-Person Households | 169 (29.9%) | 7 (1.2%) |
| 3-Person Households | 49 (8.7%) | 0 (0.0%) |
| 4-Person Households | 80 (14.2%) | 0 (0.0%) |
| 5-Person Households | 27 (4.8%) | 0 (0.0%) |
| 6-Person Households | 2 (0.4%) | 0 (0.0%) |
| 7+ Person Households | 0 (0.0%) | 0 (0.0%) |
| Total | 327 (57.9%) | 238 (42.1%) |
Female Fertility in Waterford borough
Fertility by Age in Waterford borough
Average fertility rate in Waterford borough is 52.0 births per 1,000 women. Women in the age bracket of 20 to 34 years have the highest fertility rate with 141.0 births per 1,000 women. Women in the age bracket of 20 to 34 years acount for 81.8% of all women with births.
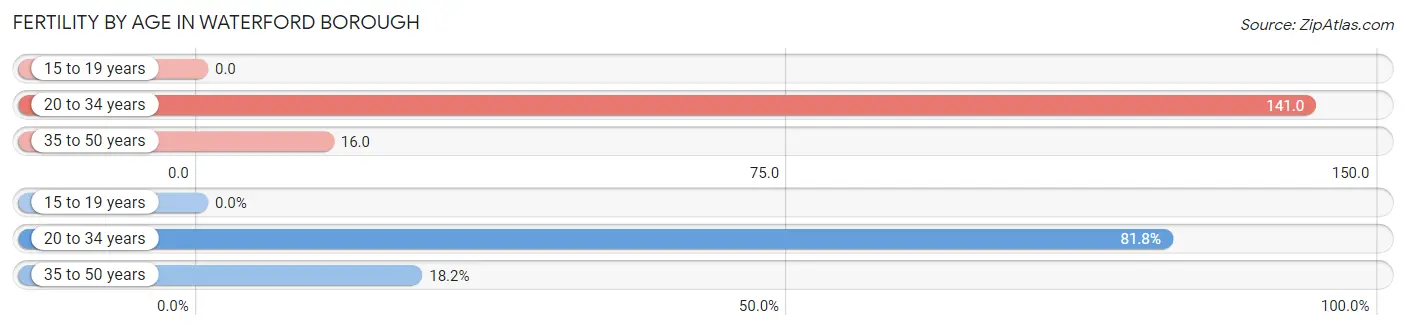
| Age Bracket | Women with Births | Births / 1,000 Women |
| 15 to 19 years | 0 (0.0%) | 0.0 |
| 20 to 34 years | 9 (81.8%) | 141.0 |
| 35 to 50 years | 2 (18.2%) | 16.0 |
| Total | 11 (100.0%) | 52.0 |
Fertility by Age by Marriage Status in Waterford borough
45.5% of women with births (11) in Waterford borough are married. The highest percentage of unmarried women with births falls into 20 to 34 years age bracket with 66.7% of them unmarried at the time of birth, while the lowest percentage of unmarried women with births belong to 35 to 50 years age bracket with 0.0% of them unmarried.
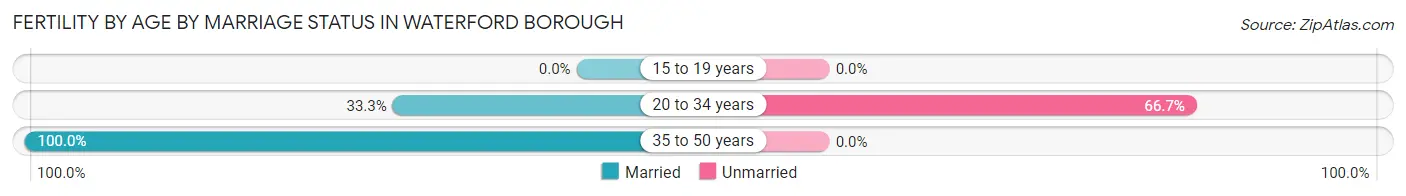
| Age Bracket | Married | Unmarried |
| 15 to 19 years | 0 (0.0%) | 0 (0.0%) |
| 20 to 34 years | 3 (33.3%) | 6 (66.7%) |
| 35 to 50 years | 2 (100.0%) | 0 (0.0%) |
| Total | 5 (45.5%) | 6 (54.5%) |
Fertility by Education in Waterford borough
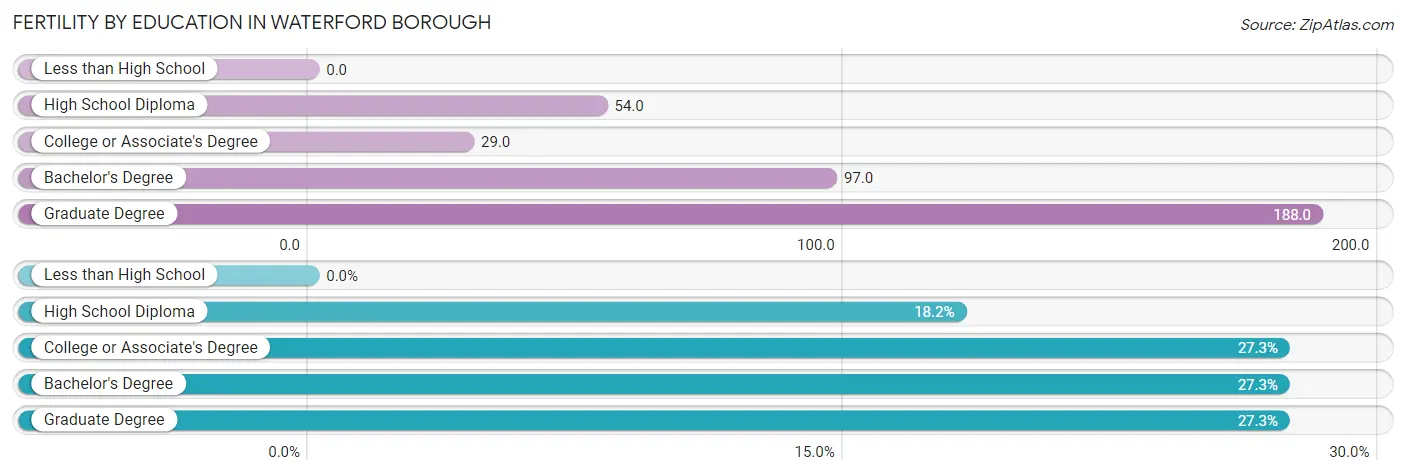
| Educational Attainment | Women with Births | Births / 1,000 Women |
| Less than High School | 0 (0.0%) | 0.0 |
| High School Diploma | 2 (18.2%) | 54.0 |
| College or Associate's Degree | 3 (27.3%) | 29.0 |
| Bachelor's Degree | 3 (27.3%) | 97.0 |
| Graduate Degree | 3 (27.3%) | 188.0 |
| Total | 11 (100.0%) | 52.0 |
Fertility by Education by Marriage Status in Waterford borough
54.5% of women with births in Waterford borough are unmarried. Women with the educational attainment of high school diploma are most likely to be married with 100.0% of them married at childbirth, while women with the educational attainment of college or associate's degree are least likely to be married with 100.0% of them unmarried at childbirth.
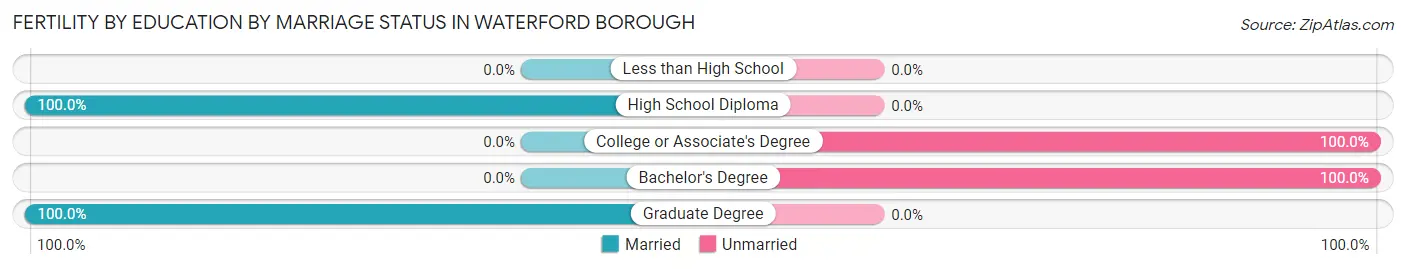
| Educational Attainment | Married | Unmarried |
| Less than High School | 0 (0.0%) | 0 (0.0%) |
| High School Diploma | 2 (100.0%) | 0 (0.0%) |
| College or Associate's Degree | 0 (0.0%) | 3 (100.0%) |
| Bachelor's Degree | 0 (0.0%) | 3 (100.0%) |
| Graduate Degree | 3 (100.0%) | 0 (0.0%) |
| Total | 5 (45.5%) | 6 (54.5%) |
Employment Characteristics in Waterford borough
Employment by Class of Employer in Waterford borough
Among the 565 employed individuals in Waterford borough, private company employees (353 | 62.5%), not-for-profit organizations (86 | 15.2%), and local government employees (50 | 8.8%) make up the most common classes of employment.
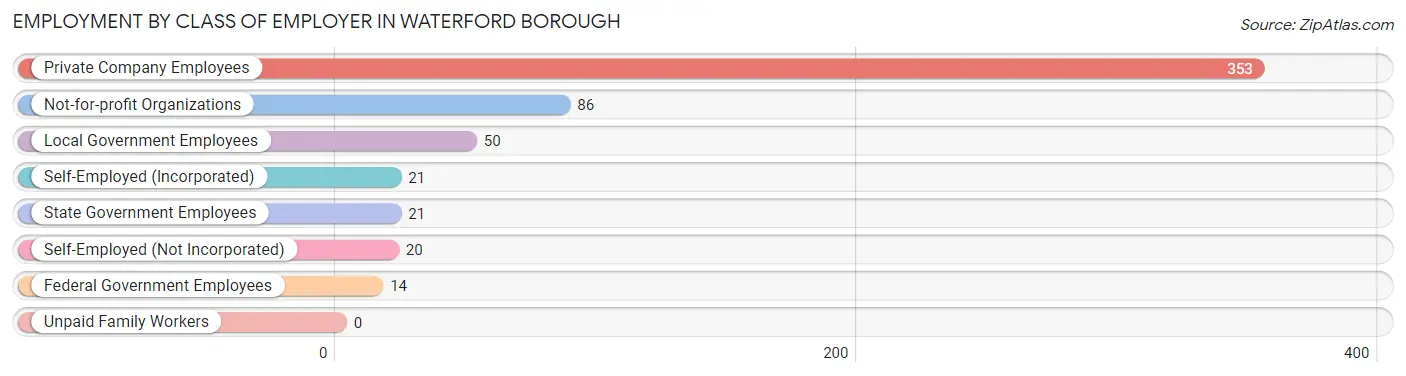
| Employer Class | # Employees | % Employees |
| Private Company Employees | 353 | 62.5% |
| Self-Employed (Incorporated) | 21 | 3.7% |
| Self-Employed (Not Incorporated) | 20 | 3.5% |
| Not-for-profit Organizations | 86 | 15.2% |
| Local Government Employees | 50 | 8.8% |
| State Government Employees | 21 | 3.7% |
| Federal Government Employees | 14 | 2.5% |
| Unpaid Family Workers | 0 | 0.0% |
| Total | 565 | 100.0% |
Employment Status by Age in Waterford borough
According to the labor force statistics for Waterford borough, out of the total population over 16 years of age (996), 62.8% or 625 individuals are in the labor force, with 9.2% or 58 of them unemployed. The age group with the highest labor force participation rate is 25 to 29 years, with 100.0% or 64 individuals in the labor force. Within the labor force, the 25 to 29 years age range has the highest percentage of unemployed individuals, with 26.6% or 17 of them being unemployed.
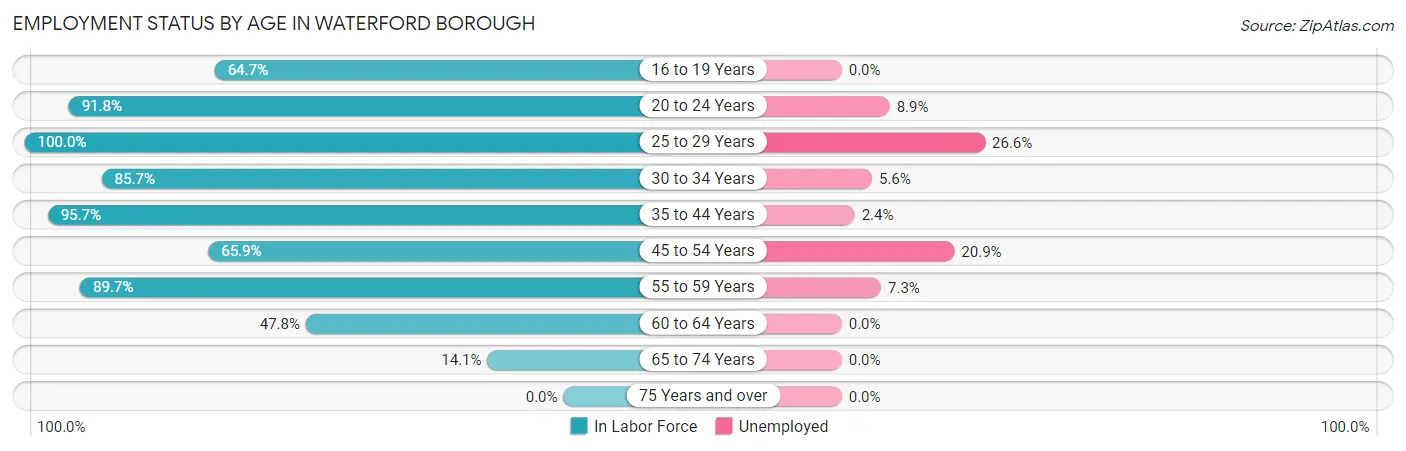
| Age Bracket | In Labor Force | Unemployed |
| 16 to 19 Years | 33 (64.7%) | 0 (0.0%) |
| 20 to 24 Years | 45 (91.8%) | 4 (8.9%) |
| 25 to 29 Years | 64 (100.0%) | 17 (26.6%) |
| 30 to 34 Years | 36 (85.7%) | 2 (5.6%) |
| 35 to 44 Years | 133 (95.7%) | 3 (2.4%) |
| 45 to 54 Years | 91 (65.9%) | 19 (20.9%) |
| 55 to 59 Years | 165 (89.7%) | 12 (7.3%) |
| 60 to 64 Years | 44 (47.8%) | 0 (0.0%) |
| 65 to 74 Years | 14 (14.1%) | 0 (0.0%) |
| 75 Years and over | 0 (0.0%) | 0 (0.0%) |
| Total | 625 (62.8%) | 58 (9.2%) |
Employment Status by Educational Attainment in Waterford borough
According to labor force statistics for Waterford borough, 80.9% of individuals (533) out of the total population between 25 and 64 years of age (659) are in the labor force, with 10.1% or 54 of them being unemployed. The group with the highest labor force participation rate are those with the educational attainment of bachelor's degree or higher, with 90.2% or 129 individuals in the labor force. Within the labor force, individuals with less than high school education have the highest percentage of unemployment, with 69.2% or 36 of them being unemployed.
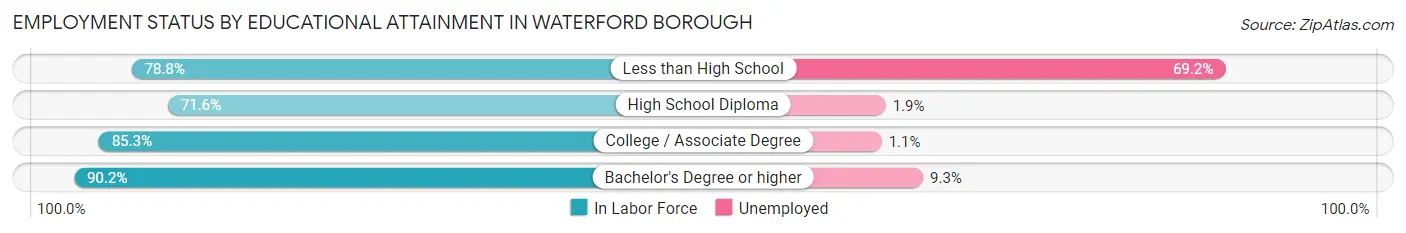
| Educational Attainment | In Labor Force | Unemployed |
| Less than High School | 52 (78.8%) | 46 (69.2%) |
| High School Diploma | 166 (71.6%) | 4 (1.9%) |
| College / Associate Degree | 186 (85.3%) | 2 (1.1%) |
| Bachelor's Degree or higher | 129 (90.2%) | 13 (9.3%) |
| Total | 533 (80.9%) | 67 (10.1%) |
Employment Occupations by Sex in Waterford borough
Management, Business, Science and Arts Occupations
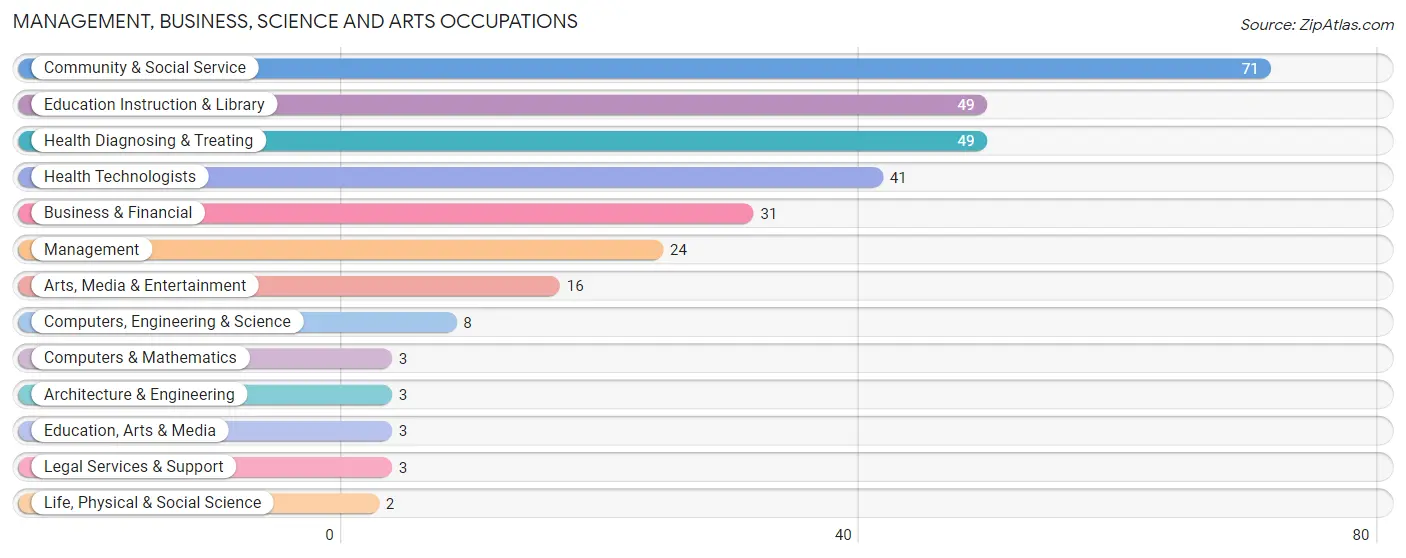
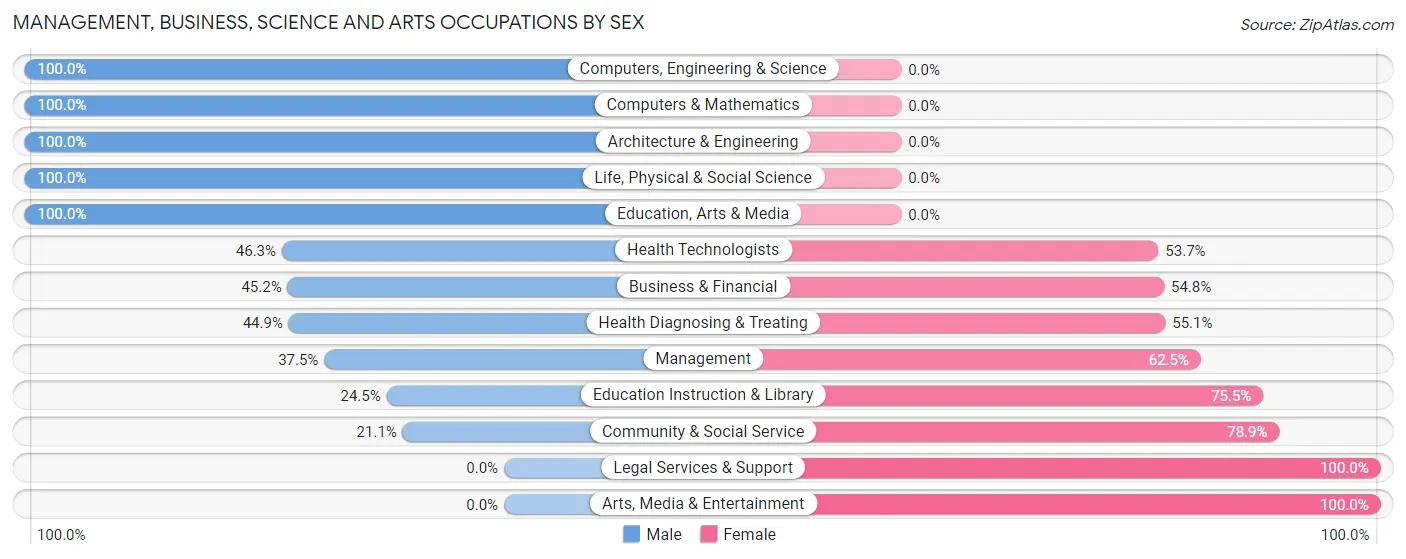
The most common Management, Business, Science and Arts occupations in Waterford borough are Community & Social Service (71 | 12.7%), Education Instruction & Library (49 | 8.7%), Health Diagnosing & Treating (49 | 8.7%), Health Technologists (41 | 7.3%), and Business & Financial (31 | 5.5%).
Management, Business, Science and Arts Occupations by Sex
Within the Management, Business, Science and Arts occupations in Waterford borough, the most male-oriented occupations are Computers, Engineering & Science (100.0%), Computers & Mathematics (100.0%), and Architecture & Engineering (100.0%), while the most female-oriented occupations are Legal Services & Support (100.0%), Arts, Media & Entertainment (100.0%), and Community & Social Service (78.9%).
| Occupation | Male | Female |
| Management | 9 (37.5%) | 15 (62.5%) |
| Business & Financial | 14 (45.2%) | 17 (54.8%) |
| Computers, Engineering & Science | 8 (100.0%) | 0 (0.0%) |
| Computers & Mathematics | 3 (100.0%) | 0 (0.0%) |
| Architecture & Engineering | 3 (100.0%) | 0 (0.0%) |
| Life, Physical & Social Science | 2 (100.0%) | 0 (0.0%) |
| Community & Social Service | 15 (21.1%) | 56 (78.9%) |
| Education, Arts & Media | 3 (100.0%) | 0 (0.0%) |
| Legal Services & Support | 0 (0.0%) | 3 (100.0%) |
| Education Instruction & Library | 12 (24.5%) | 37 (75.5%) |
| Arts, Media & Entertainment | 0 (0.0%) | 16 (100.0%) |
| Health Diagnosing & Treating | 22 (44.9%) | 27 (55.1%) |
| Health Technologists | 19 (46.3%) | 22 (53.7%) |
| Total (Category) | 68 (37.2%) | 115 (62.8%) |
| Total (Overall) | 297 (53.0%) | 263 (47.0%) |
Services Occupations
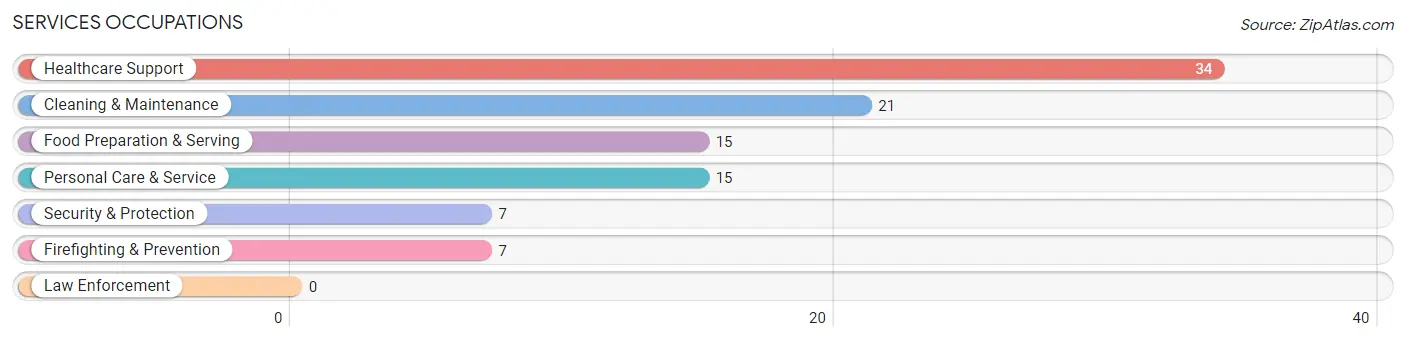
The most common Services occupations in Waterford borough are Healthcare Support (34 | 6.1%), Cleaning & Maintenance (21 | 3.7%), Food Preparation & Serving (15 | 2.7%), Personal Care & Service (15 | 2.7%), and Security & Protection (7 | 1.3%).
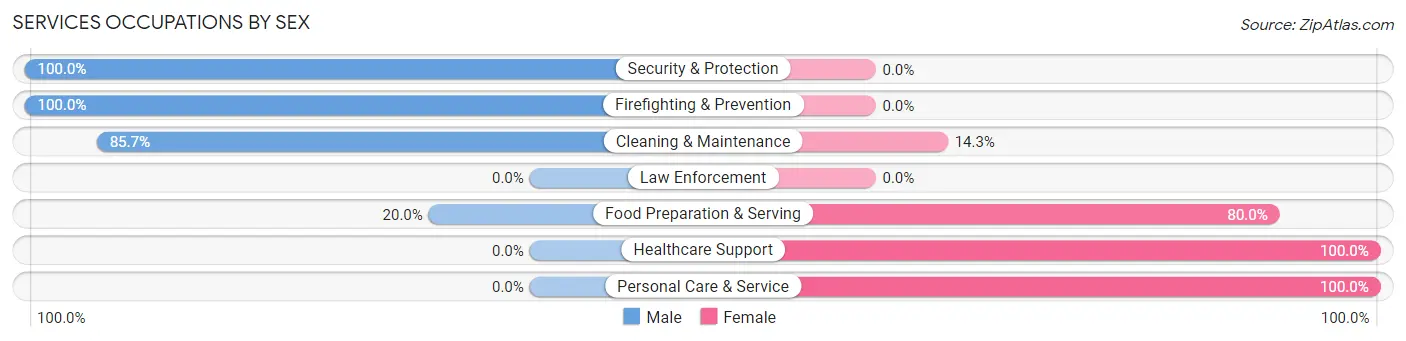
Services Occupations by Sex
Within the Services occupations in Waterford borough, the most male-oriented occupations are Security & Protection (100.0%), Firefighting & Prevention (100.0%), and Cleaning & Maintenance (85.7%), while the most female-oriented occupations are Healthcare Support (100.0%), Personal Care & Service (100.0%), and Food Preparation & Serving (80.0%).
| Occupation | Male | Female |
| Healthcare Support | 0 (0.0%) | 34 (100.0%) |
| Security & Protection | 7 (100.0%) | 0 (0.0%) |
| Firefighting & Prevention | 7 (100.0%) | 0 (0.0%) |
| Law Enforcement | 0 (0.0%) | 0 (0.0%) |
| Food Preparation & Serving | 3 (20.0%) | 12 (80.0%) |
| Cleaning & Maintenance | 18 (85.7%) | 3 (14.3%) |
| Personal Care & Service | 0 (0.0%) | 15 (100.0%) |
| Total (Category) | 28 (30.4%) | 64 (69.6%) |
| Total (Overall) | 297 (53.0%) | 263 (47.0%) |
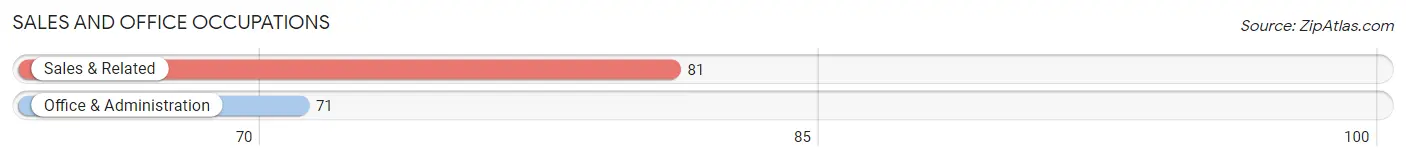
Sales and Office Occupations
The most common Sales and Office occupations in Waterford borough are Sales & Related (81 | 14.5%), and Office & Administration (71 | 12.7%).
Sales and Office Occupations by Sex
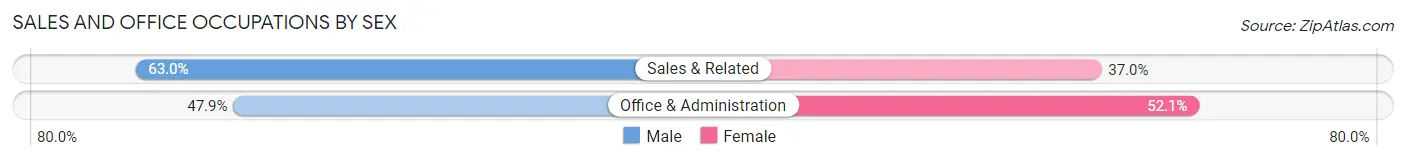
| Occupation | Male | Female |
| Sales & Related | 51 (63.0%) | 30 (37.0%) |
| Office & Administration | 34 (47.9%) | 37 (52.1%) |
| Total (Category) | 85 (55.9%) | 67 (44.1%) |
| Total (Overall) | 297 (53.0%) | 263 (47.0%) |
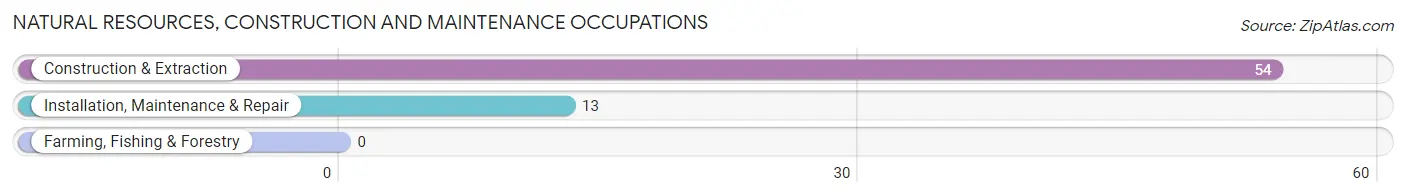
Natural Resources, Construction and Maintenance Occupations
The most common Natural Resources, Construction and Maintenance occupations in Waterford borough are Construction & Extraction (54 | 9.6%), and Installation, Maintenance & Repair (13 | 2.3%).
Natural Resources, Construction and Maintenance Occupations by Sex
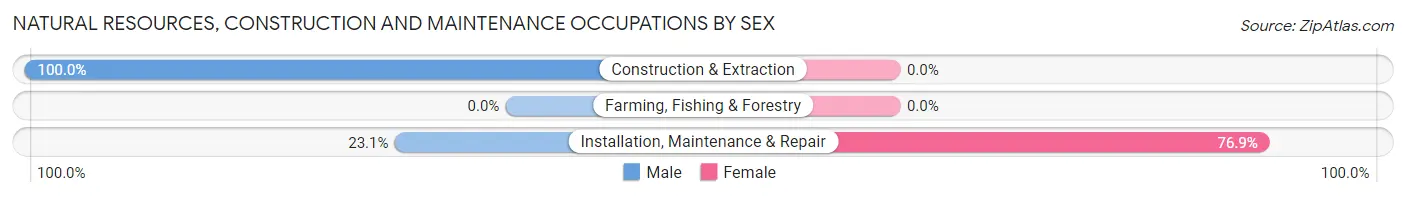
| Occupation | Male | Female |
| Farming, Fishing & Forestry | 0 (0.0%) | 0 (0.0%) |
| Construction & Extraction | 54 (100.0%) | 0 (0.0%) |
| Installation, Maintenance & Repair | 3 (23.1%) | 10 (76.9%) |
| Total (Category) | 57 (85.1%) | 10 (14.9%) |
| Total (Overall) | 297 (53.0%) | 263 (47.0%) |
Production, Transportation and Moving Occupations
The most common Production, Transportation and Moving occupations in Waterford borough are Transportation (25 | 4.5%), Material Moving (21 | 3.7%), and Production (20 | 3.6%).
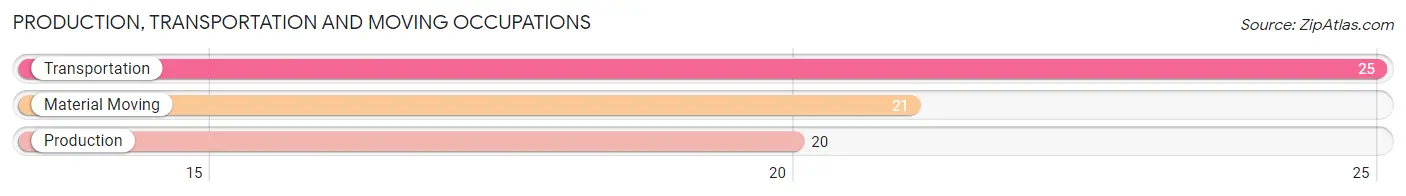
Production, Transportation and Moving Occupations by Sex
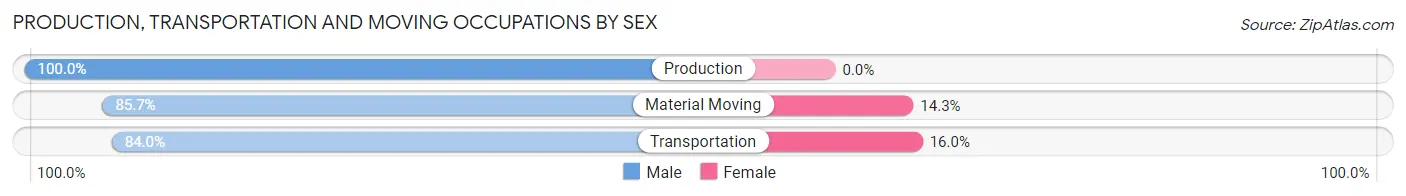
| Occupation | Male | Female |
| Production | 20 (100.0%) | 0 (0.0%) |
| Transportation | 21 (84.0%) | 4 (16.0%) |
| Material Moving | 18 (85.7%) | 3 (14.3%) |
| Total (Category) | 59 (89.4%) | 7 (10.6%) |
| Total (Overall) | 297 (53.0%) | 263 (47.0%) |
Employment Industries by Sex in Waterford borough
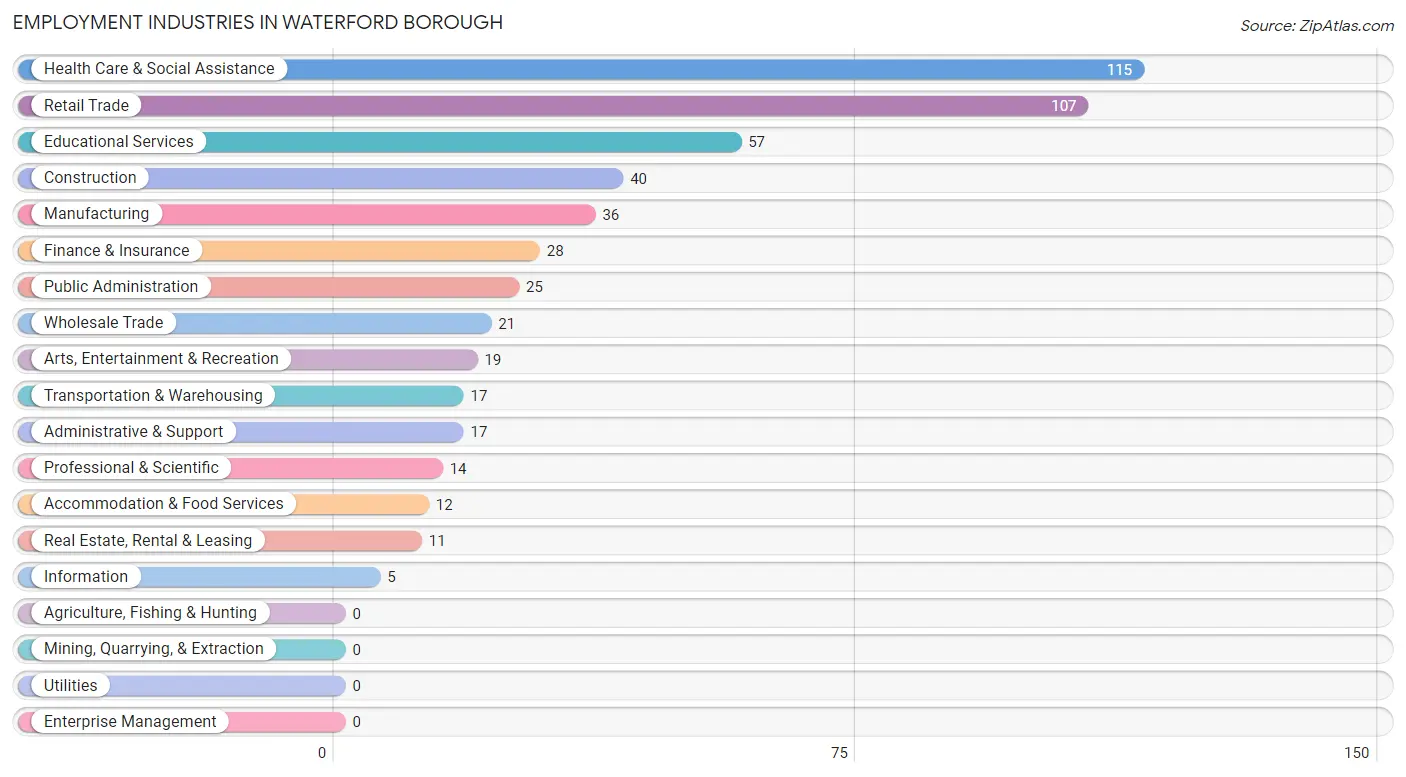
Employment Industries in Waterford borough
The major employment industries in Waterford borough include Health Care & Social Assistance (115 | 20.5%), Retail Trade (107 | 19.1%), Educational Services (57 | 10.2%), Construction (40 | 7.1%), and Manufacturing (36 | 6.4%).
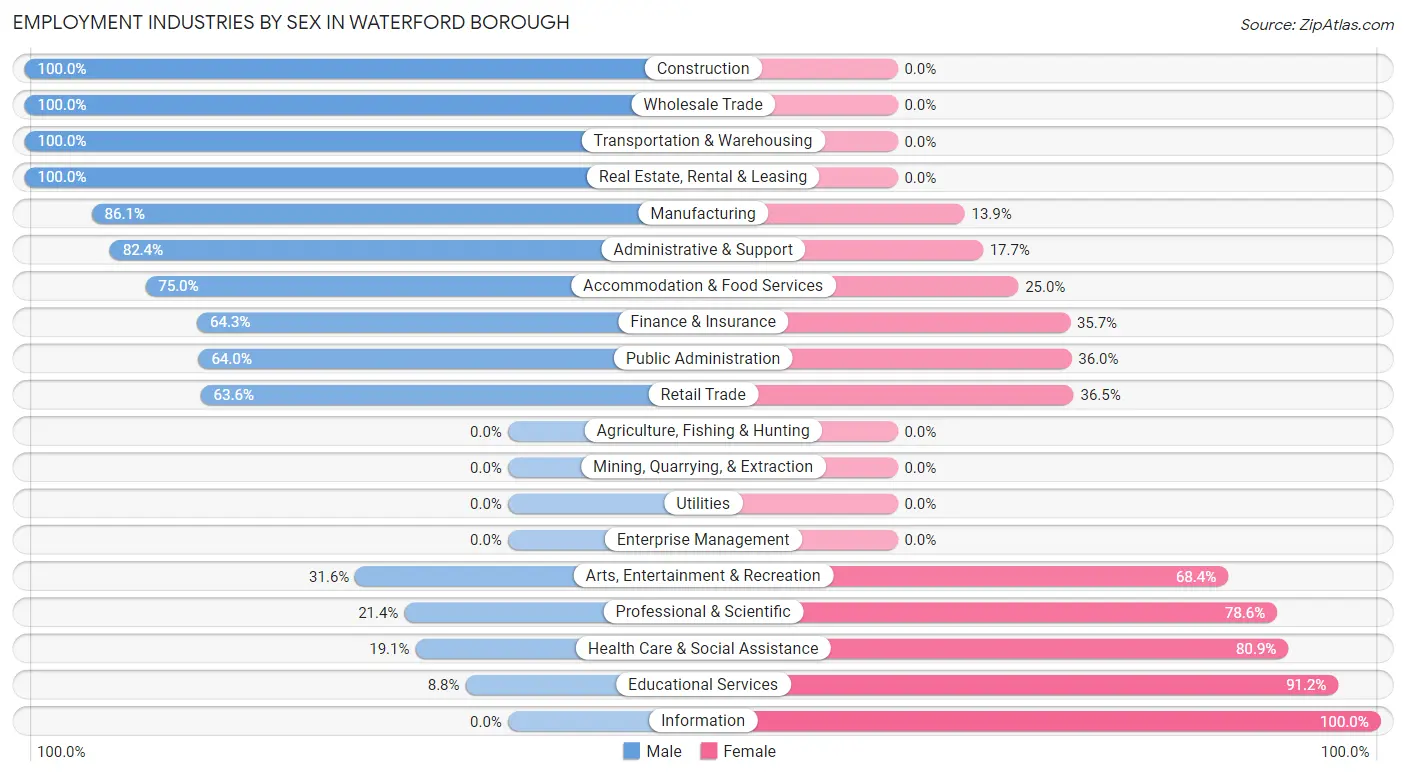
Employment Industries by Sex in Waterford borough
The Waterford borough industries that see more men than women are Construction (100.0%), Wholesale Trade (100.0%), and Transportation & Warehousing (100.0%), whereas the industries that tend to have a higher number of women are Information (100.0%), Educational Services (91.2%), and Health Care & Social Assistance (80.9%).
| Industry | Male | Female |
| Agriculture, Fishing & Hunting | 0 (0.0%) | 0 (0.0%) |
| Mining, Quarrying, & Extraction | 0 (0.0%) | 0 (0.0%) |
| Construction | 40 (100.0%) | 0 (0.0%) |
| Manufacturing | 31 (86.1%) | 5 (13.9%) |
| Wholesale Trade | 21 (100.0%) | 0 (0.0%) |
| Retail Trade | 68 (63.5%) | 39 (36.4%) |
| Transportation & Warehousing | 17 (100.0%) | 0 (0.0%) |
| Utilities | 0 (0.0%) | 0 (0.0%) |
| Information | 0 (0.0%) | 5 (100.0%) |
| Finance & Insurance | 18 (64.3%) | 10 (35.7%) |
| Real Estate, Rental & Leasing | 11 (100.0%) | 0 (0.0%) |
| Professional & Scientific | 3 (21.4%) | 11 (78.6%) |
| Enterprise Management | 0 (0.0%) | 0 (0.0%) |
| Administrative & Support | 14 (82.4%) | 3 (17.6%) |
| Educational Services | 5 (8.8%) | 52 (91.2%) |
| Health Care & Social Assistance | 22 (19.1%) | 93 (80.9%) |
| Arts, Entertainment & Recreation | 6 (31.6%) | 13 (68.4%) |
| Accommodation & Food Services | 9 (75.0%) | 3 (25.0%) |
| Public Administration | 16 (64.0%) | 9 (36.0%) |
| Total | 297 (53.0%) | 263 (47.0%) |
Education in Waterford borough
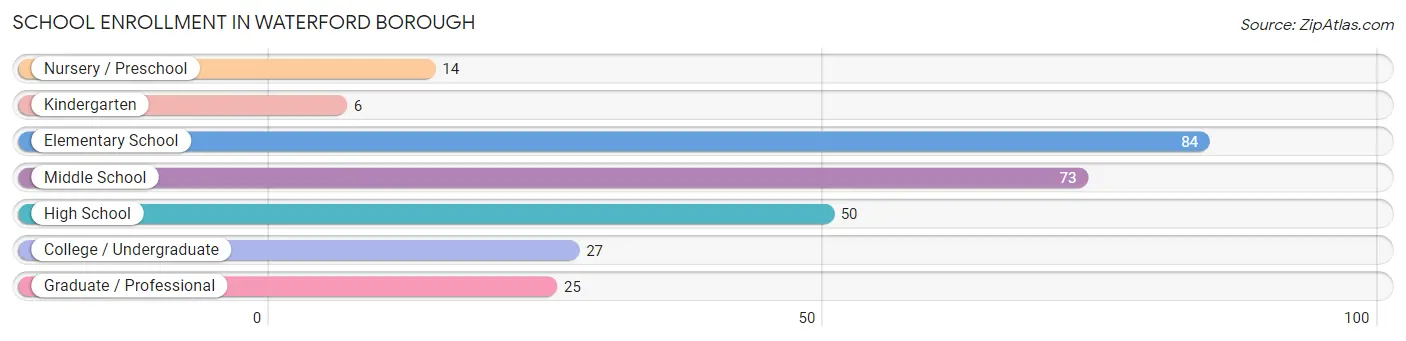
School Enrollment in Waterford borough
The most common levels of schooling among the 279 students in Waterford borough are elementary school (84 | 30.1%), middle school (73 | 26.2%), and high school (50 | 17.9%).
| School Level | # Students | % Students |
| Nursery / Preschool | 14 | 5.0% |
| Kindergarten | 6 | 2.1% |
| Elementary School | 84 | 30.1% |
| Middle School | 73 | 26.2% |
| High School | 50 | 17.9% |
| College / Undergraduate | 27 | 9.7% |
| Graduate / Professional | 25 | 9.0% |
| Total | 279 | 100.0% |
School Enrollment by Age by Funding Source in Waterford borough
Out of a total of 279 students who are enrolled in schools in Waterford borough, 35 (12.5%) attend a private institution, while the remaining 244 (87.5%) are enrolled in public schools. The age group of 3 to 4 year olds has the highest likelihood of being enrolled in private schools, with 14 (100.0% in the age bracket) enrolled. Conversely, the age group of 10 to 14 year olds has the lowest likelihood of being enrolled in a private school, with 88 (100.0% in the age bracket) attending a public institution.
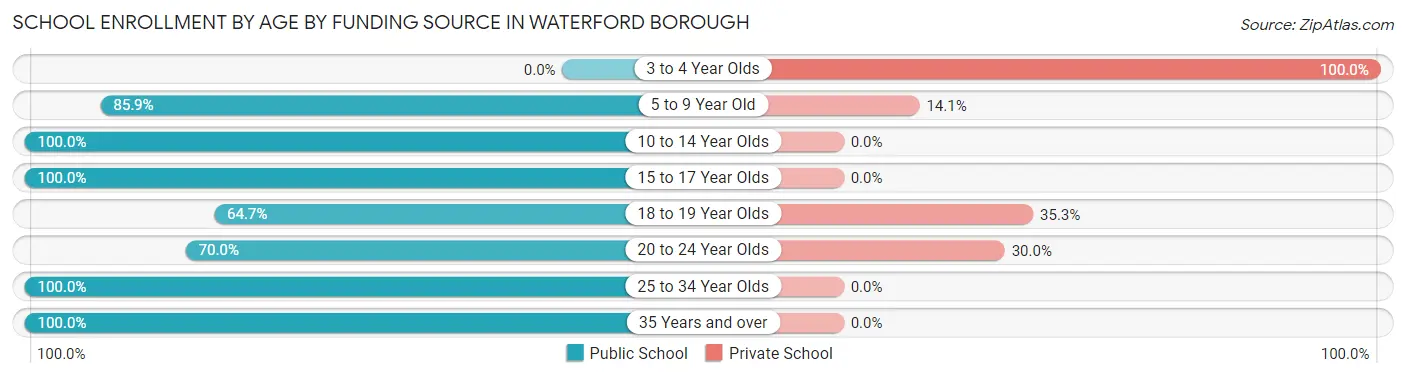
| Age Bracket | Public School | Private School |
| 3 to 4 Year Olds | 0 (0.0%) | 14 (100.0%) |
| 5 to 9 Year Old | 73 (85.9%) | 12 (14.1%) |
| 10 to 14 Year Olds | 88 (100.0%) | 0 (0.0%) |
| 15 to 17 Year Olds | 40 (100.0%) | 0 (0.0%) |
| 18 to 19 Year Olds | 11 (64.7%) | 6 (35.3%) |
| 20 to 24 Year Olds | 7 (70.0%) | 3 (30.0%) |
| 25 to 34 Year Olds | 8 (100.0%) | 0 (0.0%) |
| 35 Years and over | 17 (100.0%) | 0 (0.0%) |
| Total | 244 (87.5%) | 35 (12.5%) |
Educational Attainment by Field of Study in Waterford borough
Education (67 | 34.0%), business (26 | 13.2%), social sciences (19 | 9.6%), science & technology (18 | 9.1%), and psychology (16 | 8.1%) are the most common fields of study among 197 individuals in Waterford borough who have obtained a bachelor's degree or higher.
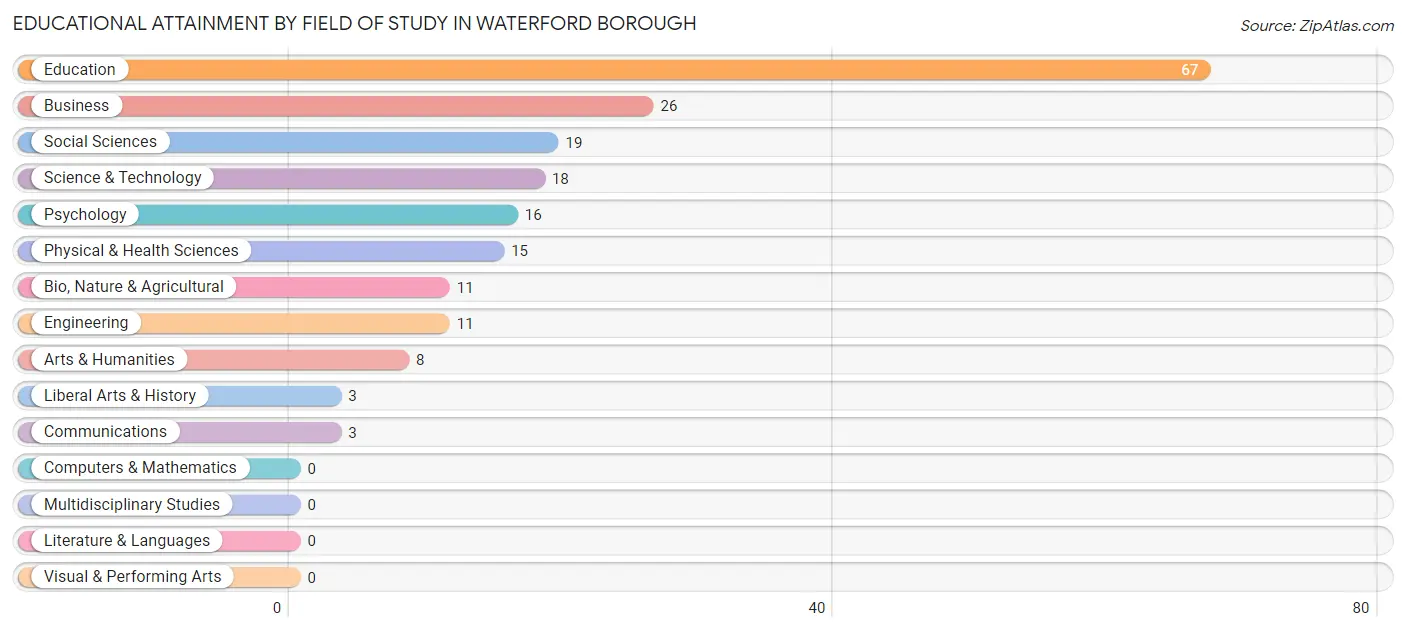
| Field of Study | # Graduates | % Graduates |
| Computers & Mathematics | 0 | 0.0% |
| Bio, Nature & Agricultural | 11 | 5.6% |
| Physical & Health Sciences | 15 | 7.6% |
| Psychology | 16 | 8.1% |
| Social Sciences | 19 | 9.6% |
| Engineering | 11 | 5.6% |
| Multidisciplinary Studies | 0 | 0.0% |
| Science & Technology | 18 | 9.1% |
| Business | 26 | 13.2% |
| Education | 67 | 34.0% |
| Literature & Languages | 0 | 0.0% |
| Liberal Arts & History | 3 | 1.5% |
| Visual & Performing Arts | 0 | 0.0% |
| Communications | 3 | 1.5% |
| Arts & Humanities | 8 | 4.1% |
| Total | 197 | 100.0% |
Transportation & Commute in Waterford borough
Vehicle Availability by Sex in Waterford borough
The most prevalent vehicle ownership categories in Waterford borough are males with 2 vehicles (143, accounting for 46.9%) and females with 2 vehicles (132, making up 55.0%).
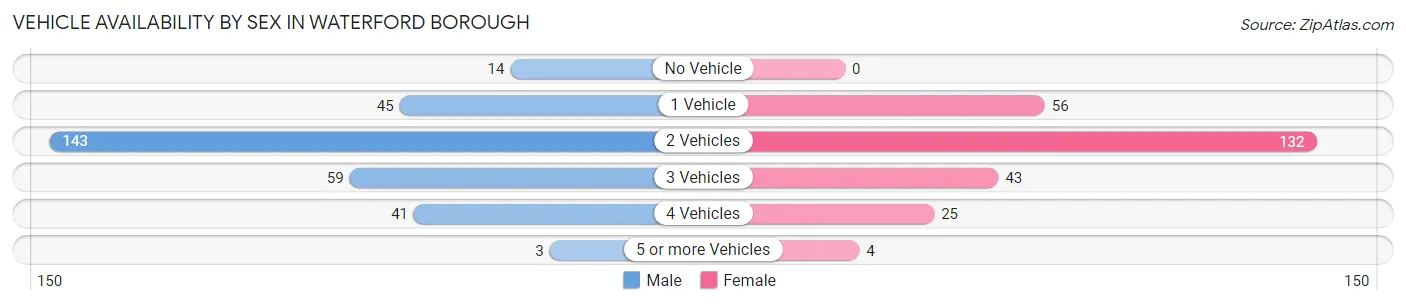
| Vehicles Available | Male | Female |
| No Vehicle | 14 (4.6%) | 0 (0.0%) |
| 1 Vehicle | 45 (14.7%) | 56 (21.5%) |
| 2 Vehicles | 143 (46.9%) | 132 (50.8%) |
| 3 Vehicles | 59 (19.3%) | 43 (16.5%) |
| 4 Vehicles | 41 (13.4%) | 25 (9.6%) |
| 5 or more Vehicles | 3 (1.0%) | 4 (1.5%) |
| Total | 305 (100.0%) | 260 (100.0%) |
Commute Time in Waterford borough
The most frequently occuring commute durations in Waterford borough are 30 to 34 minutes (138 commuters, 26.3%), 5 to 9 minutes (84 commuters, 16.0%), and 20 to 24 minutes (57 commuters, 10.9%).
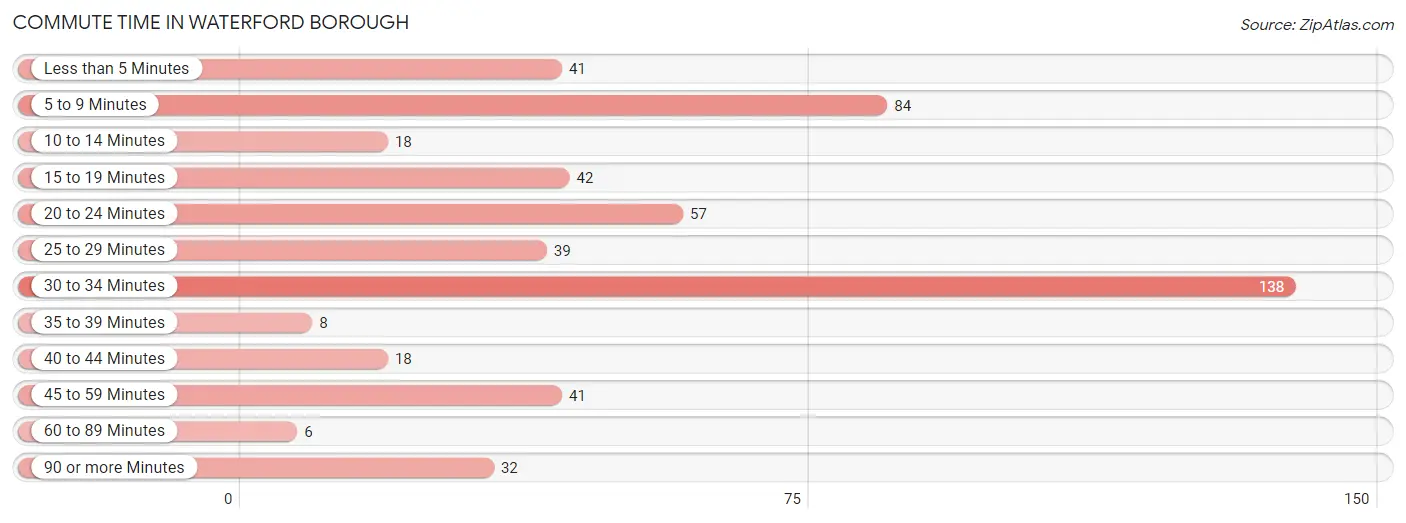
| Commute Time | # Commuters | % Commuters |
| Less than 5 Minutes | 41 | 7.8% |
| 5 to 9 Minutes | 84 | 16.0% |
| 10 to 14 Minutes | 18 | 3.4% |
| 15 to 19 Minutes | 42 | 8.0% |
| 20 to 24 Minutes | 57 | 10.9% |
| 25 to 29 Minutes | 39 | 7.4% |
| 30 to 34 Minutes | 138 | 26.3% |
| 35 to 39 Minutes | 8 | 1.5% |
| 40 to 44 Minutes | 18 | 3.4% |
| 45 to 59 Minutes | 41 | 7.8% |
| 60 to 89 Minutes | 6 | 1.1% |
| 90 or more Minutes | 32 | 6.1% |
Commute Time by Sex in Waterford borough
The most common commute times in Waterford borough are 30 to 34 minutes (78 commuters, 28.5%) for males and 30 to 34 minutes (60 commuters, 24.0%) for females.
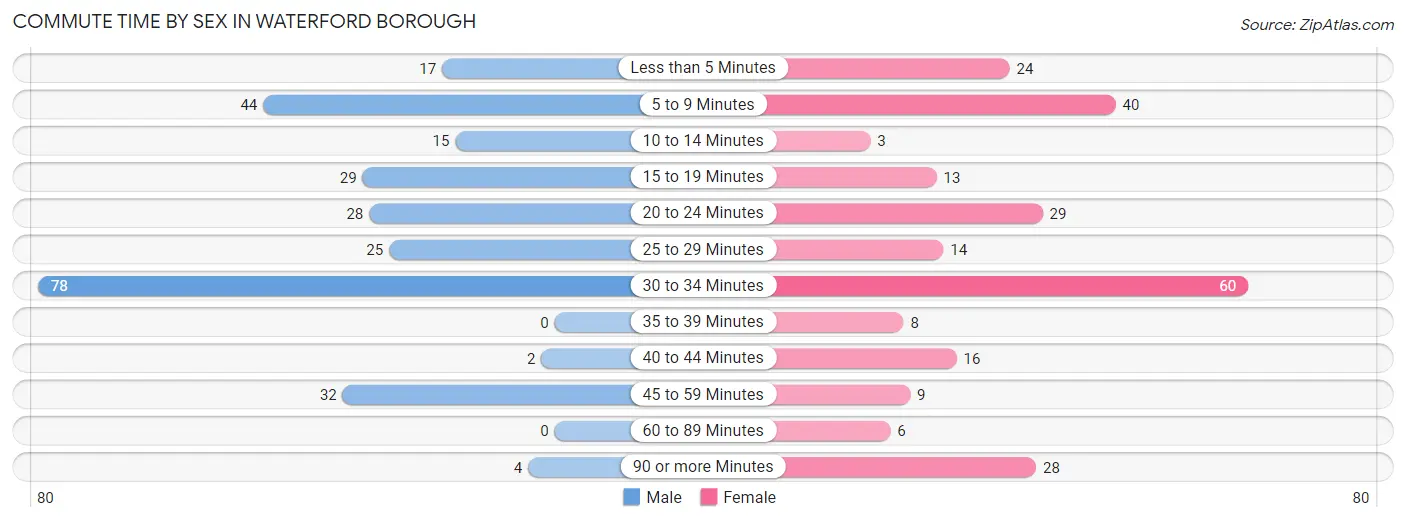
| Commute Time | Male | Female |
| Less than 5 Minutes | 17 (6.2%) | 24 (9.6%) |
| 5 to 9 Minutes | 44 (16.1%) | 40 (16.0%) |
| 10 to 14 Minutes | 15 (5.5%) | 3 (1.2%) |
| 15 to 19 Minutes | 29 (10.6%) | 13 (5.2%) |
| 20 to 24 Minutes | 28 (10.2%) | 29 (11.6%) |
| 25 to 29 Minutes | 25 (9.1%) | 14 (5.6%) |
| 30 to 34 Minutes | 78 (28.5%) | 60 (24.0%) |
| 35 to 39 Minutes | 0 (0.0%) | 8 (3.2%) |
| 40 to 44 Minutes | 2 (0.7%) | 16 (6.4%) |
| 45 to 59 Minutes | 32 (11.7%) | 9 (3.6%) |
| 60 to 89 Minutes | 0 (0.0%) | 6 (2.4%) |
| 90 or more Minutes | 4 (1.5%) | 28 (11.2%) |
Time of Departure to Work by Sex in Waterford borough
The most frequent times of departure to work in Waterford borough are 6:00 AM to 6:29 AM (49, 17.9%) for males and 7:00 AM to 7:29 AM (63, 25.2%) for females.
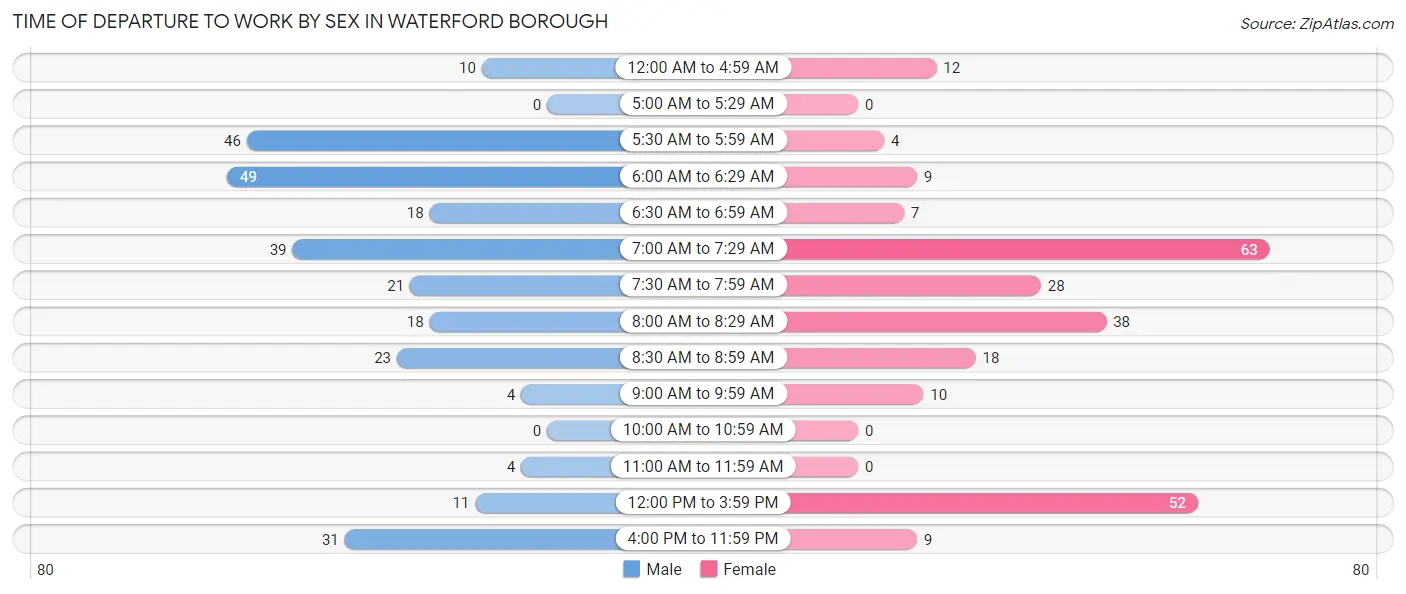
| Time of Departure | Male | Female |
| 12:00 AM to 4:59 AM | 10 (3.6%) | 12 (4.8%) |
| 5:00 AM to 5:29 AM | 0 (0.0%) | 0 (0.0%) |
| 5:30 AM to 5:59 AM | 46 (16.8%) | 4 (1.6%) |
| 6:00 AM to 6:29 AM | 49 (17.9%) | 9 (3.6%) |
| 6:30 AM to 6:59 AM | 18 (6.6%) | 7 (2.8%) |
| 7:00 AM to 7:29 AM | 39 (14.2%) | 63 (25.2%) |
| 7:30 AM to 7:59 AM | 21 (7.7%) | 28 (11.2%) |
| 8:00 AM to 8:29 AM | 18 (6.6%) | 38 (15.2%) |
| 8:30 AM to 8:59 AM | 23 (8.4%) | 18 (7.2%) |
| 9:00 AM to 9:59 AM | 4 (1.5%) | 10 (4.0%) |
| 10:00 AM to 10:59 AM | 0 (0.0%) | 0 (0.0%) |
| 11:00 AM to 11:59 AM | 4 (1.5%) | 0 (0.0%) |
| 12:00 PM to 3:59 PM | 11 (4.0%) | 52 (20.8%) |
| 4:00 PM to 11:59 PM | 31 (11.3%) | 9 (3.6%) |
| Total | 274 (100.0%) | 250 (100.0%) |
Housing Occupancy in Waterford borough
Occupancy by Ownership in Waterford borough
Of the total 565 dwellings in Waterford borough, owner-occupied units account for 275 (48.7%), while renter-occupied units make up 290 (51.3%).
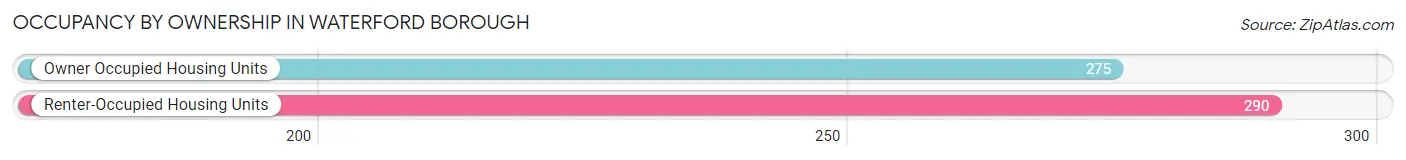
| Occupancy | # Housing Units | % Housing Units |
| Owner Occupied Housing Units | 275 | 48.7% |
| Renter-Occupied Housing Units | 290 | 51.3% |
| Total Occupied Housing Units | 565 | 100.0% |
Occupancy by Household Size in Waterford borough
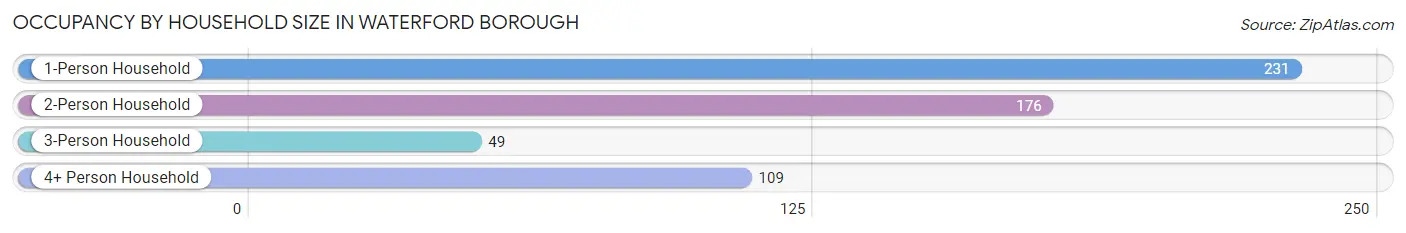
| Household Size | # Housing Units | % Housing Units |
| 1-Person Household | 231 | 40.9% |
| 2-Person Household | 176 | 31.1% |
| 3-Person Household | 49 | 8.7% |
| 4+ Person Household | 109 | 19.3% |
| Total Housing Units | 565 | 100.0% |
Occupancy by Ownership by Household Size in Waterford borough
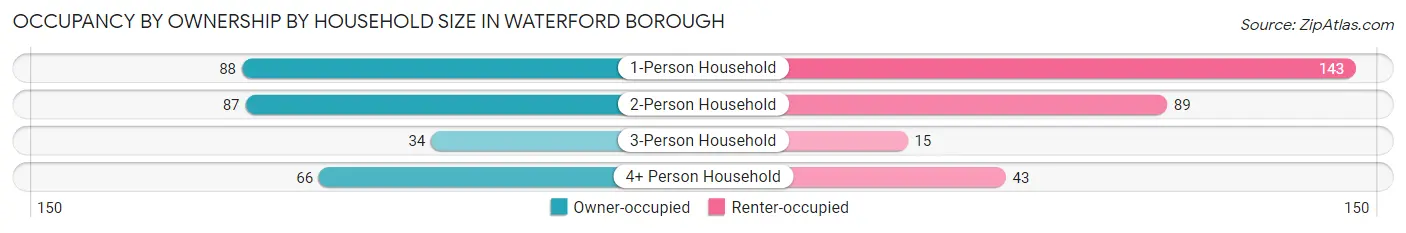
| Household Size | Owner-occupied | Renter-occupied |
| 1-Person Household | 88 (38.1%) | 143 (61.9%) |
| 2-Person Household | 87 (49.4%) | 89 (50.6%) |
| 3-Person Household | 34 (69.4%) | 15 (30.6%) |
| 4+ Person Household | 66 (60.6%) | 43 (39.5%) |
| Total Housing Units | 275 (48.7%) | 290 (51.3%) |
Occupancy by Educational Attainment in Waterford borough
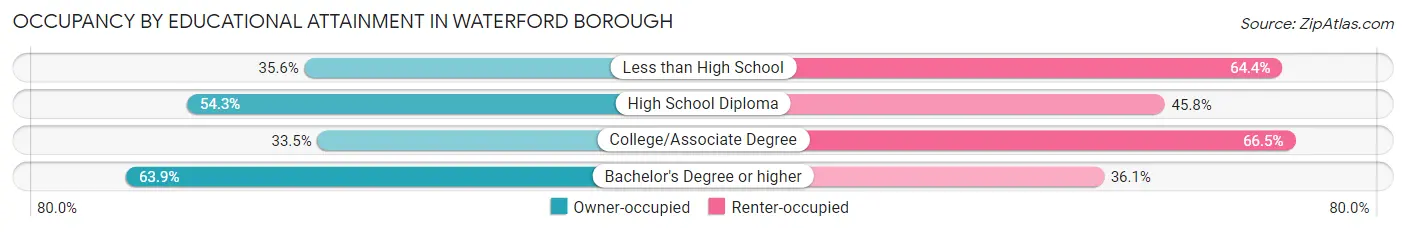
| Household Size | Owner-occupied | Renter-occupied |
| Less than High School | 21 (35.6%) | 38 (64.4%) |
| High School Diploma | 115 (54.2%) | 97 (45.8%) |
| College/Associate Degree | 54 (33.5%) | 107 (66.5%) |
| Bachelor's Degree or higher | 85 (63.9%) | 48 (36.1%) |
Occupancy by Age of Householder in Waterford borough
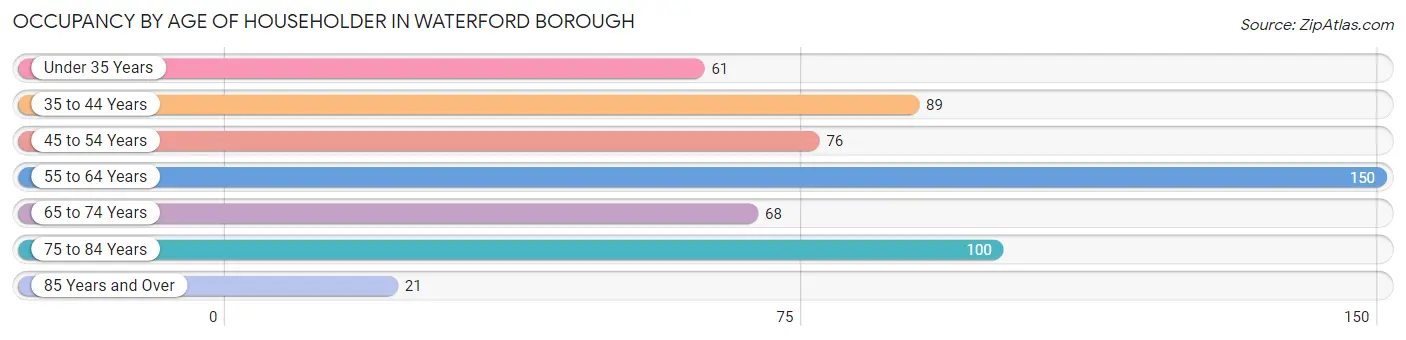
| Age Bracket | # Households | % Households |
| Under 35 Years | 61 | 10.8% |
| 35 to 44 Years | 89 | 15.8% |
| 45 to 54 Years | 76 | 13.5% |
| 55 to 64 Years | 150 | 26.6% |
| 65 to 74 Years | 68 | 12.0% |
| 75 to 84 Years | 100 | 17.7% |
| 85 Years and Over | 21 | 3.7% |
| Total | 565 | 100.0% |
Housing Finances in Waterford borough
Median Income by Occupancy in Waterford borough
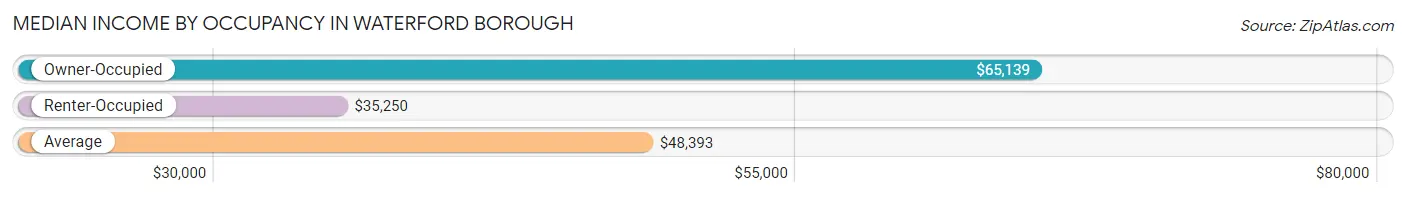
| Occupancy Type | # Households | Median Income |
| Owner-Occupied | 275 (48.7%) | $65,139 |
| Renter-Occupied | 290 (51.3%) | $35,250 |
| Average | 565 (100.0%) | $48,393 |
Occupancy by Householder Income Bracket in Waterford borough
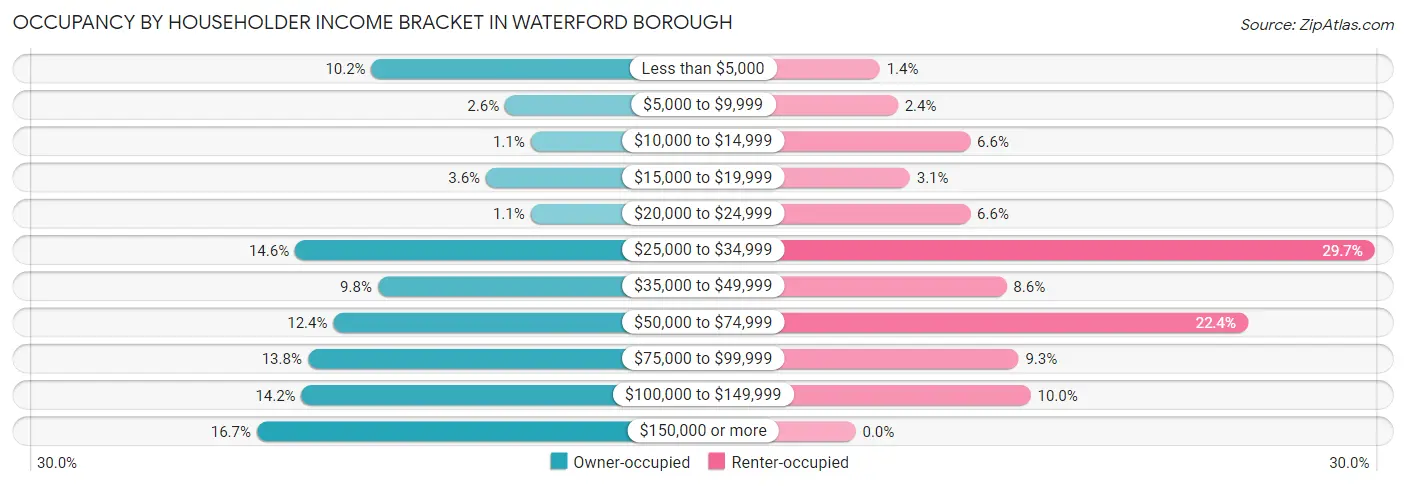
| Income Bracket | Owner-occupied | Renter-occupied |
| Less than $5,000 | 28 (10.2%) | 4 (1.4%) |
| $5,000 to $9,999 | 7 (2.5%) | 7 (2.4%) |
| $10,000 to $14,999 | 3 (1.1%) | 19 (6.6%) |
| $15,000 to $19,999 | 10 (3.6%) | 9 (3.1%) |
| $20,000 to $24,999 | 3 (1.1%) | 19 (6.6%) |
| $25,000 to $34,999 | 40 (14.5%) | 86 (29.7%) |
| $35,000 to $49,999 | 27 (9.8%) | 25 (8.6%) |
| $50,000 to $74,999 | 34 (12.4%) | 65 (22.4%) |
| $75,000 to $99,999 | 38 (13.8%) | 27 (9.3%) |
| $100,000 to $149,999 | 39 (14.2%) | 29 (10.0%) |
| $150,000 or more | 46 (16.7%) | 0 (0.0%) |
| Total | 275 (100.0%) | 290 (100.0%) |
Monthly Housing Cost Tiers in Waterford borough
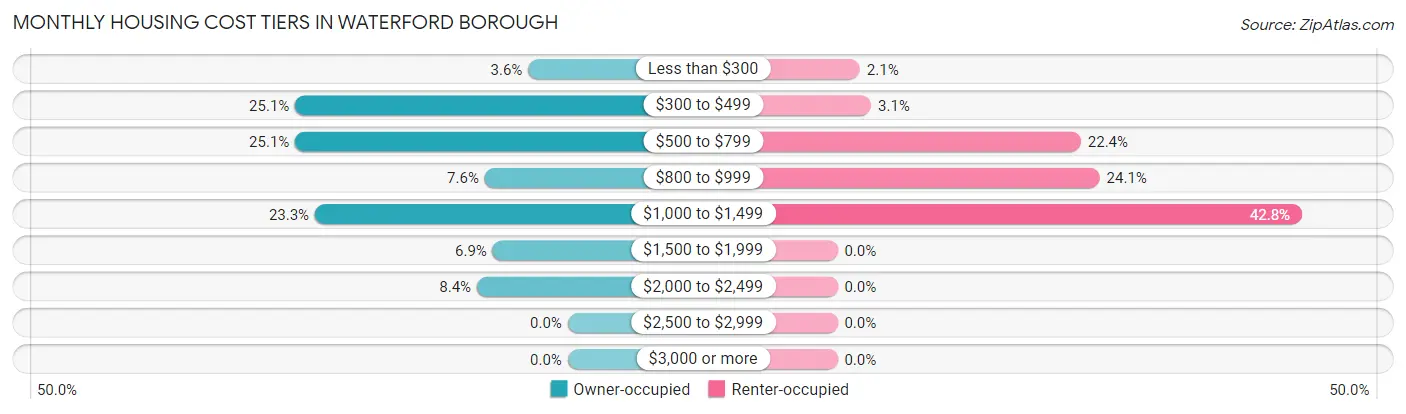
| Monthly Cost | Owner-occupied | Renter-occupied |
| Less than $300 | 10 (3.6%) | 6 (2.1%) |
| $300 to $499 | 69 (25.1%) | 9 (3.1%) |
| $500 to $799 | 69 (25.1%) | 65 (22.4%) |
| $800 to $999 | 21 (7.6%) | 70 (24.1%) |
| $1,000 to $1,499 | 64 (23.3%) | 124 (42.8%) |
| $1,500 to $1,999 | 19 (6.9%) | 0 (0.0%) |
| $2,000 to $2,499 | 23 (8.4%) | 0 (0.0%) |
| $2,500 to $2,999 | 0 (0.0%) | 0 (0.0%) |
| $3,000 or more | 0 (0.0%) | 0 (0.0%) |
| Total | 275 (100.0%) | 290 (100.0%) |
Physical Housing Characteristics in Waterford borough
Housing Structures in Waterford borough
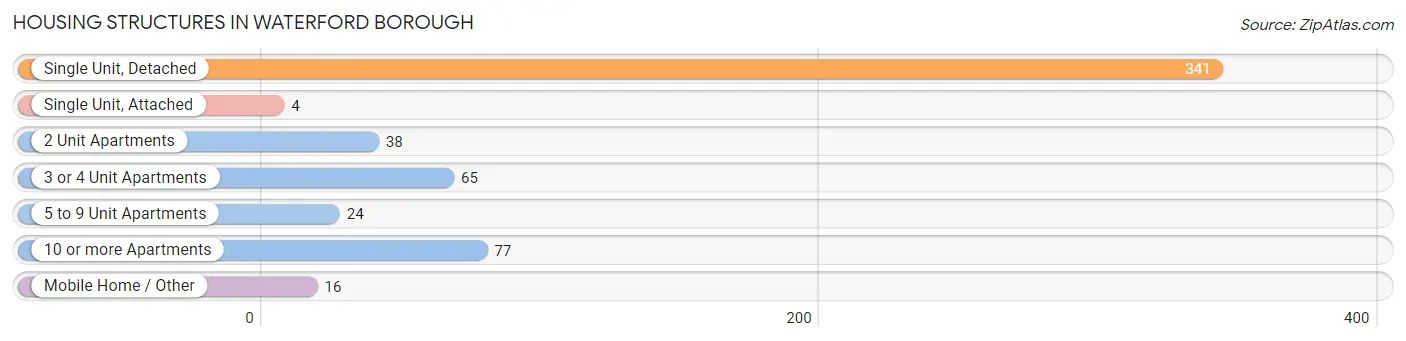
| Structure Type | # Housing Units | % Housing Units |
| Single Unit, Detached | 341 | 60.4% |
| Single Unit, Attached | 4 | 0.7% |
| 2 Unit Apartments | 38 | 6.7% |
| 3 or 4 Unit Apartments | 65 | 11.5% |
| 5 to 9 Unit Apartments | 24 | 4.3% |
| 10 or more Apartments | 77 | 13.6% |
| Mobile Home / Other | 16 | 2.8% |
| Total | 565 | 100.0% |
Housing Structures by Occupancy in Waterford borough
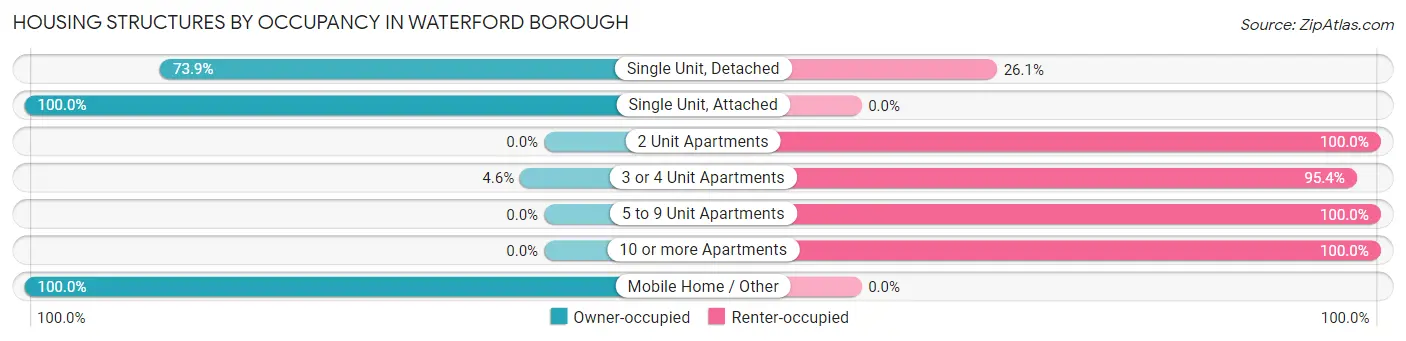
| Structure Type | Owner-occupied | Renter-occupied |
| Single Unit, Detached | 252 (73.9%) | 89 (26.1%) |
| Single Unit, Attached | 4 (100.0%) | 0 (0.0%) |
| 2 Unit Apartments | 0 (0.0%) | 38 (100.0%) |
| 3 or 4 Unit Apartments | 3 (4.6%) | 62 (95.4%) |
| 5 to 9 Unit Apartments | 0 (0.0%) | 24 (100.0%) |
| 10 or more Apartments | 0 (0.0%) | 77 (100.0%) |
| Mobile Home / Other | 16 (100.0%) | 0 (0.0%) |
| Total | 275 (48.7%) | 290 (51.3%) |
Housing Structures by Number of Rooms in Waterford borough
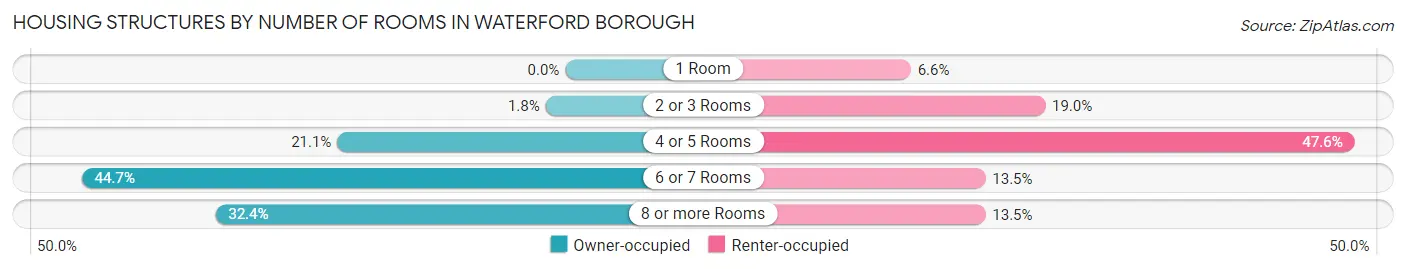
| Number of Rooms | Owner-occupied | Renter-occupied |
| 1 Room | 0 (0.0%) | 19 (6.6%) |
| 2 or 3 Rooms | 5 (1.8%) | 55 (19.0%) |
| 4 or 5 Rooms | 58 (21.1%) | 138 (47.6%) |
| 6 or 7 Rooms | 123 (44.7%) | 39 (13.5%) |
| 8 or more Rooms | 89 (32.4%) | 39 (13.5%) |
| Total | 275 (100.0%) | 290 (100.0%) |
Housing Structure by Heating Type in Waterford borough
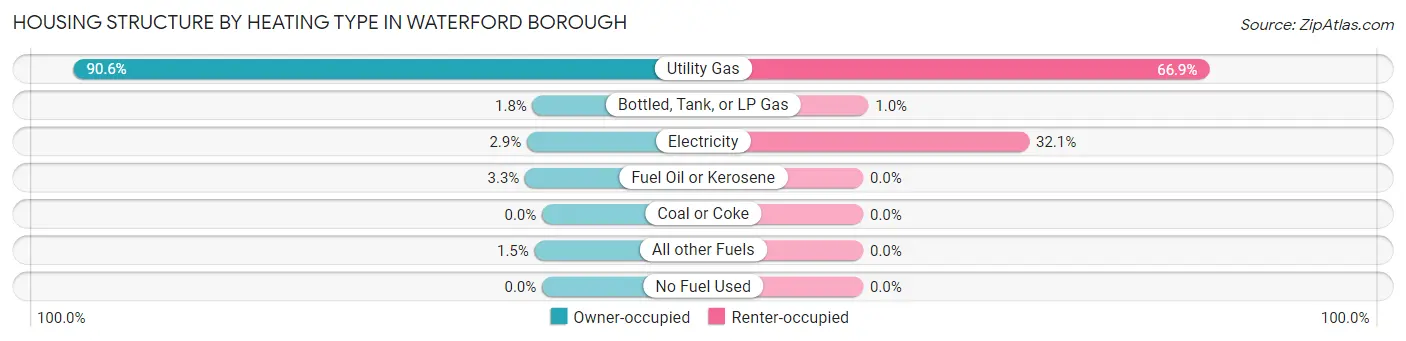
| Heating Type | Owner-occupied | Renter-occupied |
| Utility Gas | 249 (90.5%) | 194 (66.9%) |
| Bottled, Tank, or LP Gas | 5 (1.8%) | 3 (1.0%) |
| Electricity | 8 (2.9%) | 93 (32.1%) |
| Fuel Oil or Kerosene | 9 (3.3%) | 0 (0.0%) |
| Coal or Coke | 0 (0.0%) | 0 (0.0%) |
| All other Fuels | 4 (1.5%) | 0 (0.0%) |
| No Fuel Used | 0 (0.0%) | 0 (0.0%) |
| Total | 275 (100.0%) | 290 (100.0%) |
Household Vehicle Usage in Waterford borough
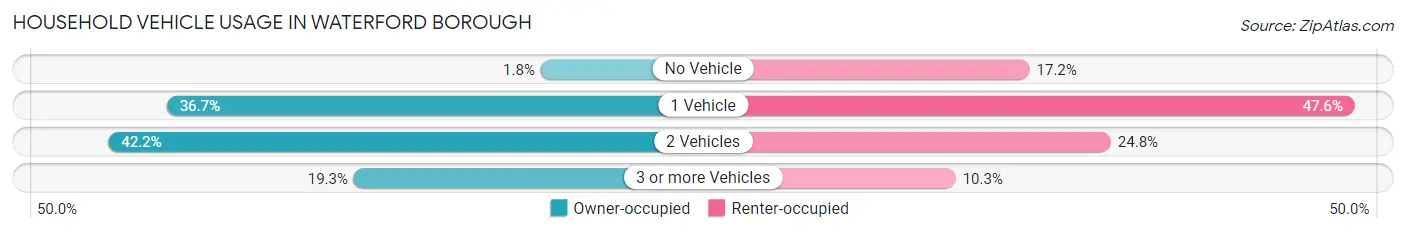
| Vehicles per Household | Owner-occupied | Renter-occupied |
| No Vehicle | 5 (1.8%) | 50 (17.2%) |
| 1 Vehicle | 101 (36.7%) | 138 (47.6%) |
| 2 Vehicles | 116 (42.2%) | 72 (24.8%) |
| 3 or more Vehicles | 53 (19.3%) | 30 (10.3%) |
| Total | 275 (100.0%) | 290 (100.0%) |
Real Estate & Mortgages in Waterford borough
Real Estate and Mortgage Overview in Waterford borough
| Characteristic | Without Mortgage | With Mortgage |
| Housing Units | 136 | 139 |
| Median Property Value | $142,200 | $157,100 |
| Median Household Income | $46,250 | $21 |
| Monthly Housing Costs | $475 | $0 |
| Real Estate Taxes | $1,898 | $0 |
Property Value by Mortgage Status in Waterford borough
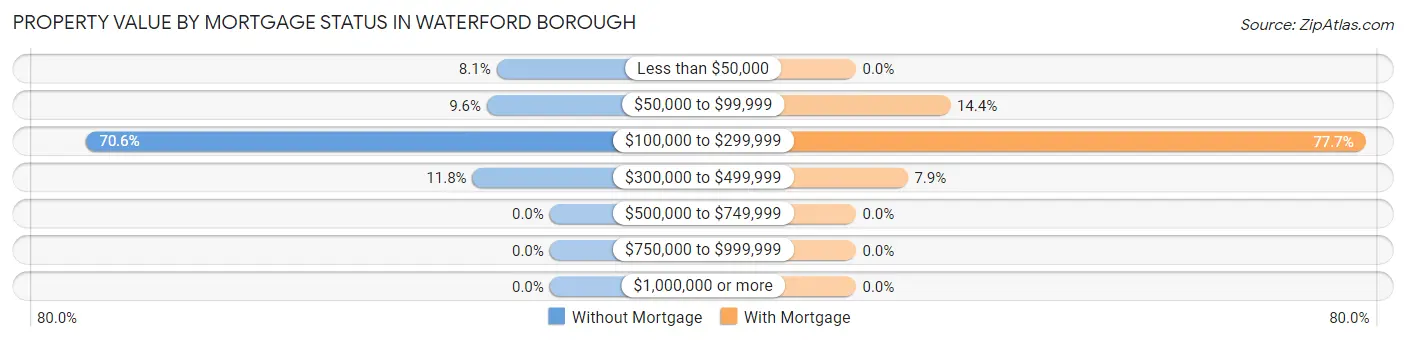
| Property Value | Without Mortgage | With Mortgage |
| Less than $50,000 | 11 (8.1%) | 0 (0.0%) |
| $50,000 to $99,999 | 13 (9.6%) | 20 (14.4%) |
| $100,000 to $299,999 | 96 (70.6%) | 108 (77.7%) |
| $300,000 to $499,999 | 16 (11.8%) | 11 (7.9%) |
| $500,000 to $749,999 | 0 (0.0%) | 0 (0.0%) |
| $750,000 to $999,999 | 0 (0.0%) | 0 (0.0%) |
| $1,000,000 or more | 0 (0.0%) | 0 (0.0%) |
| Total | 136 (100.0%) | 139 (100.0%) |
Household Income by Mortgage Status in Waterford borough
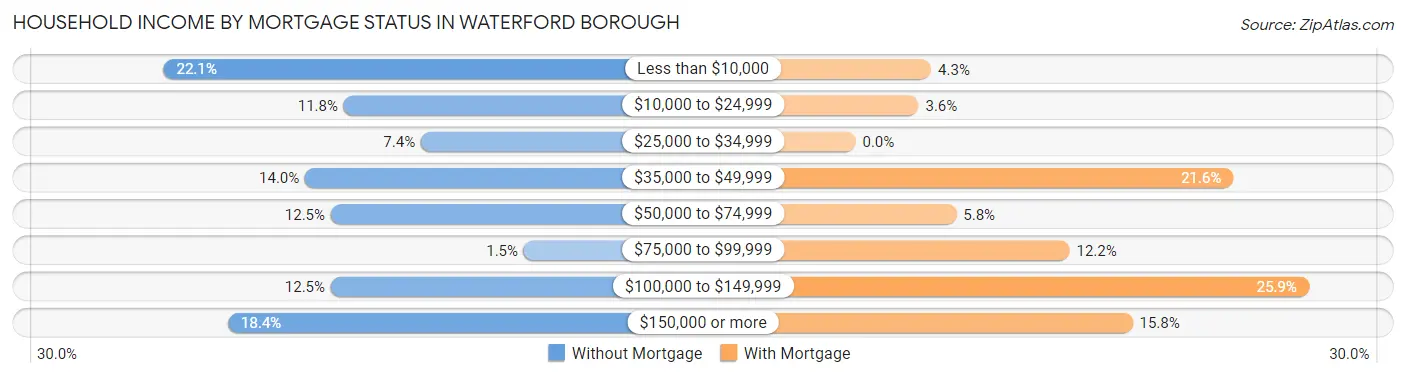
| Household Income | Without Mortgage | With Mortgage |
| Less than $10,000 | 30 (22.1%) | 6 (4.3%) |
| $10,000 to $24,999 | 16 (11.8%) | 5 (3.6%) |
| $25,000 to $34,999 | 10 (7.3%) | 0 (0.0%) |
| $35,000 to $49,999 | 19 (14.0%) | 30 (21.6%) |
| $50,000 to $74,999 | 17 (12.5%) | 8 (5.8%) |
| $75,000 to $99,999 | 2 (1.5%) | 17 (12.2%) |
| $100,000 to $149,999 | 17 (12.5%) | 36 (25.9%) |
| $150,000 or more | 25 (18.4%) | 22 (15.8%) |
| Total | 136 (100.0%) | 139 (100.0%) |
Property Value to Household Income Ratio in Waterford borough
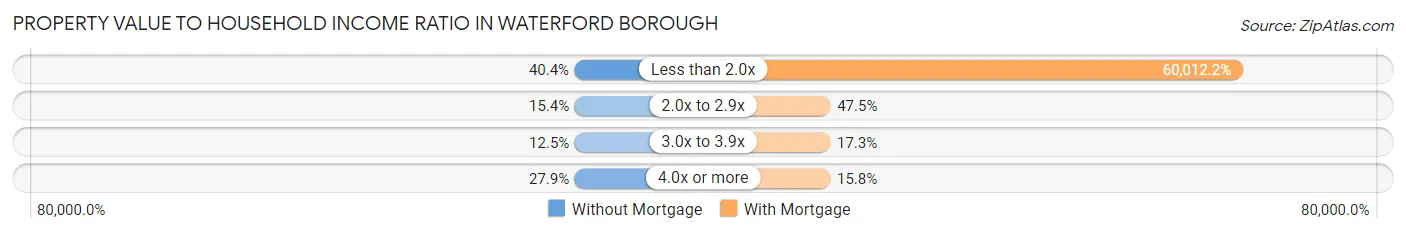
| Value-to-Income Ratio | Without Mortgage | With Mortgage |
| Less than 2.0x | 55 (40.4%) | 83,417 (60,012.2%) |
| 2.0x to 2.9x | 21 (15.4%) | 66 (47.5%) |
| 3.0x to 3.9x | 17 (12.5%) | 24 (17.3%) |
| 4.0x or more | 38 (27.9%) | 22 (15.8%) |
| Total | 136 (100.0%) | 139 (100.0%) |
Real Estate Taxes by Mortgage Status in Waterford borough
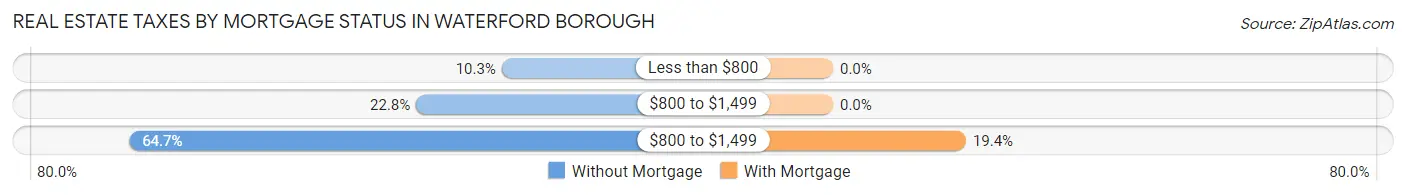
| Property Taxes | Without Mortgage | With Mortgage |
| Less than $800 | 14 (10.3%) | 0 (0.0%) |
| $800 to $1,499 | 31 (22.8%) | 0 (0.0%) |
| $800 to $1,499 | 88 (64.7%) | 27 (19.4%) |
| Total | 136 (100.0%) | 139 (100.0%) |
Health & Disability in Waterford borough
Health Insurance Coverage by Age in Waterford borough
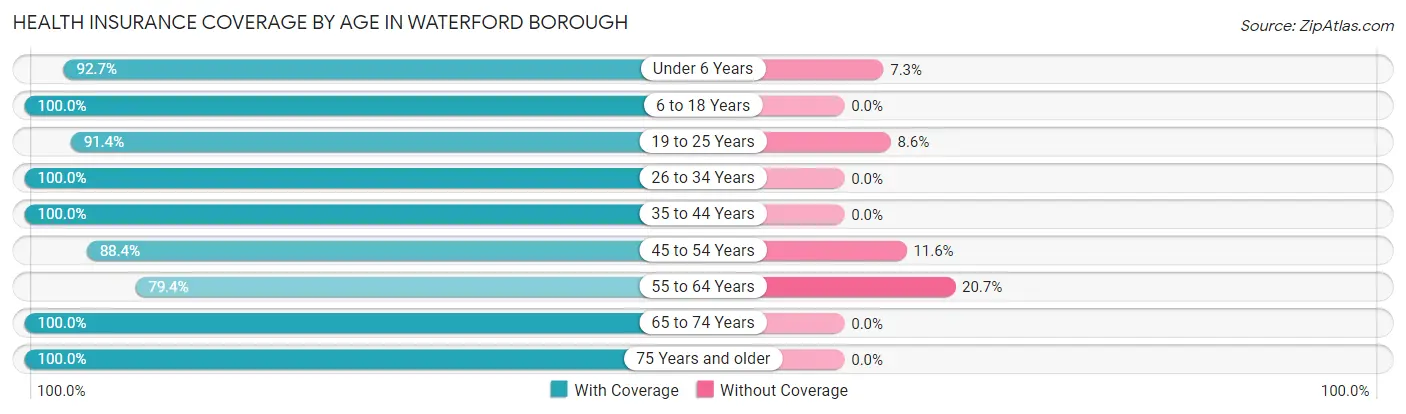
| Age Bracket | With Coverage | Without Coverage |
| Under 6 Years | 51 (92.7%) | 4 (7.3%) |
| 6 to 18 Years | 239 (100.0%) | 0 (0.0%) |
| 19 to 25 Years | 53 (91.4%) | 5 (8.6%) |
| 26 to 34 Years | 102 (100.0%) | 0 (0.0%) |
| 35 to 44 Years | 131 (100.0%) | 0 (0.0%) |
| 45 to 54 Years | 122 (88.4%) | 16 (11.6%) |
| 55 to 64 Years | 219 (79.3%) | 57 (20.6%) |
| 65 to 74 Years | 99 (100.0%) | 0 (0.0%) |
| 75 Years and older | 138 (100.0%) | 0 (0.0%) |
| Total | 1,154 (93.4%) | 82 (6.6%) |
Health Insurance Coverage by Citizenship Status in Waterford borough
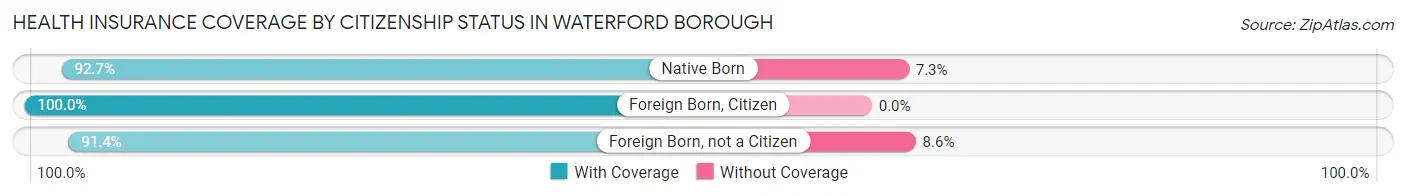
| Citizenship Status | With Coverage | Without Coverage |
| Native Born | 51 (92.7%) | 4 (7.3%) |
| Foreign Born, Citizen | 239 (100.0%) | 0 (0.0%) |
| Foreign Born, not a Citizen | 53 (91.4%) | 5 (8.6%) |
Health Insurance Coverage by Household Income in Waterford borough
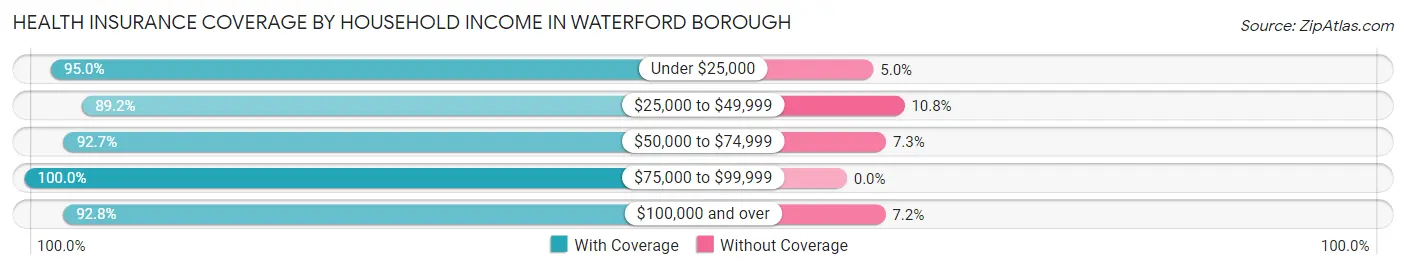
| Household Income | With Coverage | Without Coverage |
| Under $25,000 | 153 (95.0%) | 8 (5.0%) |
| $25,000 to $49,999 | 256 (89.2%) | 31 (10.8%) |
| $50,000 to $74,999 | 202 (92.7%) | 16 (7.3%) |
| $75,000 to $99,999 | 197 (100.0%) | 0 (0.0%) |
| $100,000 and over | 346 (92.8%) | 27 (7.2%) |
Public vs Private Health Insurance Coverage by Age in Waterford borough
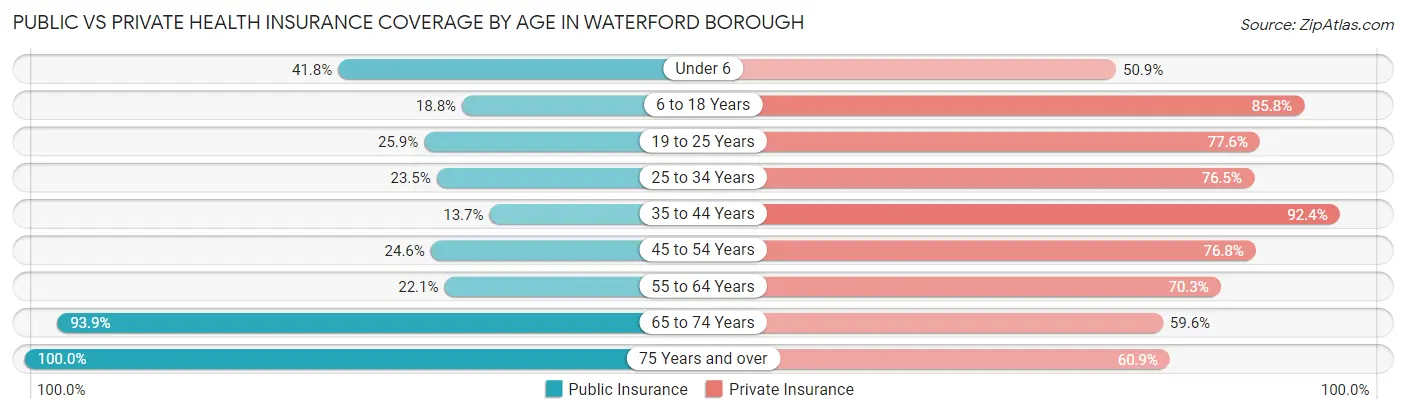
| Age Bracket | Public Insurance | Private Insurance |
| Under 6 | 23 (41.8%) | 28 (50.9%) |
| 6 to 18 Years | 45 (18.8%) | 205 (85.8%) |
| 19 to 25 Years | 15 (25.9%) | 45 (77.6%) |
| 25 to 34 Years | 24 (23.5%) | 78 (76.5%) |
| 35 to 44 Years | 18 (13.7%) | 121 (92.4%) |
| 45 to 54 Years | 34 (24.6%) | 106 (76.8%) |
| 55 to 64 Years | 61 (22.1%) | 194 (70.3%) |
| 65 to 74 Years | 93 (93.9%) | 59 (59.6%) |
| 75 Years and over | 138 (100.0%) | 84 (60.9%) |
| Total | 451 (36.5%) | 920 (74.4%) |
Disability Status by Sex by Age in Waterford borough
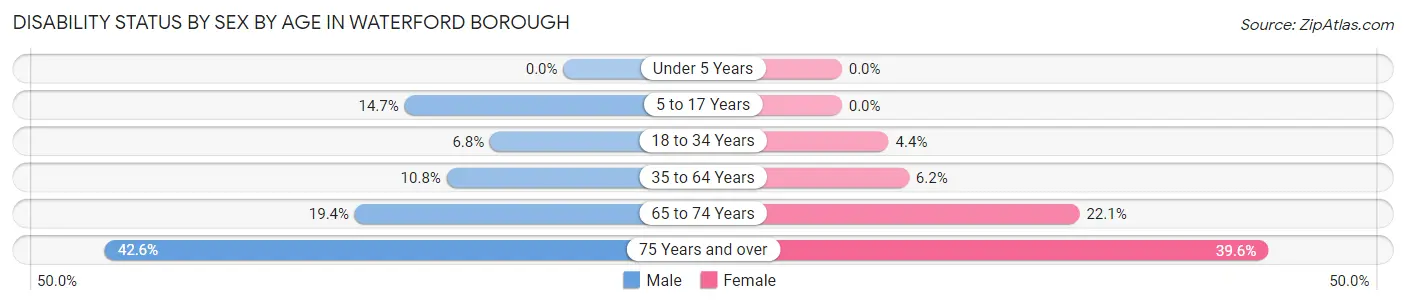
| Age Bracket | Male | Female |
| Under 5 Years | 0 (0.0%) | 0 (0.0%) |
| 5 to 17 Years | 14 (14.7%) | 0 (0.0%) |
| 18 to 34 Years | 7 (6.8%) | 3 (4.3%) |
| 35 to 64 Years | 26 (10.8%) | 19 (6.2%) |
| 65 to 74 Years | 6 (19.4%) | 15 (22.1%) |
| 75 Years and over | 20 (42.5%) | 36 (39.6%) |
Disability Class by Sex by Age in Waterford borough
Disability Class: Hearing Difficulty
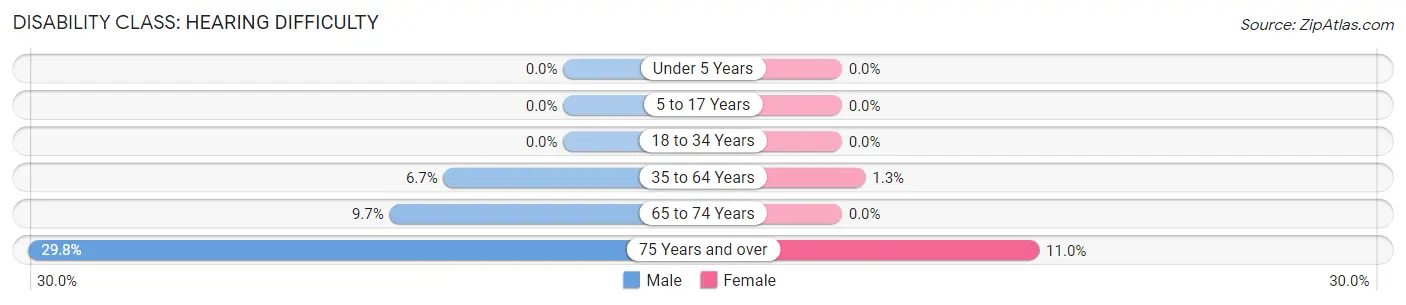
| Age Bracket | Male | Female |
| Under 5 Years | 0 (0.0%) | 0 (0.0%) |
| 5 to 17 Years | 0 (0.0%) | 0 (0.0%) |
| 18 to 34 Years | 0 (0.0%) | 0 (0.0%) |
| 35 to 64 Years | 16 (6.7%) | 4 (1.3%) |
| 65 to 74 Years | 3 (9.7%) | 0 (0.0%) |
| 75 Years and over | 14 (29.8%) | 10 (11.0%) |
Disability Class: Vision Difficulty
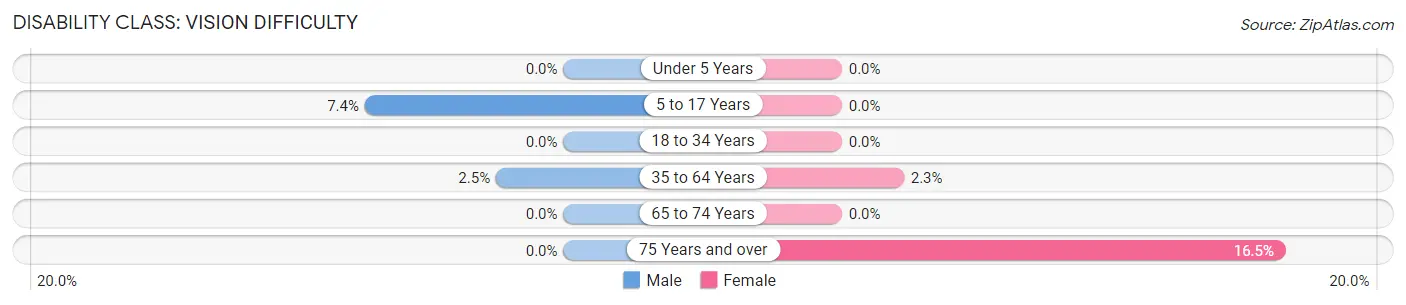
| Age Bracket | Male | Female |
| Under 5 Years | 0 (0.0%) | 0 (0.0%) |
| 5 to 17 Years | 7 (7.4%) | 0 (0.0%) |
| 18 to 34 Years | 0 (0.0%) | 0 (0.0%) |
| 35 to 64 Years | 6 (2.5%) | 7 (2.3%) |
| 65 to 74 Years | 0 (0.0%) | 0 (0.0%) |
| 75 Years and over | 0 (0.0%) | 15 (16.5%) |
Disability Class: Cognitive Difficulty
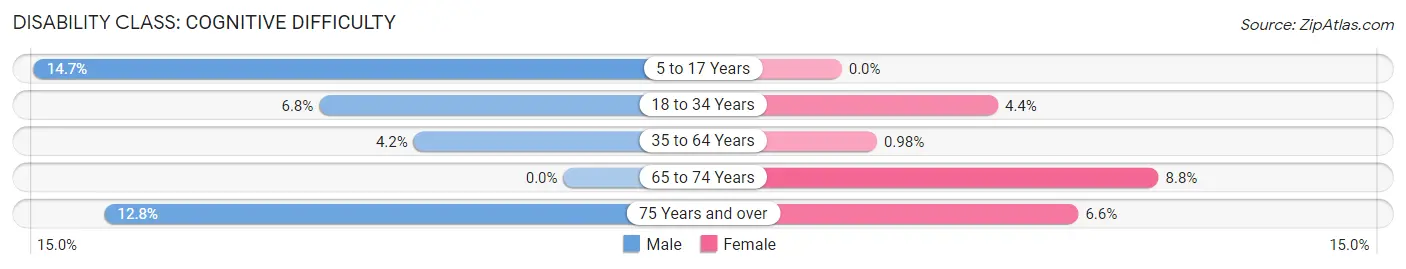
| Age Bracket | Male | Female |
| 5 to 17 Years | 14 (14.7%) | 0 (0.0%) |
| 18 to 34 Years | 7 (6.8%) | 3 (4.3%) |
| 35 to 64 Years | 10 (4.2%) | 3 (1.0%) |
| 65 to 74 Years | 0 (0.0%) | 6 (8.8%) |
| 75 Years and over | 6 (12.8%) | 6 (6.6%) |
Disability Class: Ambulatory Difficulty
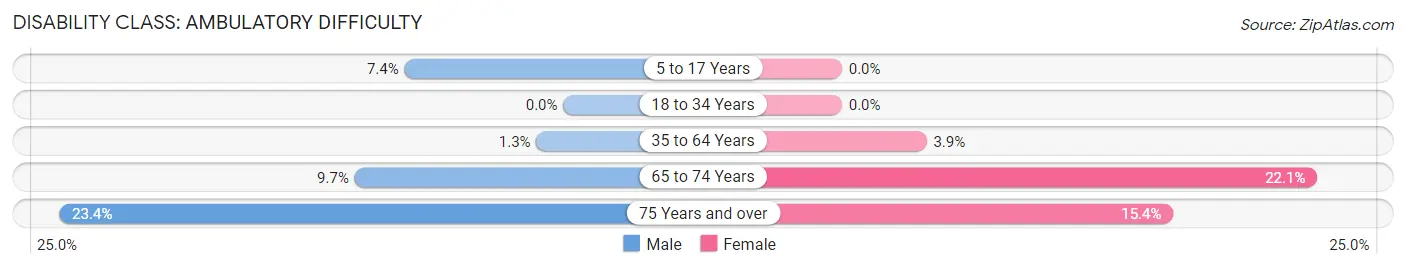
| Age Bracket | Male | Female |
| 5 to 17 Years | 7 (7.4%) | 0 (0.0%) |
| 18 to 34 Years | 0 (0.0%) | 0 (0.0%) |
| 35 to 64 Years | 3 (1.3%) | 12 (3.9%) |
| 65 to 74 Years | 3 (9.7%) | 15 (22.1%) |
| 75 Years and over | 11 (23.4%) | 14 (15.4%) |
Disability Class: Self-Care Difficulty
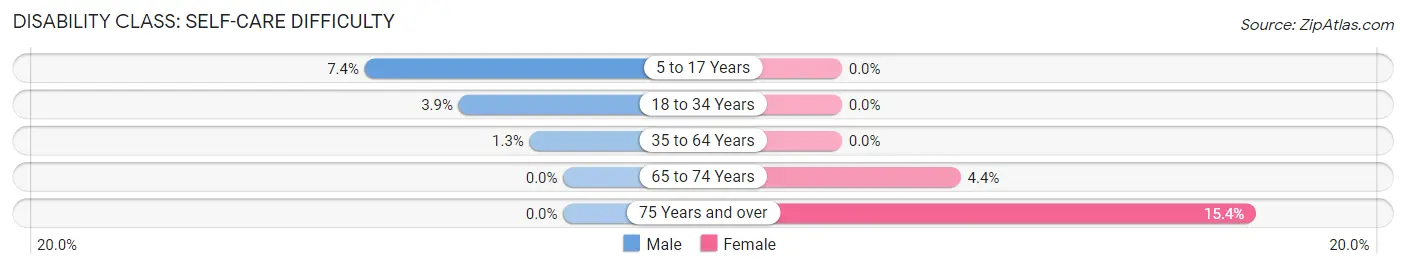
| Age Bracket | Male | Female |
| 5 to 17 Years | 7 (7.4%) | 0 (0.0%) |
| 18 to 34 Years | 4 (3.9%) | 0 (0.0%) |
| 35 to 64 Years | 3 (1.3%) | 0 (0.0%) |
| 65 to 74 Years | 0 (0.0%) | 3 (4.4%) |
| 75 Years and over | 0 (0.0%) | 14 (15.4%) |
Technology Access in Waterford borough
Computing Device Access in Waterford borough
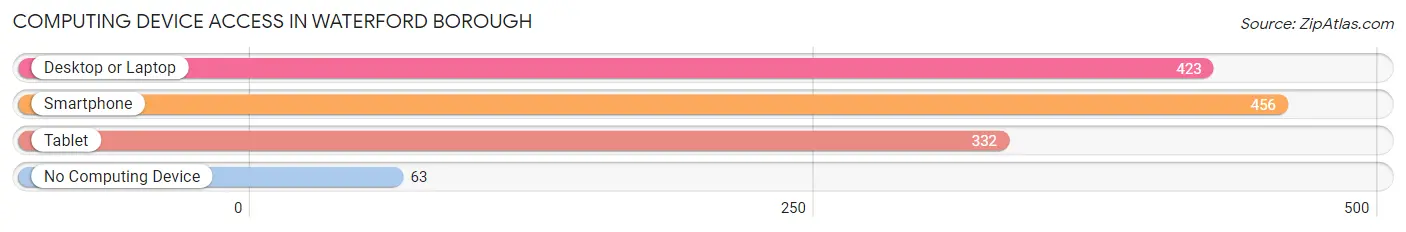
| Device Type | # Households | % Households |
| Desktop or Laptop | 423 | 74.9% |
| Smartphone | 456 | 80.7% |
| Tablet | 332 | 58.8% |
| No Computing Device | 63 | 11.2% |
| Total | 565 | 100.0% |
Internet Access in Waterford borough
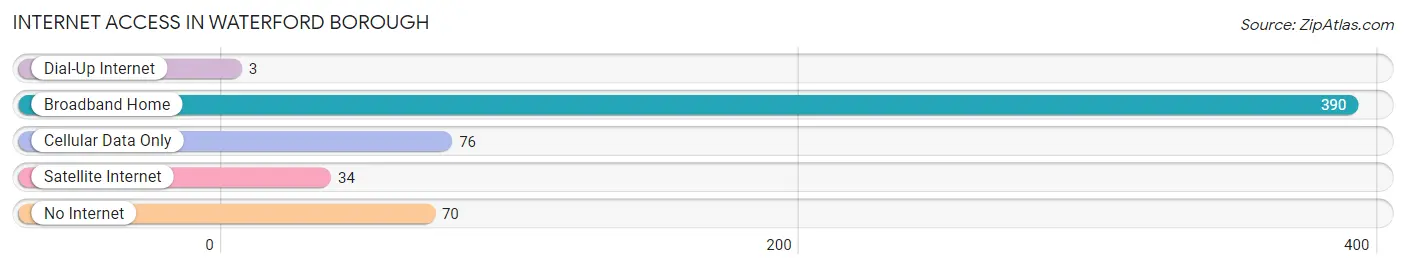
| Internet Type | # Households | % Households |
| Dial-Up Internet | 3 | 0.5% |
| Broadband Home | 390 | 69.0% |
| Cellular Data Only | 76 | 13.5% |
| Satellite Internet | 34 | 6.0% |
| No Internet | 70 | 12.4% |
| Total | 565 | 100.0% |
Waterford borough Summary
Waterford Borough is a small borough located in Erie County, Pennsylvania. It is situated on the banks of the French Creek, a tributary of the Allegheny River. The borough is located approximately 25 miles south of Erie and is part of the Erie Metropolitan Statistical Area. As of the 2010 census, the population of Waterford Borough was 1,517.
History
Waterford Borough was founded in 1816 by a group of settlers from Waterford, Connecticut. The settlers were led by Captain William Buell, who had served in the Revolutionary War. The settlers purchased the land from the Iroquois Indians and named the area after their hometown in Connecticut. The first settlers built a sawmill and gristmill on the banks of the French Creek, which provided the foundation for the town’s economy.
In 1832, the borough was incorporated and the first mayor, William Buell, was elected. The town continued to grow and by the late 19th century, it had become a thriving industrial center. The town was home to several factories, including a paper mill, a woolen mill, a tannery, and a foundry. The town also had a thriving lumber industry, which provided the raw materials for the factories.
Geography
Waterford Borough is located in northwestern Pennsylvania, approximately 25 miles south of Erie. It is situated on the banks of the French Creek, a tributary of the Allegheny River. The borough is located in a rural area and is surrounded by rolling hills and forests. The borough covers an area of 1.2 square miles and has a population density of 1,269 people per square mile.
Economy
The economy of Waterford Borough is largely based on manufacturing and agriculture. The town is home to several factories, including a paper mill, a woolen mill, a tannery, and a foundry. The town also has a thriving lumber industry, which provides the raw materials for the factories. In addition, the town is home to several farms, which produce a variety of crops, including corn, wheat, and hay.
Demographics
As of the 2010 census, the population of Waterford Borough was 1,517. The racial makeup of the borough was 97.3% White, 0.7% African American, 0.2% Native American, 0.2% Asian, 0.2% from other races, and 1.6% from two or more races. The median household income was $37,917 and the median family income was $45,938. The per capita income was $19,945. Approximately 11.3% of the population was below the poverty line.
Common Questions
What is Per Capita Income in Waterford borough?
Per Capita income in Waterford borough is $31,524.
What is the Median Family Income in Waterford borough?
Median Family Income in Waterford borough is $73,438.
What is the Median Household income in Waterford borough?
Median Household Income in Waterford borough is $48,393.
What is Income or Wage Gap in Waterford borough?
Income or Wage Gap in Waterford borough is 31.5%.
Women in Waterford borough earn 68.5 cents for every dollar earned by a man.
What is Inequality or Gini Index in Waterford borough?
Inequality or Gini Index in Waterford borough is 0.44.
What is the Total Population of Waterford borough?
Total Population of Waterford borough is 1,244.
What is the Total Male Population of Waterford borough?
Total Male Population of Waterford borough is 540.
What is the Total Female Population of Waterford borough?
Total Female Population of Waterford borough is 704.
What is the Ratio of Males per 100 Females in Waterford borough?
There are 76.70 Males per 100 Females in Waterford borough.
What is the Ratio of Females per 100 Males in Waterford borough?
There are 130.37 Females per 100 Males in Waterford borough.
What is the Median Population Age in Waterford borough?
Median Population Age in Waterford borough is 48.3 Years.
What is the Average Family Size in Waterford borough
Average Family Size in Waterford borough is 2.9 People.
What is the Average Household Size in Waterford borough
Average Household Size in Waterford borough is 2.2 People.
How Large is the Labor Force in Waterford borough?
There are 625 People in the Labor Forcein in Waterford borough.
What is the Percentage of People in the Labor Force in Waterford borough?
62.8% of People are in the Labor Force in Waterford borough.
What is the Unemployment Rate in Waterford borough?
Unemployment Rate in Waterford borough is 9.2%.