Salunga, PA Map & Demographics
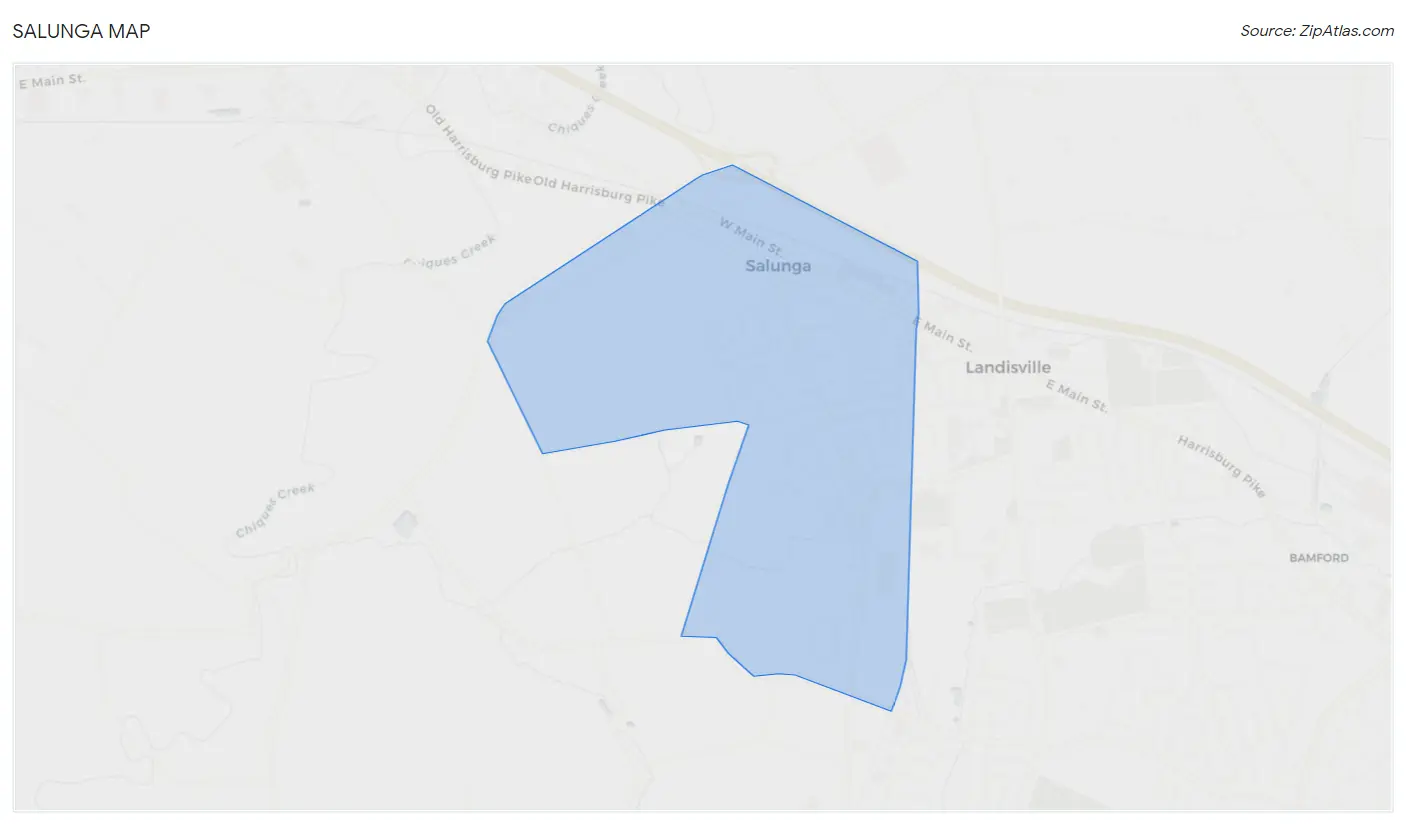
Salunga Map
Salunga Overview
$40,700
PER CAPITA INCOME
$125,667
AVG FAMILY INCOME
$82,857
AVG HOUSEHOLD INCOME
44.9%
WAGE / INCOME GAP [ % ]
55.1¢/ $1
WAGE / INCOME GAP [ $ ]
0.41
INEQUALITY / GINI INDEX
3,114
TOTAL POPULATION
1,393
MALE POPULATION
1,721
FEMALE POPULATION
80.94
MALES / 100 FEMALES
123.55
FEMALES / 100 MALES
48.6
MEDIAN AGE
3.2
AVG FAMILY SIZE
2.4
AVG HOUSEHOLD SIZE
1,502
LABOR FORCE [ PEOPLE ]
59.4%
PERCENT IN LABOR FORCE
2.3%
UNEMPLOYMENT RATE
Salunga Area Codes
Income in Salunga
Income Overview in Salunga
Per Capita Income in Salunga is $40,700, while median incomes of families and households are $125,667 and $82,857 respectively.
| Characteristic | Number | Measure |
| Per Capita Income | 3,114 | $40,700 |
| Median Family Income | 796 | $125,667 |
| Mean Family Income | 796 | $127,802 |
| Median Household Income | 1,312 | $82,857 |
| Mean Household Income | 1,312 | $93,654 |
| Income Deficit | 796 | $0 |
| Wage / Income Gap (%) | 3,114 | 44.88% |
| Wage / Income Gap ($) | 3,114 | 55.12¢ per $1 |
| Gini / Inequality Index | 3,114 | 0.41 |
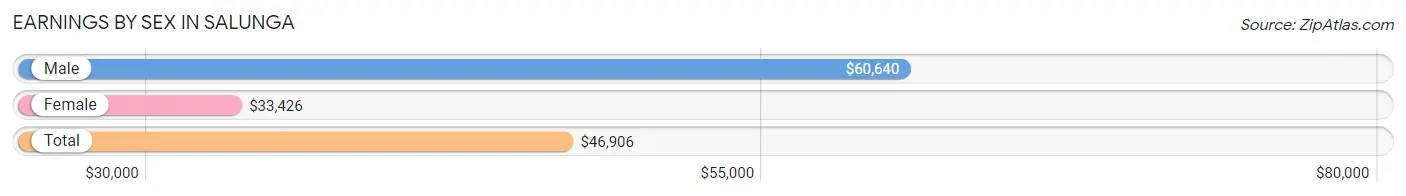
Earnings by Sex in Salunga
Average Earnings in Salunga are $46,906, $60,640 for men and $33,426 for women, a difference of 44.9%.
| Sex | Number | Average Earnings |
| Male | 925 (55.3%) | $60,640 |
| Female | 748 (44.7%) | $33,426 |
| Total | 1,673 (100.0%) | $46,906 |
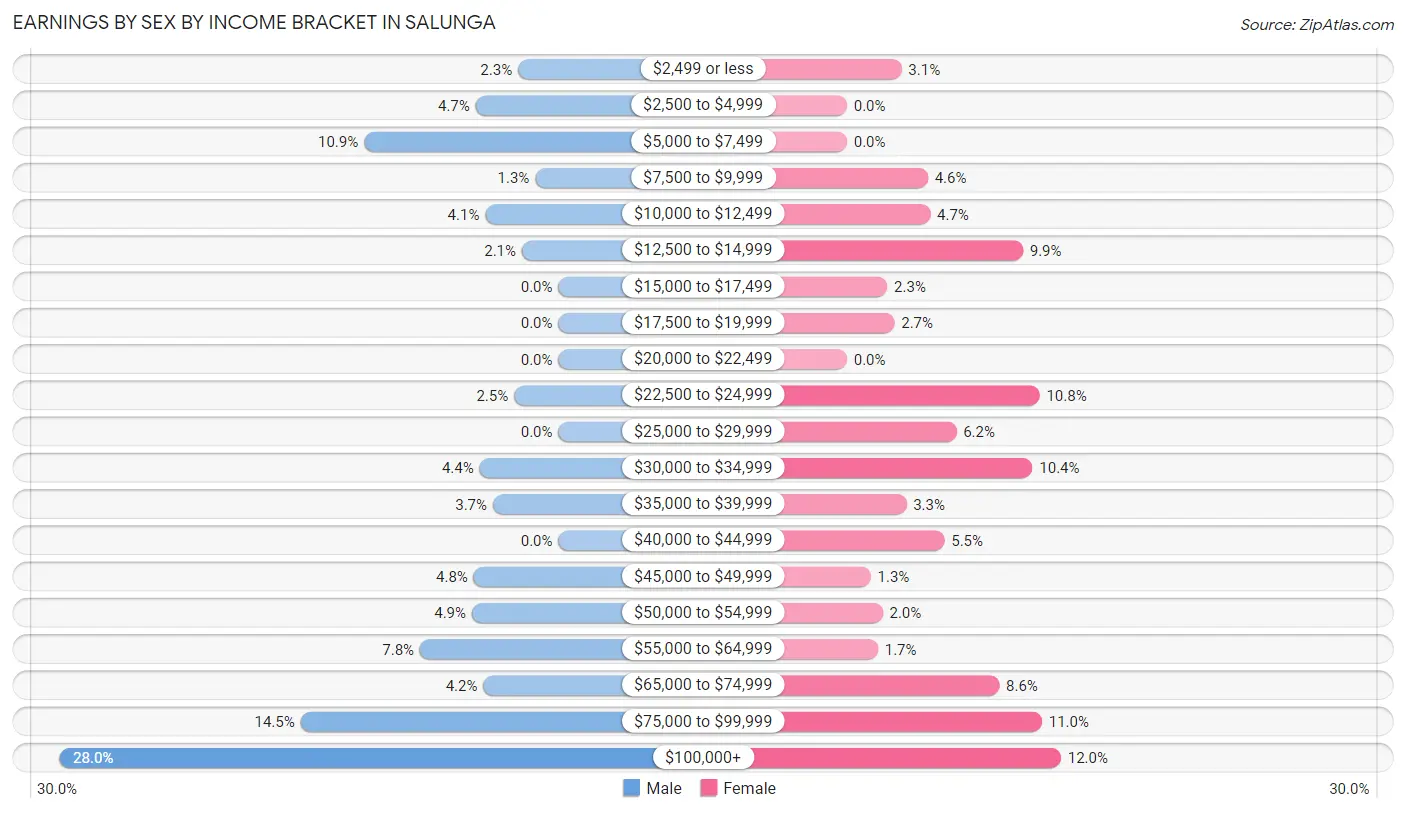
Earnings by Sex by Income Bracket in Salunga
The most common earnings brackets in Salunga are $100,000+ for men (259 | 28.0%) and $100,000+ for women (90 | 12.0%).
| Income | Male | Female |
| $2,499 or less | 21 (2.3%) | 23 (3.1%) |
| $2,500 to $4,999 | 43 (4.6%) | 0 (0.0%) |
| $5,000 to $7,499 | 101 (10.9%) | 0 (0.0%) |
| $7,500 to $9,999 | 12 (1.3%) | 34 (4.5%) |
| $10,000 to $12,499 | 38 (4.1%) | 35 (4.7%) |
| $12,500 to $14,999 | 19 (2.1%) | 74 (9.9%) |
| $15,000 to $17,499 | 0 (0.0%) | 17 (2.3%) |
| $17,500 to $19,999 | 0 (0.0%) | 20 (2.7%) |
| $20,000 to $22,499 | 0 (0.0%) | 0 (0.0%) |
| $22,500 to $24,999 | 23 (2.5%) | 81 (10.8%) |
| $25,000 to $29,999 | 0 (0.0%) | 46 (6.1%) |
| $30,000 to $34,999 | 41 (4.4%) | 78 (10.4%) |
| $35,000 to $39,999 | 34 (3.7%) | 25 (3.3%) |
| $40,000 to $44,999 | 0 (0.0%) | 41 (5.5%) |
| $45,000 to $49,999 | 44 (4.8%) | 10 (1.3%) |
| $50,000 to $54,999 | 45 (4.9%) | 15 (2.0%) |
| $55,000 to $64,999 | 72 (7.8%) | 13 (1.7%) |
| $65,000 to $74,999 | 39 (4.2%) | 64 (8.6%) |
| $75,000 to $99,999 | 134 (14.5%) | 82 (11.0%) |
| $100,000+ | 259 (28.0%) | 90 (12.0%) |
| Total | 925 (100.0%) | 748 (100.0%) |
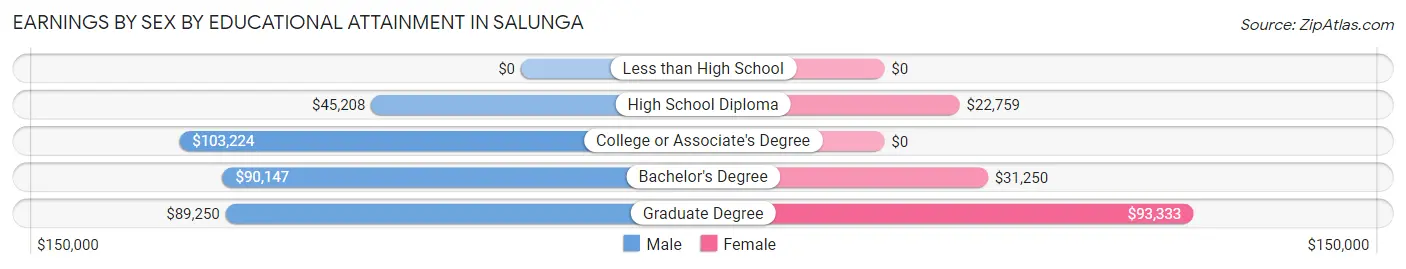
Earnings by Sex by Educational Attainment in Salunga
Average earnings in Salunga are $71,125 for men and $34,444 for women, a difference of 51.6%. Men with an educational attainment of college or associate's degree enjoy the highest average annual earnings of $103,224, while those with high school diploma education earn the least with $45,208. Women with an educational attainment of graduate degree earn the most with the average annual earnings of $93,333, while those with high school diploma education have the smallest earnings of $22,759.
| Educational Attainment | Male Income | Female Income |
| Less than High School | - | - |
| High School Diploma | $45,208 | $22,759 |
| College or Associate's Degree | $103,224 | $0 |
| Bachelor's Degree | $90,147 | $31,250 |
| Graduate Degree | $89,250 | $93,333 |
| Total | $71,125 | $34,444 |
Family Income in Salunga
Family Income Brackets in Salunga
According to the Salunga family income data, there are 268 families falling into the $150,000 to $199,999 income range, which is the most common income bracket and makes up 33.7% of all families.
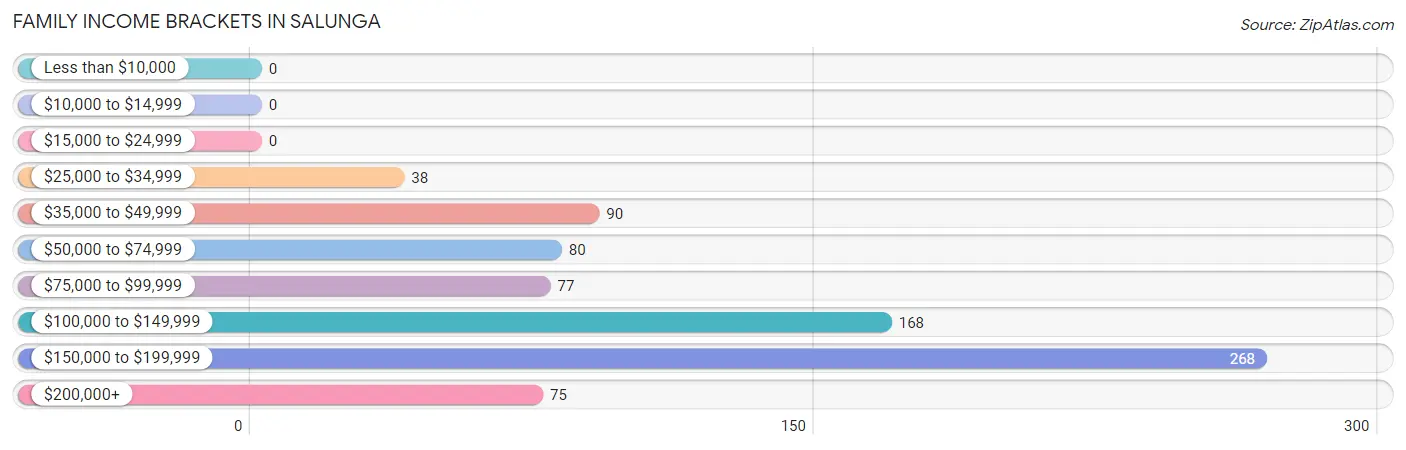
| Income Bracket | # Families | % Families |
| Less than $10,000 | 0 | 0.0% |
| $10,000 to $14,999 | 0 | 0.0% |
| $15,000 to $24,999 | 0 | 0.0% |
| $25,000 to $34,999 | 38 | 4.8% |
| $35,000 to $49,999 | 90 | 11.3% |
| $50,000 to $74,999 | 80 | 10.1% |
| $75,000 to $99,999 | 77 | 9.7% |
| $100,000 to $149,999 | 168 | 21.1% |
| $150,000 to $199,999 | 268 | 33.7% |
| $200,000+ | 75 | 9.4% |
Family Income by Famaliy Size in Salunga
4-person families (159 | 20.0%) account for the highest median family income in Salunga with $180,694 per family, while 4-person families (159 | 20.0%) have the highest median income of $45,174 per family member.
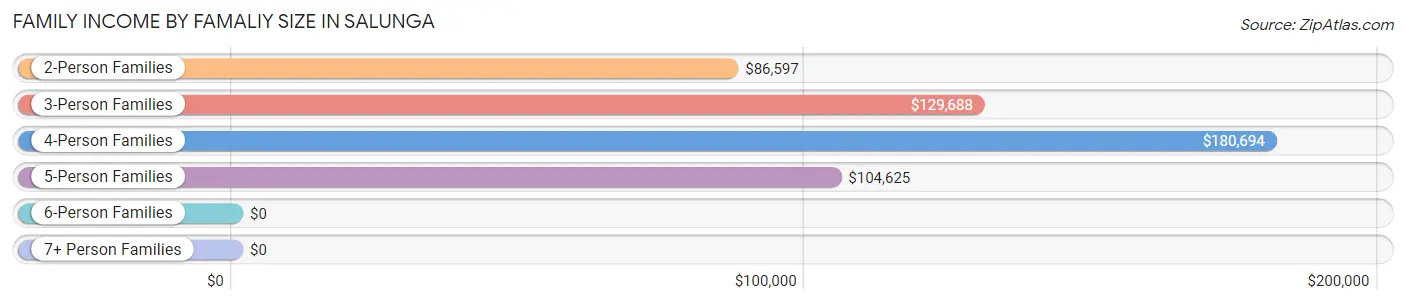
| Income Bracket | # Families | Median Income |
| 2-Person Families | 367 (46.1%) | $86,597 |
| 3-Person Families | 185 (23.2%) | $129,688 |
| 4-Person Families | 159 (20.0%) | $180,694 |
| 5-Person Families | 85 (10.7%) | $104,625 |
| 6-Person Families | 0 (0.0%) | $0 |
| 7+ Person Families | 0 (0.0%) | $0 |
| Total | 796 (100.0%) | $125,667 |
Family Income by Number of Earners in Salunga
The median family income in Salunga is $125,667, with families comprising 3+ earners (134) having the highest median family income of $167,833, while families with no earners (131) have the lowest median family income of $61,354, accounting for 16.8% and 16.5% of families, respectively.
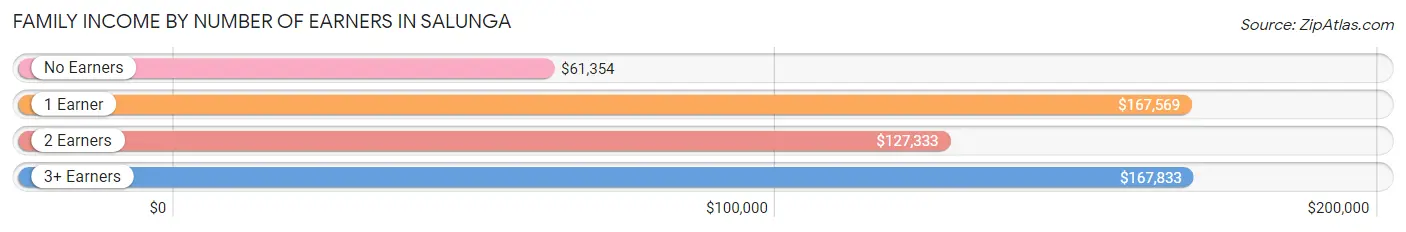
| Number of Earners | # Families | Median Income |
| No Earners | 131 (16.5%) | $61,354 |
| 1 Earner | 77 (9.7%) | $167,569 |
| 2 Earners | 454 (57.0%) | $127,333 |
| 3+ Earners | 134 (16.8%) | $167,833 |
| Total | 796 (100.0%) | $125,667 |
Household Income in Salunga
Household Income Brackets in Salunga
With 289 households falling in the category, the $15,000 to $24,999 income range is the most frequent in Salunga, accounting for 22.0% of all households. In contrast, only 14 households (1.1%) fall into the $10,000 to $14,999 income bracket, making it the least populous group.
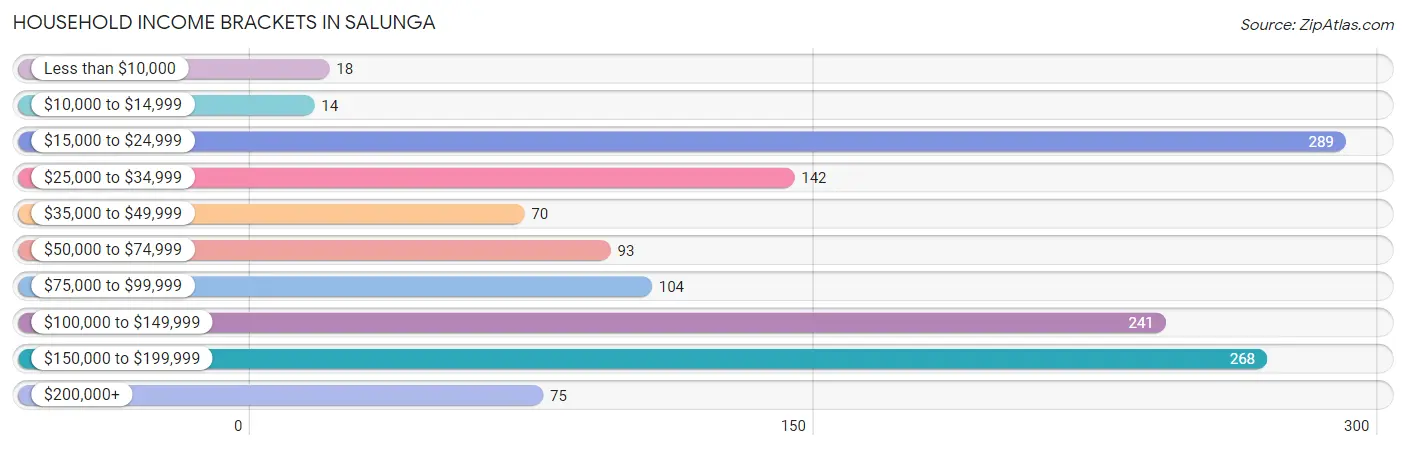
| Income Bracket | # Households | % Households |
| Less than $10,000 | 18 | 1.4% |
| $10,000 to $14,999 | 14 | 1.1% |
| $15,000 to $24,999 | 289 | 22.0% |
| $25,000 to $34,999 | 142 | 10.8% |
| $35,000 to $49,999 | 70 | 5.3% |
| $50,000 to $74,999 | 93 | 7.1% |
| $75,000 to $99,999 | 104 | 7.9% |
| $100,000 to $149,999 | 241 | 18.4% |
| $150,000 to $199,999 | 268 | 20.4% |
| $200,000+ | 75 | 5.7% |
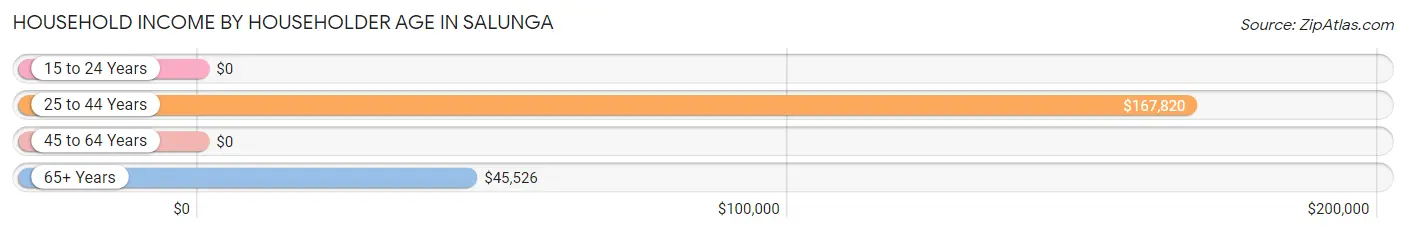
Household Income by Householder Age in Salunga
The median household income in Salunga is $82,857, with the highest median household income of $167,820 found in the 25 to 44 years age bracket for the primary householder. A total of 291 households (22.2%) fall into this category.
| Income Bracket | # Households | Median Income |
| 15 to 24 Years | 0 (0.0%) | $0 |
| 25 to 44 Years | 291 (22.2%) | $167,820 |
| 45 to 64 Years | 617 (47.0%) | $0 |
| 65+ Years | 404 (30.8%) | $45,526 |
| Total | 1,312 (100.0%) | $82,857 |
Poverty in Salunga
Income Below Poverty by Sex and Age in Salunga
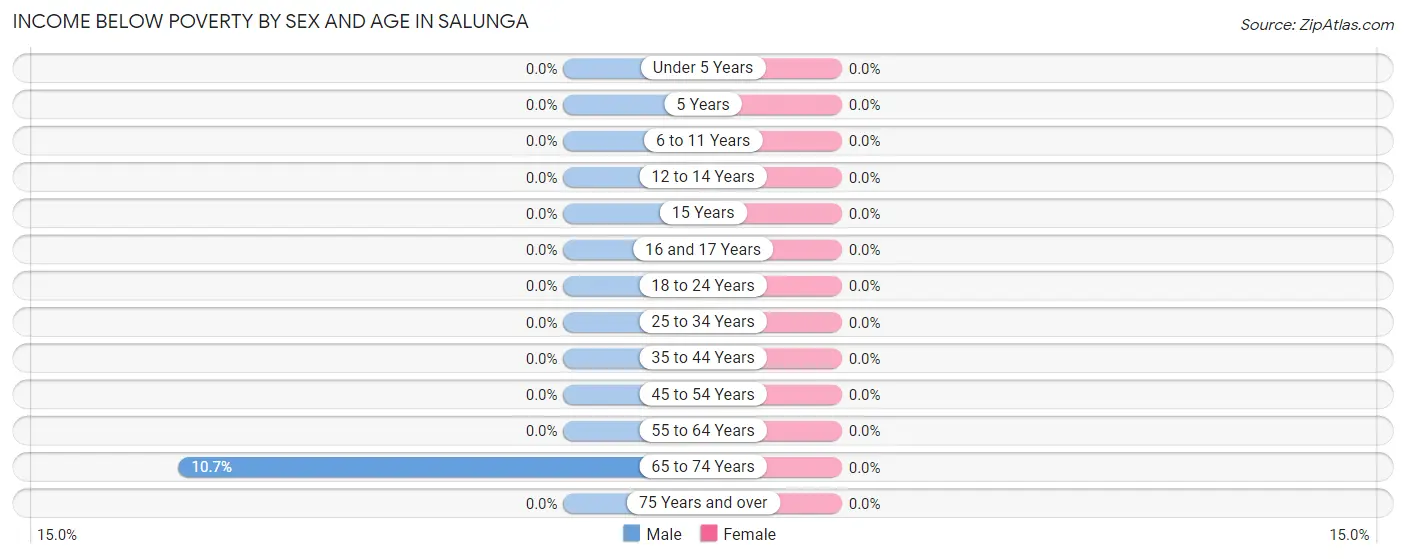
| Age Bracket | Male | Female |
| Under 5 Years | 0 (0.0%) | 0 (0.0%) |
| 5 Years | 0 (0.0%) | 0 (0.0%) |
| 6 to 11 Years | 0 (0.0%) | 0 (0.0%) |
| 12 to 14 Years | 0 (0.0%) | 0 (0.0%) |
| 15 Years | 0 (0.0%) | 0 (0.0%) |
| 16 and 17 Years | 0 (0.0%) | 0 (0.0%) |
| 18 to 24 Years | 0 (0.0%) | 0 (0.0%) |
| 25 to 34 Years | 0 (0.0%) | 0 (0.0%) |
| 35 to 44 Years | 0 (0.0%) | 0 (0.0%) |
| 45 to 54 Years | 0 (0.0%) | 0 (0.0%) |
| 55 to 64 Years | 0 (0.0%) | 0 (0.0%) |
| 65 to 74 Years | 18 (10.7%) | 0 (0.0%) |
| 75 Years and over | 0 (0.0%) | 0 (0.0%) |
| Total | 18 (1.3%) | 0 (0.0%) |
Income Above Poverty by Sex and Age in Salunga
According to the poverty statistics in Salunga, males aged under 5 years and females aged under 5 years are the age groups that are most secure financially, with 100.0% of males and 100.0% of females in these age groups living above the poverty line.
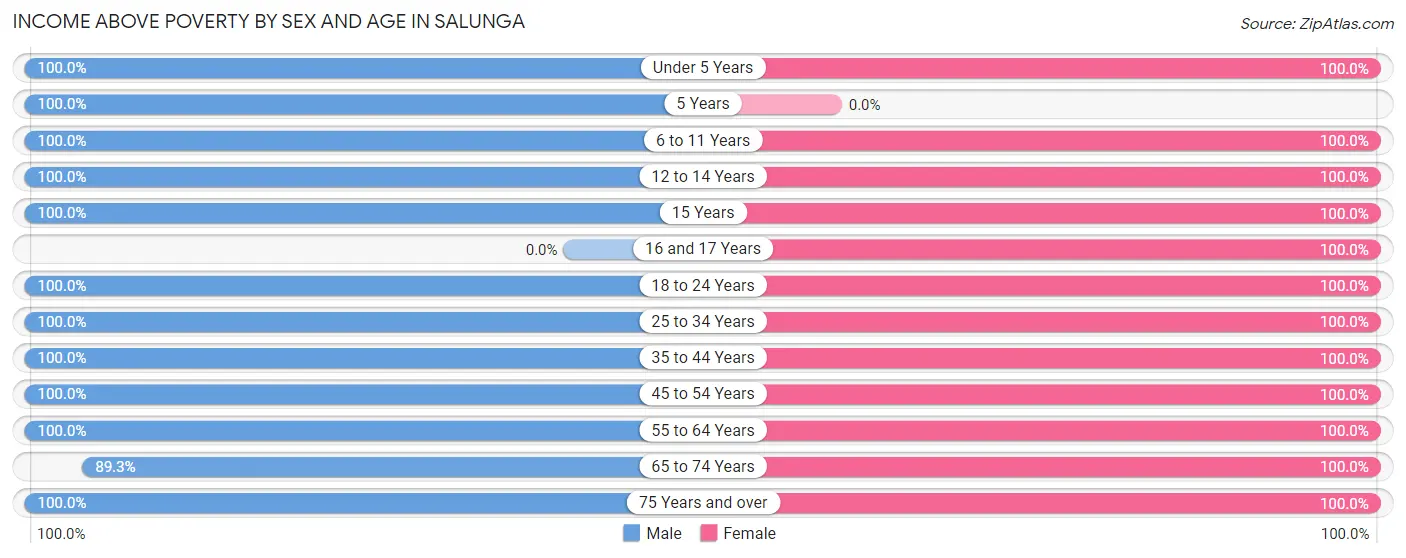
| Age Bracket | Male | Female |
| Under 5 Years | 13 (100.0%) | 86 (100.0%) |
| 5 Years | 28 (100.0%) | 0 (0.0%) |
| 6 to 11 Years | 138 (100.0%) | 237 (100.0%) |
| 12 to 14 Years | 44 (100.0%) | 14 (100.0%) |
| 15 Years | 13 (100.0%) | 12 (100.0%) |
| 16 and 17 Years | 0 (0.0%) | 35 (100.0%) |
| 18 to 24 Years | 89 (100.0%) | 9 (100.0%) |
| 25 to 34 Years | 135 (100.0%) | 174 (100.0%) |
| 35 to 44 Years | 190 (100.0%) | 226 (100.0%) |
| 45 to 54 Years | 374 (100.0%) | 144 (100.0%) |
| 55 to 64 Years | 143 (100.0%) | 394 (100.0%) |
| 65 to 74 Years | 150 (89.3%) | 294 (100.0%) |
| 75 Years and over | 58 (100.0%) | 96 (100.0%) |
| Total | 1,375 (98.7%) | 1,721 (100.0%) |
Income Below Poverty Among Married-Couple Families in Salunga
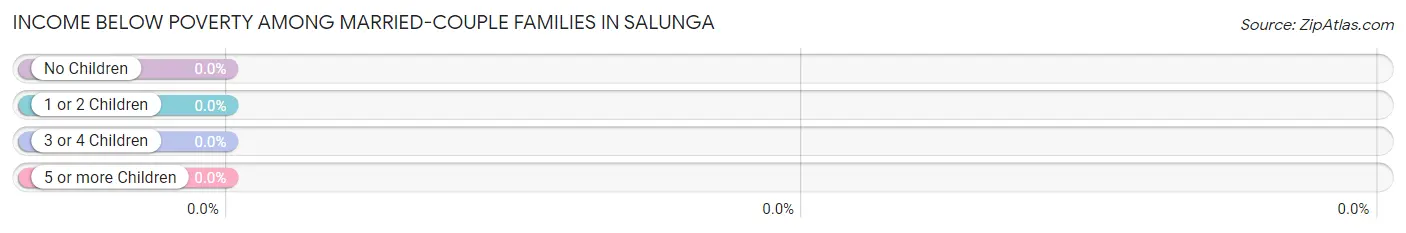
| Children | Above Poverty | Below Poverty |
| No Children | 445 (100.0%) | 0 (0.0%) |
| 1 or 2 Children | 205 (100.0%) | 0 (0.0%) |
| 3 or 4 Children | 50 (100.0%) | 0 (0.0%) |
| 5 or more Children | 0 (0.0%) | 0 (0.0%) |
| Total | 700 (100.0%) | 0 (0.0%) |
Income Below Poverty Among Single-Parent Households in Salunga
| Children | Single Father | Single Mother |
| No Children | 0 (0.0%) | 0 (0.0%) |
| 1 or 2 Children | 0 (0.0%) | 0 (0.0%) |
| 3 or 4 Children | 0 (0.0%) | 0 (0.0%) |
| 5 or more Children | 0 (0.0%) | 0 (0.0%) |
| Total | 0 (0.0%) | 0 (0.0%) |
Income Below Poverty Among Married-Couple vs Single-Parent Households in Salunga
| Children | Married-Couple Families | Single-Parent Households |
| No Children | 0 (0.0%) | 0 (0.0%) |
| 1 or 2 Children | 0 (0.0%) | 0 (0.0%) |
| 3 or 4 Children | 0 (0.0%) | 0 (0.0%) |
| 5 or more Children | 0 (0.0%) | 0 (0.0%) |
| Total | 0 (0.0%) | 0 (0.0%) |
Race in Salunga
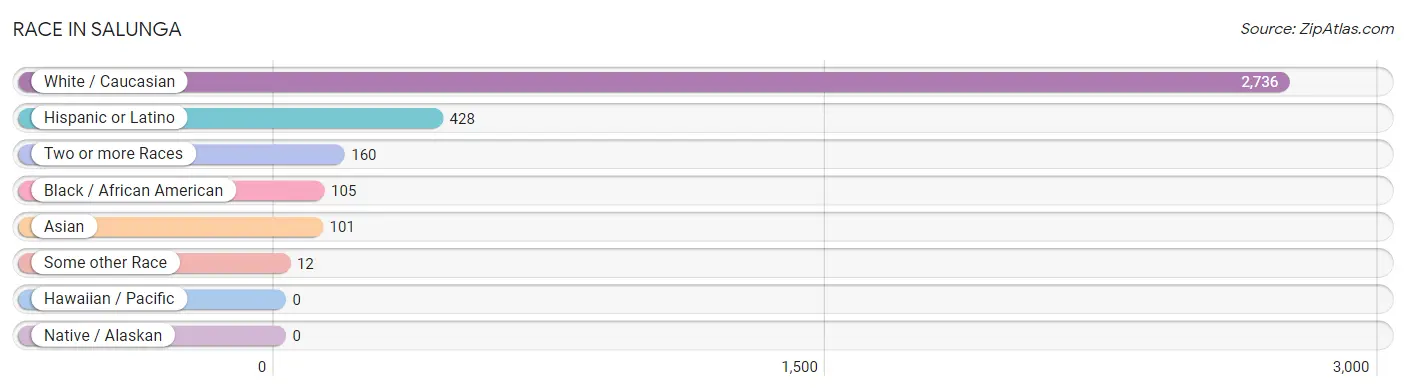
The most populous races in Salunga are White / Caucasian (2,736 | 87.9%), Hispanic or Latino (428 | 13.7%), and Two or more Races (160 | 5.1%).
| Race | # Population | % Population |
| Asian | 101 | 3.2% |
| Black / African American | 105 | 3.4% |
| Hawaiian / Pacific | 0 | 0.0% |
| Hispanic or Latino | 428 | 13.7% |
| Native / Alaskan | 0 | 0.0% |
| White / Caucasian | 2,736 | 87.9% |
| Two or more Races | 160 | 5.1% |
| Some other Race | 12 | 0.4% |
| Total | 3,114 | 100.0% |
Ancestry in Salunga
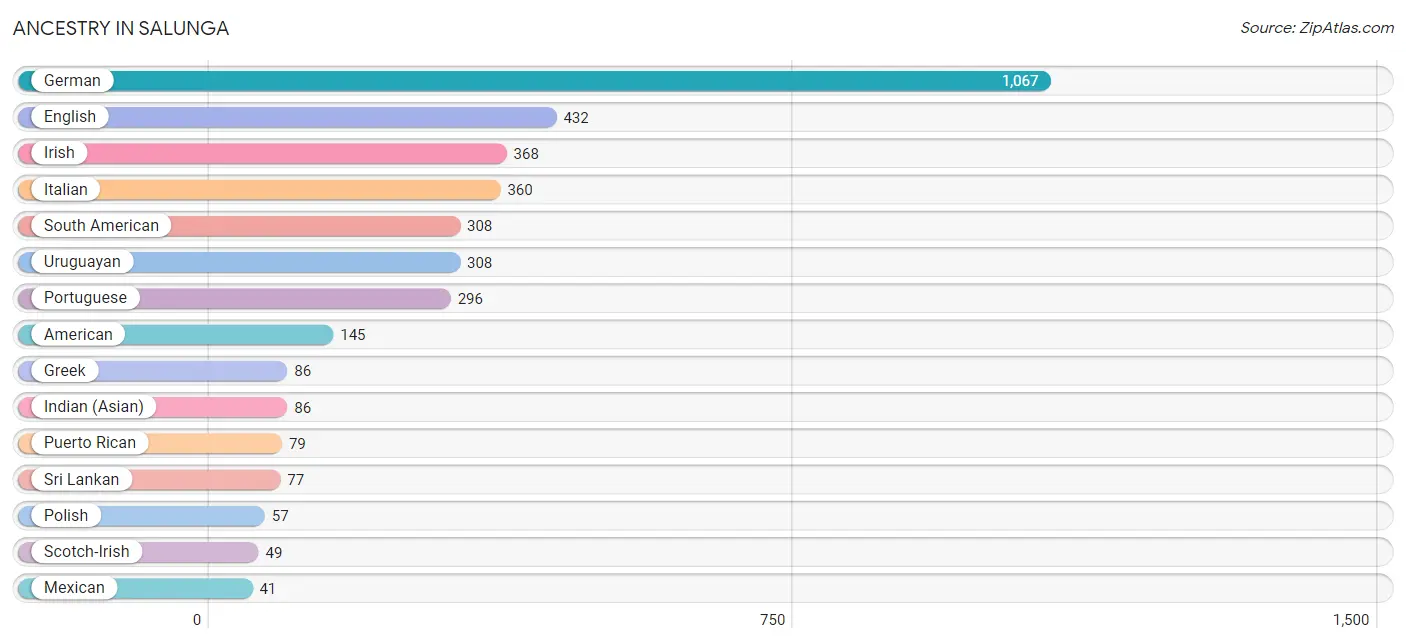
The most populous ancestries reported in Salunga are German (1,067 | 34.3%), English (432 | 13.9%), Irish (368 | 11.8%), Italian (360 | 11.6%), and South American (308 | 9.9%), together accounting for 81.4% of all Salunga residents.
| Ancestry | # Population | % Population |
| American | 145 | 4.7% |
| Austrian | 17 | 0.5% |
| Czech | 28 | 0.9% |
| Dutch | 34 | 1.1% |
| English | 432 | 13.9% |
| Ethiopian | 12 | 0.4% |
| European | 13 | 0.4% |
| French | 18 | 0.6% |
| German | 1,067 | 34.3% |
| Greek | 86 | 2.8% |
| Indian (Asian) | 86 | 2.8% |
| Irish | 368 | 11.8% |
| Italian | 360 | 11.6% |
| Korean | 17 | 0.5% |
| Mexican | 41 | 1.3% |
| Polish | 57 | 1.8% |
| Portuguese | 296 | 9.5% |
| Puerto Rican | 79 | 2.5% |
| Russian | 21 | 0.7% |
| Scotch-Irish | 49 | 1.6% |
| Scottish | 13 | 0.4% |
| South American | 308 | 9.9% |
| Sri Lankan | 77 | 2.5% |
| Subsaharan African | 12 | 0.4% |
| Swiss | 35 | 1.1% |
| Uruguayan | 308 | 9.9% | View All 26 Rows |
Immigrants in Salunga
The most numerous immigrant groups reported in Salunga came from Latin America (62 | 2.0%), South America (62 | 2.0%), Uruguay (62 | 2.0%), Asia (39 | 1.3%), and South Eastern Asia (39 | 1.3%), together accounting for 8.5% of all Salunga residents.
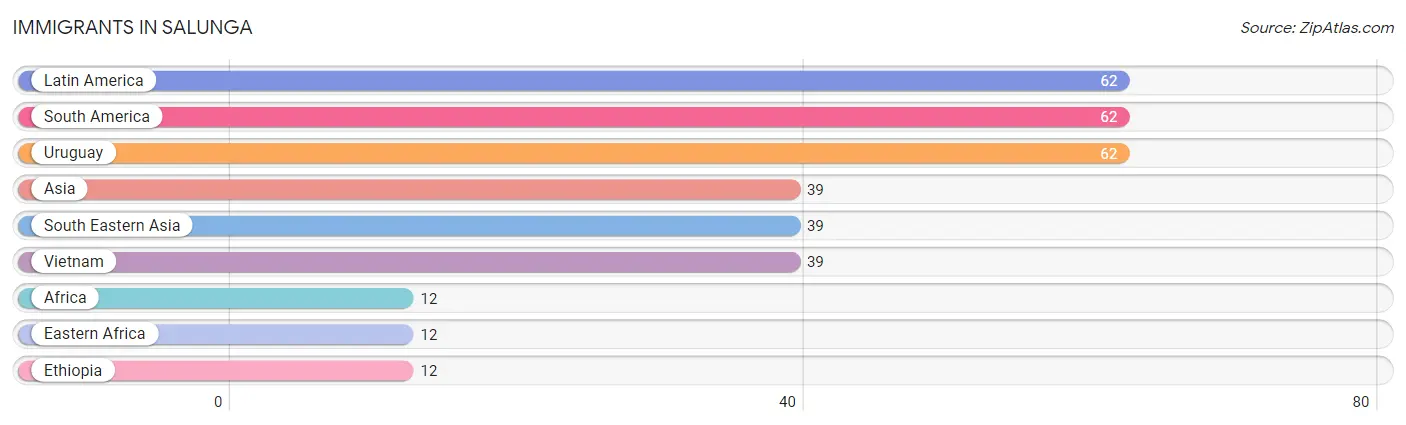
| Immigration Origin | # Population | % Population |
| Africa | 12 | 0.4% |
| Asia | 39 | 1.3% |
| Eastern Africa | 12 | 0.4% |
| Ethiopia | 12 | 0.4% |
| Latin America | 62 | 2.0% |
| South America | 62 | 2.0% |
| South Eastern Asia | 39 | 1.3% |
| Uruguay | 62 | 2.0% |
| Vietnam | 39 | 1.3% | View All 9 Rows |
Sex and Age in Salunga
Sex and Age in Salunga
The most populous age groups in Salunga are 50 to 54 Years (307 | 22.0%) for men and 60 to 64 Years (334 | 19.4%) for women.
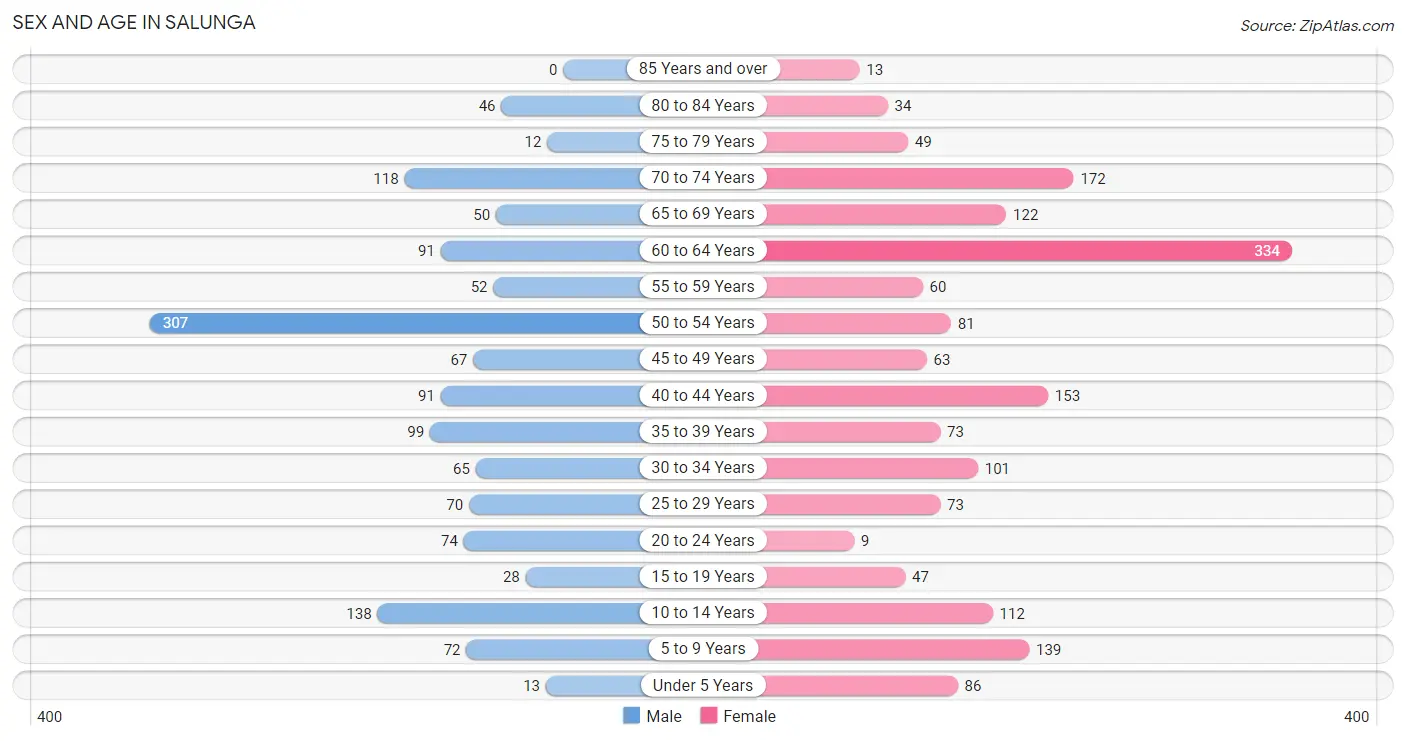
| Age Bracket | Male | Female |
| Under 5 Years | 13 (0.9%) | 86 (5.0%) |
| 5 to 9 Years | 72 (5.2%) | 139 (8.1%) |
| 10 to 14 Years | 138 (9.9%) | 112 (6.5%) |
| 15 to 19 Years | 28 (2.0%) | 47 (2.7%) |
| 20 to 24 Years | 74 (5.3%) | 9 (0.5%) |
| 25 to 29 Years | 70 (5.0%) | 73 (4.2%) |
| 30 to 34 Years | 65 (4.7%) | 101 (5.9%) |
| 35 to 39 Years | 99 (7.1%) | 73 (4.2%) |
| 40 to 44 Years | 91 (6.5%) | 153 (8.9%) |
| 45 to 49 Years | 67 (4.8%) | 63 (3.7%) |
| 50 to 54 Years | 307 (22.0%) | 81 (4.7%) |
| 55 to 59 Years | 52 (3.7%) | 60 (3.5%) |
| 60 to 64 Years | 91 (6.5%) | 334 (19.4%) |
| 65 to 69 Years | 50 (3.6%) | 122 (7.1%) |
| 70 to 74 Years | 118 (8.5%) | 172 (10.0%) |
| 75 to 79 Years | 12 (0.9%) | 49 (2.9%) |
| 80 to 84 Years | 46 (3.3%) | 34 (2.0%) |
| 85 Years and over | 0 (0.0%) | 13 (0.8%) |
| Total | 1,393 (100.0%) | 1,721 (100.0%) |
Families and Households in Salunga
Median Family Size in Salunga
The median family size in Salunga is 3.22 persons per family, with married-couple families (700 | 87.9%) accounting for the largest median family size of 3.32 persons per family. On the other hand, single male/father families (21 | 2.6%) represent the smallest median family size with 1.81 persons per family.
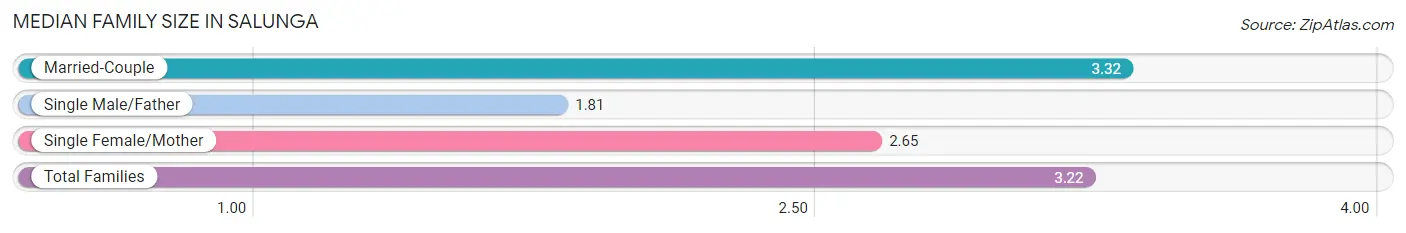
| Family Type | # Families | Family Size |
| Married-Couple | 700 (87.9%) | 3.32 |
| Single Male/Father | 21 (2.6%) | 1.81 |
| Single Female/Mother | 75 (9.4%) | 2.65 |
| Total Families | 796 (100.0%) | 3.22 |
Median Household Size in Salunga
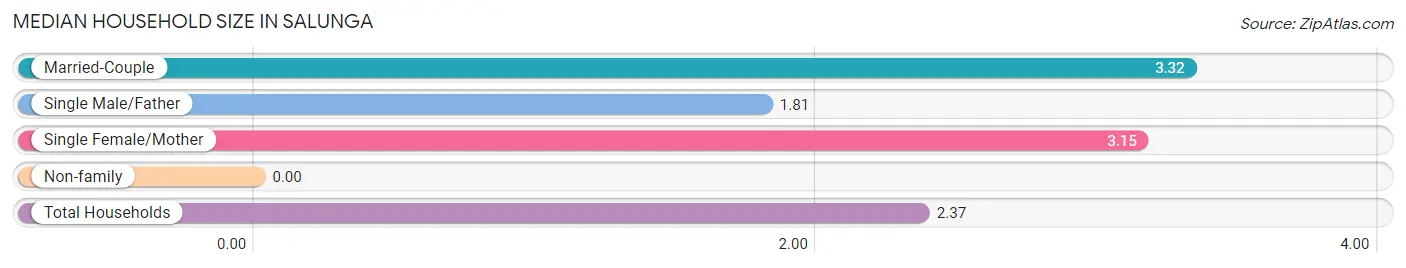
| Household Type | # Households | Household Size |
| Married-Couple | 700 (53.3%) | 3.32 |
| Single Male/Father | 21 (1.6%) | 1.81 |
| Single Female/Mother | 75 (5.7%) | 3.15 |
| Non-family | 516 (39.3%) | - |
| Total Households | 1,312 (100.0%) | 2.37 |
Household Size by Marriage Status in Salunga
Out of a total of 1,312 households in Salunga, 796 (60.7%) are family households, while 516 (39.3%) are nonfamily households. The most numerous type of family households are 2-person households, comprising 359, and the most common type of nonfamily households are 1-person households, comprising 516.
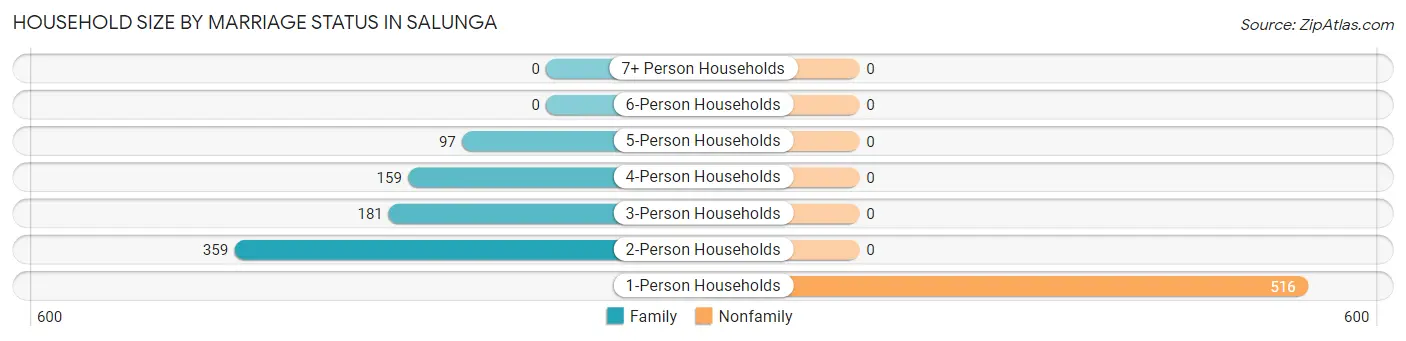
| Household Size | Family Households | Nonfamily Households |
| 1-Person Households | - | 516 (39.3%) |
| 2-Person Households | 359 (27.4%) | 0 (0.0%) |
| 3-Person Households | 181 (13.8%) | 0 (0.0%) |
| 4-Person Households | 159 (12.1%) | 0 (0.0%) |
| 5-Person Households | 97 (7.4%) | 0 (0.0%) |
| 6-Person Households | 0 (0.0%) | 0 (0.0%) |
| 7+ Person Households | 0 (0.0%) | 0 (0.0%) |
| Total | 796 (60.7%) | 516 (39.3%) |
Female Fertility in Salunga
Fertility by Age in Salunga
| Age Bracket | Women with Births | Births / 1,000 Women |
| 15 to 19 years | 0 (0.0%) | 0.0 |
| 20 to 34 years | 0 (0.0%) | 0.0 |
| 35 to 50 years | 0 (0.0%) | 0.0 |
| Total | 0 (0.0%) | 0.0 |
Fertility by Age by Marriage Status in Salunga
| Age Bracket | Married | Unmarried |
| 15 to 19 years | 0 (0.0%) | 0 (0.0%) |
| 20 to 34 years | 0 (0.0%) | 0 (0.0%) |
| 35 to 50 years | 0 (0.0%) | 0 (0.0%) |
| Total | 0 (0.0%) | 0 (0.0%) |
Fertility by Education in Salunga
| Educational Attainment | Women with Births | Births / 1,000 Women |
| Less than High School | 0 (0.0%) | 0.0 |
| High School Diploma | 0 (0.0%) | 0.0 |
| College or Associate's Degree | 0 (0.0%) | 0.0 |
| Bachelor's Degree | 0 (0.0%) | 0.0 |
| Graduate Degree | 0 (0.0%) | 0.0 |
| Total | 0 (0.0%) | 0.0 |
Fertility by Education by Marriage Status in Salunga
| Educational Attainment | Married | Unmarried |
| Less than High School | 0 (0.0%) | 0 (0.0%) |
| High School Diploma | 0 (0.0%) | 0 (0.0%) |
| College or Associate's Degree | 0 (0.0%) | 0 (0.0%) |
| Bachelor's Degree | 0 (0.0%) | 0 (0.0%) |
| Graduate Degree | 0 (0.0%) | 0 (0.0%) |
| Total | 0 (0.0%) | 0 (0.0%) |
Employment Characteristics in Salunga
Employment by Class of Employer in Salunga
Among the 1,417 employed individuals in Salunga, private company employees (949 | 67.0%), not-for-profit organizations (228 | 16.1%), and local government employees (103 | 7.3%) make up the most common classes of employment.
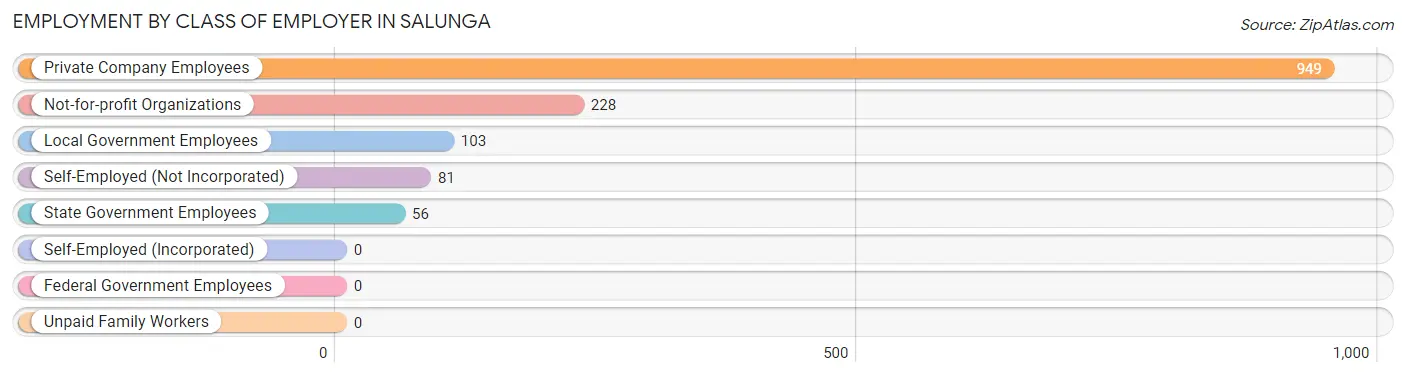
| Employer Class | # Employees | % Employees |
| Private Company Employees | 949 | 67.0% |
| Self-Employed (Incorporated) | 0 | 0.0% |
| Self-Employed (Not Incorporated) | 81 | 5.7% |
| Not-for-profit Organizations | 228 | 16.1% |
| Local Government Employees | 103 | 7.3% |
| State Government Employees | 56 | 4.0% |
| Federal Government Employees | 0 | 0.0% |
| Unpaid Family Workers | 0 | 0.0% |
| Total | 1,417 | 100.0% |
Employment Status by Age in Salunga
According to the labor force statistics for Salunga, out of the total population over 16 years of age (2,529), 59.4% or 1,502 individuals are in the labor force, with 2.3% or 35 of them unemployed. The age group with the highest labor force participation rate is 16 to 19 years, with 100.0% or 50 individuals in the labor force. Within the labor force, the 20 to 24 years age range has the highest percentage of unemployed individuals, with 22.9% or 19 of them being unemployed.
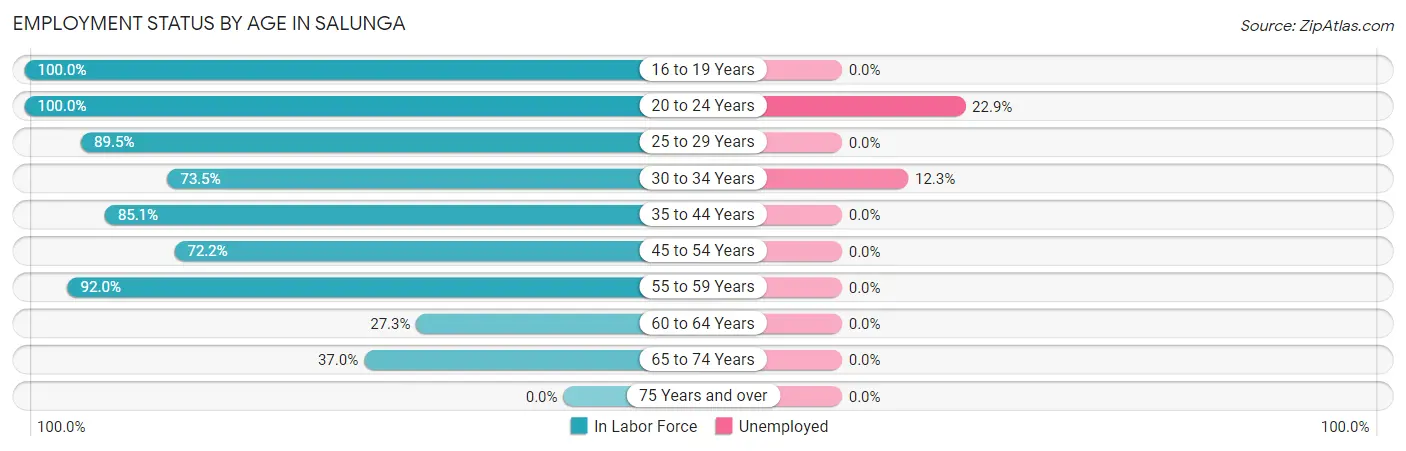
| Age Bracket | In Labor Force | Unemployed |
| 16 to 19 Years | 50 (100.0%) | 0 (0.0%) |
| 20 to 24 Years | 83 (100.0%) | 19 (22.9%) |
| 25 to 29 Years | 128 (89.5%) | 0 (0.0%) |
| 30 to 34 Years | 122 (73.5%) | 15 (12.3%) |
| 35 to 44 Years | 354 (85.1%) | 0 (0.0%) |
| 45 to 54 Years | 374 (72.2%) | 0 (0.0%) |
| 55 to 59 Years | 103 (92.0%) | 0 (0.0%) |
| 60 to 64 Years | 116 (27.3%) | 0 (0.0%) |
| 65 to 74 Years | 171 (37.0%) | 0 (0.0%) |
| 75 Years and over | 0 (0.0%) | 0 (0.0%) |
| Total | 1,502 (59.4%) | 35 (2.3%) |
Employment Status by Educational Attainment in Salunga
According to labor force statistics for Salunga, 67.2% of individuals (1,196) out of the total population between 25 and 64 years of age (1,780) are in the labor force, with 1.3% or 16 of them being unemployed. The group with the highest labor force participation rate are those with the educational attainment of college / associate degree, with 100.0% or 177 individuals in the labor force. Within the labor force, individuals with high school diploma education have the highest percentage of unemployment, with 5.0% or 15 of them being unemployed.
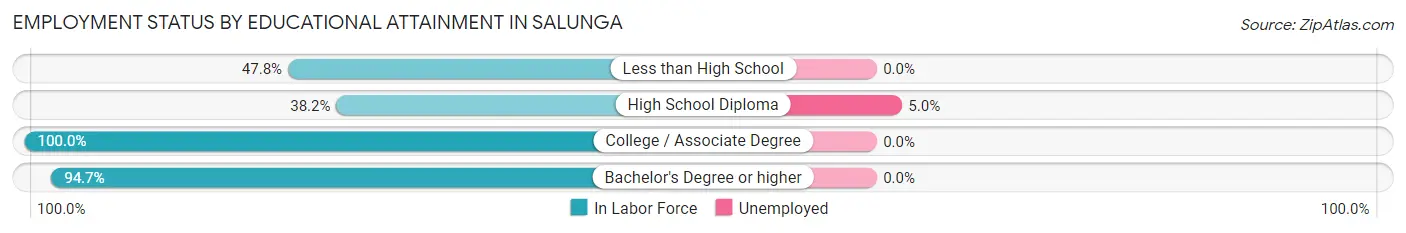
| Educational Attainment | In Labor Force | Unemployed |
| Less than High School | 54 (47.8%) | 0 (0.0%) |
| High School Diploma | 301 (38.2%) | 39 (5.0%) |
| College / Associate Degree | 177 (100.0%) | 0 (0.0%) |
| Bachelor's Degree or higher | 665 (94.7%) | 0 (0.0%) |
| Total | 1,196 (67.2%) | 23 (1.3%) |
Employment Occupations by Sex in Salunga
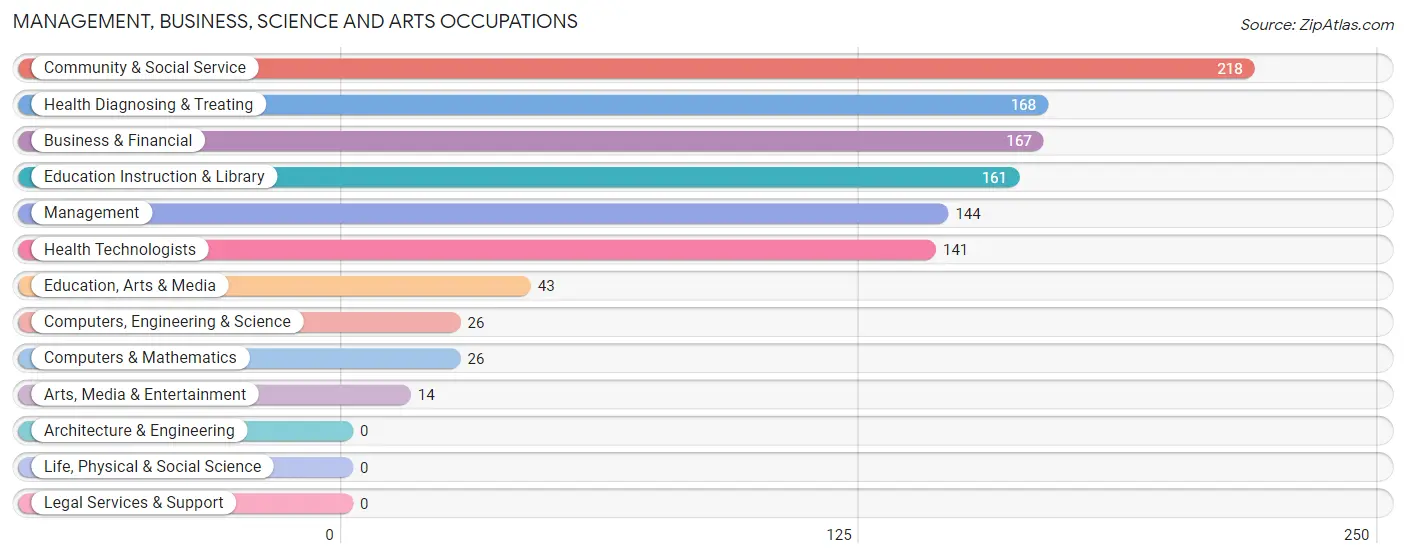
Management, Business, Science and Arts Occupations
The most common Management, Business, Science and Arts occupations in Salunga are Community & Social Service (218 | 14.9%), Health Diagnosing & Treating (168 | 11.5%), Business & Financial (167 | 11.4%), Education Instruction & Library (161 | 11.0%), and Management (144 | 9.8%).
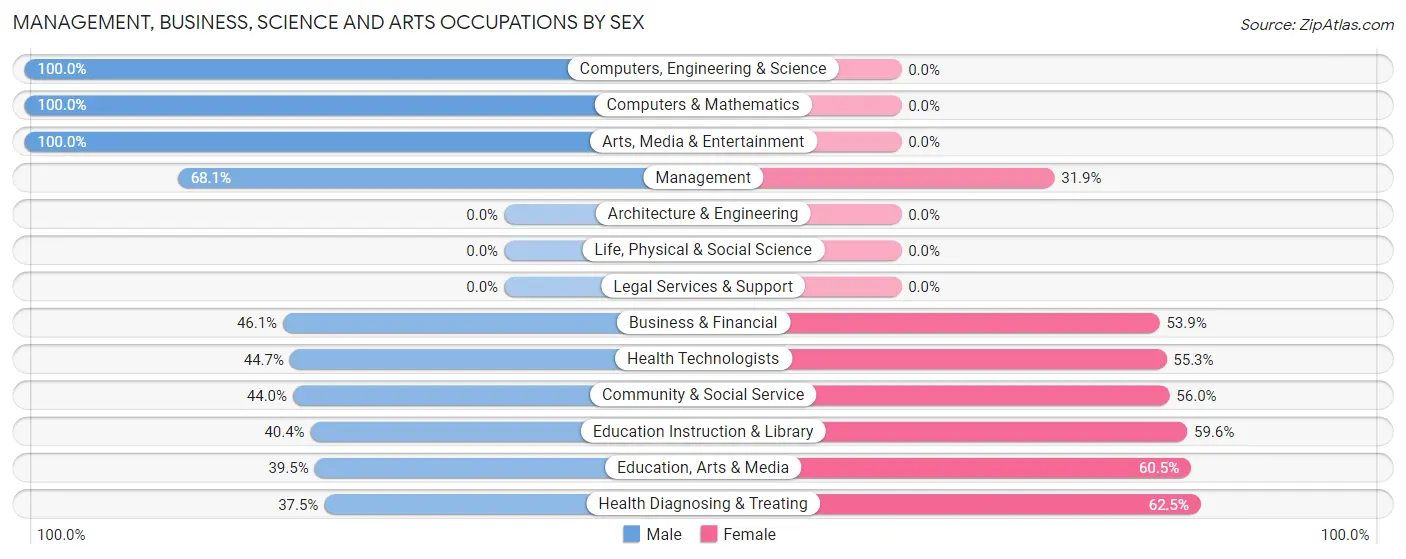
Management, Business, Science and Arts Occupations by Sex
Within the Management, Business, Science and Arts occupations in Salunga, the most male-oriented occupations are Computers, Engineering & Science (100.0%), Computers & Mathematics (100.0%), and Arts, Media & Entertainment (100.0%), while the most female-oriented occupations are Health Diagnosing & Treating (62.5%), Education, Arts & Media (60.5%), and Education Instruction & Library (59.6%).
| Occupation | Male | Female |
| Management | 98 (68.1%) | 46 (31.9%) |
| Business & Financial | 77 (46.1%) | 90 (53.9%) |
| Computers, Engineering & Science | 26 (100.0%) | 0 (0.0%) |
| Computers & Mathematics | 26 (100.0%) | 0 (0.0%) |
| Architecture & Engineering | 0 (0.0%) | 0 (0.0%) |
| Life, Physical & Social Science | 0 (0.0%) | 0 (0.0%) |
| Community & Social Service | 96 (44.0%) | 122 (56.0%) |
| Education, Arts & Media | 17 (39.5%) | 26 (60.5%) |
| Legal Services & Support | 0 (0.0%) | 0 (0.0%) |
| Education Instruction & Library | 65 (40.4%) | 96 (59.6%) |
| Arts, Media & Entertainment | 14 (100.0%) | 0 (0.0%) |
| Health Diagnosing & Treating | 63 (37.5%) | 105 (62.5%) |
| Health Technologists | 63 (44.7%) | 78 (55.3%) |
| Total (Category) | 360 (49.8%) | 363 (50.2%) |
| Total (Overall) | 796 (54.3%) | 671 (45.7%) |
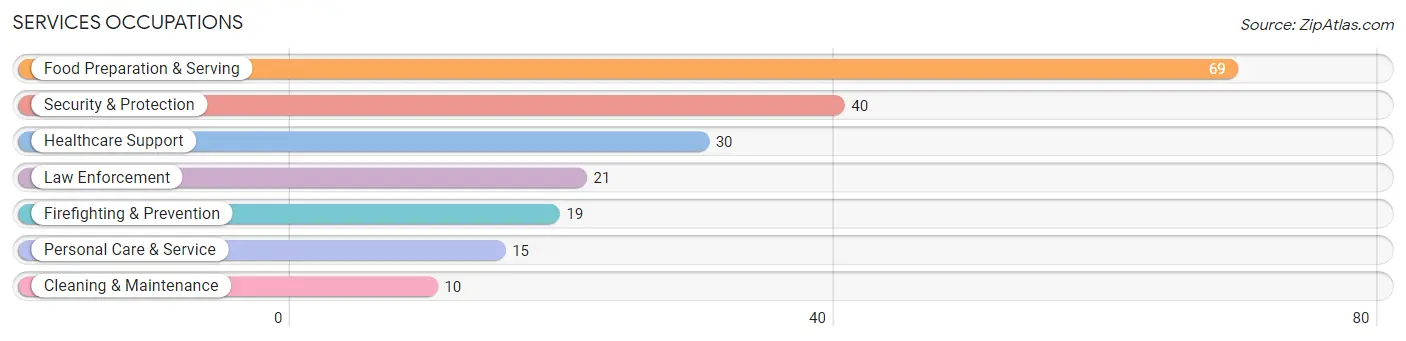
Services Occupations
The most common Services occupations in Salunga are Food Preparation & Serving (69 | 4.7%), Security & Protection (40 | 2.7%), Healthcare Support (30 | 2.0%), Law Enforcement (21 | 1.4%), and Firefighting & Prevention (19 | 1.3%).
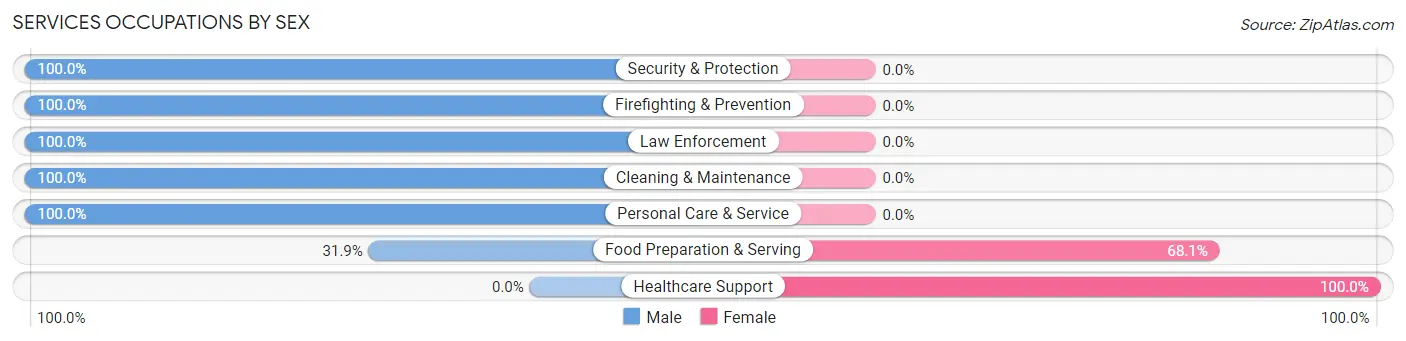
Services Occupations by Sex
Within the Services occupations in Salunga, the most male-oriented occupations are Security & Protection (100.0%), Firefighting & Prevention (100.0%), and Law Enforcement (100.0%), while the most female-oriented occupations are Healthcare Support (100.0%), and Food Preparation & Serving (68.1%).
| Occupation | Male | Female |
| Healthcare Support | 0 (0.0%) | 30 (100.0%) |
| Security & Protection | 40 (100.0%) | 0 (0.0%) |
| Firefighting & Prevention | 19 (100.0%) | 0 (0.0%) |
| Law Enforcement | 21 (100.0%) | 0 (0.0%) |
| Food Preparation & Serving | 22 (31.9%) | 47 (68.1%) |
| Cleaning & Maintenance | 10 (100.0%) | 0 (0.0%) |
| Personal Care & Service | 15 (100.0%) | 0 (0.0%) |
| Total (Category) | 87 (53.0%) | 77 (46.9%) |
| Total (Overall) | 796 (54.3%) | 671 (45.7%) |
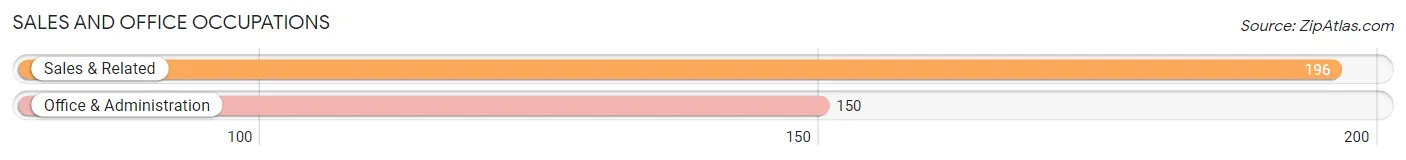
Sales and Office Occupations
The most common Sales and Office occupations in Salunga are Sales & Related (196 | 13.4%), and Office & Administration (150 | 10.2%).
Sales and Office Occupations by Sex
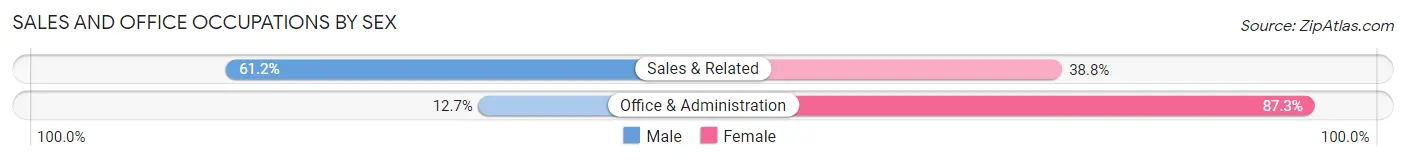
| Occupation | Male | Female |
| Sales & Related | 120 (61.2%) | 76 (38.8%) |
| Office & Administration | 19 (12.7%) | 131 (87.3%) |
| Total (Category) | 139 (40.2%) | 207 (59.8%) |
| Total (Overall) | 796 (54.3%) | 671 (45.7%) |
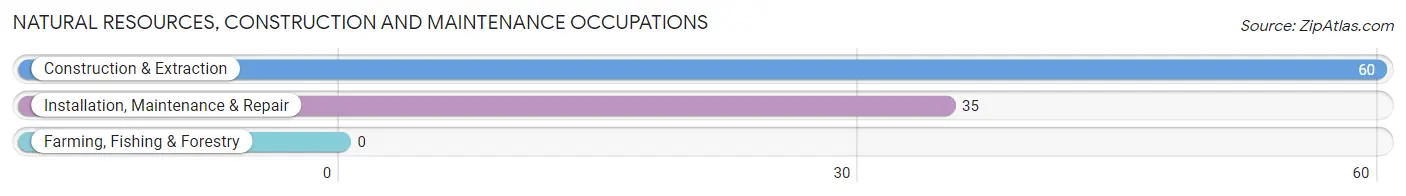
Natural Resources, Construction and Maintenance Occupations
The most common Natural Resources, Construction and Maintenance occupations in Salunga are Construction & Extraction (60 | 4.1%), and Installation, Maintenance & Repair (35 | 2.4%).
Natural Resources, Construction and Maintenance Occupations by Sex
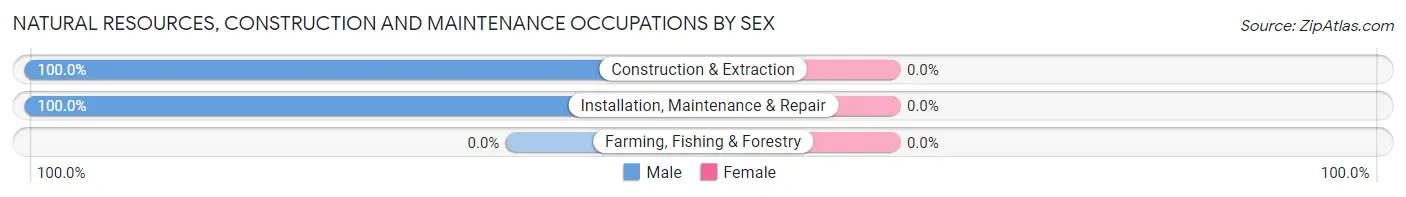
| Occupation | Male | Female |
| Farming, Fishing & Forestry | 0 (0.0%) | 0 (0.0%) |
| Construction & Extraction | 60 (100.0%) | 0 (0.0%) |
| Installation, Maintenance & Repair | 35 (100.0%) | 0 (0.0%) |
| Total (Category) | 95 (100.0%) | 0 (0.0%) |
| Total (Overall) | 796 (54.3%) | 671 (45.7%) |
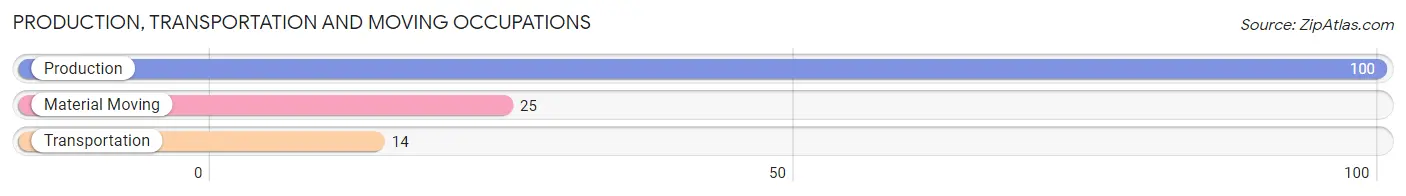
Production, Transportation and Moving Occupations
The most common Production, Transportation and Moving occupations in Salunga are Production (100 | 6.8%), Material Moving (25 | 1.7%), and Transportation (14 | 0.9%).
Production, Transportation and Moving Occupations by Sex
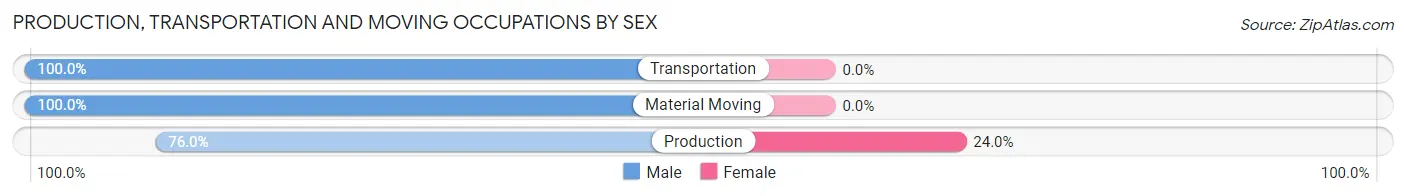
| Occupation | Male | Female |
| Production | 76 (76.0%) | 24 (24.0%) |
| Transportation | 14 (100.0%) | 0 (0.0%) |
| Material Moving | 25 (100.0%) | 0 (0.0%) |
| Total (Category) | 115 (82.7%) | 24 (17.3%) |
| Total (Overall) | 796 (54.3%) | 671 (45.7%) |
Employment Industries by Sex in Salunga
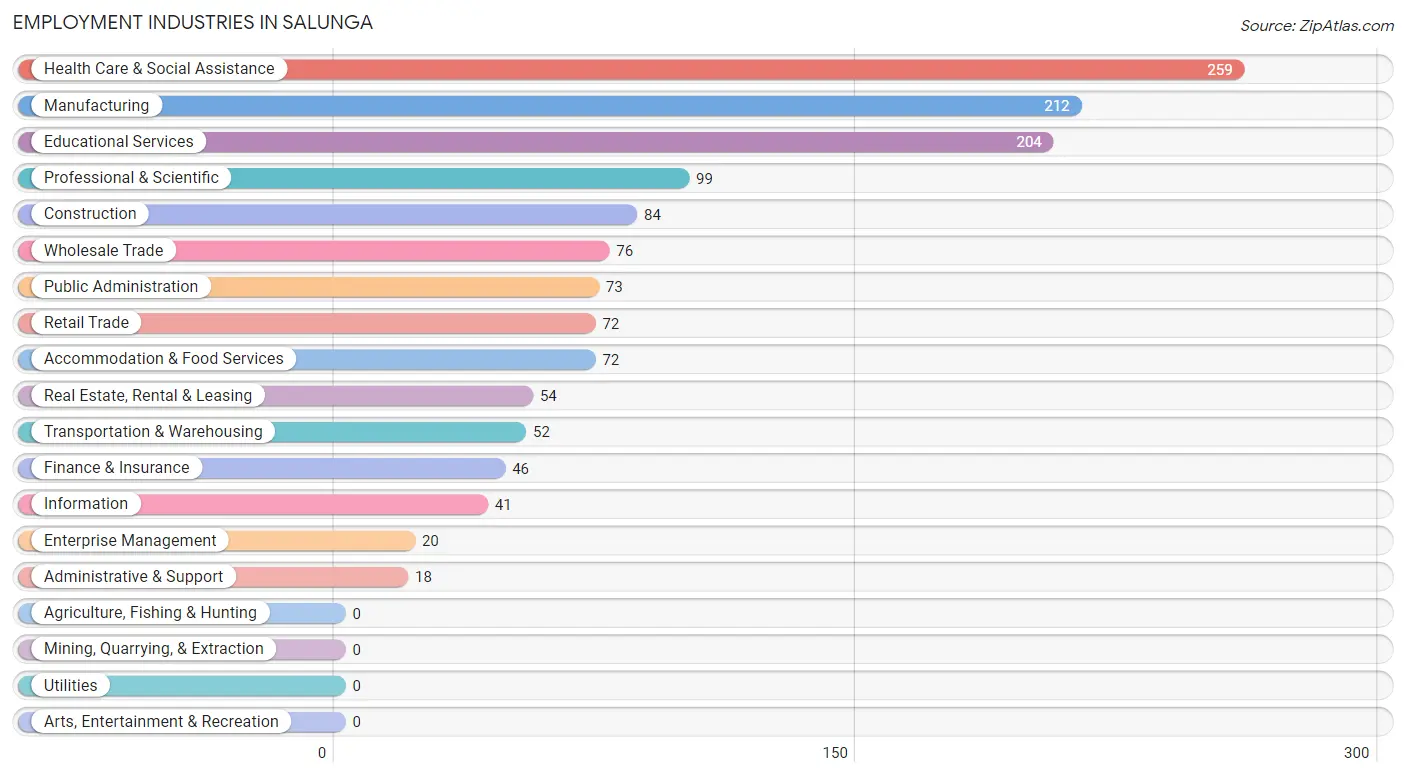
Employment Industries in Salunga
The major employment industries in Salunga include Health Care & Social Assistance (259 | 17.7%), Manufacturing (212 | 14.4%), Educational Services (204 | 13.9%), Professional & Scientific (99 | 6.8%), and Construction (84 | 5.7%).
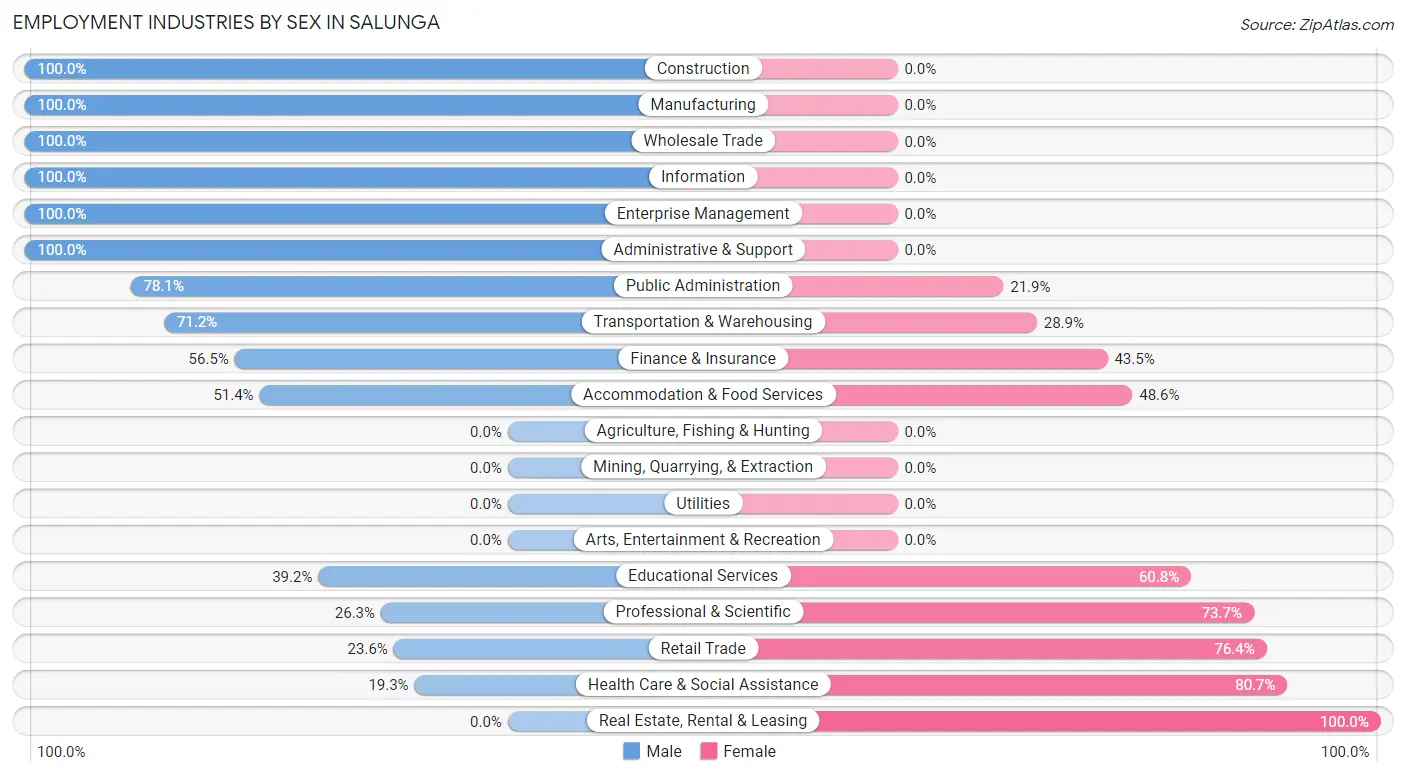
Employment Industries by Sex in Salunga
The Salunga industries that see more men than women are Construction (100.0%), Manufacturing (100.0%), and Wholesale Trade (100.0%), whereas the industries that tend to have a higher number of women are Real Estate, Rental & Leasing (100.0%), Health Care & Social Assistance (80.7%), and Retail Trade (76.4%).
| Industry | Male | Female |
| Agriculture, Fishing & Hunting | 0 (0.0%) | 0 (0.0%) |
| Mining, Quarrying, & Extraction | 0 (0.0%) | 0 (0.0%) |
| Construction | 84 (100.0%) | 0 (0.0%) |
| Manufacturing | 212 (100.0%) | 0 (0.0%) |
| Wholesale Trade | 76 (100.0%) | 0 (0.0%) |
| Retail Trade | 17 (23.6%) | 55 (76.4%) |
| Transportation & Warehousing | 37 (71.2%) | 15 (28.8%) |
| Utilities | 0 (0.0%) | 0 (0.0%) |
| Information | 41 (100.0%) | 0 (0.0%) |
| Finance & Insurance | 26 (56.5%) | 20 (43.5%) |
| Real Estate, Rental & Leasing | 0 (0.0%) | 54 (100.0%) |
| Professional & Scientific | 26 (26.3%) | 73 (73.7%) |
| Enterprise Management | 20 (100.0%) | 0 (0.0%) |
| Administrative & Support | 18 (100.0%) | 0 (0.0%) |
| Educational Services | 80 (39.2%) | 124 (60.8%) |
| Health Care & Social Assistance | 50 (19.3%) | 209 (80.7%) |
| Arts, Entertainment & Recreation | 0 (0.0%) | 0 (0.0%) |
| Accommodation & Food Services | 37 (51.4%) | 35 (48.6%) |
| Public Administration | 57 (78.1%) | 16 (21.9%) |
| Total | 796 (54.3%) | 671 (45.7%) |
Education in Salunga
School Enrollment in Salunga
The most common levels of schooling among the 616 students in Salunga are middle school (250 | 40.6%), elementary school (183 | 29.7%), and college / undergraduate (66 | 10.7%).
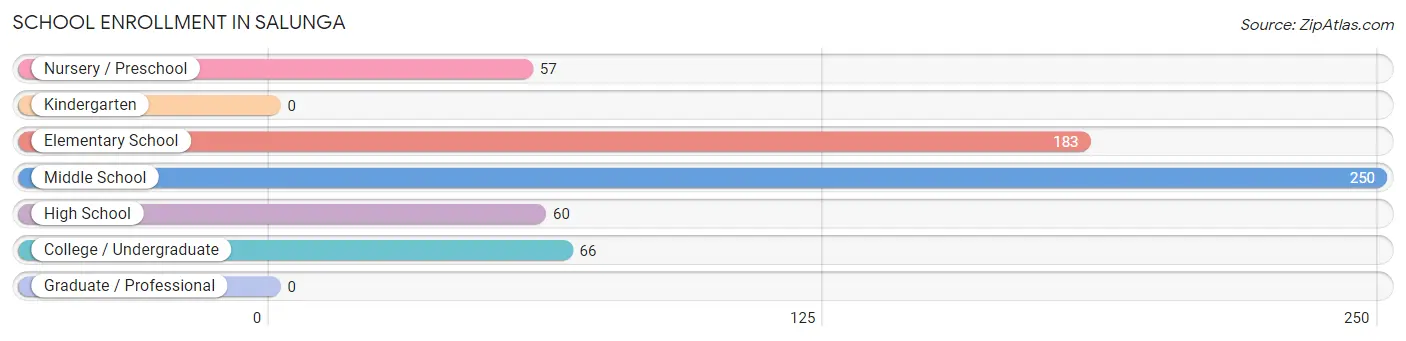
| School Level | # Students | % Students |
| Nursery / Preschool | 57 | 9.2% |
| Kindergarten | 0 | 0.0% |
| Elementary School | 183 | 29.7% |
| Middle School | 250 | 40.6% |
| High School | 60 | 9.7% |
| College / Undergraduate | 66 | 10.7% |
| Graduate / Professional | 0 | 0.0% |
| Total | 616 | 100.0% |
School Enrollment by Age by Funding Source in Salunga
Out of a total of 616 students who are enrolled in schools in Salunga, 58 (9.4%) attend a private institution, while the remaining 558 (90.6%) are enrolled in public schools. The age group of 20 to 24 year olds has the highest likelihood of being enrolled in private schools, with 30 (61.2% in the age bracket) enrolled. Conversely, the age group of 3 to 4 year olds has the lowest likelihood of being enrolled in a private school, with 29 (100.0% in the age bracket) attending a public institution.
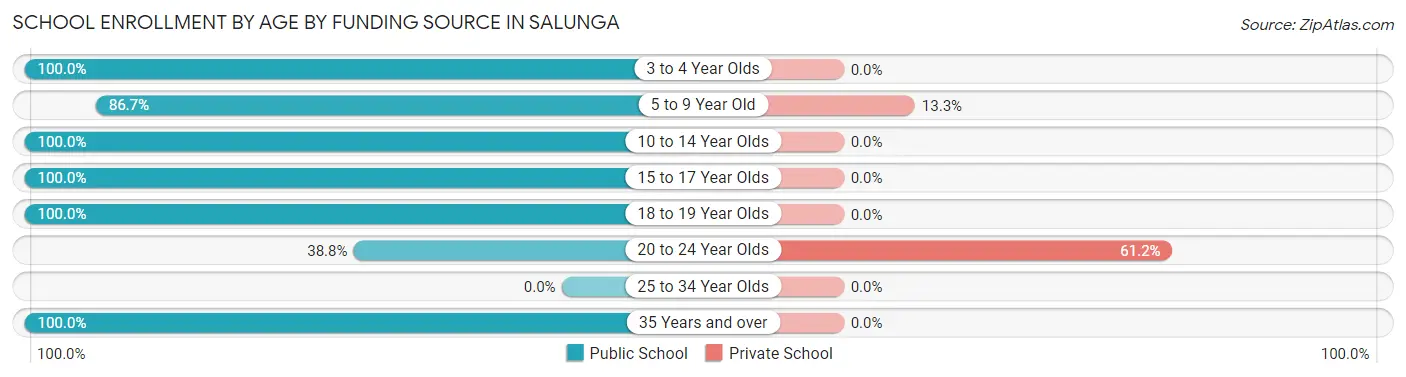
| Age Bracket | Public School | Private School |
| 3 to 4 Year Olds | 29 (100.0%) | 0 (0.0%) |
| 5 to 9 Year Old | 183 (86.7%) | 28 (13.3%) |
| 10 to 14 Year Olds | 250 (100.0%) | 0 (0.0%) |
| 15 to 17 Year Olds | 60 (100.0%) | 0 (0.0%) |
| 18 to 19 Year Olds | 15 (100.0%) | 0 (0.0%) |
| 20 to 24 Year Olds | 19 (38.8%) | 30 (61.2%) |
| 25 to 34 Year Olds | 0 (0.0%) | 0 (0.0%) |
| 35 Years and over | 2 (100.0%) | 0 (0.0%) |
| Total | 558 (90.6%) | 58 (9.4%) |
Educational Attainment by Field of Study in Salunga
Business (281 | 28.6%), education (172 | 17.5%), science & technology (115 | 11.7%), communications (106 | 10.8%), and bio, nature & agricultural (79 | 8.0%) are the most common fields of study among 983 individuals in Salunga who have obtained a bachelor's degree or higher.
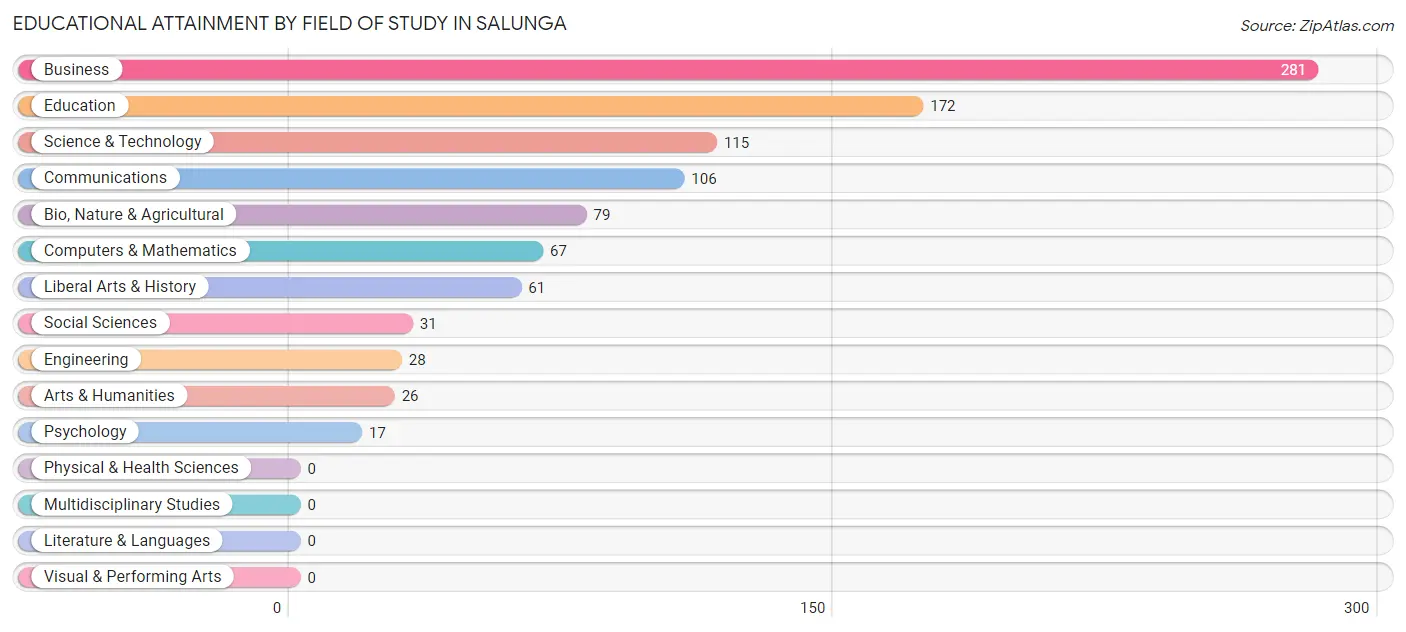
| Field of Study | # Graduates | % Graduates |
| Computers & Mathematics | 67 | 6.8% |
| Bio, Nature & Agricultural | 79 | 8.0% |
| Physical & Health Sciences | 0 | 0.0% |
| Psychology | 17 | 1.7% |
| Social Sciences | 31 | 3.2% |
| Engineering | 28 | 2.9% |
| Multidisciplinary Studies | 0 | 0.0% |
| Science & Technology | 115 | 11.7% |
| Business | 281 | 28.6% |
| Education | 172 | 17.5% |
| Literature & Languages | 0 | 0.0% |
| Liberal Arts & History | 61 | 6.2% |
| Visual & Performing Arts | 0 | 0.0% |
| Communications | 106 | 10.8% |
| Arts & Humanities | 26 | 2.6% |
| Total | 983 | 100.0% |
Transportation & Commute in Salunga
Vehicle Availability by Sex in Salunga
The most prevalent vehicle ownership categories in Salunga are males with 2 vehicles (311, accounting for 41.7%) and females with 2 vehicles (373, making up 46.4%).
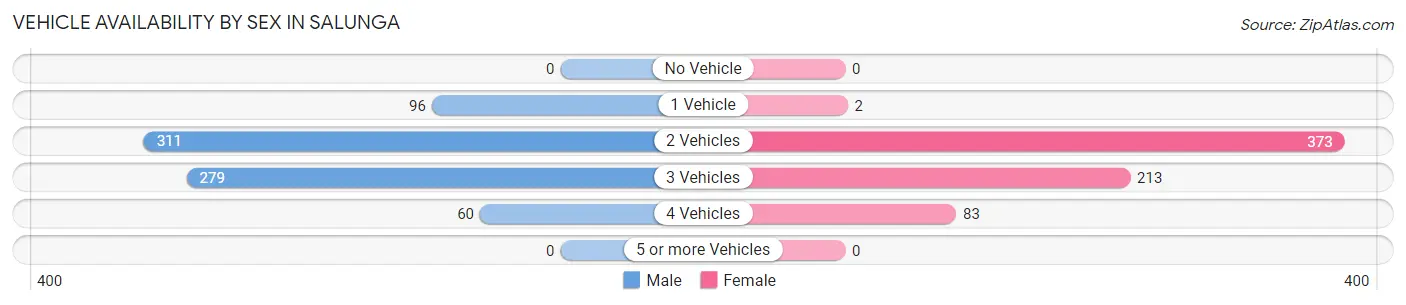
| Vehicles Available | Male | Female |
| No Vehicle | 0 (0.0%) | 0 (0.0%) |
| 1 Vehicle | 96 (12.9%) | 2 (0.3%) |
| 2 Vehicles | 311 (41.7%) | 373 (55.6%) |
| 3 Vehicles | 279 (37.4%) | 213 (31.7%) |
| 4 Vehicles | 60 (8.0%) | 83 (12.4%) |
| 5 or more Vehicles | 0 (0.0%) | 0 (0.0%) |
| Total | 746 (100.0%) | 671 (100.0%) |
Commute Time in Salunga
The most frequently occuring commute durations in Salunga are 20 to 24 minutes (287 commuters, 21.6%), 10 to 14 minutes (258 commuters, 19.4%), and 15 to 19 minutes (170 commuters, 12.8%).
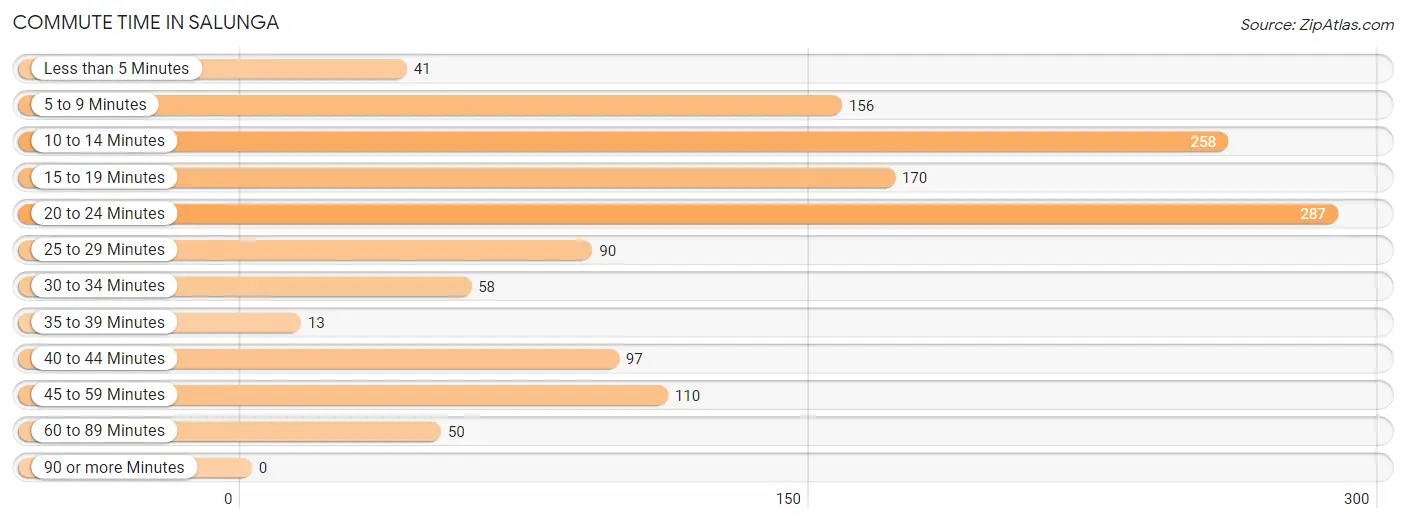
| Commute Time | # Commuters | % Commuters |
| Less than 5 Minutes | 41 | 3.1% |
| 5 to 9 Minutes | 156 | 11.7% |
| 10 to 14 Minutes | 258 | 19.4% |
| 15 to 19 Minutes | 170 | 12.8% |
| 20 to 24 Minutes | 287 | 21.6% |
| 25 to 29 Minutes | 90 | 6.8% |
| 30 to 34 Minutes | 58 | 4.4% |
| 35 to 39 Minutes | 13 | 1.0% |
| 40 to 44 Minutes | 97 | 7.3% |
| 45 to 59 Minutes | 110 | 8.3% |
| 60 to 89 Minutes | 50 | 3.8% |
| 90 or more Minutes | 0 | 0.0% |
Commute Time by Sex in Salunga
The most common commute times in Salunga are 10 to 14 minutes (133 commuters, 19.3%) for males and 20 to 24 minutes (172 commuters, 26.8%) for females.
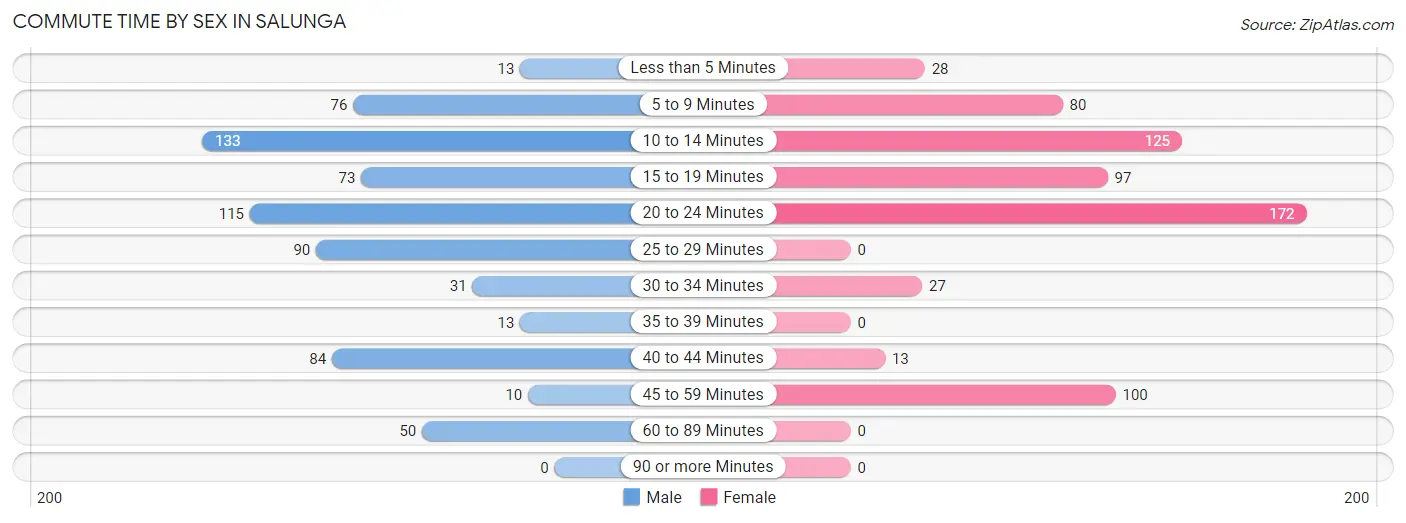
| Commute Time | Male | Female |
| Less than 5 Minutes | 13 (1.9%) | 28 (4.4%) |
| 5 to 9 Minutes | 76 (11.1%) | 80 (12.5%) |
| 10 to 14 Minutes | 133 (19.3%) | 125 (19.5%) |
| 15 to 19 Minutes | 73 (10.6%) | 97 (15.1%) |
| 20 to 24 Minutes | 115 (16.7%) | 172 (26.8%) |
| 25 to 29 Minutes | 90 (13.1%) | 0 (0.0%) |
| 30 to 34 Minutes | 31 (4.5%) | 27 (4.2%) |
| 35 to 39 Minutes | 13 (1.9%) | 0 (0.0%) |
| 40 to 44 Minutes | 84 (12.2%) | 13 (2.0%) |
| 45 to 59 Minutes | 10 (1.5%) | 100 (15.6%) |
| 60 to 89 Minutes | 50 (7.3%) | 0 (0.0%) |
| 90 or more Minutes | 0 (0.0%) | 0 (0.0%) |
Time of Departure to Work by Sex in Salunga
The most frequent times of departure to work in Salunga are 5:00 AM to 5:29 AM (155, 22.5%) for males and 7:00 AM to 7:29 AM (146, 22.7%) for females.
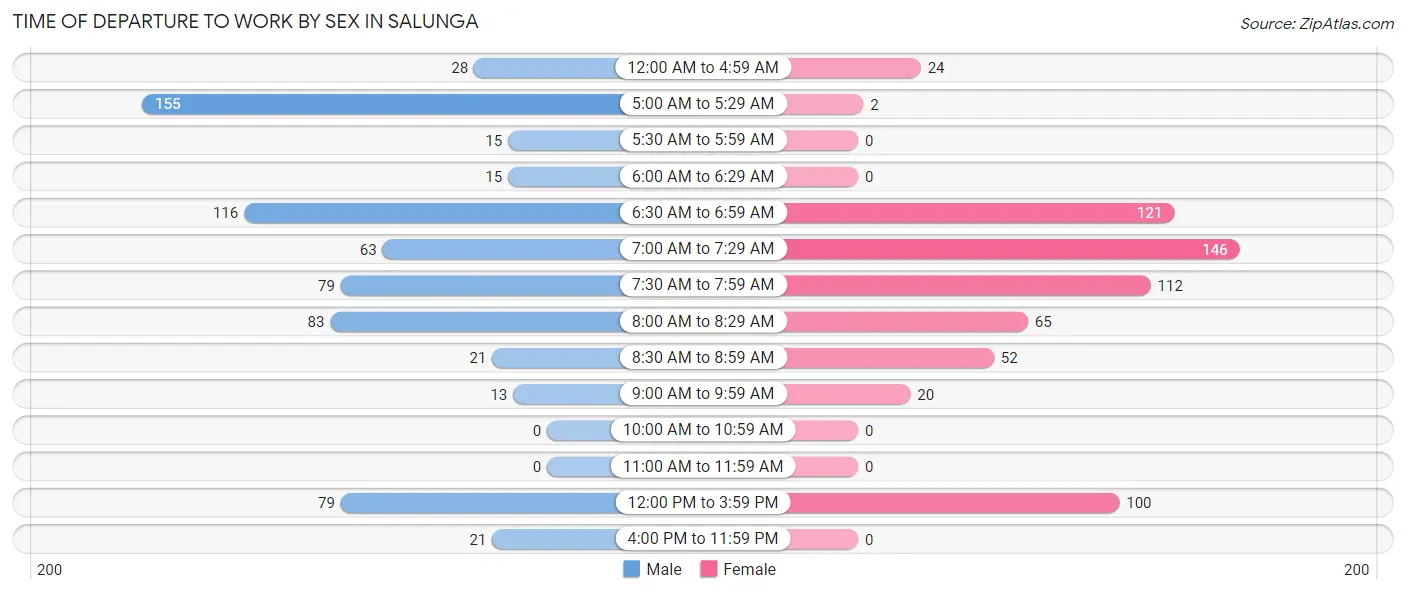
| Time of Departure | Male | Female |
| 12:00 AM to 4:59 AM | 28 (4.1%) | 24 (3.7%) |
| 5:00 AM to 5:29 AM | 155 (22.5%) | 2 (0.3%) |
| 5:30 AM to 5:59 AM | 15 (2.2%) | 0 (0.0%) |
| 6:00 AM to 6:29 AM | 15 (2.2%) | 0 (0.0%) |
| 6:30 AM to 6:59 AM | 116 (16.9%) | 121 (18.9%) |
| 7:00 AM to 7:29 AM | 63 (9.2%) | 146 (22.7%) |
| 7:30 AM to 7:59 AM | 79 (11.5%) | 112 (17.4%) |
| 8:00 AM to 8:29 AM | 83 (12.1%) | 65 (10.1%) |
| 8:30 AM to 8:59 AM | 21 (3.0%) | 52 (8.1%) |
| 9:00 AM to 9:59 AM | 13 (1.9%) | 20 (3.1%) |
| 10:00 AM to 10:59 AM | 0 (0.0%) | 0 (0.0%) |
| 11:00 AM to 11:59 AM | 0 (0.0%) | 0 (0.0%) |
| 12:00 PM to 3:59 PM | 79 (11.5%) | 100 (15.6%) |
| 4:00 PM to 11:59 PM | 21 (3.0%) | 0 (0.0%) |
| Total | 688 (100.0%) | 642 (100.0%) |
Housing Occupancy in Salunga
Occupancy by Ownership in Salunga
Of the total 1,312 dwellings in Salunga, owner-occupied units account for 1,080 (82.3%), while renter-occupied units make up 232 (17.7%).
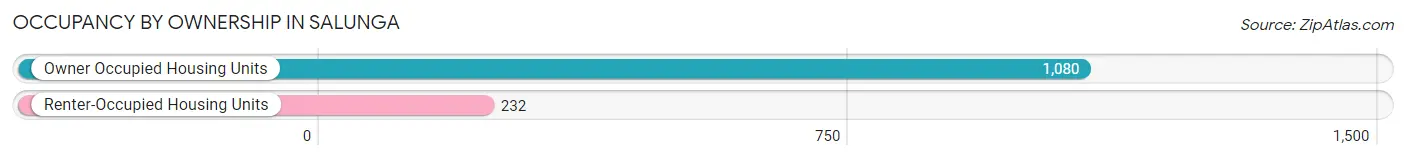
| Occupancy | # Housing Units | % Housing Units |
| Owner Occupied Housing Units | 1,080 | 82.3% |
| Renter-Occupied Housing Units | 232 | 17.7% |
| Total Occupied Housing Units | 1,312 | 100.0% |
Occupancy by Household Size in Salunga
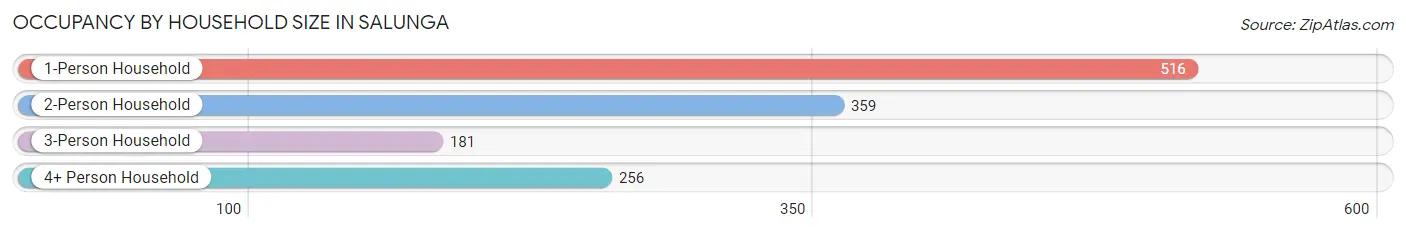
| Household Size | # Housing Units | % Housing Units |
| 1-Person Household | 516 | 39.3% |
| 2-Person Household | 359 | 27.4% |
| 3-Person Household | 181 | 13.8% |
| 4+ Person Household | 256 | 19.5% |
| Total Housing Units | 1,312 | 100.0% |
Occupancy by Ownership by Household Size in Salunga
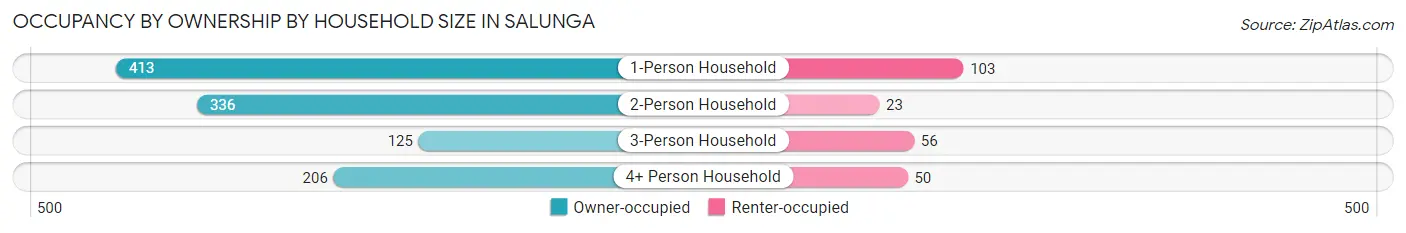
| Household Size | Owner-occupied | Renter-occupied |
| 1-Person Household | 413 (80.0%) | 103 (20.0%) |
| 2-Person Household | 336 (93.6%) | 23 (6.4%) |
| 3-Person Household | 125 (69.1%) | 56 (30.9%) |
| 4+ Person Household | 206 (80.5%) | 50 (19.5%) |
| Total Housing Units | 1,080 (82.3%) | 232 (17.7%) |
Occupancy by Educational Attainment in Salunga
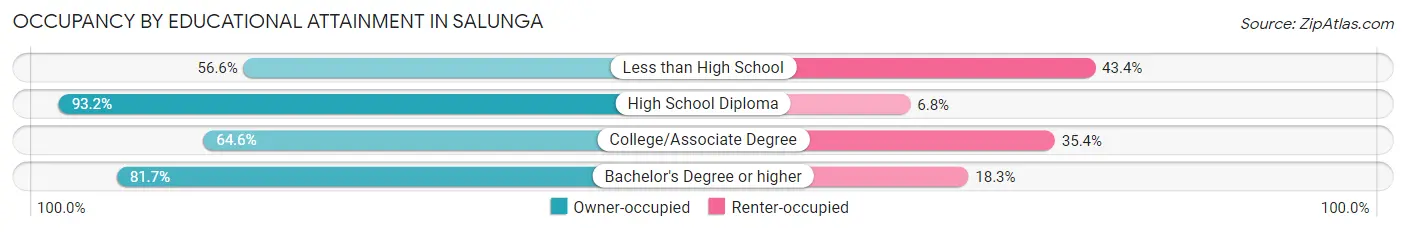
| Household Size | Owner-occupied | Renter-occupied |
| Less than High School | 86 (56.6%) | 66 (43.4%) |
| High School Diploma | 550 (93.2%) | 40 (6.8%) |
| College/Associate Degree | 82 (64.6%) | 45 (35.4%) |
| Bachelor's Degree or higher | 362 (81.7%) | 81 (18.3%) |
Occupancy by Age of Householder in Salunga
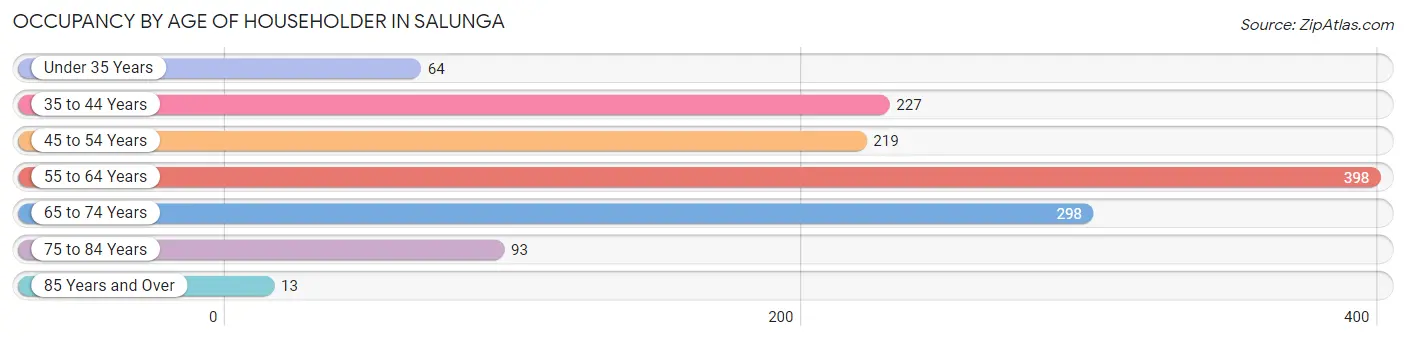
| Age Bracket | # Households | % Households |
| Under 35 Years | 64 | 4.9% |
| 35 to 44 Years | 227 | 17.3% |
| 45 to 54 Years | 219 | 16.7% |
| 55 to 64 Years | 398 | 30.3% |
| 65 to 74 Years | 298 | 22.7% |
| 75 to 84 Years | 93 | 7.1% |
| 85 Years and Over | 13 | 1.0% |
| Total | 1,312 | 100.0% |
Housing Finances in Salunga
Median Income by Occupancy in Salunga
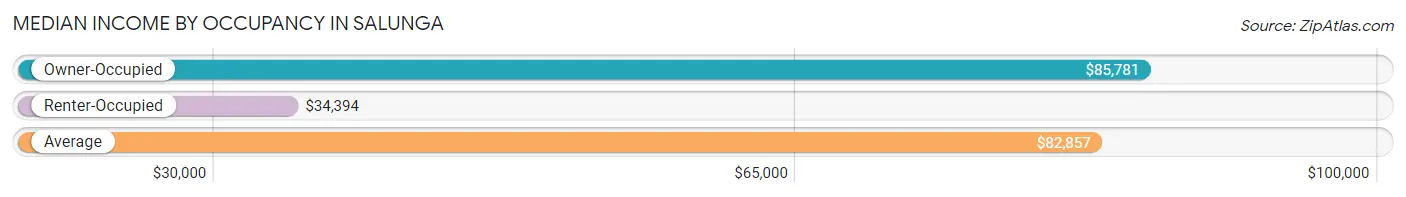
| Occupancy Type | # Households | Median Income |
| Owner-Occupied | 1,080 (82.3%) | $85,781 |
| Renter-Occupied | 232 (17.7%) | $34,394 |
| Average | 1,312 (100.0%) | $82,857 |
Occupancy by Householder Income Bracket in Salunga
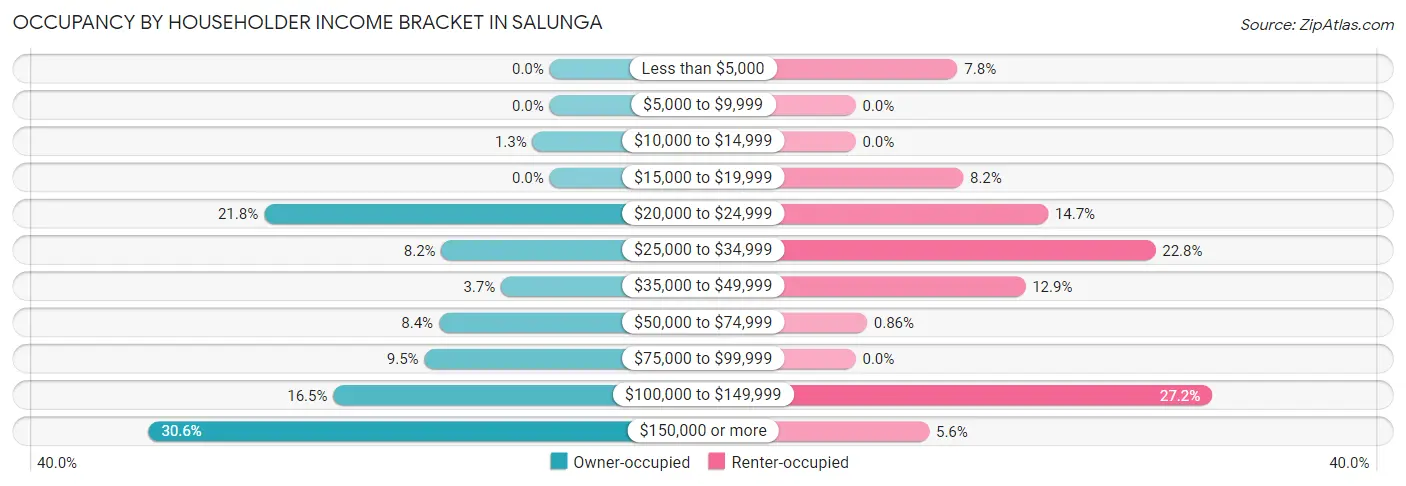
| Income Bracket | Owner-occupied | Renter-occupied |
| Less than $5,000 | 0 (0.0%) | 18 (7.8%) |
| $5,000 to $9,999 | 0 (0.0%) | 0 (0.0%) |
| $10,000 to $14,999 | 14 (1.3%) | 0 (0.0%) |
| $15,000 to $19,999 | 0 (0.0%) | 19 (8.2%) |
| $20,000 to $24,999 | 235 (21.8%) | 34 (14.7%) |
| $25,000 to $34,999 | 89 (8.2%) | 53 (22.8%) |
| $35,000 to $49,999 | 40 (3.7%) | 30 (12.9%) |
| $50,000 to $74,999 | 91 (8.4%) | 2 (0.9%) |
| $75,000 to $99,999 | 103 (9.5%) | 0 (0.0%) |
| $100,000 to $149,999 | 178 (16.5%) | 63 (27.2%) |
| $150,000 or more | 330 (30.6%) | 13 (5.6%) |
| Total | 1,080 (100.0%) | 232 (100.0%) |
Monthly Housing Cost Tiers in Salunga
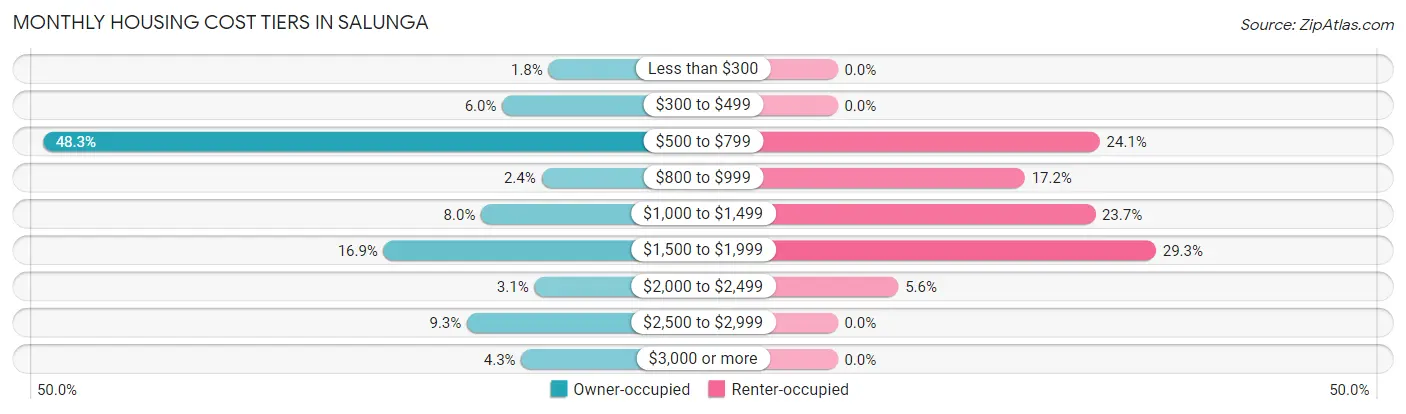
| Monthly Cost | Owner-occupied | Renter-occupied |
| Less than $300 | 19 (1.8%) | 0 (0.0%) |
| $300 to $499 | 65 (6.0%) | 0 (0.0%) |
| $500 to $799 | 522 (48.3%) | 56 (24.1%) |
| $800 to $999 | 26 (2.4%) | 40 (17.2%) |
| $1,000 to $1,499 | 86 (8.0%) | 55 (23.7%) |
| $1,500 to $1,999 | 183 (16.9%) | 68 (29.3%) |
| $2,000 to $2,499 | 33 (3.1%) | 13 (5.6%) |
| $2,500 to $2,999 | 100 (9.3%) | 0 (0.0%) |
| $3,000 or more | 46 (4.3%) | 0 (0.0%) |
| Total | 1,080 (100.0%) | 232 (100.0%) |
Physical Housing Characteristics in Salunga
Housing Structures in Salunga
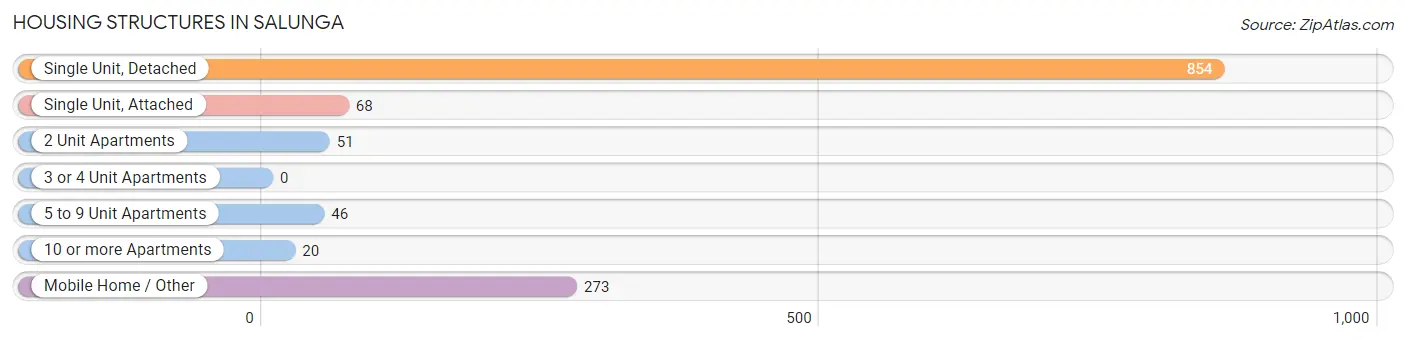
| Structure Type | # Housing Units | % Housing Units |
| Single Unit, Detached | 854 | 65.1% |
| Single Unit, Attached | 68 | 5.2% |
| 2 Unit Apartments | 51 | 3.9% |
| 3 or 4 Unit Apartments | 0 | 0.0% |
| 5 to 9 Unit Apartments | 46 | 3.5% |
| 10 or more Apartments | 20 | 1.5% |
| Mobile Home / Other | 273 | 20.8% |
| Total | 1,312 | 100.0% |
Housing Structures by Occupancy in Salunga
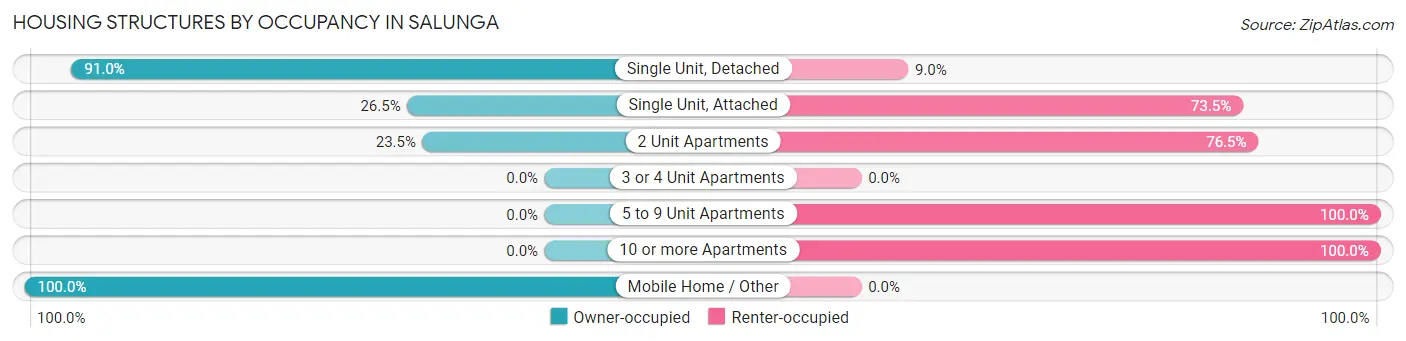
| Structure Type | Owner-occupied | Renter-occupied |
| Single Unit, Detached | 777 (91.0%) | 77 (9.0%) |
| Single Unit, Attached | 18 (26.5%) | 50 (73.5%) |
| 2 Unit Apartments | 12 (23.5%) | 39 (76.5%) |
| 3 or 4 Unit Apartments | 0 (0.0%) | 0 (0.0%) |
| 5 to 9 Unit Apartments | 0 (0.0%) | 46 (100.0%) |
| 10 or more Apartments | 0 (0.0%) | 20 (100.0%) |
| Mobile Home / Other | 273 (100.0%) | 0 (0.0%) |
| Total | 1,080 (82.3%) | 232 (17.7%) |
Housing Structures by Number of Rooms in Salunga
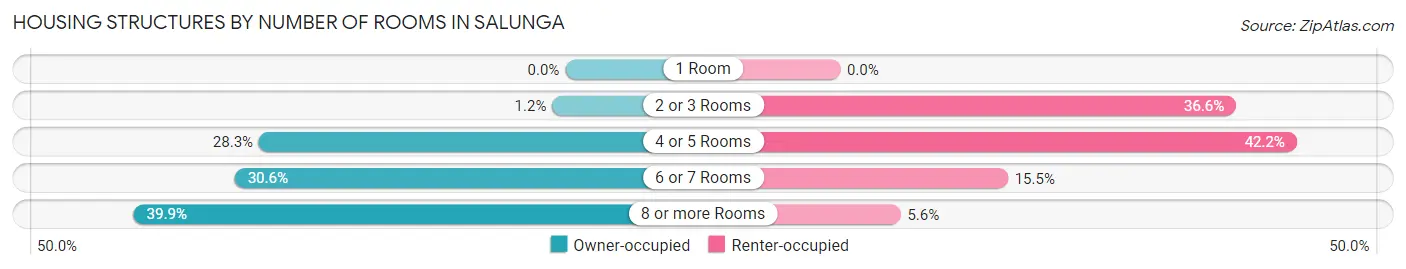
| Number of Rooms | Owner-occupied | Renter-occupied |
| 1 Room | 0 (0.0%) | 0 (0.0%) |
| 2 or 3 Rooms | 13 (1.2%) | 85 (36.6%) |
| 4 or 5 Rooms | 306 (28.3%) | 98 (42.2%) |
| 6 or 7 Rooms | 330 (30.6%) | 36 (15.5%) |
| 8 or more Rooms | 431 (39.9%) | 13 (5.6%) |
| Total | 1,080 (100.0%) | 232 (100.0%) |
Housing Structure by Heating Type in Salunga
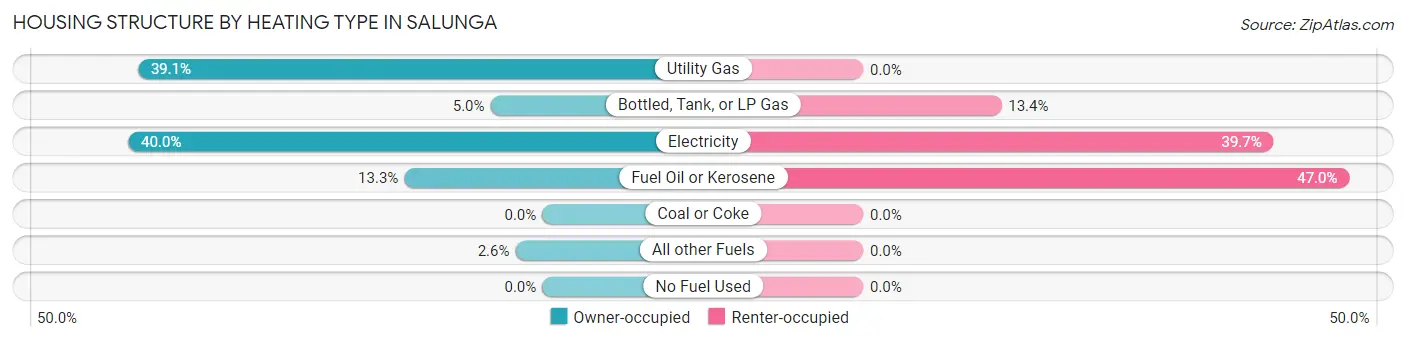
| Heating Type | Owner-occupied | Renter-occupied |
| Utility Gas | 422 (39.1%) | 0 (0.0%) |
| Bottled, Tank, or LP Gas | 54 (5.0%) | 31 (13.4%) |
| Electricity | 432 (40.0%) | 92 (39.7%) |
| Fuel Oil or Kerosene | 144 (13.3%) | 109 (47.0%) |
| Coal or Coke | 0 (0.0%) | 0 (0.0%) |
| All other Fuels | 28 (2.6%) | 0 (0.0%) |
| No Fuel Used | 0 (0.0%) | 0 (0.0%) |
| Total | 1,080 (100.0%) | 232 (100.0%) |
Household Vehicle Usage in Salunga
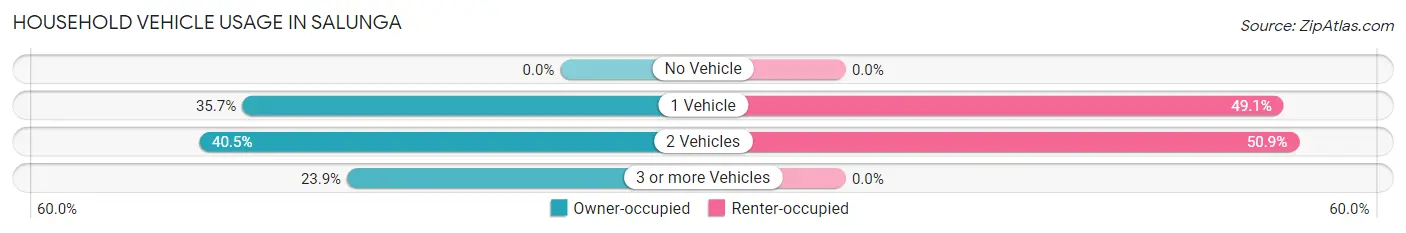
| Vehicles per Household | Owner-occupied | Renter-occupied |
| No Vehicle | 0 (0.0%) | 0 (0.0%) |
| 1 Vehicle | 385 (35.6%) | 114 (49.1%) |
| 2 Vehicles | 437 (40.5%) | 118 (50.9%) |
| 3 or more Vehicles | 258 (23.9%) | 0 (0.0%) |
| Total | 1,080 (100.0%) | 232 (100.0%) |
Real Estate & Mortgages in Salunga
Real Estate and Mortgage Overview in Salunga
| Characteristic | Without Mortgage | With Mortgage |
| Housing Units | 624 | 456 |
| Median Property Value | - | - |
| Median Household Income | - | - |
| Monthly Housing Costs | $573 | $46 |
| Real Estate Taxes | - | - |
Property Value by Mortgage Status in Salunga
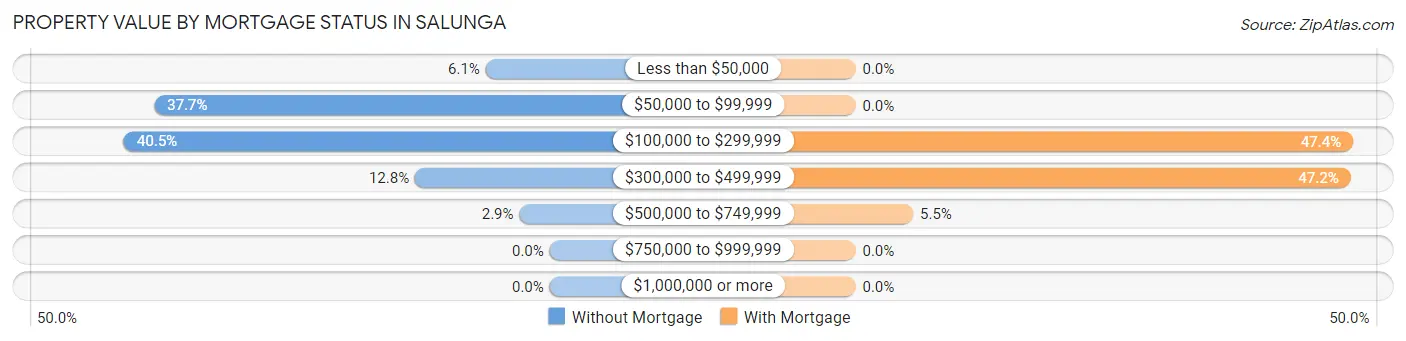
| Property Value | Without Mortgage | With Mortgage |
| Less than $50,000 | 38 (6.1%) | 0 (0.0%) |
| $50,000 to $99,999 | 235 (37.7%) | 0 (0.0%) |
| $100,000 to $299,999 | 253 (40.5%) | 216 (47.4%) |
| $300,000 to $499,999 | 80 (12.8%) | 215 (47.1%) |
| $500,000 to $749,999 | 18 (2.9%) | 25 (5.5%) |
| $750,000 to $999,999 | 0 (0.0%) | 0 (0.0%) |
| $1,000,000 or more | 0 (0.0%) | 0 (0.0%) |
| Total | 624 (100.0%) | 456 (100.0%) |
Household Income by Mortgage Status in Salunga
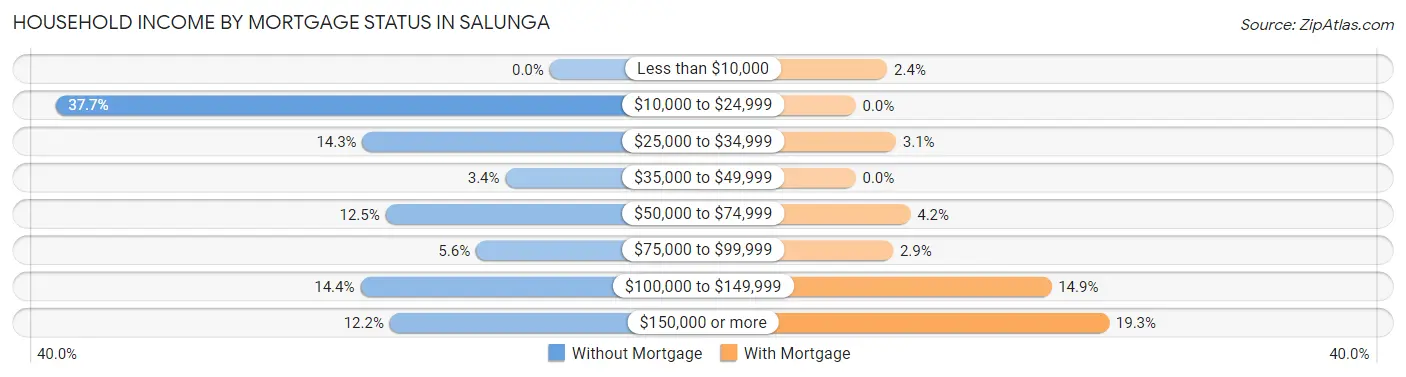
| Household Income | Without Mortgage | With Mortgage |
| Less than $10,000 | 0 (0.0%) | 11 (2.4%) |
| $10,000 to $24,999 | 235 (37.7%) | 0 (0.0%) |
| $25,000 to $34,999 | 89 (14.3%) | 14 (3.1%) |
| $35,000 to $49,999 | 21 (3.4%) | 0 (0.0%) |
| $50,000 to $74,999 | 78 (12.5%) | 19 (4.2%) |
| $75,000 to $99,999 | 35 (5.6%) | 13 (2.9%) |
| $100,000 to $149,999 | 90 (14.4%) | 68 (14.9%) |
| $150,000 or more | 76 (12.2%) | 88 (19.3%) |
| Total | 624 (100.0%) | 456 (100.0%) |
Property Value to Household Income Ratio in Salunga
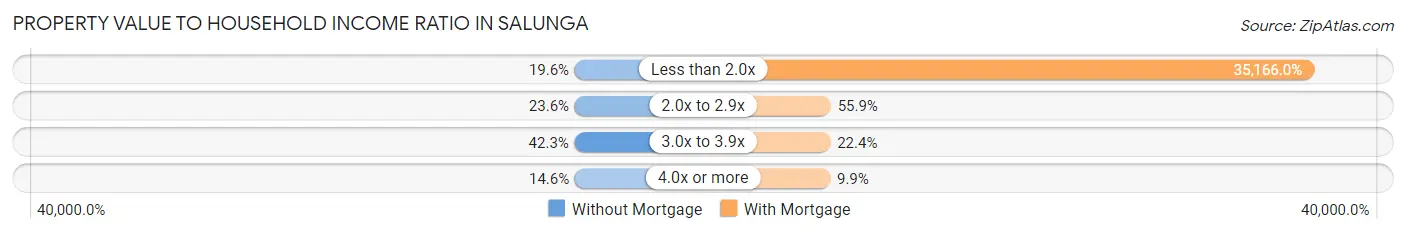
| Value-to-Income Ratio | Without Mortgage | With Mortgage |
| Less than 2.0x | 122 (19.6%) | 160,357 (35,166.0%) |
| 2.0x to 2.9x | 147 (23.6%) | 255 (55.9%) |
| 3.0x to 3.9x | 264 (42.3%) | 102 (22.4%) |
| 4.0x or more | 91 (14.6%) | 45 (9.9%) |
| Total | 624 (100.0%) | 456 (100.0%) |
Real Estate Taxes by Mortgage Status in Salunga
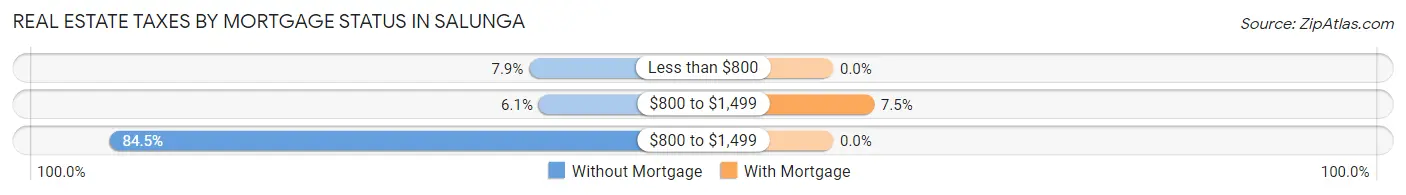
| Property Taxes | Without Mortgage | With Mortgage |
| Less than $800 | 49 (7.9%) | 0 (0.0%) |
| $800 to $1,499 | 38 (6.1%) | 34 (7.5%) |
| $800 to $1,499 | 527 (84.5%) | 0 (0.0%) |
| Total | 624 (100.0%) | 456 (100.0%) |
Health & Disability in Salunga
Health Insurance Coverage by Age in Salunga
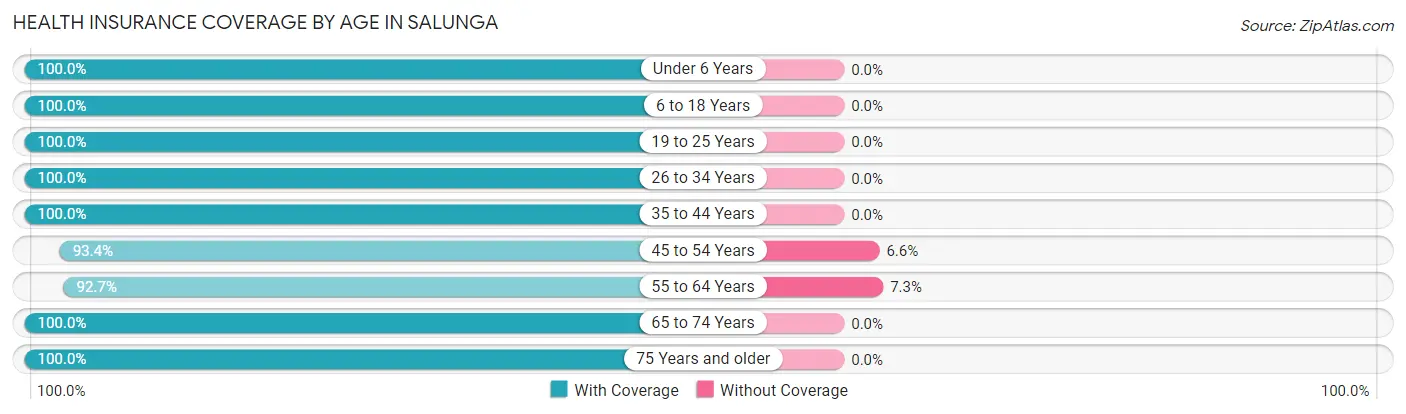
| Age Bracket | With Coverage | Without Coverage |
| Under 6 Years | 127 (100.0%) | 0 (0.0%) |
| 6 to 18 Years | 508 (100.0%) | 0 (0.0%) |
| 19 to 25 Years | 143 (100.0%) | 0 (0.0%) |
| 26 to 34 Years | 249 (100.0%) | 0 (0.0%) |
| 35 to 44 Years | 416 (100.0%) | 0 (0.0%) |
| 45 to 54 Years | 484 (93.4%) | 34 (6.6%) |
| 55 to 64 Years | 498 (92.7%) | 39 (7.3%) |
| 65 to 74 Years | 462 (100.0%) | 0 (0.0%) |
| 75 Years and older | 154 (100.0%) | 0 (0.0%) |
| Total | 3,041 (97.7%) | 73 (2.3%) |
Health Insurance Coverage by Citizenship Status in Salunga
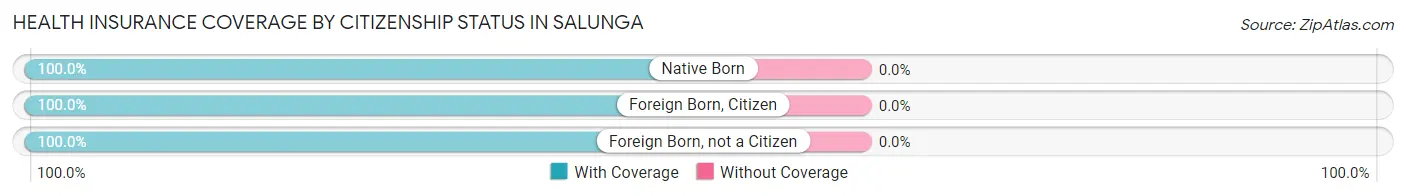
| Citizenship Status | With Coverage | Without Coverage |
| Native Born | 127 (100.0%) | 0 (0.0%) |
| Foreign Born, Citizen | 508 (100.0%) | 0 (0.0%) |
| Foreign Born, not a Citizen | 143 (100.0%) | 0 (0.0%) |
Health Insurance Coverage by Household Income in Salunga
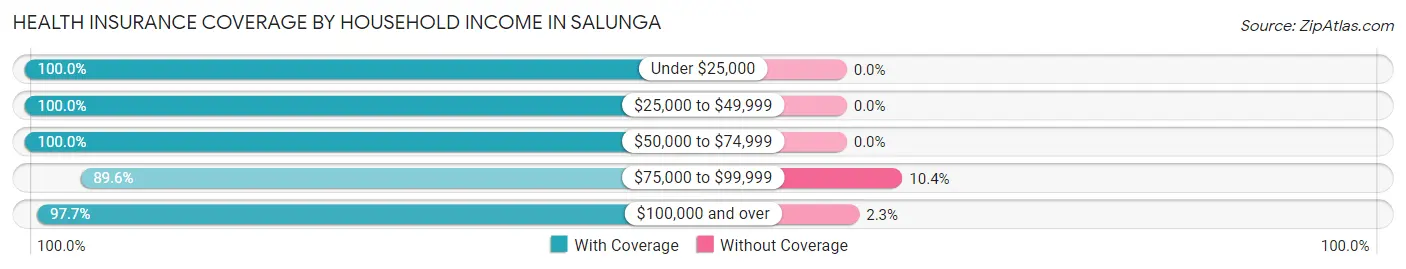
| Household Income | With Coverage | Without Coverage |
| Under $25,000 | 320 (100.0%) | 0 (0.0%) |
| $25,000 to $49,999 | 331 (100.0%) | 0 (0.0%) |
| $50,000 to $74,999 | 234 (100.0%) | 0 (0.0%) |
| $75,000 to $99,999 | 232 (89.6%) | 27 (10.4%) |
| $100,000 and over | 1,924 (97.7%) | 46 (2.3%) |
Public vs Private Health Insurance Coverage by Age in Salunga
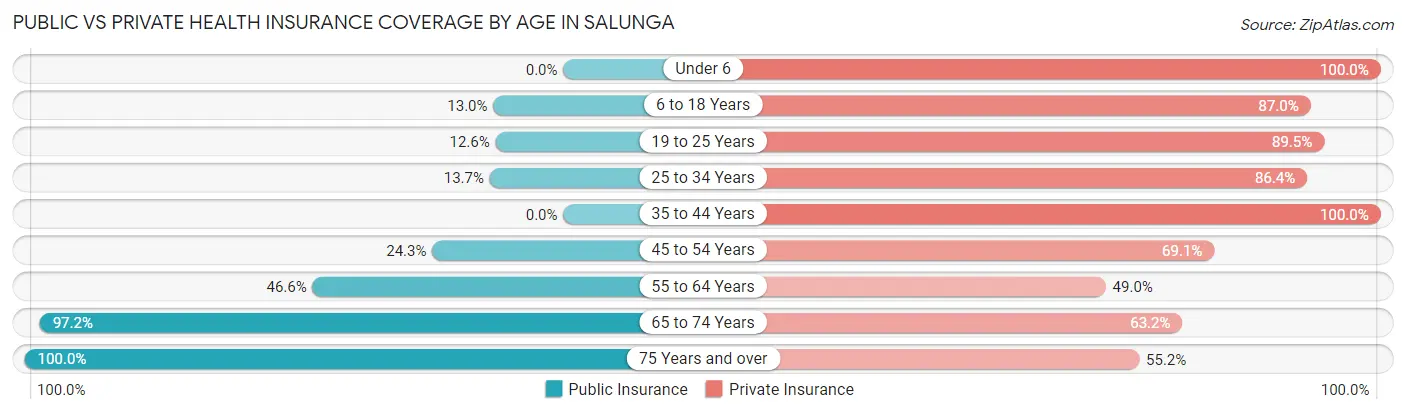
| Age Bracket | Public Insurance | Private Insurance |
| Under 6 | 0 (0.0%) | 127 (100.0%) |
| 6 to 18 Years | 66 (13.0%) | 442 (87.0%) |
| 19 to 25 Years | 18 (12.6%) | 128 (89.5%) |
| 25 to 34 Years | 34 (13.7%) | 215 (86.4%) |
| 35 to 44 Years | 0 (0.0%) | 416 (100.0%) |
| 45 to 54 Years | 126 (24.3%) | 358 (69.1%) |
| 55 to 64 Years | 250 (46.6%) | 263 (49.0%) |
| 65 to 74 Years | 449 (97.2%) | 292 (63.2%) |
| 75 Years and over | 154 (100.0%) | 85 (55.2%) |
| Total | 1,097 (35.2%) | 2,326 (74.7%) |
Disability Status by Sex by Age in Salunga
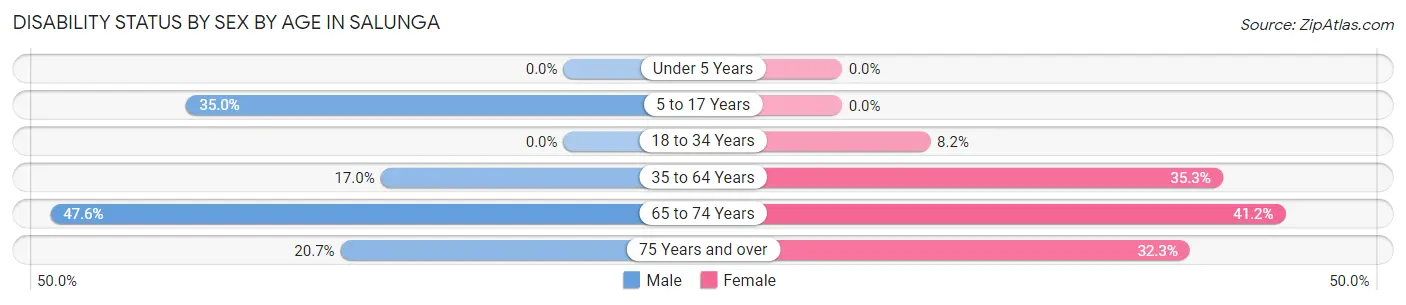
| Age Bracket | Male | Female |
| Under 5 Years | 0 (0.0%) | 0 (0.0%) |
| 5 to 17 Years | 78 (35.0%) | 0 (0.0%) |
| 18 to 34 Years | 0 (0.0%) | 15 (8.2%) |
| 35 to 64 Years | 120 (17.0%) | 270 (35.3%) |
| 65 to 74 Years | 80 (47.6%) | 121 (41.2%) |
| 75 Years and over | 12 (20.7%) | 31 (32.3%) |
Disability Class by Sex by Age in Salunga
Disability Class: Hearing Difficulty
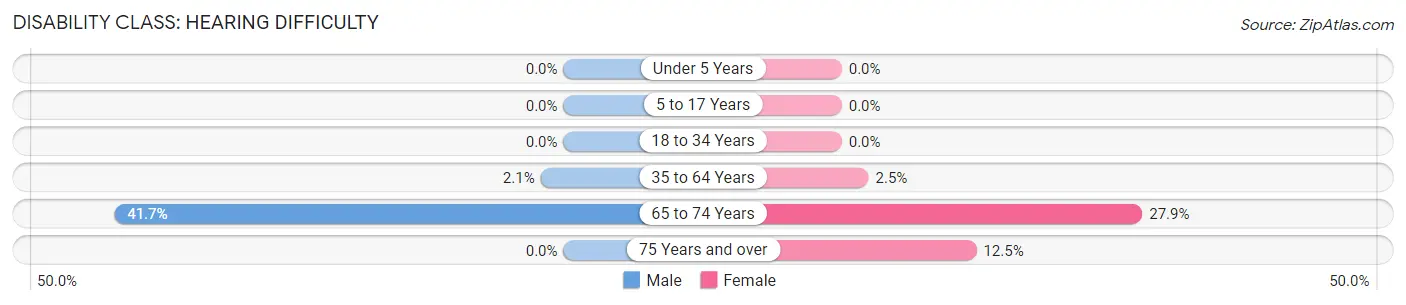
| Age Bracket | Male | Female |
| Under 5 Years | 0 (0.0%) | 0 (0.0%) |
| 5 to 17 Years | 0 (0.0%) | 0 (0.0%) |
| 18 to 34 Years | 0 (0.0%) | 0 (0.0%) |
| 35 to 64 Years | 15 (2.1%) | 19 (2.5%) |
| 65 to 74 Years | 70 (41.7%) | 82 (27.9%) |
| 75 Years and over | 0 (0.0%) | 12 (12.5%) |
Disability Class: Vision Difficulty
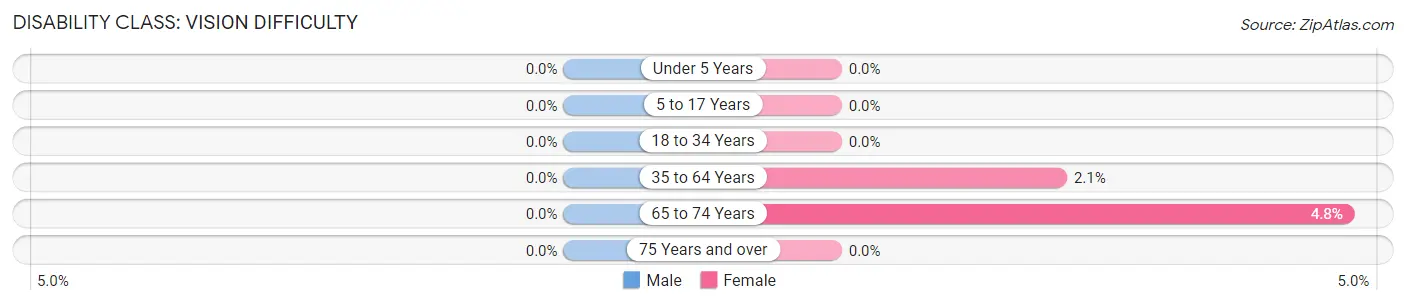
| Age Bracket | Male | Female |
| Under 5 Years | 0 (0.0%) | 0 (0.0%) |
| 5 to 17 Years | 0 (0.0%) | 0 (0.0%) |
| 18 to 34 Years | 0 (0.0%) | 0 (0.0%) |
| 35 to 64 Years | 0 (0.0%) | 16 (2.1%) |
| 65 to 74 Years | 0 (0.0%) | 14 (4.8%) |
| 75 Years and over | 0 (0.0%) | 0 (0.0%) |
Disability Class: Cognitive Difficulty
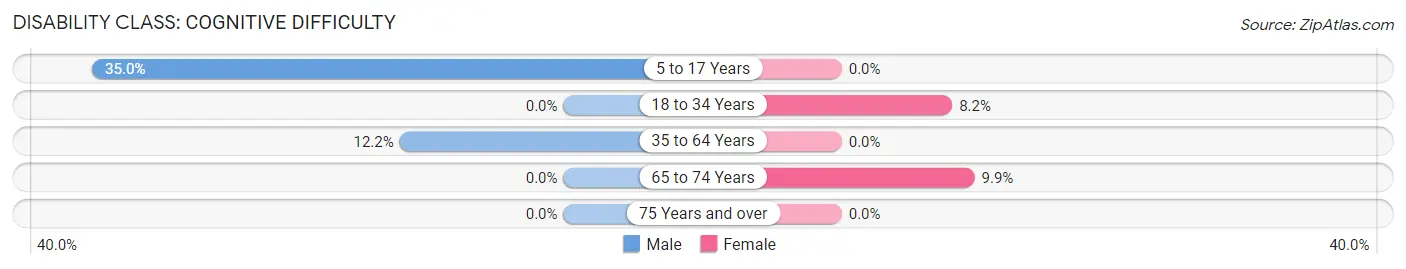
| Age Bracket | Male | Female |
| 5 to 17 Years | 78 (35.0%) | 0 (0.0%) |
| 18 to 34 Years | 0 (0.0%) | 15 (8.2%) |
| 35 to 64 Years | 86 (12.2%) | 0 (0.0%) |
| 65 to 74 Years | 0 (0.0%) | 29 (9.9%) |
| 75 Years and over | 0 (0.0%) | 0 (0.0%) |
Disability Class: Ambulatory Difficulty
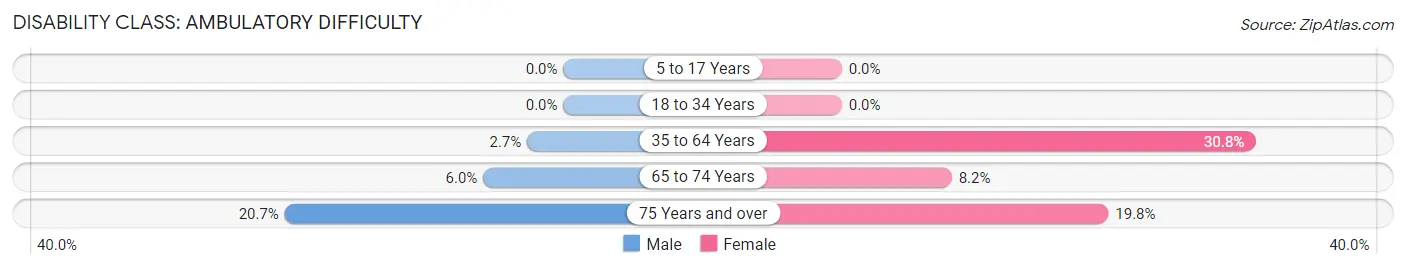
| Age Bracket | Male | Female |
| 5 to 17 Years | 0 (0.0%) | 0 (0.0%) |
| 18 to 34 Years | 0 (0.0%) | 0 (0.0%) |
| 35 to 64 Years | 19 (2.7%) | 235 (30.8%) |
| 65 to 74 Years | 10 (5.9%) | 24 (8.2%) |
| 75 Years and over | 12 (20.7%) | 19 (19.8%) |
Disability Class: Self-Care Difficulty
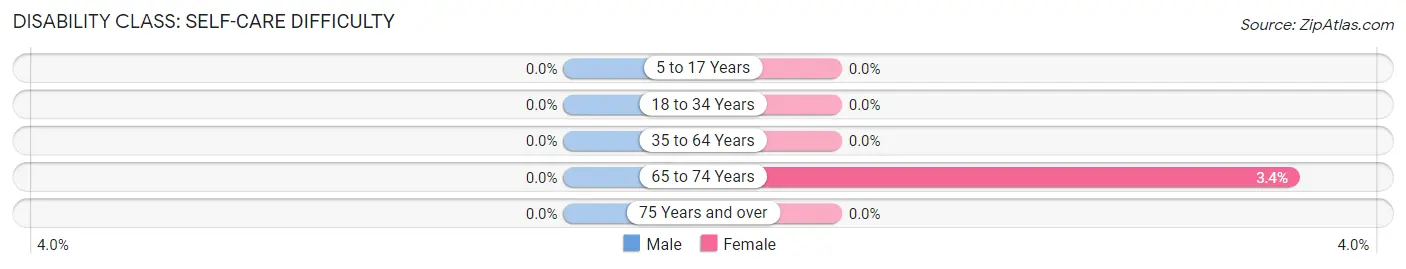
| Age Bracket | Male | Female |
| 5 to 17 Years | 0 (0.0%) | 0 (0.0%) |
| 18 to 34 Years | 0 (0.0%) | 0 (0.0%) |
| 35 to 64 Years | 0 (0.0%) | 0 (0.0%) |
| 65 to 74 Years | 0 (0.0%) | 10 (3.4%) |
| 75 Years and over | 0 (0.0%) | 0 (0.0%) |
Technology Access in Salunga
Computing Device Access in Salunga
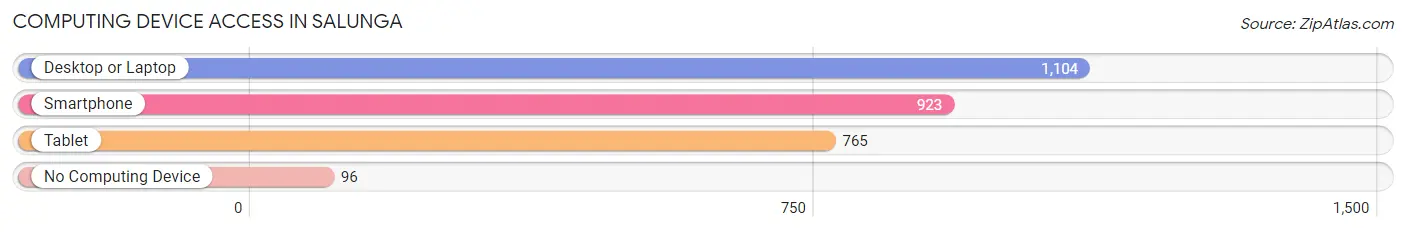
| Device Type | # Households | % Households |
| Desktop or Laptop | 1,104 | 84.2% |
| Smartphone | 923 | 70.4% |
| Tablet | 765 | 58.3% |
| No Computing Device | 96 | 7.3% |
| Total | 1,312 | 100.0% |
Internet Access in Salunga
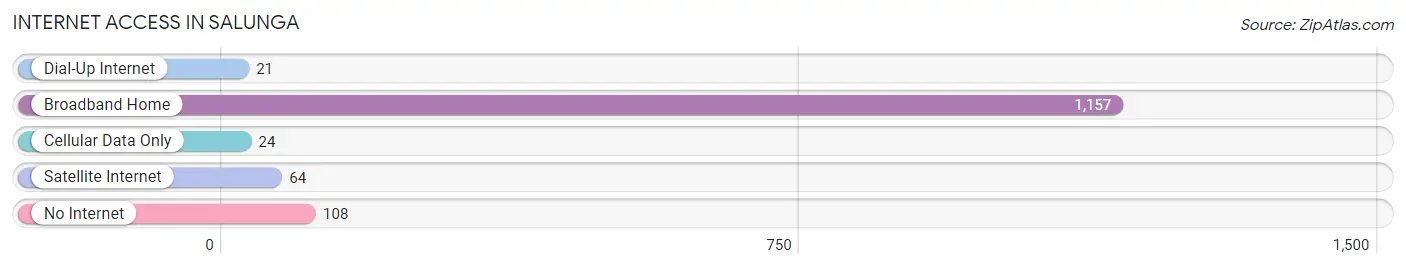
| Internet Type | # Households | % Households |
| Dial-Up Internet | 21 | 1.6% |
| Broadband Home | 1,157 | 88.2% |
| Cellular Data Only | 24 | 1.8% |
| Satellite Internet | 64 | 4.9% |
| No Internet | 108 | 8.2% |
| Total | 1,312 | 100.0% |
Salunga Summary
Salunga is a small unincorporated community located in Lancaster County, Pennsylvania. It is situated in the southeastern corner of the county, just south of the city of Lancaster. The community is part of the Lancaster Metropolitan Statistical Area and is located within the larger Lancaster-Lebanon-Berks County Combined Statistical Area.
Geography
Salunga is located at 40°02'45"N 76°17'45"W (40.04583, -76.29583). It is situated in the southeastern corner of Lancaster County, just south of the city of Lancaster. The community is bordered to the north by the borough of Mountville, to the east by the borough of Marietta, to the south by the borough of Columbia, and to the west by the borough of Millersville.
The community is situated in the Conestoga Valley, a region of rolling hills and valleys that is part of the larger Susquehanna River Valley. The Conestoga River, a tributary of the Susquehanna, flows through the valley and passes just to the east of Salunga. The community is located in the Piedmont region of Pennsylvania, which is characterized by rolling hills and valleys.
The climate in Salunga is classified as humid continental, with hot, humid summers and cold, snowy winters. The average annual temperature is 52°F (11°C), and the average annual precipitation is 41 inches (1040 mm).
Demographics
As of the 2010 census, the population of Salunga was 1,845. The racial makeup of the community was 94.3% White, 2.2% African American, 0.3% Native American, 0.7% Asian, 0.1% Pacific Islander, 0.7% from other races, and 1.9% from two or more races. Hispanic or Latino of any race were 2.2% of the population.
The median household income in Salunga was $50,938 in 2010, and the median family income was $60,938. The per capita income was $25,938. About 4.3% of families and 5.7% of the population were below the poverty line, including 8.3% of those under age 18 and 4.3% of those age 65 or over.
Economy
The economy of Salunga is largely based on agriculture and light manufacturing. The community is home to several small businesses, including a grocery store, a hardware store, a restaurant, and a gas station. The community is also home to several farms, which produce a variety of crops, including corn, soybeans, wheat, and hay.
The community is served by the Conestoga Valley School District, which provides public education to students in grades K-12. The district also operates a vocational-technical school, which provides students with the opportunity to learn a variety of trades.
The community is served by the Lancaster County Transportation Authority, which provides public transportation to the surrounding area. The community is also served by the Lancaster Airport, which provides air service to the region.
Conclusion
Salunga is a small unincorporated community located in Lancaster County, Pennsylvania. It is situated in the southeastern corner of the county, just south of the city of Lancaster. The community is part of the Lancaster Metropolitan Statistical Area and is located within the larger Lancaster-Lebanon-Berks County Combined Statistical Area. The economy of Salunga is largely based on agriculture and light manufacturing, and the community is served by the Conestoga Valley School District and the Lancaster County Transportation Authority. The community is also served by the Lancaster Airport, which provides air service to the region.
Common Questions
What is Per Capita Income in Salunga?
Per Capita income in Salunga is $40,700.
What is the Median Family Income in Salunga?
Median Family Income in Salunga is $125,667.
What is the Median Household income in Salunga?
Median Household Income in Salunga is $82,857.
What is Income or Wage Gap in Salunga?
Income or Wage Gap in Salunga is 44.9%.
Women in Salunga earn 55.1 cents for every dollar earned by a man.
What is Inequality or Gini Index in Salunga?
Inequality or Gini Index in Salunga is 0.41.
What is the Total Population of Salunga?
Total Population of Salunga is 3,114.
What is the Total Male Population of Salunga?
Total Male Population of Salunga is 1,393.
What is the Total Female Population of Salunga?
Total Female Population of Salunga is 1,721.
What is the Ratio of Males per 100 Females in Salunga?
There are 80.94 Males per 100 Females in Salunga.
What is the Ratio of Females per 100 Males in Salunga?
There are 123.55 Females per 100 Males in Salunga.
What is the Median Population Age in Salunga?
Median Population Age in Salunga is 48.6 Years.
What is the Average Family Size in Salunga
Average Family Size in Salunga is 3.2 People.
What is the Average Household Size in Salunga
Average Household Size in Salunga is 2.4 People.
How Large is the Labor Force in Salunga?
There are 1,502 People in the Labor Forcein in Salunga.
What is the Percentage of People in the Labor Force in Salunga?
59.4% of People are in the Labor Force in Salunga.
What is the Unemployment Rate in Salunga?
Unemployment Rate in Salunga is 2.3%.