Laceyville borough, PA Map & Demographics
Laceyville borough Overview
$30,807
PER CAPITA INCOME
$83,750
AVG FAMILY INCOME
$79,318
AVG HOUSEHOLD INCOME
22.3%
WAGE / INCOME GAP [ % ]
77.7¢/ $1
WAGE / INCOME GAP [ $ ]
0.28
INEQUALITY / GINI INDEX
379
TOTAL POPULATION
187
MALE POPULATION
192
FEMALE POPULATION
97.40
MALES / 100 FEMALES
102.67
FEMALES / 100 MALES
35.8
MEDIAN AGE
3.3
AVG FAMILY SIZE
2.7
AVG HOUSEHOLD SIZE
181
LABOR FORCE [ PEOPLE ]
61.1%
PERCENT IN LABOR FORCE
1.1%
UNEMPLOYMENT RATE
Income in Laceyville borough
Income Overview in Laceyville borough
Per Capita Income in Laceyville borough is $30,807, while median incomes of families and households are $83,750 and $79,318 respectively.
| Characteristic | Number | Measure |
| Per Capita Income | 379 | $30,807 |
| Median Family Income | 94 | $83,750 |
| Mean Family Income | 94 | $87,224 |
| Median Household Income | 142 | $79,318 |
| Mean Household Income | 142 | $76,327 |
| Income Deficit | 94 | $0 |
| Wage / Income Gap (%) | 379 | 22.34% |
| Wage / Income Gap ($) | 379 | 77.66¢ per $1 |
| Gini / Inequality Index | 379 | 0.28 |
Earnings by Sex in Laceyville borough
Average Earnings in Laceyville borough are $44,750, $47,159 for men and $36,625 for women, a difference of 22.3%.
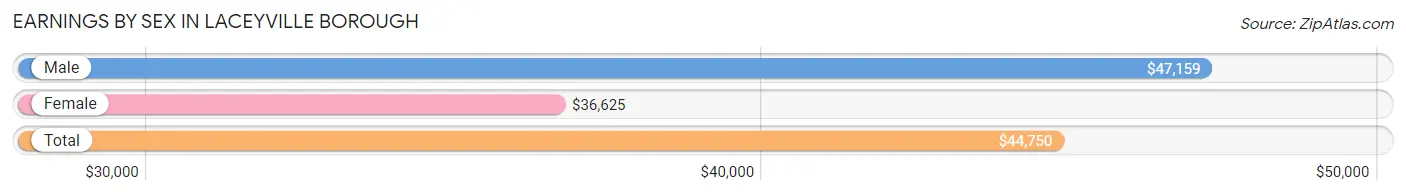
| Sex | Number | Average Earnings |
| Male | 107 (55.4%) | $47,159 |
| Female | 86 (44.6%) | $36,625 |
| Total | 193 (100.0%) | $44,750 |
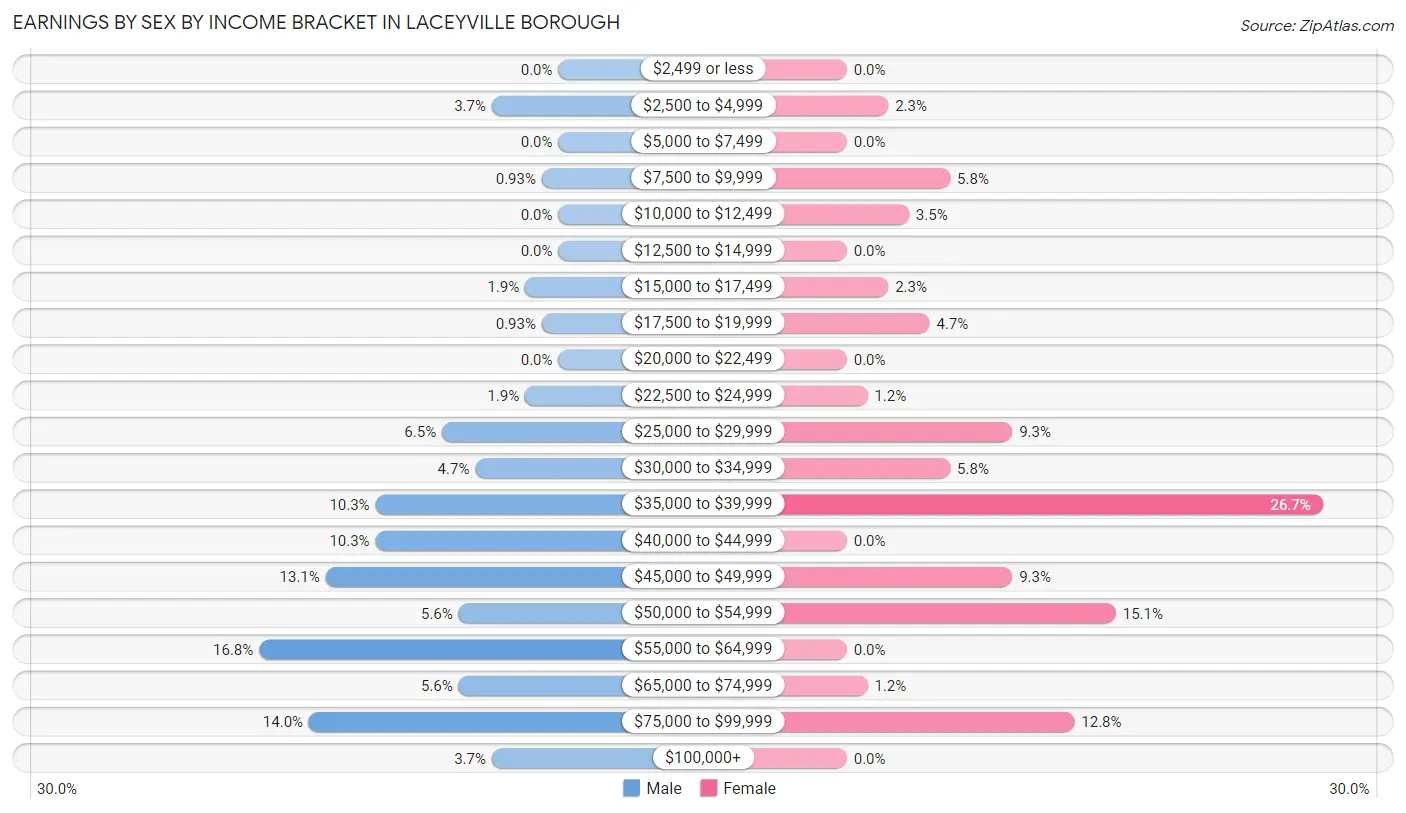
Earnings by Sex by Income Bracket in Laceyville borough
The most common earnings brackets in Laceyville borough are $55,000 to $64,999 for men (18 | 16.8%) and $35,000 to $39,999 for women (23 | 26.7%).
| Income | Male | Female |
| $2,499 or less | 0 (0.0%) | 0 (0.0%) |
| $2,500 to $4,999 | 4 (3.7%) | 2 (2.3%) |
| $5,000 to $7,499 | 0 (0.0%) | 0 (0.0%) |
| $7,500 to $9,999 | 1 (0.9%) | 5 (5.8%) |
| $10,000 to $12,499 | 0 (0.0%) | 3 (3.5%) |
| $12,500 to $14,999 | 0 (0.0%) | 0 (0.0%) |
| $15,000 to $17,499 | 2 (1.9%) | 2 (2.3%) |
| $17,500 to $19,999 | 1 (0.9%) | 4 (4.6%) |
| $20,000 to $22,499 | 0 (0.0%) | 0 (0.0%) |
| $22,500 to $24,999 | 2 (1.9%) | 1 (1.2%) |
| $25,000 to $29,999 | 7 (6.5%) | 8 (9.3%) |
| $30,000 to $34,999 | 5 (4.7%) | 5 (5.8%) |
| $35,000 to $39,999 | 11 (10.3%) | 23 (26.7%) |
| $40,000 to $44,999 | 11 (10.3%) | 0 (0.0%) |
| $45,000 to $49,999 | 14 (13.1%) | 8 (9.3%) |
| $50,000 to $54,999 | 6 (5.6%) | 13 (15.1%) |
| $55,000 to $64,999 | 18 (16.8%) | 0 (0.0%) |
| $65,000 to $74,999 | 6 (5.6%) | 1 (1.2%) |
| $75,000 to $99,999 | 15 (14.0%) | 11 (12.8%) |
| $100,000+ | 4 (3.7%) | 0 (0.0%) |
| Total | 107 (100.0%) | 86 (100.0%) |
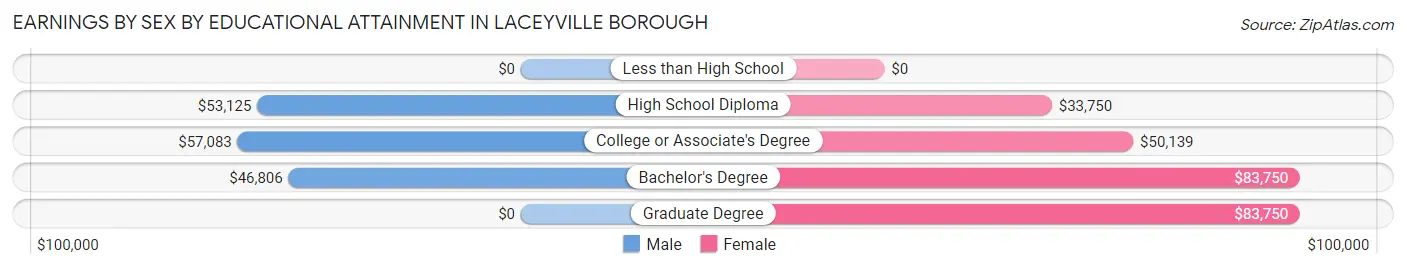
Earnings by Sex by Educational Attainment in Laceyville borough
Average earnings in Laceyville borough are $51,250 for men and $37,344 for women, a difference of 27.1%. Men with an educational attainment of college or associate's degree enjoy the highest average annual earnings of $57,083, while those with bachelor's degree education earn the least with $46,806. Women with an educational attainment of bachelor's degree earn the most with the average annual earnings of $83,750, while those with high school diploma education have the smallest earnings of $33,750.
| Educational Attainment | Male Income | Female Income |
| Less than High School | - | - |
| High School Diploma | $53,125 | $33,750 |
| College or Associate's Degree | $57,083 | $50,139 |
| Bachelor's Degree | $46,806 | $83,750 |
| Graduate Degree | - | - |
| Total | $51,250 | $37,344 |
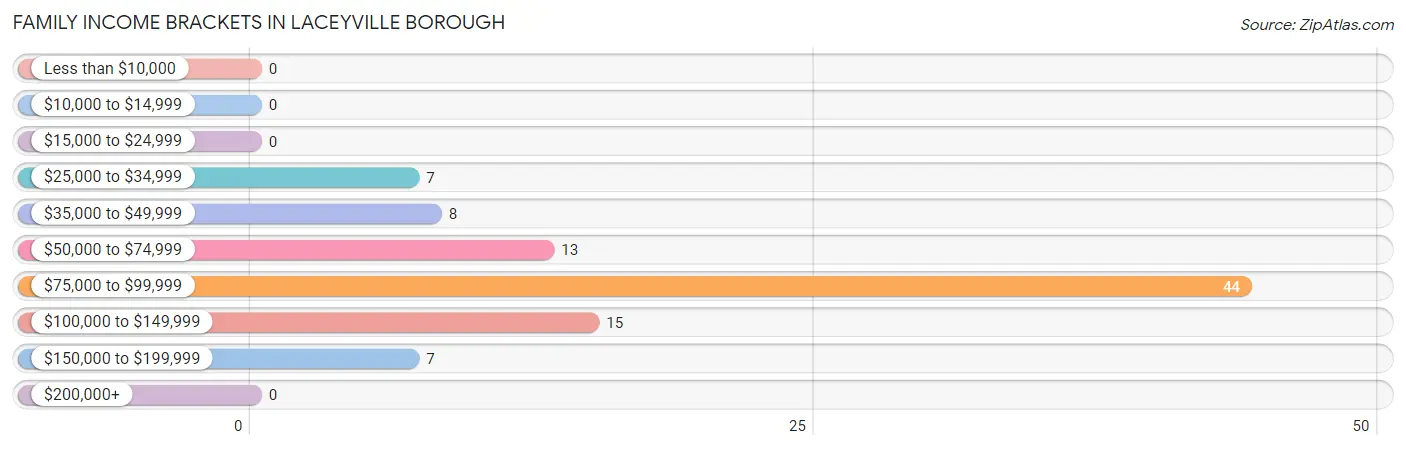
Family Income in Laceyville borough
Family Income Brackets in Laceyville borough
According to the Laceyville borough family income data, there are 44 families falling into the $75,000 to $99,999 income range, which is the most common income bracket and makes up 46.8% of all families.
| Income Bracket | # Families | % Families |
| Less than $10,000 | 0 | 0.0% |
| $10,000 to $14,999 | 0 | 0.0% |
| $15,000 to $24,999 | 0 | 0.0% |
| $25,000 to $34,999 | 7 | 7.4% |
| $35,000 to $49,999 | 8 | 8.5% |
| $50,000 to $74,999 | 13 | 13.8% |
| $75,000 to $99,999 | 44 | 46.8% |
| $100,000 to $149,999 | 15 | 16.0% |
| $150,000 to $199,999 | 7 | 7.4% |
| $200,000+ | 0 | 0.0% |
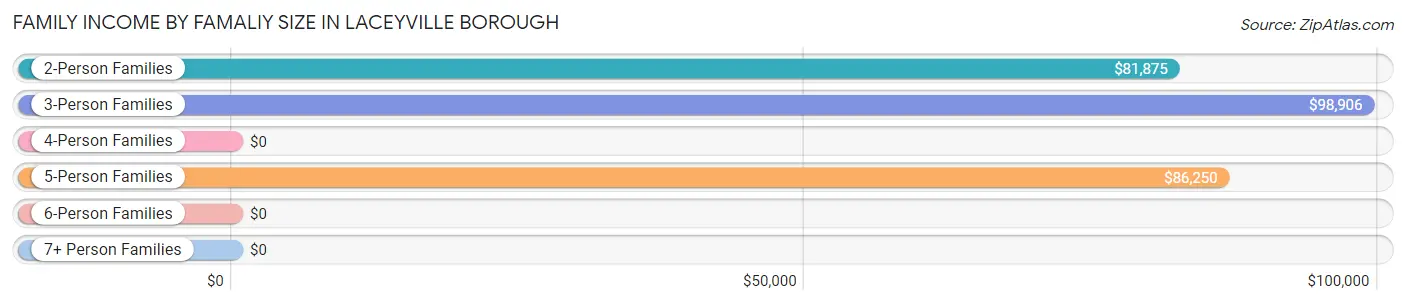
Family Income by Famaliy Size in Laceyville borough
3-person families (27 | 28.7%) account for the highest median family income in Laceyville borough with $98,906 per family, while 2-person families (49 | 52.1%) have the highest median income of $40,938 per family member.
| Income Bracket | # Families | Median Income |
| 2-Person Families | 49 (52.1%) | $81,875 |
| 3-Person Families | 27 (28.7%) | $98,906 |
| 4-Person Families | 5 (5.3%) | $0 |
| 5-Person Families | 13 (13.8%) | $86,250 |
| 6-Person Families | 0 (0.0%) | $0 |
| 7+ Person Families | 0 (0.0%) | $0 |
| Total | 94 (100.0%) | $83,750 |
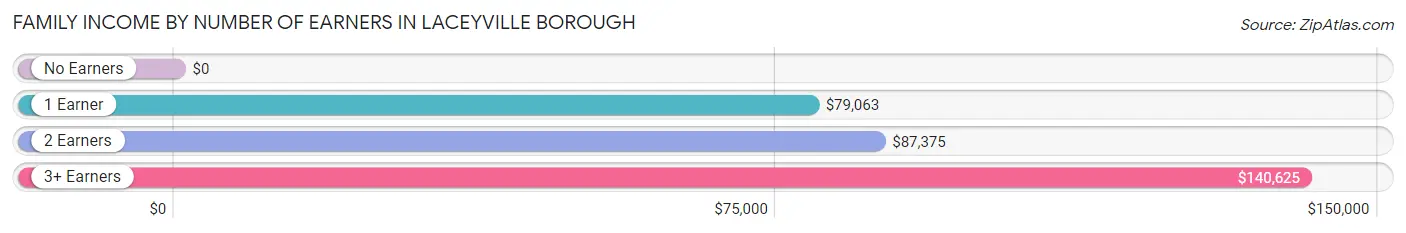
Family Income by Number of Earners in Laceyville borough
| Number of Earners | # Families | Median Income |
| No Earners | 10 (10.6%) | $0 |
| 1 Earner | 36 (38.3%) | $79,063 |
| 2 Earners | 41 (43.6%) | $87,375 |
| 3+ Earners | 7 (7.4%) | $140,625 |
| Total | 94 (100.0%) | $83,750 |
Household Income in Laceyville borough
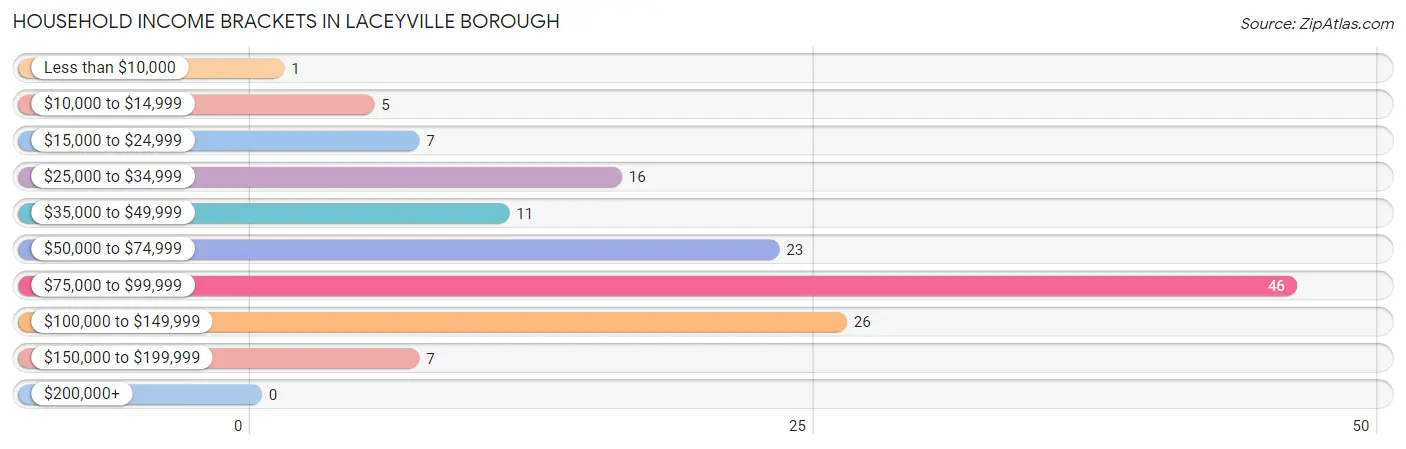
Household Income Brackets in Laceyville borough
With 46 households falling in the category, the $75,000 to $99,999 income range is the most frequent in Laceyville borough, accounting for 32.4% of all households.
| Income Bracket | # Households | % Households |
| Less than $10,000 | 1 | 0.7% |
| $10,000 to $14,999 | 5 | 3.5% |
| $15,000 to $24,999 | 7 | 4.9% |
| $25,000 to $34,999 | 16 | 11.3% |
| $35,000 to $49,999 | 11 | 7.7% |
| $50,000 to $74,999 | 23 | 16.2% |
| $75,000 to $99,999 | 46 | 32.4% |
| $100,000 to $149,999 | 26 | 18.3% |
| $150,000 to $199,999 | 7 | 4.9% |
| $200,000+ | 0 | 0.0% |
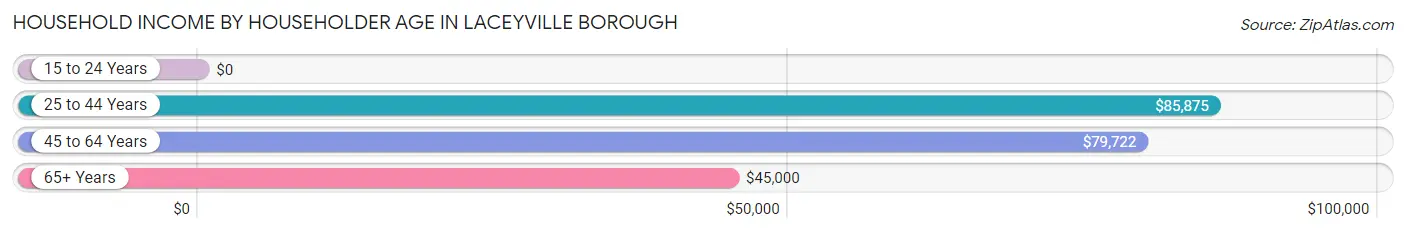
Household Income by Householder Age in Laceyville borough
The median household income in Laceyville borough is $79,318, with the highest median household income of $85,875 found in the 25 to 44 years age bracket for the primary householder. A total of 47 households (33.1%) fall into this category. Meanwhile, the 15 to 24 years age bracket for the primary householder has the lowest median household income of $0, with 7 households (4.9%) in this group.
| Income Bracket | # Households | Median Income |
| 15 to 24 Years | 7 (4.9%) | $0 |
| 25 to 44 Years | 47 (33.1%) | $85,875 |
| 45 to 64 Years | 46 (32.4%) | $79,722 |
| 65+ Years | 42 (29.6%) | $45,000 |
| Total | 142 (100.0%) | $79,318 |
Poverty in Laceyville borough
Income Below Poverty by Sex and Age in Laceyville borough
With 0.5% poverty level for males and 9.9% for females among the residents of Laceyville borough, 65 to 74 year old males and 65 to 74 year old females are the most vulnerable to poverty, with 1 males (5.9%) and 4 females (26.7%) in their respective age groups living below the poverty level.
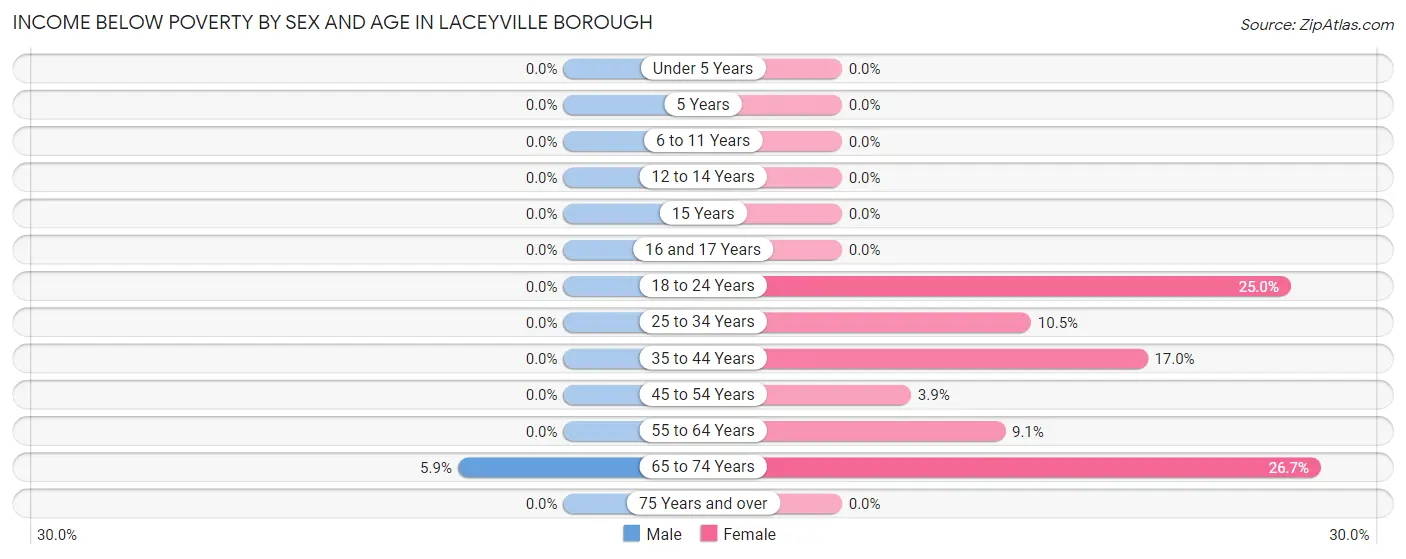
| Age Bracket | Male | Female |
| Under 5 Years | 0 (0.0%) | 0 (0.0%) |
| 5 Years | 0 (0.0%) | 0 (0.0%) |
| 6 to 11 Years | 0 (0.0%) | 0 (0.0%) |
| 12 to 14 Years | 0 (0.0%) | 0 (0.0%) |
| 15 Years | 0 (0.0%) | 0 (0.0%) |
| 16 and 17 Years | 0 (0.0%) | 0 (0.0%) |
| 18 to 24 Years | 0 (0.0%) | 3 (25.0%) |
| 25 to 34 Years | 0 (0.0%) | 2 (10.5%) |
| 35 to 44 Years | 0 (0.0%) | 8 (17.0%) |
| 45 to 54 Years | 0 (0.0%) | 1 (3.8%) |
| 55 to 64 Years | 0 (0.0%) | 1 (9.1%) |
| 65 to 74 Years | 1 (5.9%) | 4 (26.7%) |
| 75 Years and over | 0 (0.0%) | 0 (0.0%) |
| Total | 1 (0.5%) | 19 (9.9%) |
Income Above Poverty by Sex and Age in Laceyville borough
According to the poverty statistics in Laceyville borough, males aged under 5 years and females aged under 5 years are the age groups that are most secure financially, with 100.0% of males and 100.0% of females in these age groups living above the poverty line.
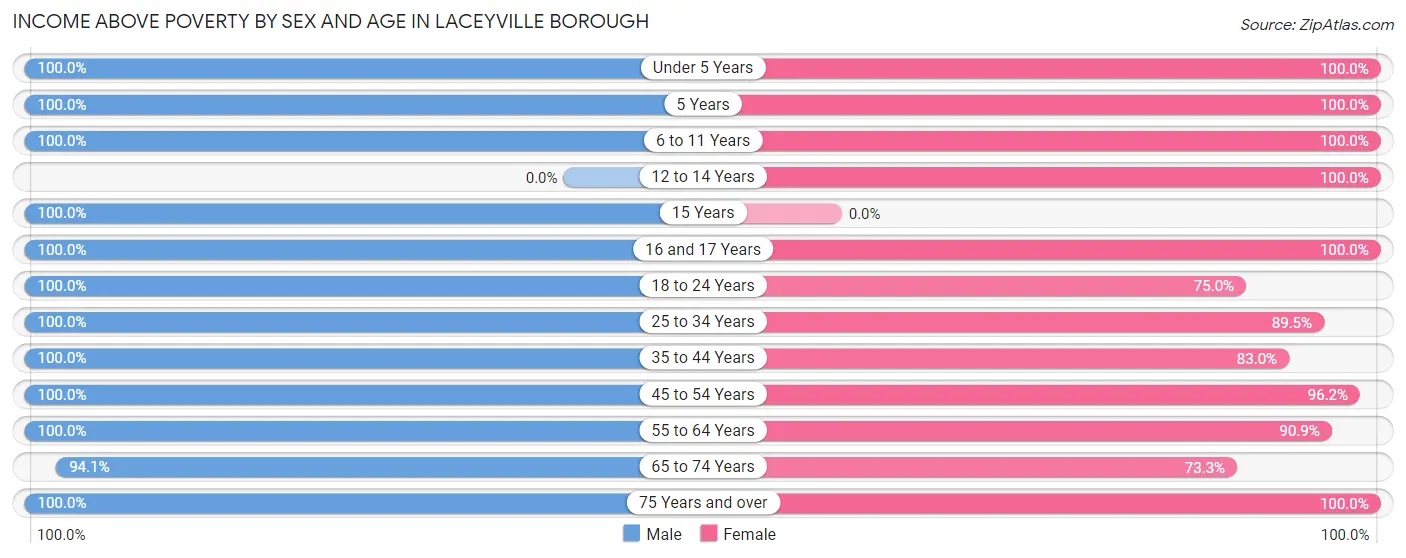
| Age Bracket | Male | Female |
| Under 5 Years | 10 (100.0%) | 2 (100.0%) |
| 5 Years | 9 (100.0%) | 2 (100.0%) |
| 6 to 11 Years | 14 (100.0%) | 18 (100.0%) |
| 12 to 14 Years | 0 (0.0%) | 23 (100.0%) |
| 15 Years | 5 (100.0%) | 0 (0.0%) |
| 16 and 17 Years | 6 (100.0%) | 7 (100.0%) |
| 18 to 24 Years | 9 (100.0%) | 9 (75.0%) |
| 25 to 34 Years | 44 (100.0%) | 17 (89.5%) |
| 35 to 44 Years | 11 (100.0%) | 39 (83.0%) |
| 45 to 54 Years | 33 (100.0%) | 25 (96.2%) |
| 55 to 64 Years | 14 (100.0%) | 10 (90.9%) |
| 65 to 74 Years | 16 (94.1%) | 11 (73.3%) |
| 75 Years and over | 15 (100.0%) | 10 (100.0%) |
| Total | 186 (99.5%) | 173 (90.1%) |
Income Below Poverty Among Married-Couple Families in Laceyville borough
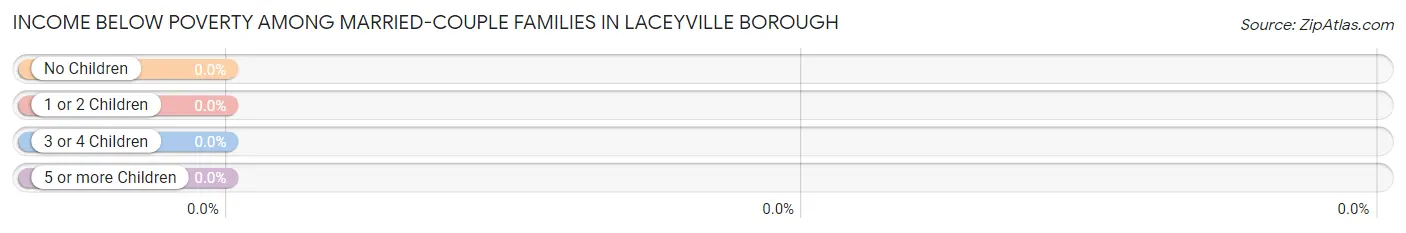
| Children | Above Poverty | Below Poverty |
| No Children | 37 (100.0%) | 0 (0.0%) |
| 1 or 2 Children | 19 (100.0%) | 0 (0.0%) |
| 3 or 4 Children | 12 (100.0%) | 0 (0.0%) |
| 5 or more Children | 0 (0.0%) | 0 (0.0%) |
| Total | 68 (100.0%) | 0 (0.0%) |
Income Below Poverty Among Single-Parent Households in Laceyville borough
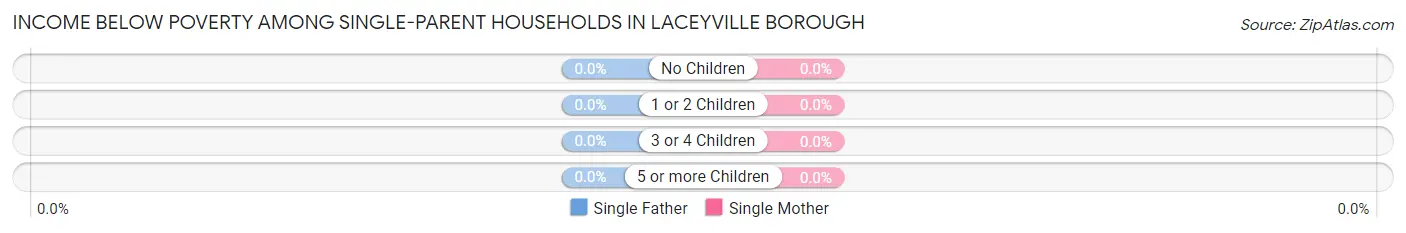
| Children | Single Father | Single Mother |
| No Children | 0 (0.0%) | 0 (0.0%) |
| 1 or 2 Children | 0 (0.0%) | 0 (0.0%) |
| 3 or 4 Children | 0 (0.0%) | 0 (0.0%) |
| 5 or more Children | 0 (0.0%) | 0 (0.0%) |
| Total | 0 (0.0%) | 0 (0.0%) |
Income Below Poverty Among Married-Couple vs Single-Parent Households in Laceyville borough
| Children | Married-Couple Families | Single-Parent Households |
| No Children | 0 (0.0%) | 0 (0.0%) |
| 1 or 2 Children | 0 (0.0%) | 0 (0.0%) |
| 3 or 4 Children | 0 (0.0%) | 0 (0.0%) |
| 5 or more Children | 0 (0.0%) | 0 (0.0%) |
| Total | 0 (0.0%) | 0 (0.0%) |
Race in Laceyville borough
The most populous races in Laceyville borough are White / Caucasian (347 | 91.6%), Hispanic or Latino (42 | 11.1%), and Some other Race (28 | 7.4%).
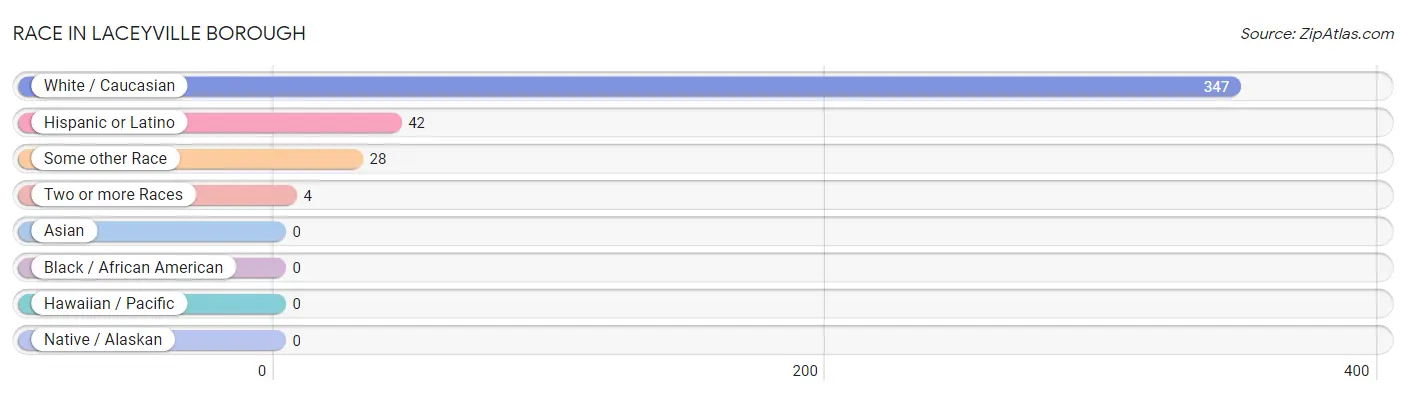
| Race | # Population | % Population |
| Asian | 0 | 0.0% |
| Black / African American | 0 | 0.0% |
| Hawaiian / Pacific | 0 | 0.0% |
| Hispanic or Latino | 42 | 11.1% |
| Native / Alaskan | 0 | 0.0% |
| White / Caucasian | 347 | 91.6% |
| Two or more Races | 4 | 1.1% |
| Some other Race | 28 | 7.4% |
| Total | 379 | 100.0% |
Ancestry in Laceyville borough
The most populous ancestries reported in Laceyville borough are German (61 | 16.1%), English (43 | 11.4%), Irish (33 | 8.7%), Central American (28 | 7.4%), and Salvadoran (28 | 7.4%), together accounting for 50.9% of all Laceyville borough residents.
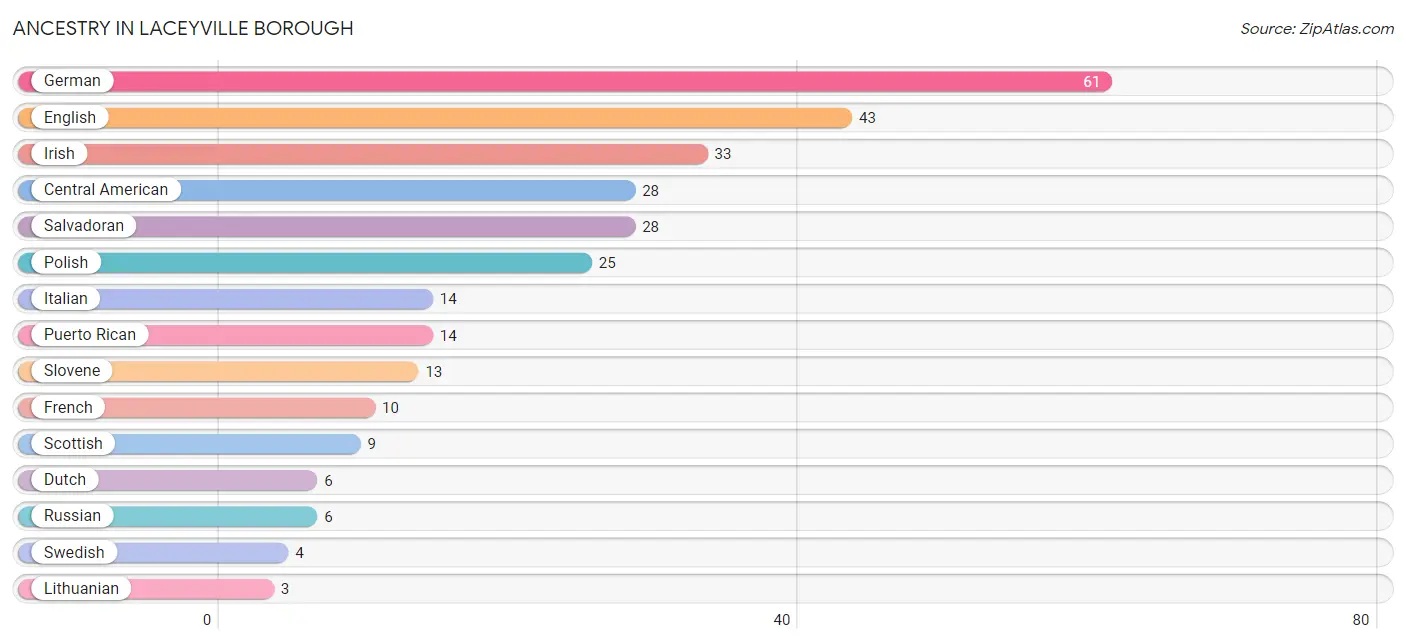
| Ancestry | # Population | % Population |
| American | 1 | 0.3% |
| Central American | 28 | 7.4% |
| Cherokee | 1 | 0.3% |
| Dutch | 6 | 1.6% |
| Eastern European | 2 | 0.5% |
| English | 43 | 11.4% |
| French | 10 | 2.6% |
| German | 61 | 16.1% |
| Greek | 1 | 0.3% |
| Irish | 33 | 8.7% |
| Italian | 14 | 3.7% |
| Korean | 1 | 0.3% |
| Lithuanian | 3 | 0.8% |
| Polish | 25 | 6.6% |
| Puerto Rican | 14 | 3.7% |
| Russian | 6 | 1.6% |
| Salvadoran | 28 | 7.4% |
| Scotch-Irish | 2 | 0.5% |
| Scottish | 9 | 2.4% |
| Slovak | 3 | 0.8% |
| Slovene | 13 | 3.4% |
| Swedish | 4 | 1.1% |
| Swiss | 1 | 0.3% |
| Welsh | 3 | 0.8% | View All 24 Rows |
Immigrants in Laceyville borough
The most numerous immigrant groups reported in Laceyville borough came from Central America (20 | 5.3%), El Salvador (20 | 5.3%), Latin America (20 | 5.3%), and Canada (5 | 1.3%), together accounting for 17.2% of all Laceyville borough residents.
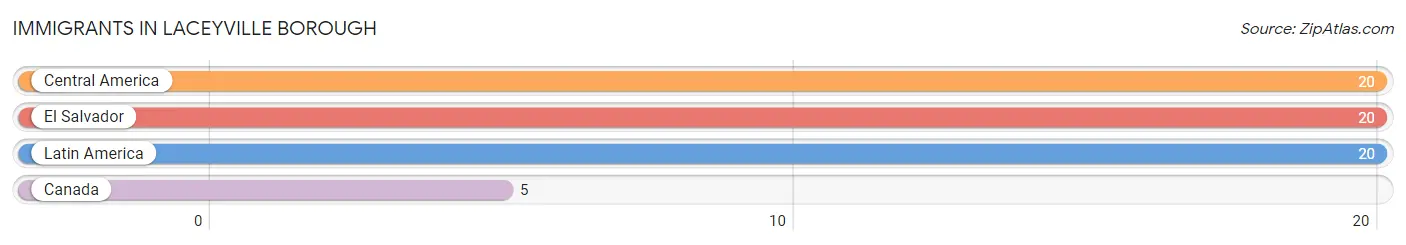
| Immigration Origin | # Population | % Population |
| Canada | 5 | 1.3% |
| Central America | 20 | 5.3% |
| El Salvador | 20 | 5.3% |
| Latin America | 20 | 5.3% | View All 4 Rows |
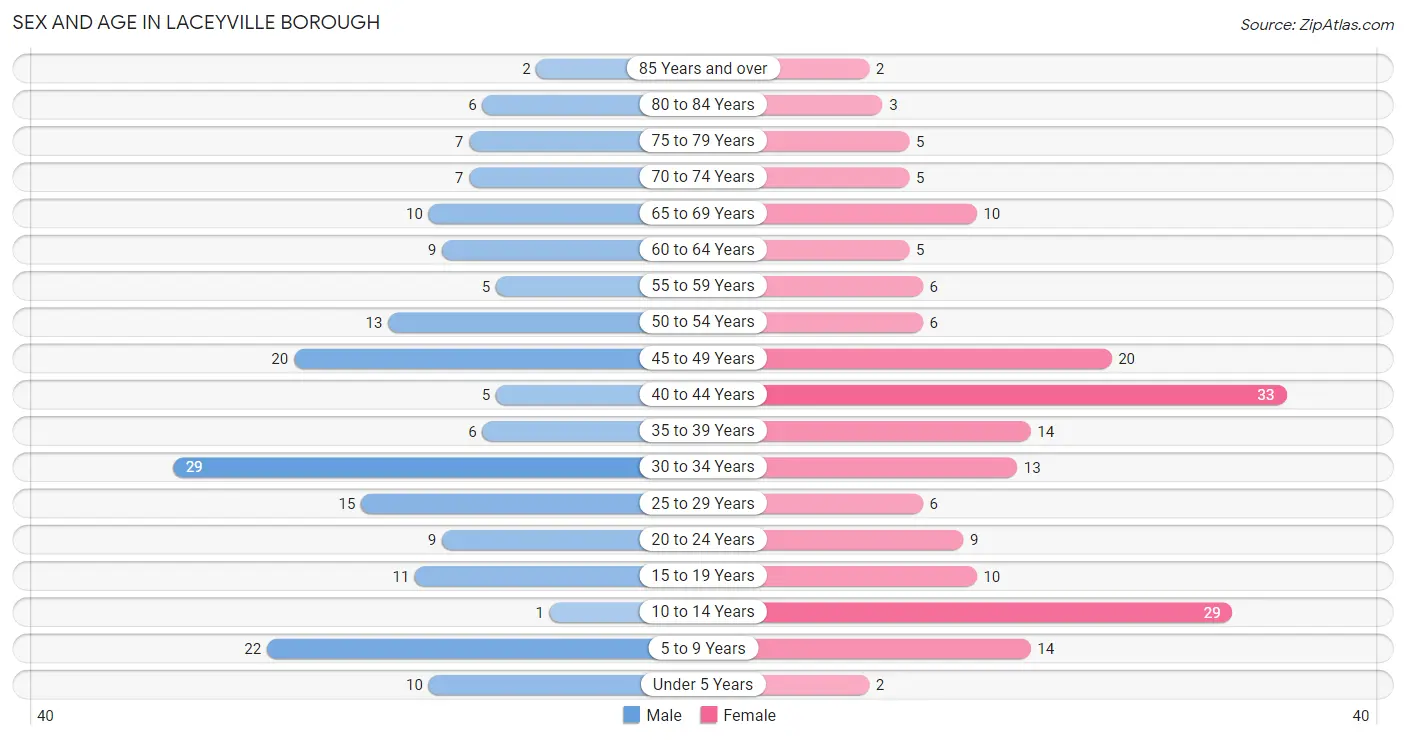
Sex and Age in Laceyville borough
Sex and Age in Laceyville borough
The most populous age groups in Laceyville borough are 30 to 34 Years (29 | 15.5%) for men and 40 to 44 Years (33 | 17.2%) for women.
| Age Bracket | Male | Female |
| Under 5 Years | 10 (5.3%) | 2 (1.0%) |
| 5 to 9 Years | 22 (11.8%) | 14 (7.3%) |
| 10 to 14 Years | 1 (0.5%) | 29 (15.1%) |
| 15 to 19 Years | 11 (5.9%) | 10 (5.2%) |
| 20 to 24 Years | 9 (4.8%) | 9 (4.7%) |
| 25 to 29 Years | 15 (8.0%) | 6 (3.1%) |
| 30 to 34 Years | 29 (15.5%) | 13 (6.8%) |
| 35 to 39 Years | 6 (3.2%) | 14 (7.3%) |
| 40 to 44 Years | 5 (2.7%) | 33 (17.2%) |
| 45 to 49 Years | 20 (10.7%) | 20 (10.4%) |
| 50 to 54 Years | 13 (7.0%) | 6 (3.1%) |
| 55 to 59 Years | 5 (2.7%) | 6 (3.1%) |
| 60 to 64 Years | 9 (4.8%) | 5 (2.6%) |
| 65 to 69 Years | 10 (5.3%) | 10 (5.2%) |
| 70 to 74 Years | 7 (3.7%) | 5 (2.6%) |
| 75 to 79 Years | 7 (3.7%) | 5 (2.6%) |
| 80 to 84 Years | 6 (3.2%) | 3 (1.6%) |
| 85 Years and over | 2 (1.1%) | 2 (1.0%) |
| Total | 187 (100.0%) | 192 (100.0%) |
Families and Households in Laceyville borough
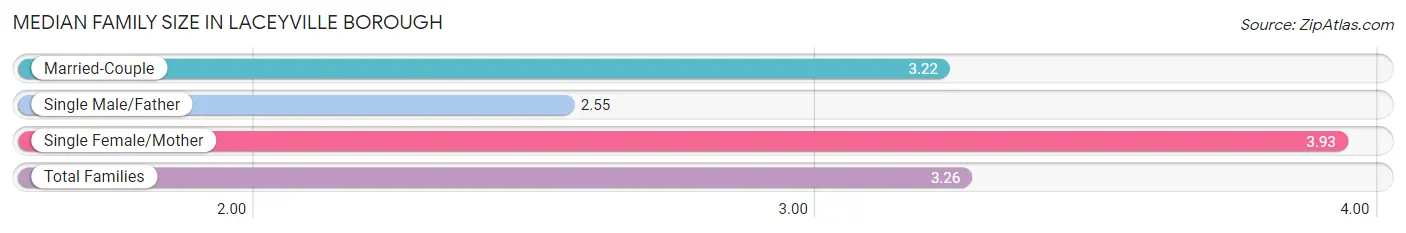
Median Family Size in Laceyville borough
The median family size in Laceyville borough is 3.26 persons per family, with single female/mother families (15 | 16.0%) accounting for the largest median family size of 3.93 persons per family. On the other hand, single male/father families (11 | 11.7%) represent the smallest median family size with 2.55 persons per family.
| Family Type | # Families | Family Size |
| Married-Couple | 68 (72.3%) | 3.22 |
| Single Male/Father | 11 (11.7%) | 2.55 |
| Single Female/Mother | 15 (16.0%) | 3.93 |
| Total Families | 94 (100.0%) | 3.26 |
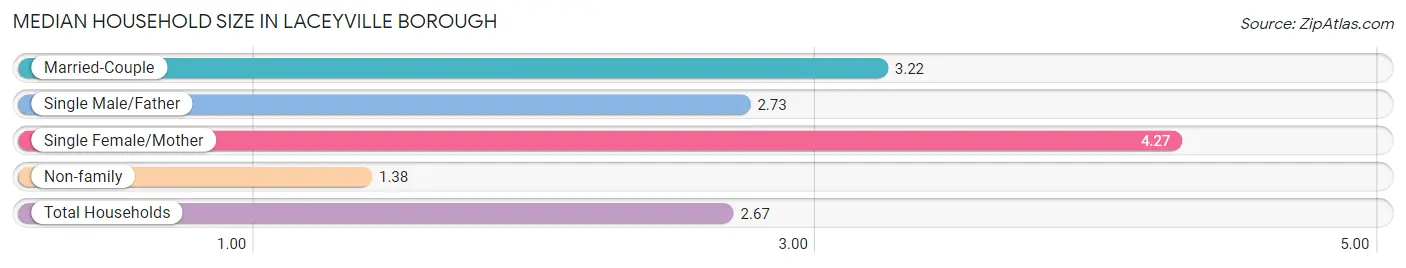
Median Household Size in Laceyville borough
The median household size in Laceyville borough is 2.67 persons per household, with single female/mother households (15 | 10.6%) accounting for the largest median household size of 4.27 persons per household. non-family households (48 | 33.8%) represent the smallest median household size with 1.38 persons per household.
| Household Type | # Households | Household Size |
| Married-Couple | 68 (47.9%) | 3.22 |
| Single Male/Father | 11 (7.7%) | 2.73 |
| Single Female/Mother | 15 (10.6%) | 4.27 |
| Non-family | 48 (33.8%) | 1.38 |
| Total Households | 142 (100.0%) | 2.67 |
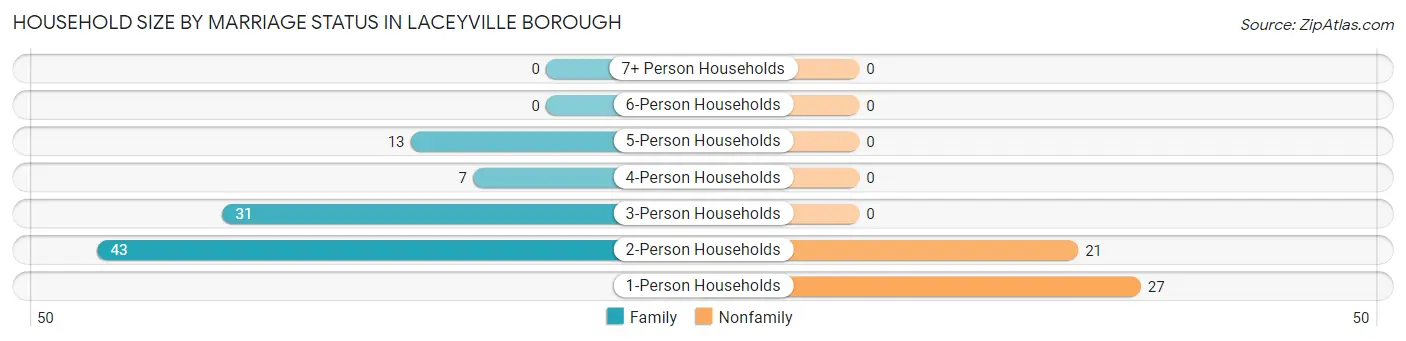
Household Size by Marriage Status in Laceyville borough
Out of a total of 142 households in Laceyville borough, 94 (66.2%) are family households, while 48 (33.8%) are nonfamily households. The most numerous type of family households are 2-person households, comprising 43, and the most common type of nonfamily households are 1-person households, comprising 27.
| Household Size | Family Households | Nonfamily Households |
| 1-Person Households | - | 27 (19.0%) |
| 2-Person Households | 43 (30.3%) | 21 (14.8%) |
| 3-Person Households | 31 (21.8%) | 0 (0.0%) |
| 4-Person Households | 7 (4.9%) | 0 (0.0%) |
| 5-Person Households | 13 (9.1%) | 0 (0.0%) |
| 6-Person Households | 0 (0.0%) | 0 (0.0%) |
| 7+ Person Households | 0 (0.0%) | 0 (0.0%) |
| Total | 94 (66.2%) | 48 (33.8%) |
Female Fertility in Laceyville borough
Fertility by Age in Laceyville borough
Average fertility rate in Laceyville borough is 93.0 births per 1,000 women. Women in the age bracket of 20 to 34 years have the highest fertility rate with 179.0 births per 1,000 women. Women in the age bracket of 20 to 34 years acount for 50.0% of all women with births.
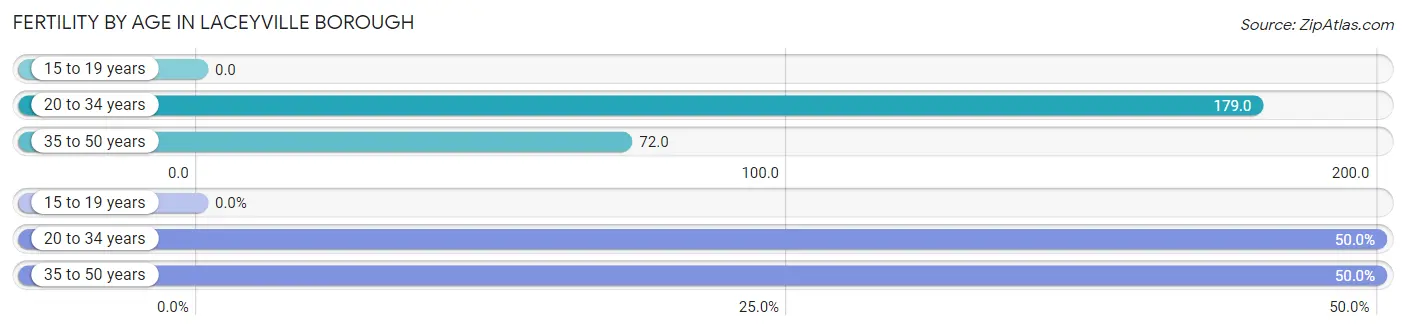
| Age Bracket | Women with Births | Births / 1,000 Women |
| 15 to 19 years | 0 (0.0%) | 0.0 |
| 20 to 34 years | 5 (50.0%) | 179.0 |
| 35 to 50 years | 5 (50.0%) | 72.0 |
| Total | 10 (100.0%) | 93.0 |
Fertility by Age by Marriage Status in Laceyville borough
70.0% of women with births (10) in Laceyville borough are married. The highest percentage of unmarried women with births falls into 20 to 34 years age bracket with 60.0% of them unmarried at the time of birth, while the lowest percentage of unmarried women with births belong to 35 to 50 years age bracket with 0.0% of them unmarried.
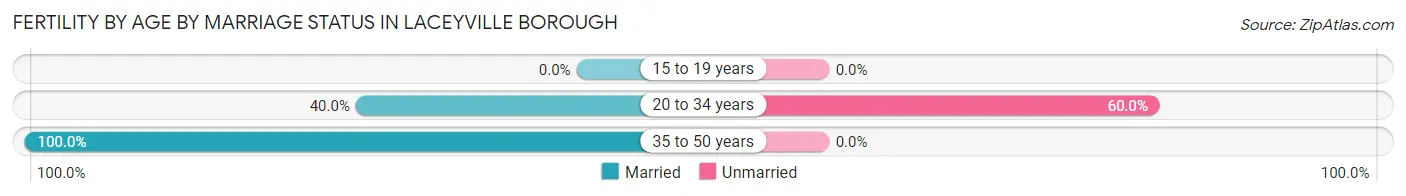
| Age Bracket | Married | Unmarried |
| 15 to 19 years | 0 (0.0%) | 0 (0.0%) |
| 20 to 34 years | 2 (40.0%) | 3 (60.0%) |
| 35 to 50 years | 5 (100.0%) | 0 (0.0%) |
| Total | 7 (70.0%) | 3 (30.0%) |
Fertility by Education in Laceyville borough
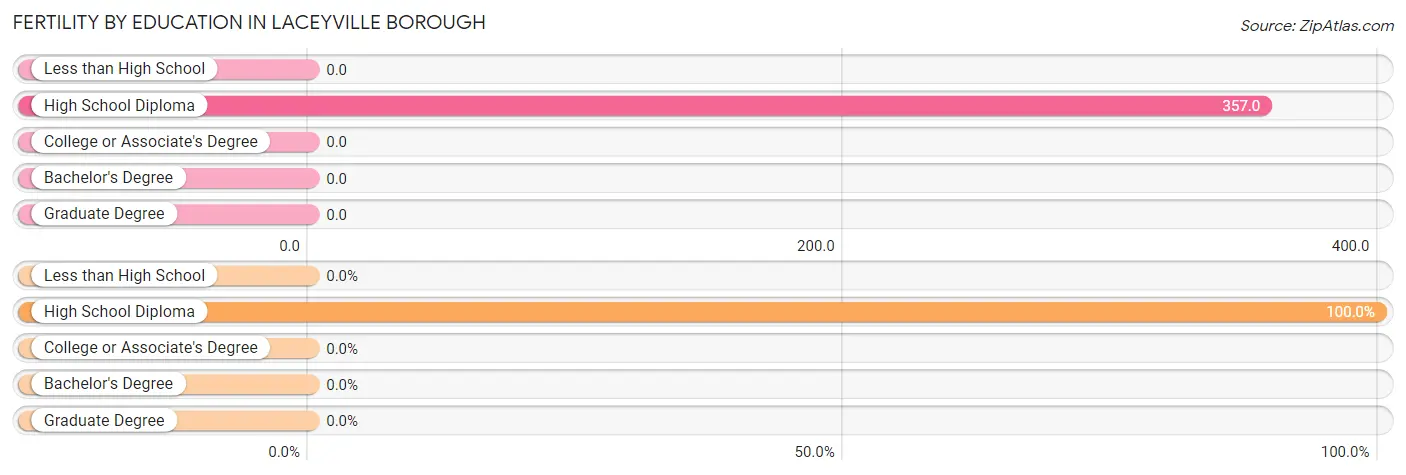
| Educational Attainment | Women with Births | Births / 1,000 Women |
| Less than High School | 0 (0.0%) | 0.0 |
| High School Diploma | 10 (100.0%) | 357.0 |
| College or Associate's Degree | 0 (0.0%) | 0.0 |
| Bachelor's Degree | 0 (0.0%) | 0.0 |
| Graduate Degree | 0 (0.0%) | 0.0 |
| Total | 10 (100.0%) | 93.0 |
Fertility by Education by Marriage Status in Laceyville borough
30.0% of women with births in Laceyville borough are unmarried. Women with the educational attainment of high school diploma are most likely to be married with 70.0% of them married at childbirth, while women with the educational attainment of high school diploma are least likely to be married with 30.0% of them unmarried at childbirth.
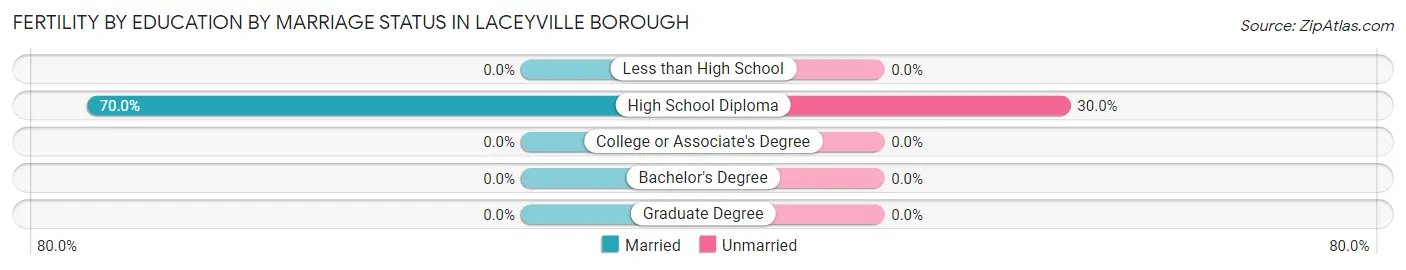
| Educational Attainment | Married | Unmarried |
| Less than High School | 0 (0.0%) | 0 (0.0%) |
| High School Diploma | 7 (70.0%) | 3 (30.0%) |
| College or Associate's Degree | 0 (0.0%) | 0 (0.0%) |
| Bachelor's Degree | 0 (0.0%) | 0 (0.0%) |
| Graduate Degree | 0 (0.0%) | 0 (0.0%) |
| Total | 7 (70.0%) | 3 (30.0%) |
Employment Characteristics in Laceyville borough
Employment by Class of Employer in Laceyville borough
Among the 178 employed individuals in Laceyville borough, private company employees (140 | 78.6%), not-for-profit organizations (20 | 11.2%), and self-employed (not incorporated) (6 | 3.4%) make up the most common classes of employment.
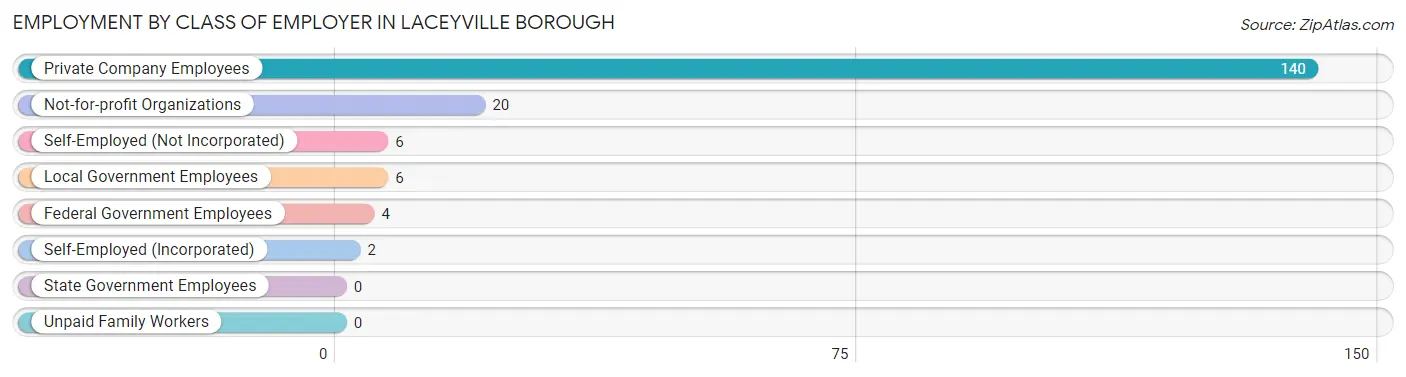
| Employer Class | # Employees | % Employees |
| Private Company Employees | 140 | 78.6% |
| Self-Employed (Incorporated) | 2 | 1.1% |
| Self-Employed (Not Incorporated) | 6 | 3.4% |
| Not-for-profit Organizations | 20 | 11.2% |
| Local Government Employees | 6 | 3.4% |
| State Government Employees | 0 | 0.0% |
| Federal Government Employees | 4 | 2.2% |
| Unpaid Family Workers | 0 | 0.0% |
| Total | 178 | 100.0% |
Employment Status by Age in Laceyville borough
According to the labor force statistics for Laceyville borough, out of the total population over 16 years of age (296), 61.1% or 181 individuals are in the labor force, with 1.1% or 2 of them unemployed. The age group with the highest labor force participation rate is 60 to 64 years, with 85.7% or 12 individuals in the labor force. Within the labor force, the 30 to 34 years age range has the highest percentage of unemployed individuals, with 6.5% or 2 of them being unemployed.
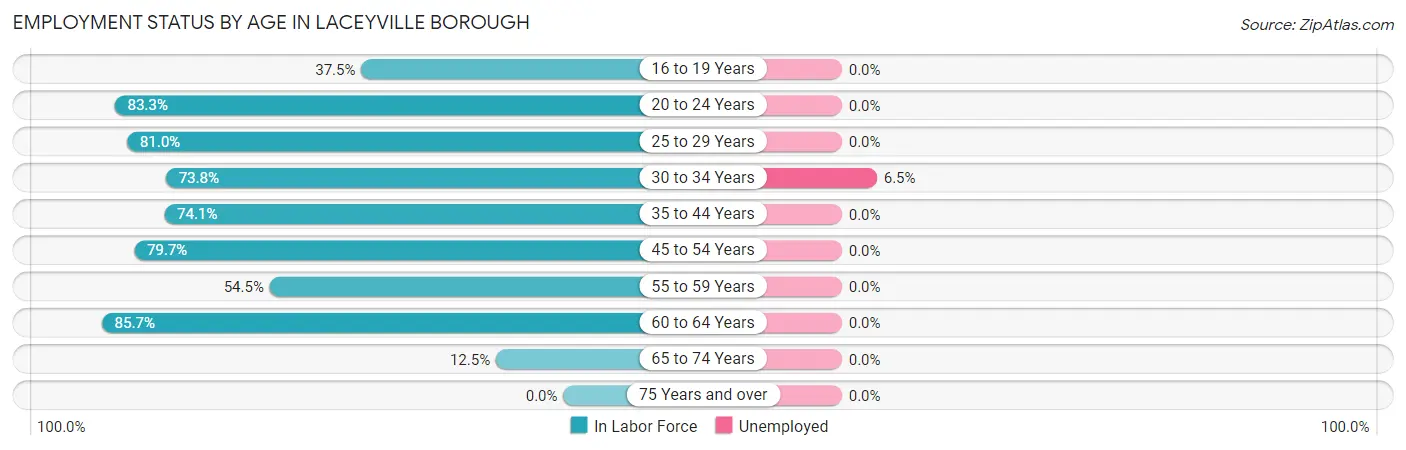
| Age Bracket | In Labor Force | Unemployed |
| 16 to 19 Years | 6 (37.5%) | 0 (0.0%) |
| 20 to 24 Years | 15 (83.3%) | 0 (0.0%) |
| 25 to 29 Years | 17 (81.0%) | 0 (0.0%) |
| 30 to 34 Years | 31 (73.8%) | 2 (6.5%) |
| 35 to 44 Years | 43 (74.1%) | 0 (0.0%) |
| 45 to 54 Years | 47 (79.7%) | 0 (0.0%) |
| 55 to 59 Years | 6 (54.5%) | 0 (0.0%) |
| 60 to 64 Years | 12 (85.7%) | 0 (0.0%) |
| 65 to 74 Years | 4 (12.5%) | 0 (0.0%) |
| 75 Years and over | 0 (0.0%) | 0 (0.0%) |
| Total | 181 (61.1%) | 2 (1.1%) |
Employment Status by Educational Attainment in Laceyville borough
According to labor force statistics for Laceyville borough, 76.1% of individuals (156) out of the total population between 25 and 64 years of age (205) are in the labor force, with 1.3% or 2 of them being unemployed. The group with the highest labor force participation rate are those with the educational attainment of bachelor's degree or higher, with 100.0% or 29 individuals in the labor force. Within the labor force, individuals with high school diploma education have the highest percentage of unemployment, with 2.9% or 2 of them being unemployed.
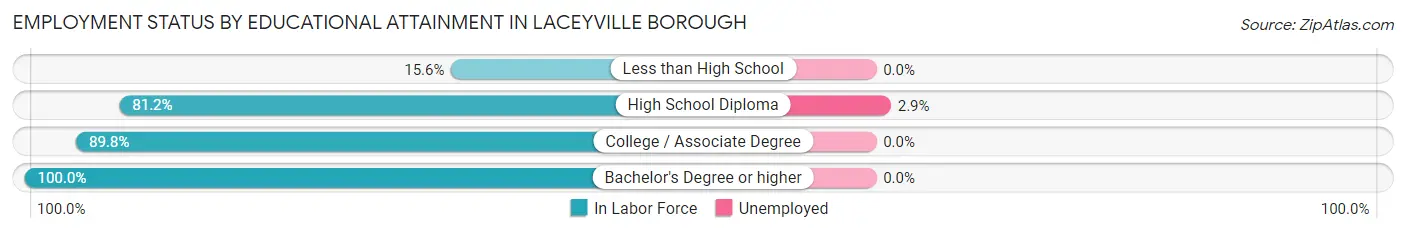
| Educational Attainment | In Labor Force | Unemployed |
| Less than High School | 5 (15.6%) | 0 (0.0%) |
| High School Diploma | 69 (81.2%) | 2 (2.9%) |
| College / Associate Degree | 53 (89.8%) | 0 (0.0%) |
| Bachelor's Degree or higher | 29 (100.0%) | 0 (0.0%) |
| Total | 156 (76.1%) | 3 (1.3%) |
Employment Occupations by Sex in Laceyville borough
Management, Business, Science and Arts Occupations
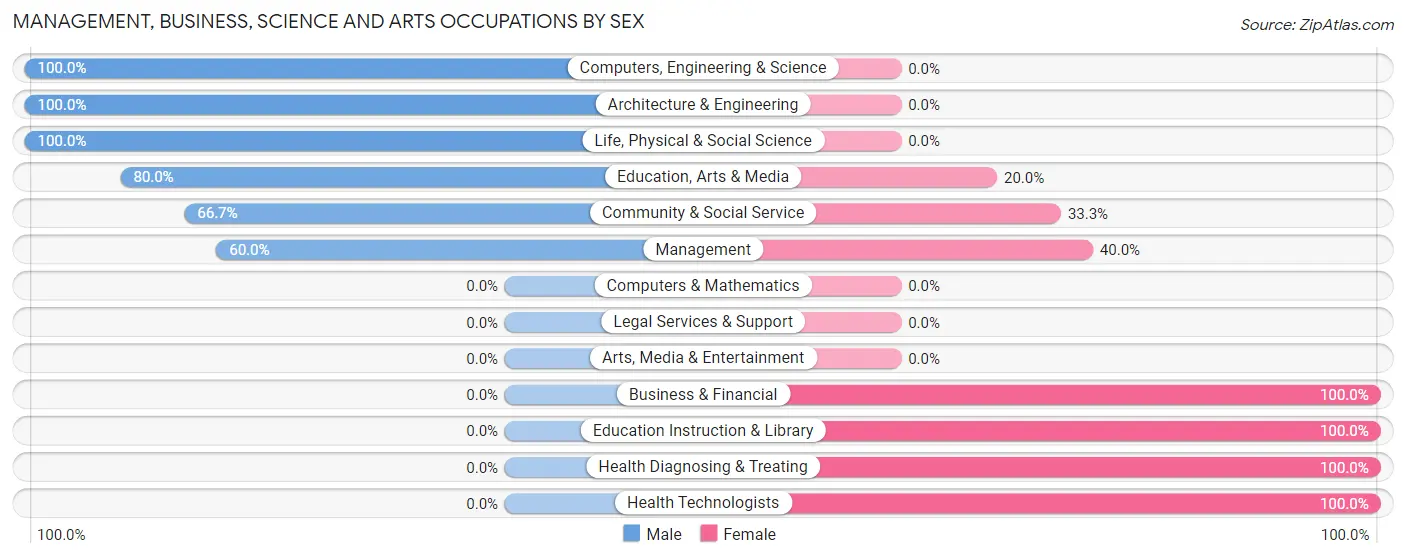
The most common Management, Business, Science and Arts occupations in Laceyville borough are Health Diagnosing & Treating (15 | 8.4%), Health Technologists (15 | 8.4%), Computers, Engineering & Science (6 | 3.4%), Community & Social Service (6 | 3.4%), and Management (5 | 2.8%).
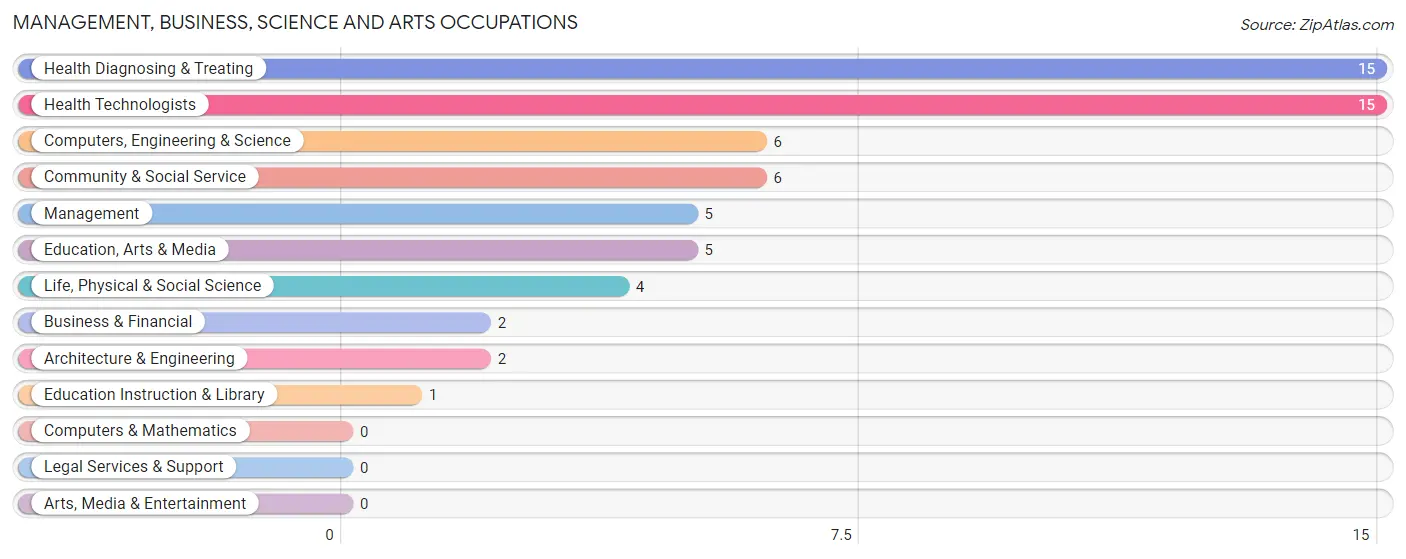
Management, Business, Science and Arts Occupations by Sex
Within the Management, Business, Science and Arts occupations in Laceyville borough, the most male-oriented occupations are Computers, Engineering & Science (100.0%), Architecture & Engineering (100.0%), and Life, Physical & Social Science (100.0%), while the most female-oriented occupations are Business & Financial (100.0%), Education Instruction & Library (100.0%), and Health Diagnosing & Treating (100.0%).
| Occupation | Male | Female |
| Management | 3 (60.0%) | 2 (40.0%) |
| Business & Financial | 0 (0.0%) | 2 (100.0%) |
| Computers, Engineering & Science | 6 (100.0%) | 0 (0.0%) |
| Computers & Mathematics | 0 (0.0%) | 0 (0.0%) |
| Architecture & Engineering | 2 (100.0%) | 0 (0.0%) |
| Life, Physical & Social Science | 4 (100.0%) | 0 (0.0%) |
| Community & Social Service | 4 (66.7%) | 2 (33.3%) |
| Education, Arts & Media | 4 (80.0%) | 1 (20.0%) |
| Legal Services & Support | 0 (0.0%) | 0 (0.0%) |
| Education Instruction & Library | 0 (0.0%) | 1 (100.0%) |
| Arts, Media & Entertainment | 0 (0.0%) | 0 (0.0%) |
| Health Diagnosing & Treating | 0 (0.0%) | 15 (100.0%) |
| Health Technologists | 0 (0.0%) | 15 (100.0%) |
| Total (Category) | 13 (38.2%) | 21 (61.8%) |
| Total (Overall) | 95 (53.1%) | 84 (46.9%) |
Services Occupations
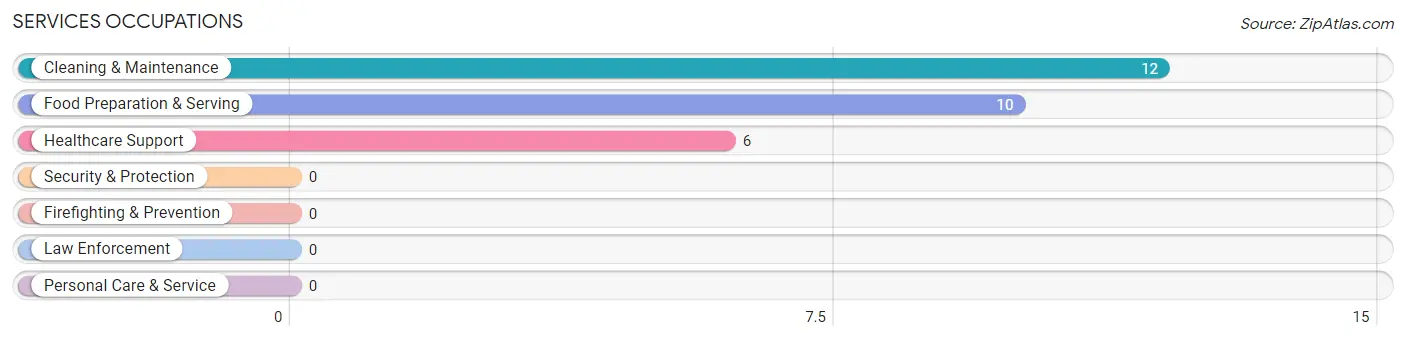
The most common Services occupations in Laceyville borough are Cleaning & Maintenance (12 | 6.7%), Food Preparation & Serving (10 | 5.6%), and Healthcare Support (6 | 3.4%).
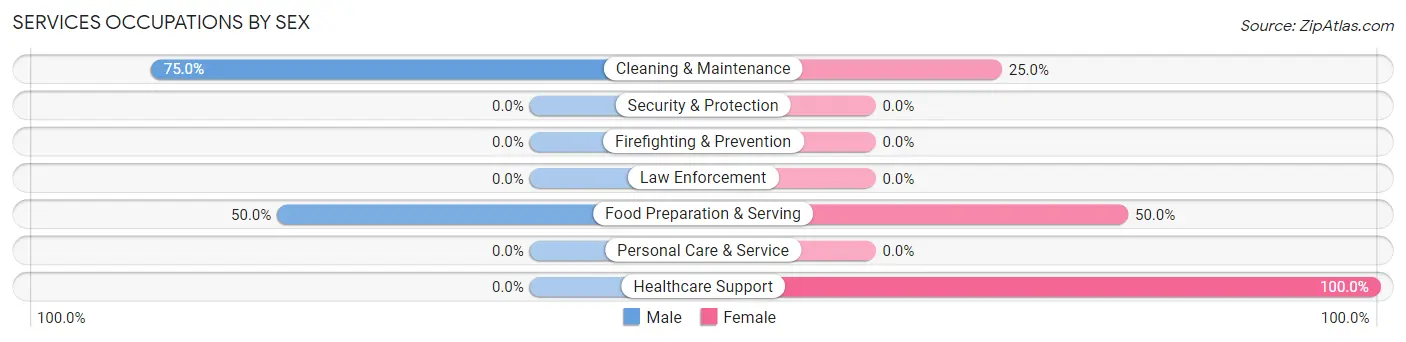
Services Occupations by Sex
Within the Services occupations in Laceyville borough, the most male-oriented occupations are Cleaning & Maintenance (75.0%), and Food Preparation & Serving (50.0%), while the most female-oriented occupations are Healthcare Support (100.0%), Food Preparation & Serving (50.0%), and Cleaning & Maintenance (25.0%).
| Occupation | Male | Female |
| Healthcare Support | 0 (0.0%) | 6 (100.0%) |
| Security & Protection | 0 (0.0%) | 0 (0.0%) |
| Firefighting & Prevention | 0 (0.0%) | 0 (0.0%) |
| Law Enforcement | 0 (0.0%) | 0 (0.0%) |
| Food Preparation & Serving | 5 (50.0%) | 5 (50.0%) |
| Cleaning & Maintenance | 9 (75.0%) | 3 (25.0%) |
| Personal Care & Service | 0 (0.0%) | 0 (0.0%) |
| Total (Category) | 14 (50.0%) | 14 (50.0%) |
| Total (Overall) | 95 (53.1%) | 84 (46.9%) |
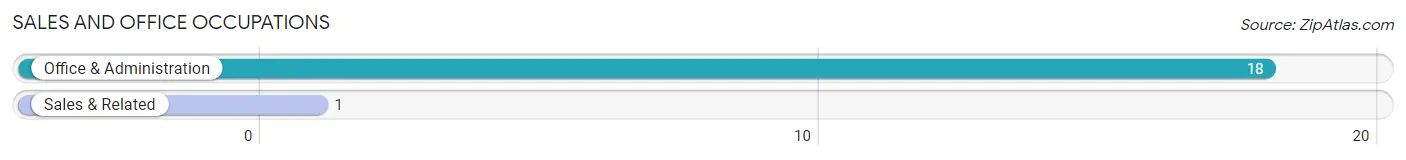
Sales and Office Occupations
The most common Sales and Office occupations in Laceyville borough are Office & Administration (18 | 10.1%), and Sales & Related (1 | 0.6%).
Sales and Office Occupations by Sex
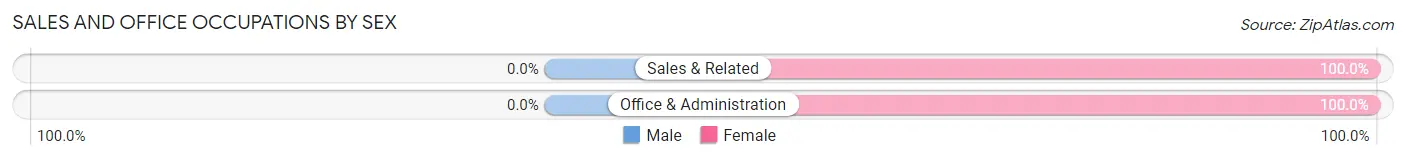
| Occupation | Male | Female |
| Sales & Related | 0 (0.0%) | 1 (100.0%) |
| Office & Administration | 0 (0.0%) | 18 (100.0%) |
| Total (Category) | 0 (0.0%) | 19 (100.0%) |
| Total (Overall) | 95 (53.1%) | 84 (46.9%) |
Natural Resources, Construction and Maintenance Occupations
The most common Natural Resources, Construction and Maintenance occupations in Laceyville borough are Construction & Extraction (13 | 7.3%), and Installation, Maintenance & Repair (11 | 6.1%).

Natural Resources, Construction and Maintenance Occupations by Sex
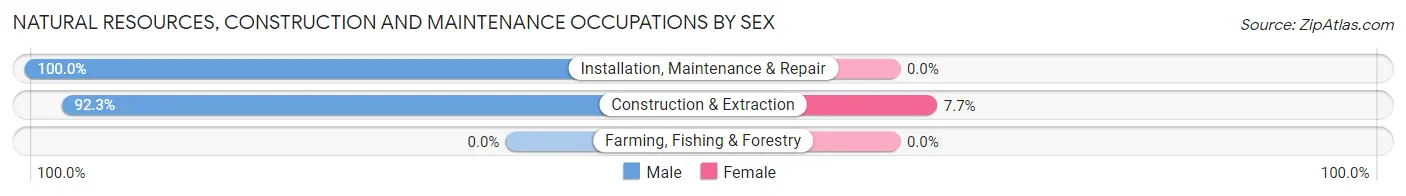
| Occupation | Male | Female |
| Farming, Fishing & Forestry | 0 (0.0%) | 0 (0.0%) |
| Construction & Extraction | 12 (92.3%) | 1 (7.7%) |
| Installation, Maintenance & Repair | 11 (100.0%) | 0 (0.0%) |
| Total (Category) | 23 (95.8%) | 1 (4.2%) |
| Total (Overall) | 95 (53.1%) | 84 (46.9%) |
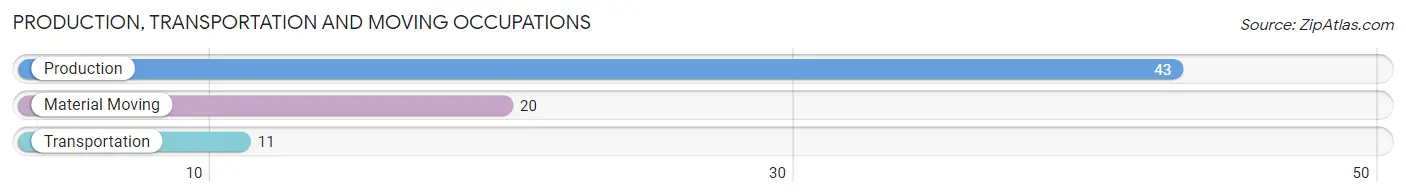
Production, Transportation and Moving Occupations
The most common Production, Transportation and Moving occupations in Laceyville borough are Production (43 | 24.0%), Material Moving (20 | 11.2%), and Transportation (11 | 6.1%).
Production, Transportation and Moving Occupations by Sex
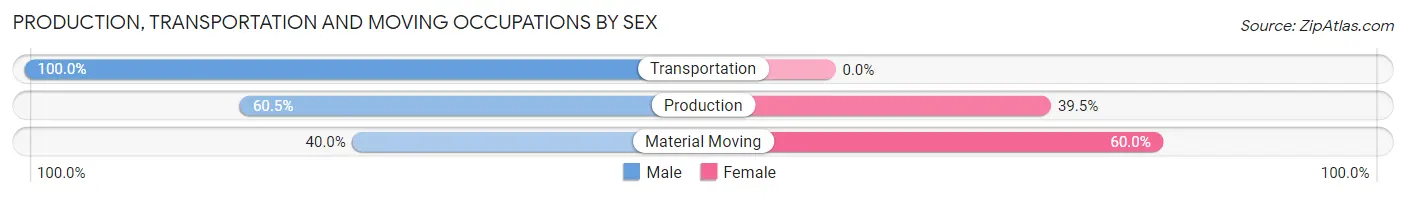
| Occupation | Male | Female |
| Production | 26 (60.5%) | 17 (39.5%) |
| Transportation | 11 (100.0%) | 0 (0.0%) |
| Material Moving | 8 (40.0%) | 12 (60.0%) |
| Total (Category) | 45 (60.8%) | 29 (39.2%) |
| Total (Overall) | 95 (53.1%) | 84 (46.9%) |
Employment Industries by Sex in Laceyville borough
Employment Industries in Laceyville borough
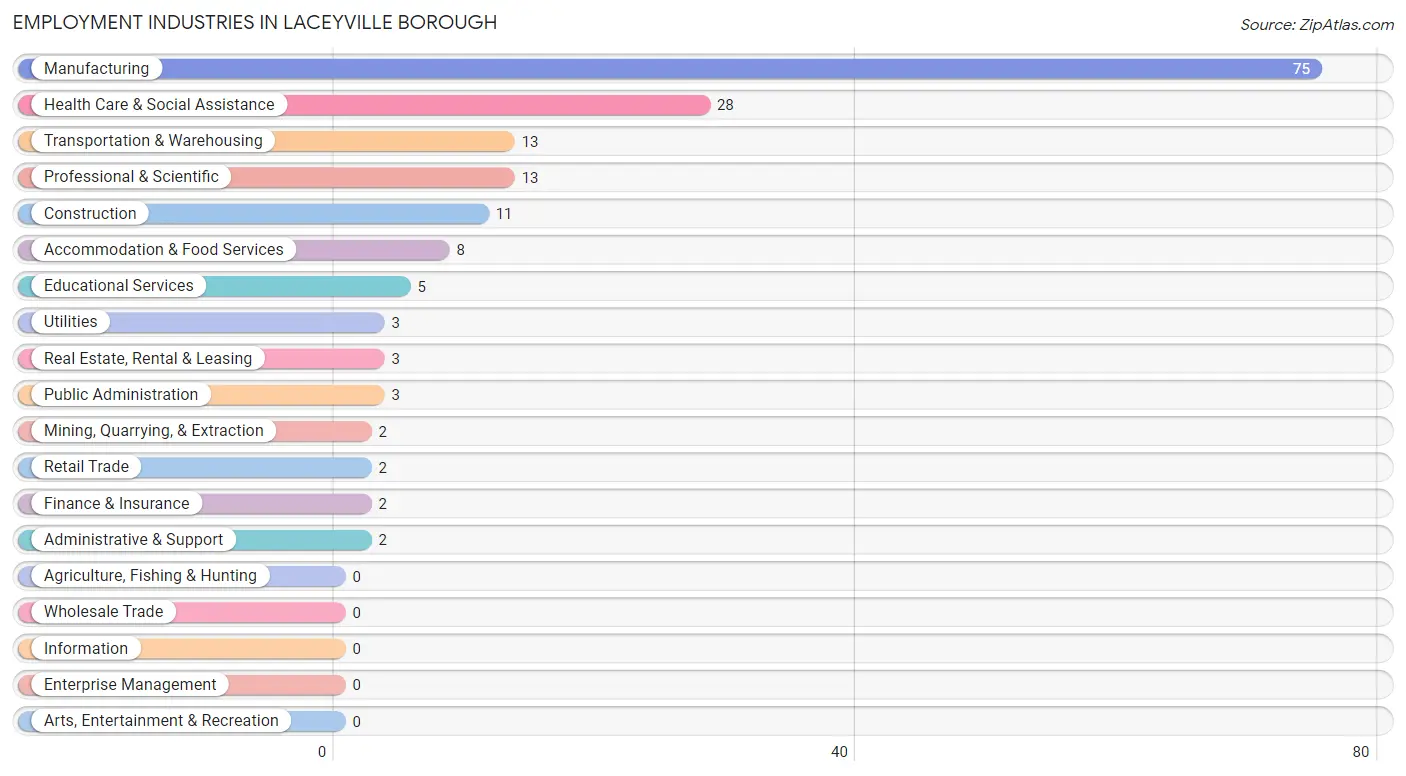
The major employment industries in Laceyville borough include Manufacturing (75 | 41.9%), Health Care & Social Assistance (28 | 15.6%), Transportation & Warehousing (13 | 7.3%), Professional & Scientific (13 | 7.3%), and Construction (11 | 6.1%).
Employment Industries by Sex in Laceyville borough
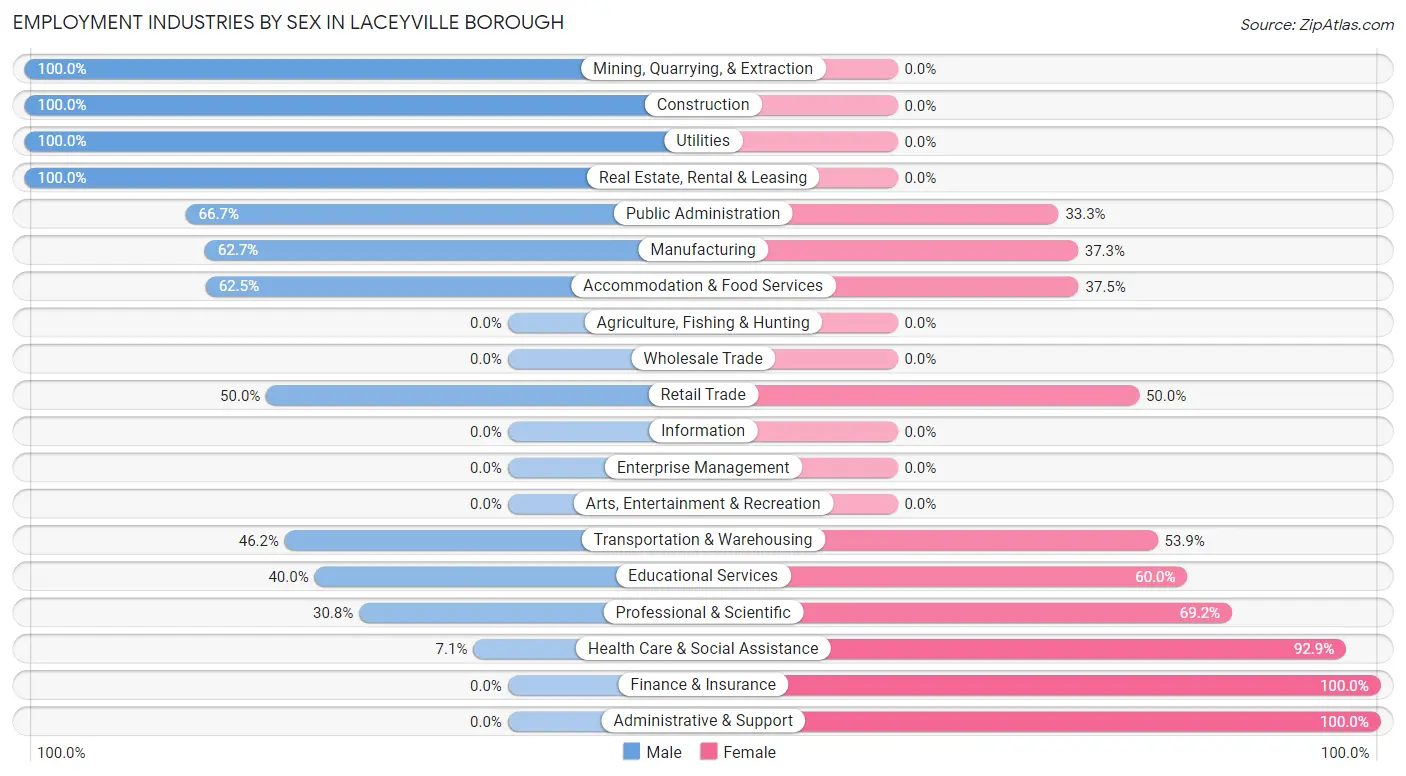
The Laceyville borough industries that see more men than women are Mining, Quarrying, & Extraction (100.0%), Construction (100.0%), and Utilities (100.0%), whereas the industries that tend to have a higher number of women are Finance & Insurance (100.0%), Administrative & Support (100.0%), and Health Care & Social Assistance (92.9%).
| Industry | Male | Female |
| Agriculture, Fishing & Hunting | 0 (0.0%) | 0 (0.0%) |
| Mining, Quarrying, & Extraction | 2 (100.0%) | 0 (0.0%) |
| Construction | 11 (100.0%) | 0 (0.0%) |
| Manufacturing | 47 (62.7%) | 28 (37.3%) |
| Wholesale Trade | 0 (0.0%) | 0 (0.0%) |
| Retail Trade | 1 (50.0%) | 1 (50.0%) |
| Transportation & Warehousing | 6 (46.2%) | 7 (53.8%) |
| Utilities | 3 (100.0%) | 0 (0.0%) |
| Information | 0 (0.0%) | 0 (0.0%) |
| Finance & Insurance | 0 (0.0%) | 2 (100.0%) |
| Real Estate, Rental & Leasing | 3 (100.0%) | 0 (0.0%) |
| Professional & Scientific | 4 (30.8%) | 9 (69.2%) |
| Enterprise Management | 0 (0.0%) | 0 (0.0%) |
| Administrative & Support | 0 (0.0%) | 2 (100.0%) |
| Educational Services | 2 (40.0%) | 3 (60.0%) |
| Health Care & Social Assistance | 2 (7.1%) | 26 (92.9%) |
| Arts, Entertainment & Recreation | 0 (0.0%) | 0 (0.0%) |
| Accommodation & Food Services | 5 (62.5%) | 3 (37.5%) |
| Public Administration | 2 (66.7%) | 1 (33.3%) |
| Total | 95 (53.1%) | 84 (46.9%) |
Education in Laceyville borough
School Enrollment in Laceyville borough
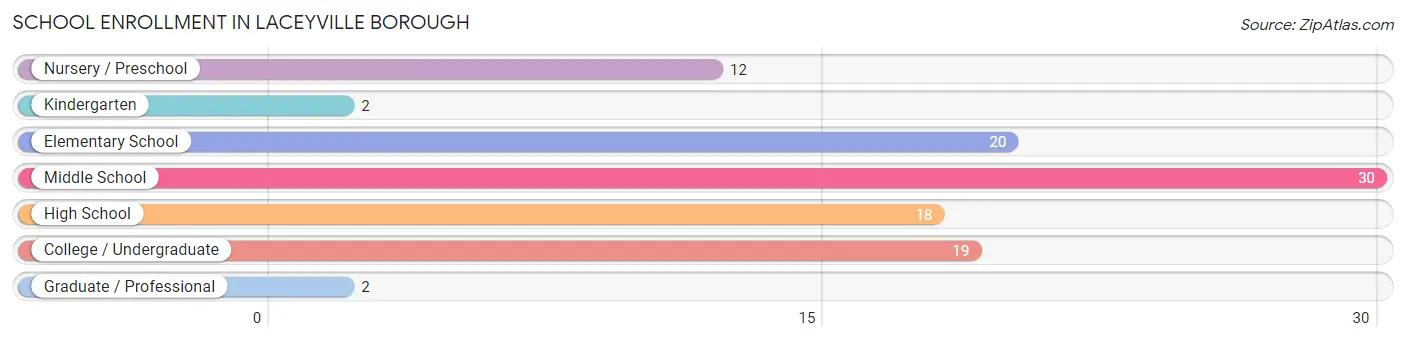
The most common levels of schooling among the 103 students in Laceyville borough are middle school (30 | 29.1%), elementary school (20 | 19.4%), and college / undergraduate (19 | 18.4%).
| School Level | # Students | % Students |
| Nursery / Preschool | 12 | 11.7% |
| Kindergarten | 2 | 1.9% |
| Elementary School | 20 | 19.4% |
| Middle School | 30 | 29.1% |
| High School | 18 | 17.5% |
| College / Undergraduate | 19 | 18.4% |
| Graduate / Professional | 2 | 1.9% |
| Total | 103 | 100.0% |
School Enrollment by Age by Funding Source in Laceyville borough
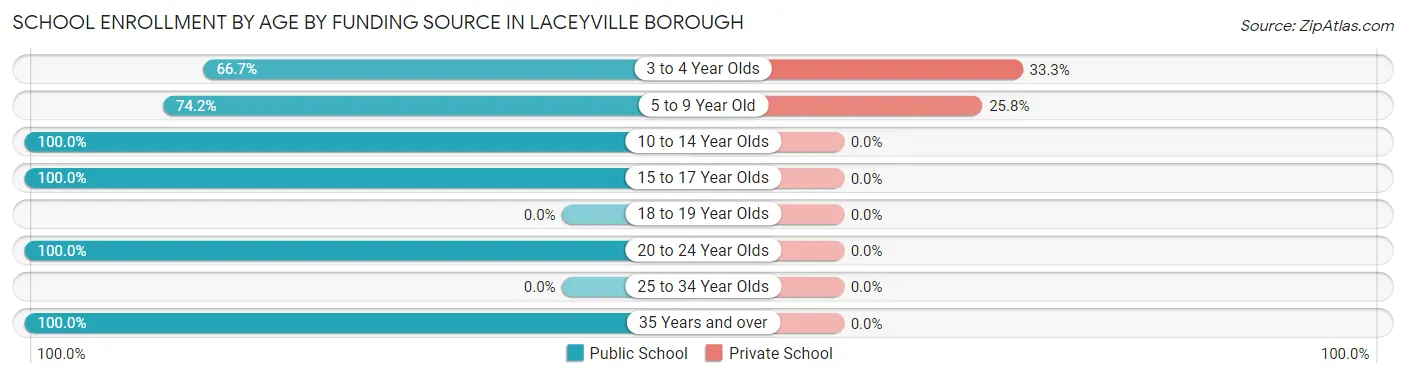
Out of a total of 103 students who are enrolled in schools in Laceyville borough, 9 (8.7%) attend a private institution, while the remaining 94 (91.3%) are enrolled in public schools. The age group of 3 to 4 year olds has the highest likelihood of being enrolled in private schools, with 1 (33.3% in the age bracket) enrolled. Conversely, the age group of 10 to 14 year olds has the lowest likelihood of being enrolled in a private school, with 30 (100.0% in the age bracket) attending a public institution.
| Age Bracket | Public School | Private School |
| 3 to 4 Year Olds | 2 (66.7%) | 1 (33.3%) |
| 5 to 9 Year Old | 23 (74.2%) | 8 (25.8%) |
| 10 to 14 Year Olds | 30 (100.0%) | 0 (0.0%) |
| 15 to 17 Year Olds | 18 (100.0%) | 0 (0.0%) |
| 18 to 19 Year Olds | 0 (0.0%) | 0 (0.0%) |
| 20 to 24 Year Olds | 3 (100.0%) | 0 (0.0%) |
| 25 to 34 Year Olds | 0 (0.0%) | 0 (0.0%) |
| 35 Years and over | 18 (100.0%) | 0 (0.0%) |
| Total | 94 (91.3%) | 9 (8.7%) |
Educational Attainment by Field of Study in Laceyville borough
Business (9 | 25.0%), education (9 | 25.0%), science & technology (6 | 16.7%), liberal arts & history (5 | 13.9%), and physical & health sciences (4 | 11.1%) are the most common fields of study among 36 individuals in Laceyville borough who have obtained a bachelor's degree or higher.
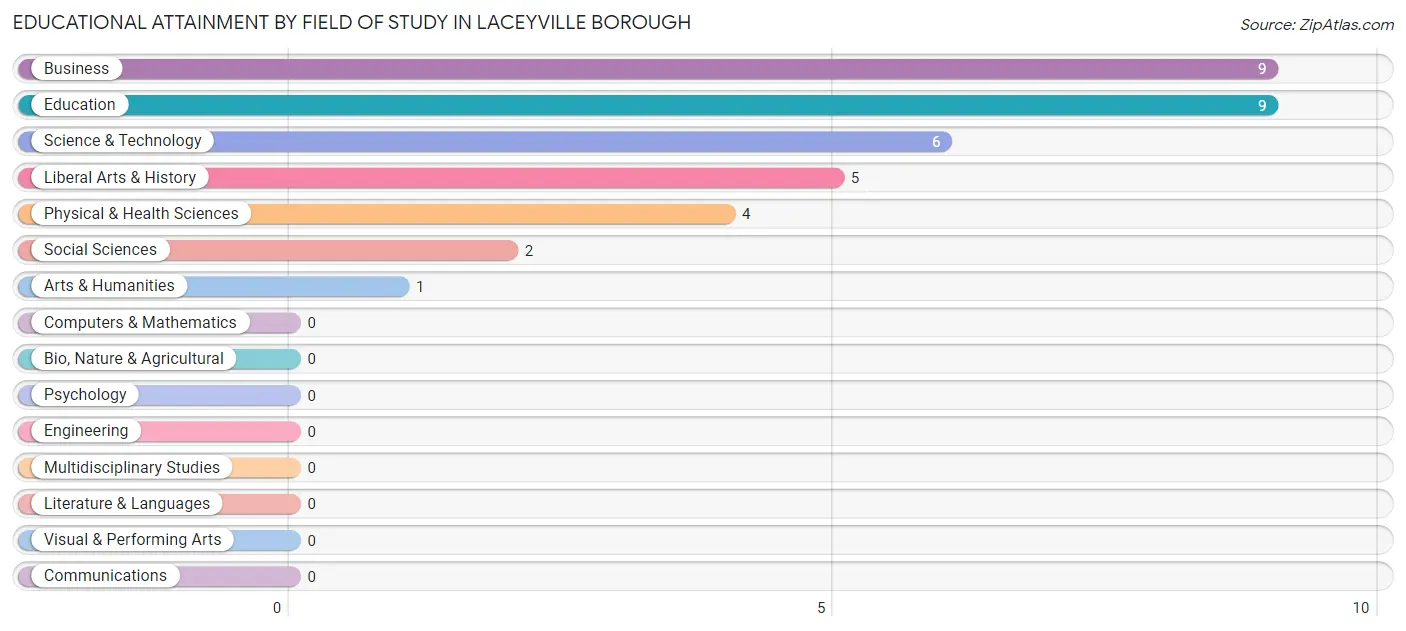
| Field of Study | # Graduates | % Graduates |
| Computers & Mathematics | 0 | 0.0% |
| Bio, Nature & Agricultural | 0 | 0.0% |
| Physical & Health Sciences | 4 | 11.1% |
| Psychology | 0 | 0.0% |
| Social Sciences | 2 | 5.6% |
| Engineering | 0 | 0.0% |
| Multidisciplinary Studies | 0 | 0.0% |
| Science & Technology | 6 | 16.7% |
| Business | 9 | 25.0% |
| Education | 9 | 25.0% |
| Literature & Languages | 0 | 0.0% |
| Liberal Arts & History | 5 | 13.9% |
| Visual & Performing Arts | 0 | 0.0% |
| Communications | 0 | 0.0% |
| Arts & Humanities | 1 | 2.8% |
| Total | 36 | 100.0% |
Transportation & Commute in Laceyville borough
Vehicle Availability by Sex in Laceyville borough
The most prevalent vehicle ownership categories in Laceyville borough are males with 2 vehicles (45, accounting for 47.9%) and females with 2 vehicles (44, making up 53.6%).
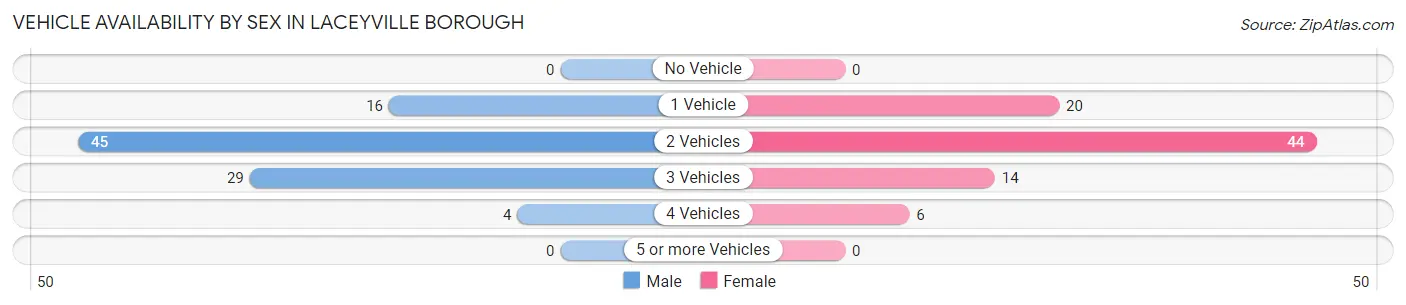
| Vehicles Available | Male | Female |
| No Vehicle | 0 (0.0%) | 0 (0.0%) |
| 1 Vehicle | 16 (17.0%) | 20 (23.8%) |
| 2 Vehicles | 45 (47.9%) | 44 (52.4%) |
| 3 Vehicles | 29 (30.8%) | 14 (16.7%) |
| 4 Vehicles | 4 (4.3%) | 6 (7.1%) |
| 5 or more Vehicles | 0 (0.0%) | 0 (0.0%) |
| Total | 94 (100.0%) | 84 (100.0%) |
Commute Time in Laceyville borough
The most frequently occuring commute durations in Laceyville borough are 10 to 14 minutes (35 commuters, 20.0%), 20 to 24 minutes (32 commuters, 18.3%), and 15 to 19 minutes (30 commuters, 17.1%).
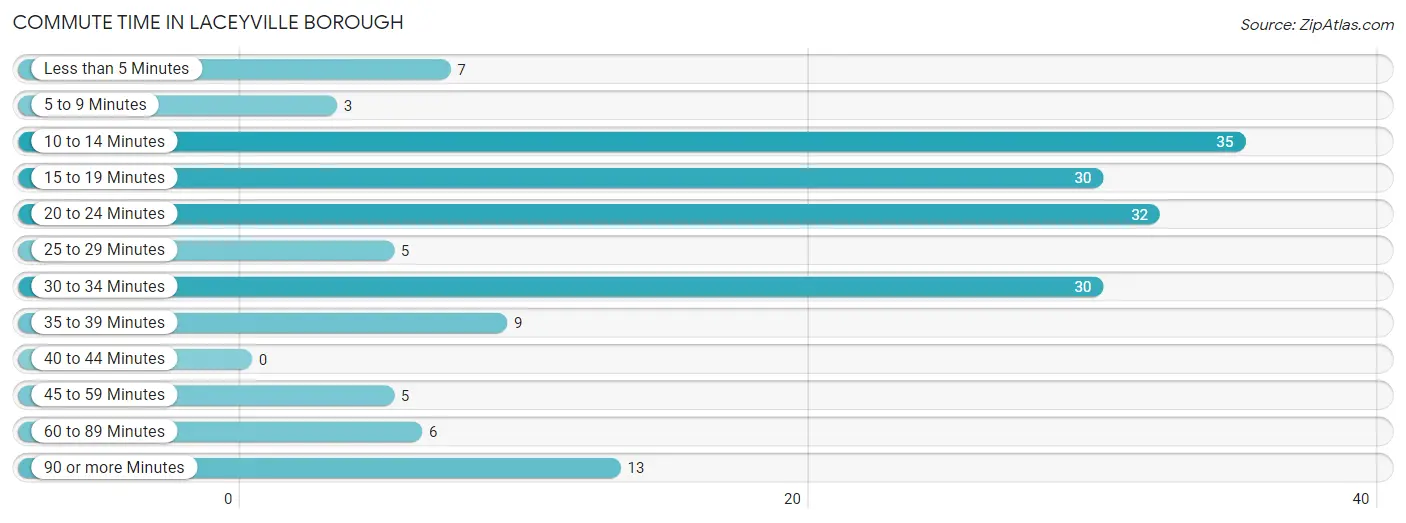
| Commute Time | # Commuters | % Commuters |
| Less than 5 Minutes | 7 | 4.0% |
| 5 to 9 Minutes | 3 | 1.7% |
| 10 to 14 Minutes | 35 | 20.0% |
| 15 to 19 Minutes | 30 | 17.1% |
| 20 to 24 Minutes | 32 | 18.3% |
| 25 to 29 Minutes | 5 | 2.9% |
| 30 to 34 Minutes | 30 | 17.1% |
| 35 to 39 Minutes | 9 | 5.1% |
| 40 to 44 Minutes | 0 | 0.0% |
| 45 to 59 Minutes | 5 | 2.9% |
| 60 to 89 Minutes | 6 | 3.4% |
| 90 or more Minutes | 13 | 7.4% |
Commute Time by Sex in Laceyville borough
The most common commute times in Laceyville borough are 20 to 24 minutes (19 commuters, 20.9%) for males and 10 to 14 minutes (22 commuters, 26.2%) for females.
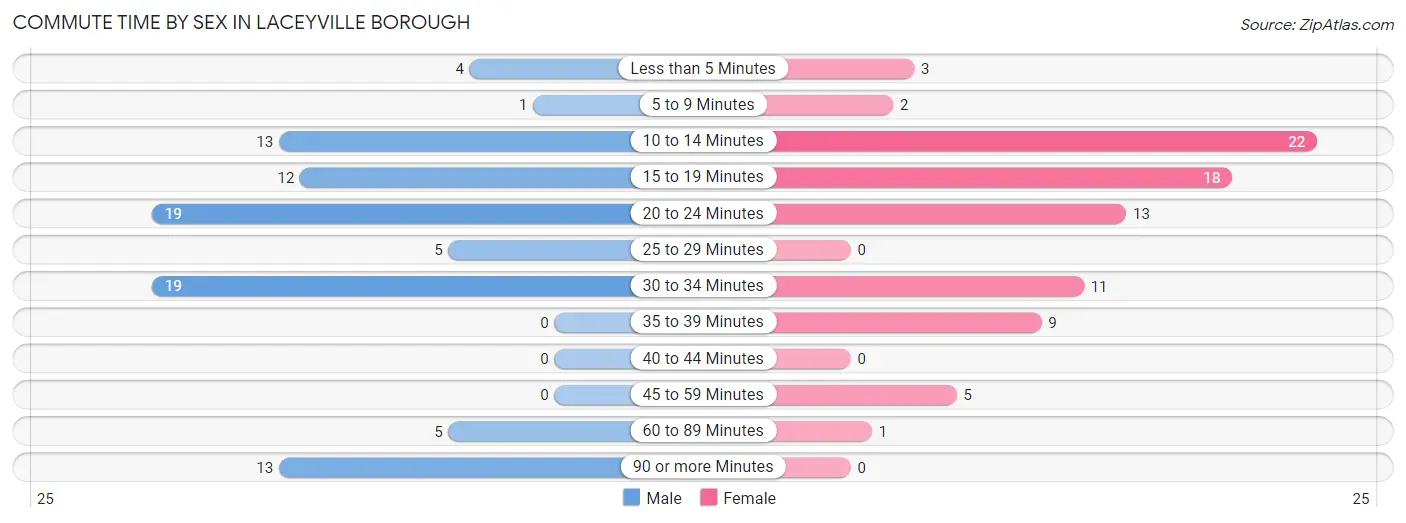
| Commute Time | Male | Female |
| Less than 5 Minutes | 4 (4.4%) | 3 (3.6%) |
| 5 to 9 Minutes | 1 (1.1%) | 2 (2.4%) |
| 10 to 14 Minutes | 13 (14.3%) | 22 (26.2%) |
| 15 to 19 Minutes | 12 (13.2%) | 18 (21.4%) |
| 20 to 24 Minutes | 19 (20.9%) | 13 (15.5%) |
| 25 to 29 Minutes | 5 (5.5%) | 0 (0.0%) |
| 30 to 34 Minutes | 19 (20.9%) | 11 (13.1%) |
| 35 to 39 Minutes | 0 (0.0%) | 9 (10.7%) |
| 40 to 44 Minutes | 0 (0.0%) | 0 (0.0%) |
| 45 to 59 Minutes | 0 (0.0%) | 5 (5.9%) |
| 60 to 89 Minutes | 5 (5.5%) | 1 (1.2%) |
| 90 or more Minutes | 13 (14.3%) | 0 (0.0%) |
Time of Departure to Work by Sex in Laceyville borough
The most frequent times of departure to work in Laceyville borough are 12:00 AM to 4:59 AM (21, 23.1%) for males and 5:00 AM to 5:29 AM (17, 20.2%) for females.
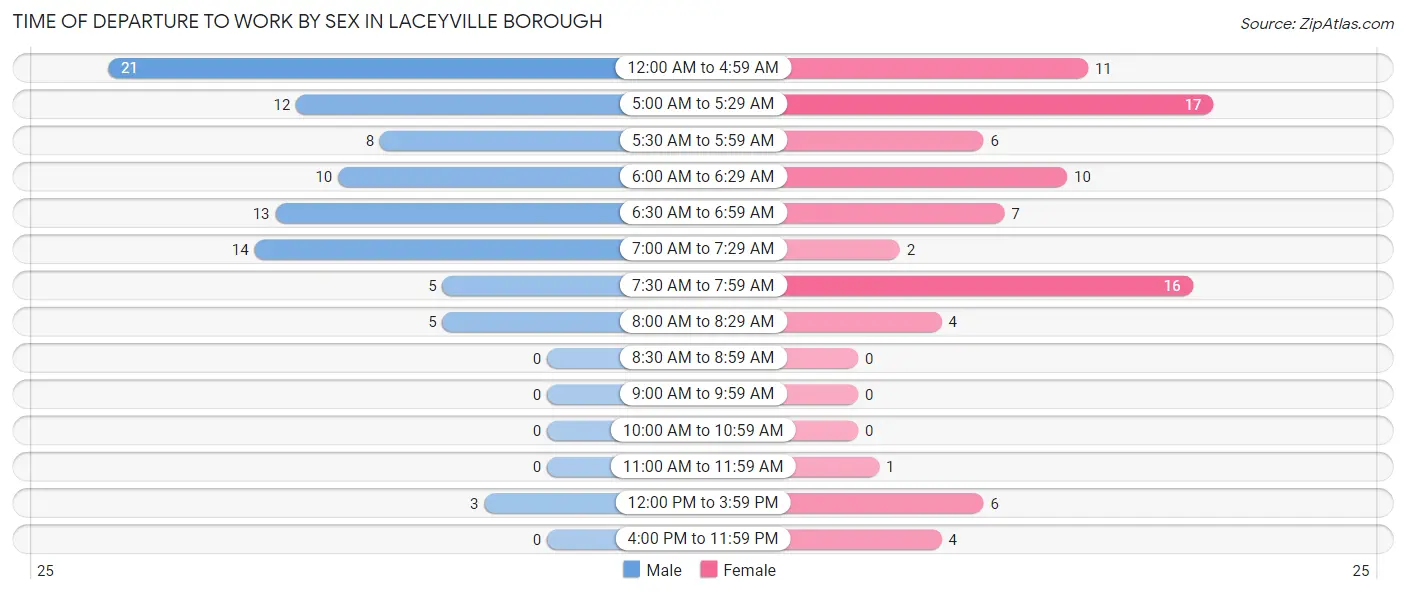
| Time of Departure | Male | Female |
| 12:00 AM to 4:59 AM | 21 (23.1%) | 11 (13.1%) |
| 5:00 AM to 5:29 AM | 12 (13.2%) | 17 (20.2%) |
| 5:30 AM to 5:59 AM | 8 (8.8%) | 6 (7.1%) |
| 6:00 AM to 6:29 AM | 10 (11.0%) | 10 (11.9%) |
| 6:30 AM to 6:59 AM | 13 (14.3%) | 7 (8.3%) |
| 7:00 AM to 7:29 AM | 14 (15.4%) | 2 (2.4%) |
| 7:30 AM to 7:59 AM | 5 (5.5%) | 16 (19.1%) |
| 8:00 AM to 8:29 AM | 5 (5.5%) | 4 (4.8%) |
| 8:30 AM to 8:59 AM | 0 (0.0%) | 0 (0.0%) |
| 9:00 AM to 9:59 AM | 0 (0.0%) | 0 (0.0%) |
| 10:00 AM to 10:59 AM | 0 (0.0%) | 0 (0.0%) |
| 11:00 AM to 11:59 AM | 0 (0.0%) | 1 (1.2%) |
| 12:00 PM to 3:59 PM | 3 (3.3%) | 6 (7.1%) |
| 4:00 PM to 11:59 PM | 0 (0.0%) | 4 (4.8%) |
| Total | 91 (100.0%) | 84 (100.0%) |
Housing Occupancy in Laceyville borough
Occupancy by Ownership in Laceyville borough
Of the total 142 dwellings in Laceyville borough, owner-occupied units account for 86 (60.6%), while renter-occupied units make up 56 (39.4%).
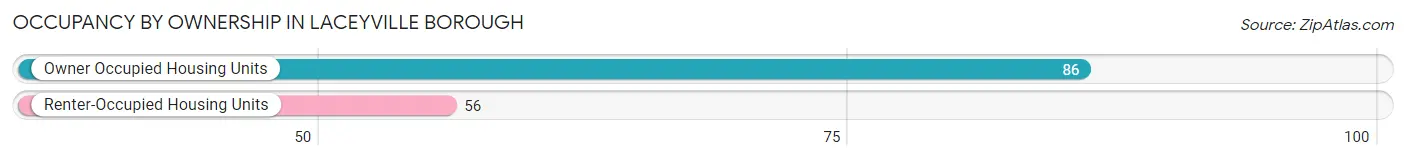
| Occupancy | # Housing Units | % Housing Units |
| Owner Occupied Housing Units | 86 | 60.6% |
| Renter-Occupied Housing Units | 56 | 39.4% |
| Total Occupied Housing Units | 142 | 100.0% |
Occupancy by Household Size in Laceyville borough
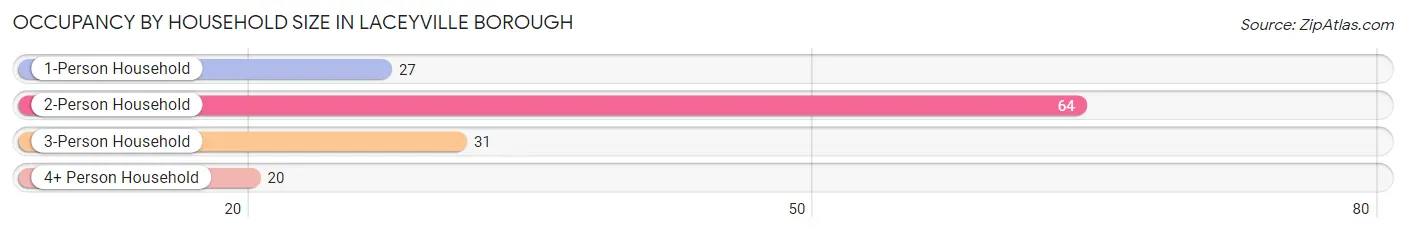
| Household Size | # Housing Units | % Housing Units |
| 1-Person Household | 27 | 19.0% |
| 2-Person Household | 64 | 45.1% |
| 3-Person Household | 31 | 21.8% |
| 4+ Person Household | 20 | 14.1% |
| Total Housing Units | 142 | 100.0% |
Occupancy by Ownership by Household Size in Laceyville borough
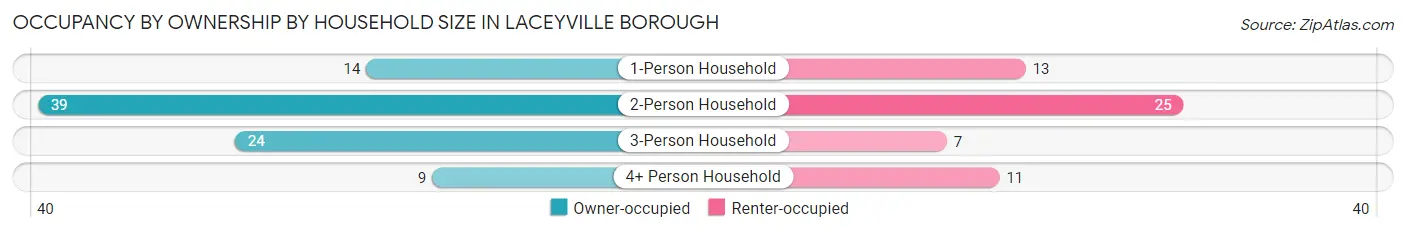
| Household Size | Owner-occupied | Renter-occupied |
| 1-Person Household | 14 (51.8%) | 13 (48.1%) |
| 2-Person Household | 39 (60.9%) | 25 (39.1%) |
| 3-Person Household | 24 (77.4%) | 7 (22.6%) |
| 4+ Person Household | 9 (45.0%) | 11 (55.0%) |
| Total Housing Units | 86 (60.6%) | 56 (39.4%) |
Occupancy by Educational Attainment in Laceyville borough
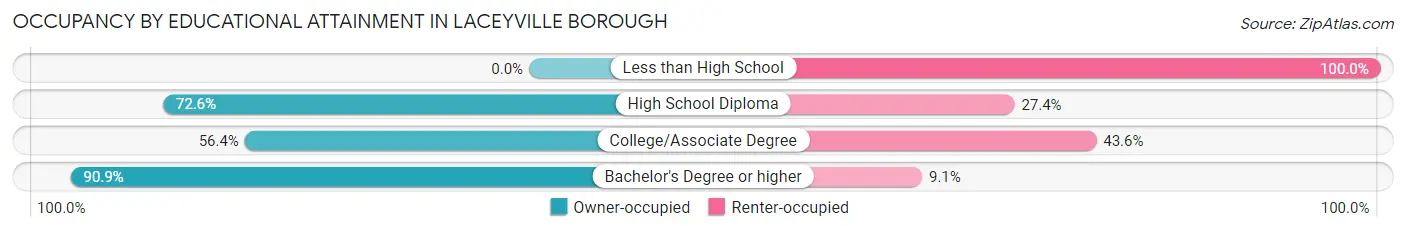
| Household Size | Owner-occupied | Renter-occupied |
| Less than High School | 0 (0.0%) | 14 (100.0%) |
| High School Diploma | 45 (72.6%) | 17 (27.4%) |
| College/Associate Degree | 31 (56.4%) | 24 (43.6%) |
| Bachelor's Degree or higher | 10 (90.9%) | 1 (9.1%) |
Occupancy by Age of Householder in Laceyville borough
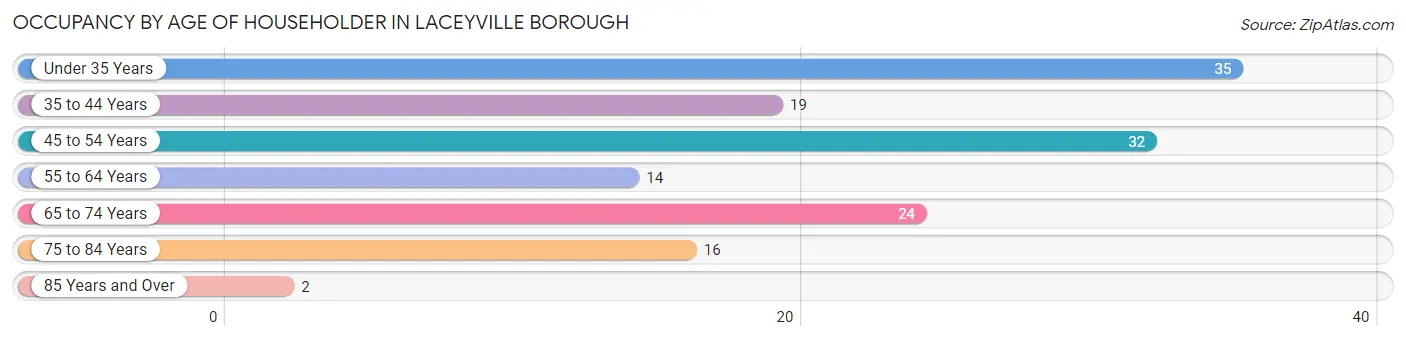
| Age Bracket | # Households | % Households |
| Under 35 Years | 35 | 24.6% |
| 35 to 44 Years | 19 | 13.4% |
| 45 to 54 Years | 32 | 22.5% |
| 55 to 64 Years | 14 | 9.9% |
| 65 to 74 Years | 24 | 16.9% |
| 75 to 84 Years | 16 | 11.3% |
| 85 Years and Over | 2 | 1.4% |
| Total | 142 | 100.0% |
Housing Finances in Laceyville borough
Median Income by Occupancy in Laceyville borough
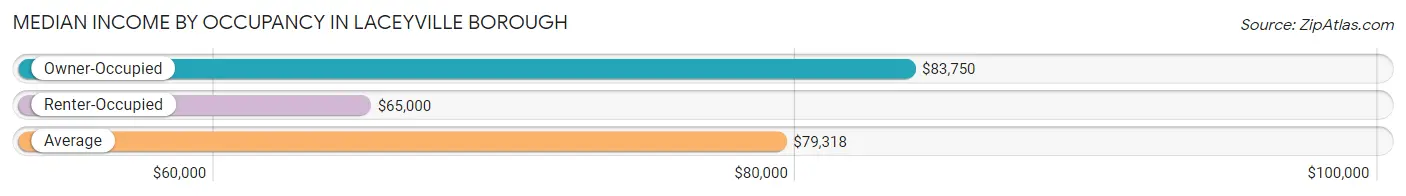
| Occupancy Type | # Households | Median Income |
| Owner-Occupied | 86 (60.6%) | $83,750 |
| Renter-Occupied | 56 (39.4%) | $65,000 |
| Average | 142 (100.0%) | $79,318 |
Occupancy by Householder Income Bracket in Laceyville borough
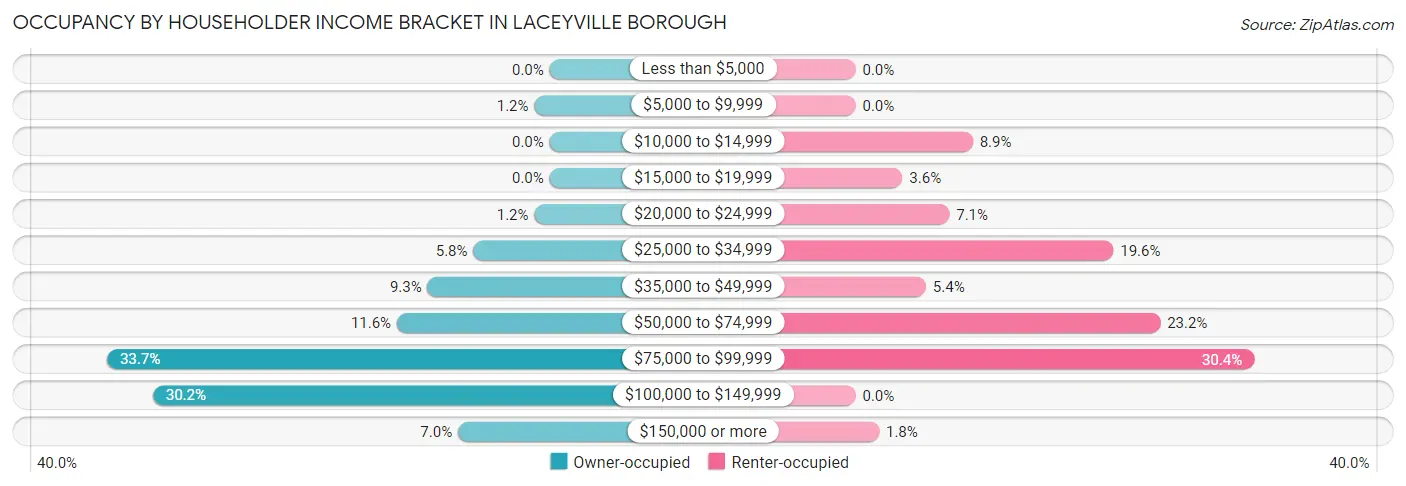
| Income Bracket | Owner-occupied | Renter-occupied |
| Less than $5,000 | 0 (0.0%) | 0 (0.0%) |
| $5,000 to $9,999 | 1 (1.2%) | 0 (0.0%) |
| $10,000 to $14,999 | 0 (0.0%) | 5 (8.9%) |
| $15,000 to $19,999 | 0 (0.0%) | 2 (3.6%) |
| $20,000 to $24,999 | 1 (1.2%) | 4 (7.1%) |
| $25,000 to $34,999 | 5 (5.8%) | 11 (19.6%) |
| $35,000 to $49,999 | 8 (9.3%) | 3 (5.4%) |
| $50,000 to $74,999 | 10 (11.6%) | 13 (23.2%) |
| $75,000 to $99,999 | 29 (33.7%) | 17 (30.4%) |
| $100,000 to $149,999 | 26 (30.2%) | 0 (0.0%) |
| $150,000 or more | 6 (7.0%) | 1 (1.8%) |
| Total | 86 (100.0%) | 56 (100.0%) |
Monthly Housing Cost Tiers in Laceyville borough
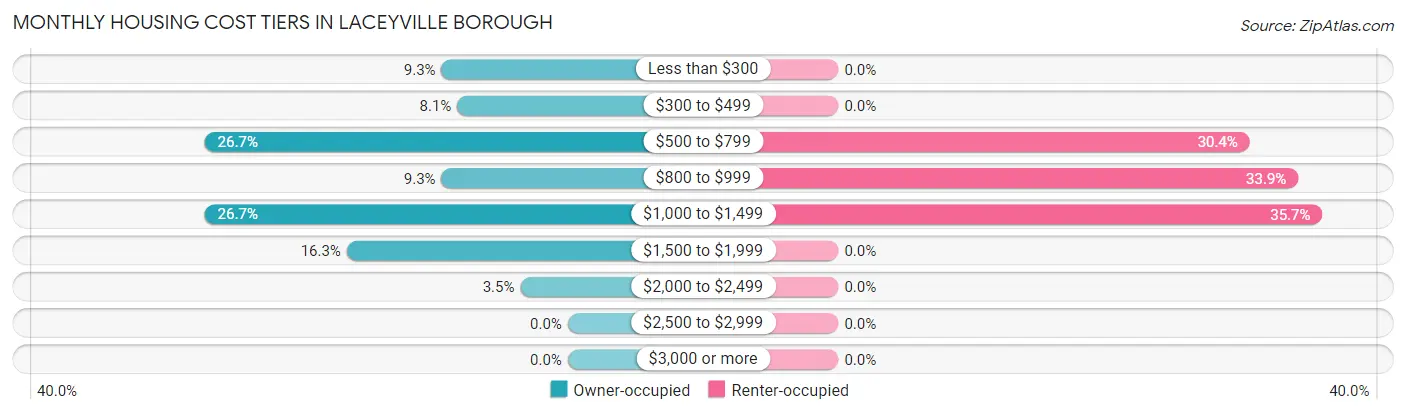
| Monthly Cost | Owner-occupied | Renter-occupied |
| Less than $300 | 8 (9.3%) | 0 (0.0%) |
| $300 to $499 | 7 (8.1%) | 0 (0.0%) |
| $500 to $799 | 23 (26.7%) | 17 (30.4%) |
| $800 to $999 | 8 (9.3%) | 19 (33.9%) |
| $1,000 to $1,499 | 23 (26.7%) | 20 (35.7%) |
| $1,500 to $1,999 | 14 (16.3%) | 0 (0.0%) |
| $2,000 to $2,499 | 3 (3.5%) | 0 (0.0%) |
| $2,500 to $2,999 | 0 (0.0%) | 0 (0.0%) |
| $3,000 or more | 0 (0.0%) | 0 (0.0%) |
| Total | 86 (100.0%) | 56 (100.0%) |
Physical Housing Characteristics in Laceyville borough
Housing Structures in Laceyville borough
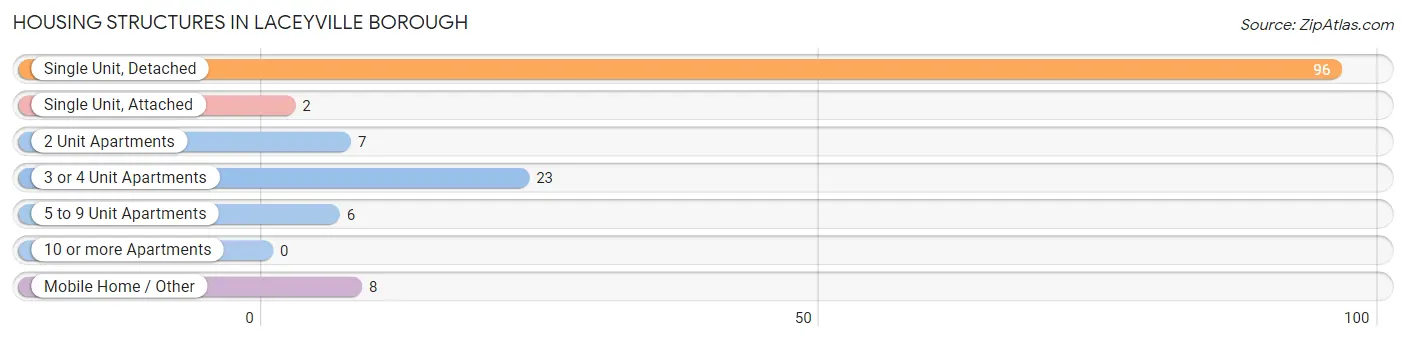
| Structure Type | # Housing Units | % Housing Units |
| Single Unit, Detached | 96 | 67.6% |
| Single Unit, Attached | 2 | 1.4% |
| 2 Unit Apartments | 7 | 4.9% |
| 3 or 4 Unit Apartments | 23 | 16.2% |
| 5 to 9 Unit Apartments | 6 | 4.2% |
| 10 or more Apartments | 0 | 0.0% |
| Mobile Home / Other | 8 | 5.6% |
| Total | 142 | 100.0% |
Housing Structures by Occupancy in Laceyville borough
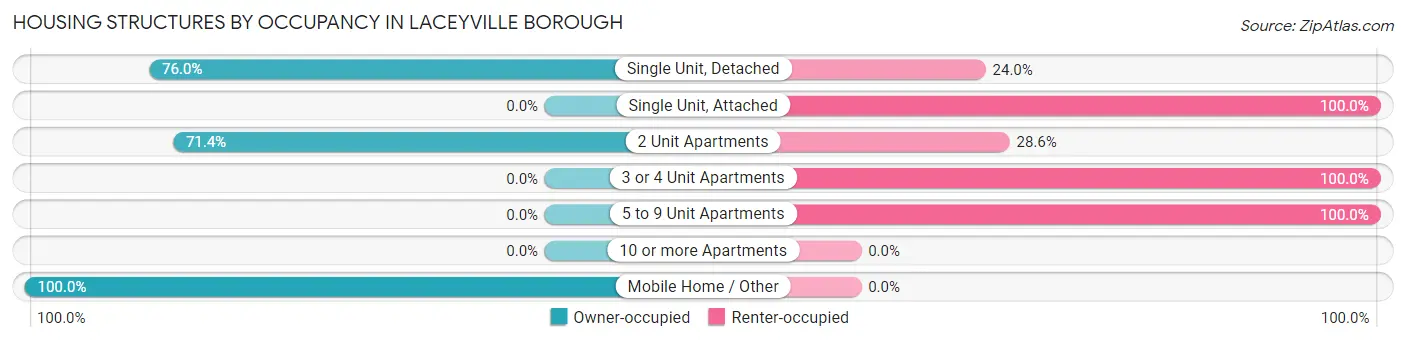
| Structure Type | Owner-occupied | Renter-occupied |
| Single Unit, Detached | 73 (76.0%) | 23 (24.0%) |
| Single Unit, Attached | 0 (0.0%) | 2 (100.0%) |
| 2 Unit Apartments | 5 (71.4%) | 2 (28.6%) |
| 3 or 4 Unit Apartments | 0 (0.0%) | 23 (100.0%) |
| 5 to 9 Unit Apartments | 0 (0.0%) | 6 (100.0%) |
| 10 or more Apartments | 0 (0.0%) | 0 (0.0%) |
| Mobile Home / Other | 8 (100.0%) | 0 (0.0%) |
| Total | 86 (60.6%) | 56 (39.4%) |
Housing Structures by Number of Rooms in Laceyville borough
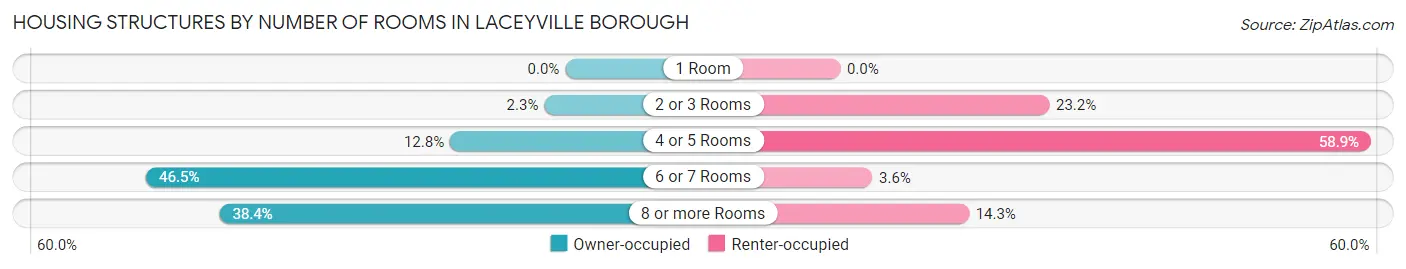
| Number of Rooms | Owner-occupied | Renter-occupied |
| 1 Room | 0 (0.0%) | 0 (0.0%) |
| 2 or 3 Rooms | 2 (2.3%) | 13 (23.2%) |
| 4 or 5 Rooms | 11 (12.8%) | 33 (58.9%) |
| 6 or 7 Rooms | 40 (46.5%) | 2 (3.6%) |
| 8 or more Rooms | 33 (38.4%) | 8 (14.3%) |
| Total | 86 (100.0%) | 56 (100.0%) |
Housing Structure by Heating Type in Laceyville borough
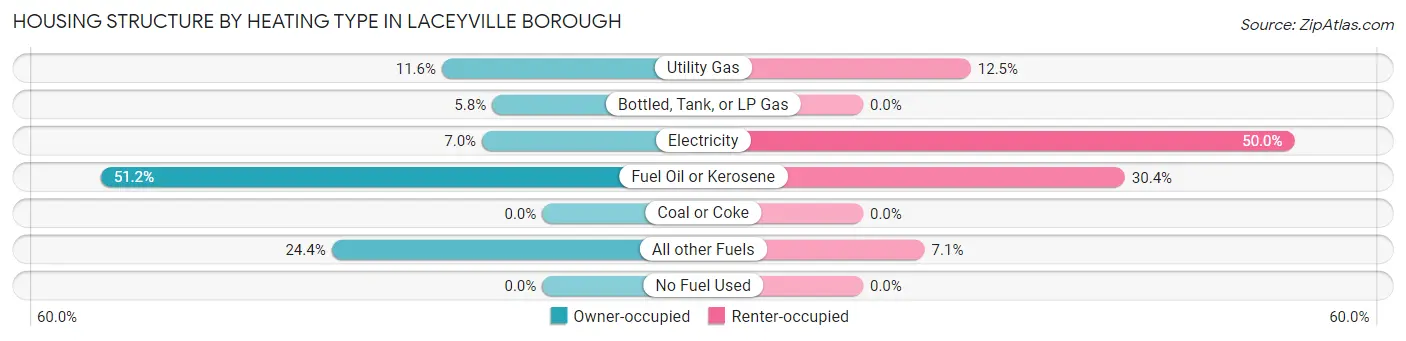
| Heating Type | Owner-occupied | Renter-occupied |
| Utility Gas | 10 (11.6%) | 7 (12.5%) |
| Bottled, Tank, or LP Gas | 5 (5.8%) | 0 (0.0%) |
| Electricity | 6 (7.0%) | 28 (50.0%) |
| Fuel Oil or Kerosene | 44 (51.2%) | 17 (30.4%) |
| Coal or Coke | 0 (0.0%) | 0 (0.0%) |
| All other Fuels | 21 (24.4%) | 4 (7.1%) |
| No Fuel Used | 0 (0.0%) | 0 (0.0%) |
| Total | 86 (100.0%) | 56 (100.0%) |
Household Vehicle Usage in Laceyville borough
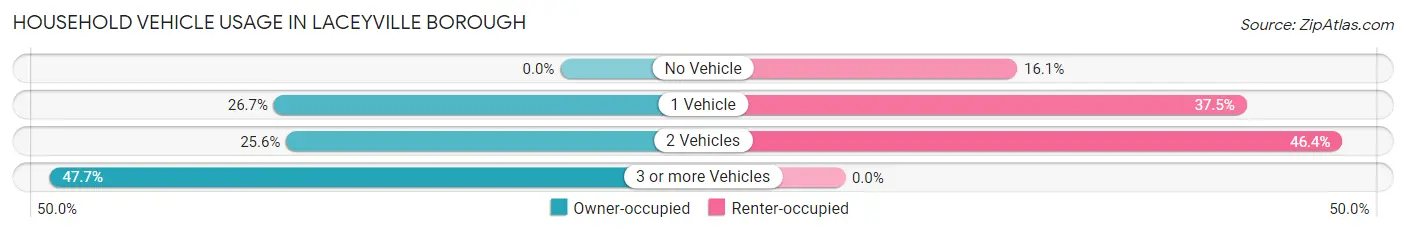
| Vehicles per Household | Owner-occupied | Renter-occupied |
| No Vehicle | 0 (0.0%) | 9 (16.1%) |
| 1 Vehicle | 23 (26.7%) | 21 (37.5%) |
| 2 Vehicles | 22 (25.6%) | 26 (46.4%) |
| 3 or more Vehicles | 41 (47.7%) | 0 (0.0%) |
| Total | 86 (100.0%) | 56 (100.0%) |
Real Estate & Mortgages in Laceyville borough
Real Estate and Mortgage Overview in Laceyville borough
| Characteristic | Without Mortgage | With Mortgage |
| Housing Units | 41 | 45 |
| Median Property Value | $118,800 | $123,900 |
| Median Household Income | $79,844 | $5 |
| Monthly Housing Costs | $579 | $0 |
| Real Estate Taxes | $2,500 | $0 |
Property Value by Mortgage Status in Laceyville borough
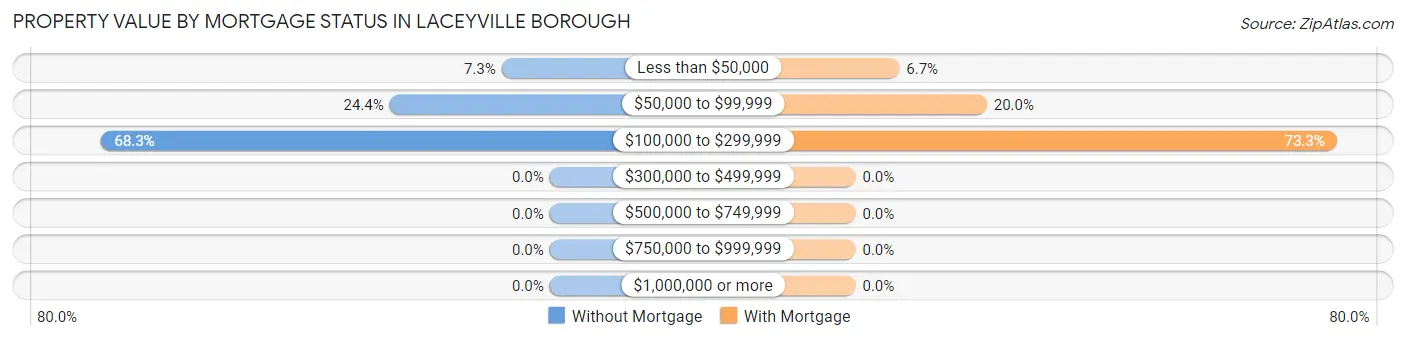
| Property Value | Without Mortgage | With Mortgage |
| Less than $50,000 | 3 (7.3%) | 3 (6.7%) |
| $50,000 to $99,999 | 10 (24.4%) | 9 (20.0%) |
| $100,000 to $299,999 | 28 (68.3%) | 33 (73.3%) |
| $300,000 to $499,999 | 0 (0.0%) | 0 (0.0%) |
| $500,000 to $749,999 | 0 (0.0%) | 0 (0.0%) |
| $750,000 to $999,999 | 0 (0.0%) | 0 (0.0%) |
| $1,000,000 or more | 0 (0.0%) | 0 (0.0%) |
| Total | 41 (100.0%) | 45 (100.0%) |
Household Income by Mortgage Status in Laceyville borough
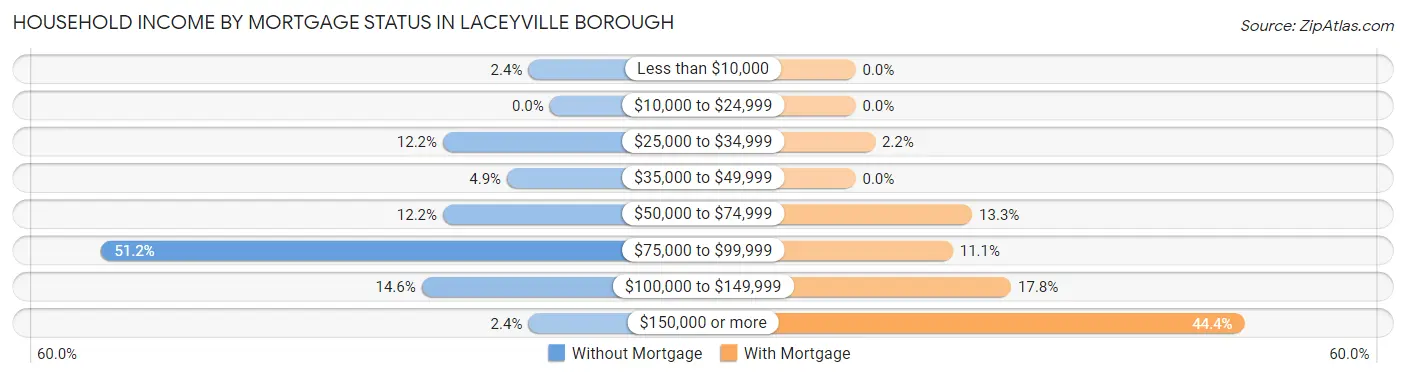
| Household Income | Without Mortgage | With Mortgage |
| Less than $10,000 | 1 (2.4%) | 0 (0.0%) |
| $10,000 to $24,999 | 0 (0.0%) | 0 (0.0%) |
| $25,000 to $34,999 | 5 (12.2%) | 1 (2.2%) |
| $35,000 to $49,999 | 2 (4.9%) | 0 (0.0%) |
| $50,000 to $74,999 | 5 (12.2%) | 6 (13.3%) |
| $75,000 to $99,999 | 21 (51.2%) | 5 (11.1%) |
| $100,000 to $149,999 | 6 (14.6%) | 8 (17.8%) |
| $150,000 or more | 1 (2.4%) | 20 (44.4%) |
| Total | 41 (100.0%) | 45 (100.0%) |
Property Value to Household Income Ratio in Laceyville borough
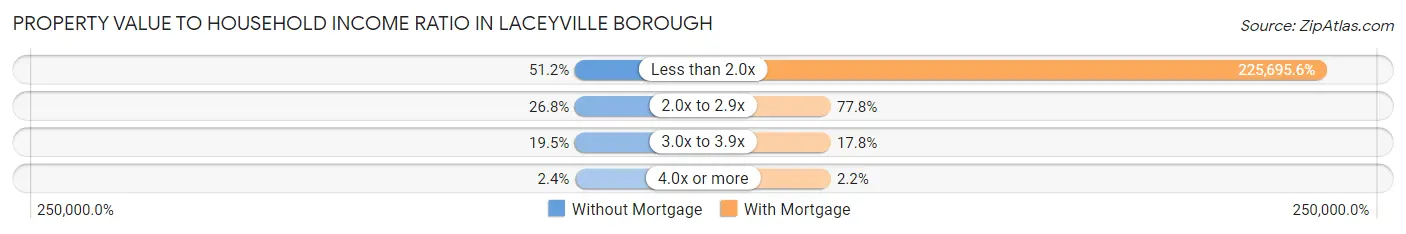
| Value-to-Income Ratio | Without Mortgage | With Mortgage |
| Less than 2.0x | 21 (51.2%) | 101,563 (225,695.6%) |
| 2.0x to 2.9x | 11 (26.8%) | 35 (77.8%) |
| 3.0x to 3.9x | 8 (19.5%) | 8 (17.8%) |
| 4.0x or more | 1 (2.4%) | 1 (2.2%) |
| Total | 41 (100.0%) | 45 (100.0%) |
Real Estate Taxes by Mortgage Status in Laceyville borough
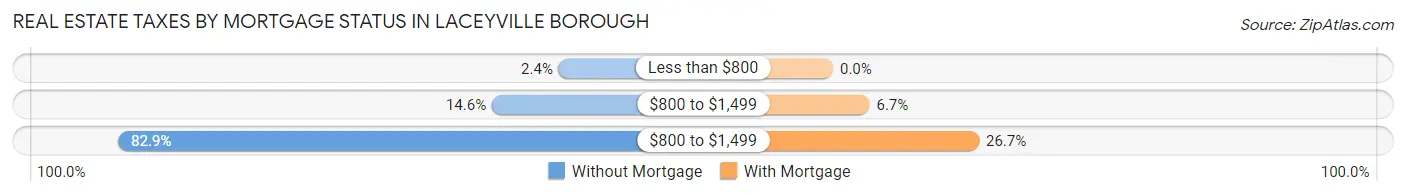
| Property Taxes | Without Mortgage | With Mortgage |
| Less than $800 | 1 (2.4%) | 0 (0.0%) |
| $800 to $1,499 | 6 (14.6%) | 3 (6.7%) |
| $800 to $1,499 | 34 (82.9%) | 12 (26.7%) |
| Total | 41 (100.0%) | 45 (100.0%) |
Health & Disability in Laceyville borough
Health Insurance Coverage by Age in Laceyville borough
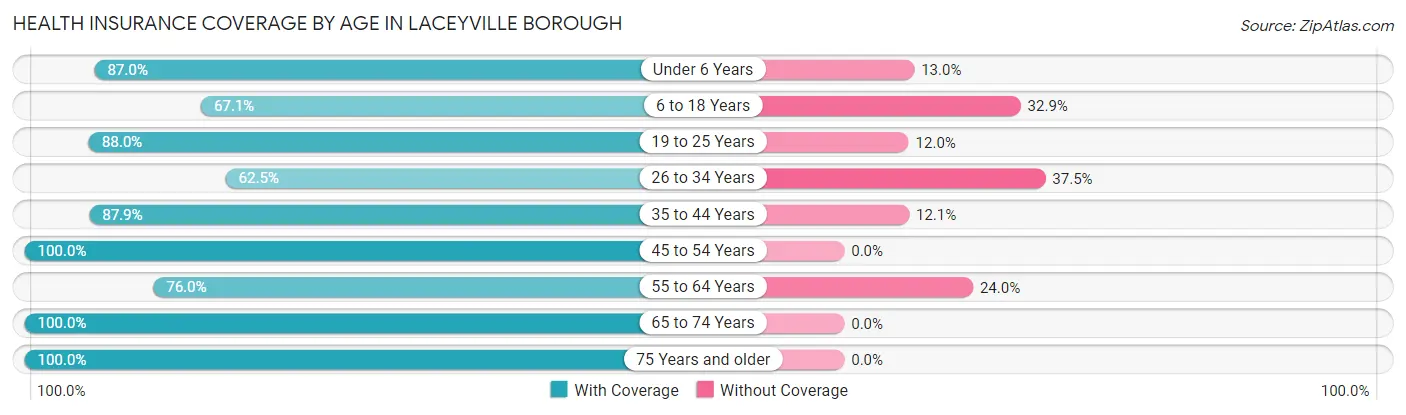
| Age Bracket | With Coverage | Without Coverage |
| Under 6 Years | 20 (87.0%) | 3 (13.0%) |
| 6 to 18 Years | 51 (67.1%) | 25 (32.9%) |
| 19 to 25 Years | 22 (88.0%) | 3 (12.0%) |
| 26 to 34 Years | 35 (62.5%) | 21 (37.5%) |
| 35 to 44 Years | 51 (87.9%) | 7 (12.1%) |
| 45 to 54 Years | 59 (100.0%) | 0 (0.0%) |
| 55 to 64 Years | 19 (76.0%) | 6 (24.0%) |
| 65 to 74 Years | 32 (100.0%) | 0 (0.0%) |
| 75 Years and older | 25 (100.0%) | 0 (0.0%) |
| Total | 314 (82.9%) | 65 (17.2%) |
Health Insurance Coverage by Citizenship Status in Laceyville borough
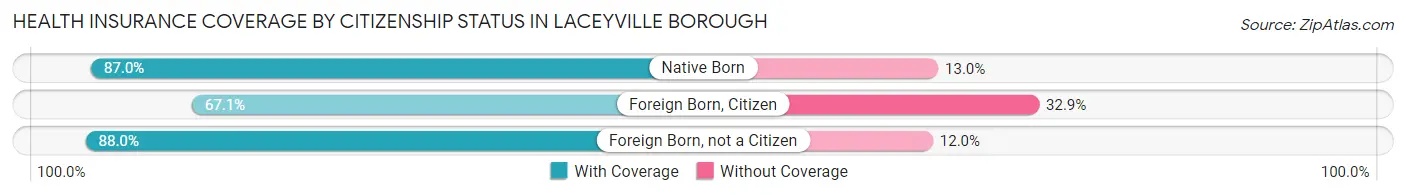
| Citizenship Status | With Coverage | Without Coverage |
| Native Born | 20 (87.0%) | 3 (13.0%) |
| Foreign Born, Citizen | 51 (67.1%) | 25 (32.9%) |
| Foreign Born, not a Citizen | 22 (88.0%) | 3 (12.0%) |
Health Insurance Coverage by Household Income in Laceyville borough
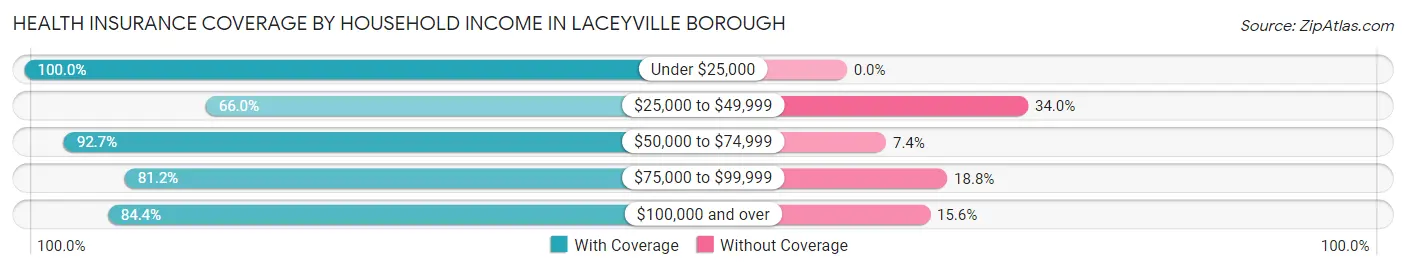
| Household Income | With Coverage | Without Coverage |
| Under $25,000 | 16 (100.0%) | 0 (0.0%) |
| $25,000 to $49,999 | 35 (66.0%) | 18 (34.0%) |
| $50,000 to $74,999 | 63 (92.6%) | 5 (7.3%) |
| $75,000 to $99,999 | 108 (81.2%) | 25 (18.8%) |
| $100,000 and over | 92 (84.4%) | 17 (15.6%) |
Public vs Private Health Insurance Coverage by Age in Laceyville borough
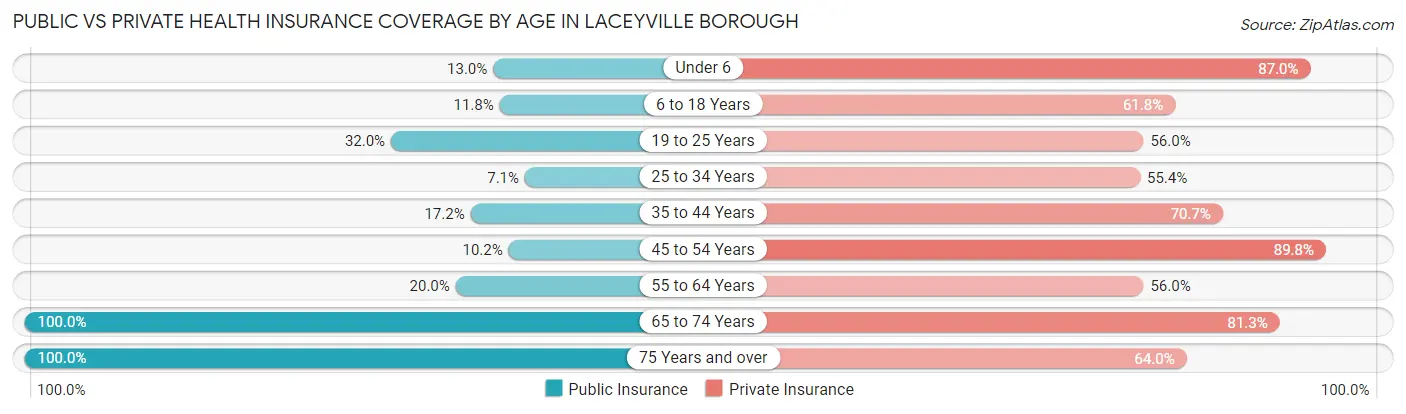
| Age Bracket | Public Insurance | Private Insurance |
| Under 6 | 3 (13.0%) | 20 (87.0%) |
| 6 to 18 Years | 9 (11.8%) | 47 (61.8%) |
| 19 to 25 Years | 8 (32.0%) | 14 (56.0%) |
| 25 to 34 Years | 4 (7.1%) | 31 (55.4%) |
| 35 to 44 Years | 10 (17.2%) | 41 (70.7%) |
| 45 to 54 Years | 6 (10.2%) | 53 (89.8%) |
| 55 to 64 Years | 5 (20.0%) | 14 (56.0%) |
| 65 to 74 Years | 32 (100.0%) | 26 (81.2%) |
| 75 Years and over | 25 (100.0%) | 16 (64.0%) |
| Total | 102 (26.9%) | 262 (69.1%) |
Disability Status by Sex by Age in Laceyville borough
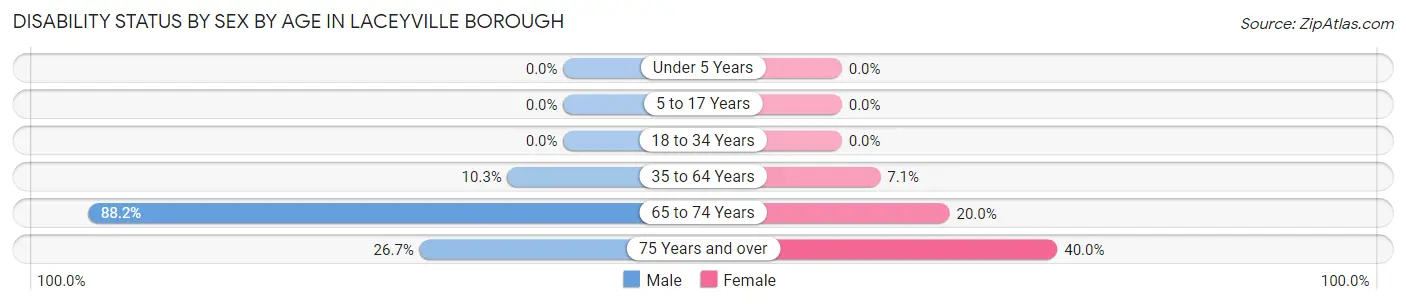
| Age Bracket | Male | Female |
| Under 5 Years | 0 (0.0%) | 0 (0.0%) |
| 5 to 17 Years | 0 (0.0%) | 0 (0.0%) |
| 18 to 34 Years | 0 (0.0%) | 0 (0.0%) |
| 35 to 64 Years | 6 (10.3%) | 6 (7.1%) |
| 65 to 74 Years | 15 (88.2%) | 3 (20.0%) |
| 75 Years and over | 4 (26.7%) | 4 (40.0%) |
Disability Class by Sex by Age in Laceyville borough
Disability Class: Hearing Difficulty
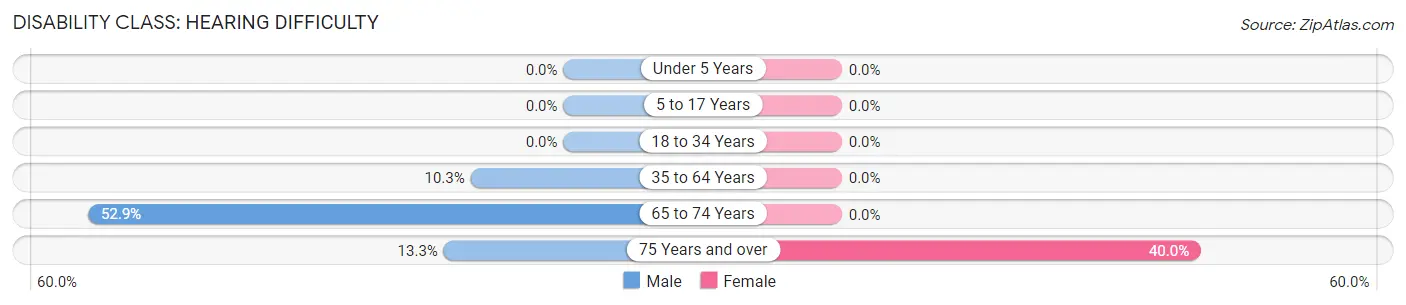
| Age Bracket | Male | Female |
| Under 5 Years | 0 (0.0%) | 0 (0.0%) |
| 5 to 17 Years | 0 (0.0%) | 0 (0.0%) |
| 18 to 34 Years | 0 (0.0%) | 0 (0.0%) |
| 35 to 64 Years | 6 (10.3%) | 0 (0.0%) |
| 65 to 74 Years | 9 (52.9%) | 0 (0.0%) |
| 75 Years and over | 2 (13.3%) | 4 (40.0%) |
Disability Class: Vision Difficulty
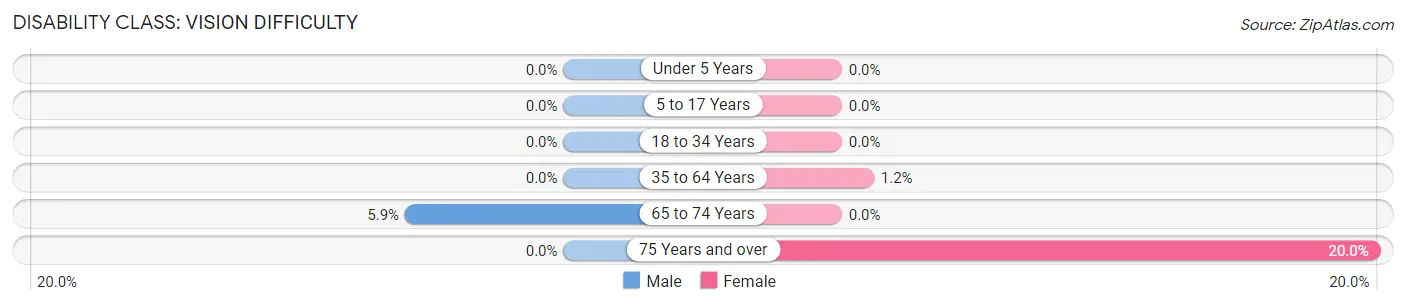
| Age Bracket | Male | Female |
| Under 5 Years | 0 (0.0%) | 0 (0.0%) |
| 5 to 17 Years | 0 (0.0%) | 0 (0.0%) |
| 18 to 34 Years | 0 (0.0%) | 0 (0.0%) |
| 35 to 64 Years | 0 (0.0%) | 1 (1.2%) |
| 65 to 74 Years | 1 (5.9%) | 0 (0.0%) |
| 75 Years and over | 0 (0.0%) | 2 (20.0%) |
Disability Class: Cognitive Difficulty
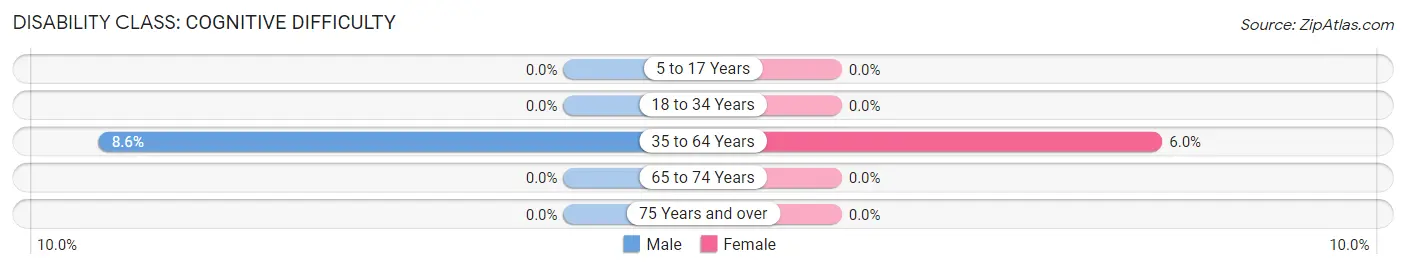
| Age Bracket | Male | Female |
| 5 to 17 Years | 0 (0.0%) | 0 (0.0%) |
| 18 to 34 Years | 0 (0.0%) | 0 (0.0%) |
| 35 to 64 Years | 5 (8.6%) | 5 (5.9%) |
| 65 to 74 Years | 0 (0.0%) | 0 (0.0%) |
| 75 Years and over | 0 (0.0%) | 0 (0.0%) |
Disability Class: Ambulatory Difficulty
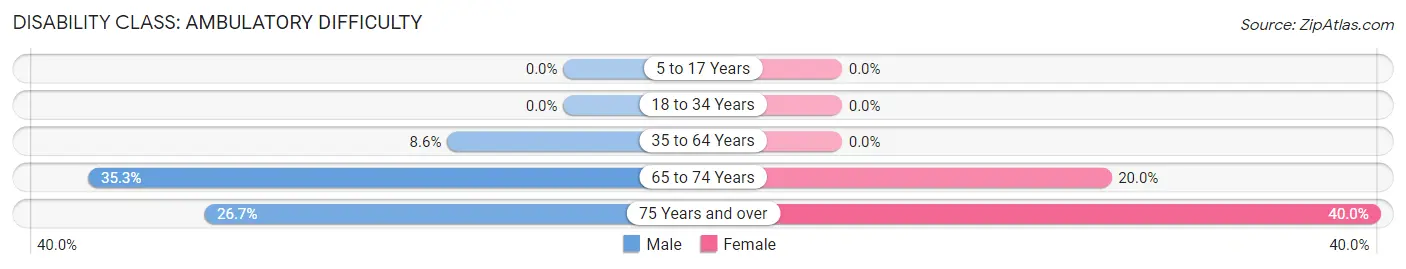
| Age Bracket | Male | Female |
| 5 to 17 Years | 0 (0.0%) | 0 (0.0%) |
| 18 to 34 Years | 0 (0.0%) | 0 (0.0%) |
| 35 to 64 Years | 5 (8.6%) | 0 (0.0%) |
| 65 to 74 Years | 6 (35.3%) | 3 (20.0%) |
| 75 Years and over | 4 (26.7%) | 4 (40.0%) |
Disability Class: Self-Care Difficulty
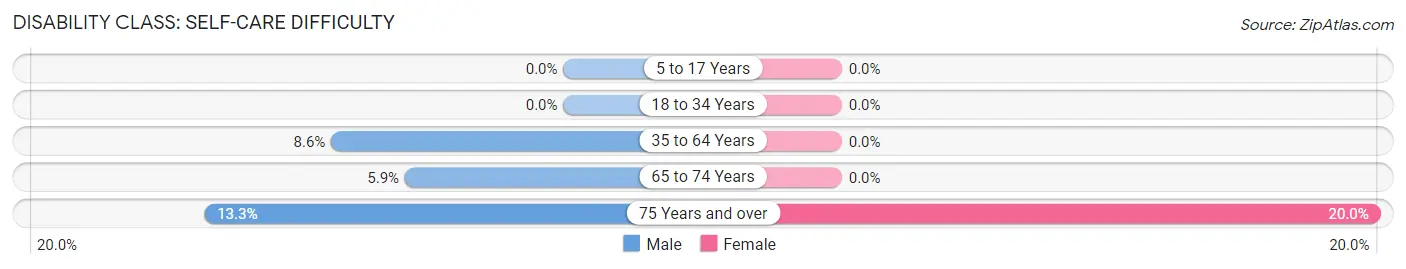
| Age Bracket | Male | Female |
| 5 to 17 Years | 0 (0.0%) | 0 (0.0%) |
| 18 to 34 Years | 0 (0.0%) | 0 (0.0%) |
| 35 to 64 Years | 5 (8.6%) | 0 (0.0%) |
| 65 to 74 Years | 1 (5.9%) | 0 (0.0%) |
| 75 Years and over | 2 (13.3%) | 2 (20.0%) |
Technology Access in Laceyville borough
Computing Device Access in Laceyville borough
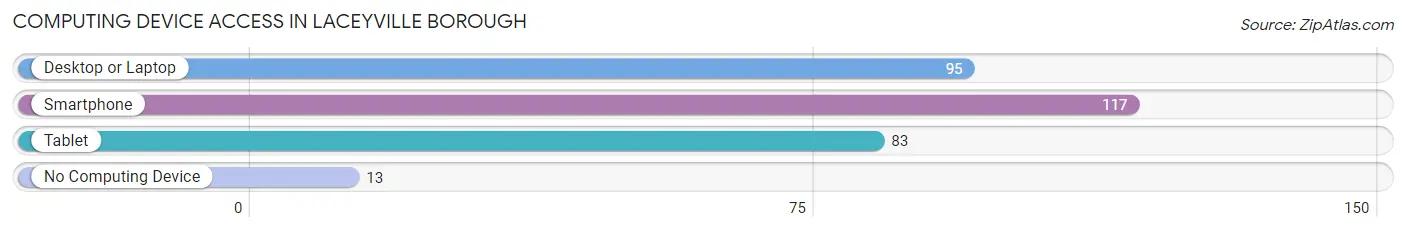
| Device Type | # Households | % Households |
| Desktop or Laptop | 95 | 66.9% |
| Smartphone | 117 | 82.4% |
| Tablet | 83 | 58.5% |
| No Computing Device | 13 | 9.1% |
| Total | 142 | 100.0% |
Internet Access in Laceyville borough
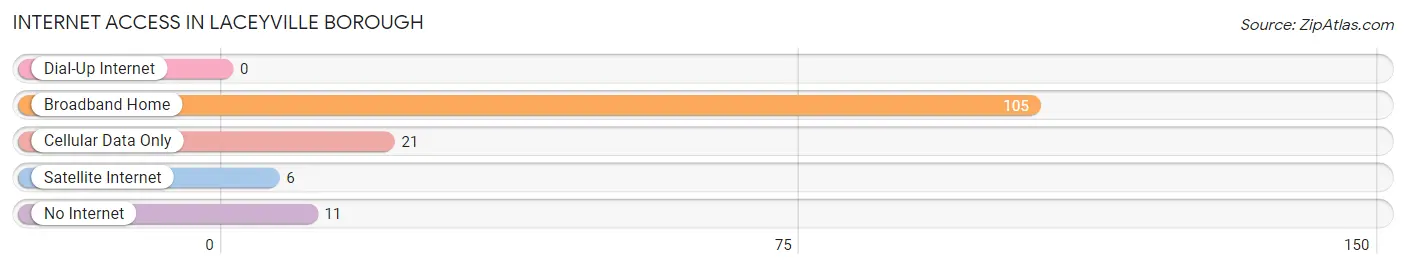
| Internet Type | # Households | % Households |
| Dial-Up Internet | 0 | 0.0% |
| Broadband Home | 105 | 73.9% |
| Cellular Data Only | 21 | 14.8% |
| Satellite Internet | 6 | 4.2% |
| No Internet | 11 | 7.7% |
| Total | 142 | 100.0% |
Laceyville borough Summary
Laceyville Borough is a small borough located in Wyoming County, Pennsylvania. It is situated in the Endless Mountains region of the state, and is part of the Scranton–Wilkes-Barre–Hazleton Metropolitan Statistical Area. The borough has a population of approximately 500 people, and is home to a variety of businesses, including a grocery store, a hardware store, and a few restaurants.
History
Laceyville Borough was founded in 1845 by William Lacey, a local farmer. The borough was named after him, and was incorporated in 1851. The borough was originally a farming community, and the main industry was dairy farming. In the late 19th century, the borough began to grow and develop, and by the early 20th century, it had become a small industrial center. The borough was home to several factories, including a tannery, a sawmill, and a furniture factory.
Geography
Laceyville Borough is located in the Endless Mountains region of Pennsylvania. It is situated in the northern part of Wyoming County, and is bordered by the Susquehanna River to the east and the Lackawanna River to the west. The borough is located approximately 30 miles northwest of Scranton, and is part of the Scranton–Wilkes-Barre–Hazleton Metropolitan Statistical Area.
The borough has a total area of 0.7 square miles, all of which is land. The terrain is mostly flat, with some rolling hills. The borough is located in a rural area, and is surrounded by farmland.
Economy
The economy of Laceyville Borough is largely based on agriculture and tourism. The borough is home to several small businesses, including a grocery store, a hardware store, and a few restaurants. The borough also has a few small manufacturing companies, including a furniture factory and a tannery.
The borough is also home to several tourist attractions, including the Laceyville Historical Society Museum, the Laceyville Covered Bridge, and the Laceyville Railroad Station. The borough is also home to several parks, including the Laceyville Borough Park and the Laceyville Nature Preserve.
Demographics
As of the 2010 census, the population of Laceyville Borough was 498. The racial makeup of the borough was 97.2% White, 0.6% African American, 0.2% Native American, 0.2% Asian, 0.2% from other races, and 1.8% from two or more races. Hispanic or Latino of any race were 0.8% of the population.
The median household income in the borough was $37,500, and the median family income was $45,000. The per capita income was $18,000. About 11.2% of the population was below the poverty line. The majority of the population (90.2%) was over the age of 18, and the median age was 43.5 years.
Common Questions
What is Per Capita Income in Laceyville borough?
Per Capita income in Laceyville borough is $30,807.
What is the Median Family Income in Laceyville borough?
Median Family Income in Laceyville borough is $83,750.
What is the Median Household income in Laceyville borough?
Median Household Income in Laceyville borough is $79,318.
What is Income or Wage Gap in Laceyville borough?
Income or Wage Gap in Laceyville borough is 22.3%.
Women in Laceyville borough earn 77.7 cents for every dollar earned by a man.
What is Inequality or Gini Index in Laceyville borough?
Inequality or Gini Index in Laceyville borough is 0.28.
What is the Total Population of Laceyville borough?
Total Population of Laceyville borough is 379.
What is the Total Male Population of Laceyville borough?
Total Male Population of Laceyville borough is 187.
What is the Total Female Population of Laceyville borough?
Total Female Population of Laceyville borough is 192.
What is the Ratio of Males per 100 Females in Laceyville borough?
There are 97.40 Males per 100 Females in Laceyville borough.
What is the Ratio of Females per 100 Males in Laceyville borough?
There are 102.67 Females per 100 Males in Laceyville borough.
What is the Median Population Age in Laceyville borough?
Median Population Age in Laceyville borough is 35.8 Years.
What is the Average Family Size in Laceyville borough
Average Family Size in Laceyville borough is 3.3 People.
What is the Average Household Size in Laceyville borough
Average Household Size in Laceyville borough is 2.7 People.
How Large is the Labor Force in Laceyville borough?
There are 181 People in the Labor Forcein in Laceyville borough.
What is the Percentage of People in the Labor Force in Laceyville borough?
61.1% of People are in the Labor Force in Laceyville borough.
What is the Unemployment Rate in Laceyville borough?
Unemployment Rate in Laceyville borough is 1.1%.