Lucerne Mines, PA Map & Demographics
Lucerne Mines Map
Lucerne Mines Overview
$31,911
PER CAPITA INCOME
$70,156
AVG FAMILY INCOME
$67,135
AVG HOUSEHOLD INCOME
35.3%
WAGE / INCOME GAP [ % ]
64.7¢/ $1
WAGE / INCOME GAP [ $ ]
0.30
INEQUALITY / GINI INDEX
881
TOTAL POPULATION
485
MALE POPULATION
396
FEMALE POPULATION
122.47
MALES / 100 FEMALES
81.65
FEMALES / 100 MALES
39.3
MEDIAN AGE
2.7
AVG FAMILY SIZE
2.4
AVG HOUSEHOLD SIZE
411
LABOR FORCE [ PEOPLE ]
58.7%
PERCENT IN LABOR FORCE
Income in Lucerne Mines
Income Overview in Lucerne Mines
Per Capita Income in Lucerne Mines is $31,911, while median incomes of families and households are $70,156 and $67,135 respectively.
| Characteristic | Number | Measure |
| Per Capita Income | 881 | $31,911 |
| Median Family Income | 276 | $70,156 |
| Mean Family Income | 276 | $84,332 |
| Median Household Income | 365 | $67,135 |
| Mean Household Income | 365 | $77,391 |
| Income Deficit | 276 | $0 |
| Wage / Income Gap (%) | 881 | 35.31% |
| Wage / Income Gap ($) | 881 | 64.69¢ per $1 |
| Gini / Inequality Index | 881 | 0.30 |
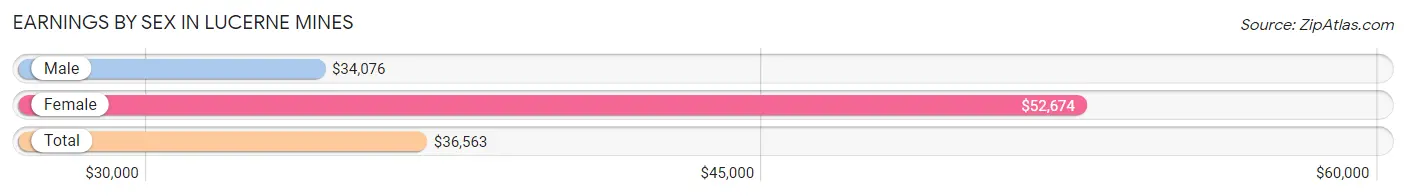
Earnings by Sex in Lucerne Mines
Average Earnings in Lucerne Mines are $36,563, $34,076 for men and $52,674 for women, a difference of 35.3%.
| Sex | Number | Average Earnings |
| Male | 181 (42.9%) | $34,076 |
| Female | 241 (57.1%) | $52,674 |
| Total | 422 (100.0%) | $36,563 |
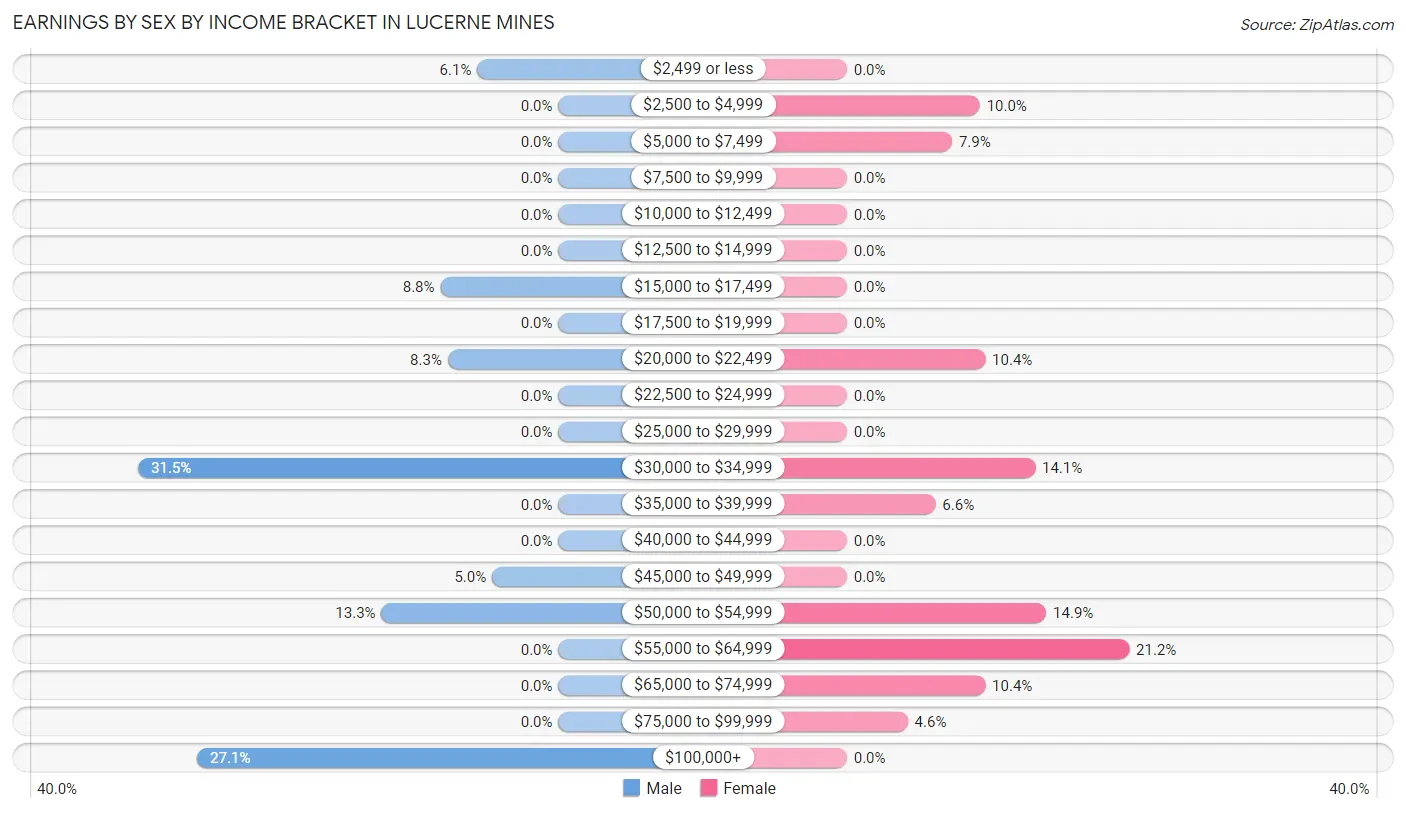
Earnings by Sex by Income Bracket in Lucerne Mines
The most common earnings brackets in Lucerne Mines are $30,000 to $34,999 for men (57 | 31.5%) and $55,000 to $64,999 for women (51 | 21.2%).
| Income | Male | Female |
| $2,499 or less | 11 (6.1%) | 0 (0.0%) |
| $2,500 to $4,999 | 0 (0.0%) | 24 (10.0%) |
| $5,000 to $7,499 | 0 (0.0%) | 19 (7.9%) |
| $7,500 to $9,999 | 0 (0.0%) | 0 (0.0%) |
| $10,000 to $12,499 | 0 (0.0%) | 0 (0.0%) |
| $12,500 to $14,999 | 0 (0.0%) | 0 (0.0%) |
| $15,000 to $17,499 | 16 (8.8%) | 0 (0.0%) |
| $17,500 to $19,999 | 0 (0.0%) | 0 (0.0%) |
| $20,000 to $22,499 | 15 (8.3%) | 25 (10.4%) |
| $22,500 to $24,999 | 0 (0.0%) | 0 (0.0%) |
| $25,000 to $29,999 | 0 (0.0%) | 0 (0.0%) |
| $30,000 to $34,999 | 57 (31.5%) | 34 (14.1%) |
| $35,000 to $39,999 | 0 (0.0%) | 16 (6.6%) |
| $40,000 to $44,999 | 0 (0.0%) | 0 (0.0%) |
| $45,000 to $49,999 | 9 (5.0%) | 0 (0.0%) |
| $50,000 to $54,999 | 24 (13.3%) | 36 (14.9%) |
| $55,000 to $64,999 | 0 (0.0%) | 51 (21.2%) |
| $65,000 to $74,999 | 0 (0.0%) | 25 (10.4%) |
| $75,000 to $99,999 | 0 (0.0%) | 11 (4.6%) |
| $100,000+ | 49 (27.1%) | 0 (0.0%) |
| Total | 181 (100.0%) | 241 (100.0%) |
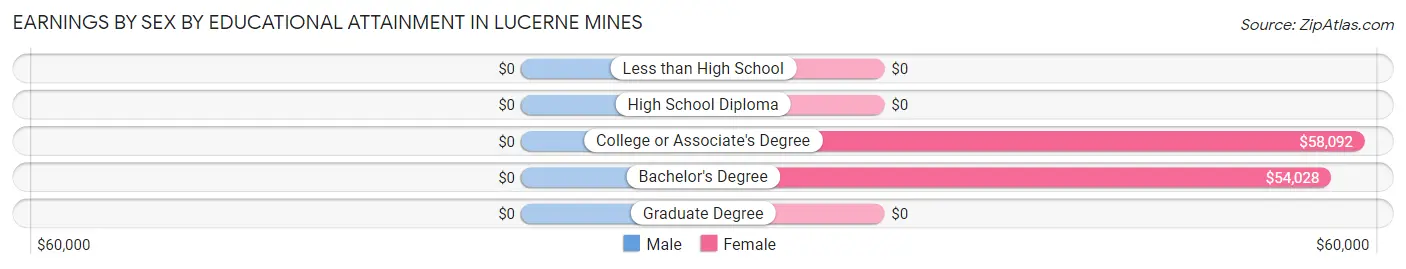
Earnings by Sex by Educational Attainment in Lucerne Mines
| Educational Attainment | Male Income | Female Income |
| Less than High School | - | - |
| High School Diploma | - | - |
| College or Associate's Degree | - | - |
| Bachelor's Degree | - | - |
| Graduate Degree | - | - |
| Total | - | - |
Family Income in Lucerne Mines
Family Income Brackets in Lucerne Mines
According to the Lucerne Mines family income data, there are 101 families falling into the $50,000 to $74,999 income range, which is the most common income bracket and makes up 36.6% of all families.
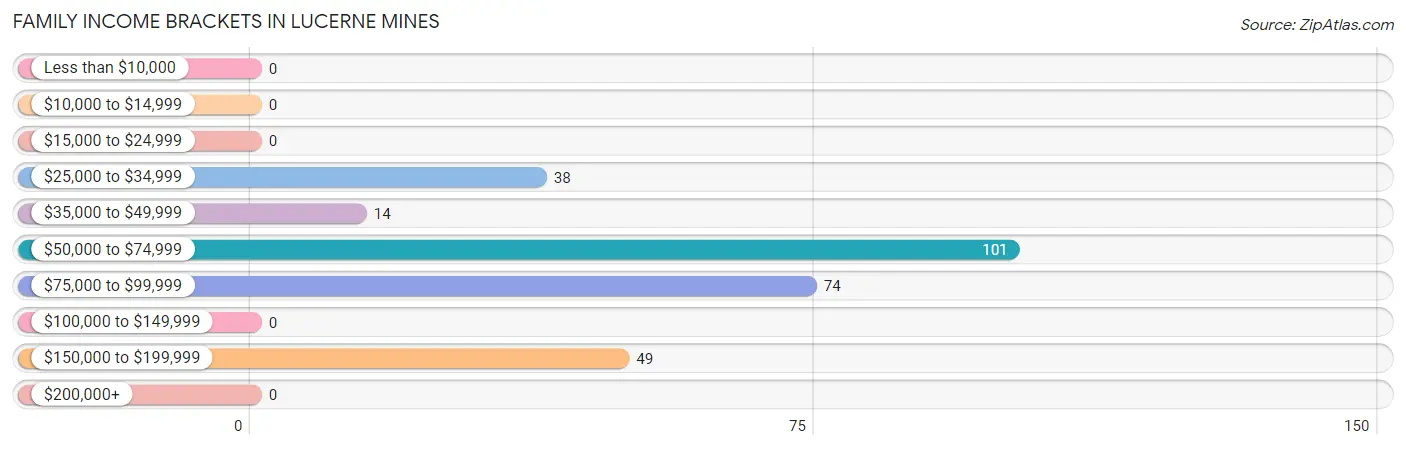
| Income Bracket | # Families | % Families |
| Less than $10,000 | 0 | 0.0% |
| $10,000 to $14,999 | 0 | 0.0% |
| $15,000 to $24,999 | 0 | 0.0% |
| $25,000 to $34,999 | 38 | 13.8% |
| $35,000 to $49,999 | 14 | 5.1% |
| $50,000 to $74,999 | 101 | 36.6% |
| $75,000 to $99,999 | 74 | 26.8% |
| $100,000 to $149,999 | 0 | 0.0% |
| $150,000 to $199,999 | 49 | 17.8% |
| $200,000+ | 0 | 0.0% |
Family Income by Famaliy Size in Lucerne Mines
2-person families (148 | 53.6%) account for the highest median family income in Lucerne Mines with $67,154 per family, while 2-person families (148 | 53.6%) have the highest median income of $33,577 per family member.
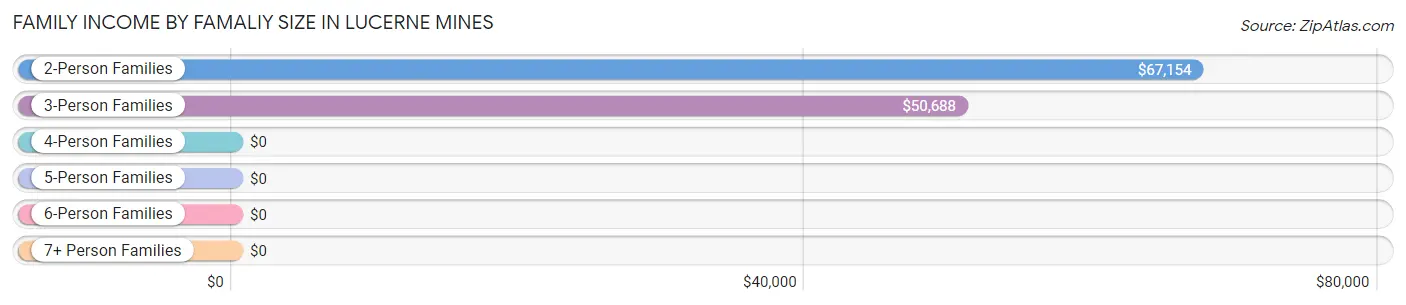
| Income Bracket | # Families | Median Income |
| 2-Person Families | 148 (53.6%) | $67,154 |
| 3-Person Families | 79 (28.6%) | $50,688 |
| 4-Person Families | 49 (17.7%) | $0 |
| 5-Person Families | 0 (0.0%) | $0 |
| 6-Person Families | 0 (0.0%) | $0 |
| 7+ Person Families | 0 (0.0%) | $0 |
| Total | 276 (100.0%) | $70,156 |
Family Income by Number of Earners in Lucerne Mines
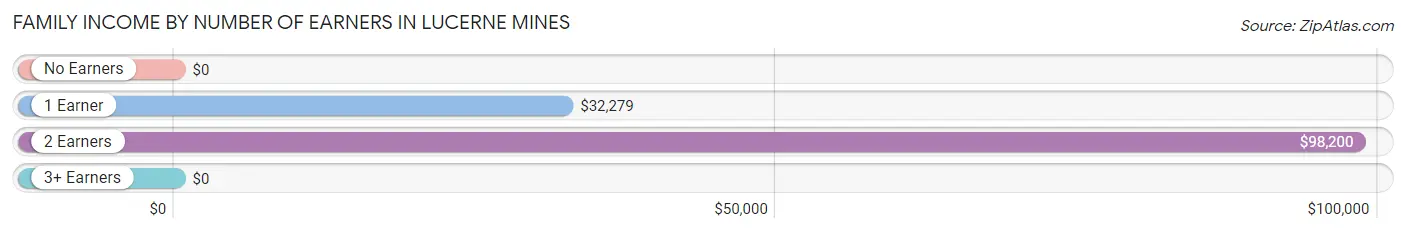
| Number of Earners | # Families | Median Income |
| No Earners | 69 (25.0%) | $0 |
| 1 Earner | 62 (22.5%) | $32,279 |
| 2 Earners | 134 (48.5%) | $98,200 |
| 3+ Earners | 11 (4.0%) | $0 |
| Total | 276 (100.0%) | $70,156 |
Household Income in Lucerne Mines
Household Income Brackets in Lucerne Mines
With 116 households falling in the category, the $50,000 to $74,999 income range is the most frequent in Lucerne Mines, accounting for 31.8% of all households.
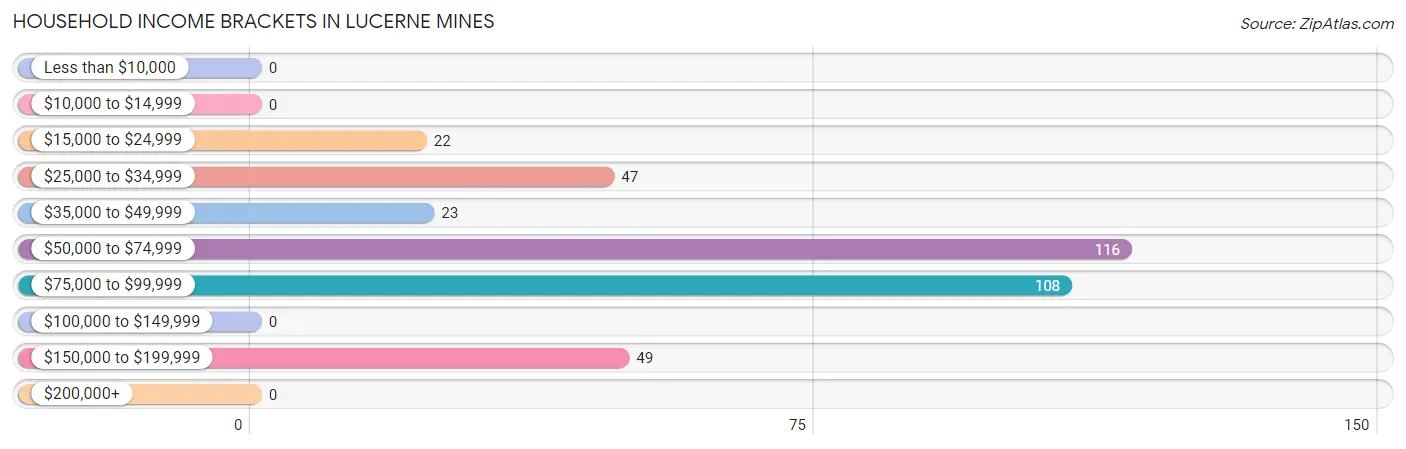
| Income Bracket | # Households | % Households |
| Less than $10,000 | 0 | 0.0% |
| $10,000 to $14,999 | 0 | 0.0% |
| $15,000 to $24,999 | 22 | 6.0% |
| $25,000 to $34,999 | 47 | 12.9% |
| $35,000 to $49,999 | 23 | 6.3% |
| $50,000 to $74,999 | 116 | 31.8% |
| $75,000 to $99,999 | 108 | 29.6% |
| $100,000 to $149,999 | 0 | 0.0% |
| $150,000 to $199,999 | 49 | 13.4% |
| $200,000+ | 0 | 0.0% |
Household Income by Householder Age in Lucerne Mines
The median household income in Lucerne Mines is $67,135, with the highest median household income of $77,292 found in the 45 to 64 years age bracket for the primary householder. A total of 76 households (20.8%) fall into this category.
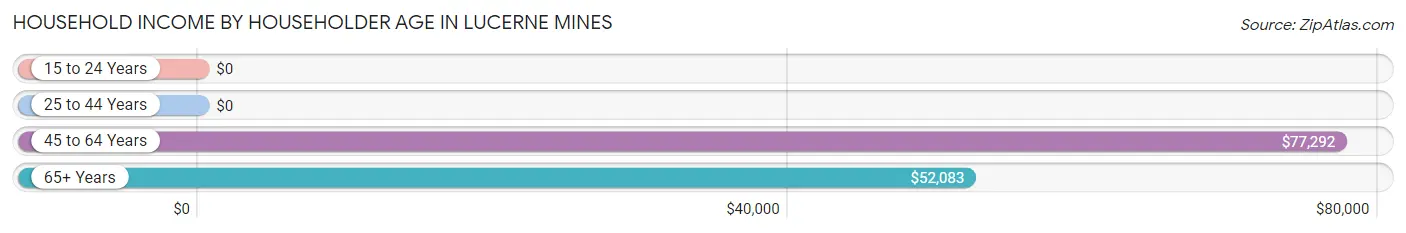
| Income Bracket | # Households | Median Income |
| 15 to 24 Years | 0 (0.0%) | $0 |
| 25 to 44 Years | 126 (34.5%) | $0 |
| 45 to 64 Years | 76 (20.8%) | $77,292 |
| 65+ Years | 163 (44.7%) | $52,083 |
| Total | 365 (100.0%) | $67,135 |
Poverty in Lucerne Mines
Income Below Poverty by Sex and Age in Lucerne Mines
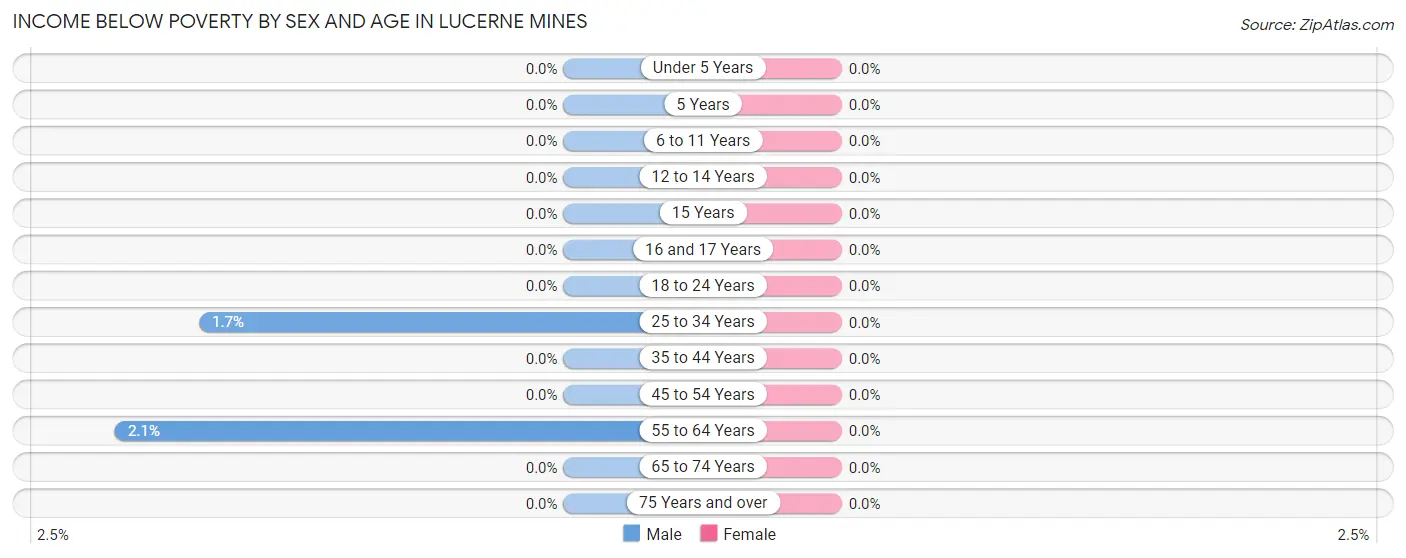
| Age Bracket | Male | Female |
| Under 5 Years | 0 (0.0%) | 0 (0.0%) |
| 5 Years | 0 (0.0%) | 0 (0.0%) |
| 6 to 11 Years | 0 (0.0%) | 0 (0.0%) |
| 12 to 14 Years | 0 (0.0%) | 0 (0.0%) |
| 15 Years | 0 (0.0%) | 0 (0.0%) |
| 16 and 17 Years | 0 (0.0%) | 0 (0.0%) |
| 18 to 24 Years | 0 (0.0%) | 0 (0.0%) |
| 25 to 34 Years | 1 (1.7%) | 0 (0.0%) |
| 35 to 44 Years | 0 (0.0%) | 0 (0.0%) |
| 45 to 54 Years | 0 (0.0%) | 0 (0.0%) |
| 55 to 64 Years | 1 (2.1%) | 0 (0.0%) |
| 65 to 74 Years | 0 (0.0%) | 0 (0.0%) |
| 75 Years and over | 0 (0.0%) | 0 (0.0%) |
| Total | 2 (0.4%) | 0 (0.0%) |
Income Above Poverty by Sex and Age in Lucerne Mines
According to the poverty statistics in Lucerne Mines, males aged under 5 years and females aged under 5 years are the age groups that are most secure financially, with 100.0% of males and 100.0% of females in these age groups living above the poverty line.
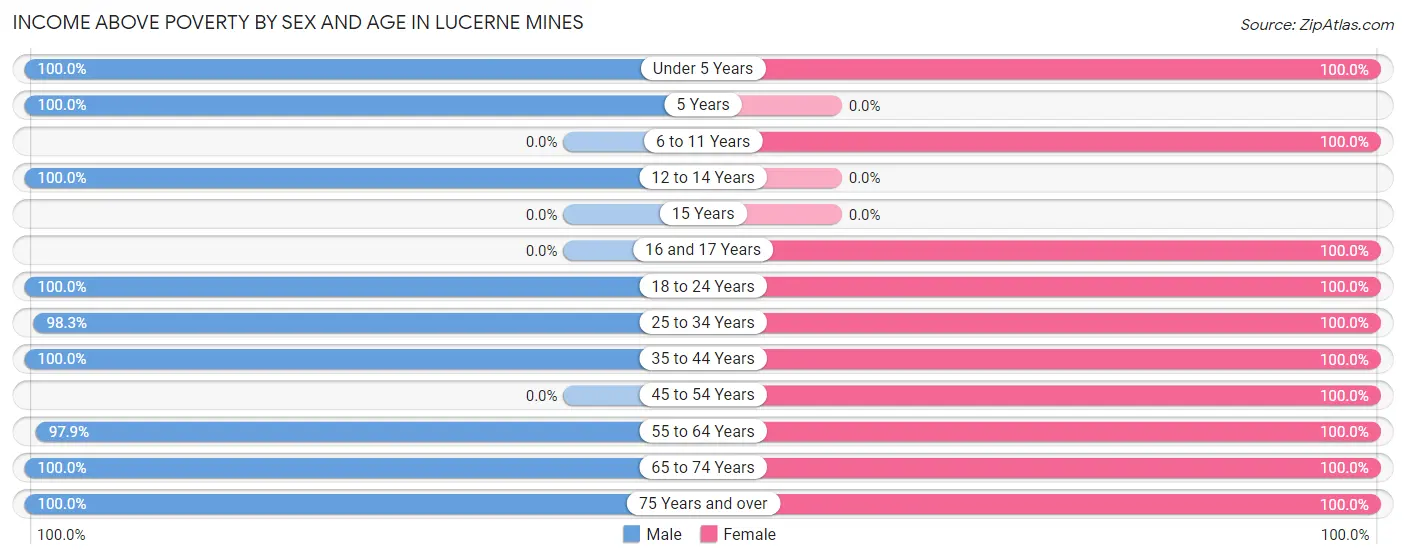
| Age Bracket | Male | Female |
| Under 5 Years | 38 (100.0%) | 16 (100.0%) |
| 5 Years | 45 (100.0%) | 0 (0.0%) |
| 6 to 11 Years | 0 (0.0%) | 37 (100.0%) |
| 12 to 14 Years | 45 (100.0%) | 0 (0.0%) |
| 15 Years | 0 (0.0%) | 0 (0.0%) |
| 16 and 17 Years | 0 (0.0%) | 24 (100.0%) |
| 18 to 24 Years | 39 (100.0%) | 19 (100.0%) |
| 25 to 34 Years | 58 (98.3%) | 89 (100.0%) |
| 35 to 44 Years | 71 (100.0%) | 20 (100.0%) |
| 45 to 54 Years | 0 (0.0%) | 30 (100.0%) |
| 55 to 64 Years | 47 (97.9%) | 60 (100.0%) |
| 65 to 74 Years | 135 (100.0%) | 84 (100.0%) |
| 75 Years and over | 5 (100.0%) | 17 (100.0%) |
| Total | 483 (99.6%) | 396 (100.0%) |
Income Below Poverty Among Married-Couple Families in Lucerne Mines
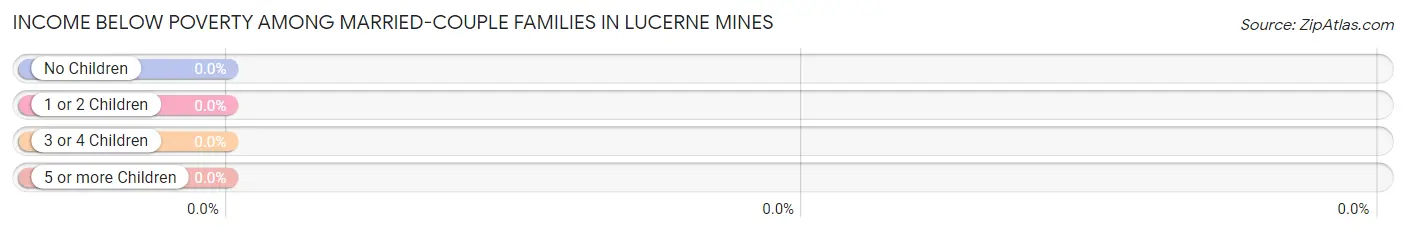
| Children | Above Poverty | Below Poverty |
| No Children | 132 (100.0%) | 0 (0.0%) |
| 1 or 2 Children | 69 (100.0%) | 0 (0.0%) |
| 3 or 4 Children | 0 (0.0%) | 0 (0.0%) |
| 5 or more Children | 0 (0.0%) | 0 (0.0%) |
| Total | 201 (100.0%) | 0 (0.0%) |
Income Below Poverty Among Single-Parent Households in Lucerne Mines
| Children | Single Father | Single Mother |
| No Children | 0 (0.0%) | 0 (0.0%) |
| 1 or 2 Children | 0 (0.0%) | 0 (0.0%) |
| 3 or 4 Children | 0 (0.0%) | 0 (0.0%) |
| 5 or more Children | 0 (0.0%) | 0 (0.0%) |
| Total | 0 (0.0%) | 0 (0.0%) |
Income Below Poverty Among Married-Couple vs Single-Parent Households in Lucerne Mines
| Children | Married-Couple Families | Single-Parent Households |
| No Children | 0 (0.0%) | 0 (0.0%) |
| 1 or 2 Children | 0 (0.0%) | 0 (0.0%) |
| 3 or 4 Children | 0 (0.0%) | 0 (0.0%) |
| 5 or more Children | 0 (0.0%) | 0 (0.0%) |
| Total | 0 (0.0%) | 0 (0.0%) |
Race in Lucerne Mines
The most populous races in Lucerne Mines are White / Caucasian (872 | 99.0%), and Two or more Races (9 | 1.0%).
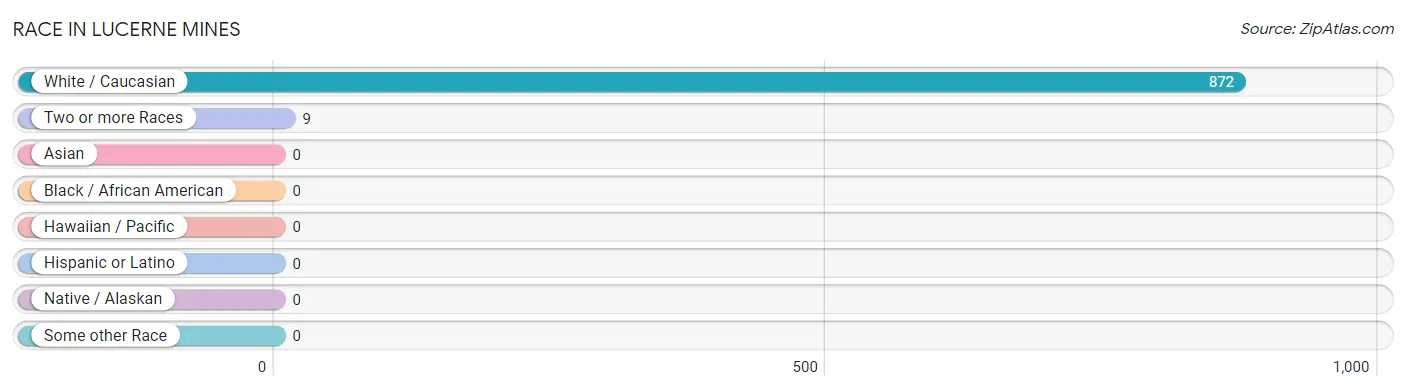
| Race | # Population | % Population |
| Asian | 0 | 0.0% |
| Black / African American | 0 | 0.0% |
| Hawaiian / Pacific | 0 | 0.0% |
| Hispanic or Latino | 0 | 0.0% |
| Native / Alaskan | 0 | 0.0% |
| White / Caucasian | 872 | 99.0% |
| Two or more Races | 9 | 1.0% |
| Some other Race | 0 | 0.0% |
| Total | 881 | 100.0% |
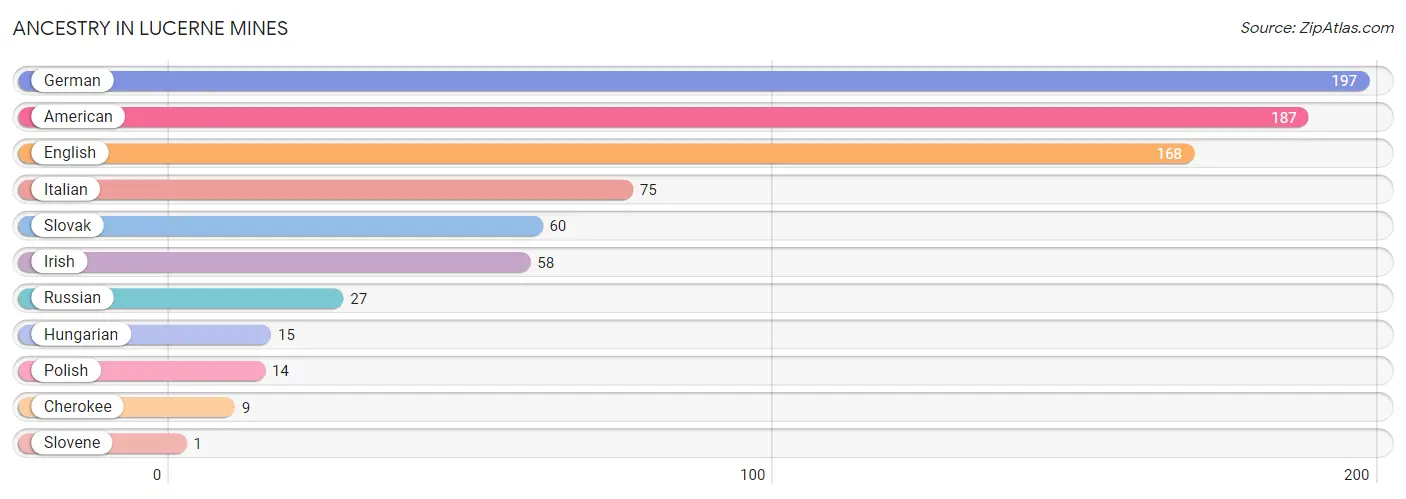
Ancestry in Lucerne Mines
The most populous ancestries reported in Lucerne Mines are German (197 | 22.4%), American (187 | 21.2%), English (168 | 19.1%), Italian (75 | 8.5%), and Slovak (60 | 6.8%), together accounting for 78.0% of all Lucerne Mines residents.
| Ancestry | # Population | % Population |
| American | 187 | 21.2% |
| Cherokee | 9 | 1.0% |
| English | 168 | 19.1% |
| German | 197 | 22.4% |
| Hungarian | 15 | 1.7% |
| Irish | 58 | 6.6% |
| Italian | 75 | 8.5% |
| Polish | 14 | 1.6% |
| Russian | 27 | 3.1% |
| Slovak | 60 | 6.8% |
| Slovene | 1 | 0.1% | View All 11 Rows |
Immigrants in Lucerne Mines

| Immigration Origin | # Population | % Population | View All 0 Rows |
Sex and Age in Lucerne Mines
Sex and Age in Lucerne Mines
The most populous age groups in Lucerne Mines are 70 to 74 Years (135 | 27.8%) for men and 30 to 34 Years (74 | 18.7%) for women.
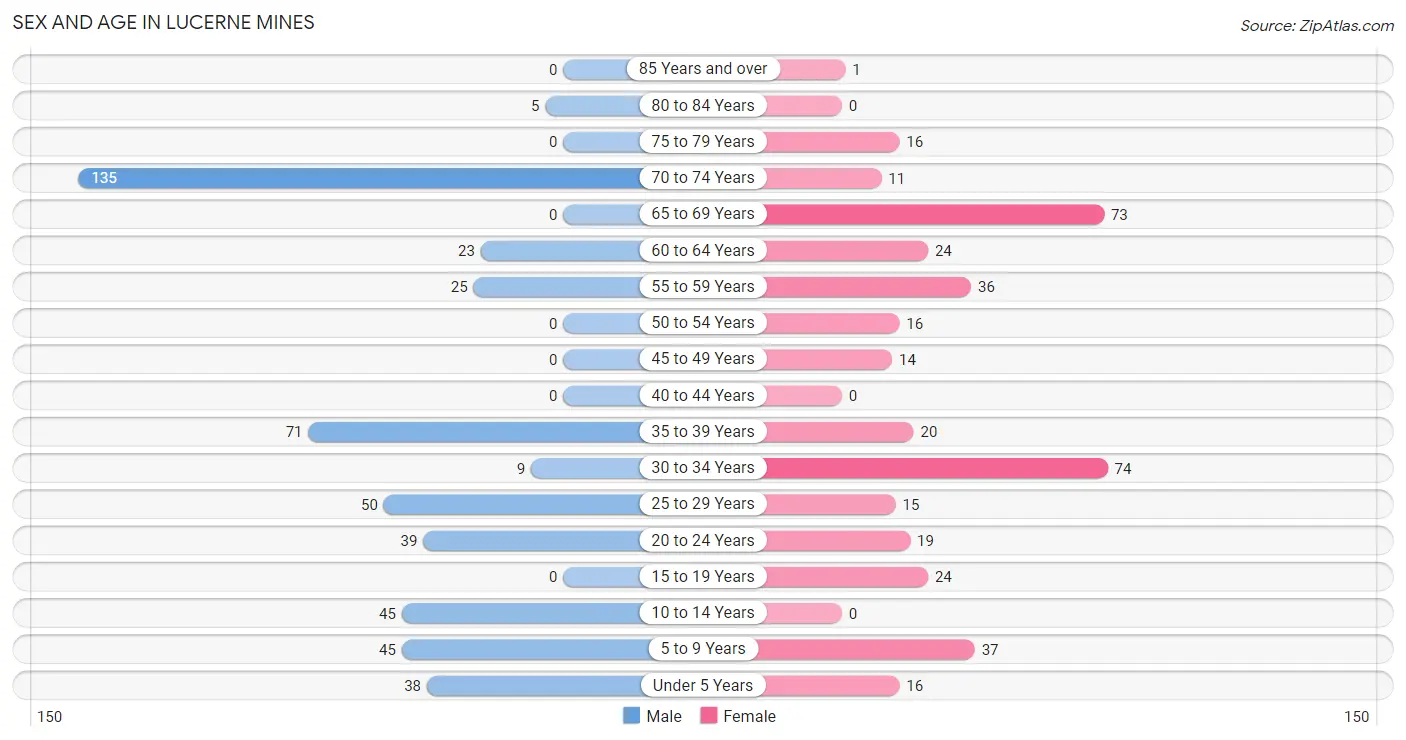
| Age Bracket | Male | Female |
| Under 5 Years | 38 (7.8%) | 16 (4.0%) |
| 5 to 9 Years | 45 (9.3%) | 37 (9.3%) |
| 10 to 14 Years | 45 (9.3%) | 0 (0.0%) |
| 15 to 19 Years | 0 (0.0%) | 24 (6.1%) |
| 20 to 24 Years | 39 (8.0%) | 19 (4.8%) |
| 25 to 29 Years | 50 (10.3%) | 15 (3.8%) |
| 30 to 34 Years | 9 (1.9%) | 74 (18.7%) |
| 35 to 39 Years | 71 (14.6%) | 20 (5.1%) |
| 40 to 44 Years | 0 (0.0%) | 0 (0.0%) |
| 45 to 49 Years | 0 (0.0%) | 14 (3.5%) |
| 50 to 54 Years | 0 (0.0%) | 16 (4.0%) |
| 55 to 59 Years | 25 (5.1%) | 36 (9.1%) |
| 60 to 64 Years | 23 (4.7%) | 24 (6.1%) |
| 65 to 69 Years | 0 (0.0%) | 73 (18.4%) |
| 70 to 74 Years | 135 (27.8%) | 11 (2.8%) |
| 75 to 79 Years | 0 (0.0%) | 16 (4.0%) |
| 80 to 84 Years | 5 (1.0%) | 0 (0.0%) |
| 85 Years and over | 0 (0.0%) | 1 (0.3%) |
| Total | 485 (100.0%) | 396 (100.0%) |
Families and Households in Lucerne Mines
Median Family Size in Lucerne Mines
The median family size in Lucerne Mines is 2.72 persons per family, with single male/father families (34 | 12.3%) accounting for the largest median family size of 3.21 persons per family. On the other hand, married-couple families (201 | 72.8%) represent the smallest median family size with 2.62 persons per family.
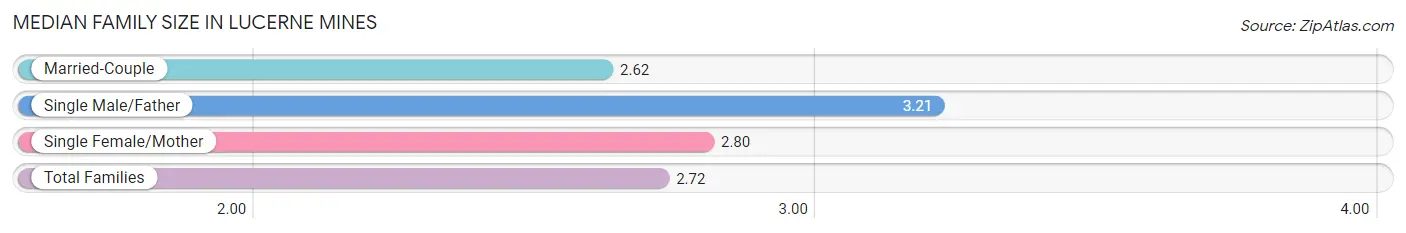
| Family Type | # Families | Family Size |
| Married-Couple | 201 (72.8%) | 2.62 |
| Single Male/Father | 34 (12.3%) | 3.21 |
| Single Female/Mother | 41 (14.9%) | 2.80 |
| Total Families | 276 (100.0%) | 2.72 |
Median Household Size in Lucerne Mines
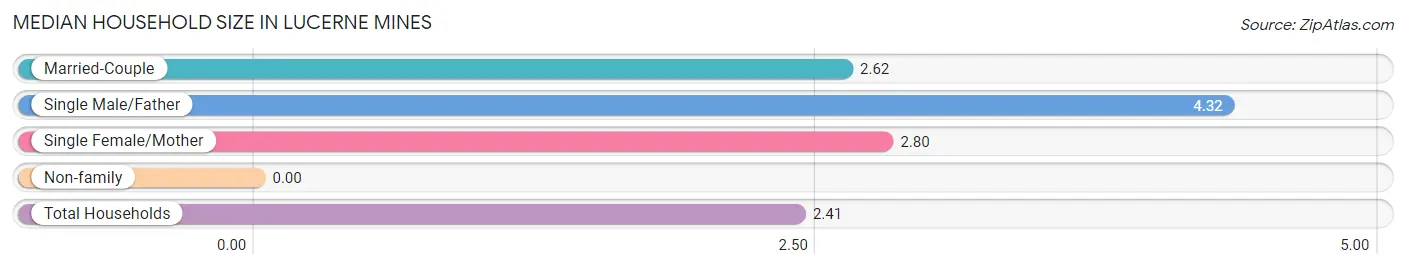
| Household Type | # Households | Household Size |
| Married-Couple | 201 (55.1%) | 2.62 |
| Single Male/Father | 34 (9.3%) | 4.32 |
| Single Female/Mother | 41 (11.2%) | 2.80 |
| Non-family | 89 (24.4%) | - |
| Total Households | 365 (100.0%) | 2.41 |
Household Size by Marriage Status in Lucerne Mines
Out of a total of 365 households in Lucerne Mines, 276 (75.6%) are family households, while 89 (24.4%) are nonfamily households. The most numerous type of family households are 2-person households, comprising 148, and the most common type of nonfamily households are 1-person households, comprising 89.
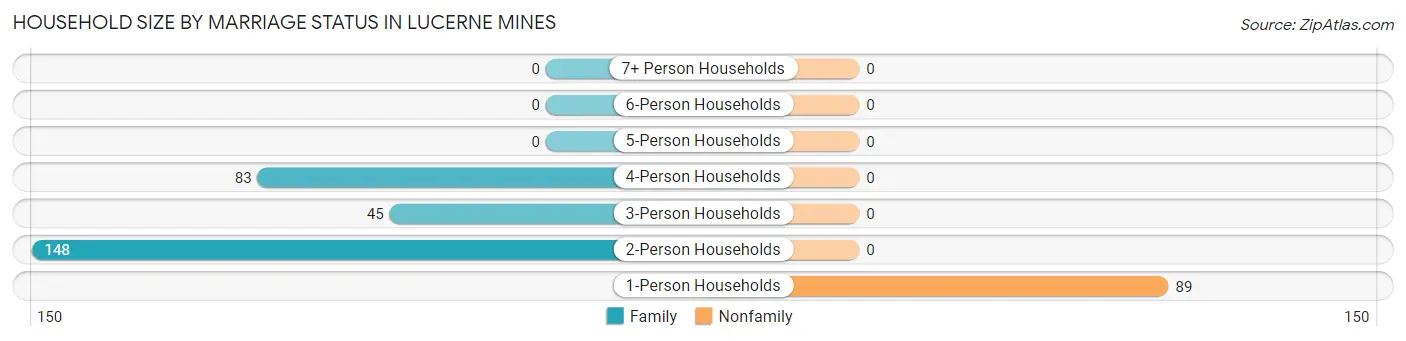
| Household Size | Family Households | Nonfamily Households |
| 1-Person Households | - | 89 (24.4%) |
| 2-Person Households | 148 (40.6%) | 0 (0.0%) |
| 3-Person Households | 45 (12.3%) | 0 (0.0%) |
| 4-Person Households | 83 (22.7%) | 0 (0.0%) |
| 5-Person Households | 0 (0.0%) | 0 (0.0%) |
| 6-Person Households | 0 (0.0%) | 0 (0.0%) |
| 7+ Person Households | 0 (0.0%) | 0 (0.0%) |
| Total | 276 (75.6%) | 89 (24.4%) |
Female Fertility in Lucerne Mines
Fertility by Age in Lucerne Mines
| Age Bracket | Women with Births | Births / 1,000 Women |
| 15 to 19 years | 0 (0.0%) | 0.0 |
| 20 to 34 years | 0 (0.0%) | 0.0 |
| 35 to 50 years | 0 (0.0%) | 0.0 |
| Total | 0 (0.0%) | 0.0 |
Fertility by Age by Marriage Status in Lucerne Mines
| Age Bracket | Married | Unmarried |
| 15 to 19 years | 0 (0.0%) | 0 (0.0%) |
| 20 to 34 years | 0 (0.0%) | 0 (0.0%) |
| 35 to 50 years | 0 (0.0%) | 0 (0.0%) |
| Total | 0 (0.0%) | 0 (0.0%) |
Fertility by Education in Lucerne Mines
| Educational Attainment | Women with Births | Births / 1,000 Women |
| Less than High School | 0 (0.0%) | 0.0 |
| High School Diploma | 0 (0.0%) | 0.0 |
| College or Associate's Degree | 0 (0.0%) | 0.0 |
| Bachelor's Degree | 0 (0.0%) | 0.0 |
| Graduate Degree | 0 (0.0%) | 0.0 |
| Total | 0 (0.0%) | 0.0 |
Fertility by Education by Marriage Status in Lucerne Mines
| Educational Attainment | Married | Unmarried |
| Less than High School | 0 (0.0%) | 0 (0.0%) |
| High School Diploma | 0 (0.0%) | 0 (0.0%) |
| College or Associate's Degree | 0 (0.0%) | 0 (0.0%) |
| Bachelor's Degree | 0 (0.0%) | 0 (0.0%) |
| Graduate Degree | 0 (0.0%) | 0 (0.0%) |
| Total | 0 (0.0%) | 0 (0.0%) |
Employment Characteristics in Lucerne Mines
Employment by Class of Employer in Lucerne Mines
Among the 411 employed individuals in Lucerne Mines, private company employees (286 | 69.6%), federal government employees (49 | 11.9%), and not-for-profit organizations (40 | 9.7%) make up the most common classes of employment.
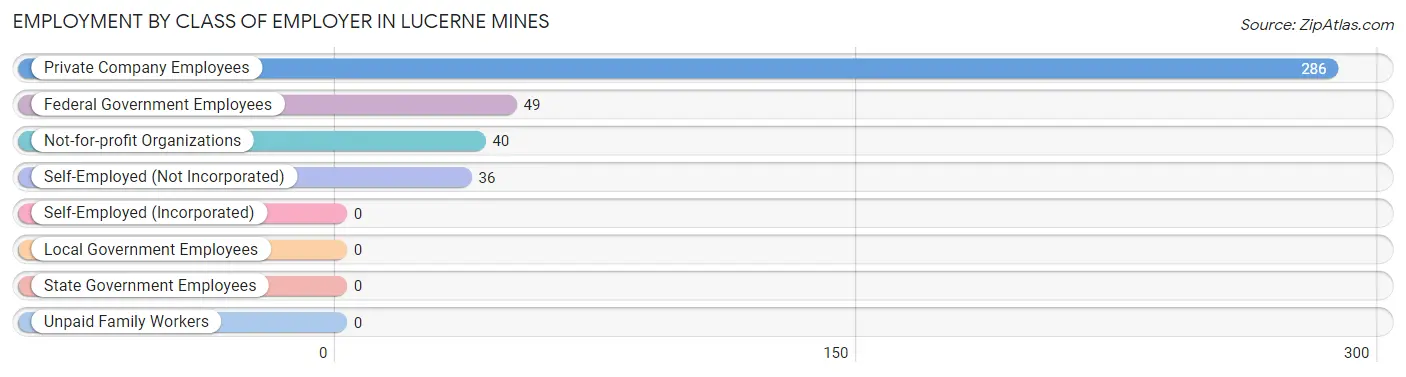
| Employer Class | # Employees | % Employees |
| Private Company Employees | 286 | 69.6% |
| Self-Employed (Incorporated) | 0 | 0.0% |
| Self-Employed (Not Incorporated) | 36 | 8.8% |
| Not-for-profit Organizations | 40 | 9.7% |
| Local Government Employees | 0 | 0.0% |
| State Government Employees | 0 | 0.0% |
| Federal Government Employees | 49 | 11.9% |
| Unpaid Family Workers | 0 | 0.0% |
| Total | 411 | 100.0% |
Employment Status by Age in Lucerne Mines
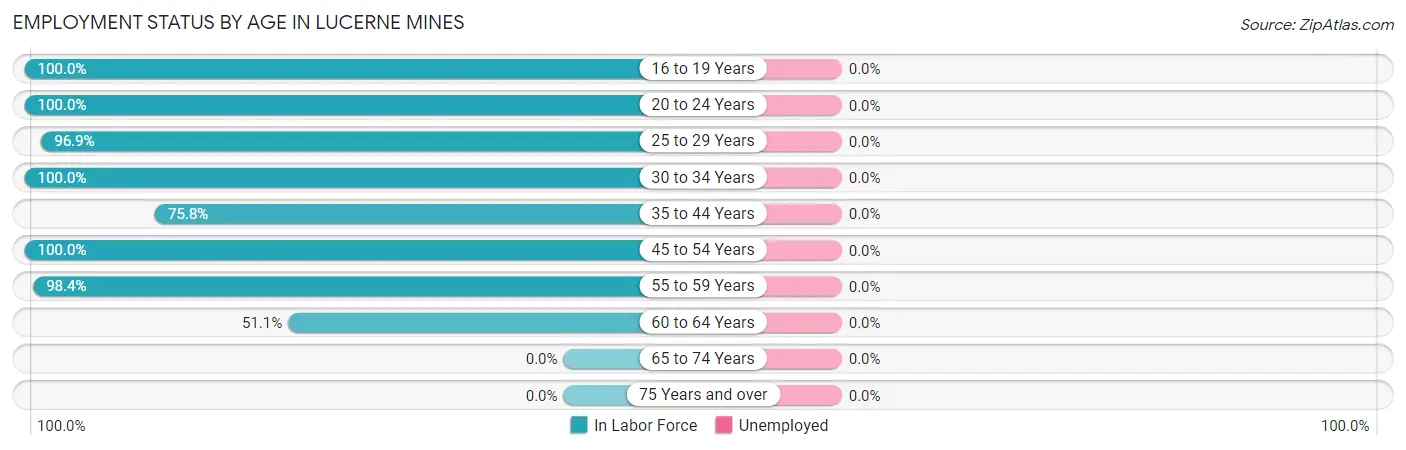
| Age Bracket | In Labor Force | Unemployed |
| 16 to 19 Years | 24 (100.0%) | 0 (0.0%) |
| 20 to 24 Years | 58 (100.0%) | 0 (0.0%) |
| 25 to 29 Years | 63 (96.9%) | 0 (0.0%) |
| 30 to 34 Years | 83 (100.0%) | 0 (0.0%) |
| 35 to 44 Years | 69 (75.8%) | 0 (0.0%) |
| 45 to 54 Years | 30 (100.0%) | 0 (0.0%) |
| 55 to 59 Years | 60 (98.4%) | 0 (0.0%) |
| 60 to 64 Years | 24 (51.1%) | 0 (0.0%) |
| 65 to 74 Years | 0 (0.0%) | 0 (0.0%) |
| 75 Years and over | 0 (0.0%) | 0 (0.0%) |
| Total | 411 (58.7%) | 0 (0.0%) |
Employment Status by Educational Attainment in Lucerne Mines
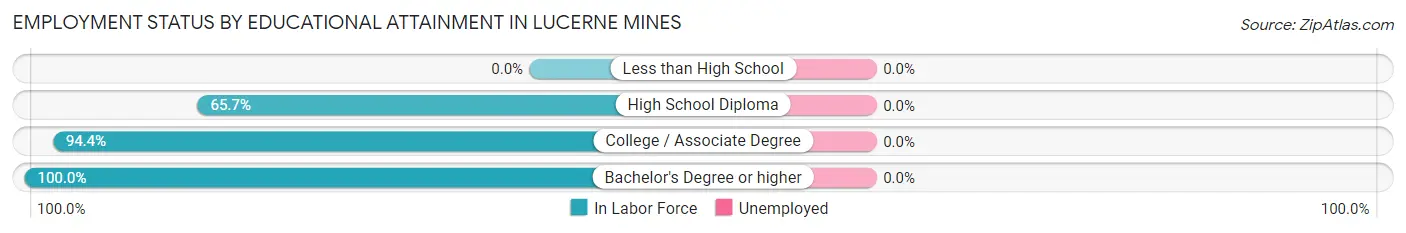
| Educational Attainment | In Labor Force | Unemployed |
| Less than High School | 0 (0.0%) | 0 (0.0%) |
| High School Diploma | 69 (65.7%) | 0 (0.0%) |
| College / Associate Degree | 184 (94.4%) | 0 (0.0%) |
| Bachelor's Degree or higher | 76 (100.0%) | 0 (0.0%) |
| Total | 329 (87.3%) | 0 (0.0%) |
Employment Occupations by Sex in Lucerne Mines
Management, Business, Science and Arts Occupations
The most common Management, Business, Science and Arts occupations in Lucerne Mines are Management (27 | 7.5%), and Health Diagnosing & Treating (13 | 3.6%).
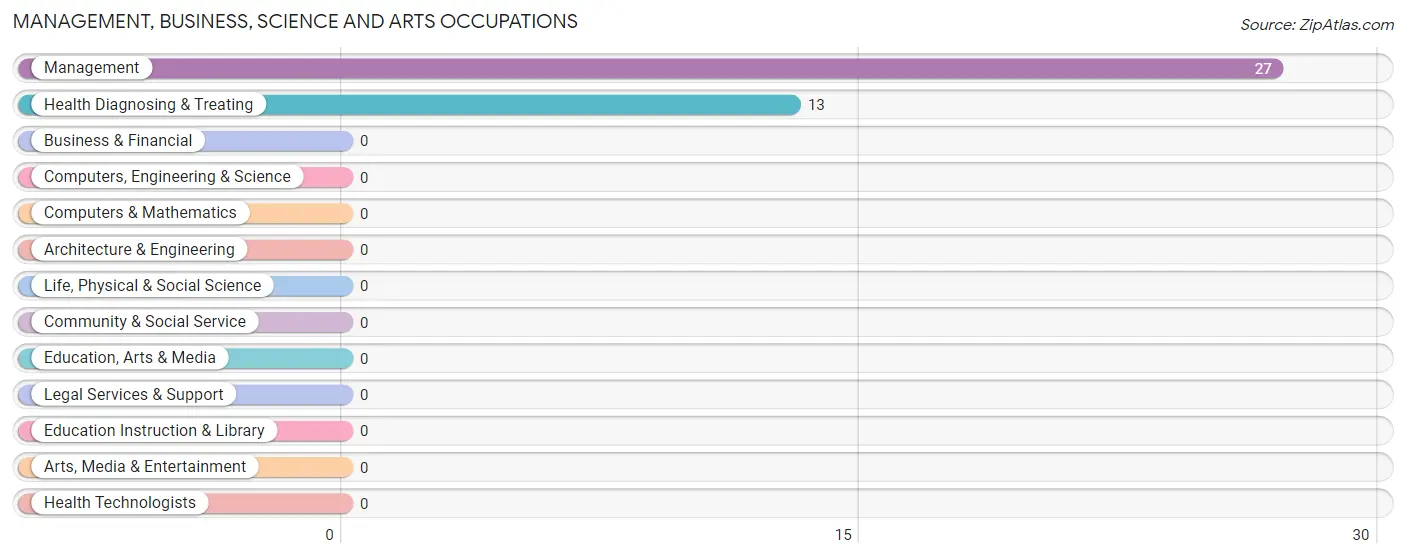
Management, Business, Science and Arts Occupations by Sex
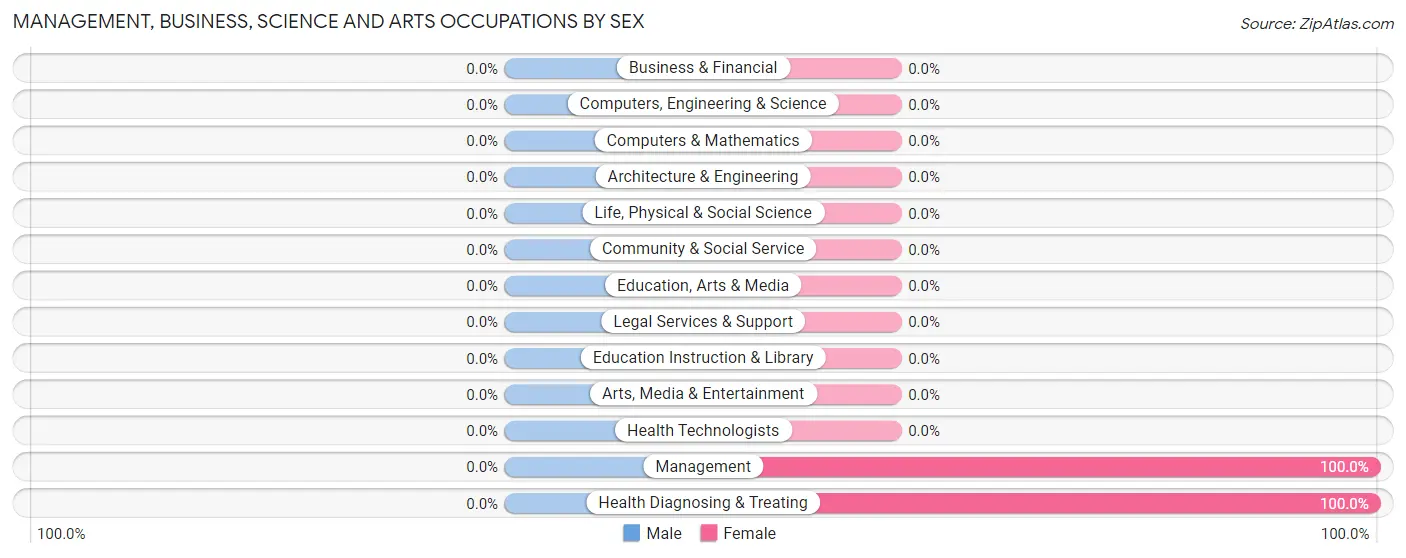
| Occupation | Male | Female |
| Management | 0 (0.0%) | 27 (100.0%) |
| Business & Financial | 0 (0.0%) | 0 (0.0%) |
| Computers, Engineering & Science | 0 (0.0%) | 0 (0.0%) |
| Computers & Mathematics | 0 (0.0%) | 0 (0.0%) |
| Architecture & Engineering | 0 (0.0%) | 0 (0.0%) |
| Life, Physical & Social Science | 0 (0.0%) | 0 (0.0%) |
| Community & Social Service | 0 (0.0%) | 0 (0.0%) |
| Education, Arts & Media | 0 (0.0%) | 0 (0.0%) |
| Legal Services & Support | 0 (0.0%) | 0 (0.0%) |
| Education Instruction & Library | 0 (0.0%) | 0 (0.0%) |
| Arts, Media & Entertainment | 0 (0.0%) | 0 (0.0%) |
| Health Diagnosing & Treating | 0 (0.0%) | 13 (100.0%) |
| Health Technologists | 0 (0.0%) | 0 (0.0%) |
| Total (Category) | 0 (0.0%) | 40 (100.0%) |
| Total (Overall) | 121 (33.4%) | 241 (66.6%) |
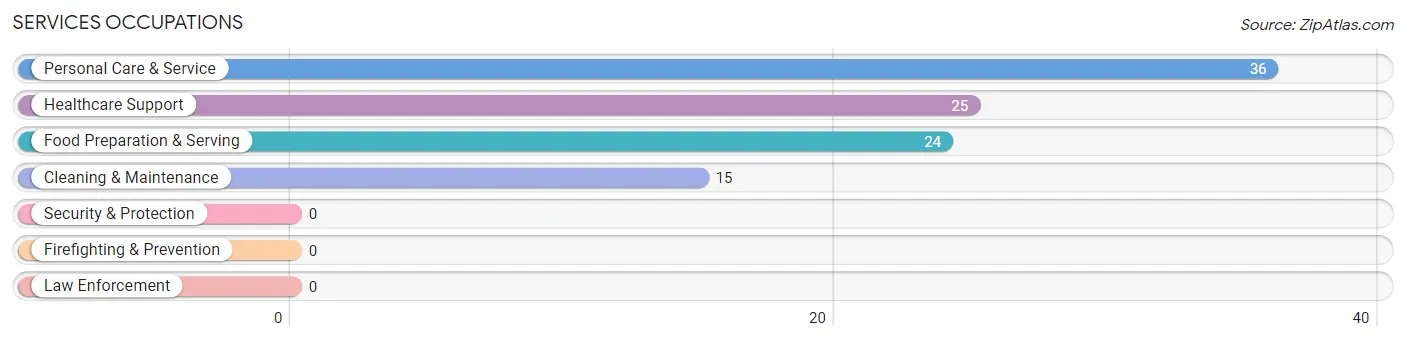
Services Occupations
The most common Services occupations in Lucerne Mines are Personal Care & Service (36 | 9.9%), Healthcare Support (25 | 6.9%), Food Preparation & Serving (24 | 6.6%), and Cleaning & Maintenance (15 | 4.1%).
Services Occupations by Sex
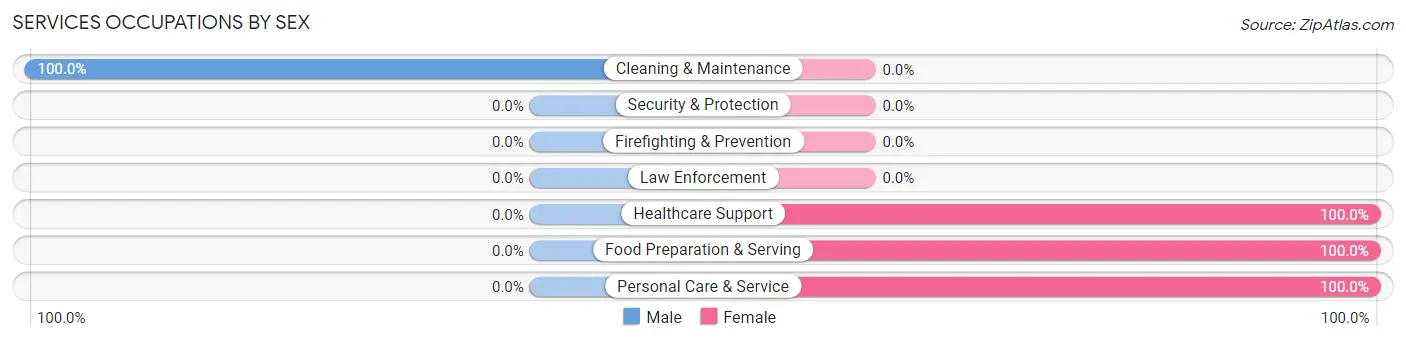
| Occupation | Male | Female |
| Healthcare Support | 0 (0.0%) | 25 (100.0%) |
| Security & Protection | 0 (0.0%) | 0 (0.0%) |
| Firefighting & Prevention | 0 (0.0%) | 0 (0.0%) |
| Law Enforcement | 0 (0.0%) | 0 (0.0%) |
| Food Preparation & Serving | 0 (0.0%) | 24 (100.0%) |
| Cleaning & Maintenance | 15 (100.0%) | 0 (0.0%) |
| Personal Care & Service | 0 (0.0%) | 36 (100.0%) |
| Total (Category) | 15 (15.0%) | 85 (85.0%) |
| Total (Overall) | 121 (33.4%) | 241 (66.6%) |
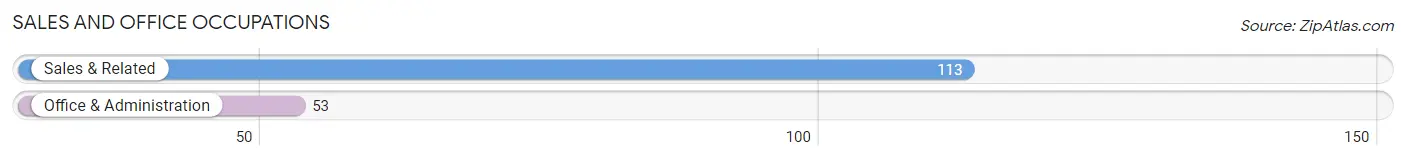
Sales and Office Occupations
The most common Sales and Office occupations in Lucerne Mines are Sales & Related (113 | 31.2%), and Office & Administration (53 | 14.6%).
Sales and Office Occupations by Sex

| Occupation | Male | Female |
| Sales & Related | 50 (44.3%) | 63 (55.7%) |
| Office & Administration | 0 (0.0%) | 53 (100.0%) |
| Total (Category) | 50 (30.1%) | 116 (69.9%) |
| Total (Overall) | 121 (33.4%) | 241 (66.6%) |
Natural Resources, Construction and Maintenance Occupations
The most common Natural Resources, Construction and Maintenance occupations in Lucerne Mines are , and Installation, Maintenance & Repair (24 | 6.6%).
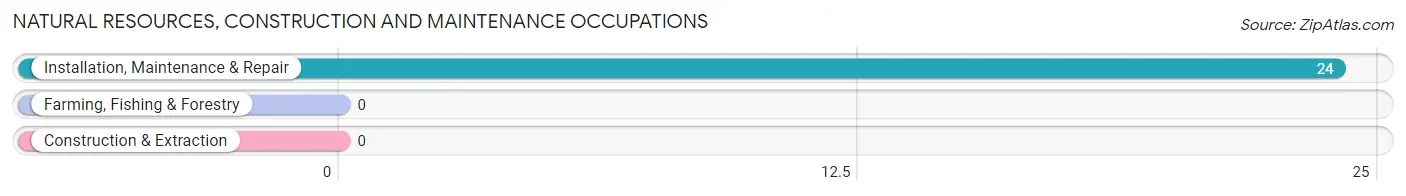
Natural Resources, Construction and Maintenance Occupations by Sex
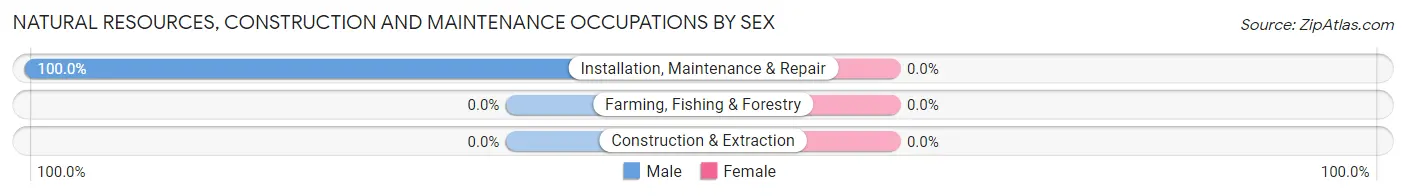
| Occupation | Male | Female |
| Farming, Fishing & Forestry | 0 (0.0%) | 0 (0.0%) |
| Construction & Extraction | 0 (0.0%) | 0 (0.0%) |
| Installation, Maintenance & Repair | 24 (100.0%) | 0 (0.0%) |
| Total (Category) | 24 (100.0%) | 0 (0.0%) |
| Total (Overall) | 121 (33.4%) | 241 (66.6%) |
Production, Transportation and Moving Occupations
The most common Production, Transportation and Moving occupations in Lucerne Mines are Production (23 | 6.4%), and Transportation (9 | 2.5%).
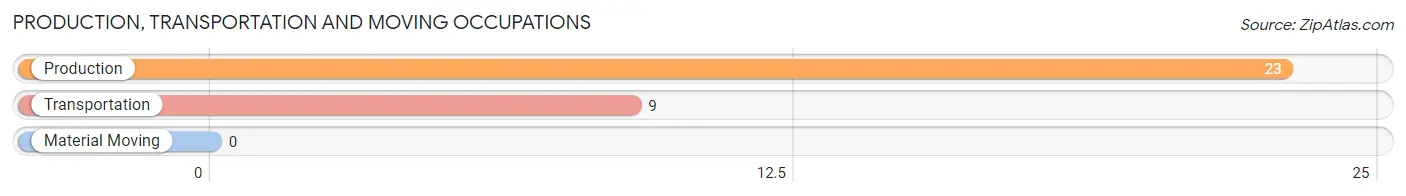
Production, Transportation and Moving Occupations by Sex
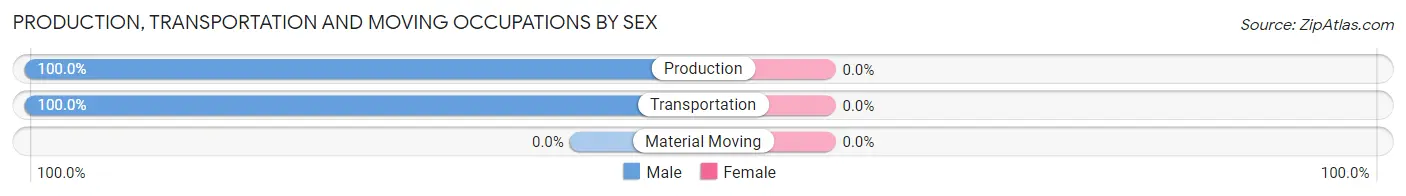
| Occupation | Male | Female |
| Production | 23 (100.0%) | 0 (0.0%) |
| Transportation | 9 (100.0%) | 0 (0.0%) |
| Material Moving | 0 (0.0%) | 0 (0.0%) |
| Total (Category) | 32 (100.0%) | 0 (0.0%) |
| Total (Overall) | 121 (33.4%) | 241 (66.6%) |
Employment Industries by Sex in Lucerne Mines
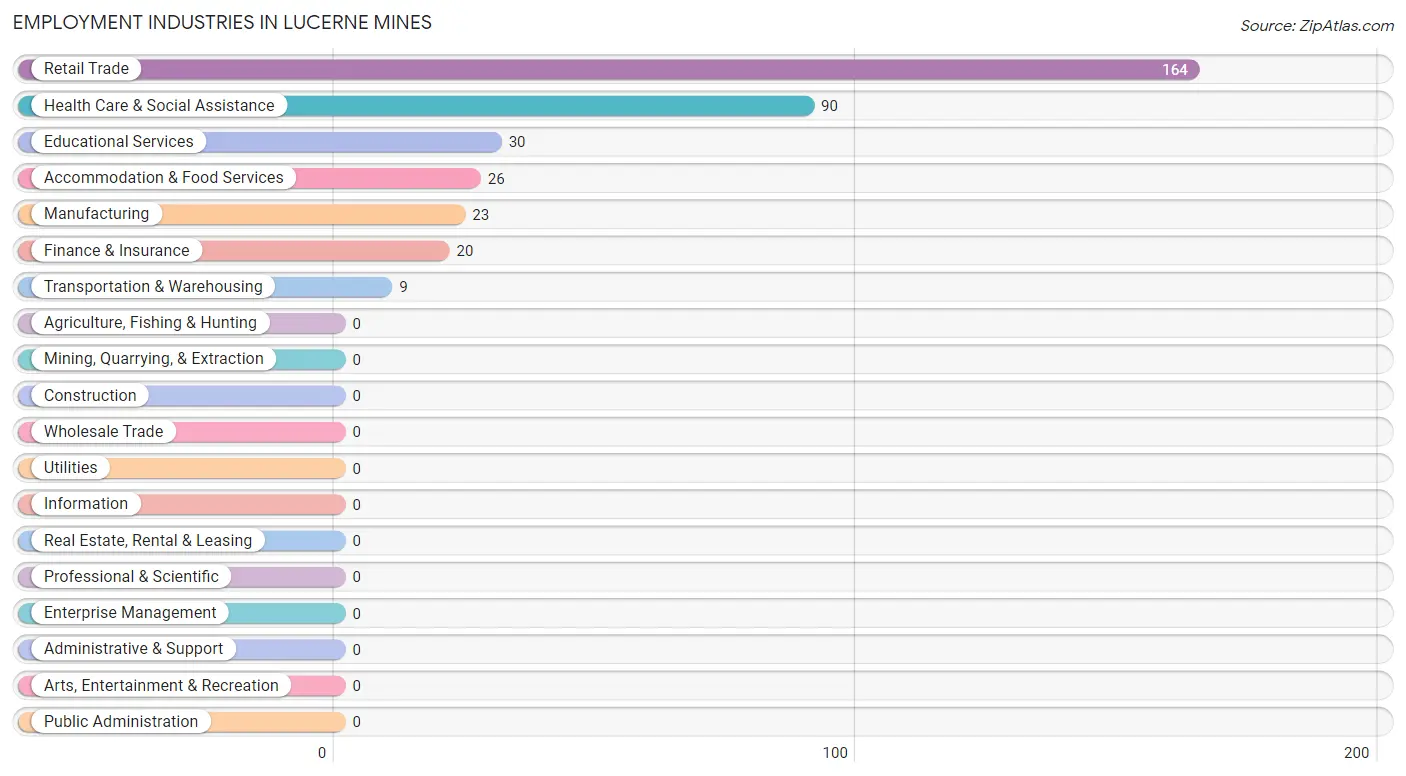
Employment Industries in Lucerne Mines
The major employment industries in Lucerne Mines include Retail Trade (164 | 45.3%), Health Care & Social Assistance (90 | 24.9%), Educational Services (30 | 8.3%), Accommodation & Food Services (26 | 7.2%), and Manufacturing (23 | 6.4%).
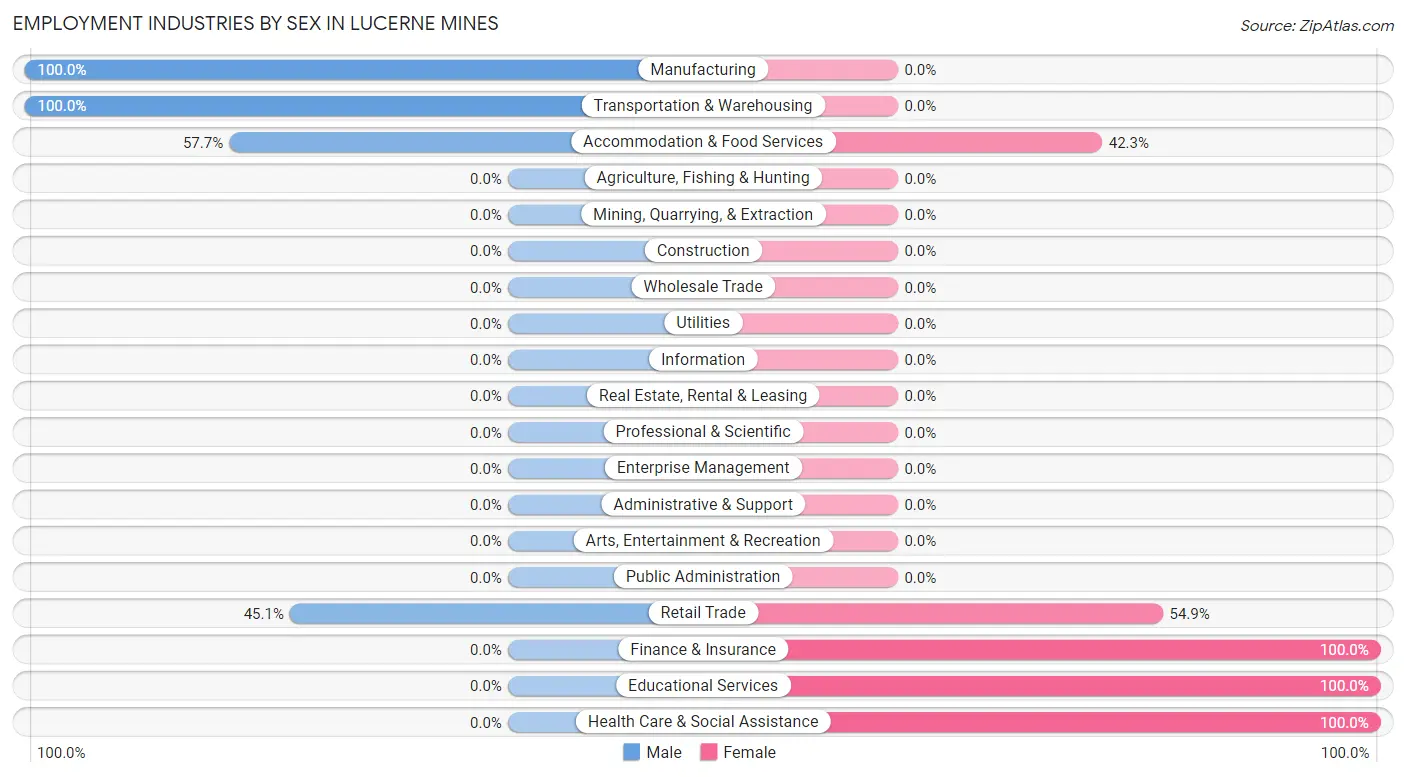
Employment Industries by Sex in Lucerne Mines
The Lucerne Mines industries that see more men than women are Manufacturing (100.0%), Transportation & Warehousing (100.0%), and Accommodation & Food Services (57.7%), whereas the industries that tend to have a higher number of women are Finance & Insurance (100.0%), Educational Services (100.0%), and Health Care & Social Assistance (100.0%).
| Industry | Male | Female |
| Agriculture, Fishing & Hunting | 0 (0.0%) | 0 (0.0%) |
| Mining, Quarrying, & Extraction | 0 (0.0%) | 0 (0.0%) |
| Construction | 0 (0.0%) | 0 (0.0%) |
| Manufacturing | 23 (100.0%) | 0 (0.0%) |
| Wholesale Trade | 0 (0.0%) | 0 (0.0%) |
| Retail Trade | 74 (45.1%) | 90 (54.9%) |
| Transportation & Warehousing | 9 (100.0%) | 0 (0.0%) |
| Utilities | 0 (0.0%) | 0 (0.0%) |
| Information | 0 (0.0%) | 0 (0.0%) |
| Finance & Insurance | 0 (0.0%) | 20 (100.0%) |
| Real Estate, Rental & Leasing | 0 (0.0%) | 0 (0.0%) |
| Professional & Scientific | 0 (0.0%) | 0 (0.0%) |
| Enterprise Management | 0 (0.0%) | 0 (0.0%) |
| Administrative & Support | 0 (0.0%) | 0 (0.0%) |
| Educational Services | 0 (0.0%) | 30 (100.0%) |
| Health Care & Social Assistance | 0 (0.0%) | 90 (100.0%) |
| Arts, Entertainment & Recreation | 0 (0.0%) | 0 (0.0%) |
| Accommodation & Food Services | 15 (57.7%) | 11 (42.3%) |
| Public Administration | 0 (0.0%) | 0 (0.0%) |
| Total | 121 (33.4%) | 241 (66.6%) |
Education in Lucerne Mines
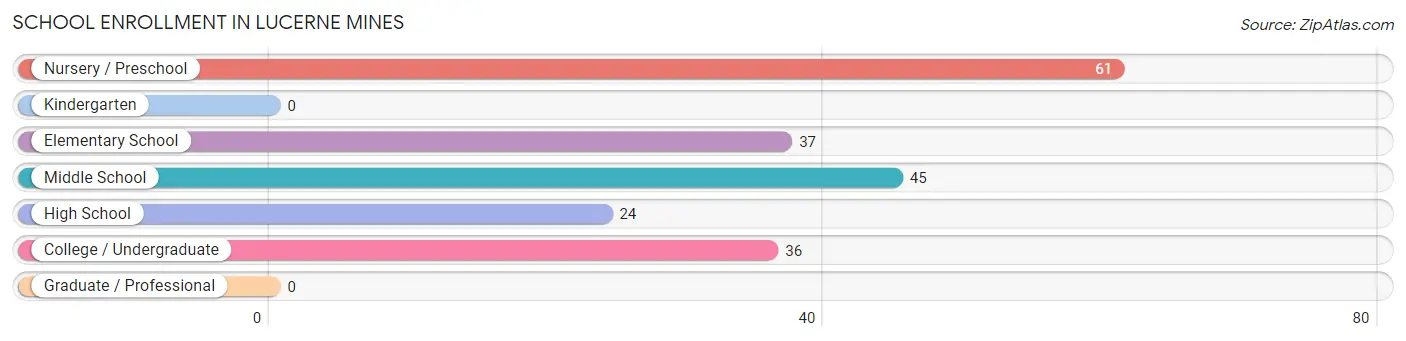
School Enrollment in Lucerne Mines
The most common levels of schooling among the 203 students in Lucerne Mines are nursery / preschool (61 | 30.0%), middle school (45 | 22.2%), and elementary school (37 | 18.2%).
| School Level | # Students | % Students |
| Nursery / Preschool | 61 | 30.0% |
| Kindergarten | 0 | 0.0% |
| Elementary School | 37 | 18.2% |
| Middle School | 45 | 22.2% |
| High School | 24 | 11.8% |
| College / Undergraduate | 36 | 17.7% |
| Graduate / Professional | 0 | 0.0% |
| Total | 203 | 100.0% |
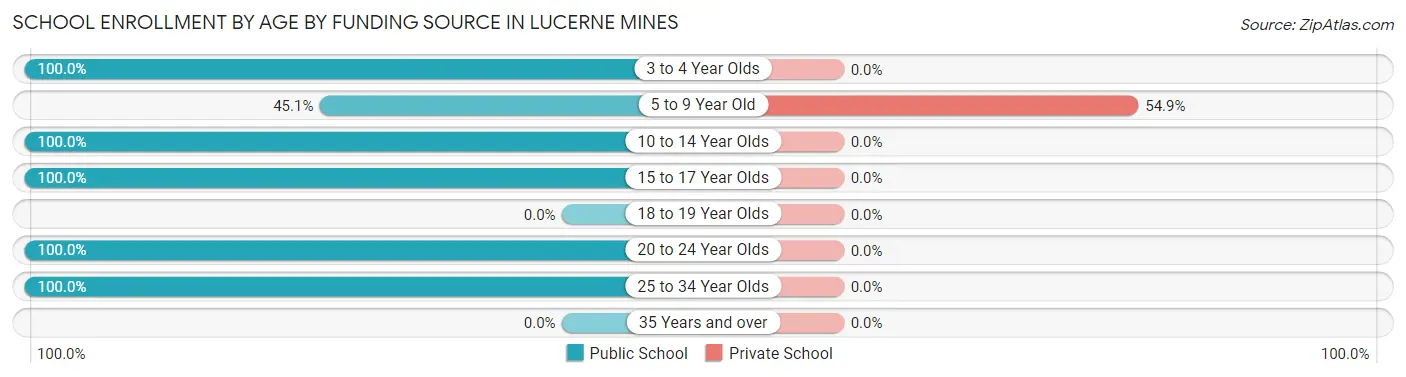
School Enrollment by Age by Funding Source in Lucerne Mines
Out of a total of 203 students who are enrolled in schools in Lucerne Mines, 45 (22.2%) attend a private institution, while the remaining 158 (77.8%) are enrolled in public schools. The age group of 5 to 9 year old has the highest likelihood of being enrolled in private schools, with 45 (54.9% in the age bracket) enrolled. Conversely, the age group of 3 to 4 year olds has the lowest likelihood of being enrolled in a private school, with 16 (100.0% in the age bracket) attending a public institution.
| Age Bracket | Public School | Private School |
| 3 to 4 Year Olds | 16 (100.0%) | 0 (0.0%) |
| 5 to 9 Year Old | 37 (45.1%) | 45 (54.9%) |
| 10 to 14 Year Olds | 45 (100.0%) | 0 (0.0%) |
| 15 to 17 Year Olds | 24 (100.0%) | 0 (0.0%) |
| 18 to 19 Year Olds | 0 (0.0%) | 0 (0.0%) |
| 20 to 24 Year Olds | 35 (100.0%) | 0 (0.0%) |
| 25 to 34 Year Olds | 1 (100.0%) | 0 (0.0%) |
| 35 Years and over | 0 (0.0%) | 0 (0.0%) |
| Total | 158 (77.8%) | 45 (22.2%) |
Educational Attainment by Field of Study in Lucerne Mines
Arts & humanities (49 | 56.3%), literature & languages (16 | 18.4%), computers & mathematics (11 | 12.6%), and science & technology (11 | 12.6%) are the most common fields of study among 87 individuals in Lucerne Mines who have obtained a bachelor's degree or higher.
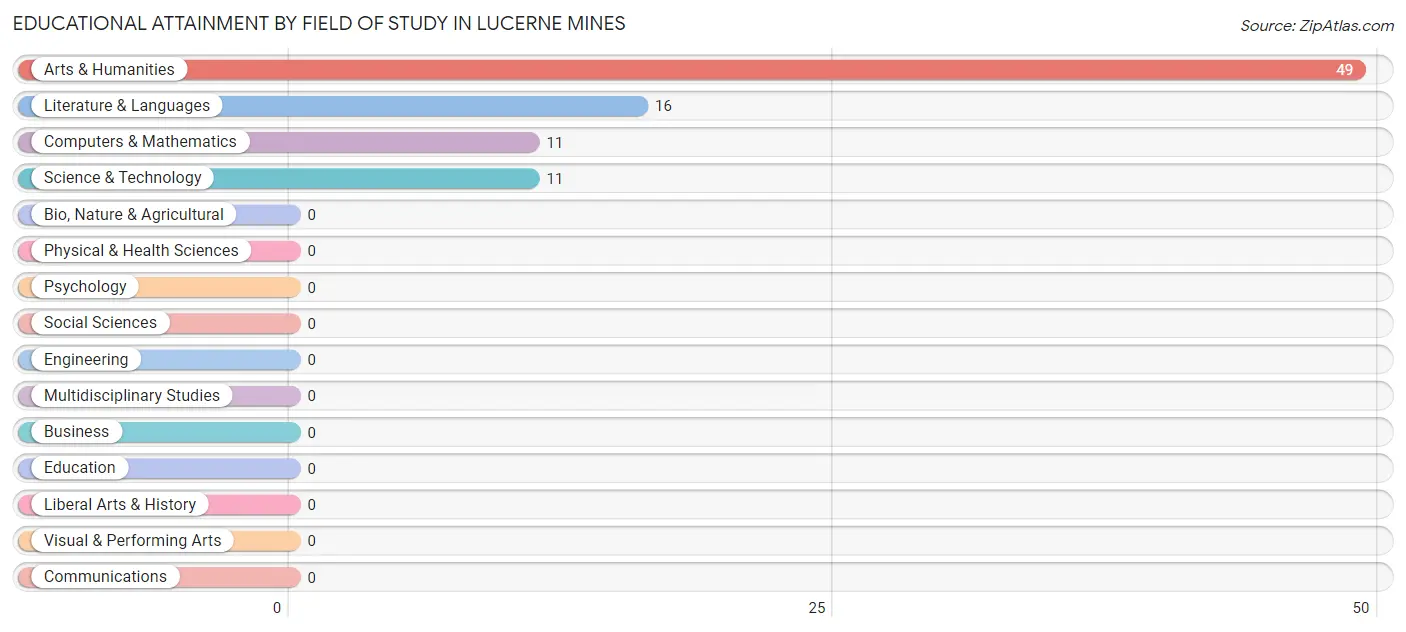
| Field of Study | # Graduates | % Graduates |
| Computers & Mathematics | 11 | 12.6% |
| Bio, Nature & Agricultural | 0 | 0.0% |
| Physical & Health Sciences | 0 | 0.0% |
| Psychology | 0 | 0.0% |
| Social Sciences | 0 | 0.0% |
| Engineering | 0 | 0.0% |
| Multidisciplinary Studies | 0 | 0.0% |
| Science & Technology | 11 | 12.6% |
| Business | 0 | 0.0% |
| Education | 0 | 0.0% |
| Literature & Languages | 16 | 18.4% |
| Liberal Arts & History | 0 | 0.0% |
| Visual & Performing Arts | 0 | 0.0% |
| Communications | 0 | 0.0% |
| Arts & Humanities | 49 | 56.3% |
| Total | 87 | 100.0% |
Transportation & Commute in Lucerne Mines
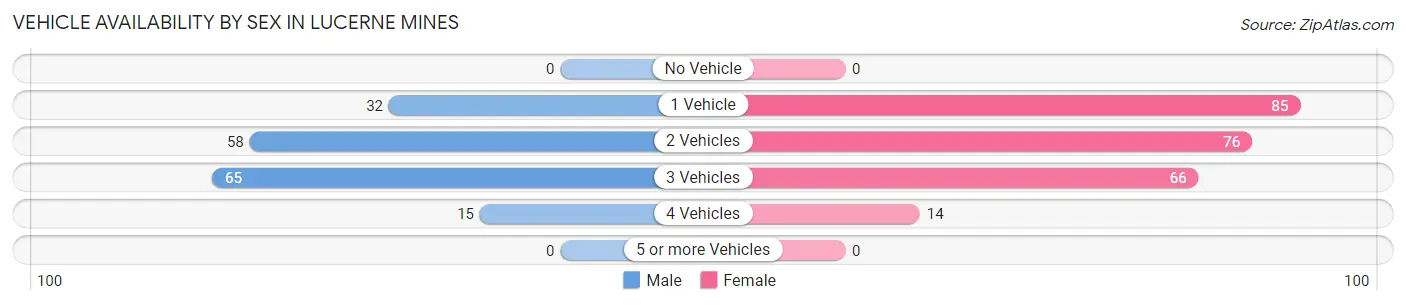
Vehicle Availability by Sex in Lucerne Mines
The most prevalent vehicle ownership categories in Lucerne Mines are males with 3 vehicles (65, accounting for 38.2%) and females with 3 vehicles (66, making up 27.0%).
| Vehicles Available | Male | Female |
| No Vehicle | 0 (0.0%) | 0 (0.0%) |
| 1 Vehicle | 32 (18.8%) | 85 (35.3%) |
| 2 Vehicles | 58 (34.1%) | 76 (31.5%) |
| 3 Vehicles | 65 (38.2%) | 66 (27.4%) |
| 4 Vehicles | 15 (8.8%) | 14 (5.8%) |
| 5 or more Vehicles | 0 (0.0%) | 0 (0.0%) |
| Total | 170 (100.0%) | 241 (100.0%) |
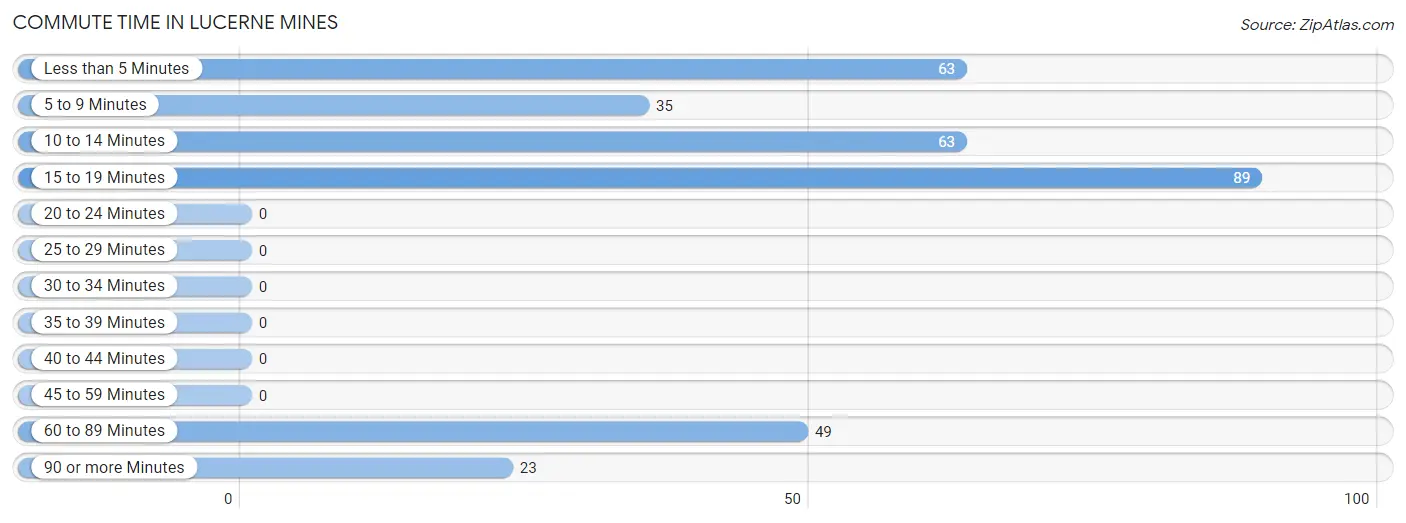
Commute Time in Lucerne Mines
The most frequently occuring commute durations in Lucerne Mines are 15 to 19 minutes (89 commuters, 27.6%), less than 5 minutes (63 commuters, 19.6%), and 10 to 14 minutes (63 commuters, 19.6%).
| Commute Time | # Commuters | % Commuters |
| Less than 5 Minutes | 63 | 19.6% |
| 5 to 9 Minutes | 35 | 10.9% |
| 10 to 14 Minutes | 63 | 19.6% |
| 15 to 19 Minutes | 89 | 27.6% |
| 20 to 24 Minutes | 0 | 0.0% |
| 25 to 29 Minutes | 0 | 0.0% |
| 30 to 34 Minutes | 0 | 0.0% |
| 35 to 39 Minutes | 0 | 0.0% |
| 40 to 44 Minutes | 0 | 0.0% |
| 45 to 59 Minutes | 0 | 0.0% |
| 60 to 89 Minutes | 49 | 15.2% |
| 90 or more Minutes | 23 | 7.1% |
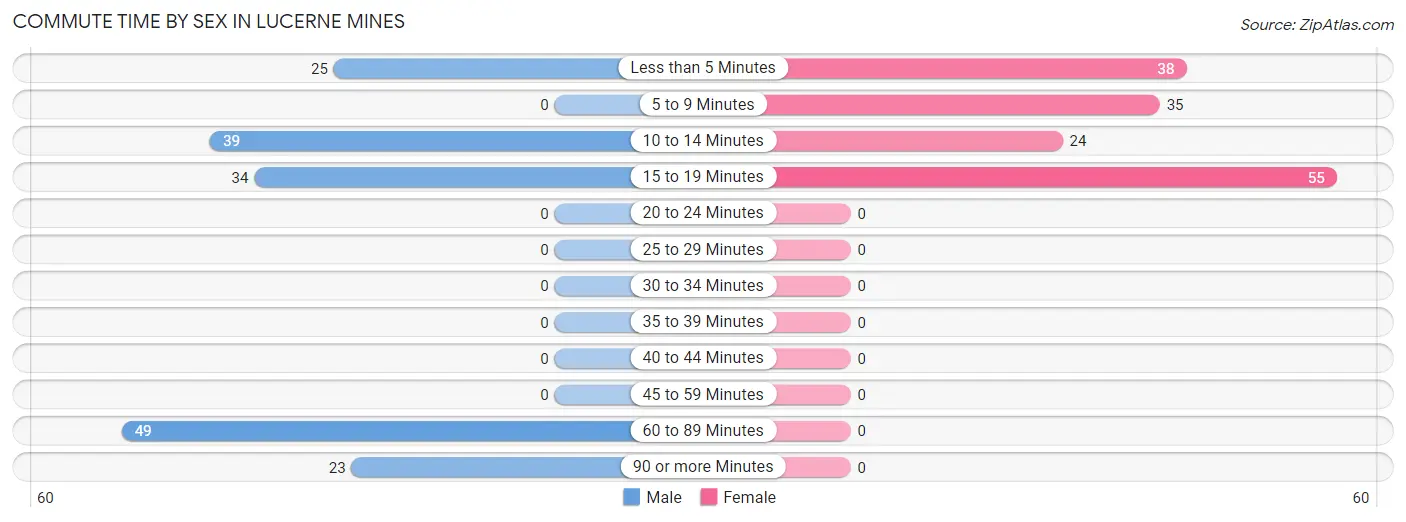
Commute Time by Sex in Lucerne Mines
The most common commute times in Lucerne Mines are 60 to 89 minutes (49 commuters, 28.8%) for males and 15 to 19 minutes (55 commuters, 36.2%) for females.
| Commute Time | Male | Female |
| Less than 5 Minutes | 25 (14.7%) | 38 (25.0%) |
| 5 to 9 Minutes | 0 (0.0%) | 35 (23.0%) |
| 10 to 14 Minutes | 39 (22.9%) | 24 (15.8%) |
| 15 to 19 Minutes | 34 (20.0%) | 55 (36.2%) |
| 20 to 24 Minutes | 0 (0.0%) | 0 (0.0%) |
| 25 to 29 Minutes | 0 (0.0%) | 0 (0.0%) |
| 30 to 34 Minutes | 0 (0.0%) | 0 (0.0%) |
| 35 to 39 Minutes | 0 (0.0%) | 0 (0.0%) |
| 40 to 44 Minutes | 0 (0.0%) | 0 (0.0%) |
| 45 to 59 Minutes | 0 (0.0%) | 0 (0.0%) |
| 60 to 89 Minutes | 49 (28.8%) | 0 (0.0%) |
| 90 or more Minutes | 23 (13.5%) | 0 (0.0%) |
Time of Departure to Work by Sex in Lucerne Mines
The most frequent times of departure to work in Lucerne Mines are 12:00 PM to 3:59 PM (50, 29.4%) for males and 5:30 AM to 5:59 AM (52, 34.2%) for females.
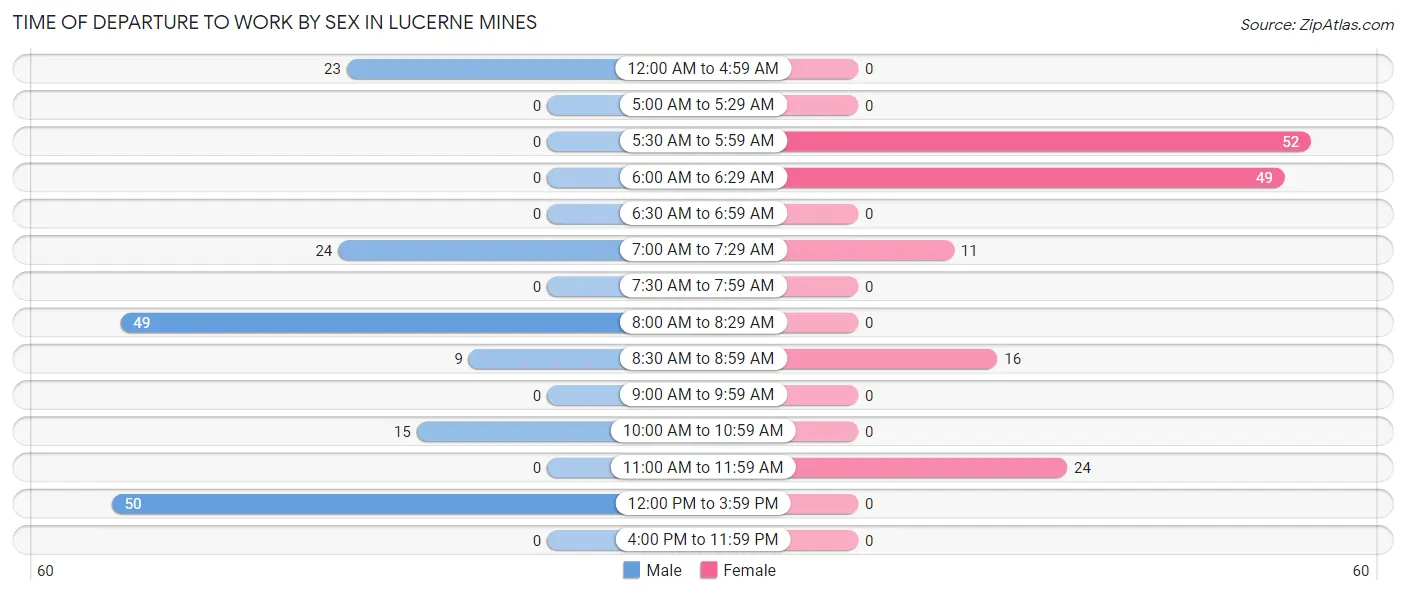
| Time of Departure | Male | Female |
| 12:00 AM to 4:59 AM | 23 (13.5%) | 0 (0.0%) |
| 5:00 AM to 5:29 AM | 0 (0.0%) | 0 (0.0%) |
| 5:30 AM to 5:59 AM | 0 (0.0%) | 52 (34.2%) |
| 6:00 AM to 6:29 AM | 0 (0.0%) | 49 (32.2%) |
| 6:30 AM to 6:59 AM | 0 (0.0%) | 0 (0.0%) |
| 7:00 AM to 7:29 AM | 24 (14.1%) | 11 (7.2%) |
| 7:30 AM to 7:59 AM | 0 (0.0%) | 0 (0.0%) |
| 8:00 AM to 8:29 AM | 49 (28.8%) | 0 (0.0%) |
| 8:30 AM to 8:59 AM | 9 (5.3%) | 16 (10.5%) |
| 9:00 AM to 9:59 AM | 0 (0.0%) | 0 (0.0%) |
| 10:00 AM to 10:59 AM | 15 (8.8%) | 0 (0.0%) |
| 11:00 AM to 11:59 AM | 0 (0.0%) | 24 (15.8%) |
| 12:00 PM to 3:59 PM | 50 (29.4%) | 0 (0.0%) |
| 4:00 PM to 11:59 PM | 0 (0.0%) | 0 (0.0%) |
| Total | 170 (100.0%) | 152 (100.0%) |
Housing Occupancy in Lucerne Mines
Occupancy by Ownership in Lucerne Mines
Of the total 365 dwellings in Lucerne Mines, owner-occupied units account for 292 (80.0%), while renter-occupied units make up 73 (20.0%).
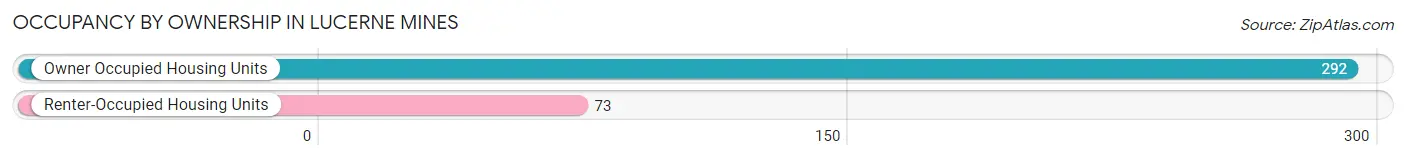
| Occupancy | # Housing Units | % Housing Units |
| Owner Occupied Housing Units | 292 | 80.0% |
| Renter-Occupied Housing Units | 73 | 20.0% |
| Total Occupied Housing Units | 365 | 100.0% |
Occupancy by Household Size in Lucerne Mines
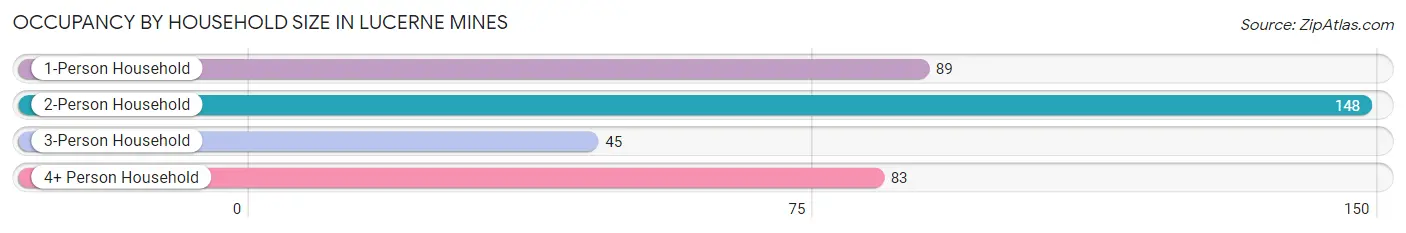
| Household Size | # Housing Units | % Housing Units |
| 1-Person Household | 89 | 24.4% |
| 2-Person Household | 148 | 40.6% |
| 3-Person Household | 45 | 12.3% |
| 4+ Person Household | 83 | 22.7% |
| Total Housing Units | 365 | 100.0% |
Occupancy by Ownership by Household Size in Lucerne Mines
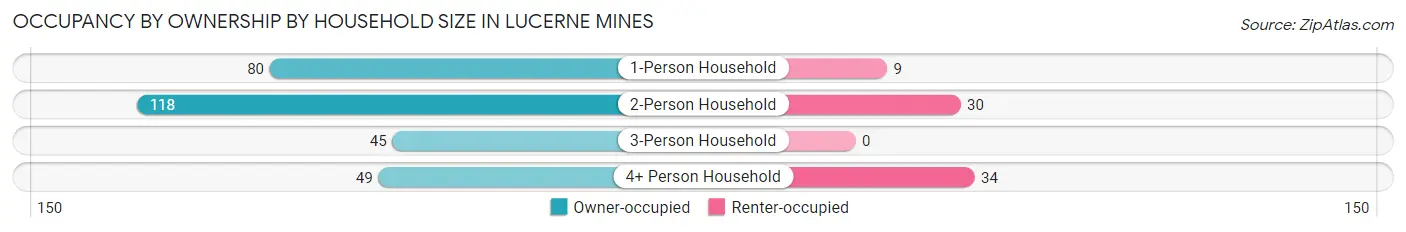
| Household Size | Owner-occupied | Renter-occupied |
| 1-Person Household | 80 (89.9%) | 9 (10.1%) |
| 2-Person Household | 118 (79.7%) | 30 (20.3%) |
| 3-Person Household | 45 (100.0%) | 0 (0.0%) |
| 4+ Person Household | 49 (59.0%) | 34 (41.0%) |
| Total Housing Units | 292 (80.0%) | 73 (20.0%) |
Occupancy by Educational Attainment in Lucerne Mines
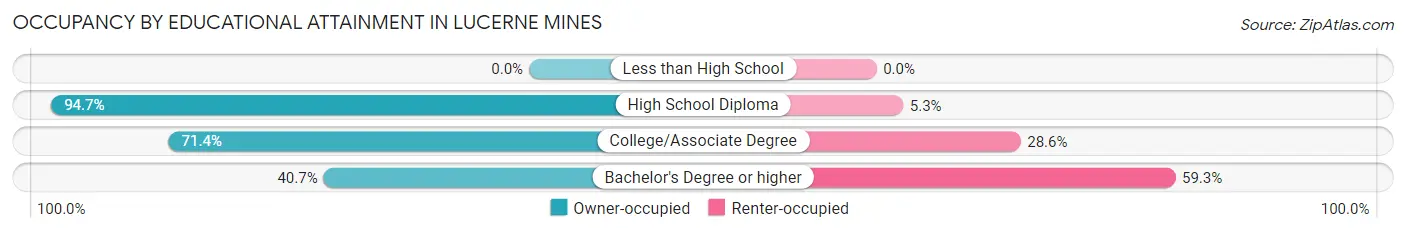
| Household Size | Owner-occupied | Renter-occupied |
| Less than High School | 0 (0.0%) | 0 (0.0%) |
| High School Diploma | 161 (94.7%) | 9 (5.3%) |
| College/Associate Degree | 120 (71.4%) | 48 (28.6%) |
| Bachelor's Degree or higher | 11 (40.7%) | 16 (59.3%) |
Occupancy by Age of Householder in Lucerne Mines
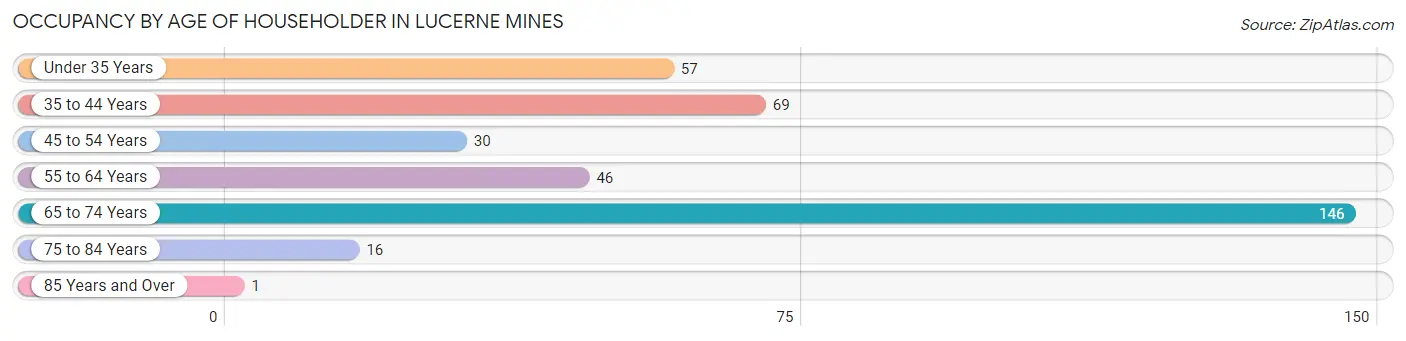
| Age Bracket | # Households | % Households |
| Under 35 Years | 57 | 15.6% |
| 35 to 44 Years | 69 | 18.9% |
| 45 to 54 Years | 30 | 8.2% |
| 55 to 64 Years | 46 | 12.6% |
| 65 to 74 Years | 146 | 40.0% |
| 75 to 84 Years | 16 | 4.4% |
| 85 Years and Over | 1 | 0.3% |
| Total | 365 | 100.0% |
Housing Finances in Lucerne Mines
Median Income by Occupancy in Lucerne Mines
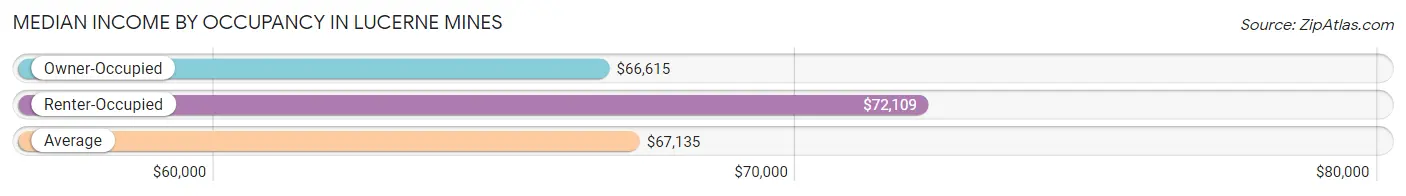
| Occupancy Type | # Households | Median Income |
| Owner-Occupied | 292 (80.0%) | $66,615 |
| Renter-Occupied | 73 (20.0%) | $72,109 |
| Average | 365 (100.0%) | $67,135 |
Occupancy by Householder Income Bracket in Lucerne Mines
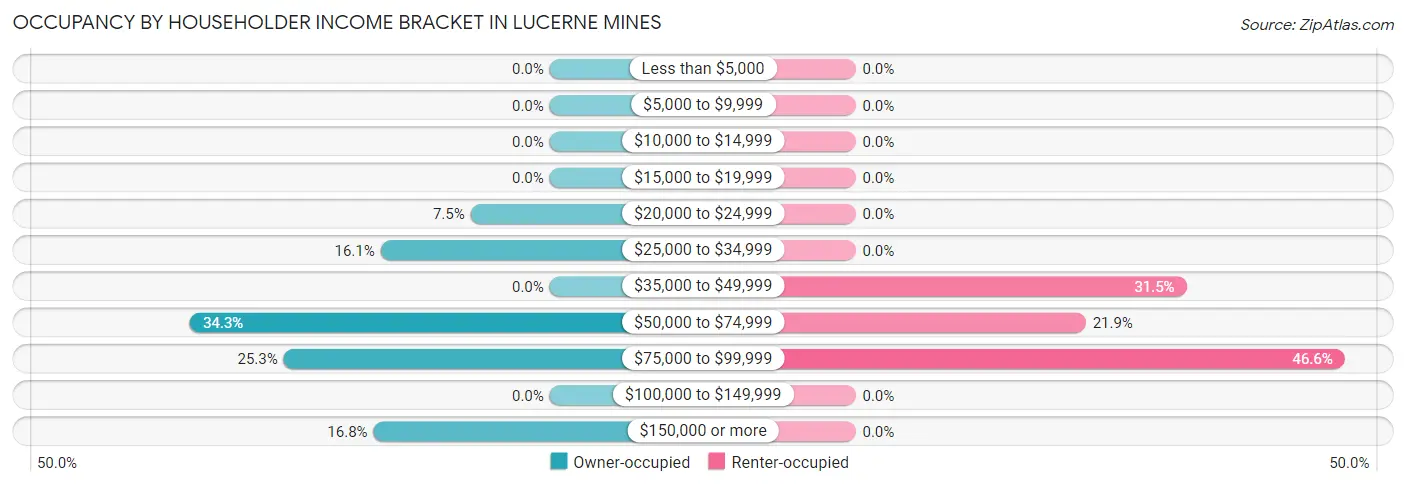
| Income Bracket | Owner-occupied | Renter-occupied |
| Less than $5,000 | 0 (0.0%) | 0 (0.0%) |
| $5,000 to $9,999 | 0 (0.0%) | 0 (0.0%) |
| $10,000 to $14,999 | 0 (0.0%) | 0 (0.0%) |
| $15,000 to $19,999 | 0 (0.0%) | 0 (0.0%) |
| $20,000 to $24,999 | 22 (7.5%) | 0 (0.0%) |
| $25,000 to $34,999 | 47 (16.1%) | 0 (0.0%) |
| $35,000 to $49,999 | 0 (0.0%) | 23 (31.5%) |
| $50,000 to $74,999 | 100 (34.3%) | 16 (21.9%) |
| $75,000 to $99,999 | 74 (25.3%) | 34 (46.6%) |
| $100,000 to $149,999 | 0 (0.0%) | 0 (0.0%) |
| $150,000 or more | 49 (16.8%) | 0 (0.0%) |
| Total | 292 (100.0%) | 73 (100.0%) |
Monthly Housing Cost Tiers in Lucerne Mines
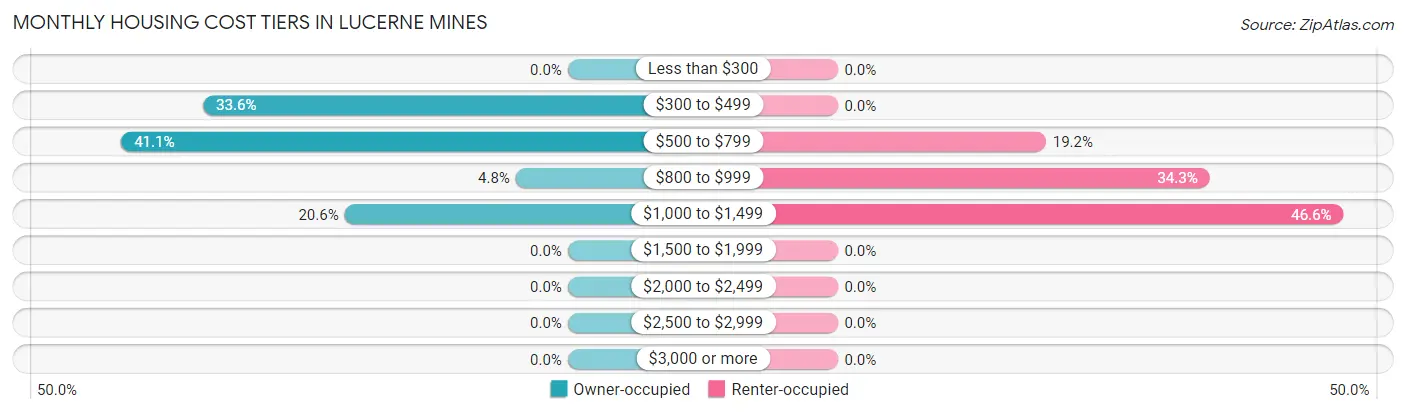
| Monthly Cost | Owner-occupied | Renter-occupied |
| Less than $300 | 0 (0.0%) | 0 (0.0%) |
| $300 to $499 | 98 (33.6%) | 0 (0.0%) |
| $500 to $799 | 120 (41.1%) | 14 (19.2%) |
| $800 to $999 | 14 (4.8%) | 25 (34.3%) |
| $1,000 to $1,499 | 60 (20.5%) | 34 (46.6%) |
| $1,500 to $1,999 | 0 (0.0%) | 0 (0.0%) |
| $2,000 to $2,499 | 0 (0.0%) | 0 (0.0%) |
| $2,500 to $2,999 | 0 (0.0%) | 0 (0.0%) |
| $3,000 or more | 0 (0.0%) | 0 (0.0%) |
| Total | 292 (100.0%) | 73 (100.0%) |
Physical Housing Characteristics in Lucerne Mines
Housing Structures in Lucerne Mines
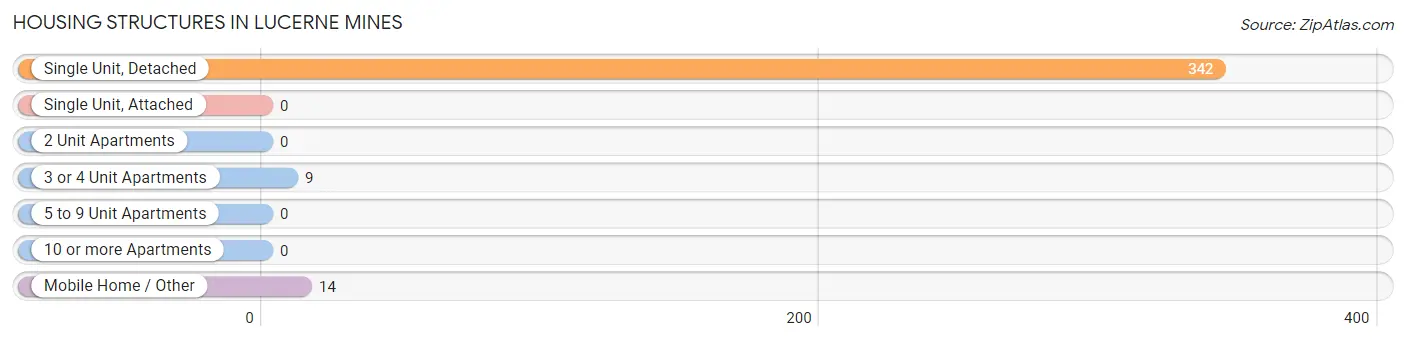
| Structure Type | # Housing Units | % Housing Units |
| Single Unit, Detached | 342 | 93.7% |
| Single Unit, Attached | 0 | 0.0% |
| 2 Unit Apartments | 0 | 0.0% |
| 3 or 4 Unit Apartments | 9 | 2.5% |
| 5 to 9 Unit Apartments | 0 | 0.0% |
| 10 or more Apartments | 0 | 0.0% |
| Mobile Home / Other | 14 | 3.8% |
| Total | 365 | 100.0% |
Housing Structures by Occupancy in Lucerne Mines
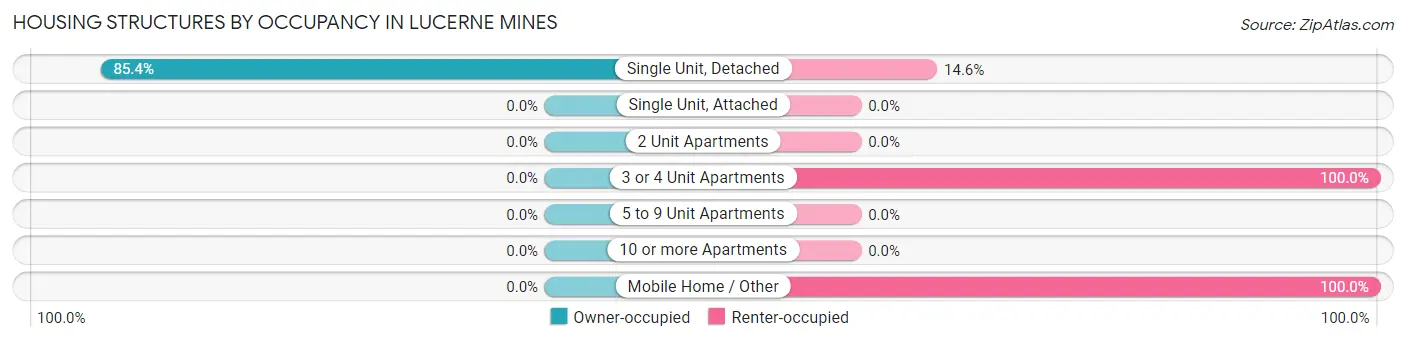
| Structure Type | Owner-occupied | Renter-occupied |
| Single Unit, Detached | 292 (85.4%) | 50 (14.6%) |
| Single Unit, Attached | 0 (0.0%) | 0 (0.0%) |
| 2 Unit Apartments | 0 (0.0%) | 0 (0.0%) |
| 3 or 4 Unit Apartments | 0 (0.0%) | 9 (100.0%) |
| 5 to 9 Unit Apartments | 0 (0.0%) | 0 (0.0%) |
| 10 or more Apartments | 0 (0.0%) | 0 (0.0%) |
| Mobile Home / Other | 0 (0.0%) | 14 (100.0%) |
| Total | 292 (80.0%) | 73 (20.0%) |
Housing Structures by Number of Rooms in Lucerne Mines
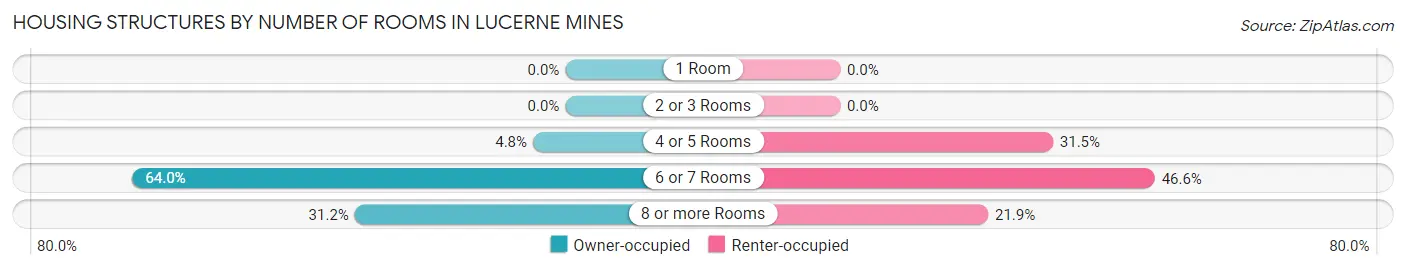
| Number of Rooms | Owner-occupied | Renter-occupied |
| 1 Room | 0 (0.0%) | 0 (0.0%) |
| 2 or 3 Rooms | 0 (0.0%) | 0 (0.0%) |
| 4 or 5 Rooms | 14 (4.8%) | 23 (31.5%) |
| 6 or 7 Rooms | 187 (64.0%) | 34 (46.6%) |
| 8 or more Rooms | 91 (31.2%) | 16 (21.9%) |
| Total | 292 (100.0%) | 73 (100.0%) |
Housing Structure by Heating Type in Lucerne Mines
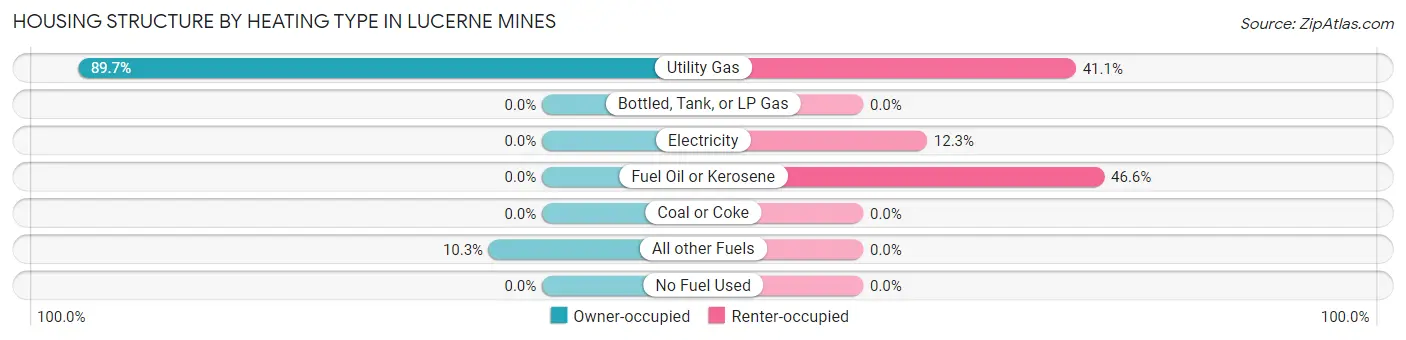
| Heating Type | Owner-occupied | Renter-occupied |
| Utility Gas | 262 (89.7%) | 30 (41.1%) |
| Bottled, Tank, or LP Gas | 0 (0.0%) | 0 (0.0%) |
| Electricity | 0 (0.0%) | 9 (12.3%) |
| Fuel Oil or Kerosene | 0 (0.0%) | 34 (46.6%) |
| Coal or Coke | 0 (0.0%) | 0 (0.0%) |
| All other Fuels | 30 (10.3%) | 0 (0.0%) |
| No Fuel Used | 0 (0.0%) | 0 (0.0%) |
| Total | 292 (100.0%) | 73 (100.0%) |
Household Vehicle Usage in Lucerne Mines
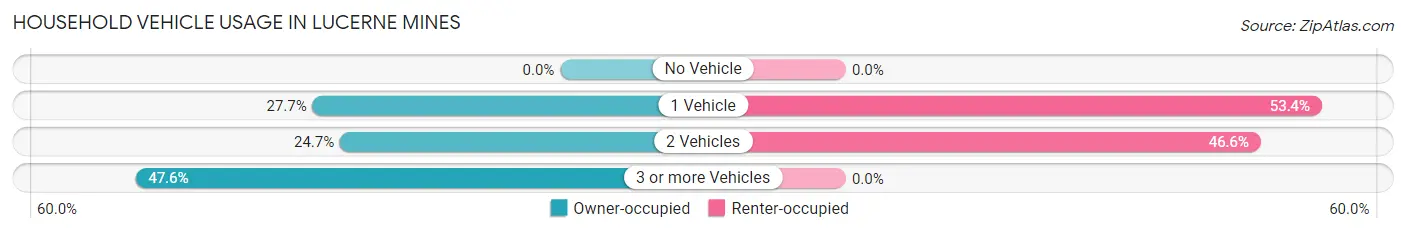
| Vehicles per Household | Owner-occupied | Renter-occupied |
| No Vehicle | 0 (0.0%) | 0 (0.0%) |
| 1 Vehicle | 81 (27.7%) | 39 (53.4%) |
| 2 Vehicles | 72 (24.7%) | 34 (46.6%) |
| 3 or more Vehicles | 139 (47.6%) | 0 (0.0%) |
| Total | 292 (100.0%) | 73 (100.0%) |
Real Estate & Mortgages in Lucerne Mines
Real Estate and Mortgage Overview in Lucerne Mines
| Characteristic | Without Mortgage | With Mortgage |
| Housing Units | 163 | 129 |
| Median Property Value | - | - |
| Median Household Income | $52,083 | $49 |
| Monthly Housing Costs | $434 | $0 |
| Real Estate Taxes | $1,945 | $0 |
Property Value by Mortgage Status in Lucerne Mines
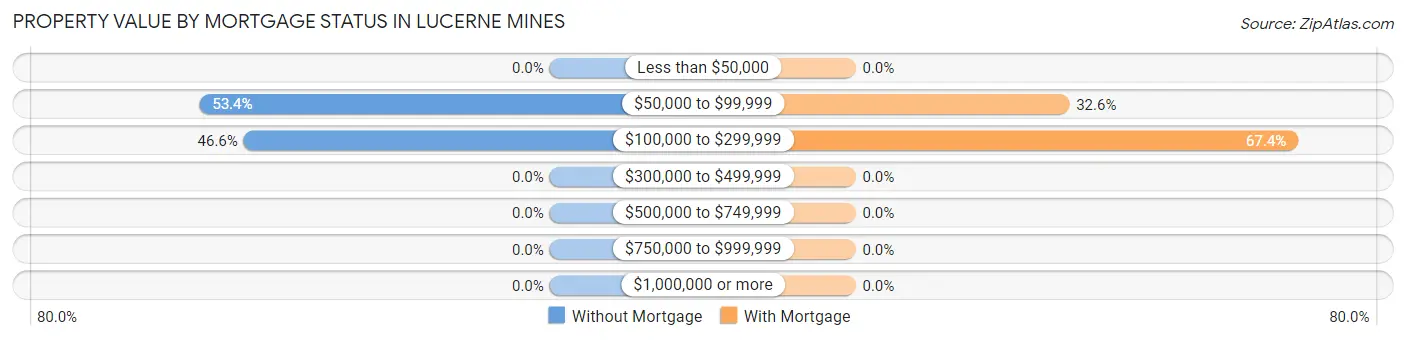
| Property Value | Without Mortgage | With Mortgage |
| Less than $50,000 | 0 (0.0%) | 0 (0.0%) |
| $50,000 to $99,999 | 87 (53.4%) | 42 (32.6%) |
| $100,000 to $299,999 | 76 (46.6%) | 87 (67.4%) |
| $300,000 to $499,999 | 0 (0.0%) | 0 (0.0%) |
| $500,000 to $749,999 | 0 (0.0%) | 0 (0.0%) |
| $750,000 to $999,999 | 0 (0.0%) | 0 (0.0%) |
| $1,000,000 or more | 0 (0.0%) | 0 (0.0%) |
| Total | 163 (100.0%) | 129 (100.0%) |
Household Income by Mortgage Status in Lucerne Mines
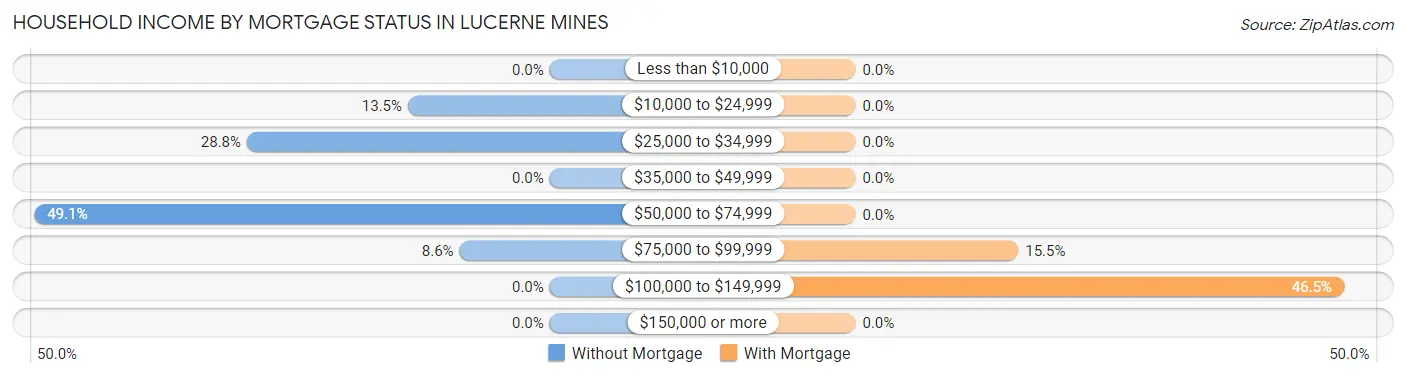
| Household Income | Without Mortgage | With Mortgage |
| Less than $10,000 | 0 (0.0%) | 0 (0.0%) |
| $10,000 to $24,999 | 22 (13.5%) | 0 (0.0%) |
| $25,000 to $34,999 | 47 (28.8%) | 0 (0.0%) |
| $35,000 to $49,999 | 0 (0.0%) | 0 (0.0%) |
| $50,000 to $74,999 | 80 (49.1%) | 0 (0.0%) |
| $75,000 to $99,999 | 14 (8.6%) | 20 (15.5%) |
| $100,000 to $149,999 | 0 (0.0%) | 60 (46.5%) |
| $150,000 or more | 0 (0.0%) | 0 (0.0%) |
| Total | 163 (100.0%) | 129 (100.0%) |
Property Value to Household Income Ratio in Lucerne Mines
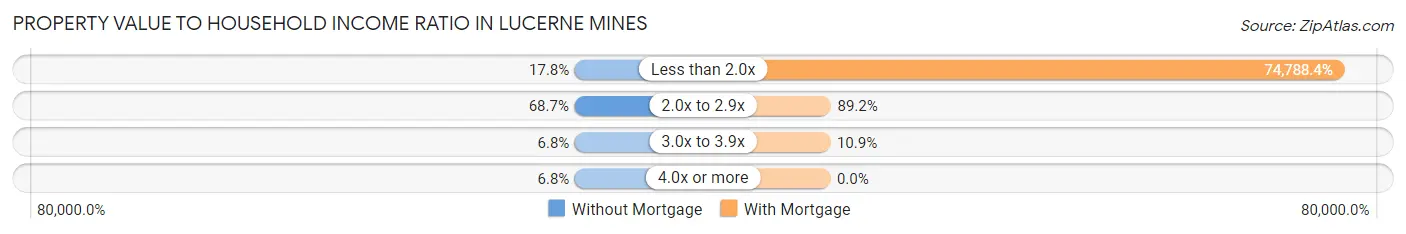
| Value-to-Income Ratio | Without Mortgage | With Mortgage |
| Less than 2.0x | 29 (17.8%) | 96,477 (74,788.4%) |
| 2.0x to 2.9x | 112 (68.7%) | 115 (89.1%) |
| 3.0x to 3.9x | 11 (6.8%) | 14 (10.8%) |
| 4.0x or more | 11 (6.8%) | 0 (0.0%) |
| Total | 163 (100.0%) | 129 (100.0%) |
Real Estate Taxes by Mortgage Status in Lucerne Mines
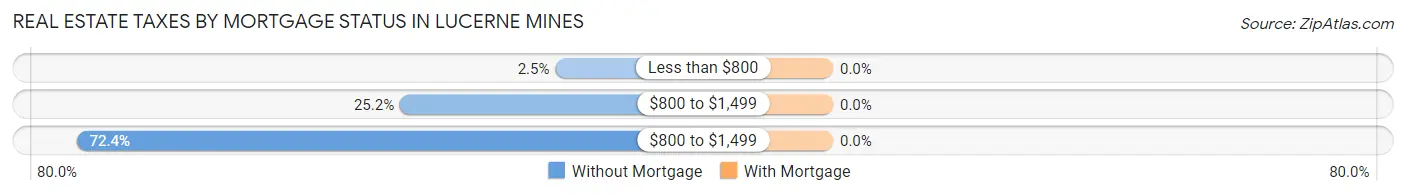
| Property Taxes | Without Mortgage | With Mortgage |
| Less than $800 | 4 (2.5%) | 0 (0.0%) |
| $800 to $1,499 | 41 (25.2%) | 0 (0.0%) |
| $800 to $1,499 | 118 (72.4%) | 0 (0.0%) |
| Total | 163 (100.0%) | 129 (100.0%) |
Health & Disability in Lucerne Mines
Health Insurance Coverage by Age in Lucerne Mines
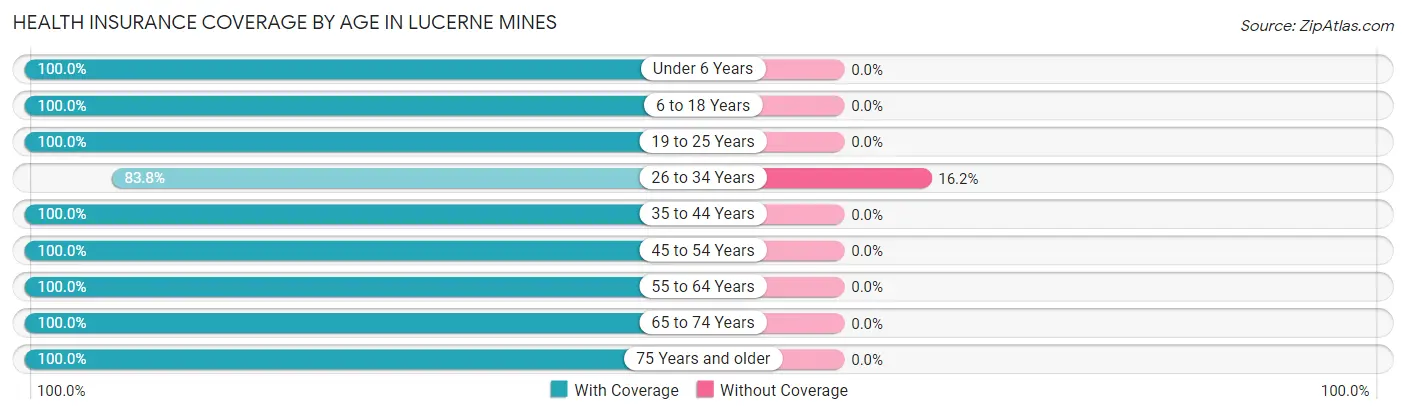
| Age Bracket | With Coverage | Without Coverage |
| Under 6 Years | 99 (100.0%) | 0 (0.0%) |
| 6 to 18 Years | 106 (100.0%) | 0 (0.0%) |
| 19 to 25 Years | 58 (100.0%) | 0 (0.0%) |
| 26 to 34 Years | 124 (83.8%) | 24 (16.2%) |
| 35 to 44 Years | 42 (100.0%) | 0 (0.0%) |
| 45 to 54 Years | 30 (100.0%) | 0 (0.0%) |
| 55 to 64 Years | 108 (100.0%) | 0 (0.0%) |
| 65 to 74 Years | 219 (100.0%) | 0 (0.0%) |
| 75 Years and older | 22 (100.0%) | 0 (0.0%) |
| Total | 808 (97.1%) | 24 (2.9%) |
Health Insurance Coverage by Citizenship Status in Lucerne Mines
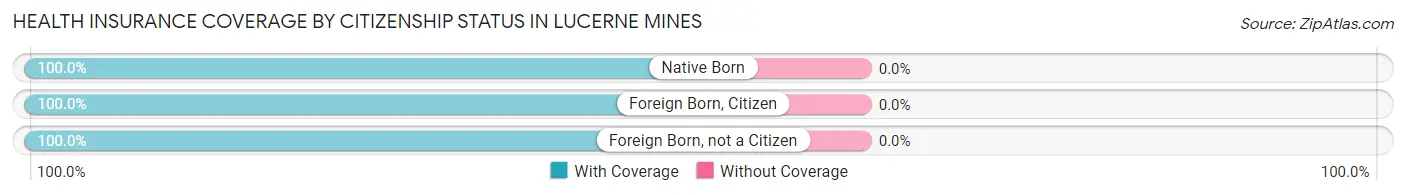
| Citizenship Status | With Coverage | Without Coverage |
| Native Born | 99 (100.0%) | 0 (0.0%) |
| Foreign Born, Citizen | 106 (100.0%) | 0 (0.0%) |
| Foreign Born, not a Citizen | 58 (100.0%) | 0 (0.0%) |
Health Insurance Coverage by Household Income in Lucerne Mines
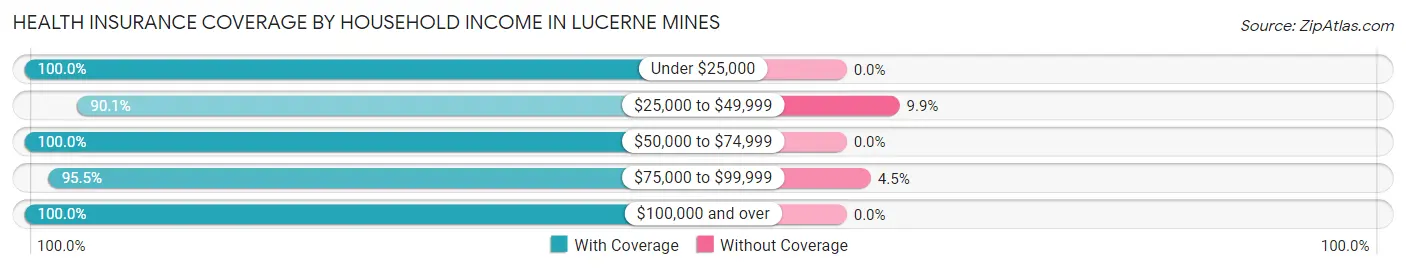
| Household Income | With Coverage | Without Coverage |
| Under $25,000 | 22 (100.0%) | 0 (0.0%) |
| $25,000 to $49,999 | 82 (90.1%) | 9 (9.9%) |
| $50,000 to $74,999 | 258 (100.0%) | 0 (0.0%) |
| $75,000 to $99,999 | 317 (95.5%) | 15 (4.5%) |
| $100,000 and over | 126 (100.0%) | 0 (0.0%) |
Public vs Private Health Insurance Coverage by Age in Lucerne Mines
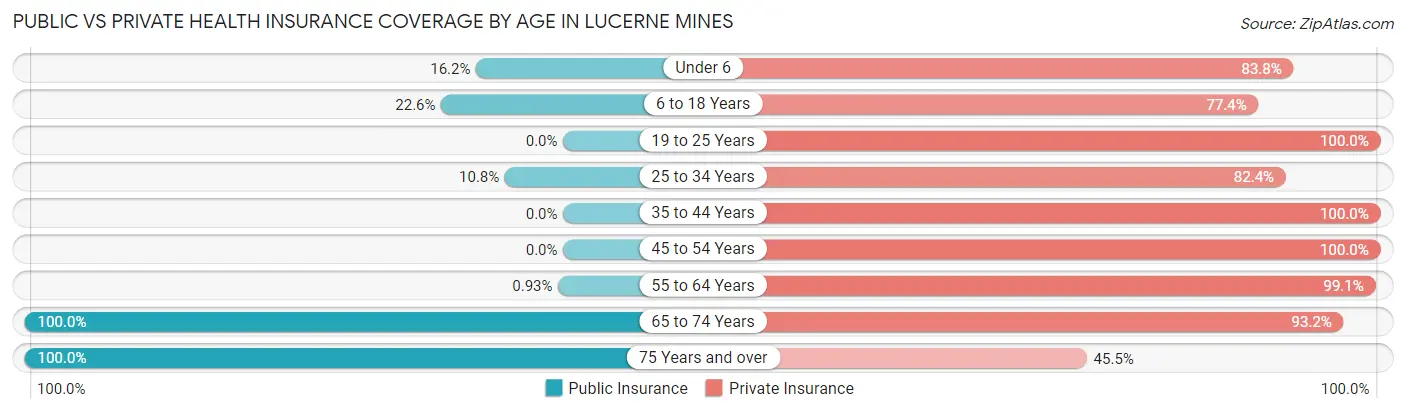
| Age Bracket | Public Insurance | Private Insurance |
| Under 6 | 16 (16.2%) | 83 (83.8%) |
| 6 to 18 Years | 24 (22.6%) | 82 (77.4%) |
| 19 to 25 Years | 0 (0.0%) | 58 (100.0%) |
| 25 to 34 Years | 16 (10.8%) | 122 (82.4%) |
| 35 to 44 Years | 0 (0.0%) | 42 (100.0%) |
| 45 to 54 Years | 0 (0.0%) | 30 (100.0%) |
| 55 to 64 Years | 1 (0.9%) | 107 (99.1%) |
| 65 to 74 Years | 219 (100.0%) | 204 (93.1%) |
| 75 Years and over | 22 (100.0%) | 10 (45.5%) |
| Total | 298 (35.8%) | 738 (88.7%) |
Disability Status by Sex by Age in Lucerne Mines
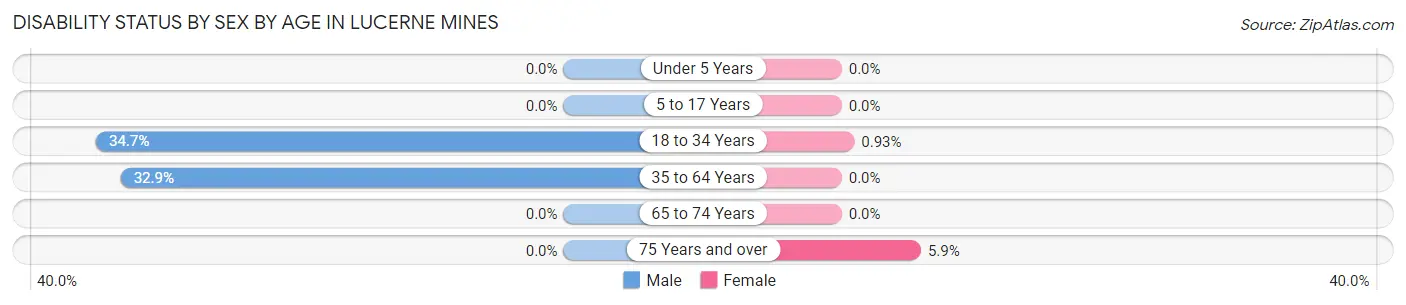
| Age Bracket | Male | Female |
| Under 5 Years | 0 (0.0%) | 0 (0.0%) |
| 5 to 17 Years | 0 (0.0%) | 0 (0.0%) |
| 18 to 34 Years | 34 (34.7%) | 1 (0.9%) |
| 35 to 64 Years | 23 (32.9%) | 0 (0.0%) |
| 65 to 74 Years | 0 (0.0%) | 0 (0.0%) |
| 75 Years and over | 0 (0.0%) | 1 (5.9%) |
Disability Class by Sex by Age in Lucerne Mines
Disability Class: Hearing Difficulty
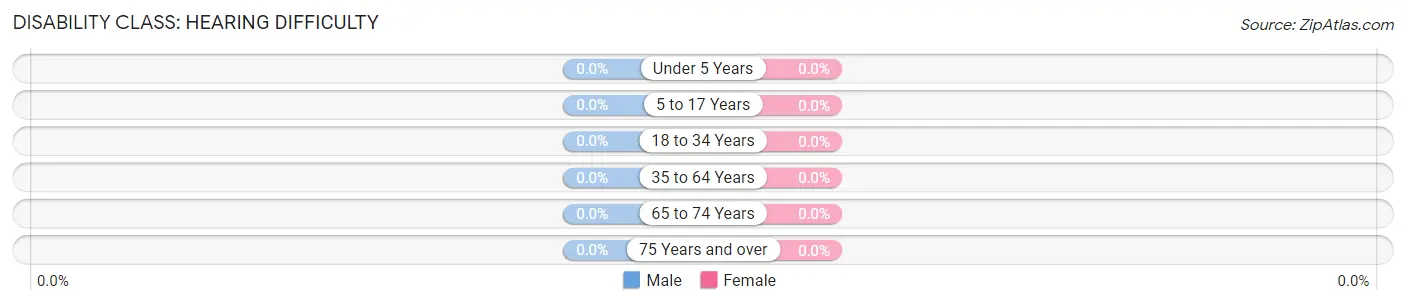
| Age Bracket | Male | Female |
| Under 5 Years | 0 (0.0%) | 0 (0.0%) |
| 5 to 17 Years | 0 (0.0%) | 0 (0.0%) |
| 18 to 34 Years | 0 (0.0%) | 0 (0.0%) |
| 35 to 64 Years | 0 (0.0%) | 0 (0.0%) |
| 65 to 74 Years | 0 (0.0%) | 0 (0.0%) |
| 75 Years and over | 0 (0.0%) | 0 (0.0%) |
Disability Class: Vision Difficulty
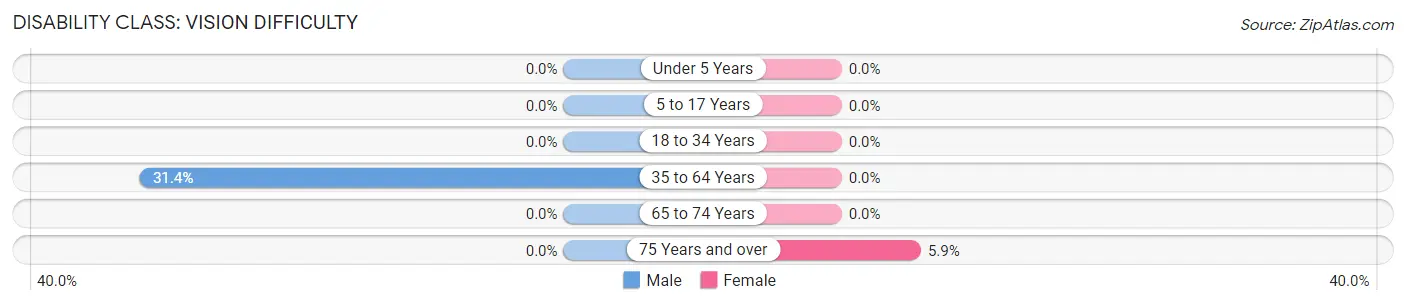
| Age Bracket | Male | Female |
| Under 5 Years | 0 (0.0%) | 0 (0.0%) |
| 5 to 17 Years | 0 (0.0%) | 0 (0.0%) |
| 18 to 34 Years | 0 (0.0%) | 0 (0.0%) |
| 35 to 64 Years | 22 (31.4%) | 0 (0.0%) |
| 65 to 74 Years | 0 (0.0%) | 0 (0.0%) |
| 75 Years and over | 0 (0.0%) | 1 (5.9%) |
Disability Class: Cognitive Difficulty
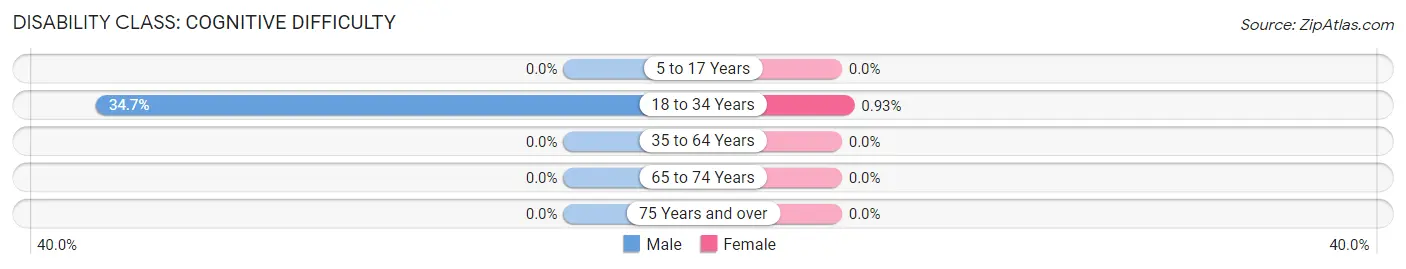
| Age Bracket | Male | Female |
| 5 to 17 Years | 0 (0.0%) | 0 (0.0%) |
| 18 to 34 Years | 34 (34.7%) | 1 (0.9%) |
| 35 to 64 Years | 0 (0.0%) | 0 (0.0%) |
| 65 to 74 Years | 0 (0.0%) | 0 (0.0%) |
| 75 Years and over | 0 (0.0%) | 0 (0.0%) |
Disability Class: Ambulatory Difficulty
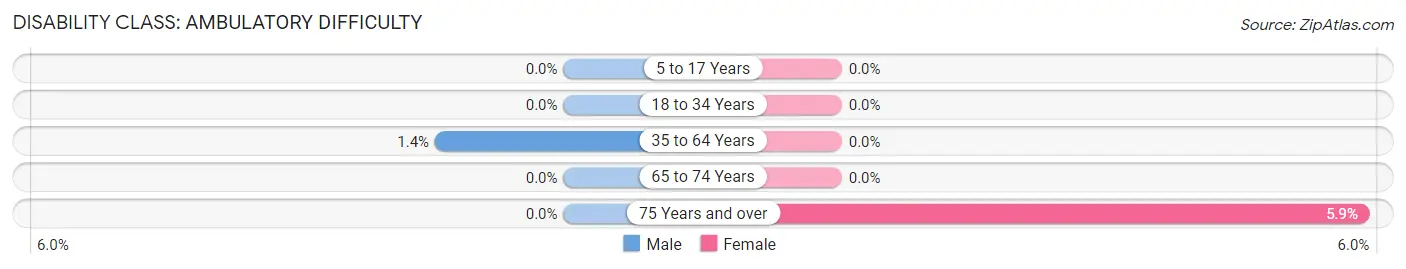
| Age Bracket | Male | Female |
| 5 to 17 Years | 0 (0.0%) | 0 (0.0%) |
| 18 to 34 Years | 0 (0.0%) | 0 (0.0%) |
| 35 to 64 Years | 1 (1.4%) | 0 (0.0%) |
| 65 to 74 Years | 0 (0.0%) | 0 (0.0%) |
| 75 Years and over | 0 (0.0%) | 1 (5.9%) |
Disability Class: Self-Care Difficulty
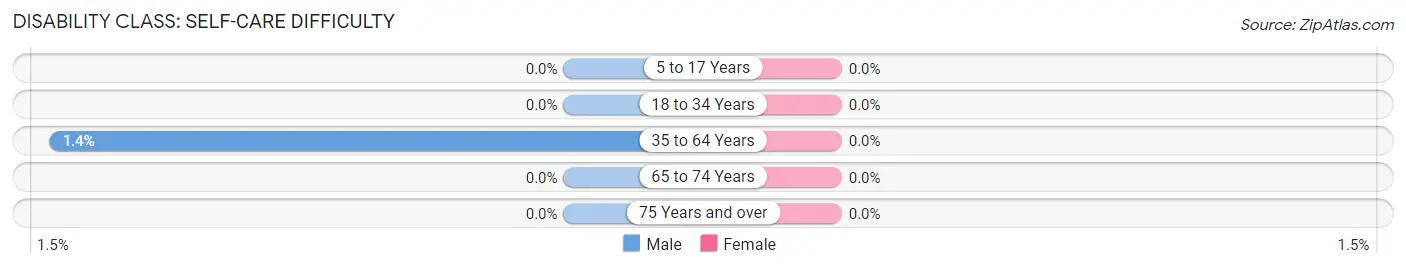
| Age Bracket | Male | Female |
| 5 to 17 Years | 0 (0.0%) | 0 (0.0%) |
| 18 to 34 Years | 0 (0.0%) | 0 (0.0%) |
| 35 to 64 Years | 1 (1.4%) | 0 (0.0%) |
| 65 to 74 Years | 0 (0.0%) | 0 (0.0%) |
| 75 Years and over | 0 (0.0%) | 0 (0.0%) |
Technology Access in Lucerne Mines
Computing Device Access in Lucerne Mines
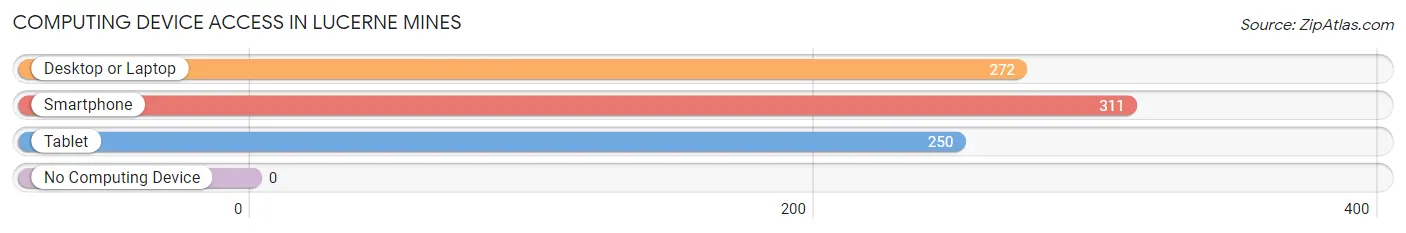
| Device Type | # Households | % Households |
| Desktop or Laptop | 272 | 74.5% |
| Smartphone | 311 | 85.2% |
| Tablet | 250 | 68.5% |
| No Computing Device | 0 | 0.0% |
| Total | 365 | 100.0% |
Internet Access in Lucerne Mines
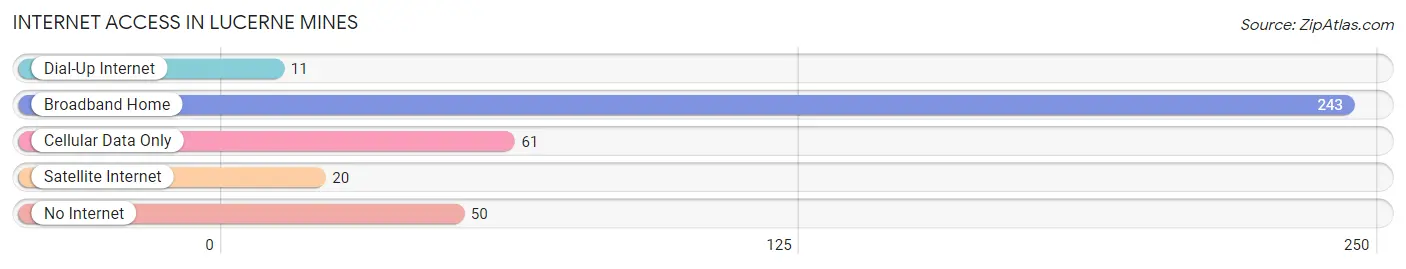
| Internet Type | # Households | % Households |
| Dial-Up Internet | 11 | 3.0% |
| Broadband Home | 243 | 66.6% |
| Cellular Data Only | 61 | 16.7% |
| Satellite Internet | 20 | 5.5% |
| No Internet | 50 | 13.7% |
| Total | 365 | 100.0% |
Lucerne Mines Summary
Lucerne Mines is a small unincorporated community located in Washington Township, Greene County, Pennsylvania. It is situated in the foothills of the Allegheny Mountains, approximately 10 miles south of Waynesburg. The population of Lucerne Mines was estimated to be around 200 people in 2000.
History
Lucerne Mines was founded in the late 19th century as a coal mining town. The town was named after the nearby Lucerne Mines, which were opened in 1883 by the Pennsylvania Coal and Iron Company. The mines were in operation until the early 20th century, when they were closed due to a lack of coal. The town was then largely abandoned, with only a few residents remaining.
Geography
Lucerne Mines is located in the foothills of the Allegheny Mountains, approximately 10 miles south of Waynesburg. The town is situated in a valley, surrounded by hills and mountains. The area is mostly rural, with a few small farms and wooded areas. The nearest major city is Pittsburgh, which is approximately 50 miles away.
Economy
The economy of Lucerne Mines is largely based on agriculture and forestry. The town is home to several small farms, which produce a variety of crops, including corn, soybeans, and hay. The town also has a few small businesses, including a general store and a gas station.
Demographics
The population of Lucerne Mines was estimated to be around 200 people in 2000. The town is predominantly white, with a small minority population. The median household income is approximately $30,000, and the median home value is around $90,000.
Conclusion
Lucerne Mines is a small unincorporated community located in Washington Township, Greene County, Pennsylvania. It was founded in the late 19th century as a coal mining town, but the mines were closed in the early 20th century. The economy of Lucerne Mines is largely based on agriculture and forestry, and the population was estimated to be around 200 people in 2000. The town is predominantly white, with a small minority population, and the median household income is approximately $30,000.
Common Questions
What is Per Capita Income in Lucerne Mines?
Per Capita income in Lucerne Mines is $31,911.
What is the Median Family Income in Lucerne Mines?
Median Family Income in Lucerne Mines is $70,156.
What is the Median Household income in Lucerne Mines?
Median Household Income in Lucerne Mines is $67,135.
What is Income or Wage Gap in Lucerne Mines?
Income or Wage Gap in Lucerne Mines is 35.3%.
Women in Lucerne Mines earn 64.7 cents for every dollar earned by a man.
What is Inequality or Gini Index in Lucerne Mines?
Inequality or Gini Index in Lucerne Mines is 0.30.
What is the Total Population of Lucerne Mines?
Total Population of Lucerne Mines is 881.
What is the Total Male Population of Lucerne Mines?
Total Male Population of Lucerne Mines is 485.
What is the Total Female Population of Lucerne Mines?
Total Female Population of Lucerne Mines is 396.
What is the Ratio of Males per 100 Females in Lucerne Mines?
There are 122.47 Males per 100 Females in Lucerne Mines.
What is the Ratio of Females per 100 Males in Lucerne Mines?
There are 81.65 Females per 100 Males in Lucerne Mines.
What is the Median Population Age in Lucerne Mines?
Median Population Age in Lucerne Mines is 39.3 Years.
What is the Average Family Size in Lucerne Mines
Average Family Size in Lucerne Mines is 2.7 People.
What is the Average Household Size in Lucerne Mines
Average Household Size in Lucerne Mines is 2.4 People.
How Large is the Labor Force in Lucerne Mines?
There are 411 People in the Labor Forcein in Lucerne Mines.
What is the Percentage of People in the Labor Force in Lucerne Mines?
58.7% of People are in the Labor Force in Lucerne Mines.