Big Beaver borough, PA Map & Demographics
Big Beaver borough Overview
$35,344
PER CAPITA INCOME
$82,031
AVG FAMILY INCOME
$66,125
AVG HOUSEHOLD INCOME
25.0%
WAGE / INCOME GAP [ % ]
75.0¢/ $1
WAGE / INCOME GAP [ $ ]
0.37
INEQUALITY / GINI INDEX
1,796
TOTAL POPULATION
880
MALE POPULATION
916
FEMALE POPULATION
96.07
MALES / 100 FEMALES
104.09
FEMALES / 100 MALES
55.3
MEDIAN AGE
2.9
AVG FAMILY SIZE
2.4
AVG HOUSEHOLD SIZE
882
LABOR FORCE [ PEOPLE ]
55.6%
PERCENT IN LABOR FORCE
10.0%
UNEMPLOYMENT RATE
Income in Big Beaver borough
Income Overview in Big Beaver borough
Per Capita Income in Big Beaver borough is $35,344, while median incomes of families and households are $82,031 and $66,125 respectively.
| Characteristic | Number | Measure |
| Per Capita Income | 1,796 | $35,344 |
| Median Family Income | 505 | $82,031 |
| Mean Family Income | 505 | $89,479 |
| Median Household Income | 727 | $66,125 |
| Mean Household Income | 727 | $83,300 |
| Income Deficit | 505 | $0 |
| Wage / Income Gap (%) | 1,796 | 25.02% |
| Wage / Income Gap ($) | 1,796 | 74.98¢ per $1 |
| Gini / Inequality Index | 1,796 | 0.37 |
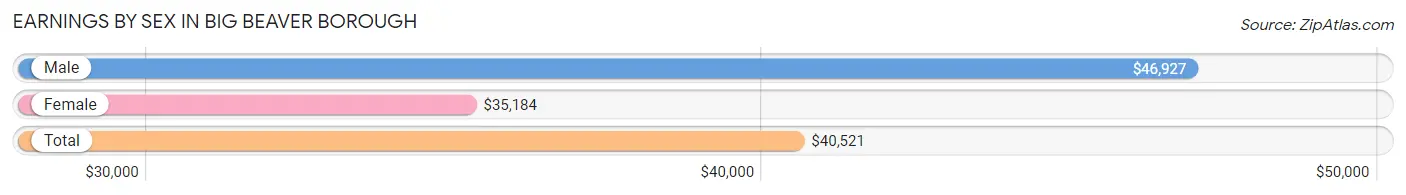
Earnings by Sex in Big Beaver borough
Average Earnings in Big Beaver borough are $40,521, $46,927 for men and $35,184 for women, a difference of 25.0%.
| Sex | Number | Average Earnings |
| Male | 557 (61.2%) | $46,927 |
| Female | 353 (38.8%) | $35,184 |
| Total | 910 (100.0%) | $40,521 |
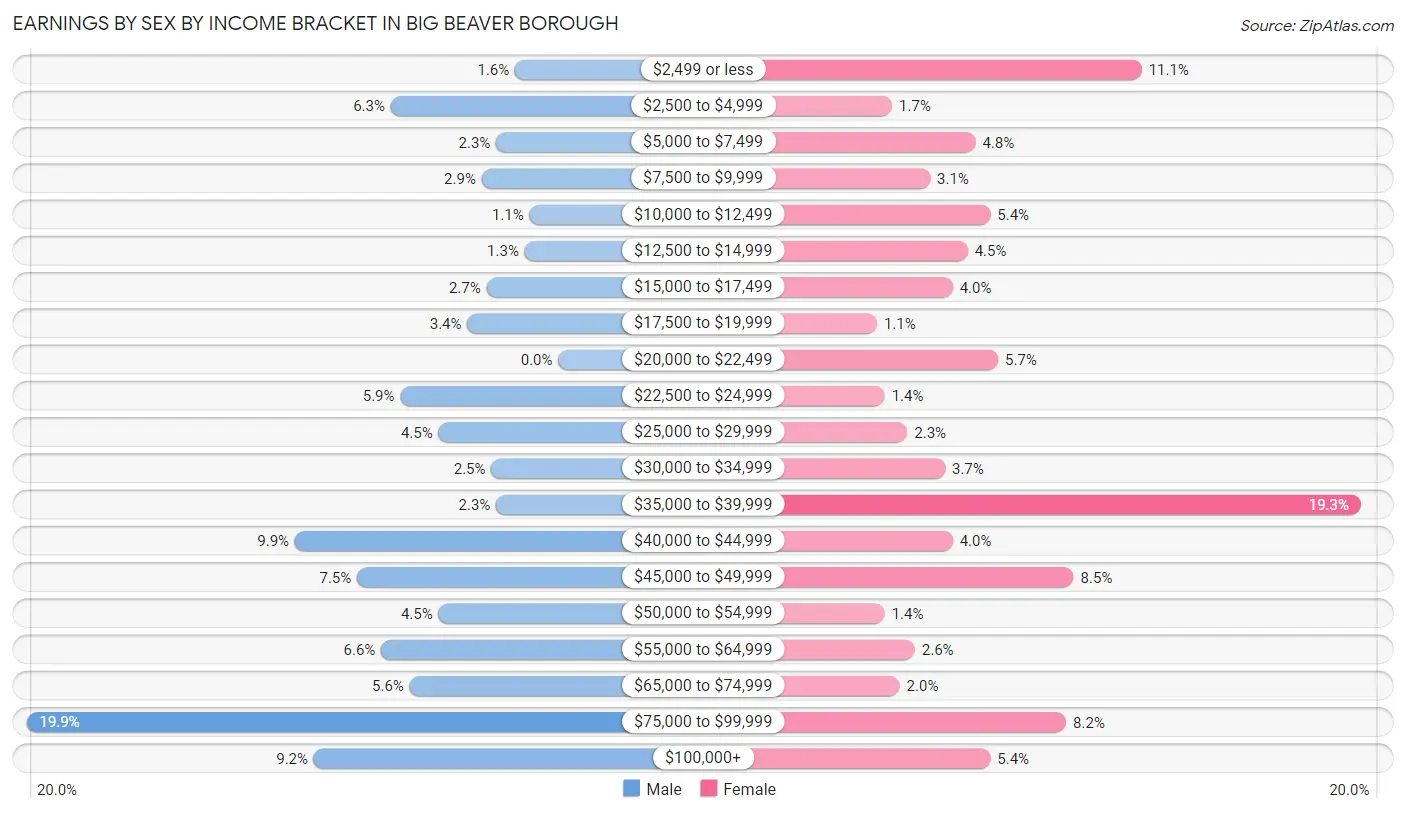
Earnings by Sex by Income Bracket in Big Beaver borough
The most common earnings brackets in Big Beaver borough are $75,000 to $99,999 for men (111 | 19.9%) and $35,000 to $39,999 for women (68 | 19.3%).
| Income | Male | Female |
| $2,499 or less | 9 (1.6%) | 39 (11.1%) |
| $2,500 to $4,999 | 35 (6.3%) | 6 (1.7%) |
| $5,000 to $7,499 | 13 (2.3%) | 17 (4.8%) |
| $7,500 to $9,999 | 16 (2.9%) | 11 (3.1%) |
| $10,000 to $12,499 | 6 (1.1%) | 19 (5.4%) |
| $12,500 to $14,999 | 7 (1.3%) | 16 (4.5%) |
| $15,000 to $17,499 | 15 (2.7%) | 14 (4.0%) |
| $17,500 to $19,999 | 19 (3.4%) | 4 (1.1%) |
| $20,000 to $22,499 | 0 (0.0%) | 20 (5.7%) |
| $22,500 to $24,999 | 33 (5.9%) | 5 (1.4%) |
| $25,000 to $29,999 | 25 (4.5%) | 8 (2.3%) |
| $30,000 to $34,999 | 14 (2.5%) | 13 (3.7%) |
| $35,000 to $39,999 | 13 (2.3%) | 68 (19.3%) |
| $40,000 to $44,999 | 55 (9.9%) | 14 (4.0%) |
| $45,000 to $49,999 | 42 (7.5%) | 30 (8.5%) |
| $50,000 to $54,999 | 25 (4.5%) | 5 (1.4%) |
| $55,000 to $64,999 | 37 (6.6%) | 9 (2.5%) |
| $65,000 to $74,999 | 31 (5.6%) | 7 (2.0%) |
| $75,000 to $99,999 | 111 (19.9%) | 29 (8.2%) |
| $100,000+ | 51 (9.2%) | 19 (5.4%) |
| Total | 557 (100.0%) | 353 (100.0%) |
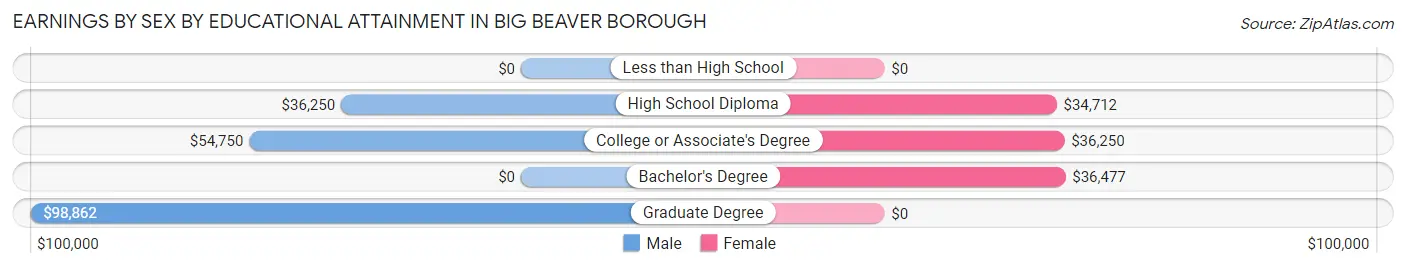
Earnings by Sex by Educational Attainment in Big Beaver borough
Average earnings in Big Beaver borough are $50,417 for men and $35,758 for women, a difference of 29.1%. Men with an educational attainment of graduate degree enjoy the highest average annual earnings of $98,862, while those with high school diploma education earn the least with $36,250. Women with an educational attainment of bachelor's degree earn the most with the average annual earnings of $36,477, while those with high school diploma education have the smallest earnings of $34,712.
| Educational Attainment | Male Income | Female Income |
| Less than High School | - | - |
| High School Diploma | $36,250 | $34,712 |
| College or Associate's Degree | $54,750 | $36,250 |
| Bachelor's Degree | - | - |
| Graduate Degree | $98,862 | $0 |
| Total | $50,417 | $35,758 |
Family Income in Big Beaver borough
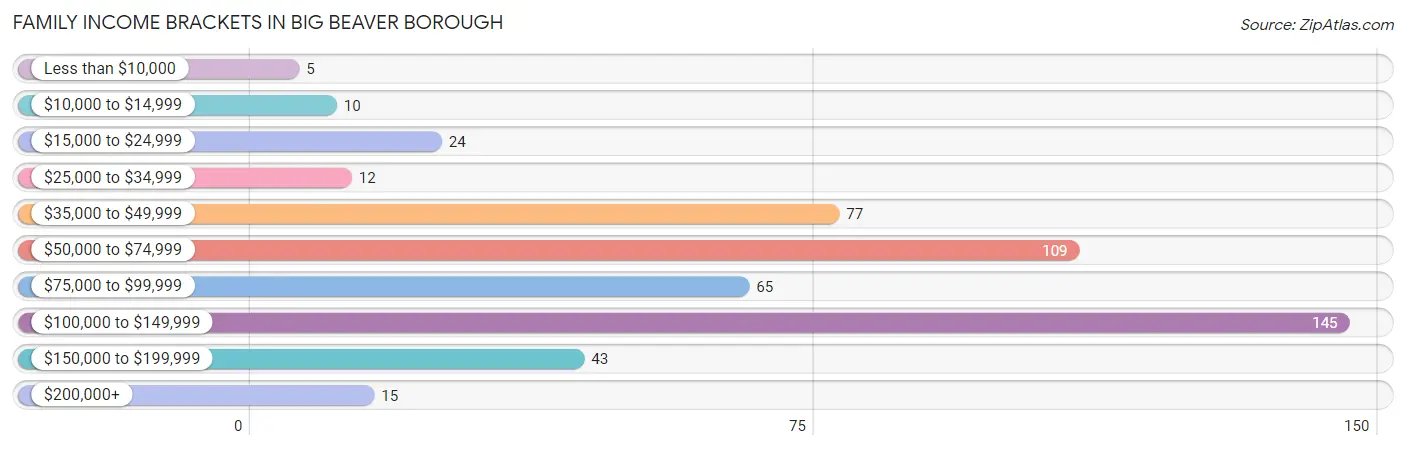
Family Income Brackets in Big Beaver borough
According to the Big Beaver borough family income data, there are 145 families falling into the $100,000 to $149,999 income range, which is the most common income bracket and makes up 28.7% of all families. Conversely, the less than $10,000 income bracket is the least frequent group with only 5 families (1.0%) belonging to this category.
| Income Bracket | # Families | % Families |
| Less than $10,000 | 5 | 1.0% |
| $10,000 to $14,999 | 10 | 2.0% |
| $15,000 to $24,999 | 24 | 4.8% |
| $25,000 to $34,999 | 12 | 2.4% |
| $35,000 to $49,999 | 77 | 15.2% |
| $50,000 to $74,999 | 109 | 21.6% |
| $75,000 to $99,999 | 65 | 12.9% |
| $100,000 to $149,999 | 145 | 28.7% |
| $150,000 to $199,999 | 43 | 8.5% |
| $200,000+ | 15 | 3.0% |
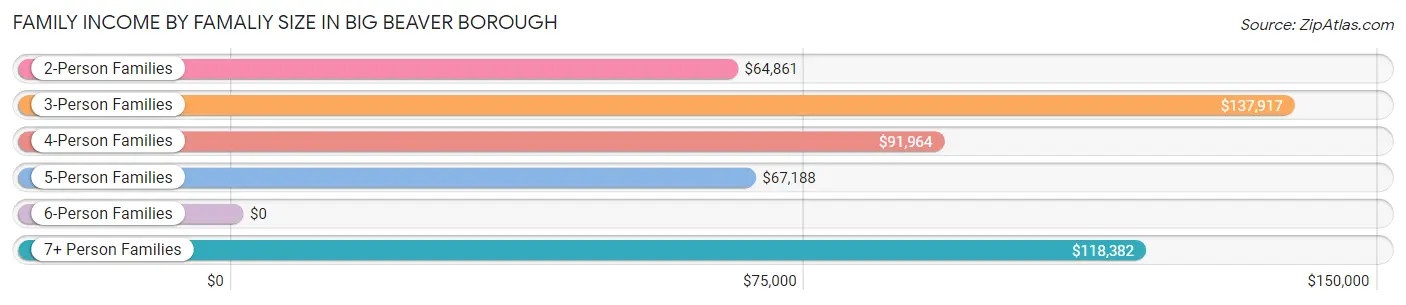
Family Income by Famaliy Size in Big Beaver borough
3-person families (68 | 13.5%) account for the highest median family income in Big Beaver borough with $137,917 per family, while 3-person families (68 | 13.5%) have the highest median income of $45,972 per family member.
| Income Bracket | # Families | Median Income |
| 2-Person Families | 319 (63.2%) | $64,861 |
| 3-Person Families | 68 (13.5%) | $137,917 |
| 4-Person Families | 39 (7.7%) | $91,964 |
| 5-Person Families | 35 (6.9%) | $67,188 |
| 6-Person Families | 0 (0.0%) | $0 |
| 7+ Person Families | 44 (8.7%) | $118,382 |
| Total | 505 (100.0%) | $82,031 |
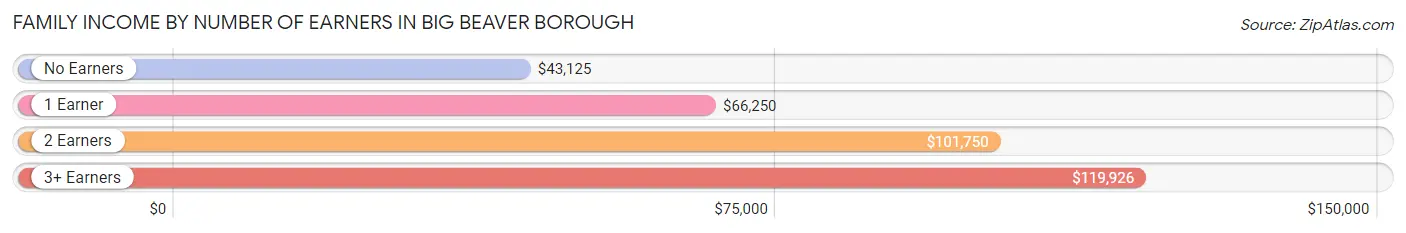
Family Income by Number of Earners in Big Beaver borough
The median family income in Big Beaver borough is $82,031, with families comprising 3+ earners (80) having the highest median family income of $119,926, while families with no earners (115) have the lowest median family income of $43,125, accounting for 15.8% and 22.8% of families, respectively.
| Number of Earners | # Families | Median Income |
| No Earners | 115 (22.8%) | $43,125 |
| 1 Earner | 165 (32.7%) | $66,250 |
| 2 Earners | 145 (28.7%) | $101,750 |
| 3+ Earners | 80 (15.8%) | $119,926 |
| Total | 505 (100.0%) | $82,031 |
Household Income in Big Beaver borough
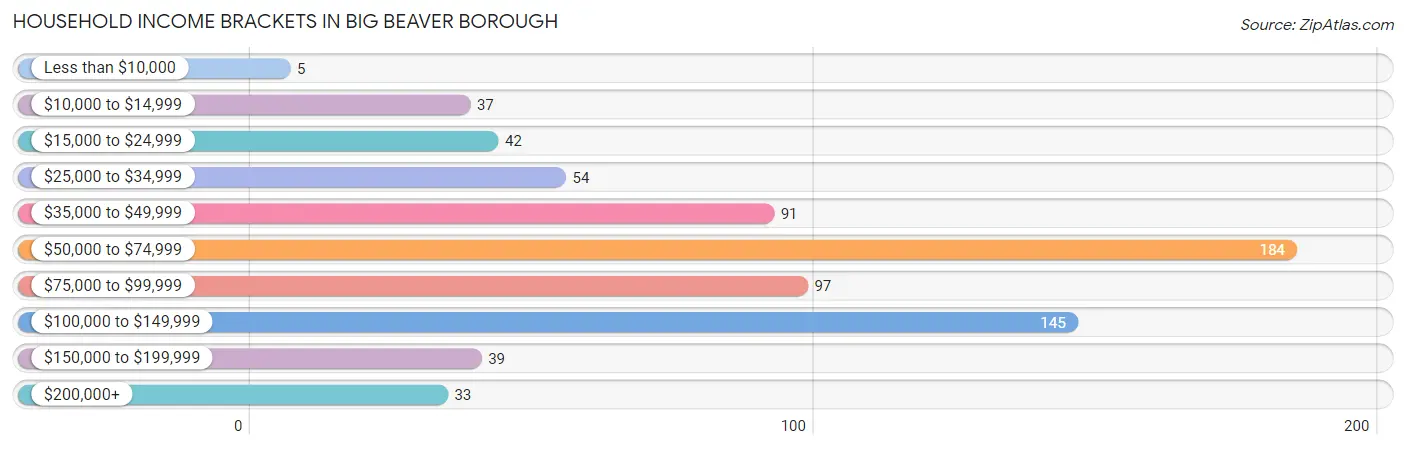
Household Income Brackets in Big Beaver borough
With 184 households falling in the category, the $50,000 to $74,999 income range is the most frequent in Big Beaver borough, accounting for 25.3% of all households. In contrast, only 5 households (0.7%) fall into the less than $10,000 income bracket, making it the least populous group.
| Income Bracket | # Households | % Households |
| Less than $10,000 | 5 | 0.7% |
| $10,000 to $14,999 | 37 | 5.1% |
| $15,000 to $24,999 | 42 | 5.8% |
| $25,000 to $34,999 | 54 | 7.4% |
| $35,000 to $49,999 | 91 | 12.5% |
| $50,000 to $74,999 | 184 | 25.3% |
| $75,000 to $99,999 | 97 | 13.3% |
| $100,000 to $149,999 | 145 | 19.9% |
| $150,000 to $199,999 | 39 | 5.4% |
| $200,000+ | 33 | 4.5% |
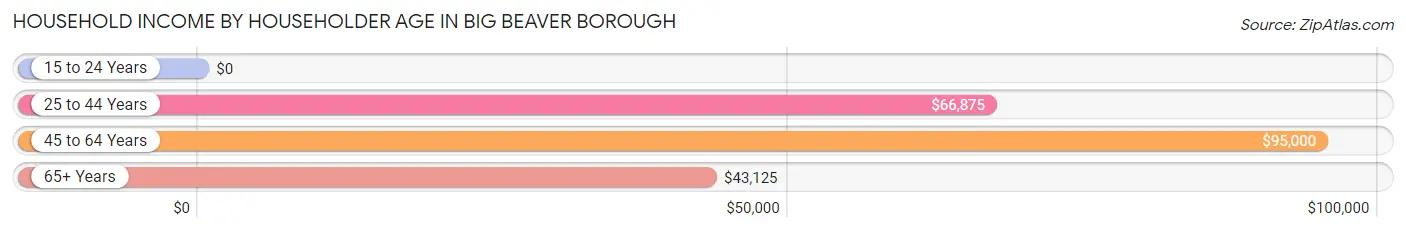
Household Income by Householder Age in Big Beaver borough
The median household income in Big Beaver borough is $66,125, with the highest median household income of $95,000 found in the 45 to 64 years age bracket for the primary householder. A total of 320 households (44.0%) fall into this category.
| Income Bracket | # Households | Median Income |
| 15 to 24 Years | 0 (0.0%) | $0 |
| 25 to 44 Years | 130 (17.9%) | $66,875 |
| 45 to 64 Years | 320 (44.0%) | $95,000 |
| 65+ Years | 277 (38.1%) | $43,125 |
| Total | 727 (100.0%) | $66,125 |
Poverty in Big Beaver borough
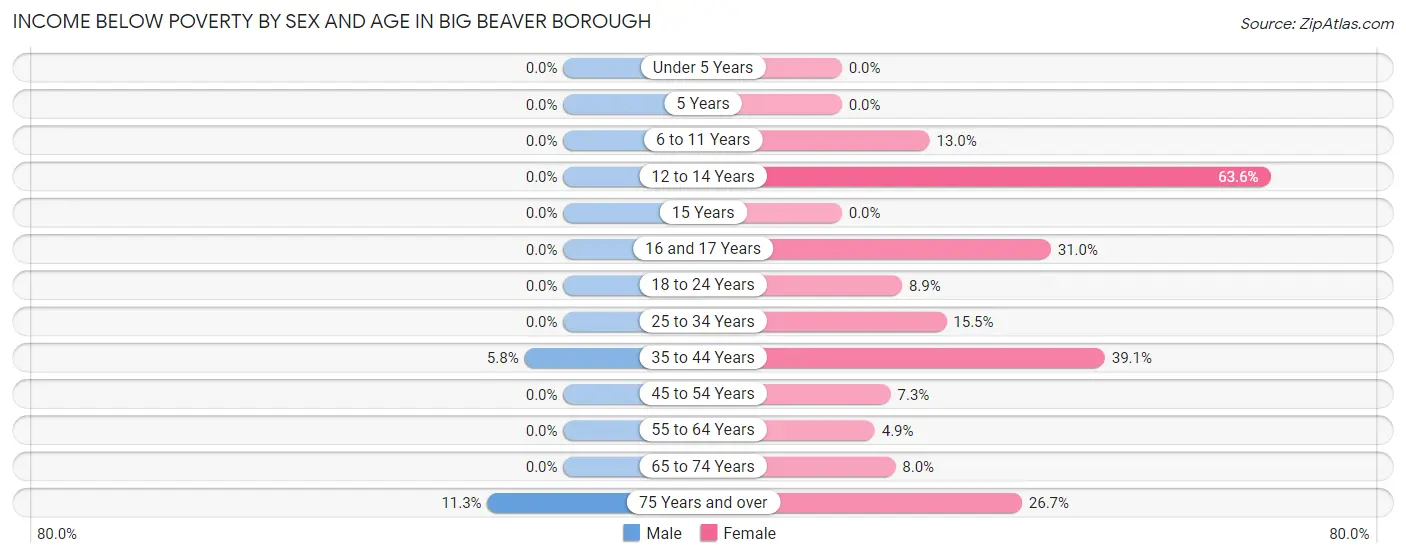
Income Below Poverty by Sex and Age in Big Beaver borough
With 1.6% poverty level for males and 13.1% for females among the residents of Big Beaver borough, 75 year old and over males and 12 to 14 year old females are the most vulnerable to poverty, with 8 males (11.3%) and 7 females (63.6%) in their respective age groups living below the poverty level.
| Age Bracket | Male | Female |
| Under 5 Years | 0 (0.0%) | 0 (0.0%) |
| 5 Years | 0 (0.0%) | 0 (0.0%) |
| 6 to 11 Years | 0 (0.0%) | 6 (13.0%) |
| 12 to 14 Years | 0 (0.0%) | 7 (63.6%) |
| 15 Years | 0 (0.0%) | 0 (0.0%) |
| 16 and 17 Years | 0 (0.0%) | 9 (31.0%) |
| 18 to 24 Years | 0 (0.0%) | 5 (8.9%) |
| 25 to 34 Years | 0 (0.0%) | 16 (15.5%) |
| 35 to 44 Years | 6 (5.8%) | 25 (39.1%) |
| 45 to 54 Years | 0 (0.0%) | 5 (7.2%) |
| 55 to 64 Years | 0 (0.0%) | 10 (4.9%) |
| 65 to 74 Years | 0 (0.0%) | 14 (8.0%) |
| 75 Years and over | 8 (11.3%) | 23 (26.7%) |
| Total | 14 (1.6%) | 120 (13.1%) |
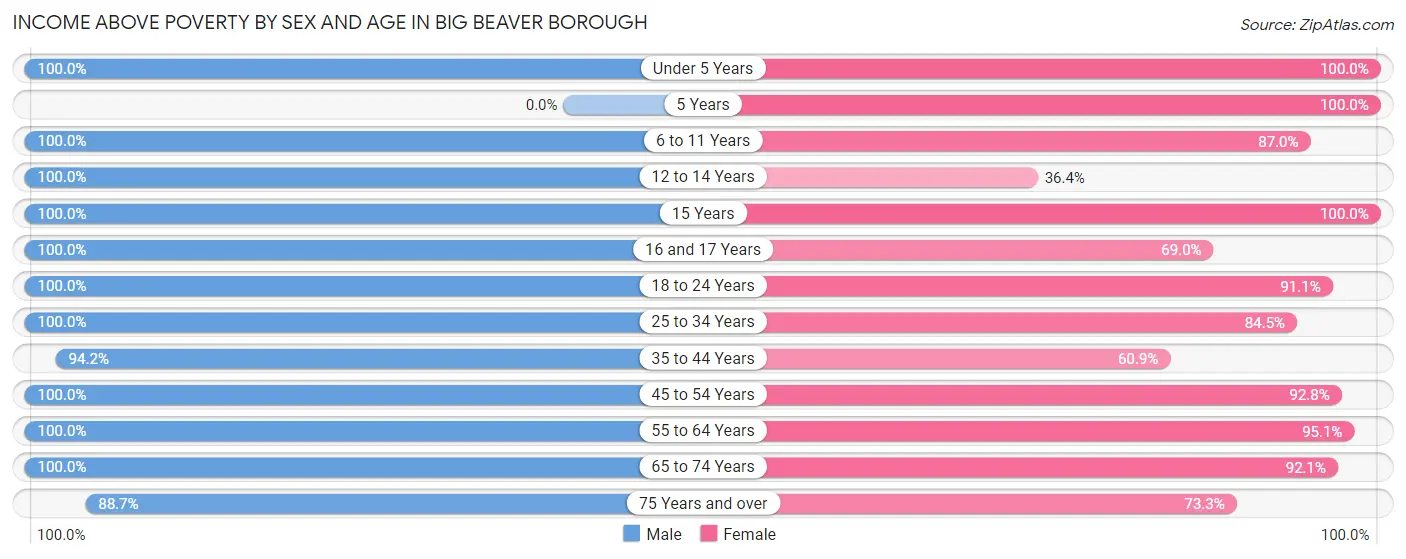
Income Above Poverty by Sex and Age in Big Beaver borough
According to the poverty statistics in Big Beaver borough, males aged under 5 years and females aged under 5 years are the age groups that are most secure financially, with 100.0% of males and 100.0% of females in these age groups living above the poverty line.
| Age Bracket | Male | Female |
| Under 5 Years | 11 (100.0%) | 37 (100.0%) |
| 5 Years | 0 (0.0%) | 12 (100.0%) |
| 6 to 11 Years | 49 (100.0%) | 40 (87.0%) |
| 12 to 14 Years | 15 (100.0%) | 4 (36.4%) |
| 15 Years | 6 (100.0%) | 23 (100.0%) |
| 16 and 17 Years | 8 (100.0%) | 20 (69.0%) |
| 18 to 24 Years | 52 (100.0%) | 51 (91.1%) |
| 25 to 34 Years | 96 (100.0%) | 87 (84.5%) |
| 35 to 44 Years | 98 (94.2%) | 39 (60.9%) |
| 45 to 54 Years | 95 (100.0%) | 64 (92.7%) |
| 55 to 64 Years | 242 (100.0%) | 194 (95.1%) |
| 65 to 74 Years | 131 (100.0%) | 162 (92.0%) |
| 75 Years and over | 63 (88.7%) | 63 (73.3%) |
| Total | 866 (98.4%) | 796 (86.9%) |
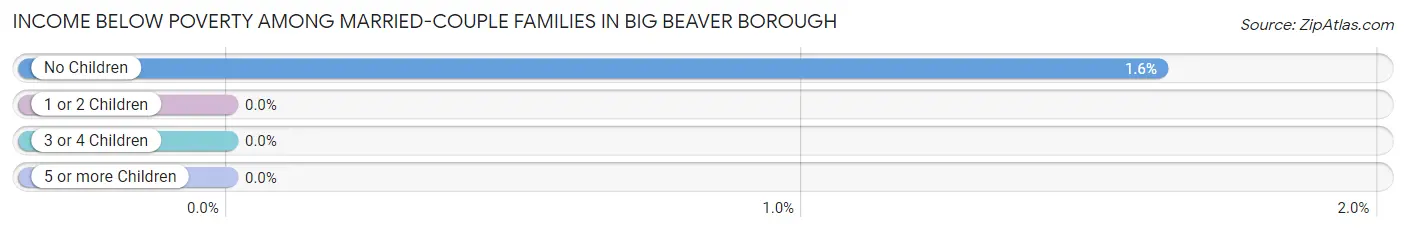
Income Below Poverty Among Married-Couple Families in Big Beaver borough
The poverty statistics for married-couple families in Big Beaver borough show that 1.2% or 5 of the total 430 families live below the poverty line. Families with no children have the highest poverty rate of 1.6%, comprising of 5 families. On the other hand, families with 1 or 2 children have the lowest poverty rate of 0.0%, which includes 0 families.
| Children | Above Poverty | Below Poverty |
| No Children | 304 (98.4%) | 5 (1.6%) |
| 1 or 2 Children | 111 (100.0%) | 0 (0.0%) |
| 3 or 4 Children | 6 (100.0%) | 0 (0.0%) |
| 5 or more Children | 4 (100.0%) | 0 (0.0%) |
| Total | 425 (98.8%) | 5 (1.2%) |
Income Below Poverty Among Single-Parent Households in Big Beaver borough
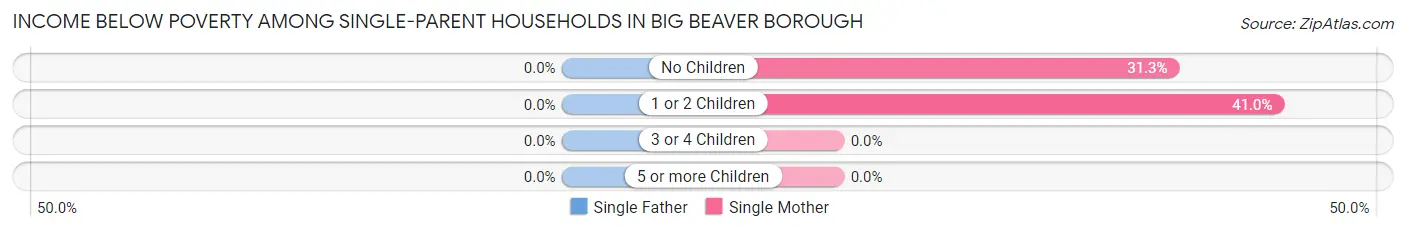
| Children | Single Father | Single Mother |
| No Children | 0 (0.0%) | 5 (31.2%) |
| 1 or 2 Children | 0 (0.0%) | 16 (41.0%) |
| 3 or 4 Children | 0 (0.0%) | 0 (0.0%) |
| 5 or more Children | 0 (0.0%) | 0 (0.0%) |
| Total | 0 (0.0%) | 21 (38.2%) |
Income Below Poverty Among Married-Couple vs Single-Parent Households in Big Beaver borough
The poverty data for Big Beaver borough shows that 5 of the married-couple family households (1.2%) and 21 of the single-parent households (28.0%) are living below the poverty level. Within the married-couple family households, those with no children have the highest poverty rate, with 5 households (1.6%) falling below the poverty line. Among the single-parent households, those with 1 or 2 children have the highest poverty rate, with 16 household (34.8%) living below poverty.
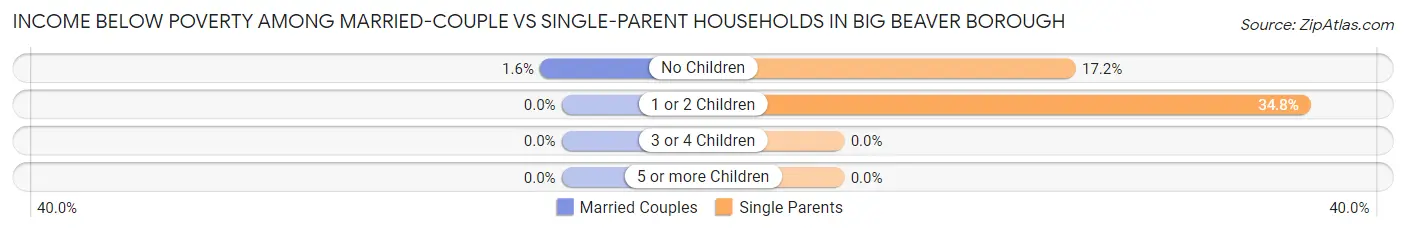
| Children | Married-Couple Families | Single-Parent Households |
| No Children | 5 (1.6%) | 5 (17.2%) |
| 1 or 2 Children | 0 (0.0%) | 16 (34.8%) |
| 3 or 4 Children | 0 (0.0%) | 0 (0.0%) |
| 5 or more Children | 0 (0.0%) | 0 (0.0%) |
| Total | 5 (1.2%) | 21 (28.0%) |
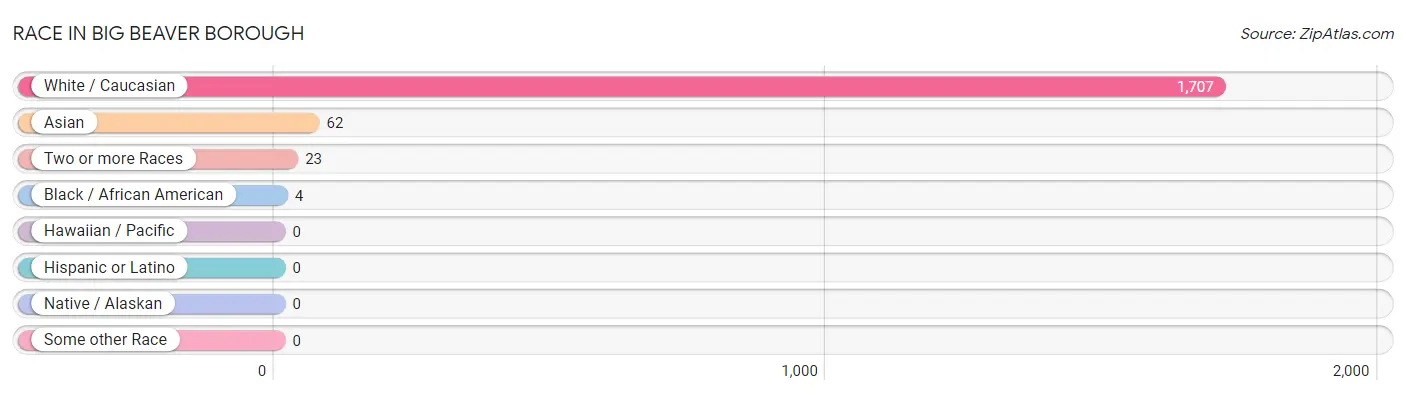
Race in Big Beaver borough
The most populous races in Big Beaver borough are White / Caucasian (1,707 | 95.0%), Asian (62 | 3.5%), and Two or more Races (23 | 1.3%).
| Race | # Population | % Population |
| Asian | 62 | 3.5% |
| Black / African American | 4 | 0.2% |
| Hawaiian / Pacific | 0 | 0.0% |
| Hispanic or Latino | 0 | 0.0% |
| Native / Alaskan | 0 | 0.0% |
| White / Caucasian | 1,707 | 95.0% |
| Two or more Races | 23 | 1.3% |
| Some other Race | 0 | 0.0% |
| Total | 1,796 | 100.0% |
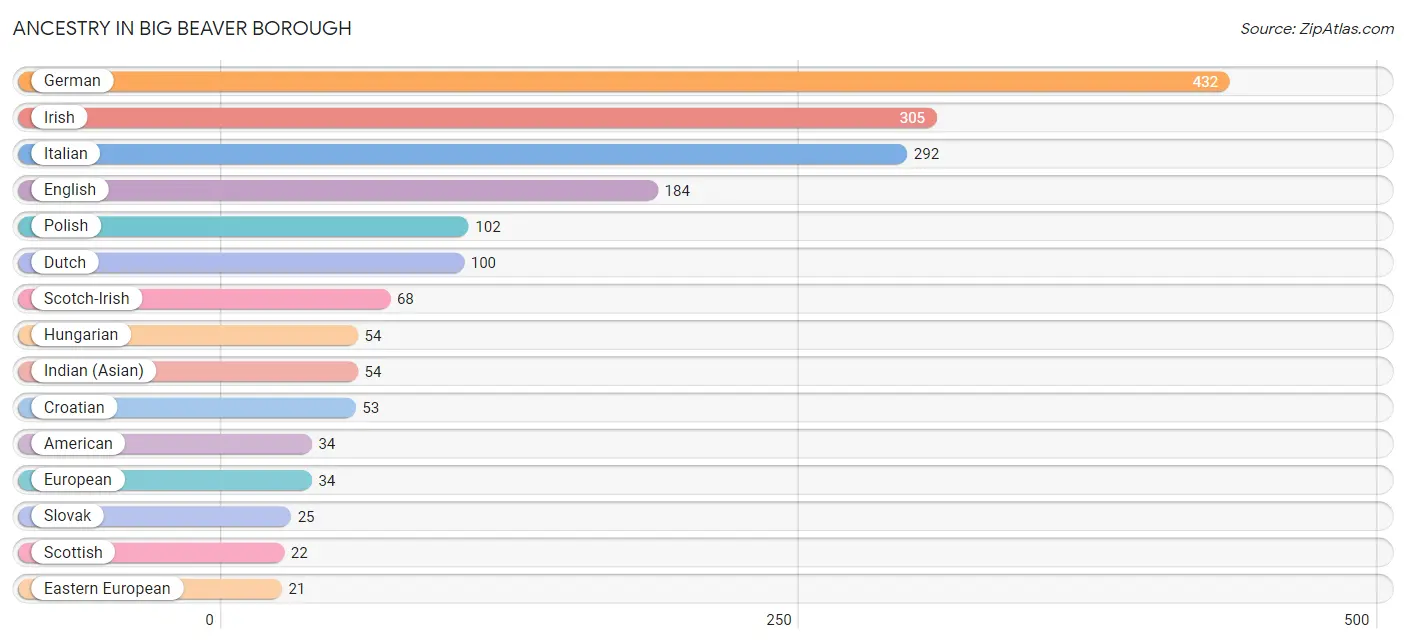
Ancestry in Big Beaver borough
The most populous ancestries reported in Big Beaver borough are German (432 | 24.0%), Irish (305 | 17.0%), Italian (292 | 16.3%), English (184 | 10.2%), and Polish (102 | 5.7%), together accounting for 73.2% of all Big Beaver borough residents.
| Ancestry | # Population | % Population |
| American | 34 | 1.9% |
| Austrian | 8 | 0.4% |
| Blackfeet | 6 | 0.3% |
| Canadian | 5 | 0.3% |
| Croatian | 53 | 2.9% |
| Czech | 4 | 0.2% |
| Dutch | 100 | 5.6% |
| Eastern European | 21 | 1.2% |
| English | 184 | 10.2% |
| European | 34 | 1.9% |
| French | 20 | 1.1% |
| French Canadian | 3 | 0.2% |
| German | 432 | 24.0% |
| Greek | 5 | 0.3% |
| Hungarian | 54 | 3.0% |
| Indian (Asian) | 54 | 3.0% |
| Irish | 305 | 17.0% |
| Italian | 292 | 16.3% |
| Norwegian | 5 | 0.3% |
| Pennsylvania German | 5 | 0.3% |
| Polish | 102 | 5.7% |
| Russian | 4 | 0.2% |
| Samoan | 5 | 0.3% |
| Scotch-Irish | 68 | 3.8% |
| Scottish | 22 | 1.2% |
| Slovak | 25 | 1.4% |
| Swedish | 14 | 0.8% |
| Swiss | 10 | 0.6% |
| Thai | 8 | 0.4% |
| Ukrainian | 4 | 0.2% |
| Welsh | 14 | 0.8% |
| Yugoslavian | 10 | 0.6% | View All 32 Rows |
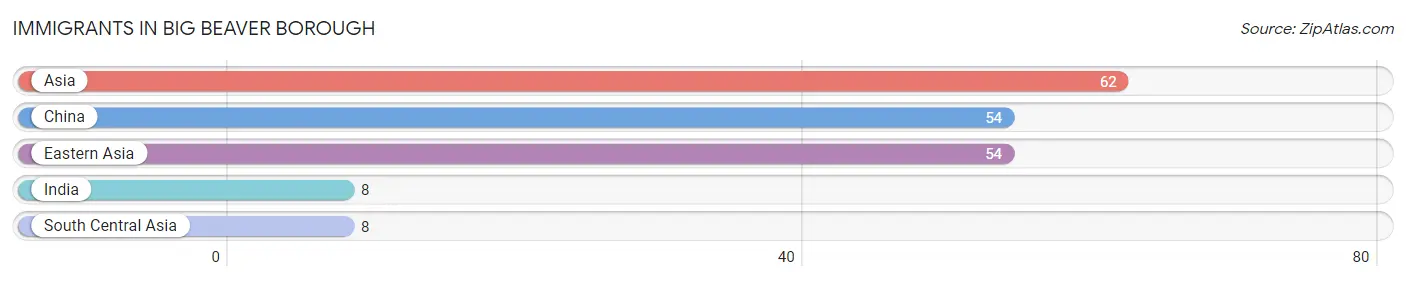
Immigrants in Big Beaver borough
The most numerous immigrant groups reported in Big Beaver borough came from Asia (62 | 3.5%), China (54 | 3.0%), Eastern Asia (54 | 3.0%), India (8 | 0.4%), and South Central Asia (8 | 0.4%), together accounting for 10.4% of all Big Beaver borough residents.
| Immigration Origin | # Population | % Population |
| Asia | 62 | 3.5% |
| China | 54 | 3.0% |
| Eastern Asia | 54 | 3.0% |
| India | 8 | 0.4% |
| South Central Asia | 8 | 0.4% | View All 5 Rows |
Sex and Age in Big Beaver borough
Sex and Age in Big Beaver borough
The most populous age groups in Big Beaver borough are 60 to 64 Years (139 | 15.8%) for men and 60 to 64 Years (130 | 14.2%) for women.
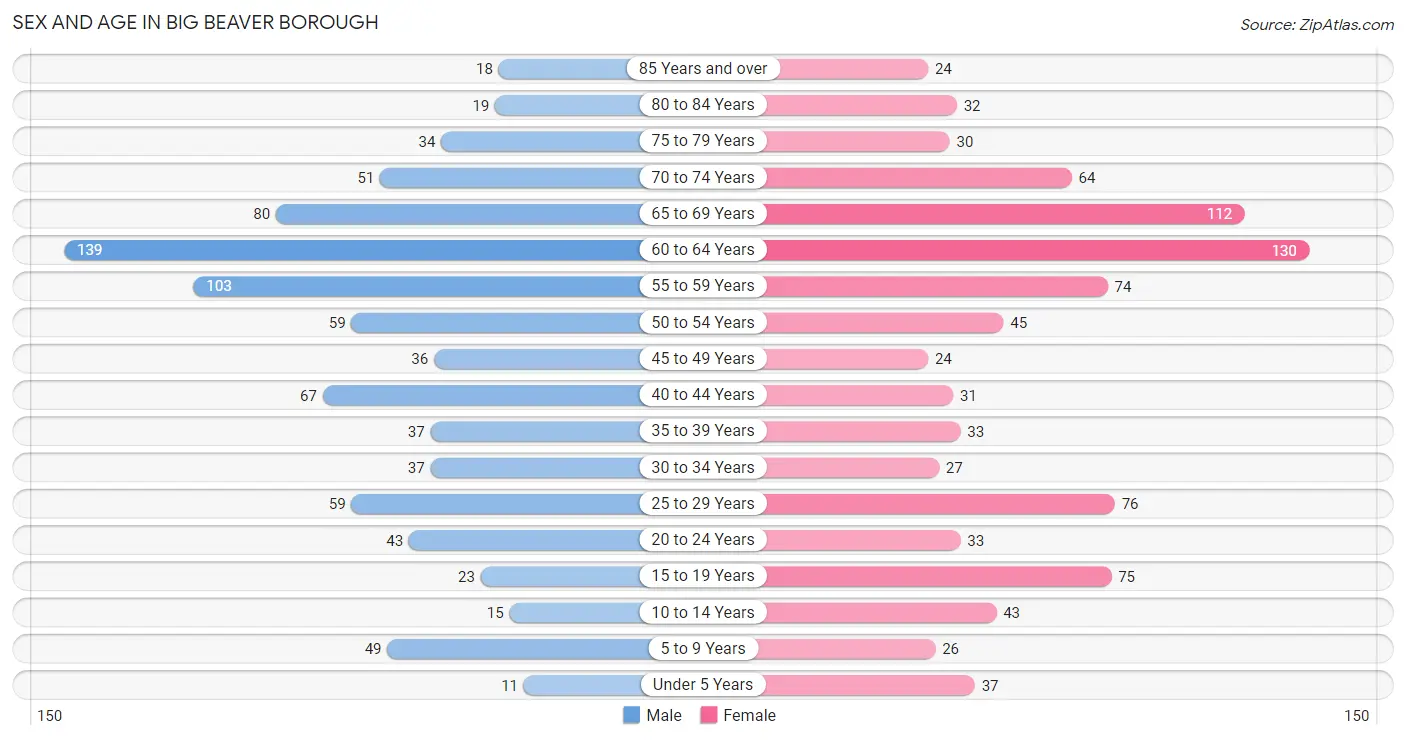
| Age Bracket | Male | Female |
| Under 5 Years | 11 (1.3%) | 37 (4.0%) |
| 5 to 9 Years | 49 (5.6%) | 26 (2.8%) |
| 10 to 14 Years | 15 (1.7%) | 43 (4.7%) |
| 15 to 19 Years | 23 (2.6%) | 75 (8.2%) |
| 20 to 24 Years | 43 (4.9%) | 33 (3.6%) |
| 25 to 29 Years | 59 (6.7%) | 76 (8.3%) |
| 30 to 34 Years | 37 (4.2%) | 27 (2.9%) |
| 35 to 39 Years | 37 (4.2%) | 33 (3.6%) |
| 40 to 44 Years | 67 (7.6%) | 31 (3.4%) |
| 45 to 49 Years | 36 (4.1%) | 24 (2.6%) |
| 50 to 54 Years | 59 (6.7%) | 45 (4.9%) |
| 55 to 59 Years | 103 (11.7%) | 74 (8.1%) |
| 60 to 64 Years | 139 (15.8%) | 130 (14.2%) |
| 65 to 69 Years | 80 (9.1%) | 112 (12.2%) |
| 70 to 74 Years | 51 (5.8%) | 64 (7.0%) |
| 75 to 79 Years | 34 (3.9%) | 30 (3.3%) |
| 80 to 84 Years | 19 (2.2%) | 32 (3.5%) |
| 85 Years and over | 18 (2.1%) | 24 (2.6%) |
| Total | 880 (100.0%) | 916 (100.0%) |
Families and Households in Big Beaver borough
Median Family Size in Big Beaver borough
The median family size in Big Beaver borough is 2.90 persons per family, with single female/mother families (55 | 10.9%) accounting for the largest median family size of 3.04 persons per family. On the other hand, single male/father families (20 | 4.0%) represent the smallest median family size with 1.80 persons per family.
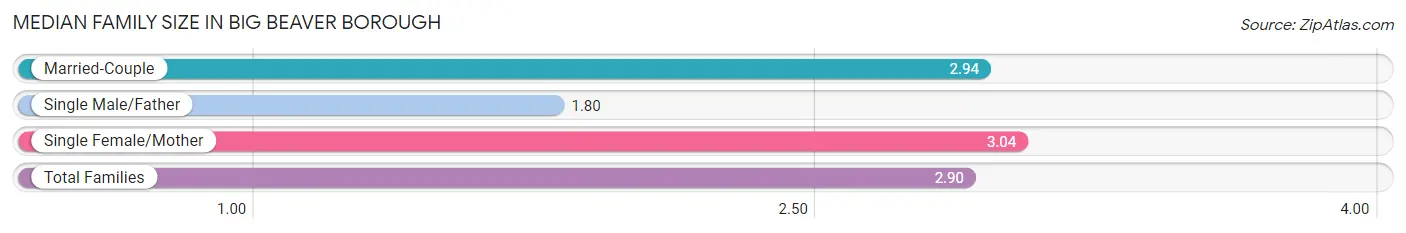
| Family Type | # Families | Family Size |
| Married-Couple | 430 (85.2%) | 2.94 |
| Single Male/Father | 20 (4.0%) | 1.80 |
| Single Female/Mother | 55 (10.9%) | 3.04 |
| Total Families | 505 (100.0%) | 2.90 |
Median Household Size in Big Beaver borough
The median household size in Big Beaver borough is 2.44 persons per household, with single female/mother households (55 | 7.6%) accounting for the largest median household size of 3.45 persons per household. non-family households (222 | 30.5%) represent the smallest median household size with 1.26 persons per household.
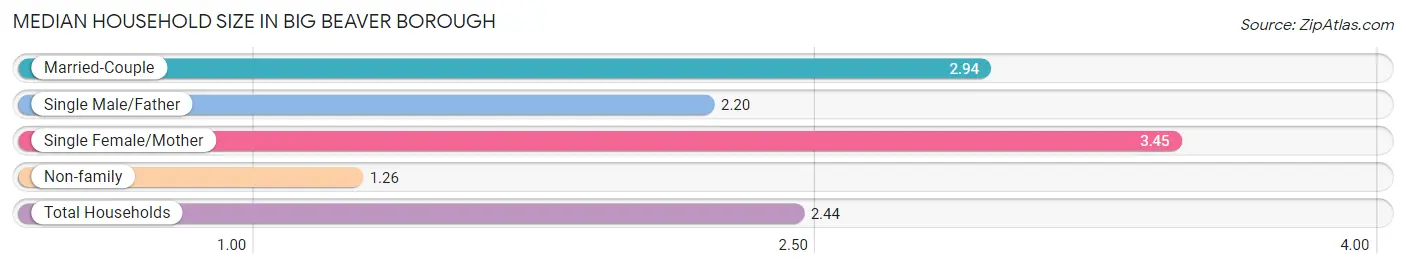
| Household Type | # Households | Household Size |
| Married-Couple | 430 (59.2%) | 2.94 |
| Single Male/Father | 20 (2.8%) | 2.20 |
| Single Female/Mother | 55 (7.6%) | 3.45 |
| Non-family | 222 (30.5%) | 1.26 |
| Total Households | 727 (100.0%) | 2.44 |
Household Size by Marriage Status in Big Beaver borough
Out of a total of 727 households in Big Beaver borough, 505 (69.5%) are family households, while 222 (30.5%) are nonfamily households. The most numerous type of family households are 2-person households, comprising 289, and the most common type of nonfamily households are 1-person households, comprising 145.
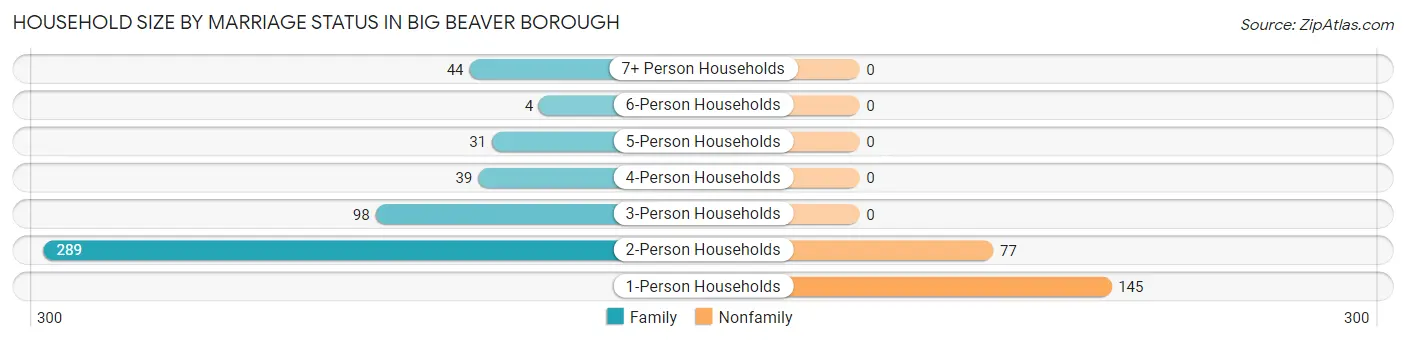
| Household Size | Family Households | Nonfamily Households |
| 1-Person Households | - | 145 (19.9%) |
| 2-Person Households | 289 (39.8%) | 77 (10.6%) |
| 3-Person Households | 98 (13.5%) | 0 (0.0%) |
| 4-Person Households | 39 (5.4%) | 0 (0.0%) |
| 5-Person Households | 31 (4.3%) | 0 (0.0%) |
| 6-Person Households | 4 (0.5%) | 0 (0.0%) |
| 7+ Person Households | 44 (6.0%) | 0 (0.0%) |
| Total | 505 (69.5%) | 222 (30.5%) |
Female Fertility in Big Beaver borough
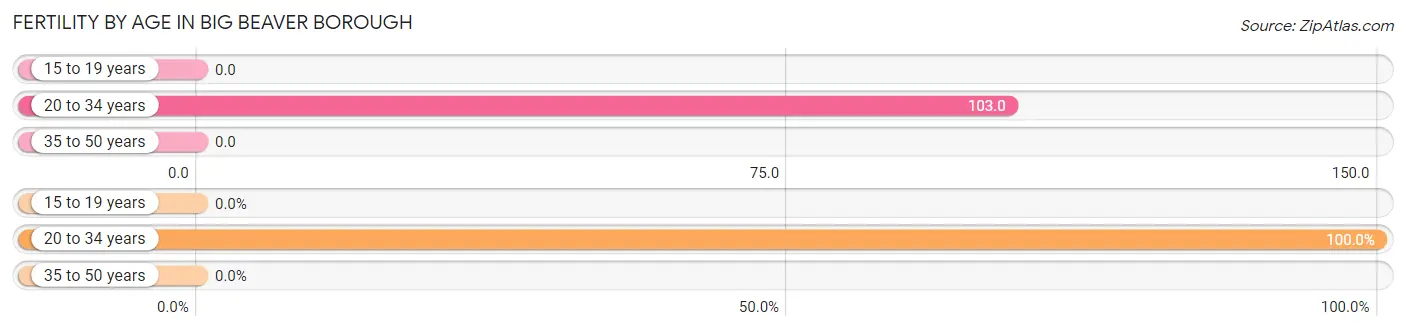
Fertility by Age in Big Beaver borough
Average fertility rate in Big Beaver borough is 45.0 births per 1,000 women. Women in the age bracket of 20 to 34 years have the highest fertility rate with 103.0 births per 1,000 women. Women in the age bracket of 20 to 34 years acount for 100.0% of all women with births.
| Age Bracket | Women with Births | Births / 1,000 Women |
| 15 to 19 years | 0 (0.0%) | 0.0 |
| 20 to 34 years | 14 (100.0%) | 103.0 |
| 35 to 50 years | 0 (0.0%) | 0.0 |
| Total | 14 (100.0%) | 45.0 |
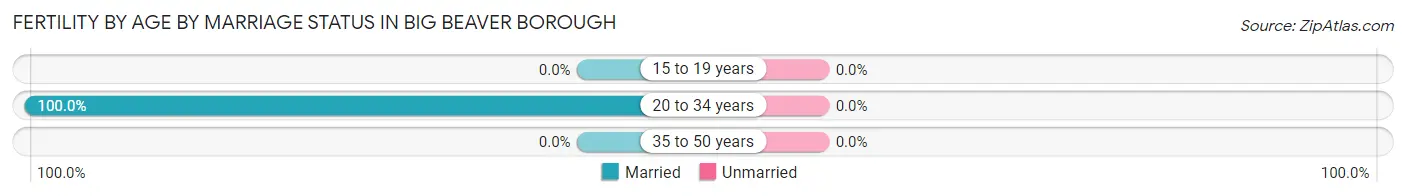
Fertility by Age by Marriage Status in Big Beaver borough
| Age Bracket | Married | Unmarried |
| 15 to 19 years | 0 (0.0%) | 0 (0.0%) |
| 20 to 34 years | 14 (100.0%) | 0 (0.0%) |
| 35 to 50 years | 0 (0.0%) | 0 (0.0%) |
| Total | 14 (100.0%) | 0 (0.0%) |
Fertility by Education in Big Beaver borough
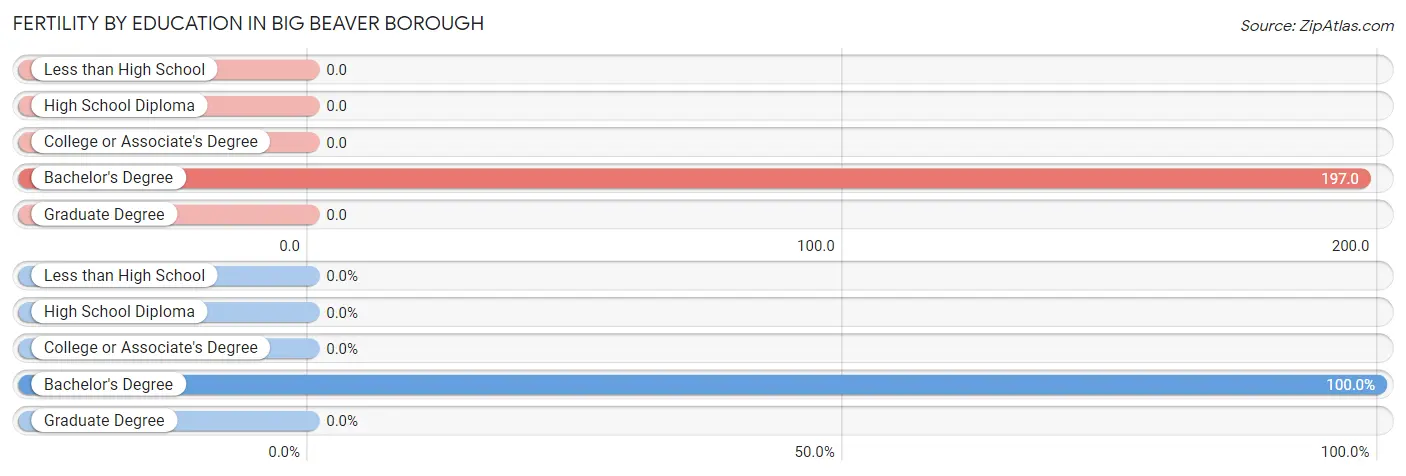
| Educational Attainment | Women with Births | Births / 1,000 Women |
| Less than High School | 0 (0.0%) | 0.0 |
| High School Diploma | 0 (0.0%) | 0.0 |
| College or Associate's Degree | 0 (0.0%) | 0.0 |
| Bachelor's Degree | 14 (100.0%) | 197.0 |
| Graduate Degree | 0 (0.0%) | 0.0 |
| Total | 14 (100.0%) | 45.0 |
Fertility by Education by Marriage Status in Big Beaver borough
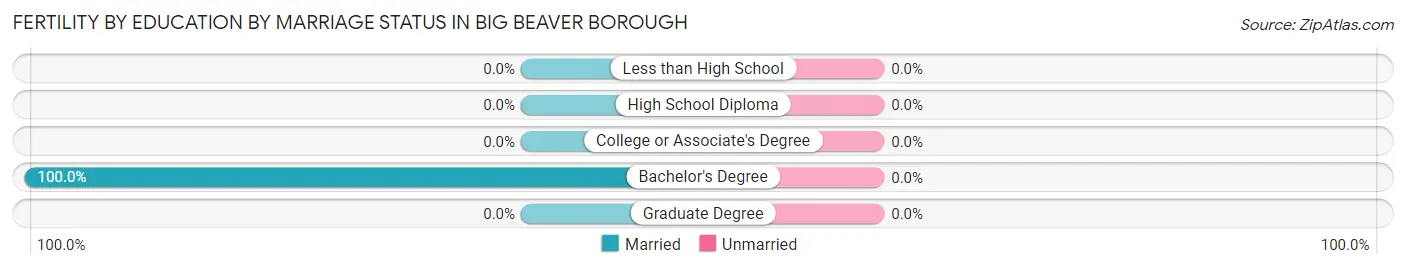
| Educational Attainment | Married | Unmarried |
| Less than High School | 0 (0.0%) | 0 (0.0%) |
| High School Diploma | 0 (0.0%) | 0 (0.0%) |
| College or Associate's Degree | 0 (0.0%) | 0 (0.0%) |
| Bachelor's Degree | 14 (100.0%) | 0 (0.0%) |
| Graduate Degree | 0 (0.0%) | 0 (0.0%) |
| Total | 14 (100.0%) | 0 (0.0%) |
Employment Characteristics in Big Beaver borough
Employment by Class of Employer in Big Beaver borough
Among the 779 employed individuals in Big Beaver borough, private company employees (536 | 68.8%), not-for-profit organizations (117 | 15.0%), and self-employed (incorporated) (50 | 6.4%) make up the most common classes of employment.
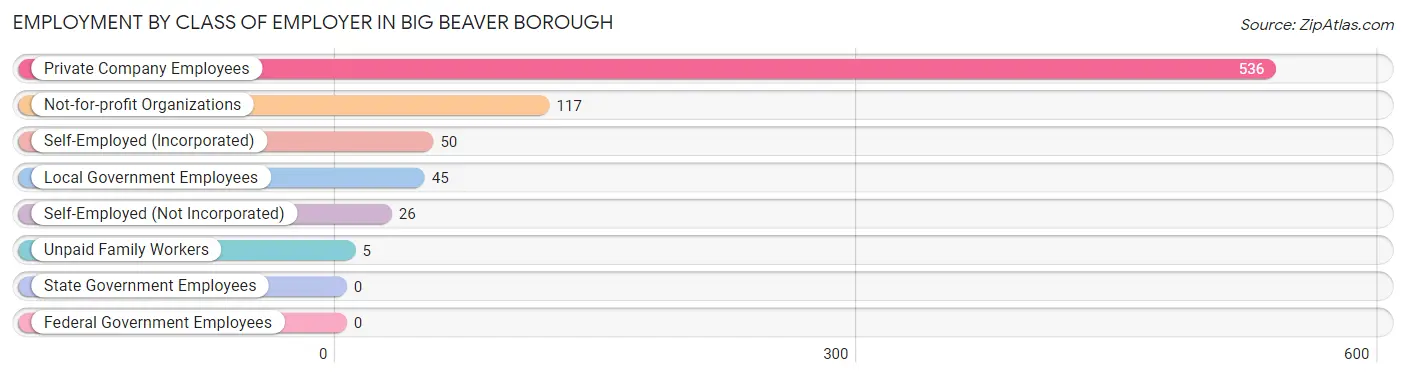
| Employer Class | # Employees | % Employees |
| Private Company Employees | 536 | 68.8% |
| Self-Employed (Incorporated) | 50 | 6.4% |
| Self-Employed (Not Incorporated) | 26 | 3.3% |
| Not-for-profit Organizations | 117 | 15.0% |
| Local Government Employees | 45 | 5.8% |
| State Government Employees | 0 | 0.0% |
| Federal Government Employees | 0 | 0.0% |
| Unpaid Family Workers | 5 | 0.6% |
| Total | 779 | 100.0% |
Employment Status by Age in Big Beaver borough
According to the labor force statistics for Big Beaver borough, out of the total population over 16 years of age (1,586), 55.6% or 882 individuals are in the labor force, with 10.0% or 88 of them unemployed. The age group with the highest labor force participation rate is 30 to 34 years, with 92.2% or 59 individuals in the labor force. Within the labor force, the 16 to 19 years age range has the highest percentage of unemployed individuals, with 37.5% or 12 of them being unemployed.
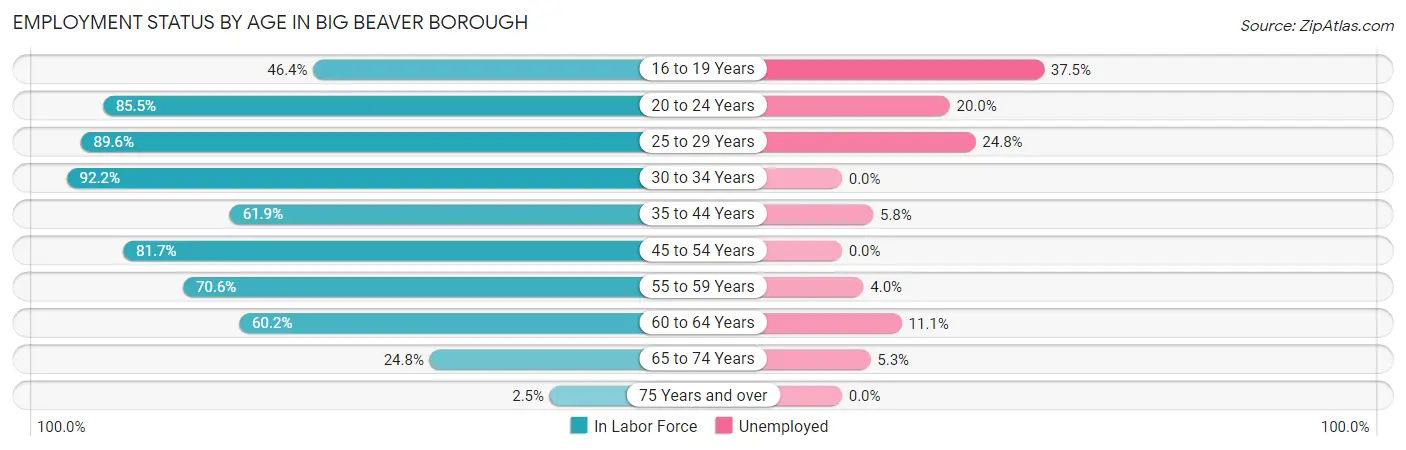
| Age Bracket | In Labor Force | Unemployed |
| 16 to 19 Years | 32 (46.4%) | 12 (37.5%) |
| 20 to 24 Years | 65 (85.5%) | 13 (20.0%) |
| 25 to 29 Years | 121 (89.6%) | 30 (24.8%) |
| 30 to 34 Years | 59 (92.2%) | 0 (0.0%) |
| 35 to 44 Years | 104 (61.9%) | 6 (5.8%) |
| 45 to 54 Years | 134 (81.7%) | 0 (0.0%) |
| 55 to 59 Years | 125 (70.6%) | 5 (4.0%) |
| 60 to 64 Years | 162 (60.2%) | 18 (11.1%) |
| 65 to 74 Years | 76 (24.8%) | 4 (5.3%) |
| 75 Years and over | 4 (2.5%) | 0 (0.0%) |
| Total | 882 (55.6%) | 88 (10.0%) |
Employment Status by Educational Attainment in Big Beaver borough
According to labor force statistics for Big Beaver borough, 72.2% of individuals (705) out of the total population between 25 and 64 years of age (977) are in the labor force, with 8.4% or 59 of them being unemployed. The group with the highest labor force participation rate are those with the educational attainment of bachelor's degree or higher, with 79.6% or 242 individuals in the labor force. Within the labor force, individuals with high school diploma education have the highest percentage of unemployment, with 13.8% or 41 of them being unemployed.
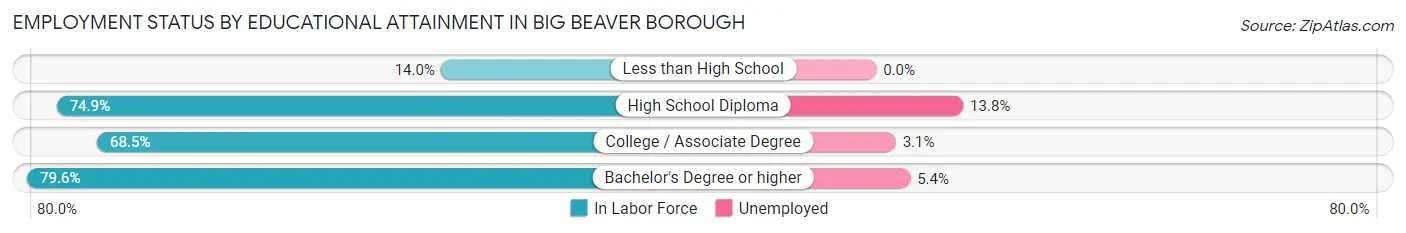
| Educational Attainment | In Labor Force | Unemployed |
| Less than High School | 6 (14.0%) | 0 (0.0%) |
| High School Diploma | 298 (74.9%) | 55 (13.8%) |
| College / Associate Degree | 159 (68.5%) | 7 (3.1%) |
| Bachelor's Degree or higher | 242 (79.6%) | 16 (5.4%) |
| Total | 705 (72.2%) | 82 (8.4%) |
Employment Occupations by Sex in Big Beaver borough
Management, Business, Science and Arts Occupations
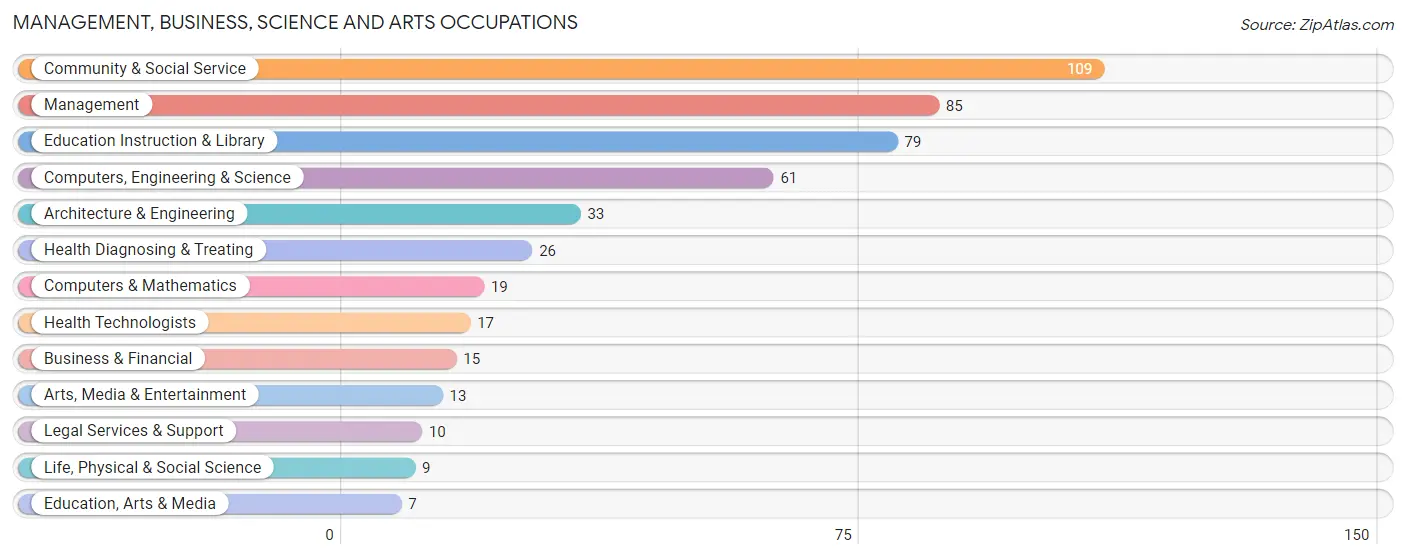
The most common Management, Business, Science and Arts occupations in Big Beaver borough are Community & Social Service (109 | 13.7%), Management (85 | 10.7%), Education Instruction & Library (79 | 10.0%), Computers, Engineering & Science (61 | 7.7%), and Architecture & Engineering (33 | 4.2%).
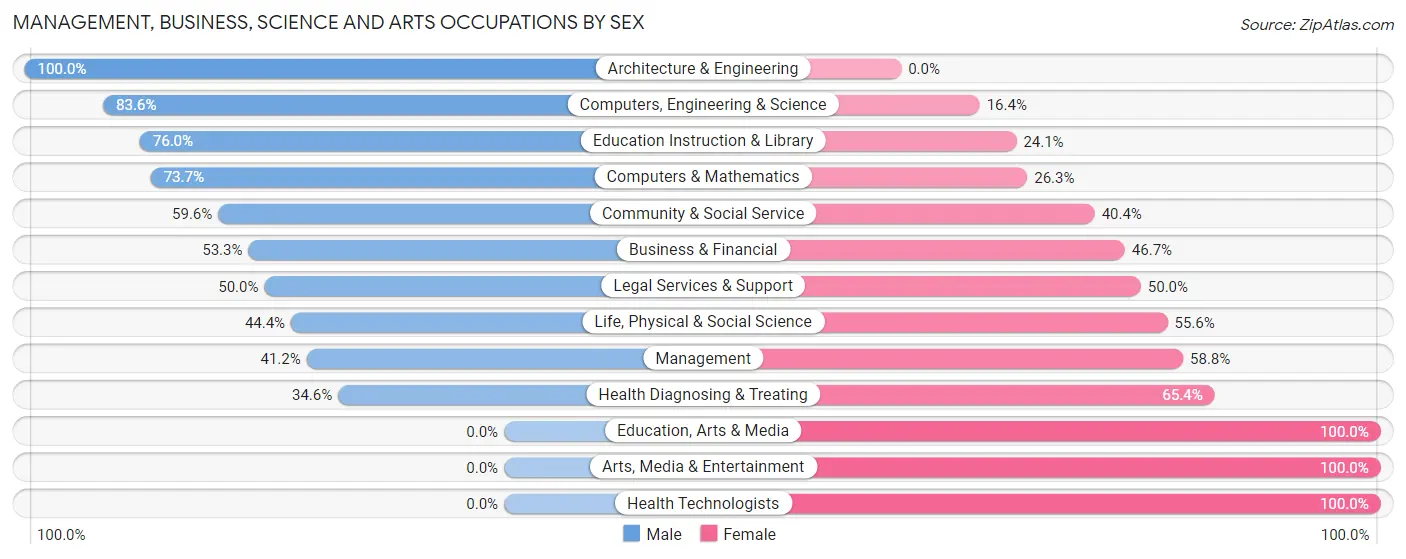
Management, Business, Science and Arts Occupations by Sex
Within the Management, Business, Science and Arts occupations in Big Beaver borough, the most male-oriented occupations are Architecture & Engineering (100.0%), Computers, Engineering & Science (83.6%), and Education Instruction & Library (75.9%), while the most female-oriented occupations are Education, Arts & Media (100.0%), Arts, Media & Entertainment (100.0%), and Health Technologists (100.0%).
| Occupation | Male | Female |
| Management | 35 (41.2%) | 50 (58.8%) |
| Business & Financial | 8 (53.3%) | 7 (46.7%) |
| Computers, Engineering & Science | 51 (83.6%) | 10 (16.4%) |
| Computers & Mathematics | 14 (73.7%) | 5 (26.3%) |
| Architecture & Engineering | 33 (100.0%) | 0 (0.0%) |
| Life, Physical & Social Science | 4 (44.4%) | 5 (55.6%) |
| Community & Social Service | 65 (59.6%) | 44 (40.4%) |
| Education, Arts & Media | 0 (0.0%) | 7 (100.0%) |
| Legal Services & Support | 5 (50.0%) | 5 (50.0%) |
| Education Instruction & Library | 60 (75.9%) | 19 (24.0%) |
| Arts, Media & Entertainment | 0 (0.0%) | 13 (100.0%) |
| Health Diagnosing & Treating | 9 (34.6%) | 17 (65.4%) |
| Health Technologists | 0 (0.0%) | 17 (100.0%) |
| Total (Category) | 168 (56.8%) | 128 (43.2%) |
| Total (Overall) | 493 (62.1%) | 301 (37.9%) |
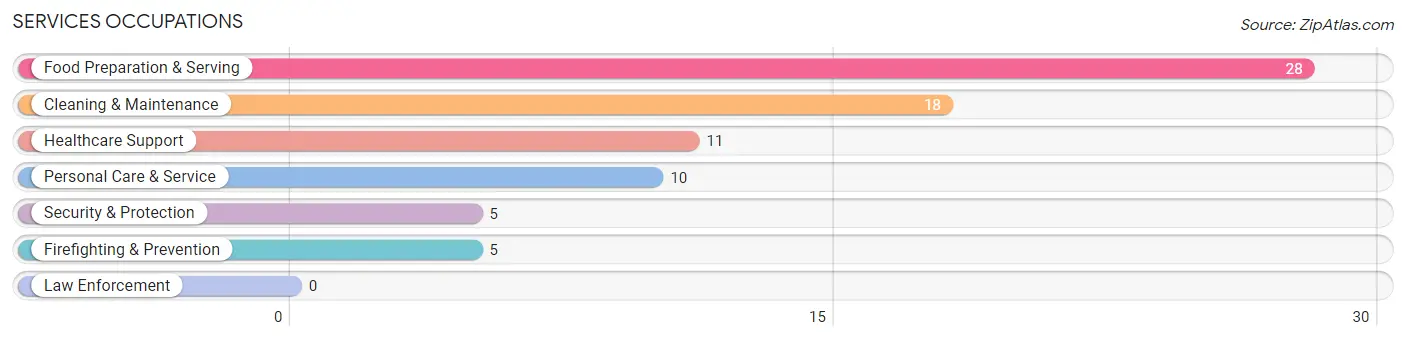
Services Occupations
The most common Services occupations in Big Beaver borough are Food Preparation & Serving (28 | 3.5%), Cleaning & Maintenance (18 | 2.3%), Healthcare Support (11 | 1.4%), Personal Care & Service (10 | 1.3%), and Security & Protection (5 | 0.6%).
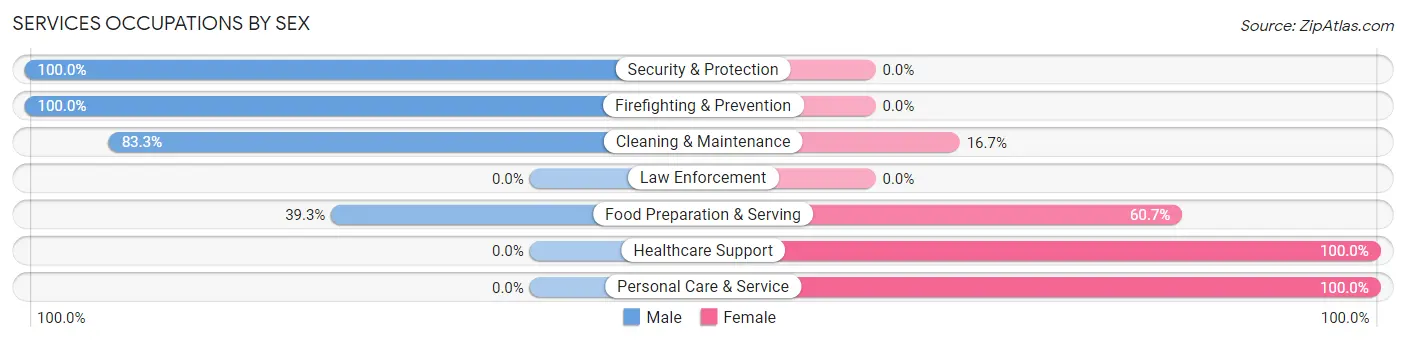
Services Occupations by Sex
Within the Services occupations in Big Beaver borough, the most male-oriented occupations are Security & Protection (100.0%), Firefighting & Prevention (100.0%), and Cleaning & Maintenance (83.3%), while the most female-oriented occupations are Healthcare Support (100.0%), Personal Care & Service (100.0%), and Food Preparation & Serving (60.7%).
| Occupation | Male | Female |
| Healthcare Support | 0 (0.0%) | 11 (100.0%) |
| Security & Protection | 5 (100.0%) | 0 (0.0%) |
| Firefighting & Prevention | 5 (100.0%) | 0 (0.0%) |
| Law Enforcement | 0 (0.0%) | 0 (0.0%) |
| Food Preparation & Serving | 11 (39.3%) | 17 (60.7%) |
| Cleaning & Maintenance | 15 (83.3%) | 3 (16.7%) |
| Personal Care & Service | 0 (0.0%) | 10 (100.0%) |
| Total (Category) | 31 (43.1%) | 41 (56.9%) |
| Total (Overall) | 493 (62.1%) | 301 (37.9%) |
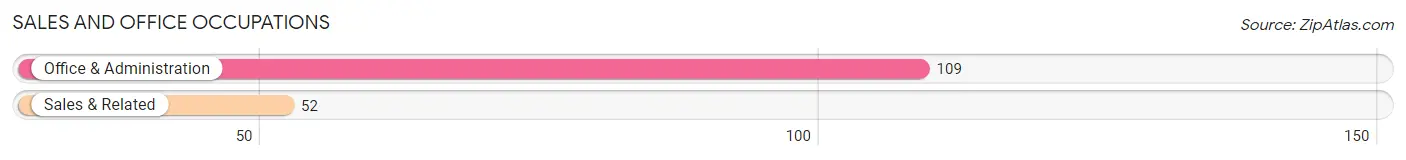
Sales and Office Occupations
The most common Sales and Office occupations in Big Beaver borough are Office & Administration (109 | 13.7%), and Sales & Related (52 | 6.6%).
Sales and Office Occupations by Sex
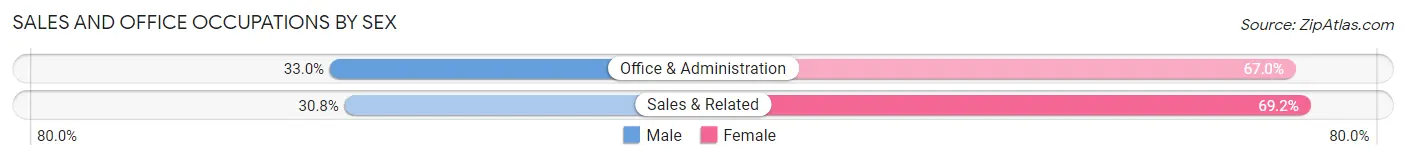
| Occupation | Male | Female |
| Sales & Related | 16 (30.8%) | 36 (69.2%) |
| Office & Administration | 36 (33.0%) | 73 (67.0%) |
| Total (Category) | 52 (32.3%) | 109 (67.7%) |
| Total (Overall) | 493 (62.1%) | 301 (37.9%) |
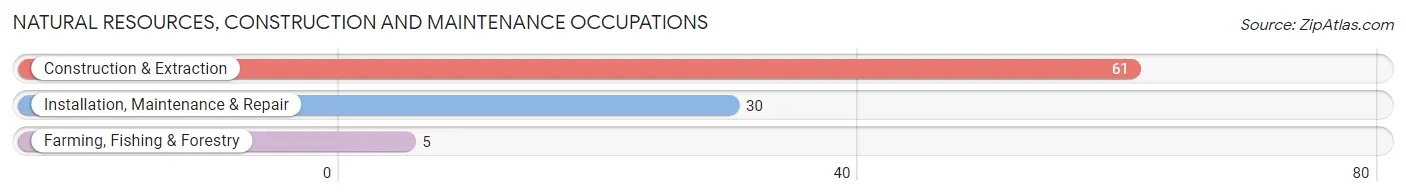
Natural Resources, Construction and Maintenance Occupations
The most common Natural Resources, Construction and Maintenance occupations in Big Beaver borough are Construction & Extraction (61 | 7.7%), Installation, Maintenance & Repair (30 | 3.8%), and Farming, Fishing & Forestry (5 | 0.6%).
Natural Resources, Construction and Maintenance Occupations by Sex
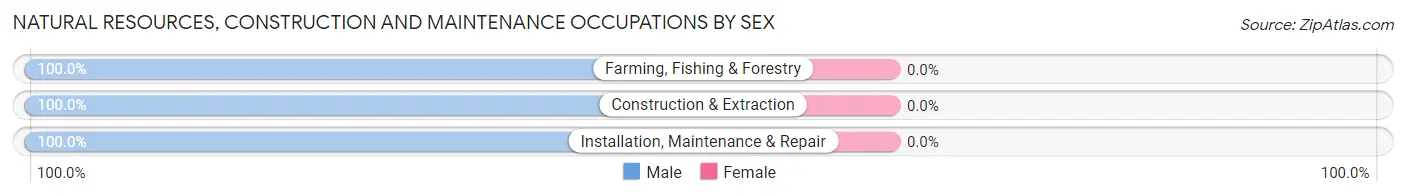
| Occupation | Male | Female |
| Farming, Fishing & Forestry | 5 (100.0%) | 0 (0.0%) |
| Construction & Extraction | 61 (100.0%) | 0 (0.0%) |
| Installation, Maintenance & Repair | 30 (100.0%) | 0 (0.0%) |
| Total (Category) | 96 (100.0%) | 0 (0.0%) |
| Total (Overall) | 493 (62.1%) | 301 (37.9%) |
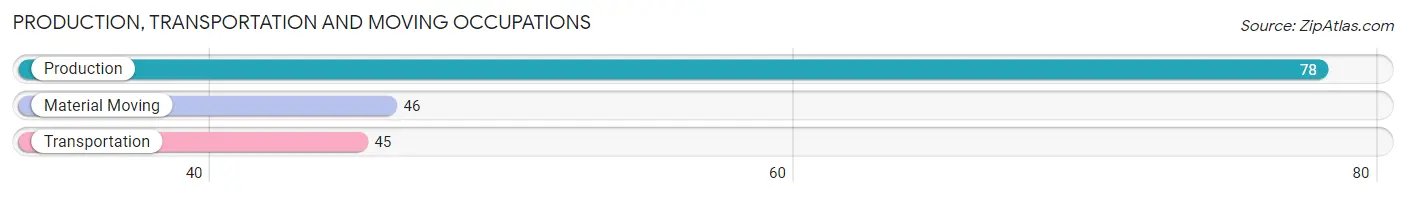
Production, Transportation and Moving Occupations
The most common Production, Transportation and Moving occupations in Big Beaver borough are Production (78 | 9.8%), Material Moving (46 | 5.8%), and Transportation (45 | 5.7%).
Production, Transportation and Moving Occupations by Sex
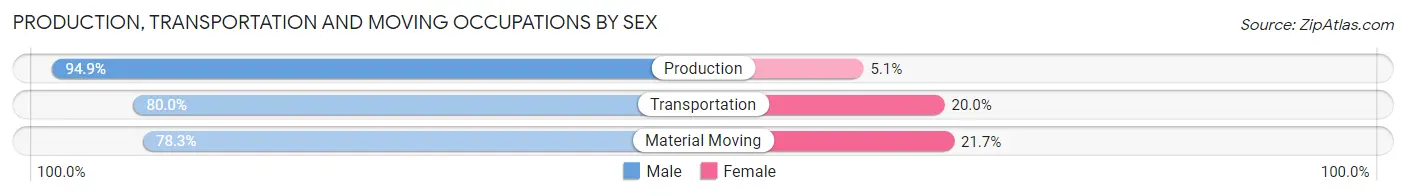
| Occupation | Male | Female |
| Production | 74 (94.9%) | 4 (5.1%) |
| Transportation | 36 (80.0%) | 9 (20.0%) |
| Material Moving | 36 (78.3%) | 10 (21.7%) |
| Total (Category) | 146 (86.4%) | 23 (13.6%) |
| Total (Overall) | 493 (62.1%) | 301 (37.9%) |
Employment Industries by Sex in Big Beaver borough
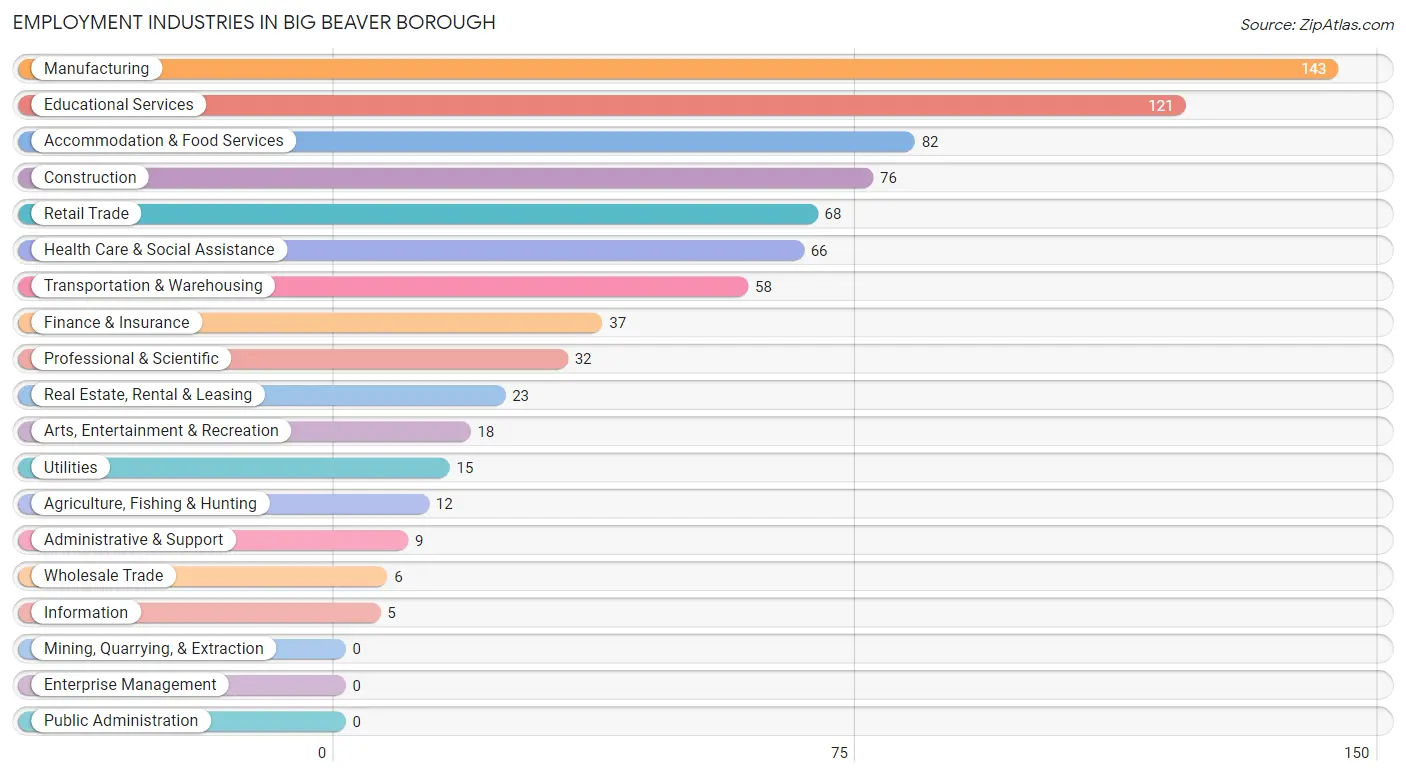
Employment Industries in Big Beaver borough
The major employment industries in Big Beaver borough include Manufacturing (143 | 18.0%), Educational Services (121 | 15.2%), Accommodation & Food Services (82 | 10.3%), Construction (76 | 9.6%), and Retail Trade (68 | 8.6%).
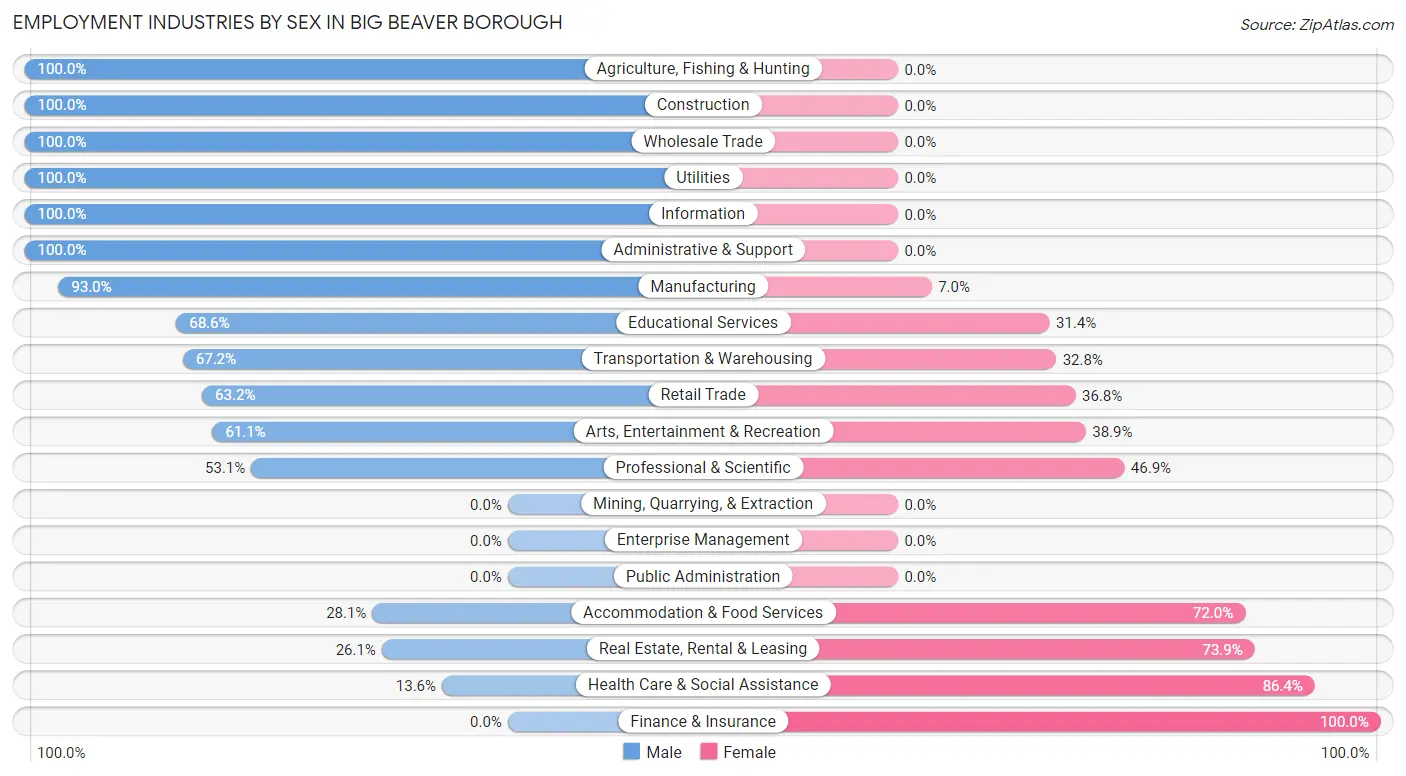
Employment Industries by Sex in Big Beaver borough
The Big Beaver borough industries that see more men than women are Agriculture, Fishing & Hunting (100.0%), Construction (100.0%), and Wholesale Trade (100.0%), whereas the industries that tend to have a higher number of women are Finance & Insurance (100.0%), Health Care & Social Assistance (86.4%), and Real Estate, Rental & Leasing (73.9%).
| Industry | Male | Female |
| Agriculture, Fishing & Hunting | 12 (100.0%) | 0 (0.0%) |
| Mining, Quarrying, & Extraction | 0 (0.0%) | 0 (0.0%) |
| Construction | 76 (100.0%) | 0 (0.0%) |
| Manufacturing | 133 (93.0%) | 10 (7.0%) |
| Wholesale Trade | 6 (100.0%) | 0 (0.0%) |
| Retail Trade | 43 (63.2%) | 25 (36.8%) |
| Transportation & Warehousing | 39 (67.2%) | 19 (32.8%) |
| Utilities | 15 (100.0%) | 0 (0.0%) |
| Information | 5 (100.0%) | 0 (0.0%) |
| Finance & Insurance | 0 (0.0%) | 37 (100.0%) |
| Real Estate, Rental & Leasing | 6 (26.1%) | 17 (73.9%) |
| Professional & Scientific | 17 (53.1%) | 15 (46.9%) |
| Enterprise Management | 0 (0.0%) | 0 (0.0%) |
| Administrative & Support | 9 (100.0%) | 0 (0.0%) |
| Educational Services | 83 (68.6%) | 38 (31.4%) |
| Health Care & Social Assistance | 9 (13.6%) | 57 (86.4%) |
| Arts, Entertainment & Recreation | 11 (61.1%) | 7 (38.9%) |
| Accommodation & Food Services | 23 (28.1%) | 59 (72.0%) |
| Public Administration | 0 (0.0%) | 0 (0.0%) |
| Total | 493 (62.1%) | 301 (37.9%) |
Education in Big Beaver borough
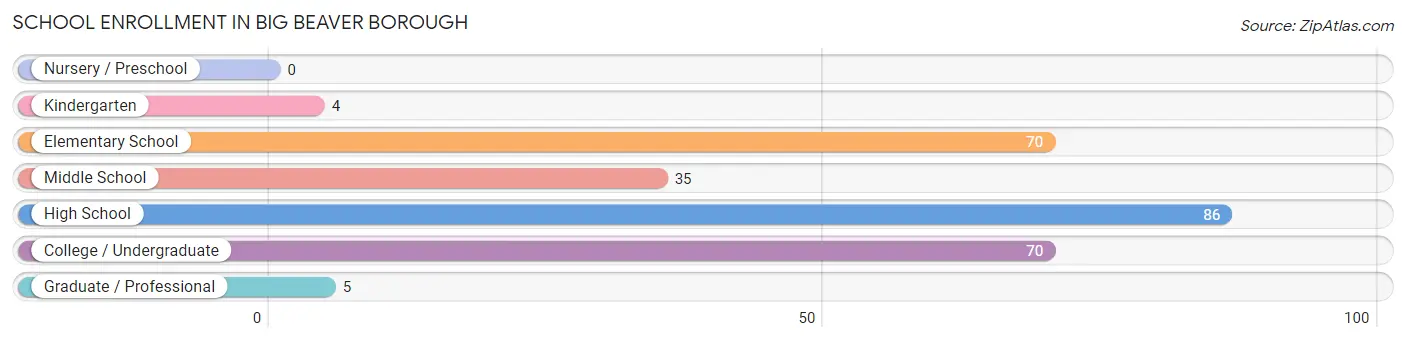
School Enrollment in Big Beaver borough
The most common levels of schooling among the 270 students in Big Beaver borough are high school (86 | 31.9%), elementary school (70 | 25.9%), and college / undergraduate (70 | 25.9%).
| School Level | # Students | % Students |
| Nursery / Preschool | 0 | 0.0% |
| Kindergarten | 4 | 1.5% |
| Elementary School | 70 | 25.9% |
| Middle School | 35 | 13.0% |
| High School | 86 | 31.9% |
| College / Undergraduate | 70 | 25.9% |
| Graduate / Professional | 5 | 1.8% |
| Total | 270 | 100.0% |
School Enrollment by Age by Funding Source in Big Beaver borough
Out of a total of 270 students who are enrolled in schools in Big Beaver borough, 139 (51.5%) attend a private institution, while the remaining 131 (48.5%) are enrolled in public schools. The age group of 35 years and over has the highest likelihood of being enrolled in private schools, with 5 (100.0% in the age bracket) enrolled. Conversely, the age group of 25 to 34 year olds has the lowest likelihood of being enrolled in a private school, with 11 (100.0% in the age bracket) attending a public institution.
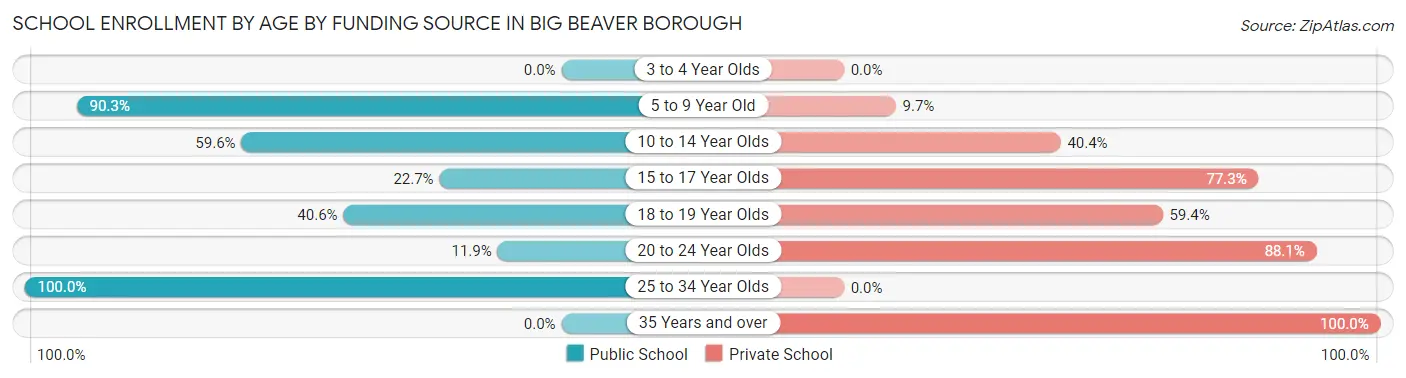
| Age Bracket | Public School | Private School |
| 3 to 4 Year Olds | 0 (0.0%) | 0 (0.0%) |
| 5 to 9 Year Old | 56 (90.3%) | 6 (9.7%) |
| 10 to 14 Year Olds | 31 (59.6%) | 21 (40.4%) |
| 15 to 17 Year Olds | 15 (22.7%) | 51 (77.3%) |
| 18 to 19 Year Olds | 13 (40.6%) | 19 (59.4%) |
| 20 to 24 Year Olds | 5 (11.9%) | 37 (88.1%) |
| 25 to 34 Year Olds | 11 (100.0%) | 0 (0.0%) |
| 35 Years and over | 0 (0.0%) | 5 (100.0%) |
| Total | 131 (48.5%) | 139 (51.5%) |
Educational Attainment by Field of Study in Big Beaver borough
Business (119 | 29.5%), education (74 | 18.4%), psychology (51 | 12.7%), science & technology (38 | 9.4%), and engineering (28 | 7.0%) are the most common fields of study among 403 individuals in Big Beaver borough who have obtained a bachelor's degree or higher.
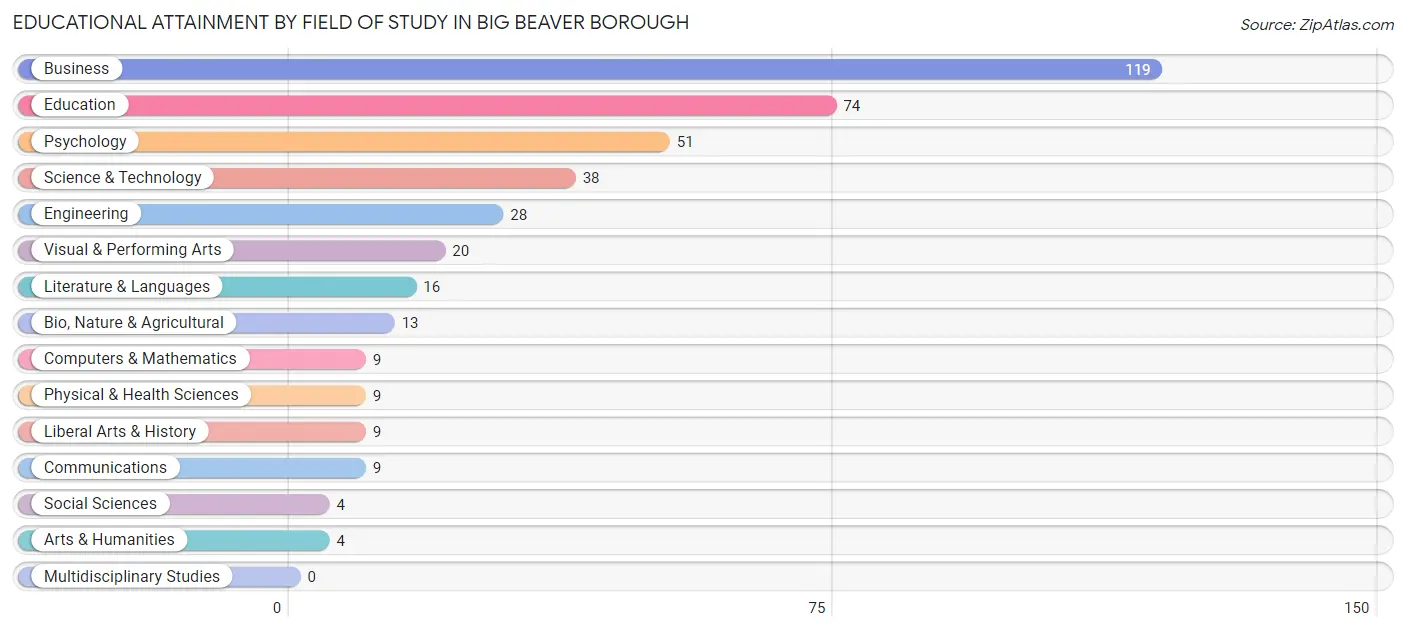
| Field of Study | # Graduates | % Graduates |
| Computers & Mathematics | 9 | 2.2% |
| Bio, Nature & Agricultural | 13 | 3.2% |
| Physical & Health Sciences | 9 | 2.2% |
| Psychology | 51 | 12.7% |
| Social Sciences | 4 | 1.0% |
| Engineering | 28 | 7.0% |
| Multidisciplinary Studies | 0 | 0.0% |
| Science & Technology | 38 | 9.4% |
| Business | 119 | 29.5% |
| Education | 74 | 18.4% |
| Literature & Languages | 16 | 4.0% |
| Liberal Arts & History | 9 | 2.2% |
| Visual & Performing Arts | 20 | 5.0% |
| Communications | 9 | 2.2% |
| Arts & Humanities | 4 | 1.0% |
| Total | 403 | 100.0% |
Transportation & Commute in Big Beaver borough
Vehicle Availability by Sex in Big Beaver borough
The most prevalent vehicle ownership categories in Big Beaver borough are males with 2 vehicles (168, accounting for 34.4%) and females with 2 vehicles (147, making up 57.9%).
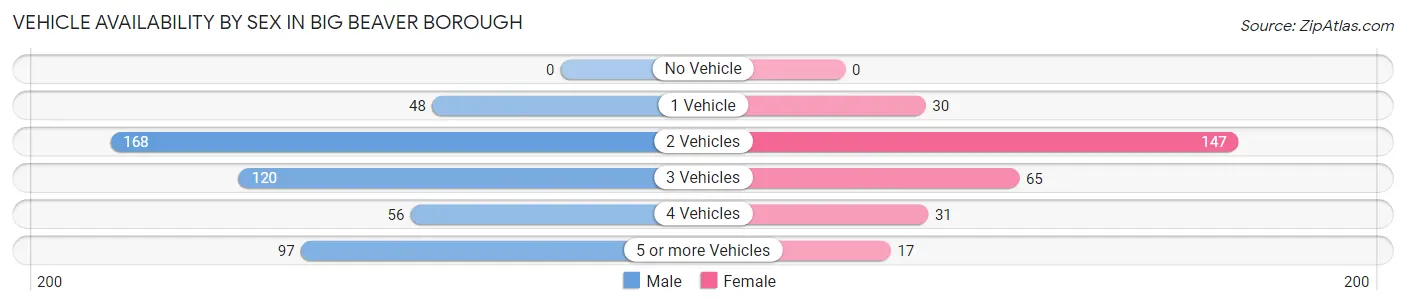
| Vehicles Available | Male | Female |
| No Vehicle | 0 (0.0%) | 0 (0.0%) |
| 1 Vehicle | 48 (9.8%) | 30 (10.3%) |
| 2 Vehicles | 168 (34.4%) | 147 (50.7%) |
| 3 Vehicles | 120 (24.5%) | 65 (22.4%) |
| 4 Vehicles | 56 (11.5%) | 31 (10.7%) |
| 5 or more Vehicles | 97 (19.8%) | 17 (5.9%) |
| Total | 489 (100.0%) | 290 (100.0%) |
Commute Time in Big Beaver borough
The most frequently occuring commute durations in Big Beaver borough are 15 to 19 minutes (176 commuters, 25.6%), 45 to 59 minutes (113 commuters, 16.4%), and 10 to 14 minutes (70 commuters, 10.2%).
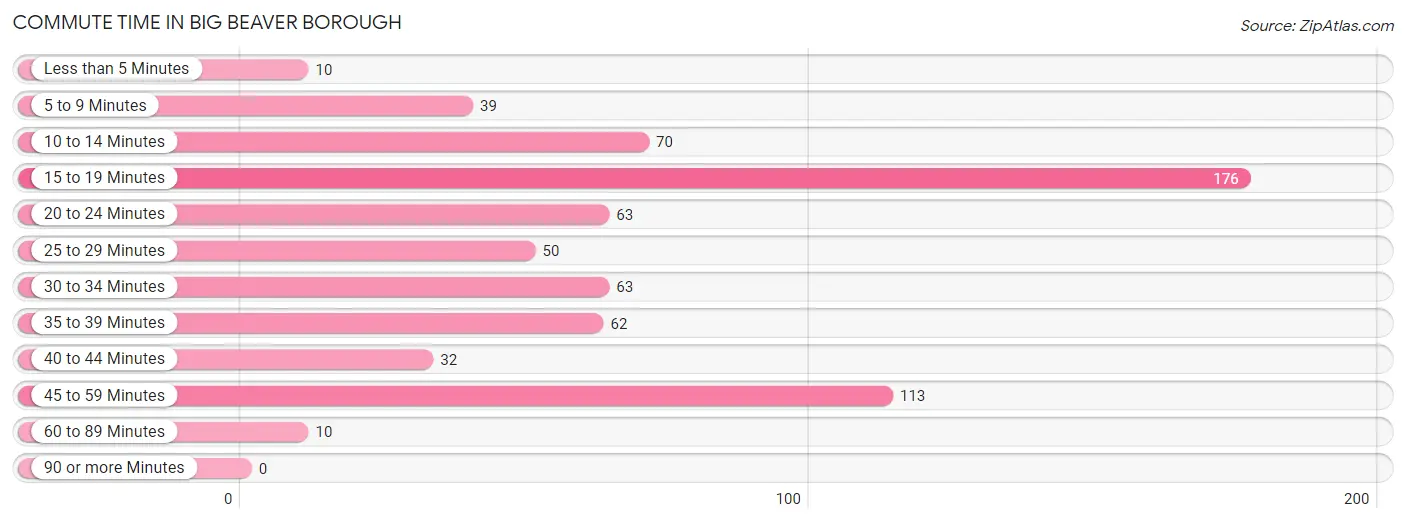
| Commute Time | # Commuters | % Commuters |
| Less than 5 Minutes | 10 | 1.5% |
| 5 to 9 Minutes | 39 | 5.7% |
| 10 to 14 Minutes | 70 | 10.2% |
| 15 to 19 Minutes | 176 | 25.6% |
| 20 to 24 Minutes | 63 | 9.2% |
| 25 to 29 Minutes | 50 | 7.3% |
| 30 to 34 Minutes | 63 | 9.2% |
| 35 to 39 Minutes | 62 | 9.0% |
| 40 to 44 Minutes | 32 | 4.6% |
| 45 to 59 Minutes | 113 | 16.4% |
| 60 to 89 Minutes | 10 | 1.5% |
| 90 or more Minutes | 0 | 0.0% |
Commute Time by Sex in Big Beaver borough
The most common commute times in Big Beaver borough are 45 to 59 minutes (88 commuters, 20.9%) for males and 15 to 19 minutes (102 commuters, 38.2%) for females.
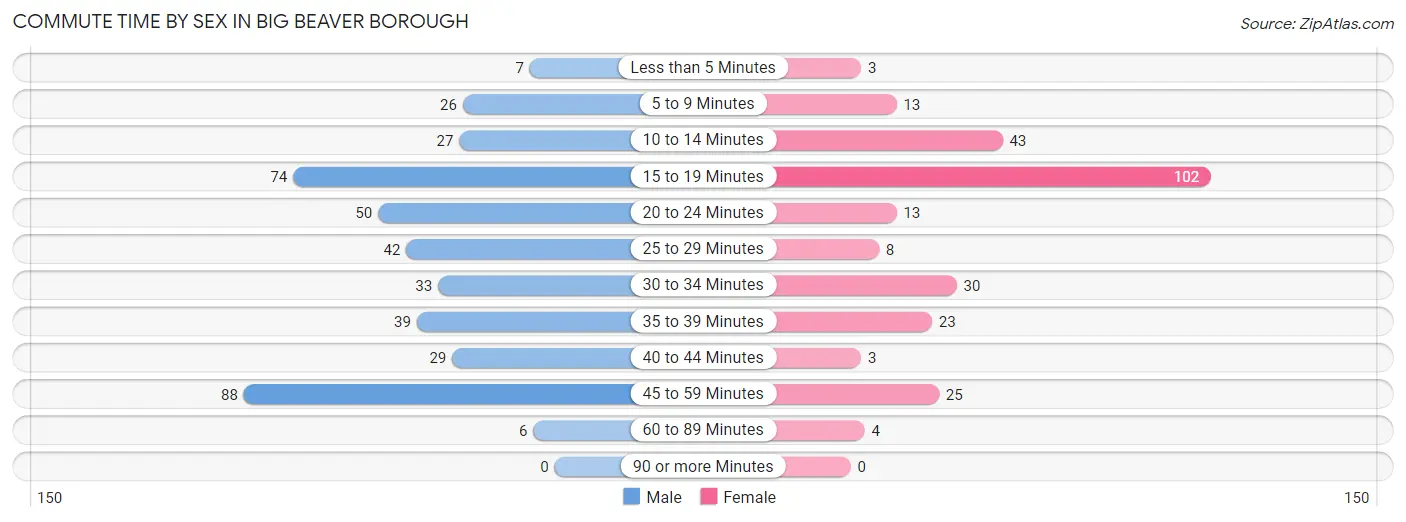
| Commute Time | Male | Female |
| Less than 5 Minutes | 7 (1.7%) | 3 (1.1%) |
| 5 to 9 Minutes | 26 (6.2%) | 13 (4.9%) |
| 10 to 14 Minutes | 27 (6.4%) | 43 (16.1%) |
| 15 to 19 Minutes | 74 (17.6%) | 102 (38.2%) |
| 20 to 24 Minutes | 50 (11.9%) | 13 (4.9%) |
| 25 to 29 Minutes | 42 (10.0%) | 8 (3.0%) |
| 30 to 34 Minutes | 33 (7.8%) | 30 (11.2%) |
| 35 to 39 Minutes | 39 (9.3%) | 23 (8.6%) |
| 40 to 44 Minutes | 29 (6.9%) | 3 (1.1%) |
| 45 to 59 Minutes | 88 (20.9%) | 25 (9.4%) |
| 60 to 89 Minutes | 6 (1.4%) | 4 (1.5%) |
| 90 or more Minutes | 0 (0.0%) | 0 (0.0%) |
Time of Departure to Work by Sex in Big Beaver borough
The most frequent times of departure to work in Big Beaver borough are 6:00 AM to 6:29 AM (108, 25.7%) for males and 8:00 AM to 8:29 AM (42, 15.7%) for females.
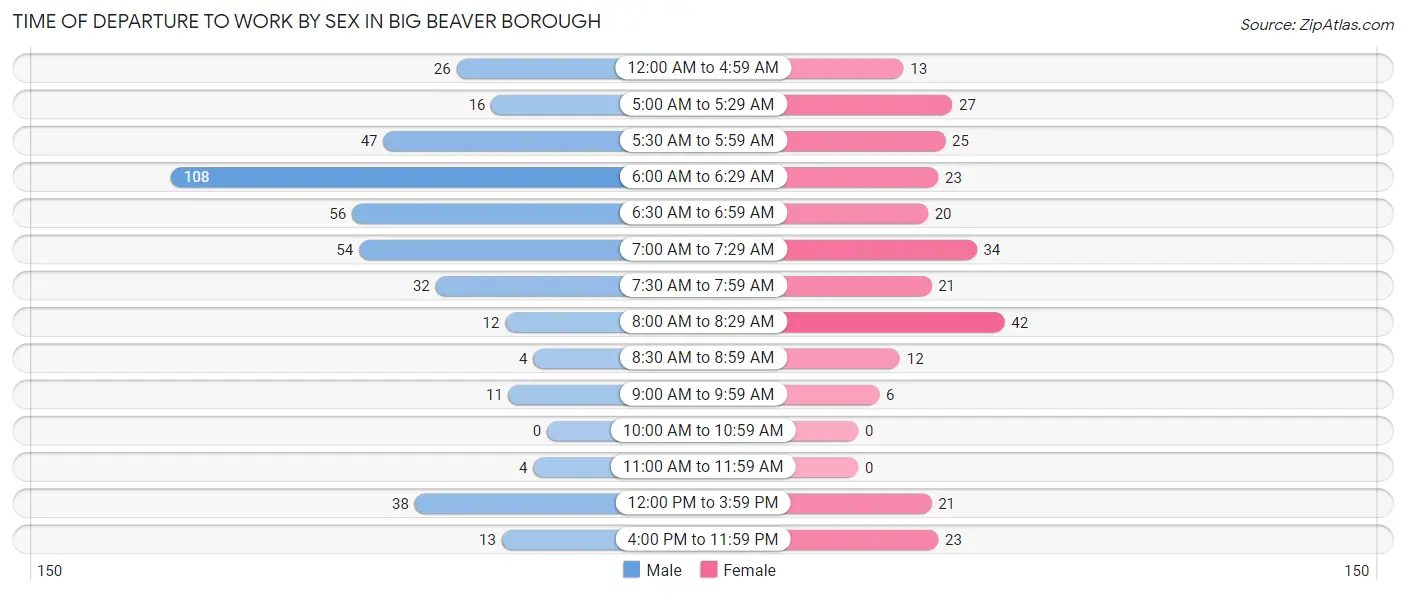
| Time of Departure | Male | Female |
| 12:00 AM to 4:59 AM | 26 (6.2%) | 13 (4.9%) |
| 5:00 AM to 5:29 AM | 16 (3.8%) | 27 (10.1%) |
| 5:30 AM to 5:59 AM | 47 (11.2%) | 25 (9.4%) |
| 6:00 AM to 6:29 AM | 108 (25.7%) | 23 (8.6%) |
| 6:30 AM to 6:59 AM | 56 (13.3%) | 20 (7.5%) |
| 7:00 AM to 7:29 AM | 54 (12.8%) | 34 (12.7%) |
| 7:30 AM to 7:59 AM | 32 (7.6%) | 21 (7.9%) |
| 8:00 AM to 8:29 AM | 12 (2.9%) | 42 (15.7%) |
| 8:30 AM to 8:59 AM | 4 (0.9%) | 12 (4.5%) |
| 9:00 AM to 9:59 AM | 11 (2.6%) | 6 (2.2%) |
| 10:00 AM to 10:59 AM | 0 (0.0%) | 0 (0.0%) |
| 11:00 AM to 11:59 AM | 4 (0.9%) | 0 (0.0%) |
| 12:00 PM to 3:59 PM | 38 (9.0%) | 21 (7.9%) |
| 4:00 PM to 11:59 PM | 13 (3.1%) | 23 (8.6%) |
| Total | 421 (100.0%) | 267 (100.0%) |
Housing Occupancy in Big Beaver borough
Occupancy by Ownership in Big Beaver borough
Of the total 727 dwellings in Big Beaver borough, owner-occupied units account for 636 (87.5%), while renter-occupied units make up 91 (12.5%).
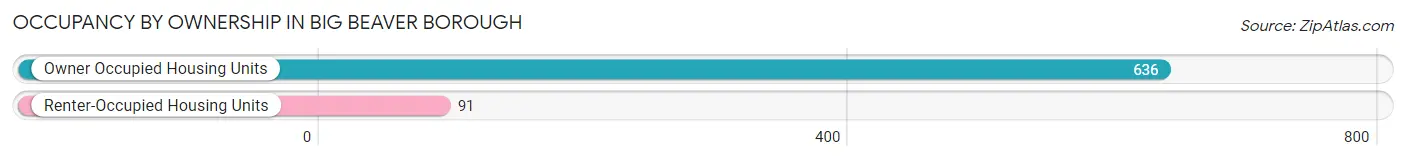
| Occupancy | # Housing Units | % Housing Units |
| Owner Occupied Housing Units | 636 | 87.5% |
| Renter-Occupied Housing Units | 91 | 12.5% |
| Total Occupied Housing Units | 727 | 100.0% |
Occupancy by Household Size in Big Beaver borough
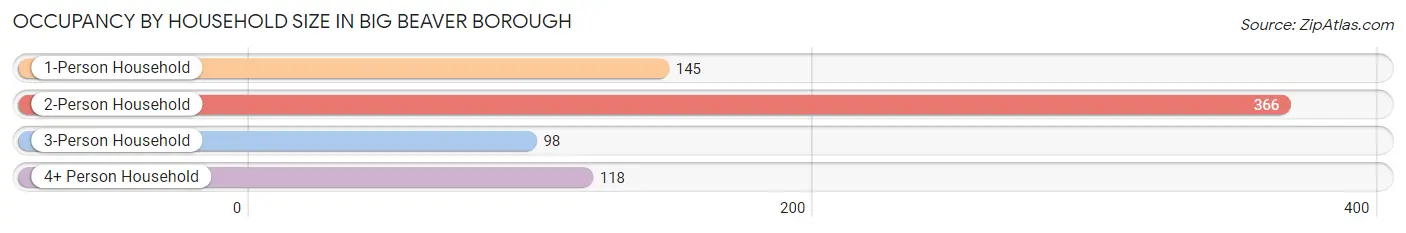
| Household Size | # Housing Units | % Housing Units |
| 1-Person Household | 145 | 19.9% |
| 2-Person Household | 366 | 50.3% |
| 3-Person Household | 98 | 13.5% |
| 4+ Person Household | 118 | 16.2% |
| Total Housing Units | 727 | 100.0% |
Occupancy by Ownership by Household Size in Big Beaver borough
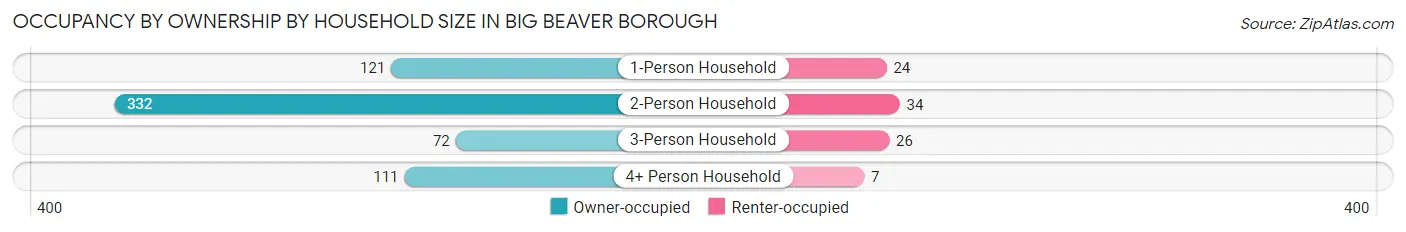
| Household Size | Owner-occupied | Renter-occupied |
| 1-Person Household | 121 (83.5%) | 24 (16.6%) |
| 2-Person Household | 332 (90.7%) | 34 (9.3%) |
| 3-Person Household | 72 (73.5%) | 26 (26.5%) |
| 4+ Person Household | 111 (94.1%) | 7 (5.9%) |
| Total Housing Units | 636 (87.5%) | 91 (12.5%) |
Occupancy by Educational Attainment in Big Beaver borough
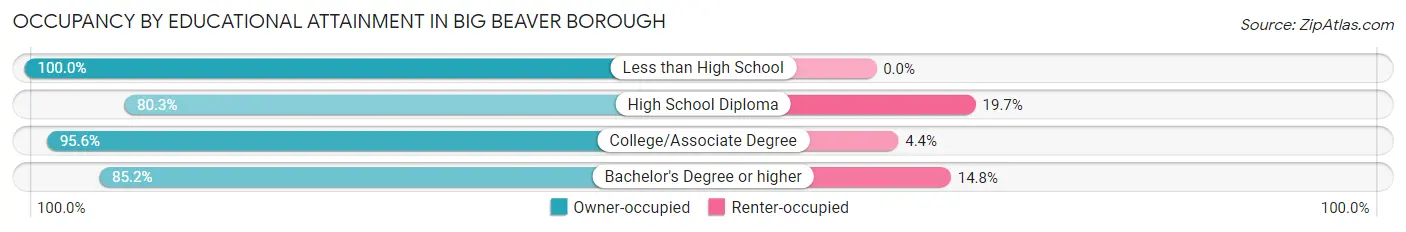
| Household Size | Owner-occupied | Renter-occupied |
| Less than High School | 46 (100.0%) | 0 (0.0%) |
| High School Diploma | 228 (80.3%) | 56 (19.7%) |
| College/Associate Degree | 218 (95.6%) | 10 (4.4%) |
| Bachelor's Degree or higher | 144 (85.2%) | 25 (14.8%) |
Occupancy by Age of Householder in Big Beaver borough
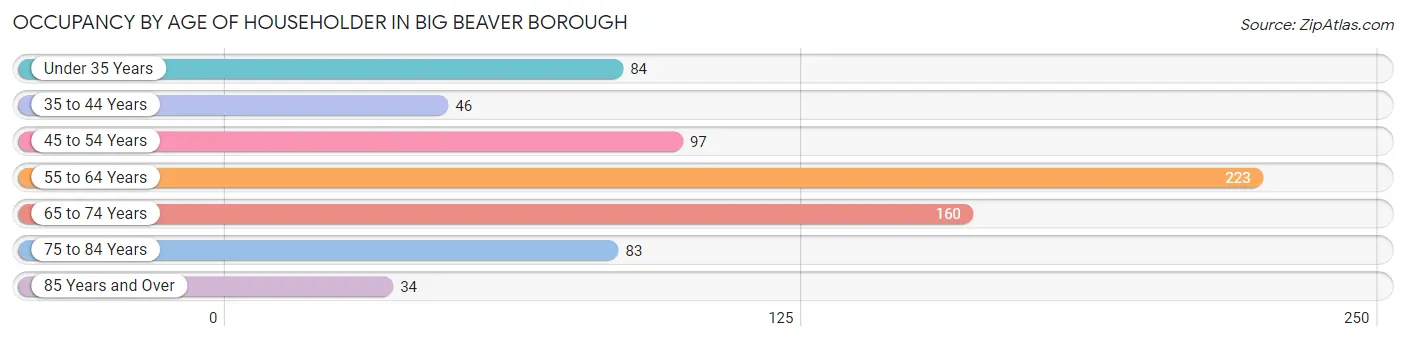
| Age Bracket | # Households | % Households |
| Under 35 Years | 84 | 11.6% |
| 35 to 44 Years | 46 | 6.3% |
| 45 to 54 Years | 97 | 13.3% |
| 55 to 64 Years | 223 | 30.7% |
| 65 to 74 Years | 160 | 22.0% |
| 75 to 84 Years | 83 | 11.4% |
| 85 Years and Over | 34 | 4.7% |
| Total | 727 | 100.0% |
Housing Finances in Big Beaver borough
Median Income by Occupancy in Big Beaver borough
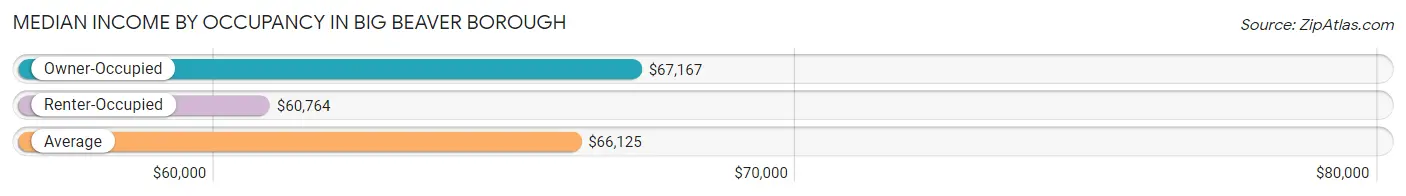
| Occupancy Type | # Households | Median Income |
| Owner-Occupied | 636 (87.5%) | $67,167 |
| Renter-Occupied | 91 (12.5%) | $60,764 |
| Average | 727 (100.0%) | $66,125 |
Occupancy by Householder Income Bracket in Big Beaver borough
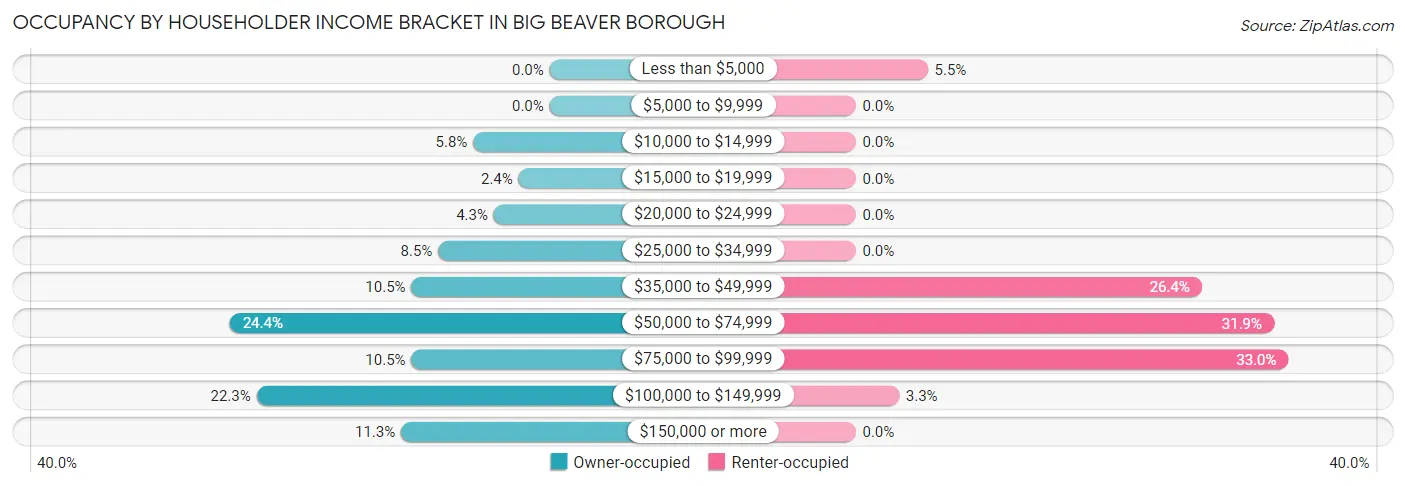
| Income Bracket | Owner-occupied | Renter-occupied |
| Less than $5,000 | 0 (0.0%) | 5 (5.5%) |
| $5,000 to $9,999 | 0 (0.0%) | 0 (0.0%) |
| $10,000 to $14,999 | 37 (5.8%) | 0 (0.0%) |
| $15,000 to $19,999 | 15 (2.4%) | 0 (0.0%) |
| $20,000 to $24,999 | 27 (4.3%) | 0 (0.0%) |
| $25,000 to $34,999 | 54 (8.5%) | 0 (0.0%) |
| $35,000 to $49,999 | 67 (10.5%) | 24 (26.4%) |
| $50,000 to $74,999 | 155 (24.4%) | 29 (31.9%) |
| $75,000 to $99,999 | 67 (10.5%) | 30 (33.0%) |
| $100,000 to $149,999 | 142 (22.3%) | 3 (3.3%) |
| $150,000 or more | 72 (11.3%) | 0 (0.0%) |
| Total | 636 (100.0%) | 91 (100.0%) |
Monthly Housing Cost Tiers in Big Beaver borough
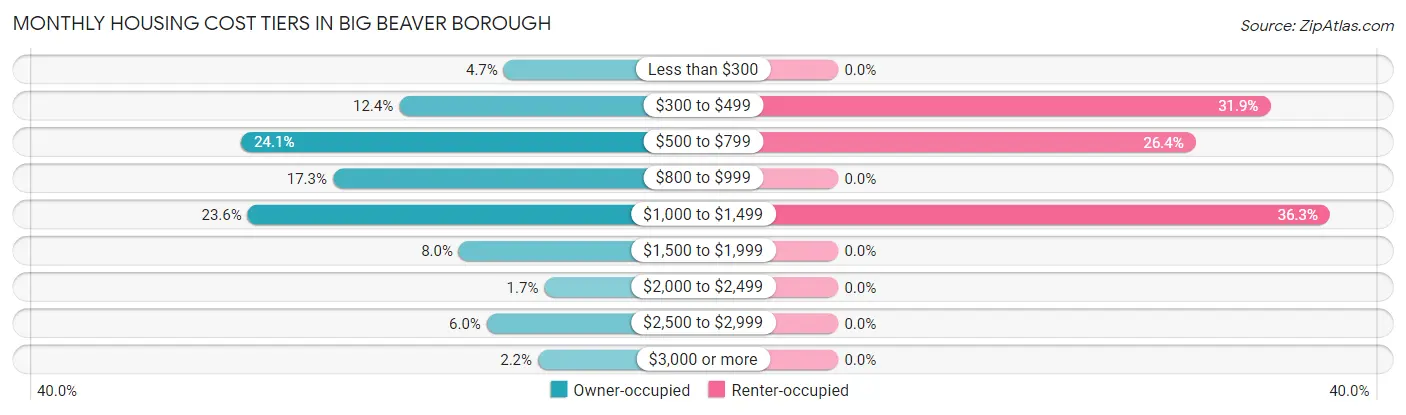
| Monthly Cost | Owner-occupied | Renter-occupied |
| Less than $300 | 30 (4.7%) | 0 (0.0%) |
| $300 to $499 | 79 (12.4%) | 29 (31.9%) |
| $500 to $799 | 153 (24.1%) | 24 (26.4%) |
| $800 to $999 | 110 (17.3%) | 0 (0.0%) |
| $1,000 to $1,499 | 150 (23.6%) | 33 (36.3%) |
| $1,500 to $1,999 | 51 (8.0%) | 0 (0.0%) |
| $2,000 to $2,499 | 11 (1.7%) | 0 (0.0%) |
| $2,500 to $2,999 | 38 (6.0%) | 0 (0.0%) |
| $3,000 or more | 14 (2.2%) | 0 (0.0%) |
| Total | 636 (100.0%) | 91 (100.0%) |
Physical Housing Characteristics in Big Beaver borough
Housing Structures in Big Beaver borough
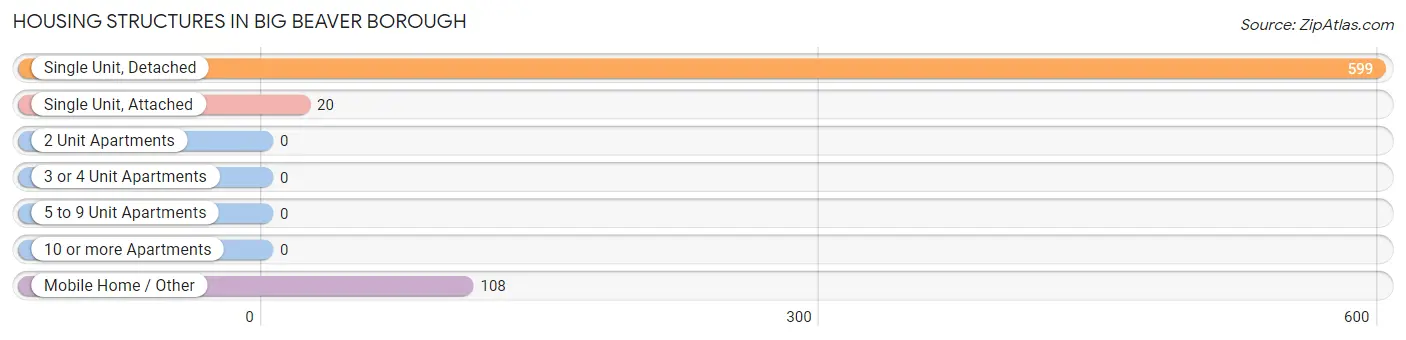
| Structure Type | # Housing Units | % Housing Units |
| Single Unit, Detached | 599 | 82.4% |
| Single Unit, Attached | 20 | 2.8% |
| 2 Unit Apartments | 0 | 0.0% |
| 3 or 4 Unit Apartments | 0 | 0.0% |
| 5 to 9 Unit Apartments | 0 | 0.0% |
| 10 or more Apartments | 0 | 0.0% |
| Mobile Home / Other | 108 | 14.9% |
| Total | 727 | 100.0% |
Housing Structures by Occupancy in Big Beaver borough
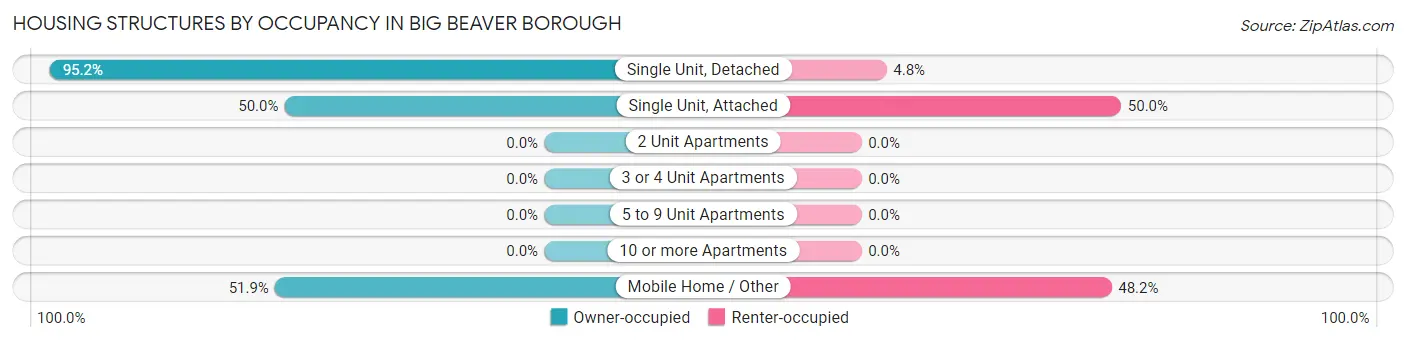
| Structure Type | Owner-occupied | Renter-occupied |
| Single Unit, Detached | 570 (95.2%) | 29 (4.8%) |
| Single Unit, Attached | 10 (50.0%) | 10 (50.0%) |
| 2 Unit Apartments | 0 (0.0%) | 0 (0.0%) |
| 3 or 4 Unit Apartments | 0 (0.0%) | 0 (0.0%) |
| 5 to 9 Unit Apartments | 0 (0.0%) | 0 (0.0%) |
| 10 or more Apartments | 0 (0.0%) | 0 (0.0%) |
| Mobile Home / Other | 56 (51.8%) | 52 (48.1%) |
| Total | 636 (87.5%) | 91 (12.5%) |
Housing Structures by Number of Rooms in Big Beaver borough
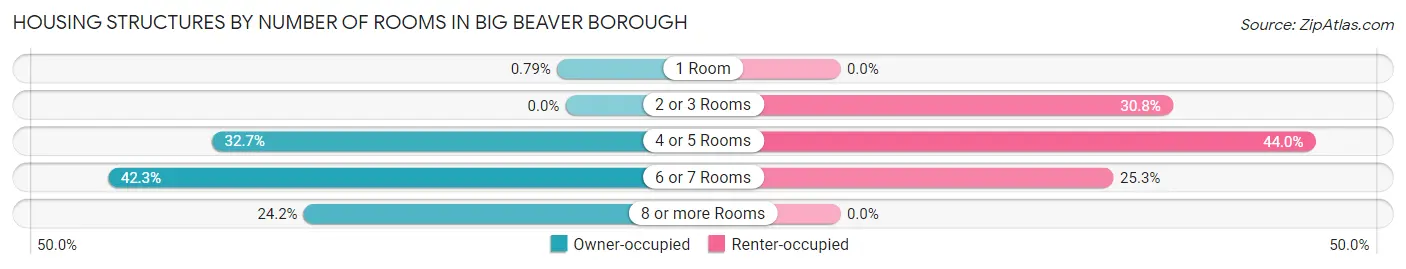
| Number of Rooms | Owner-occupied | Renter-occupied |
| 1 Room | 5 (0.8%) | 0 (0.0%) |
| 2 or 3 Rooms | 0 (0.0%) | 28 (30.8%) |
| 4 or 5 Rooms | 208 (32.7%) | 40 (44.0%) |
| 6 or 7 Rooms | 269 (42.3%) | 23 (25.3%) |
| 8 or more Rooms | 154 (24.2%) | 0 (0.0%) |
| Total | 636 (100.0%) | 91 (100.0%) |
Housing Structure by Heating Type in Big Beaver borough
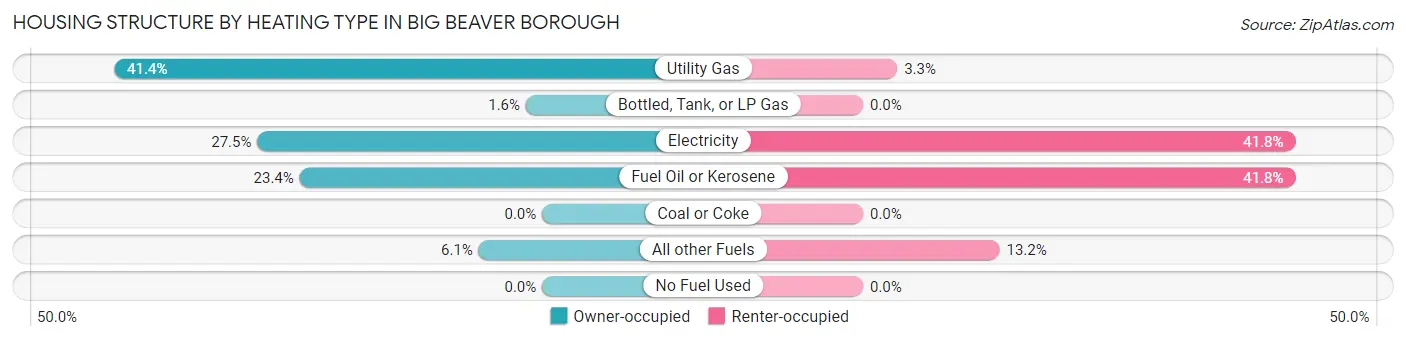
| Heating Type | Owner-occupied | Renter-occupied |
| Utility Gas | 263 (41.3%) | 3 (3.3%) |
| Bottled, Tank, or LP Gas | 10 (1.6%) | 0 (0.0%) |
| Electricity | 175 (27.5%) | 38 (41.8%) |
| Fuel Oil or Kerosene | 149 (23.4%) | 38 (41.8%) |
| Coal or Coke | 0 (0.0%) | 0 (0.0%) |
| All other Fuels | 39 (6.1%) | 12 (13.2%) |
| No Fuel Used | 0 (0.0%) | 0 (0.0%) |
| Total | 636 (100.0%) | 91 (100.0%) |
Household Vehicle Usage in Big Beaver borough
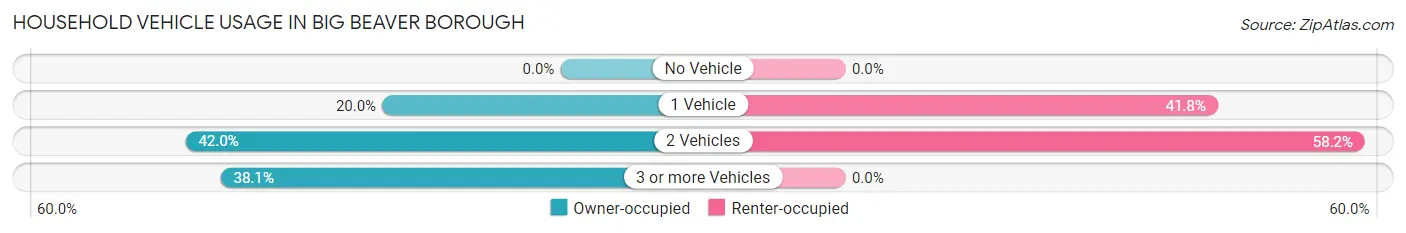
| Vehicles per Household | Owner-occupied | Renter-occupied |
| No Vehicle | 0 (0.0%) | 0 (0.0%) |
| 1 Vehicle | 127 (20.0%) | 38 (41.8%) |
| 2 Vehicles | 267 (42.0%) | 53 (58.2%) |
| 3 or more Vehicles | 242 (38.1%) | 0 (0.0%) |
| Total | 636 (100.0%) | 91 (100.0%) |
Real Estate & Mortgages in Big Beaver borough
Real Estate and Mortgage Overview in Big Beaver borough
| Characteristic | Without Mortgage | With Mortgage |
| Housing Units | 278 | 358 |
| Median Property Value | $172,600 | $173,600 |
| Median Household Income | $70,000 | $36 |
| Monthly Housing Costs | $576 | $14 |
| Real Estate Taxes | $2,591 | $0 |
Property Value by Mortgage Status in Big Beaver borough
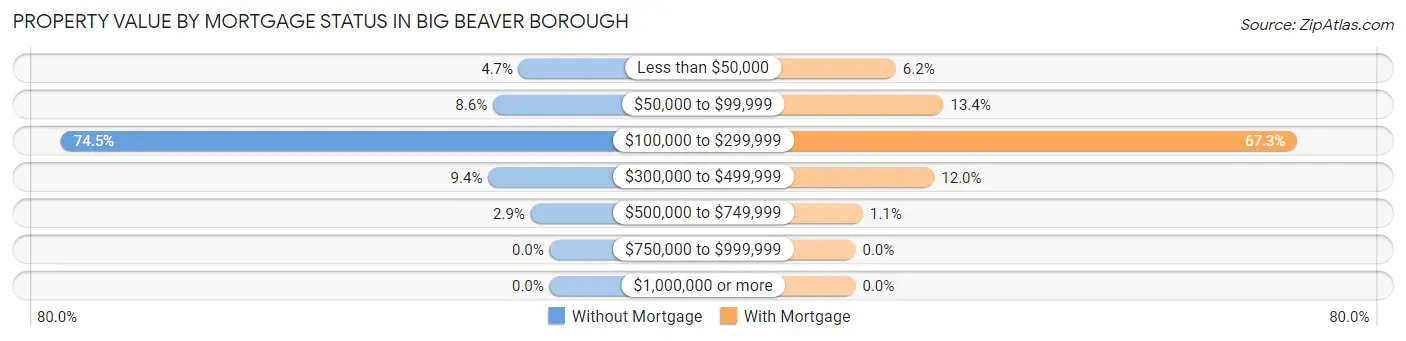
| Property Value | Without Mortgage | With Mortgage |
| Less than $50,000 | 13 (4.7%) | 22 (6.1%) |
| $50,000 to $99,999 | 24 (8.6%) | 48 (13.4%) |
| $100,000 to $299,999 | 207 (74.5%) | 241 (67.3%) |
| $300,000 to $499,999 | 26 (9.3%) | 43 (12.0%) |
| $500,000 to $749,999 | 8 (2.9%) | 4 (1.1%) |
| $750,000 to $999,999 | 0 (0.0%) | 0 (0.0%) |
| $1,000,000 or more | 0 (0.0%) | 0 (0.0%) |
| Total | 278 (100.0%) | 358 (100.0%) |
Household Income by Mortgage Status in Big Beaver borough
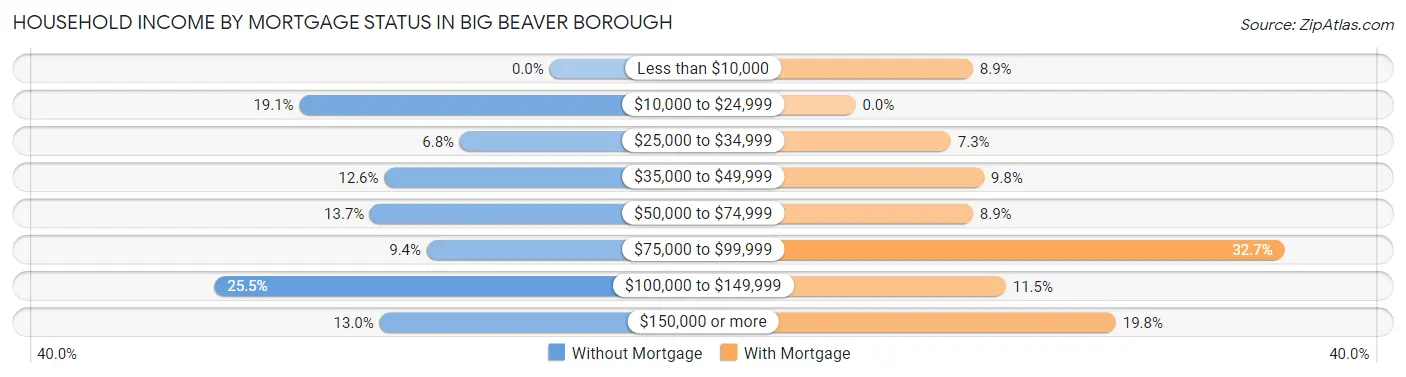
| Household Income | Without Mortgage | With Mortgage |
| Less than $10,000 | 0 (0.0%) | 32 (8.9%) |
| $10,000 to $24,999 | 53 (19.1%) | 0 (0.0%) |
| $25,000 to $34,999 | 19 (6.8%) | 26 (7.3%) |
| $35,000 to $49,999 | 35 (12.6%) | 35 (9.8%) |
| $50,000 to $74,999 | 38 (13.7%) | 32 (8.9%) |
| $75,000 to $99,999 | 26 (9.3%) | 117 (32.7%) |
| $100,000 to $149,999 | 71 (25.5%) | 41 (11.5%) |
| $150,000 or more | 36 (13.0%) | 71 (19.8%) |
| Total | 278 (100.0%) | 358 (100.0%) |
Property Value to Household Income Ratio in Big Beaver borough
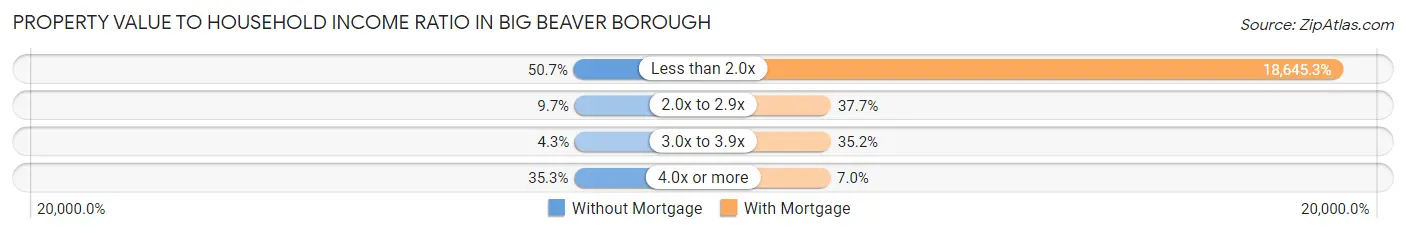
| Value-to-Income Ratio | Without Mortgage | With Mortgage |
| Less than 2.0x | 141 (50.7%) | 66,750 (18,645.2%) |
| 2.0x to 2.9x | 27 (9.7%) | 135 (37.7%) |
| 3.0x to 3.9x | 12 (4.3%) | 126 (35.2%) |
| 4.0x or more | 98 (35.2%) | 25 (7.0%) |
| Total | 278 (100.0%) | 358 (100.0%) |
Real Estate Taxes by Mortgage Status in Big Beaver borough
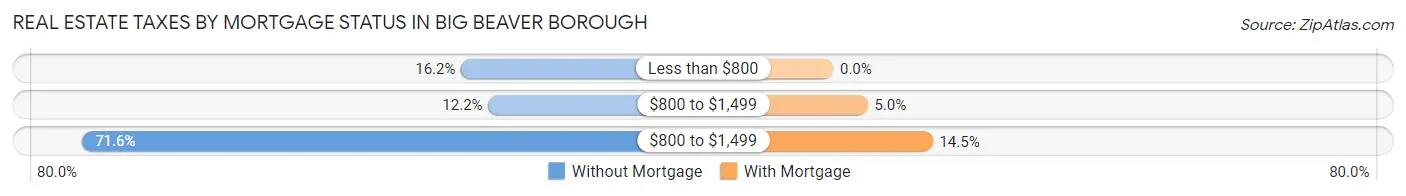
| Property Taxes | Without Mortgage | With Mortgage |
| Less than $800 | 45 (16.2%) | 0 (0.0%) |
| $800 to $1,499 | 34 (12.2%) | 18 (5.0%) |
| $800 to $1,499 | 199 (71.6%) | 52 (14.5%) |
| Total | 278 (100.0%) | 358 (100.0%) |
Health & Disability in Big Beaver borough
Health Insurance Coverage by Age in Big Beaver borough
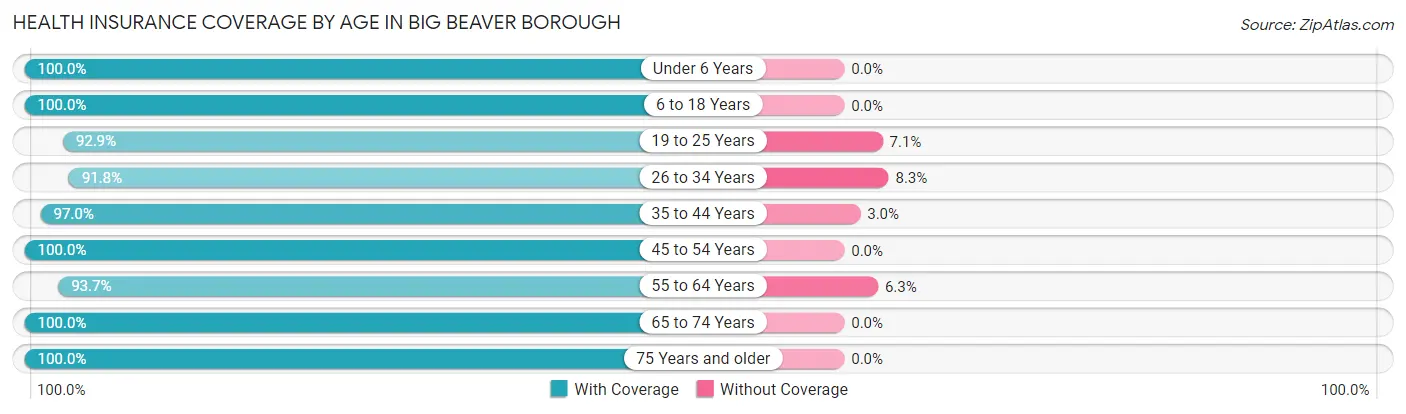
| Age Bracket | With Coverage | Without Coverage |
| Under 6 Years | 60 (100.0%) | 0 (0.0%) |
| 6 to 18 Years | 202 (100.0%) | 0 (0.0%) |
| 19 to 25 Years | 91 (92.9%) | 7 (7.1%) |
| 26 to 34 Years | 178 (91.7%) | 16 (8.3%) |
| 35 to 44 Years | 163 (97.0%) | 5 (3.0%) |
| 45 to 54 Years | 164 (100.0%) | 0 (0.0%) |
| 55 to 64 Years | 418 (93.7%) | 28 (6.3%) |
| 65 to 74 Years | 307 (100.0%) | 0 (0.0%) |
| 75 Years and older | 157 (100.0%) | 0 (0.0%) |
| Total | 1,740 (96.9%) | 56 (3.1%) |
Health Insurance Coverage by Citizenship Status in Big Beaver borough
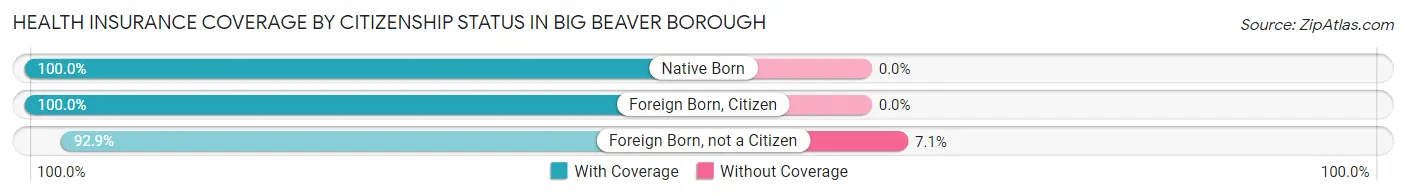
| Citizenship Status | With Coverage | Without Coverage |
| Native Born | 60 (100.0%) | 0 (0.0%) |
| Foreign Born, Citizen | 202 (100.0%) | 0 (0.0%) |
| Foreign Born, not a Citizen | 91 (92.9%) | 7 (7.1%) |
Health Insurance Coverage by Household Income in Big Beaver borough
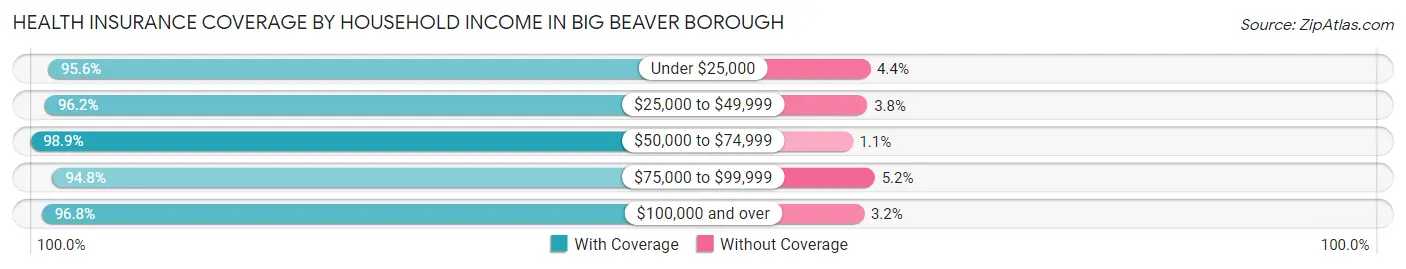
| Household Income | With Coverage | Without Coverage |
| Under $25,000 | 131 (95.6%) | 6 (4.4%) |
| $25,000 to $49,999 | 201 (96.2%) | 8 (3.8%) |
| $50,000 to $74,999 | 467 (98.9%) | 5 (1.1%) |
| $75,000 to $99,999 | 290 (94.8%) | 16 (5.2%) |
| $100,000 and over | 631 (96.8%) | 21 (3.2%) |
Public vs Private Health Insurance Coverage by Age in Big Beaver borough
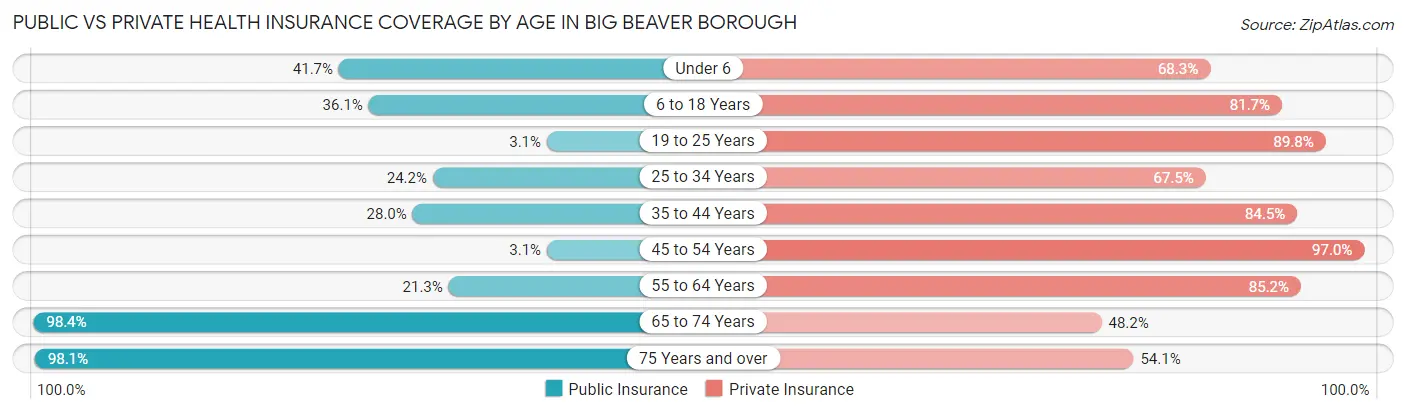
| Age Bracket | Public Insurance | Private Insurance |
| Under 6 | 25 (41.7%) | 41 (68.3%) |
| 6 to 18 Years | 73 (36.1%) | 165 (81.7%) |
| 19 to 25 Years | 3 (3.1%) | 88 (89.8%) |
| 25 to 34 Years | 47 (24.2%) | 131 (67.5%) |
| 35 to 44 Years | 47 (28.0%) | 142 (84.5%) |
| 45 to 54 Years | 5 (3.0%) | 159 (97.0%) |
| 55 to 64 Years | 95 (21.3%) | 380 (85.2%) |
| 65 to 74 Years | 302 (98.4%) | 148 (48.2%) |
| 75 Years and over | 154 (98.1%) | 85 (54.1%) |
| Total | 751 (41.8%) | 1,339 (74.6%) |
Disability Status by Sex by Age in Big Beaver borough
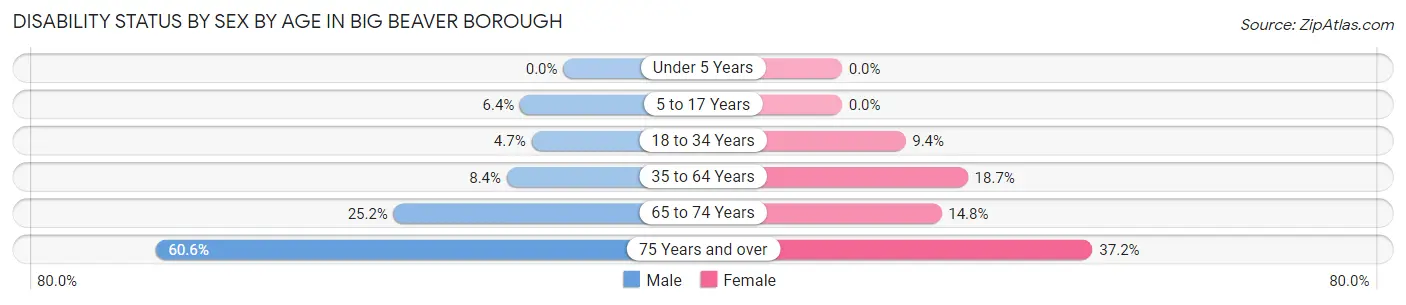
| Age Bracket | Male | Female |
| Under 5 Years | 0 (0.0%) | 0 (0.0%) |
| 5 to 17 Years | 5 (6.4%) | 0 (0.0%) |
| 18 to 34 Years | 7 (4.7%) | 15 (9.4%) |
| 35 to 64 Years | 37 (8.4%) | 63 (18.7%) |
| 65 to 74 Years | 33 (25.2%) | 26 (14.8%) |
| 75 Years and over | 43 (60.6%) | 32 (37.2%) |
Disability Class by Sex by Age in Big Beaver borough
Disability Class: Hearing Difficulty
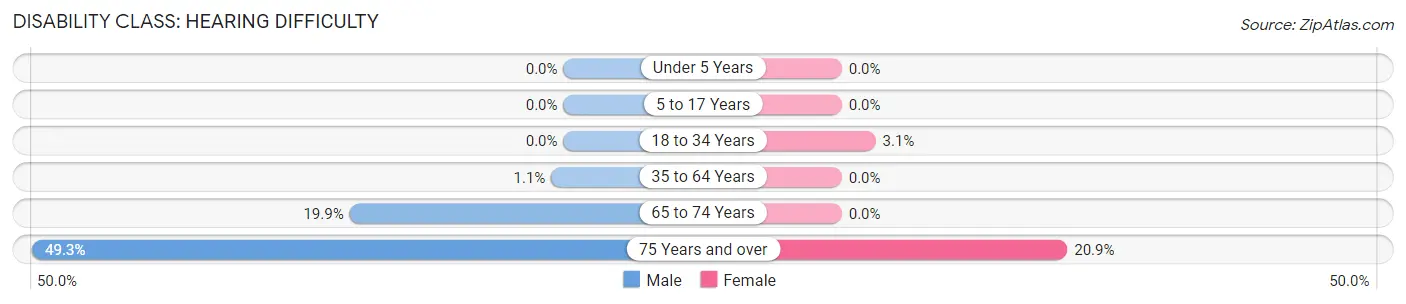
| Age Bracket | Male | Female |
| Under 5 Years | 0 (0.0%) | 0 (0.0%) |
| 5 to 17 Years | 0 (0.0%) | 0 (0.0%) |
| 18 to 34 Years | 0 (0.0%) | 5 (3.1%) |
| 35 to 64 Years | 5 (1.1%) | 0 (0.0%) |
| 65 to 74 Years | 26 (19.9%) | 0 (0.0%) |
| 75 Years and over | 35 (49.3%) | 18 (20.9%) |
Disability Class: Vision Difficulty
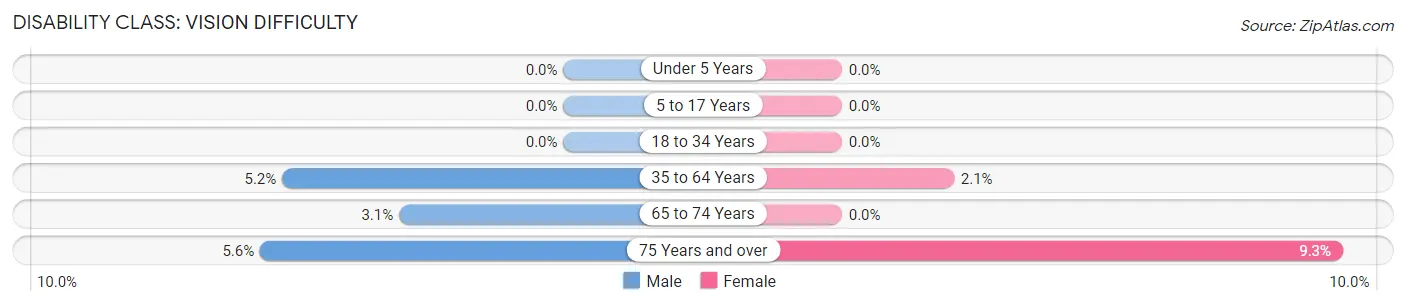
| Age Bracket | Male | Female |
| Under 5 Years | 0 (0.0%) | 0 (0.0%) |
| 5 to 17 Years | 0 (0.0%) | 0 (0.0%) |
| 18 to 34 Years | 0 (0.0%) | 0 (0.0%) |
| 35 to 64 Years | 23 (5.2%) | 7 (2.1%) |
| 65 to 74 Years | 4 (3.0%) | 0 (0.0%) |
| 75 Years and over | 4 (5.6%) | 8 (9.3%) |
Disability Class: Cognitive Difficulty
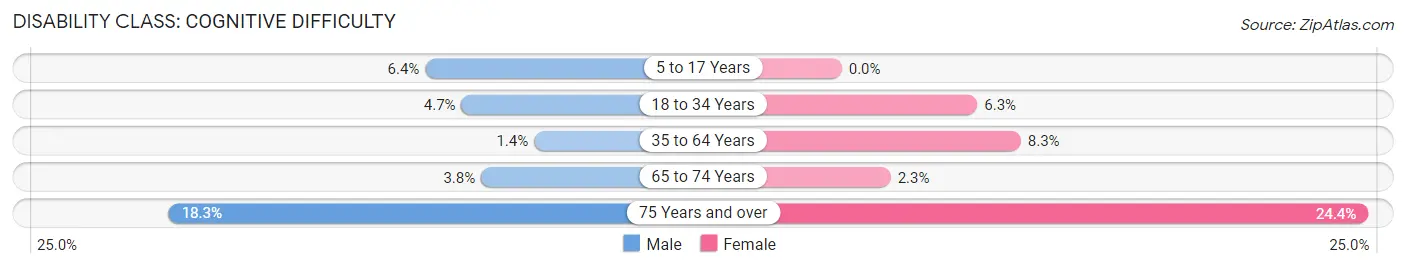
| Age Bracket | Male | Female |
| 5 to 17 Years | 5 (6.4%) | 0 (0.0%) |
| 18 to 34 Years | 7 (4.7%) | 10 (6.3%) |
| 35 to 64 Years | 6 (1.4%) | 28 (8.3%) |
| 65 to 74 Years | 5 (3.8%) | 4 (2.3%) |
| 75 Years and over | 13 (18.3%) | 21 (24.4%) |
Disability Class: Ambulatory Difficulty
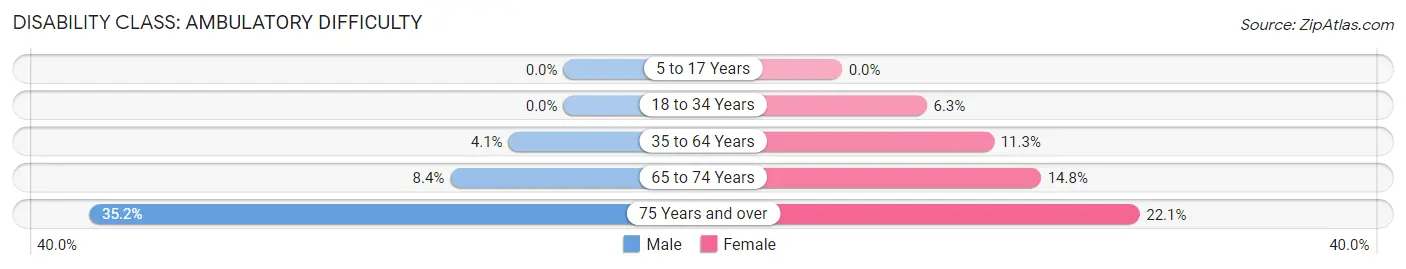
| Age Bracket | Male | Female |
| 5 to 17 Years | 0 (0.0%) | 0 (0.0%) |
| 18 to 34 Years | 0 (0.0%) | 10 (6.3%) |
| 35 to 64 Years | 18 (4.1%) | 38 (11.3%) |
| 65 to 74 Years | 11 (8.4%) | 26 (14.8%) |
| 75 Years and over | 25 (35.2%) | 19 (22.1%) |
Disability Class: Self-Care Difficulty
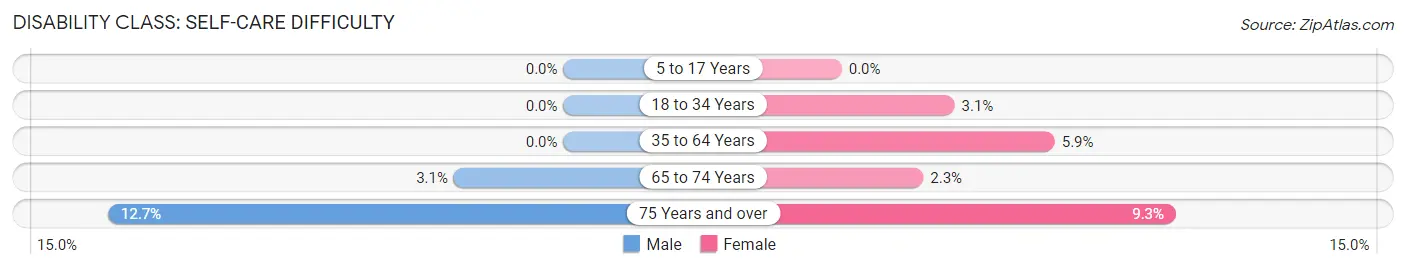
| Age Bracket | Male | Female |
| 5 to 17 Years | 0 (0.0%) | 0 (0.0%) |
| 18 to 34 Years | 0 (0.0%) | 5 (3.1%) |
| 35 to 64 Years | 0 (0.0%) | 20 (5.9%) |
| 65 to 74 Years | 4 (3.0%) | 4 (2.3%) |
| 75 Years and over | 9 (12.7%) | 8 (9.3%) |
Technology Access in Big Beaver borough
Computing Device Access in Big Beaver borough
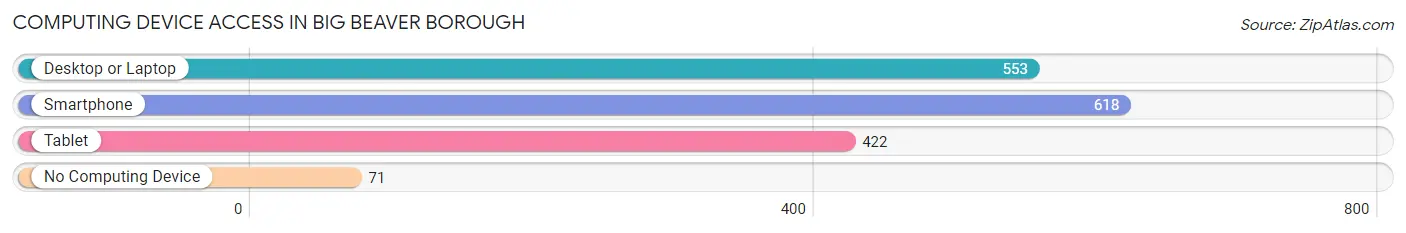
| Device Type | # Households | % Households |
| Desktop or Laptop | 553 | 76.1% |
| Smartphone | 618 | 85.0% |
| Tablet | 422 | 58.1% |
| No Computing Device | 71 | 9.8% |
| Total | 727 | 100.0% |
Internet Access in Big Beaver borough

| Internet Type | # Households | % Households |
| Dial-Up Internet | 4 | 0.5% |
| Broadband Home | 522 | 71.8% |
| Cellular Data Only | 76 | 10.4% |
| Satellite Internet | 16 | 2.2% |
| No Internet | 110 | 15.1% |
| Total | 727 | 100.0% |
Big Beaver borough Summary
Big Beaver Borough is a small borough located in Beaver County, Pennsylvania. It is situated in the northwest corner of the county, along the Ohio River. The borough has a population of 1,845 as of the 2010 census.
History
Big Beaver Borough was founded in 1802 and was originally known as Big Beaver Township. The name was changed to Big Beaver Borough in 1868. The borough was named after the Big Beaver Creek, which runs through the area. The creek was named after the large beaver population that once inhabited the area.
The first settlers in the area were mostly of German and English descent. The first settler was John Miller, who arrived in 1798. He built a log cabin and a grist mill on the banks of the Big Beaver Creek.
The borough was an important stop on the Underground Railroad, which was used to help slaves escape to freedom in the northern states. The borough was also home to a number of industries, including a sawmill, a grist mill, a tannery, and a distillery.
Geography
Big Beaver Borough is located at 40°45'N 80°17'W (40.75, -80.28). It has a total area of 1.2 square miles, all of which is land. The borough is located in the northwest corner of Beaver County, along the Ohio River. It is bordered by Big Beaver Township to the north, New Sewickley Township to the east, and Darlington Township to the south.
The borough is mostly flat, with some rolling hills in the northern part of the borough. The Big Beaver Creek runs through the borough, and there are several small ponds and lakes in the area.
Economy
The economy of Big Beaver Borough is largely based on agriculture and manufacturing. The borough is home to several small businesses, including a sawmill, a grist mill, a tannery, and a distillery.
The borough is also home to a number of small retail stores, restaurants, and other businesses. The borough is home to a number of small parks and recreational areas, including a public swimming pool, a golf course, and a number of hiking trails.
Demographics
As of the 2010 census, the population of Big Beaver Borough was 1,845. The racial makeup of the borough was 97.3% White, 0.9% African American, 0.2% Native American, 0.2% Asian, 0.1% from other races, and 1.3% from two or more races. Hispanic or Latino of any race were 0.7% of the population.
The median income for a household in the borough was $41,250, and the median income for a family was $50,000. The per capita income for the borough was $20,845. About 8.3% of families and 10.2% of the population were below the poverty line, including 14.3% of those under age 18 and 6.2% of those age 65 or over.
Common Questions
What is Per Capita Income in Big Beaver borough?
Per Capita income in Big Beaver borough is $35,344.
What is the Median Family Income in Big Beaver borough?
Median Family Income in Big Beaver borough is $82,031.
What is the Median Household income in Big Beaver borough?
Median Household Income in Big Beaver borough is $66,125.
What is Income or Wage Gap in Big Beaver borough?
Income or Wage Gap in Big Beaver borough is 25.0%.
Women in Big Beaver borough earn 75.0 cents for every dollar earned by a man.
What is Inequality or Gini Index in Big Beaver borough?
Inequality or Gini Index in Big Beaver borough is 0.37.
What is the Total Population of Big Beaver borough?
Total Population of Big Beaver borough is 1,796.
What is the Total Male Population of Big Beaver borough?
Total Male Population of Big Beaver borough is 880.
What is the Total Female Population of Big Beaver borough?
Total Female Population of Big Beaver borough is 916.
What is the Ratio of Males per 100 Females in Big Beaver borough?
There are 96.07 Males per 100 Females in Big Beaver borough.
What is the Ratio of Females per 100 Males in Big Beaver borough?
There are 104.09 Females per 100 Males in Big Beaver borough.
What is the Median Population Age in Big Beaver borough?
Median Population Age in Big Beaver borough is 55.3 Years.
What is the Average Family Size in Big Beaver borough
Average Family Size in Big Beaver borough is 2.9 People.
What is the Average Household Size in Big Beaver borough
Average Household Size in Big Beaver borough is 2.4 People.
How Large is the Labor Force in Big Beaver borough?
There are 882 People in the Labor Forcein in Big Beaver borough.
What is the Percentage of People in the Labor Force in Big Beaver borough?
55.6% of People are in the Labor Force in Big Beaver borough.
What is the Unemployment Rate in Big Beaver borough?
Unemployment Rate in Big Beaver borough is 10.0%.