Zip Codes with the Highest Percentage of Households with Income Above $100,000 in New York, NY

RELATED REPORTS & OPTIONS

Household Income | $100k+
Population
Families and Households
Female Fertility
Female Fertility (Unmarried)
Race (Community Size)
Race (Percentage)
Ancestry (Community Size)
AfghanAfricanAlbanianAlsatianAmericanApacheArabArgentineanArmenianAssyrian / Chaldean / SyriacAustralianAustrianBahamianBarbadianBasqueBelgianBelizeanBermudanBhutaneseBlackfeetBolivianBrazilianBritishBritish West IndianBulgarianBurmeseCajunCambodianCanadianCape VerdeanCarpatho RusynCelticCentral AmericanCentral American IndianCherokeeChickasawChileanChippewaChoctawColombianCosta RicanCreekCroatianCubanCypriotCzechCzechoslovakianDanishDelawareDominicanDutchDutch West IndianEastern EuropeanEcuadorianEgyptianEnglishEstonianEthiopianEuropeanFilipinoFinnishFrenchFrench American IndianFrench CanadianGermanGhanaianGreekGuamanian / ChamorroGuatemalanGuyaneseHaitianHmongHonduranHungarianIcelanderIndian (Asian)IndonesianIranianIraqiIrishIroquoisIsraeliItalianJamaicanJapaneseJordanianKenyanKoreanLaotianLatvianLebaneseLiberianLithuanianLuxembourgerMacedonianMalaysianMalteseMexicanMexican American IndianMongolianMoroccanNative HawaiianNew ZealanderNicaraguanNigerianNorthern EuropeanNorwegianOkinawanPakistaniPalestinianPanamanianParaguayanPennsylvania GermanPeruvianPolishPortuguesePuebloPuerto RicanRomanianRussianSalvadoranSamoanScandinavianScotch-IrishScottishSenegaleseSerbianSierra LeoneanSiouxSlavicSlovakSloveneSomaliSouth AfricanSouth AmericanSouth American IndianSoviet UnionSpaniardSpanishSpanish AmericanSpanish American IndianSri LankanSubsaharan AfricanSudaneseSwedishSwissSyrianThaiTrinidadian and TobagonianTurkishU.S. Virgin IslanderUgandanUkrainianUruguayanVenezuelanVietnameseWelshWest IndianYugoslavianZimbabwean
Ancestry (Percentage)
AfghanAfricanAlbanianAlsatianAmericanApacheArabArgentineanArmenianAssyrian / Chaldean / SyriacAustralianAustrianBahamianBarbadianBasqueBelgianBelizeanBermudanBhutaneseBlackfeetBolivianBrazilianBritishBritish West IndianBulgarianBurmeseCajunCambodianCanadianCape VerdeanCarpatho RusynCelticCentral AmericanCentral American IndianCherokeeChickasawChileanChippewaChoctawColombianCosta RicanCreekCroatianCubanCypriotCzechCzechoslovakianDanishDelawareDominicanDutchDutch West IndianEastern EuropeanEcuadorianEgyptianEnglishEstonianEthiopianEuropeanFilipinoFinnishFrenchFrench American IndianFrench CanadianGermanGhanaianGreekGuamanian / ChamorroGuatemalanGuyaneseHaitianHmongHonduranHungarianIcelanderIndian (Asian)IndonesianIranianIraqiIrishIroquoisIsraeliItalianJamaicanJapaneseJordanianKenyanKoreanLaotianLatvianLebaneseLiberianLithuanianLuxembourgerMacedonianMalaysianMalteseMexicanMexican American IndianMongolianMoroccanNative HawaiianNew ZealanderNicaraguanNigerianNorthern EuropeanNorwegianOkinawanPakistaniPalestinianPanamanianParaguayanPennsylvania GermanPeruvianPolishPortuguesePuebloPuerto RicanRomanianRussianSalvadoranSamoanScandinavianScotch-IrishScottishSenegaleseSerbianSierra LeoneanSiouxSlavicSlovakSloveneSomaliSouth AfricanSouth AmericanSouth American IndianSoviet UnionSpaniardSpanishSpanish AmericanSpanish American IndianSri LankanSubsaharan AfricanSudaneseSwedishSwissSyrianThaiTrinidadian and TobagonianTurkishU.S. Virgin IslanderUgandanUkrainianUruguayanVenezuelanVietnameseWelshWest IndianYugoslavianZimbabwean
Immigrant Origin (Total)
AfghanistanAfricaAlbaniaArgentinaArmeniaAsiaAustraliaAustriaBahamasBangladeshBarbadosBelarusBelgiumBelizeBoliviaBosnia and HerzegovinaBrazilBulgariaBurma / MyanmarCambodiaCameroonCanadaCaribbeanCentral AmericaChileChinaColombiaCongoCosta RicaCroatiaCubaCzechoslovakiaDenmarkDominicaDominican RepublicEastern AfricaEastern AsiaEastern EuropeEcuadorEgyptEl SalvadorEnglandEritreaEthiopiaEuropeFranceGermanyGhanaGreeceGrenadaGuatemalaGuyanaHaitiHondurasHong KongHungaryIndiaIndonesiaIranIraqIrelandIsraelItalyJamaicaJapanJordanKazakhstanKenyaKoreaKuwaitLatin AmericaLatviaLebanonLiberiaLithuaniaMalaysiaMexicoMiddle AfricaMoldovaMoroccoNepalNetherlandsNicaraguaNigeriaNorth MacedoniaNorthern AfricaNorthern EuropeNorwayOceaniaPakistanPanamaPeruPhilippinesPolandPortugalRomaniaRussiaSaudi ArabiaScotlandSenegalSerbiaSierra LeoneSingaporeSomaliaSouth AfricaSouth AmericaSouth Central AsiaSouth Eastern AsiaSouthern EuropeSpainSri LankaSt. Vincent and the GrenadinesSudanSwedenSwitzerlandSyriaTaiwanThailandTrinidad and TobagoTurkeyUgandaUkraineUruguayUzbekistanVenezuelaVietnamWest IndiesWestern AfricaWestern AsiaWestern EuropeYemenZaireZimbabwe
Immigrant Origin (Percentage)
AfghanistanAfricaAlbaniaArgentinaArmeniaAsiaAustraliaAustriaBahamasBangladeshBarbadosBelarusBelgiumBelizeBoliviaBosnia and HerzegovinaBrazilBulgariaBurma / MyanmarCambodiaCameroonCanadaCaribbeanCentral AmericaChileChinaColombiaCongoCosta RicaCroatiaCubaCzechoslovakiaDenmarkDominicaDominican RepublicEastern AfricaEastern AsiaEastern EuropeEcuadorEgyptEl SalvadorEnglandEritreaEthiopiaEuropeFranceGermanyGhanaGreeceGrenadaGuatemalaGuyanaHaitiHondurasHong KongHungaryIndiaIndonesiaIranIraqIrelandIsraelItalyJamaicaJapanJordanKazakhstanKenyaKoreaKuwaitLatin AmericaLatviaLebanonLiberiaLithuaniaMalaysiaMexicoMiddle AfricaMoldovaMoroccoNepalNetherlandsNicaraguaNigeriaNorth MacedoniaNorthern AfricaNorthern EuropeNorwayOceaniaPakistanPanamaPeruPhilippinesPolandPortugalRomaniaRussiaSaudi ArabiaScotlandSenegalSerbiaSierra LeoneSingaporeSomaliaSouth AfricaSouth AmericaSouth Central AsiaSouth Eastern AsiaSouthern EuropeSpainSri LankaSt. Vincent and the GrenadinesSudanSwedenSwitzerlandSyriaTaiwanThailandTrinidad and TobagoTurkeyUgandaUkraineUruguayUzbekistanVenezuelaVietnamWest IndiesWestern AfricaWestern AsiaWestern EuropeYemenZaireZimbabwe
Income
Income (Families)
Income (Households)
Poverty
Poverty (Families)
Unemployment
Employment Occupations
Employment Industries
Employer Class
Commute Time
Commute Means
School Enrollment
Education by Degree Field
Occupancy
Finances
Physical Characteristics
New York
Compare Zip Codes
Comparison Subject

Map of Zip Codes with the Highest Percentage of Households with Income Above $100,000 in New York

20.0%
100.0%
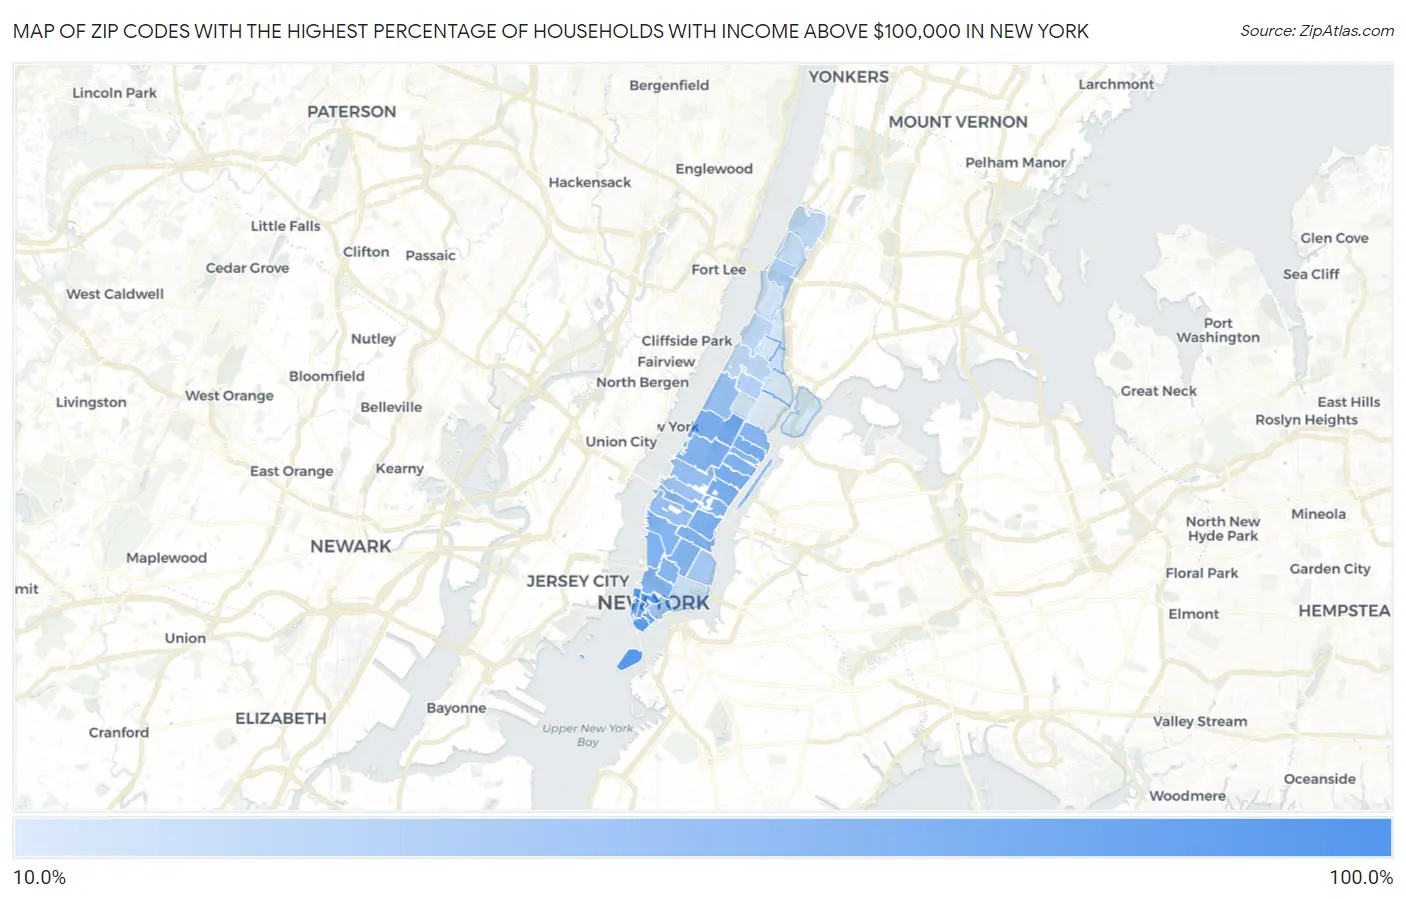
Zip Codes with the Highest Percentage of Households with Income Above $100,000 in New York Map

Zip Codes with the Highest Percentage of Households with Income Above $100,000 in New York, NY

Zip Code Households with Income > $100k vs State vs National
1. 10279 100.0% 41.7% (+58.3)#2 37.3% (+62.7)#30
2. 10282 92.7% 41.7% (+51.0)#14 37.3% (+55.4)#161
3. 10007 87.2% 41.7% (+45.5)#18 37.3% (+49.9)#201
4. 10004 86.0% 41.7% (+44.3)#21 37.3% (+48.7)#216
5. 10280 81.3% 41.7% (+39.6)#31 37.3% (+44.0)#300
6. 10005 79.1% 41.7% (+37.4)#41 37.3% (+41.8)#380
7. 10006 74.0% 41.7% (+32.3)#68 37.3% (+36.7)#637
8. 10065 68.8% 41.7% (+27.1)#118 37.3% (+31.5)#1,075
9. 10022 68.5% 41.7% (+26.8)#121 37.3% (+31.2)#1,106
10. 10024 68.1% 41.7% (+26.4)#125 37.3% (+30.8)#1,147
11. 10028 67.8% 41.7% (+26.1)#130 37.3% (+30.5)#1,185
12. 10010 65.9% 41.7% (+24.2)#155 37.3% (+28.6)#1,407
13. 10016 65.7% 41.7% (+24.0)#158 37.3% (+28.4)#1,429
14. 10021 63.8% 41.7% (+22.1)#184 37.3% (+26.5)#1,708
15. 10014 63.2% 41.7% (+21.5)#190 37.3% (+25.9)#1,805
16. 10013 63.2% 41.7% (+21.5)#191 37.3% (+25.9)#1,806
17. 10023 63.0% 41.7% (+21.3)#197 37.3% (+25.7)#1,833
18. 10011 63.0% 41.7% (+21.3)#198 37.3% (+25.7)#1,834
19. 10003 62.5% 41.7% (+20.8)#207 37.3% (+25.2)#1,925
20. 10075 62.2% 41.7% (+20.5)#212 37.3% (+24.9)#1,970
21. 10018 61.6% 41.7% (+19.9)#225 37.3% (+24.3)#2,066
22. 10017 61.2% 41.7% (+19.5)#232 37.3% (+23.9)#2,145
23. 10128 60.5% 41.7% (+18.8)#245 37.3% (+23.2)#2,260
24. 10012 60.2% 41.7% (+18.5)#250 37.3% (+22.9)#2,320
25. 10069 59.0% 41.7% (+17.3)#278 37.3% (+21.7)#2,570
26. 10044 54.3% 41.7% (+12.6)#371 37.3% (+17.0)#3,643
27. 10019 53.6% 41.7% (+11.9)#382 37.3% (+16.3)#3,798
28. 10025 52.8% 41.7% (+11.1)#395 37.3% (+15.5)#4,012
29. 10001 52.2% 41.7% (+10.5)#406 37.3% (+14.9)#4,187
30. 10162 51.6% 41.7% (+9.90)#421 37.3% (+14.3)#4,382
31. 10036 50.6% 41.7% (+8.90)#443 37.3% (+13.3)#4,656
32. 10038 49.7% 41.7% (+8.00)#462 37.3% (+12.4)#4,952
33. 10009 43.6% 41.7% (+1.90)#608 37.3% (+6.30)#7,158
34. 10033 39.1% 41.7% (-2.60)#757 37.3% (+1.80)#9,361
35. 10026 37.5% 41.7% (-4.20)#803 37.3% (+0.200)#10,250
36. 10027 34.3% 41.7% (-7.40)#919 37.3% (-3.00)#12,191
37. 10031 34.1% 41.7% (-7.60)#927 37.3% (-3.20)#12,315
38. 10034 31.6% 41.7% (-10.1)#1,045 37.3% (-5.70)#14,163
39. 10040 29.5% 41.7% (-12.2)#1,135 37.3% (-7.80)#15,820
40. 10002 26.8% 41.7% (-14.9)#1,251 37.3% (-10.5)#18,133
41. 10037 26.3% 41.7% (-15.4)#1,271 37.3% (-11.0)#18,596
42. 10032 25.1% 41.7% (-16.6)#1,335 37.3% (-12.2)#19,647
43. 10035 22.6% 41.7% (-19.1)#1,427 37.3% (-14.7)#21,886
44. 10039 21.9% 41.7% (-19.8)#1,459 37.3% (-15.4)#22,493
45. 10030 21.6% 41.7% (-20.1)#1,465 37.3% (-15.7)#22,718
46. 10029 20.0% 41.7% (-21.7)#1,507 37.3% (-17.3)#24,009

Common Questions

What are the Top 10 Zip Codes with the Highest Percentage of Households with Income Above $100,000 in New York, NY?
Top 10 Zip Codes with the Highest Percentage of Households with Income Above $100,000 in New York, NY are:
#1
100.0%
#2
92.7%
#3
87.2%
#4
86.0%
#5
81.3%
#6
79.1%
#7
74.0%
#8
68.8%
#9
68.5%
#10
68.1%
What zip code has the Highest Percentage of Households with Income Above $100,000 in New York, NY?
10279 has the Highest Percentage of Households with Income Above $100,000 in New York, NY with 100.0%.
What is the Percentage of Households with Income Above $100,000 in New York, NY?
Percentage of Households with Income Above $100,000 in New York is 39.9%.
What is the Percentage of Households with Income Above $100,000 in New York?
Percentage of Households with Income Above $100,000 in New York is 41.7%.
What is the Percentage of Households with Income Above $100,000 in the United States?
Percentage of Households with Income Above $100,000 in the United States is 37.3%.