Zip Codes with the Highest Percentage of Households with Income Above $100,000 in New York
RELATED REPORTS & OPTIONS
Household Income | $100k+
New York
Compare Zip Codes
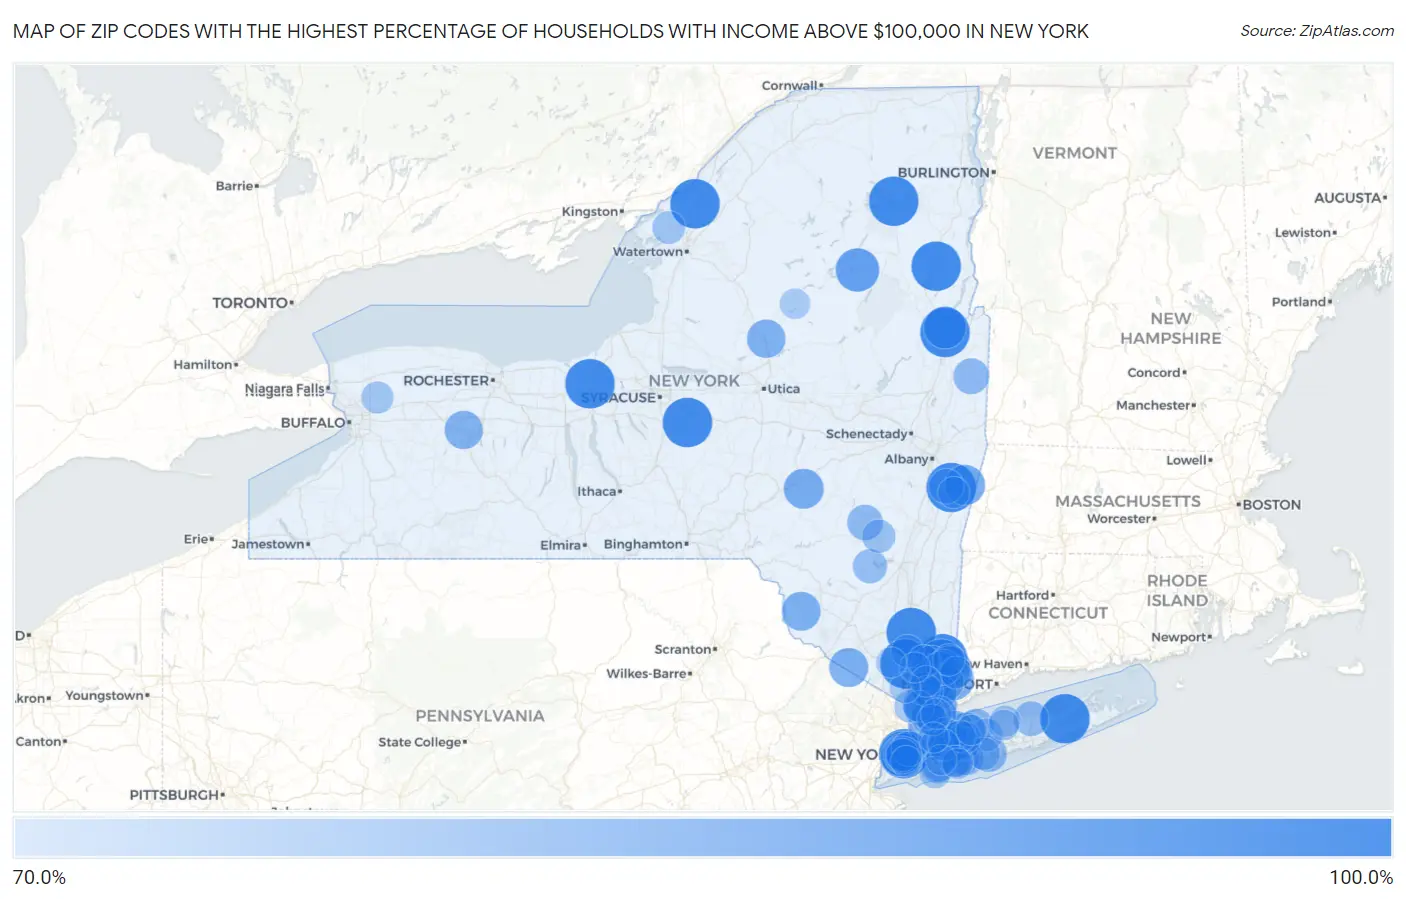
Map of Zip Codes with the Highest Percentage of Households with Income Above $100,000 in New York
70.0%
100.0%
Zip Codes with the Highest Percentage of Households with Income Above $100,000 in New York
| Zip Code | Households with Income > $100k | vs State | vs National | |
| 1. | 12977 | 100.0% | 41.7%(+58.3)#1 | 37.3%(+62.7)#7 |
| 2. | 10279 | 100.0% | 41.7%(+58.3)#2 | 37.3%(+62.7)#30 |
| 3. | 11947 | 100.0% | 41.7%(+58.3)#3 | 37.3%(+62.7)#33 |
| 4. | 10519 | 100.0% | 41.7%(+58.3)#4 | 37.3%(+62.7)#40 |
| 5. | 12872 | 100.0% | 41.7%(+58.3)#5 | 37.3%(+62.7)#53 |
| 6. | 12820 | 100.0% | 41.7%(+58.3)#6 | 37.3%(+62.7)#55 |
| 7. | 13675 | 100.0% | 41.7%(+58.3)#7 | 37.3%(+62.7)#70 |
| 8. | 13051 | 100.0% | 41.7%(+58.3)#8 | 37.3%(+62.7)#93 |
| 9. | 13154 | 100.0% | 41.7%(+58.3)#9 | 37.3%(+62.7)#101 |
| 10. | 12527 | 100.0% | 41.7%(+58.3)#10 | 37.3%(+62.7)#129 |
| 11. | 10911 | 100.0% | 41.7%(+58.3)#11 | 37.3%(+62.7)#135 |
| 12. | 12115 | 99.9% | 41.7%(+58.2)#12 | 37.3%(+62.6)#148 |
| 13. | 10578 | 95.6% | 41.7%(+53.9)#13 | 37.3%(+58.3)#152 |
| 14. | 10282 | 92.7% | 41.7%(+51.0)#14 | 37.3%(+55.4)#161 |
| 15. | 12812 | 90.7% | 41.7%(+49.0)#15 | 37.3%(+53.4)#171 |
| 16. | 12844 | 88.6% | 41.7%(+46.9)#16 | 37.3%(+51.3)#188 |
| 17. | 10501 | 87.5% | 41.7%(+45.8)#17 | 37.3%(+50.2)#200 |
| 18. | 10007 | 87.2% | 41.7%(+45.5)#18 | 37.3%(+49.9)#201 |
| 19. | 10577 | 87.1% | 41.7%(+45.4)#19 | 37.3%(+49.8)#202 |
| 20. | 10597 | 86.3% | 41.7%(+44.6)#20 | 37.3%(+49.0)#211 |
| 21. | 10004 | 86.0% | 41.7%(+44.3)#21 | 37.3%(+48.7)#216 |
| 22. | 10576 | 85.9% | 41.7%(+44.2)#22 | 37.3%(+48.6)#218 |
| 23. | 12195 | 85.7% | 41.7%(+44.0)#23 | 37.3%(+48.4)#219 |
| 24. | 10514 | 85.6% | 41.7%(+43.9)#24 | 37.3%(+48.3)#221 |
| 25. | 13751 | 85.2% | 41.7%(+43.5)#25 | 37.3%(+47.9)#228 |
| 26. | 11568 | 84.9% | 41.7%(+43.2)#26 | 37.3%(+47.6)#232 |
| 27. | 10969 | 83.9% | 41.7%(+42.2)#27 | 37.3%(+46.6)#247 |
| 28. | 12720 | 83.4% | 41.7%(+41.7)#28 | 37.3%(+46.1)#256 |
| 29. | 13301 | 82.8% | 41.7%(+41.1)#29 | 37.3%(+45.5)#264 |
| 30. | 14539 | 82.6% | 41.7%(+40.9)#30 | 37.3%(+45.3)#269 |
| 31. | 10280 | 81.3% | 41.7%(+39.6)#31 | 37.3%(+44.0)#300 |
| 32. | 10506 | 81.3% | 41.7%(+39.6)#32 | 37.3%(+44.0)#301 |
| 33. | 10533 | 81.1% | 41.7%(+39.4)#33 | 37.3%(+43.8)#307 |
| 34. | 11724 | 80.7% | 41.7%(+39.0)#34 | 37.3%(+43.4)#322 |
| 35. | 10536 | 80.3% | 41.7%(+38.6)#35 | 37.3%(+43.0)#334 |
| 36. | 10803 | 80.1% | 41.7%(+38.4)#36 | 37.3%(+42.8)#338 |
| 37. | 11030 | 79.8% | 41.7%(+38.1)#37 | 37.3%(+42.5)#350 |
| 38. | 11718 | 79.7% | 41.7%(+38.0)#38 | 37.3%(+42.4)#356 |
| 39. | 10504 | 79.5% | 41.7%(+37.8)#39 | 37.3%(+42.2)#363 |
| 40. | 11765 | 79.2% | 41.7%(+37.5)#40 | 37.3%(+41.9)#375 |
| 41. | 10005 | 79.1% | 41.7%(+37.4)#41 | 37.3%(+41.8)#380 |
| 42. | 12823 | 78.9% | 41.7%(+37.2)#42 | 37.3%(+41.6)#385 |
| 43. | 10502 | 78.8% | 41.7%(+37.1)#43 | 37.3%(+41.5)#388 |
| 44. | 12452 | 78.6% | 41.7%(+36.9)#44 | 37.3%(+41.3)#398 |
| 45. | 10580 | 78.5% | 41.7%(+36.8)#45 | 37.3%(+41.2)#400 |
| 46. | 10526 | 78.1% | 41.7%(+36.4)#46 | 37.3%(+40.8)#421 |
| 47. | 11721 | 77.4% | 41.7%(+35.7)#47 | 37.3%(+40.1)#448 |
| 48. | 11786 | 77.3% | 41.7%(+35.6)#48 | 37.3%(+40.0)#451 |
| 49. | 12132 | 77.2% | 41.7%(+35.5)#49 | 37.3%(+39.9)#462 |
| 50. | 11109 | 77.1% | 41.7%(+35.4)#50 | 37.3%(+39.8)#465 |
| 51. | 11577 | 76.7% | 41.7%(+35.0)#51 | 37.3%(+39.4)#481 |
| 52. | 10804 | 76.6% | 41.7%(+34.9)#52 | 37.3%(+39.3)#489 |
| 53. | 12494 | 76.5% | 41.7%(+34.8)#53 | 37.3%(+39.2)#500 |
| 54. | 11598 | 76.1% | 41.7%(+34.4)#54 | 37.3%(+38.8)#516 |
| 55. | 11753 | 76.0% | 41.7%(+34.3)#55 | 37.3%(+38.7)#521 |
| 56. | 10583 | 75.8% | 41.7%(+34.1)#56 | 37.3%(+38.5)#528 |
| 57. | 12450 | 75.0% | 41.7%(+33.3)#57 | 37.3%(+37.7)#575 |
| 58. | 11557 | 74.8% | 41.7%(+33.1)#58 | 37.3%(+37.5)#588 |
| 59. | 10510 | 74.7% | 41.7%(+33.0)#59 | 37.3%(+37.4)#590 |
| 60. | 11783 | 74.6% | 41.7%(+32.9)#60 | 37.3%(+37.3)#596 |
| 61. | 11725 | 74.5% | 41.7%(+32.8)#61 | 37.3%(+37.2)#606 |
| 62. | 13632 | 74.5% | 41.7%(+32.8)#62 | 37.3%(+37.2)#609 |
| 63. | 11762 | 74.4% | 41.7%(+32.7)#63 | 37.3%(+37.1)#612 |
| 64. | 10996 | 74.4% | 41.7%(+32.7)#64 | 37.3%(+37.1)#613 |
| 65. | 10588 | 74.2% | 41.7%(+32.5)#65 | 37.3%(+36.9)#623 |
| 66. | 11576 | 74.1% | 41.7%(+32.4)#66 | 37.3%(+36.8)#628 |
| 67. | 11803 | 74.0% | 41.7%(+32.3)#67 | 37.3%(+36.7)#633 |
| 68. | 10006 | 74.0% | 41.7%(+32.3)#68 | 37.3%(+36.7)#637 |
| 69. | 11579 | 73.9% | 41.7%(+32.2)#69 | 37.3%(+36.6)#644 |
| 70. | 10983 | 73.7% | 41.7%(+32.0)#70 | 37.3%(+36.4)#659 |
| 71. | 11795 | 73.6% | 41.7%(+31.9)#71 | 37.3%(+36.3)#665 |
| 72. | 11530 | 73.4% | 41.7%(+31.7)#72 | 37.3%(+36.1)#674 |
| 73. | 10590 | 73.2% | 41.7%(+31.5)#73 | 37.3%(+35.9)#689 |
| 74. | 14032 | 73.1% | 41.7%(+31.4)#74 | 37.3%(+35.8)#693 |
| 75. | 11545 | 72.9% | 41.7%(+31.2)#75 | 37.3%(+35.6)#711 |
| 76. | 11797 | 72.9% | 41.7%(+31.2)#76 | 37.3%(+35.6)#713 |
| 77. | 11020 | 72.9% | 41.7%(+31.2)#77 | 37.3%(+35.6)#714 |
| 78. | 10560 | 72.7% | 41.7%(+31.0)#78 | 37.3%(+35.4)#726 |
| 79. | 11509 | 72.7% | 41.7%(+31.0)#79 | 37.3%(+35.4)#728 |
| 80. | 11710 | 72.4% | 41.7%(+30.7)#80 | 37.3%(+35.1)#744 |
| 81. | 11791 | 72.4% | 41.7%(+30.7)#81 | 37.3%(+35.1)#746 |
| 82. | 12136 | 72.3% | 41.7%(+30.6)#82 | 37.3%(+35.0)#757 |
| 83. | 11507 | 72.1% | 41.7%(+30.4)#83 | 37.3%(+34.8)#766 |
| 84. | 11566 | 71.9% | 41.7%(+30.2)#84 | 37.3%(+34.6)#781 |
| 85. | 10570 | 71.9% | 41.7%(+30.2)#85 | 37.3%(+34.6)#783 |
| 86. | 10503 | 71.9% | 41.7%(+30.2)#86 | 37.3%(+34.6)#789 |
| 87. | 10538 | 71.8% | 41.7%(+30.1)#87 | 37.3%(+34.5)#792 |
| 88. | 11733 | 71.8% | 41.7%(+30.1)#88 | 37.3%(+34.5)#793 |
| 89. | 11215 | 71.6% | 41.7%(+29.9)#89 | 37.3%(+34.3)#812 |
| 90. | 10546 | 71.5% | 41.7%(+29.8)#90 | 37.3%(+34.2)#829 |
| 91. | 10956 | 71.2% | 41.7%(+29.5)#91 | 37.3%(+33.9)#846 |
| 92. | 10528 | 71.2% | 41.7%(+29.5)#92 | 37.3%(+33.9)#851 |
| 93. | 11793 | 71.1% | 41.7%(+29.4)#93 | 37.3%(+33.8)#858 |
| 94. | 11790 | 71.1% | 41.7%(+29.4)#94 | 37.3%(+33.8)#863 |
| 95. | 11743 | 70.9% | 41.7%(+29.2)#95 | 37.3%(+33.6)#879 |
| 96. | 11565 | 70.9% | 41.7%(+29.2)#96 | 37.3%(+33.6)#884 |
| 97. | 13420 | 70.9% | 41.7%(+29.2)#97 | 37.3%(+33.6)#886 |
| 98. | 11024 | 70.8% | 41.7%(+29.1)#98 | 37.3%(+33.5)#890 |
| 99. | 10567 | 70.7% | 41.7%(+29.0)#99 | 37.3%(+33.4)#895 |
| 100. | 10917 | 70.7% | 41.7%(+29.0)#100 | 37.3%(+33.4)#901 |
Common Questions
What are the Top 10 Zip Codes with the Highest Percentage of Households with Income Above $100,000 in New York?
Top 10 Zip Codes with the Highest Percentage of Households with Income Above $100,000 in New York are:
What zip code has the Highest Percentage of Households with Income Above $100,000 in New York?
12977 has the Highest Percentage of Households with Income Above $100,000 in New York with 100.0%.
What is the Percentage of Households with Income Above $100,000 in the State of New York?
Percentage of Households with Income Above $100,000 in New York is 41.7%.
What is the Percentage of Households with Income Above $100,000 in the United States?
Percentage of Households with Income Above $100,000 in the United States is 37.3%.