Zip Codes with the Highest Percentage of Households with Income Above $100,000 in Albany, NY

RELATED REPORTS & OPTIONS

Household Income | $100k+
Population
Families and Households
Female Fertility
Female Fertility (Unmarried)
Race (Community Size)
Race (Percentage)
Ancestry (Community Size)
AfghanAfricanAlbanianAmericanArabArgentineanArmenianAustrianBahamianBarbadianBelgianBhutaneseBlackfeetBolivianBrazilianBritishBritish West IndianBulgarianBurmeseCanadianCelticCentral AmericanCentral American IndianCherokeeChileanColombianCosta RicanCreekCroatianCubanCzechCzechoslovakianDanishDominicanDutchEastern EuropeanEcuadorianEgyptianEnglishEthiopianEuropeanFinnishFrenchFrench American IndianFrench CanadianGermanGhanaianGreekGuatemalanGuyaneseHaitianHonduranHungarianIndian (Asian)IndonesianIranianIraqiIrishIroquoisIsraeliItalianJamaicanJapaneseJordanianKoreanLaotianLatvianLebaneseLithuanianMacedonianMexicanMexican American IndianMongolianMoroccanNigerianNorthern EuropeanNorwegianPakistaniPanamanianPeruvianPolishPortuguesePuerto RicanRomanianRussianSalvadoranSamoanScandinavianScotch-IrishScottishSenegaleseSerbianSlovakSloveneSouth AfricanSouth AmericanSpaniardSpanishSri LankanSubsaharan AfricanSudaneseSwedishSwissSyrianThaiTrinidadian and TobagonianTurkishUkrainianUruguayanVietnameseWelshWest IndianYugoslavian
Ancestry (Percentage)
AfghanAfricanAlbanianAmericanArabArgentineanArmenianAustrianBahamianBarbadianBelgianBhutaneseBlackfeetBolivianBrazilianBritishBritish West IndianBulgarianBurmeseCanadianCelticCentral AmericanCentral American IndianCherokeeChileanColombianCosta RicanCreekCroatianCubanCzechCzechoslovakianDanishDominicanDutchEastern EuropeanEcuadorianEgyptianEnglishEthiopianEuropeanFinnishFrenchFrench American IndianFrench CanadianGermanGhanaianGreekGuatemalanGuyaneseHaitianHonduranHungarianIndian (Asian)IndonesianIranianIraqiIrishIroquoisIsraeliItalianJamaicanJapaneseJordanianKoreanLaotianLatvianLebaneseLithuanianMacedonianMexicanMexican American IndianMongolianMoroccanNigerianNorthern EuropeanNorwegianPakistaniPanamanianPeruvianPolishPortuguesePuerto RicanRomanianRussianSalvadoranSamoanScandinavianScotch-IrishScottishSenegaleseSerbianSlovakSloveneSouth AfricanSouth AmericanSpaniardSpanishSri LankanSubsaharan AfricanSudaneseSwedishSwissSyrianThaiTrinidadian and TobagonianTurkishUkrainianUruguayanVietnameseWelshWest IndianYugoslavian
Immigrant Origin (Total)
AfghanistanAfricaAlbaniaArgentinaAsiaAustraliaBahamasBangladeshBarbadosBelarusBosnia and HerzegovinaBrazilBulgariaBurma / MyanmarCameroonCanadaCaribbeanCentral AmericaChileChinaColombiaCosta RicaCroatiaCubaDominican RepublicEastern AfricaEastern AsiaEastern EuropeEcuadorEgyptEl SalvadorEnglandEthiopiaEuropeFranceGermanyGhanaGreeceGrenadaGuatemalaGuyanaHaitiHong KongHungaryIndiaIranIraqIrelandIsraelItalyJamaicaJapanJordanKazakhstanKenyaKoreaLatin AmericaMalaysiaMexicoMiddle AfricaMoroccoNepalNigeriaNorthern AfricaNorthern EuropeOceaniaPakistanPanamaPeruPhilippinesPolandRussiaSaudi ArabiaScotlandSenegalSouth AmericaSouth Central AsiaSouth Eastern AsiaSouthern EuropeSudanSwedenSwitzerlandSyriaTaiwanThailandTrinidad and TobagoTurkeyUkraineUzbekistanVietnamWestern AfricaWestern AsiaWestern EuropeYemenZaire
Immigrant Origin (Percentage)
AfghanistanAfricaAlbaniaArgentinaAsiaAustraliaBahamasBangladeshBarbadosBelarusBosnia and HerzegovinaBrazilBulgariaBurma / MyanmarCameroonCanadaCaribbeanCentral AmericaChileChinaColombiaCosta RicaCroatiaCubaDominican RepublicEastern AfricaEastern AsiaEastern EuropeEcuadorEgyptEl SalvadorEnglandEthiopiaEuropeFranceGermanyGhanaGreeceGrenadaGuatemalaGuyanaHaitiHong KongHungaryIndiaIranIraqIrelandIsraelItalyJamaicaJapanJordanKazakhstanKenyaKoreaLatin AmericaMalaysiaMexicoMiddle AfricaMoroccoNepalNigeriaNorthern AfricaNorthern EuropeOceaniaPakistanPanamaPeruPhilippinesPolandRussiaSaudi ArabiaScotlandSenegalSouth AmericaSouth Central AsiaSouth Eastern AsiaSouthern EuropeSudanSwedenSwitzerlandSyriaTaiwanThailandTrinidad and TobagoTurkeyUkraineUzbekistanVietnamWestern AfricaWestern AsiaWestern EuropeYemenZaire
Income
Income (Families)
Income (Households)
Poverty
Poverty (Families)
Unemployment
Employment Occupations
Employment Industries
Employer Class
Commute Time
Commute Means
School Enrollment
Education by Degree Field
Occupancy
Finances
Physical Characteristics
Albany
Compare Zip Codes
Comparison Subject

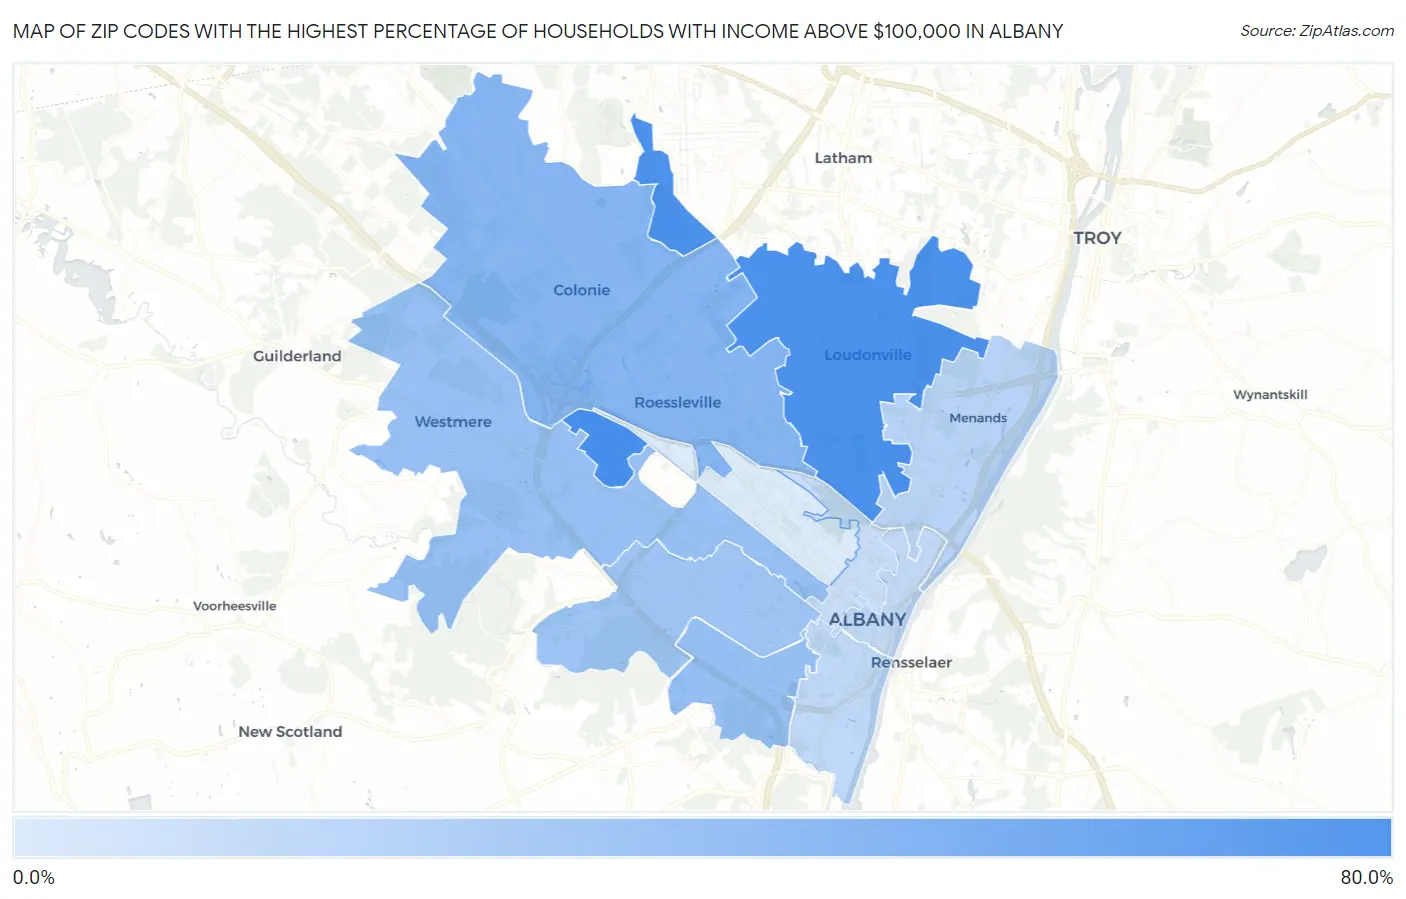
Map of Zip Codes with the Highest Percentage of Households with Income Above $100,000 in Albany

0.0%
80.0%
Zip Codes with the Highest Percentage of Households with Income Above $100,000 in Albany Map

Zip Codes with the Highest Percentage of Households with Income Above $100,000 in Albany, NY

Zip Code Households with Income > $100k vs State vs National
1.1222266.7%41.7%(+25.0)#14737.3%(+29.4)#1,312
2.1221164.4%41.7%(+22.7)#17637.3%(+27.1)#1,633
3.1220542.0%41.7%(+0.300)#66037.3%(+4.70)#7,893
4.1220936.4%41.7%(-5.30)#84437.3%(-0.900)#10,922
5.1220335.5%41.7%(-6.20)#87537.3%(-1.80)#11,440
6.1220833.1%41.7%(-8.60)#97737.3%(-4.20)#13,026
7.1220425.0%41.7%(-16.7)#1,34037.3%(-12.3)#19,764
8.1220222.6%41.7%(-19.1)#1,42937.3%(-14.7)#21,907
9.1220722.1%41.7%(-19.6)#1,45037.3%(-15.2)#22,336
10.1221019.7%41.7%(-22.0)#1,51837.3%(-17.6)#24,274
11.1220613.8%41.7%(-27.9)#1,62837.3%(-23.5)#28,204

Common Questions

What are the Top 10 Zip Codes with the Highest Percentage of Households with Income Above $100,000 in Albany, NY?
Top 10 Zip Codes with the Highest Percentage of Households with Income Above $100,000 in Albany, NY are:
#1
66.7%
#2
64.4%
#3
42.0%
#4
36.4%
#5
35.5%
#6
33.1%
#7
25.0%
#8
22.6%
#9
22.1%
#10
19.7%
What zip code has the Highest Percentage of Households with Income Above $100,000 in Albany, NY?
12222 has the Highest Percentage of Households with Income Above $100,000 in Albany, NY with 66.7%.
What is the Percentage of Households with Income Above $100,000 in Albany, NY?
Percentage of Households with Income Above $100,000 in Albany is 26.8%.
What is the Percentage of Households with Income Above $100,000 in New York?
Percentage of Households with Income Above $100,000 in New York is 41.7%.
What is the Percentage of Households with Income Above $100,000 in the United States?
Percentage of Households with Income Above $100,000 in the United States is 37.3%.