Zip Codes with the Highest Percentage of Households with Income Above $100,000 in Brooklyn, NY
RELATED REPORTS & OPTIONS
Household Income | $100k+
Brooklyn
Compare Zip Codes
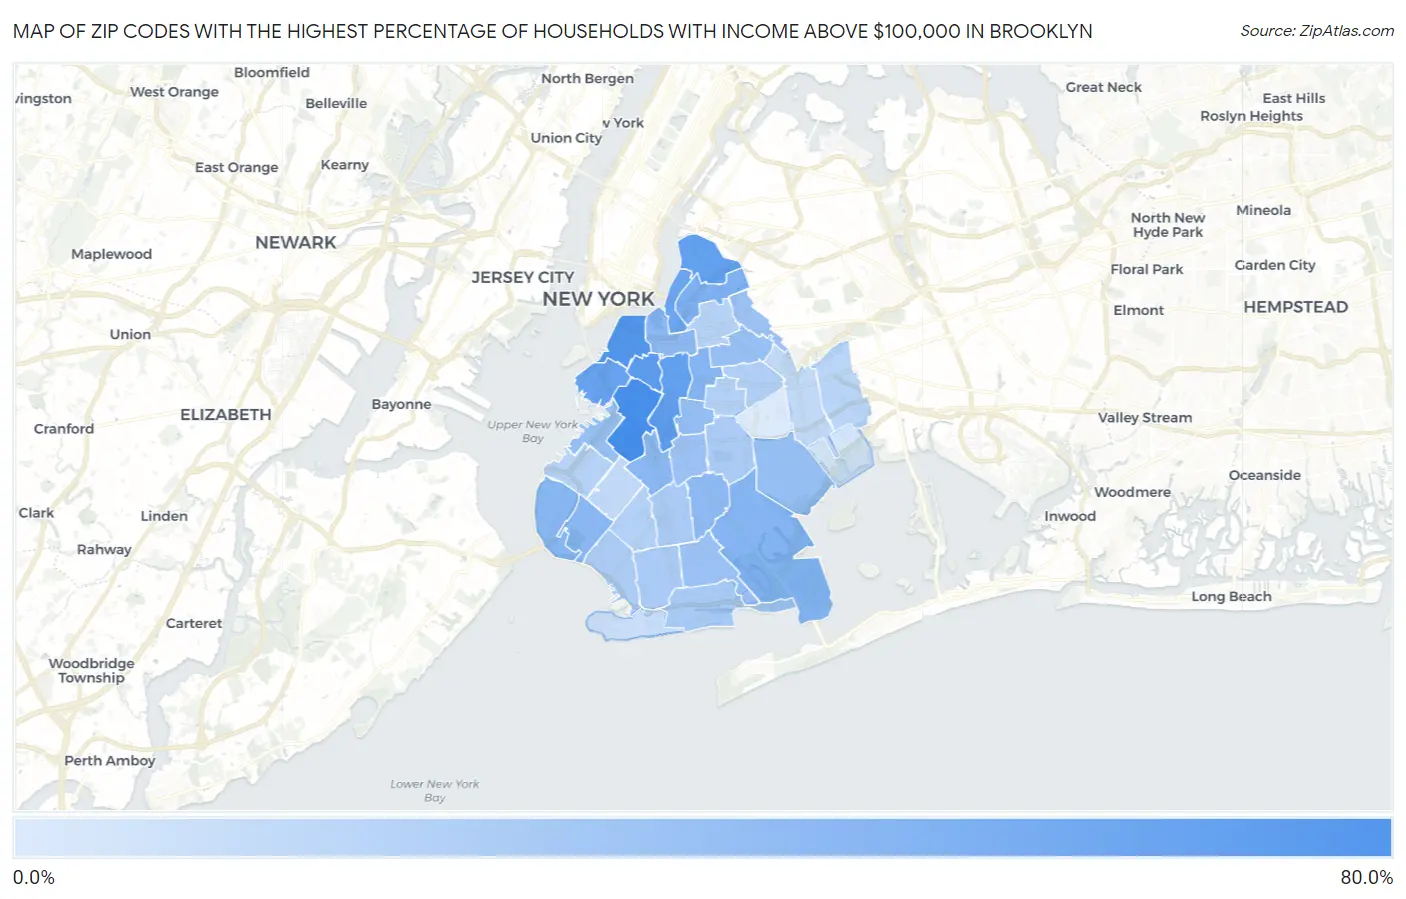
Map of Zip Codes with the Highest Percentage of Households with Income Above $100,000 in Brooklyn
15.7%
71.6%
Zip Codes with the Highest Percentage of Households with Income Above $100,000 in Brooklyn, NY
| Zip Code | Households with Income > $100k | vs State | vs National | |
| 1. | 11215 | 71.6% | 41.7%(+29.9)#89 | 37.3%(+34.3)#812 |
| 2. | 11201 | 66.9% | 41.7%(+25.2)#143 | 37.3%(+29.6)#1,267 |
| 3. | 11217 | 63.3% | 41.7%(+21.6)#189 | 37.3%(+26.0)#1,786 |
| 4. | 11238 | 60.0% | 41.7%(+18.3)#255 | 37.3%(+22.7)#2,355 |
| 5. | 11222 | 59.7% | 41.7%(+18.0)#263 | 37.3%(+22.4)#2,422 |
| 6. | 11231 | 57.8% | 41.7%(+16.1)#300 | 37.3%(+20.5)#2,798 |
| 7. | 11249 | 55.6% | 41.7%(+13.9)#344 | 37.3%(+18.3)#3,290 |
| 8. | 11211 | 48.8% | 41.7%(+7.10)#476 | 37.3%(+11.5)#5,224 |
| 9. | 11216 | 46.3% | 41.7%(+4.60)#537 | 37.3%(+9.00)#6,075 |
| 10. | 11234 | 45.7% | 41.7%(+4.00)#554 | 37.3%(+8.40)#6,316 |
| 11. | 11209 | 44.8% | 41.7%(+3.10)#577 | 37.3%(+7.50)#6,689 |
| 12. | 11228 | 44.1% | 41.7%(+2.40)#594 | 37.3%(+6.80)#6,957 |
| 13. | 11218 | 43.6% | 41.7%(+1.90)#607 | 37.3%(+6.30)#7,156 |
| 14. | 11205 | 43.0% | 41.7%(+1.30)#626 | 37.3%(+5.70)#7,430 |
| 15. | 11210 | 41.8% | 41.7%(+0.100)#667 | 37.3%(+4.50)#7,985 |
| 16. | 11225 | 40.5% | 41.7%(-1.20)#705 | 37.3%(+3.20)#8,643 |
| 17. | 11236 | 39.5% | 41.7%(-2.20)#741 | 37.3%(+2.20)#9,162 |
| 18. | 11221 | 39.1% | 41.7%(-2.60)#755 | 37.3%(+1.80)#9,357 |
| 19. | 11232 | 39.0% | 41.7%(-2.70)#762 | 37.3%(+1.70)#9,418 |
| 20. | 11229 | 38.2% | 41.7%(-3.50)#779 | 37.3%(+0.900)#9,857 |
| 21. | 11226 | 38.1% | 41.7%(-3.60)#781 | 37.3%(+0.800)#9,911 |
| 22. | 11237 | 37.0% | 41.7%(-4.70)#823 | 37.3%(-0.300)#10,532 |
| 23. | 11235 | 32.7% | 41.7%(-9.00)#997 | 37.3%(-4.60)#13,323 |
| 24. | 11230 | 32.6% | 41.7%(-9.10)#1,002 | 37.3%(-4.70)#13,379 |
| 25. | 11223 | 32.6% | 41.7%(-9.10)#1,003 | 37.3%(-4.70)#13,381 |
| 26. | 11203 | 32.4% | 41.7%(-9.30)#1,011 | 37.3%(-4.90)#13,522 |
| 27. | 11214 | 31.7% | 41.7%(-10.0)#1,037 | 37.3%(-5.60)#14,086 |
| 28. | 11233 | 29.6% | 41.7%(-12.1)#1,134 | 37.3%(-7.70)#15,740 |
| 29. | 11204 | 29.3% | 41.7%(-12.4)#1,143 | 37.3%(-8.00)#15,999 |
| 30. | 11213 | 28.7% | 41.7%(-13.0)#1,160 | 37.3%(-8.60)#16,489 |
| 31. | 11220 | 28.2% | 41.7%(-13.5)#1,186 | 37.3%(-9.10)#16,928 |
| 32. | 11206 | 28.0% | 41.7%(-13.7)#1,200 | 37.3%(-9.30)#17,101 |
| 33. | 11208 | 26.4% | 41.7%(-15.3)#1,264 | 37.3%(-10.9)#18,491 |
| 34. | 11207 | 24.4% | 41.7%(-17.3)#1,361 | 37.3%(-12.9)#20,270 |
| 35. | 11219 | 24.4% | 41.7%(-17.3)#1,362 | 37.3%(-12.9)#20,271 |
| 36. | 11224 | 22.2% | 41.7%(-19.5)#1,443 | 37.3%(-15.1)#22,211 |
| 37. | 11239 | 18.2% | 41.7%(-23.5)#1,556 | 37.3%(-19.1)#25,401 |
| 38. | 11212 | 15.7% | 41.7%(-26.0)#1,601 | 37.3%(-21.6)#27,106 |
1
Common Questions
What are the Top 10 Zip Codes with the Highest Percentage of Households with Income Above $100,000 in Brooklyn, NY?
Top 10 Zip Codes with the Highest Percentage of Households with Income Above $100,000 in Brooklyn, NY are:
What zip code has the Highest Percentage of Households with Income Above $100,000 in Brooklyn, NY?
11215 has the Highest Percentage of Households with Income Above $100,000 in Brooklyn, NY with 71.6%.
What is the Percentage of Households with Income Above $100,000 in New York?
Percentage of Households with Income Above $100,000 in New York is 41.7%.
What is the Percentage of Households with Income Above $100,000 in the United States?
Percentage of Households with Income Above $100,000 in the United States is 37.3%.