West Elmira, NY Map & Demographics
West Elmira Map
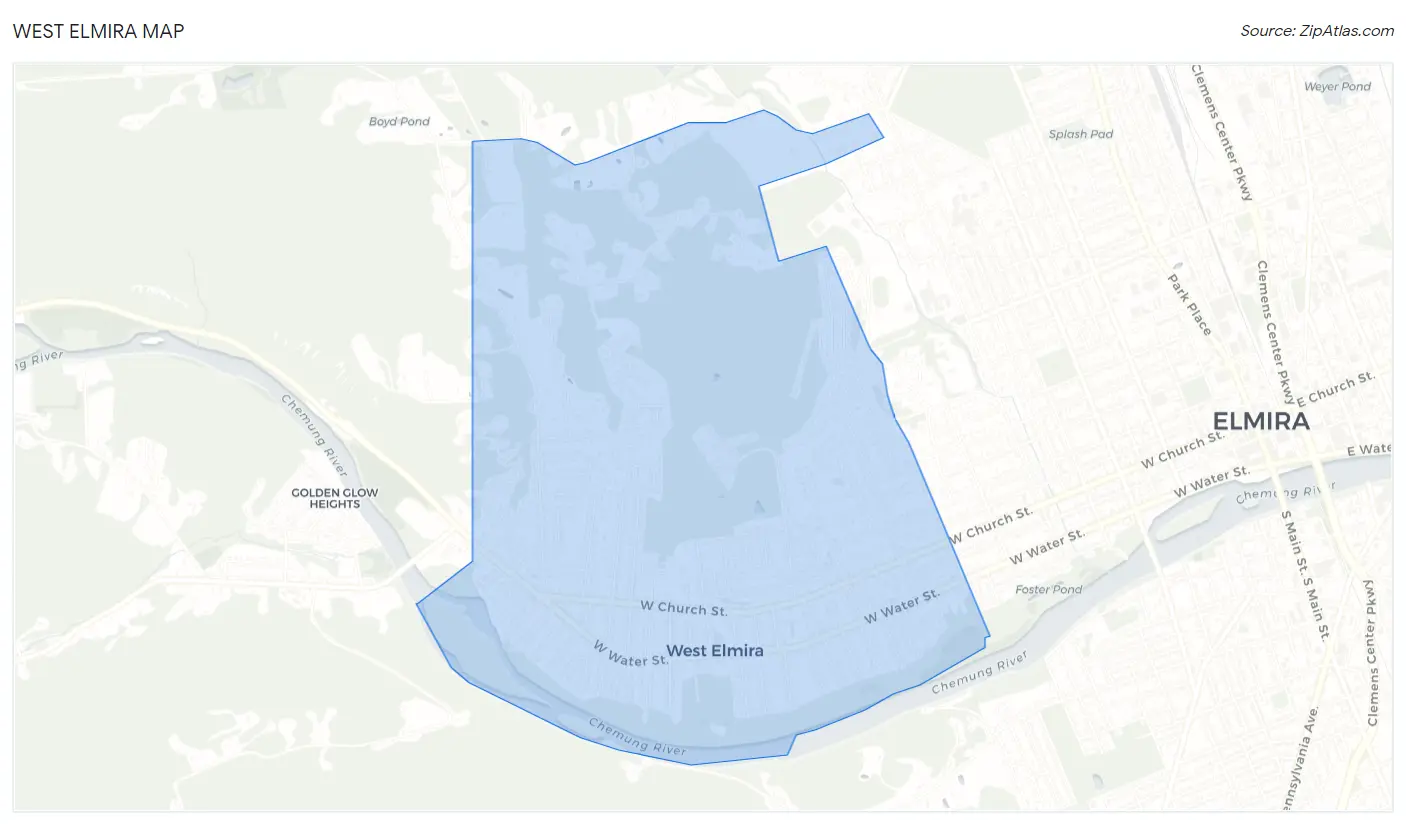
West Elmira Overview
$54,009
PER CAPITA INCOME
$104,531
AVG FAMILY INCOME
$94,091
AVG HOUSEHOLD INCOME
12.8%
WAGE / INCOME GAP [ % ]
87.2¢/ $1
WAGE / INCOME GAP [ $ ]
0.42
INEQUALITY / GINI INDEX
4,796
TOTAL POPULATION
2,164
MALE POPULATION
2,632
FEMALE POPULATION
82.22
MALES / 100 FEMALES
121.63
FEMALES / 100 MALES
46.6
MEDIAN AGE
2.8
AVG FAMILY SIZE
2.4
AVG HOUSEHOLD SIZE
2,654
LABOR FORCE [ PEOPLE ]
67.3%
PERCENT IN LABOR FORCE
4.2%
UNEMPLOYMENT RATE
Income in West Elmira
Income Overview in West Elmira
Per Capita Income in West Elmira is $54,009, while median incomes of families and households are $104,531 and $94,091 respectively.
| Characteristic | Number | Measure |
| Per Capita Income | 4,796 | $54,009 |
| Median Family Income | 1,367 | $104,531 |
| Mean Family Income | 1,367 | $130,700 |
| Median Household Income | 2,030 | $94,091 |
| Mean Household Income | 2,030 | $129,945 |
| Income Deficit | 1,367 | $0 |
| Wage / Income Gap (%) | 4,796 | 12.80% |
| Wage / Income Gap ($) | 4,796 | 87.20¢ per $1 |
| Gini / Inequality Index | 4,796 | 0.42 |
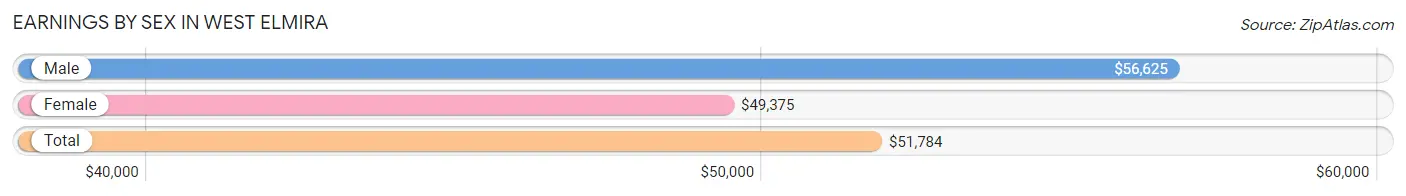
Earnings by Sex in West Elmira
Average Earnings in West Elmira are $51,784, $56,625 for men and $49,375 for women, a difference of 12.8%.
| Sex | Number | Average Earnings |
| Male | 1,399 (50.5%) | $56,625 |
| Female | 1,372 (49.5%) | $49,375 |
| Total | 2,771 (100.0%) | $51,784 |
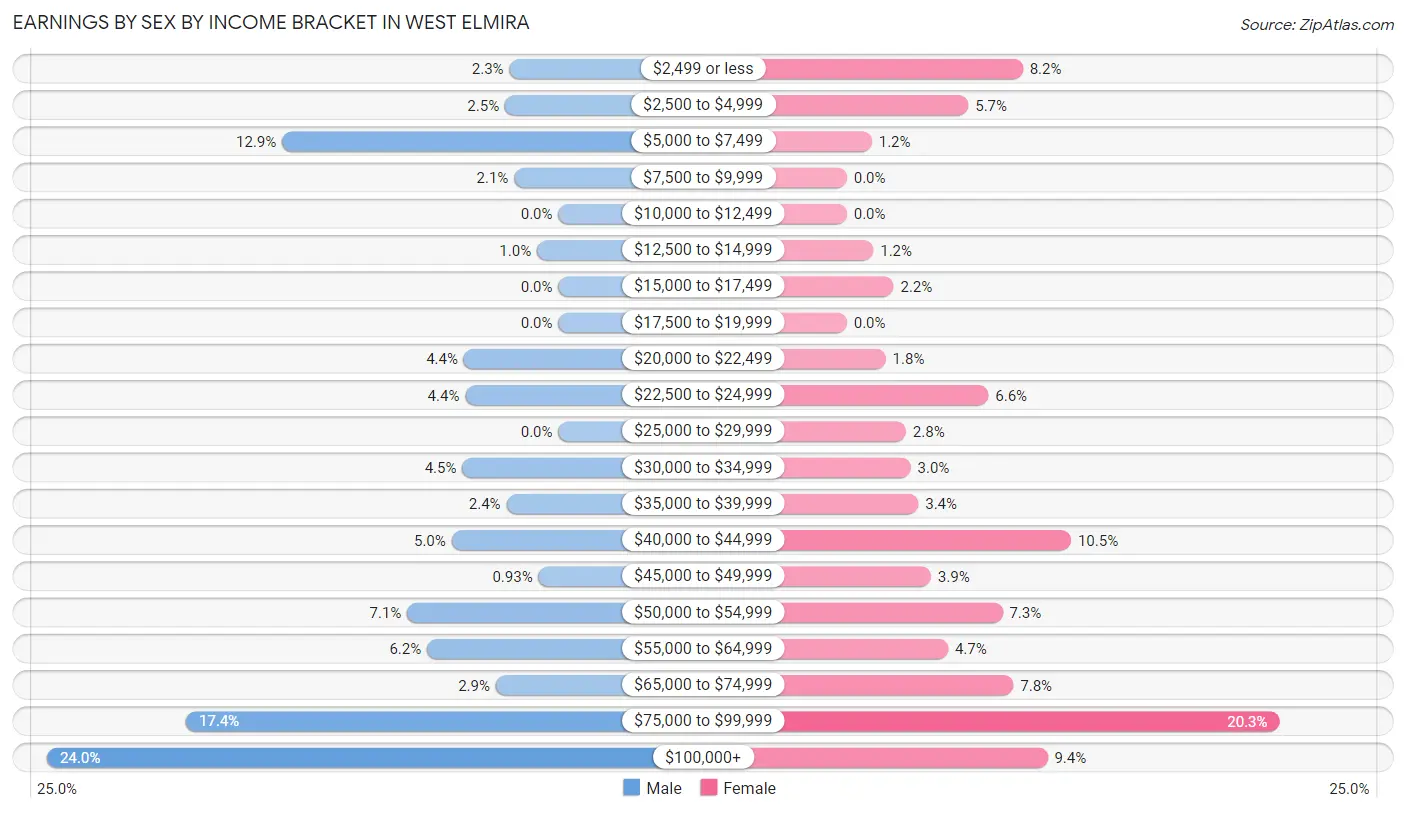
Earnings by Sex by Income Bracket in West Elmira
The most common earnings brackets in West Elmira are $100,000+ for men (335 | 23.9%) and $75,000 to $99,999 for women (278 | 20.3%).
| Income | Male | Female |
| $2,499 or less | 32 (2.3%) | 113 (8.2%) |
| $2,500 to $4,999 | 35 (2.5%) | 78 (5.7%) |
| $5,000 to $7,499 | 181 (12.9%) | 16 (1.2%) |
| $7,500 to $9,999 | 29 (2.1%) | 0 (0.0%) |
| $10,000 to $12,499 | 0 (0.0%) | 0 (0.0%) |
| $12,500 to $14,999 | 14 (1.0%) | 17 (1.2%) |
| $15,000 to $17,499 | 0 (0.0%) | 30 (2.2%) |
| $17,500 to $19,999 | 0 (0.0%) | 0 (0.0%) |
| $20,000 to $22,499 | 62 (4.4%) | 25 (1.8%) |
| $22,500 to $24,999 | 61 (4.4%) | 91 (6.6%) |
| $25,000 to $29,999 | 0 (0.0%) | 38 (2.8%) |
| $30,000 to $34,999 | 63 (4.5%) | 41 (3.0%) |
| $35,000 to $39,999 | 34 (2.4%) | 46 (3.4%) |
| $40,000 to $44,999 | 70 (5.0%) | 144 (10.5%) |
| $45,000 to $49,999 | 13 (0.9%) | 54 (3.9%) |
| $50,000 to $54,999 | 99 (7.1%) | 100 (7.3%) |
| $55,000 to $64,999 | 86 (6.1%) | 65 (4.7%) |
| $65,000 to $74,999 | 41 (2.9%) | 107 (7.8%) |
| $75,000 to $99,999 | 244 (17.4%) | 278 (20.3%) |
| $100,000+ | 335 (23.9%) | 129 (9.4%) |
| Total | 1,399 (100.0%) | 1,372 (100.0%) |
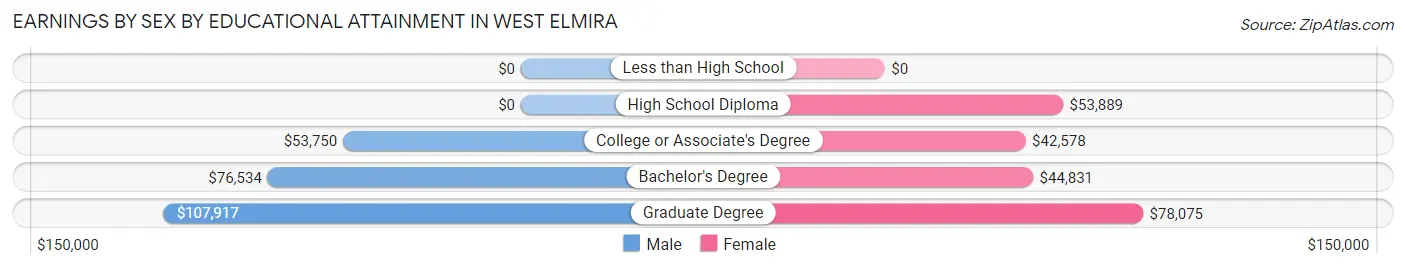
Earnings by Sex by Educational Attainment in West Elmira
Average earnings in West Elmira are $63,939 for men and $52,486 for women, a difference of 17.9%. Men with an educational attainment of graduate degree enjoy the highest average annual earnings of $107,917, while those with college or associate's degree education earn the least with $53,750. Women with an educational attainment of graduate degree earn the most with the average annual earnings of $78,075, while those with college or associate's degree education have the smallest earnings of $42,578.
| Educational Attainment | Male Income | Female Income |
| Less than High School | - | - |
| High School Diploma | - | - |
| College or Associate's Degree | $53,750 | $42,578 |
| Bachelor's Degree | $76,534 | $44,831 |
| Graduate Degree | $107,917 | $78,075 |
| Total | $63,939 | $52,486 |
Family Income in West Elmira
Family Income Brackets in West Elmira
According to the West Elmira family income data, there are 370 families falling into the $100,000 to $149,999 income range, which is the most common income bracket and makes up 27.1% of all families.
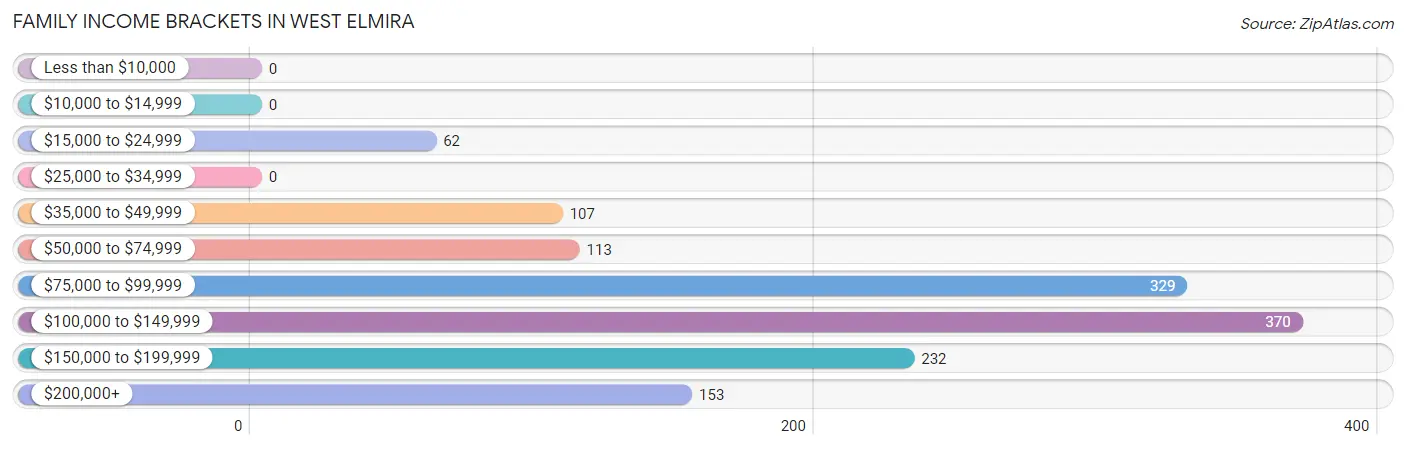
| Income Bracket | # Families | % Families |
| Less than $10,000 | 0 | 0.0% |
| $10,000 to $14,999 | 0 | 0.0% |
| $15,000 to $24,999 | 62 | 4.5% |
| $25,000 to $34,999 | 0 | 0.0% |
| $35,000 to $49,999 | 107 | 7.8% |
| $50,000 to $74,999 | 113 | 8.3% |
| $75,000 to $99,999 | 329 | 24.1% |
| $100,000 to $149,999 | 370 | 27.1% |
| $150,000 to $199,999 | 232 | 17.0% |
| $200,000+ | 153 | 11.2% |
Family Income by Famaliy Size in West Elmira
2-person families (713 | 52.2%) account for the highest median family income in West Elmira with $123,516 per family, while 2-person families (713 | 52.2%) have the highest median income of $61,758 per family member.
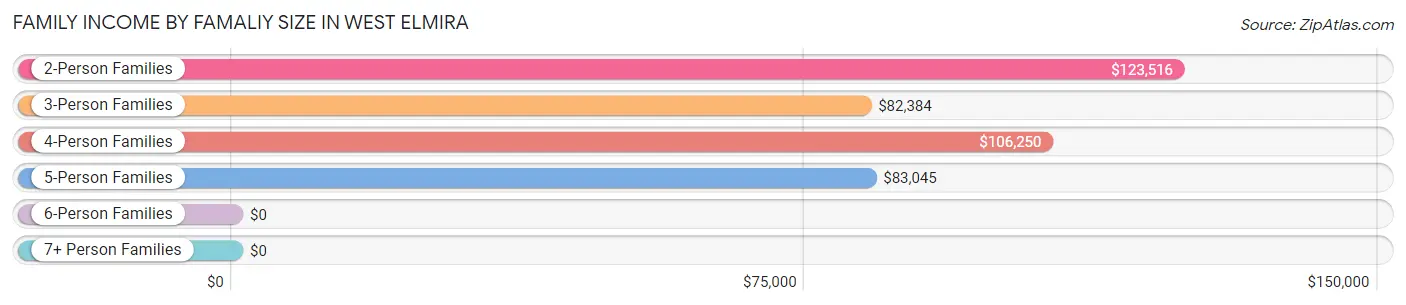
| Income Bracket | # Families | Median Income |
| 2-Person Families | 713 (52.2%) | $123,516 |
| 3-Person Families | 174 (12.7%) | $82,384 |
| 4-Person Families | 321 (23.5%) | $106,250 |
| 5-Person Families | 147 (10.7%) | $83,045 |
| 6-Person Families | 12 (0.9%) | $0 |
| 7+ Person Families | 0 (0.0%) | $0 |
| Total | 1,367 (100.0%) | $104,531 |
Family Income by Number of Earners in West Elmira
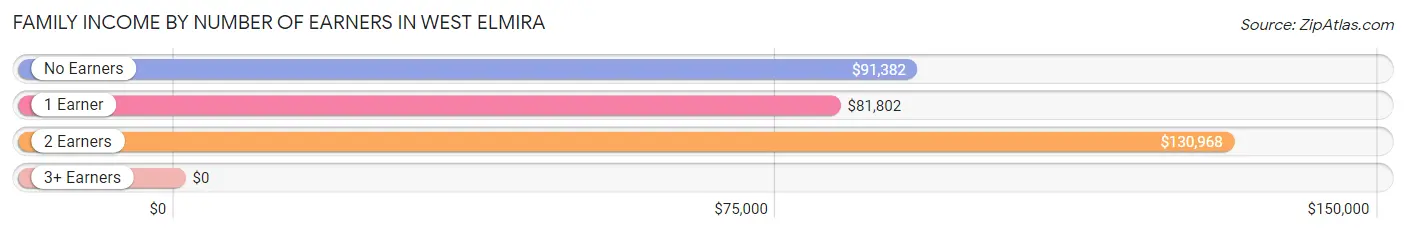
| Number of Earners | # Families | Median Income |
| No Earners | 149 (10.9%) | $91,382 |
| 1 Earner | 432 (31.6%) | $81,802 |
| 2 Earners | 565 (41.3%) | $130,968 |
| 3+ Earners | 221 (16.2%) | $0 |
| Total | 1,367 (100.0%) | $104,531 |
Household Income in West Elmira
Household Income Brackets in West Elmira
With 487 households falling in the category, the $100,000 to $149,999 income range is the most frequent in West Elmira, accounting for 24.0% of all households.
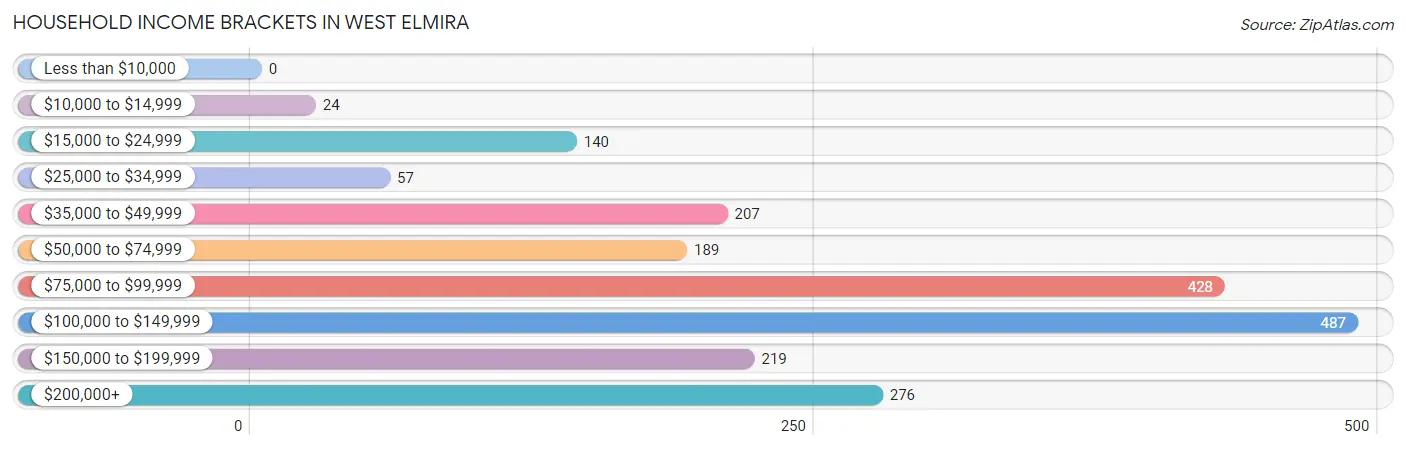
| Income Bracket | # Households | % Households |
| Less than $10,000 | 0 | 0.0% |
| $10,000 to $14,999 | 24 | 1.2% |
| $15,000 to $24,999 | 140 | 6.9% |
| $25,000 to $34,999 | 57 | 2.8% |
| $35,000 to $49,999 | 207 | 10.2% |
| $50,000 to $74,999 | 189 | 9.3% |
| $75,000 to $99,999 | 428 | 21.1% |
| $100,000 to $149,999 | 487 | 24.0% |
| $150,000 to $199,999 | 219 | 10.8% |
| $200,000+ | 276 | 13.6% |
Household Income by Householder Age in West Elmira
The median household income in West Elmira is $94,091, with the highest median household income of $105,116 found in the 45 to 64 years age bracket for the primary householder. A total of 800 households (39.4%) fall into this category.
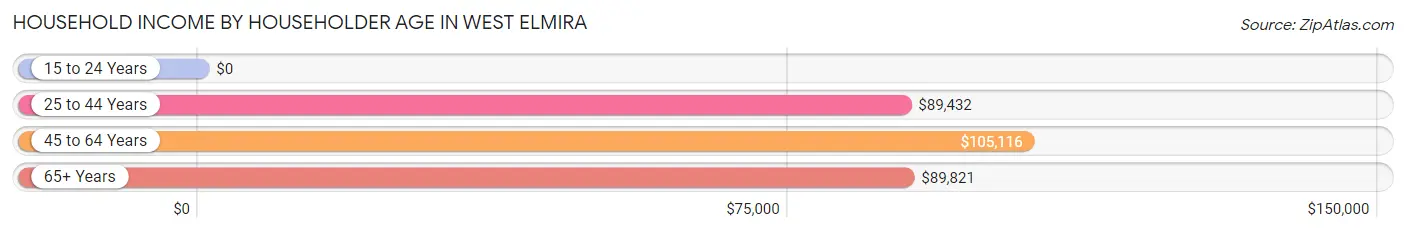
| Income Bracket | # Households | Median Income |
| 15 to 24 Years | 0 (0.0%) | $0 |
| 25 to 44 Years | 562 (27.7%) | $89,432 |
| 45 to 64 Years | 800 (39.4%) | $105,116 |
| 65+ Years | 668 (32.9%) | $89,821 |
| Total | 2,030 (100.0%) | $94,091 |
Poverty in West Elmira
Income Below Poverty by Sex and Age in West Elmira
With 4.9% poverty level for males and 3.2% for females among the residents of West Elmira, 18 to 24 year old males and 75 year old and over females are the most vulnerable to poverty, with 18 males (20.2%) and 54 females (26.0%) in their respective age groups living below the poverty level.
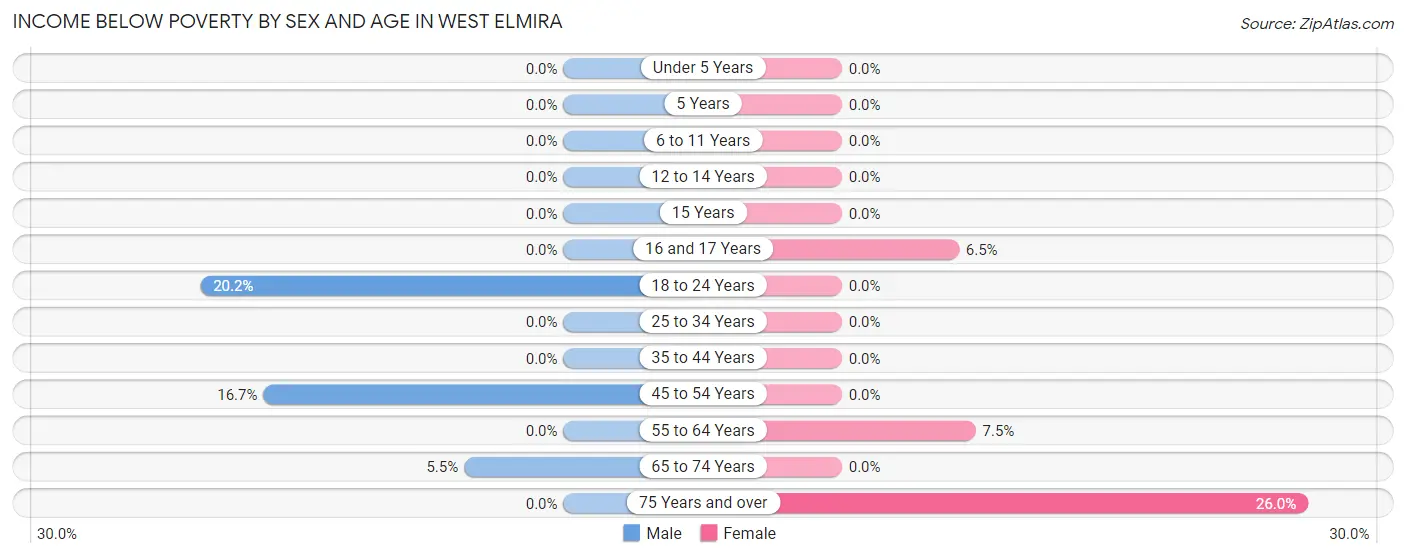
| Age Bracket | Male | Female |
| Under 5 Years | 0 (0.0%) | 0 (0.0%) |
| 5 Years | 0 (0.0%) | 0 (0.0%) |
| 6 to 11 Years | 0 (0.0%) | 0 (0.0%) |
| 12 to 14 Years | 0 (0.0%) | 0 (0.0%) |
| 15 Years | 0 (0.0%) | 0 (0.0%) |
| 16 and 17 Years | 0 (0.0%) | 6 (6.5%) |
| 18 to 24 Years | 18 (20.2%) | 0 (0.0%) |
| 25 to 34 Years | 0 (0.0%) | 0 (0.0%) |
| 35 to 44 Years | 0 (0.0%) | 0 (0.0%) |
| 45 to 54 Years | 67 (16.7%) | 0 (0.0%) |
| 55 to 64 Years | 0 (0.0%) | 24 (7.4%) |
| 65 to 74 Years | 22 (5.5%) | 0 (0.0%) |
| 75 Years and over | 0 (0.0%) | 54 (26.0%) |
| Total | 107 (4.9%) | 84 (3.2%) |
Income Above Poverty by Sex and Age in West Elmira
According to the poverty statistics in West Elmira, males aged under 5 years and females aged under 5 years are the age groups that are most secure financially, with 100.0% of males and 100.0% of females in these age groups living above the poverty line.
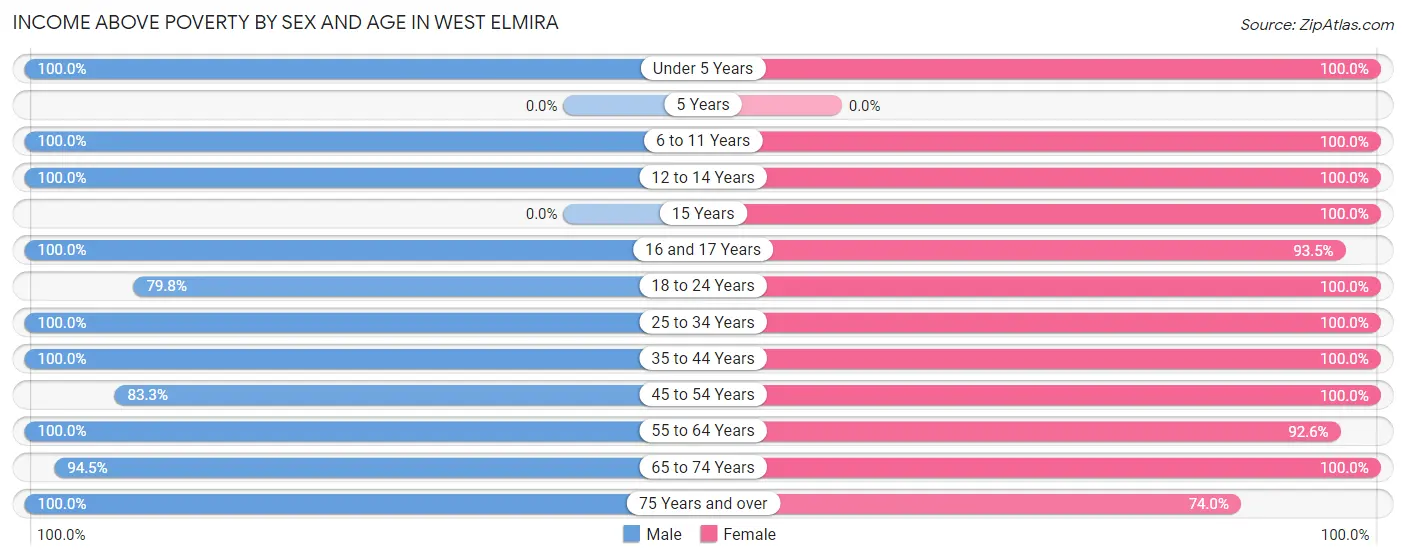
| Age Bracket | Male | Female |
| Under 5 Years | 112 (100.0%) | 136 (100.0%) |
| 5 Years | 0 (0.0%) | 0 (0.0%) |
| 6 to 11 Years | 142 (100.0%) | 148 (100.0%) |
| 12 to 14 Years | 88 (100.0%) | 186 (100.0%) |
| 15 Years | 0 (0.0%) | 40 (100.0%) |
| 16 and 17 Years | 137 (100.0%) | 86 (93.5%) |
| 18 to 24 Years | 71 (79.8%) | 131 (100.0%) |
| 25 to 34 Years | 162 (100.0%) | 195 (100.0%) |
| 35 to 44 Years | 301 (100.0%) | 328 (100.0%) |
| 45 to 54 Years | 334 (83.3%) | 500 (100.0%) |
| 55 to 64 Years | 168 (100.0%) | 298 (92.5%) |
| 65 to 74 Years | 376 (94.5%) | 346 (100.0%) |
| 75 Years and over | 166 (100.0%) | 154 (74.0%) |
| Total | 2,057 (95.1%) | 2,548 (96.8%) |
Income Below Poverty Among Married-Couple Families in West Elmira
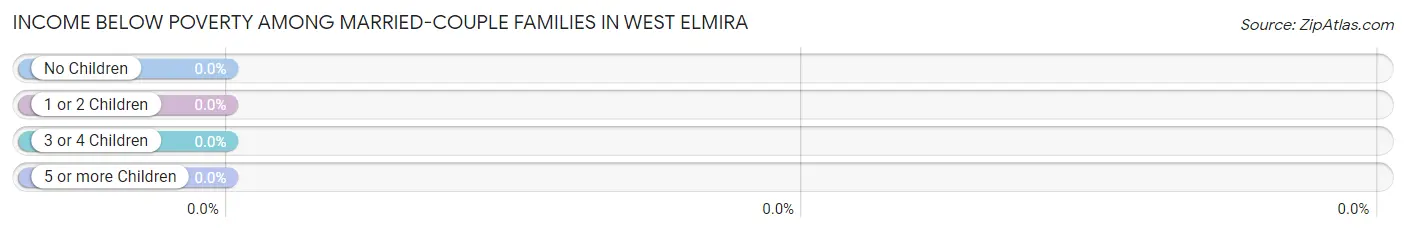
| Children | Above Poverty | Below Poverty |
| No Children | 622 (100.0%) | 0 (0.0%) |
| 1 or 2 Children | 372 (100.0%) | 0 (0.0%) |
| 3 or 4 Children | 52 (100.0%) | 0 (0.0%) |
| 5 or more Children | 0 (0.0%) | 0 (0.0%) |
| Total | 1,046 (100.0%) | 0 (0.0%) |
Income Below Poverty Among Single-Parent Households in West Elmira
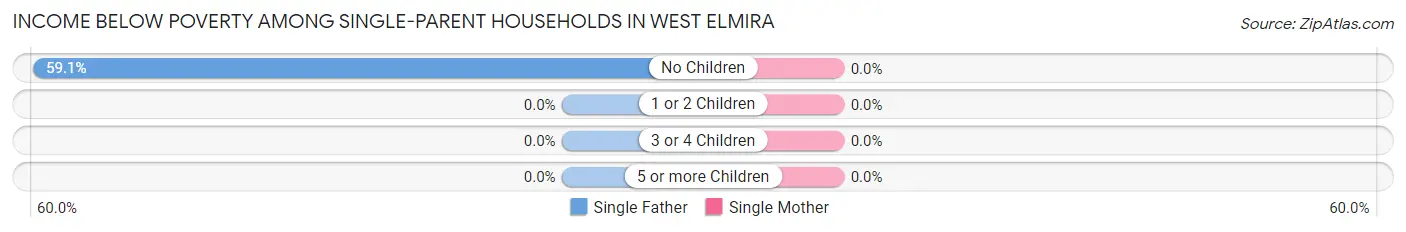
| Children | Single Father | Single Mother |
| No Children | 62 (59.1%) | 0 (0.0%) |
| 1 or 2 Children | 0 (0.0%) | 0 (0.0%) |
| 3 or 4 Children | 0 (0.0%) | 0 (0.0%) |
| 5 or more Children | 0 (0.0%) | 0 (0.0%) |
| Total | 62 (46.3%) | 0 (0.0%) |
Income Below Poverty Among Married-Couple vs Single-Parent Households in West Elmira
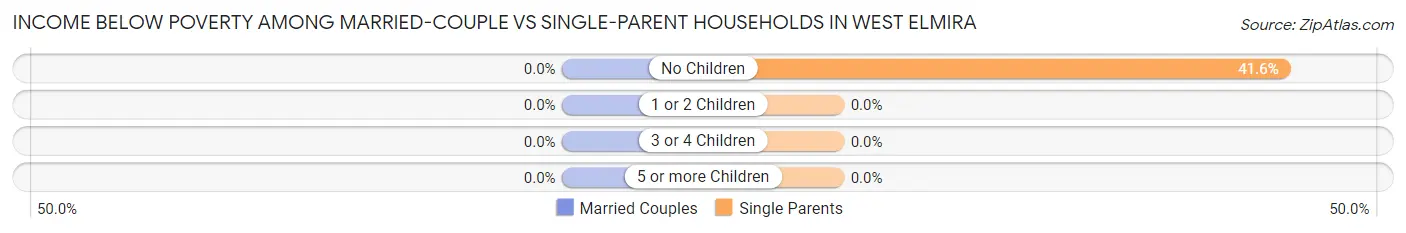
| Children | Married-Couple Families | Single-Parent Households |
| No Children | 0 (0.0%) | 62 (41.6%) |
| 1 or 2 Children | 0 (0.0%) | 0 (0.0%) |
| 3 or 4 Children | 0 (0.0%) | 0 (0.0%) |
| 5 or more Children | 0 (0.0%) | 0 (0.0%) |
| Total | 0 (0.0%) | 62 (19.3%) |
Race in West Elmira
The most populous races in West Elmira are White / Caucasian (4,457 | 92.9%), Asian (190 | 4.0%), and Hispanic or Latino (95 | 2.0%).
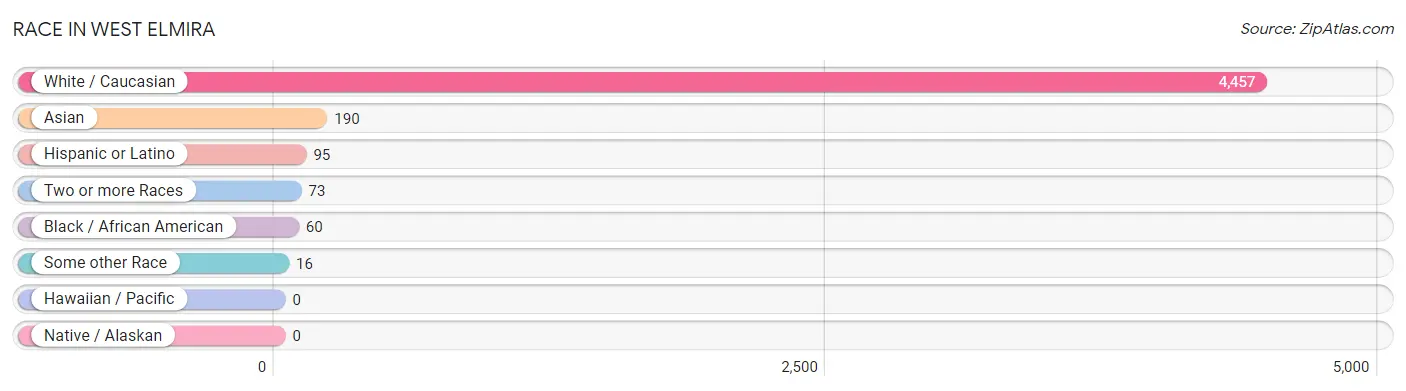
| Race | # Population | % Population |
| Asian | 190 | 4.0% |
| Black / African American | 60 | 1.3% |
| Hawaiian / Pacific | 0 | 0.0% |
| Hispanic or Latino | 95 | 2.0% |
| Native / Alaskan | 0 | 0.0% |
| White / Caucasian | 4,457 | 92.9% |
| Two or more Races | 73 | 1.5% |
| Some other Race | 16 | 0.3% |
| Total | 4,796 | 100.0% |
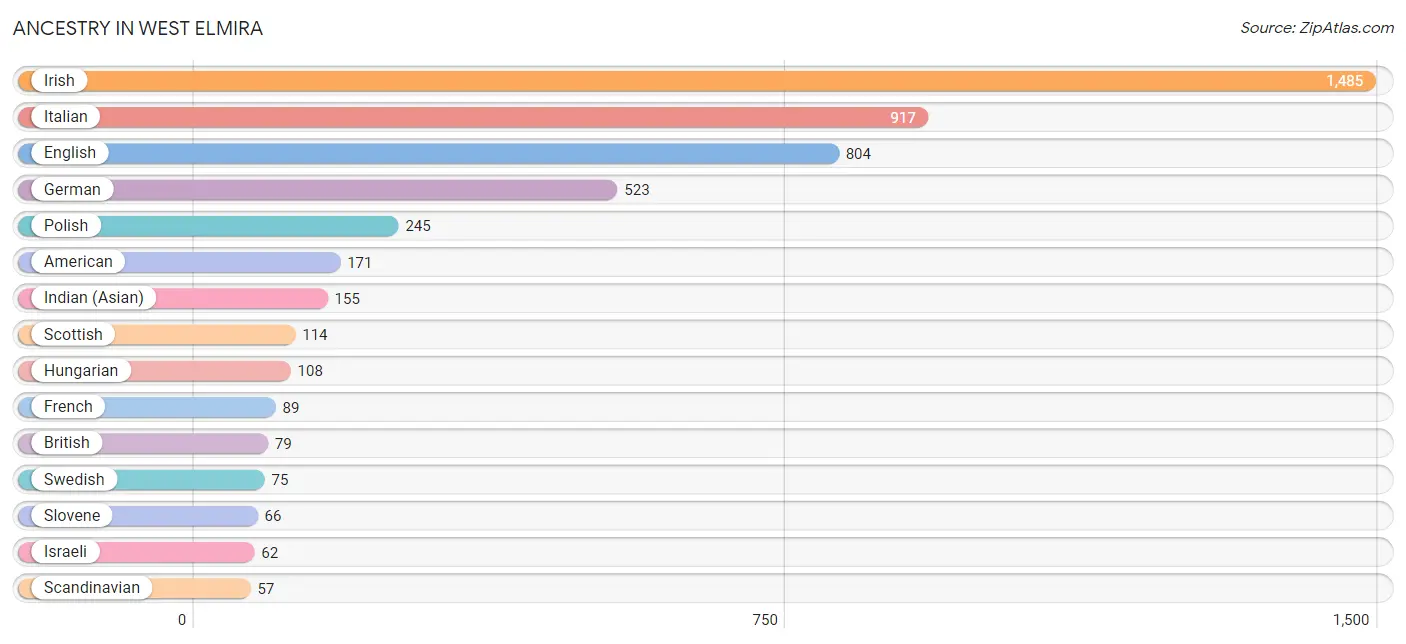
Ancestry in West Elmira
The most populous ancestries reported in West Elmira are Irish (1,485 | 31.0%), Italian (917 | 19.1%), English (804 | 16.8%), German (523 | 10.9%), and Polish (245 | 5.1%), together accounting for 82.9% of all West Elmira residents.
| Ancestry | # Population | % Population |
| American | 171 | 3.6% |
| Belgian | 23 | 0.5% |
| British | 79 | 1.7% |
| Canadian | 17 | 0.4% |
| Central American | 13 | 0.3% |
| Czech | 18 | 0.4% |
| Danish | 13 | 0.3% |
| Dutch | 38 | 0.8% |
| Eastern European | 11 | 0.2% |
| English | 804 | 16.8% |
| European | 32 | 0.7% |
| French | 89 | 1.9% |
| French Canadian | 10 | 0.2% |
| German | 523 | 10.9% |
| Hungarian | 108 | 2.2% |
| Indian (Asian) | 155 | 3.2% |
| Irish | 1,485 | 31.0% |
| Israeli | 62 | 1.3% |
| Italian | 917 | 19.1% |
| Korean | 45 | 0.9% |
| Lithuanian | 43 | 0.9% |
| New Zealander | 34 | 0.7% |
| Norwegian | 29 | 0.6% |
| Panamanian | 13 | 0.3% |
| Polish | 245 | 5.1% |
| Puerto Rican | 53 | 1.1% |
| Romanian | 16 | 0.3% |
| Russian | 40 | 0.8% |
| Scandinavian | 57 | 1.2% |
| Scottish | 114 | 2.4% |
| Slovene | 66 | 1.4% |
| Spanish | 14 | 0.3% |
| Swedish | 75 | 1.6% |
| Thai | 13 | 0.3% |
| Welsh | 35 | 0.7% | View All 35 Rows |
Immigrants in West Elmira
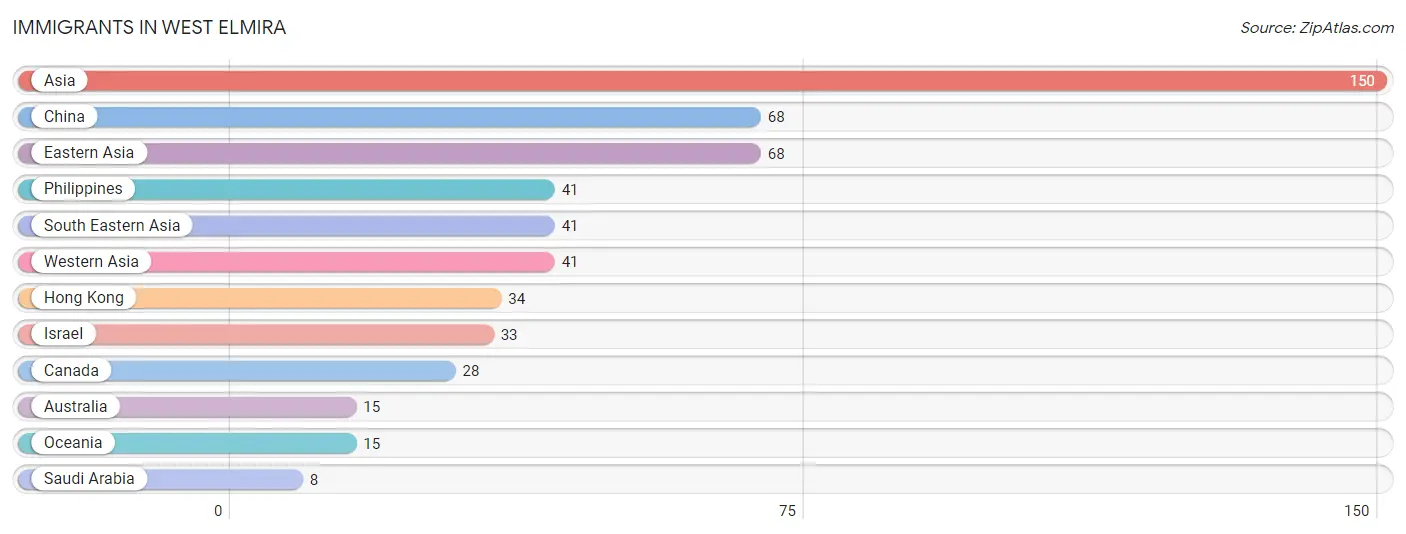
The most numerous immigrant groups reported in West Elmira came from Asia (150 | 3.1%), China (68 | 1.4%), Eastern Asia (68 | 1.4%), Philippines (41 | 0.9%), and South Eastern Asia (41 | 0.9%), together accounting for 7.7% of all West Elmira residents.
| Immigration Origin | # Population | % Population |
| Asia | 150 | 3.1% |
| Australia | 15 | 0.3% |
| Canada | 28 | 0.6% |
| China | 68 | 1.4% |
| Eastern Asia | 68 | 1.4% |
| Hong Kong | 34 | 0.7% |
| Israel | 33 | 0.7% |
| Oceania | 15 | 0.3% |
| Philippines | 41 | 0.9% |
| Saudi Arabia | 8 | 0.2% |
| South Eastern Asia | 41 | 0.9% |
| Western Asia | 41 | 0.9% | View All 12 Rows |
Sex and Age in West Elmira
Sex and Age in West Elmira
The most populous age groups in West Elmira are 65 to 69 Years (323 | 14.9%) for men and 50 to 54 Years (277 | 10.5%) for women.
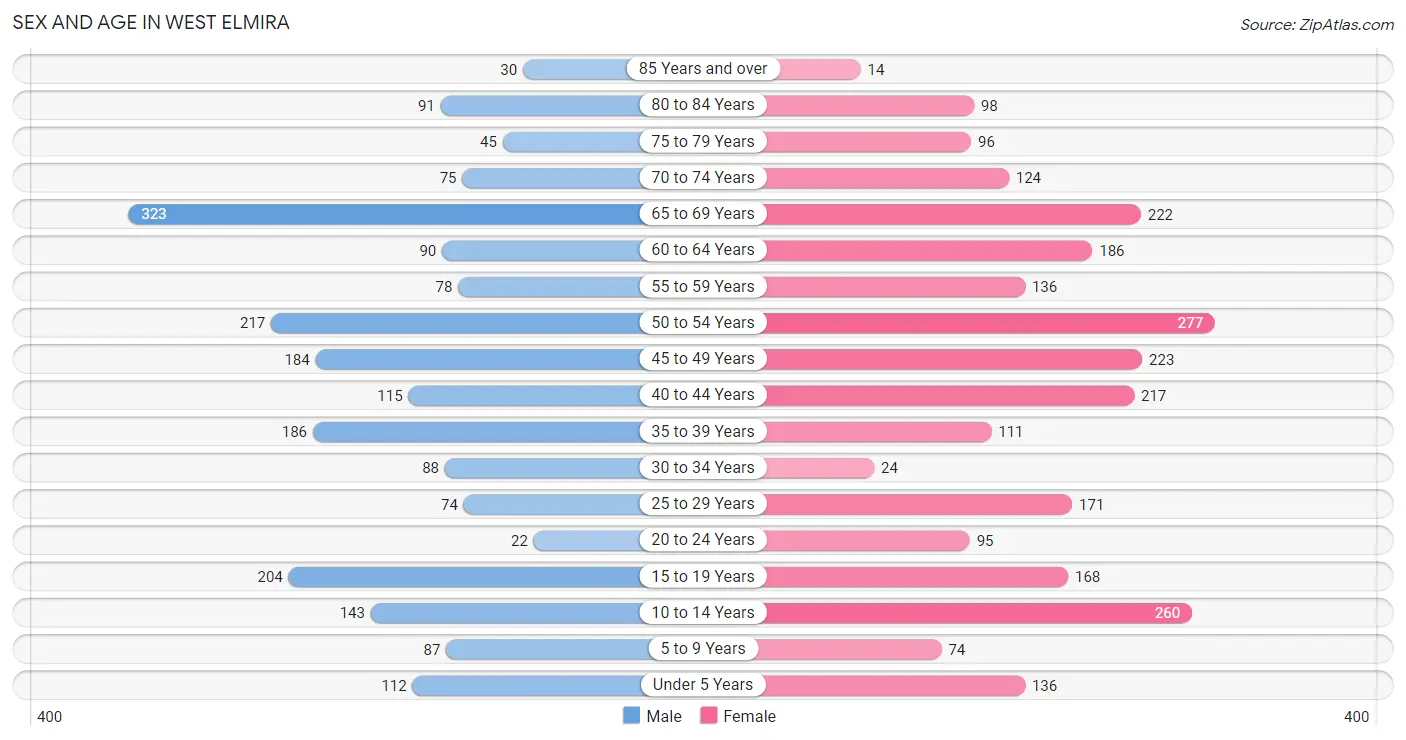
| Age Bracket | Male | Female |
| Under 5 Years | 112 (5.2%) | 136 (5.2%) |
| 5 to 9 Years | 87 (4.0%) | 74 (2.8%) |
| 10 to 14 Years | 143 (6.6%) | 260 (9.9%) |
| 15 to 19 Years | 204 (9.4%) | 168 (6.4%) |
| 20 to 24 Years | 22 (1.0%) | 95 (3.6%) |
| 25 to 29 Years | 74 (3.4%) | 171 (6.5%) |
| 30 to 34 Years | 88 (4.1%) | 24 (0.9%) |
| 35 to 39 Years | 186 (8.6%) | 111 (4.2%) |
| 40 to 44 Years | 115 (5.3%) | 217 (8.2%) |
| 45 to 49 Years | 184 (8.5%) | 223 (8.5%) |
| 50 to 54 Years | 217 (10.0%) | 277 (10.5%) |
| 55 to 59 Years | 78 (3.6%) | 136 (5.2%) |
| 60 to 64 Years | 90 (4.2%) | 186 (7.1%) |
| 65 to 69 Years | 323 (14.9%) | 222 (8.4%) |
| 70 to 74 Years | 75 (3.5%) | 124 (4.7%) |
| 75 to 79 Years | 45 (2.1%) | 96 (3.6%) |
| 80 to 84 Years | 91 (4.2%) | 98 (3.7%) |
| 85 Years and over | 30 (1.4%) | 14 (0.5%) |
| Total | 2,164 (100.0%) | 2,632 (100.0%) |
Families and Households in West Elmira
Median Family Size in West Elmira
The median family size in West Elmira is 2.82 persons per family, with single female/mother families (187 | 13.7%) accounting for the largest median family size of 3.33 persons per family. On the other hand, single male/father families (134 | 9.8%) represent the smallest median family size with 1.99 persons per family.
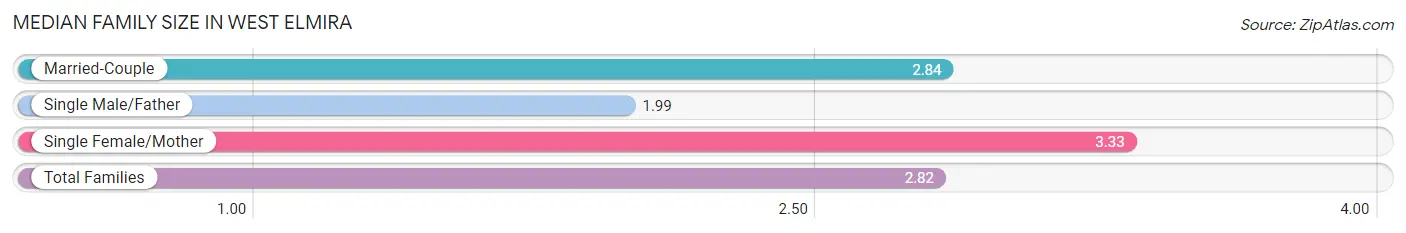
| Family Type | # Families | Family Size |
| Married-Couple | 1,046 (76.5%) | 2.84 |
| Single Male/Father | 134 (9.8%) | 1.99 |
| Single Female/Mother | 187 (13.7%) | 3.33 |
| Total Families | 1,367 (100.0%) | 2.82 |
Median Household Size in West Elmira
The median household size in West Elmira is 2.35 persons per household, with single female/mother households (187 | 9.2%) accounting for the largest median household size of 3.4 persons per household. non-family households (663 | 32.7%) represent the smallest median household size with 1.27 persons per household.
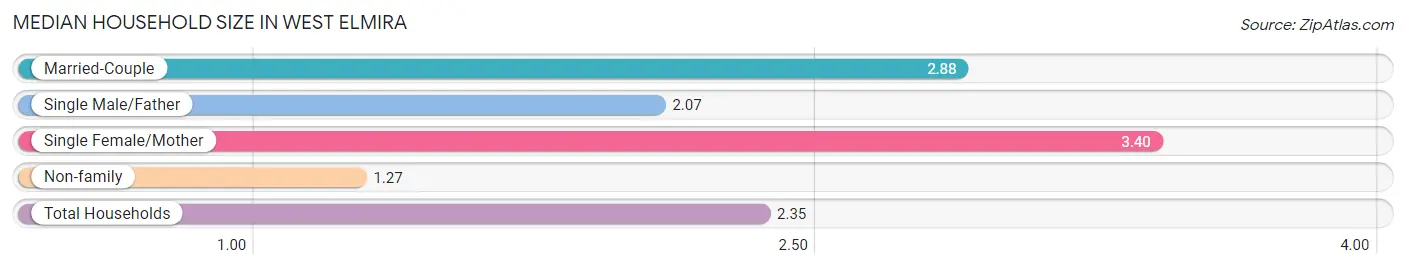
| Household Type | # Households | Household Size |
| Married-Couple | 1,046 (51.5%) | 2.88 |
| Single Male/Father | 134 (6.6%) | 2.07 |
| Single Female/Mother | 187 (9.2%) | 3.40 |
| Non-family | 663 (32.7%) | 1.27 |
| Total Households | 2,030 (100.0%) | 2.35 |
Household Size by Marriage Status in West Elmira
Out of a total of 2,030 households in West Elmira, 1,367 (67.3%) are family households, while 663 (32.7%) are nonfamily households. The most numerous type of family households are 2-person households, comprising 700, and the most common type of nonfamily households are 1-person households, comprising 493.
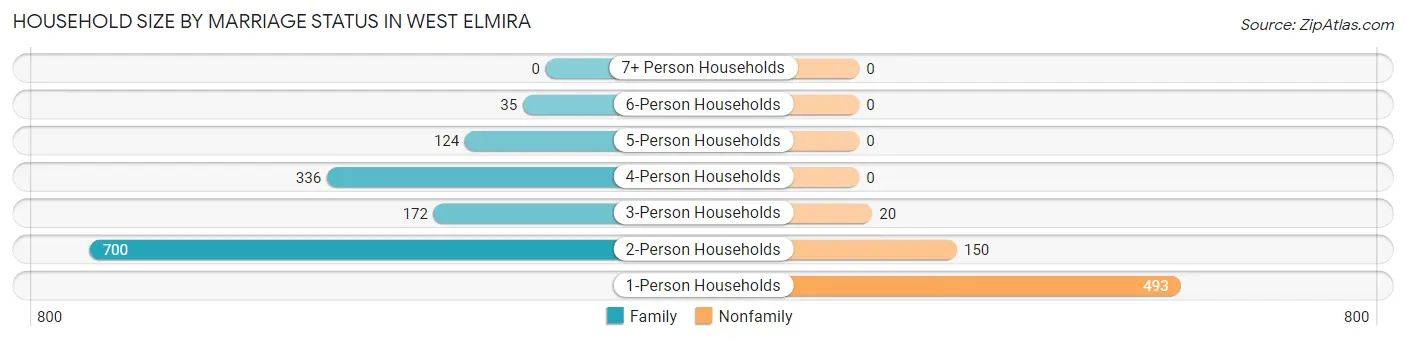
| Household Size | Family Households | Nonfamily Households |
| 1-Person Households | - | 493 (24.3%) |
| 2-Person Households | 700 (34.5%) | 150 (7.4%) |
| 3-Person Households | 172 (8.5%) | 20 (1.0%) |
| 4-Person Households | 336 (16.6%) | 0 (0.0%) |
| 5-Person Households | 124 (6.1%) | 0 (0.0%) |
| 6-Person Households | 35 (1.7%) | 0 (0.0%) |
| 7+ Person Households | 0 (0.0%) | 0 (0.0%) |
| Total | 1,367 (67.3%) | 663 (32.7%) |
Female Fertility in West Elmira
Fertility by Age in West Elmira
Average fertility rate in West Elmira is 20.0 births per 1,000 women. Women in the age bracket of 35 to 50 years have the highest fertility rate with 33.0 births per 1,000 women. Women in the age bracket of 35 to 50 years acount for 100.0% of all women with births.
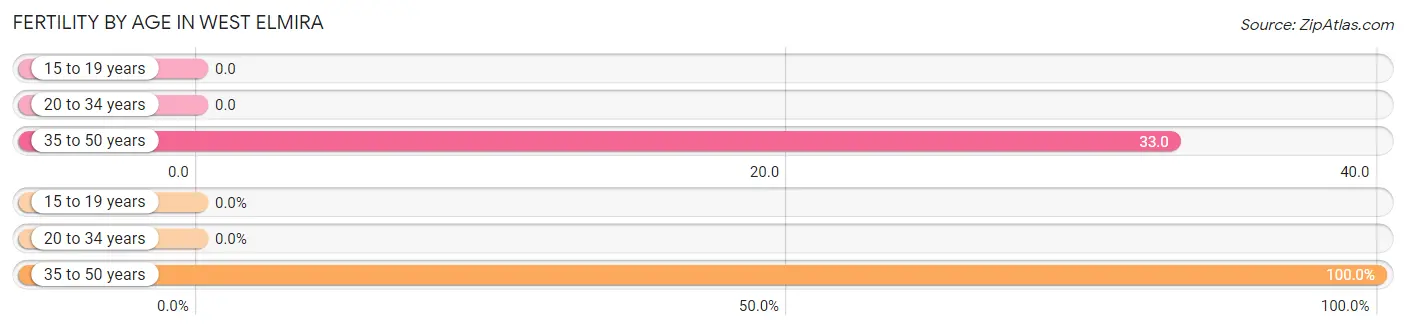
| Age Bracket | Women with Births | Births / 1,000 Women |
| 15 to 19 years | 0 (0.0%) | 0.0 |
| 20 to 34 years | 0 (0.0%) | 0.0 |
| 35 to 50 years | 23 (100.0%) | 33.0 |
| Total | 23 (100.0%) | 20.0 |
Fertility by Age by Marriage Status in West Elmira
30.4% of women with births (23) in West Elmira are married. The highest percentage of unmarried women with births falls into 35 to 50 years age bracket with 69.6% of them unmarried at the time of birth, while the lowest percentage of unmarried women with births belong to 35 to 50 years age bracket with 69.6% of them unmarried.
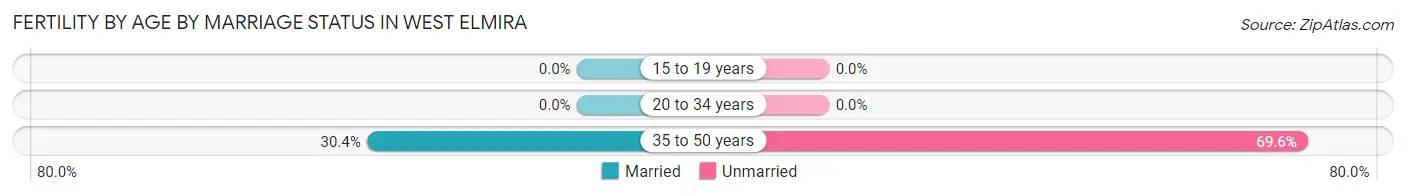
| Age Bracket | Married | Unmarried |
| 15 to 19 years | 0 (0.0%) | 0 (0.0%) |
| 20 to 34 years | 0 (0.0%) | 0 (0.0%) |
| 35 to 50 years | 7 (30.4%) | 16 (69.6%) |
| Total | 7 (30.4%) | 16 (69.6%) |
Fertility by Education in West Elmira
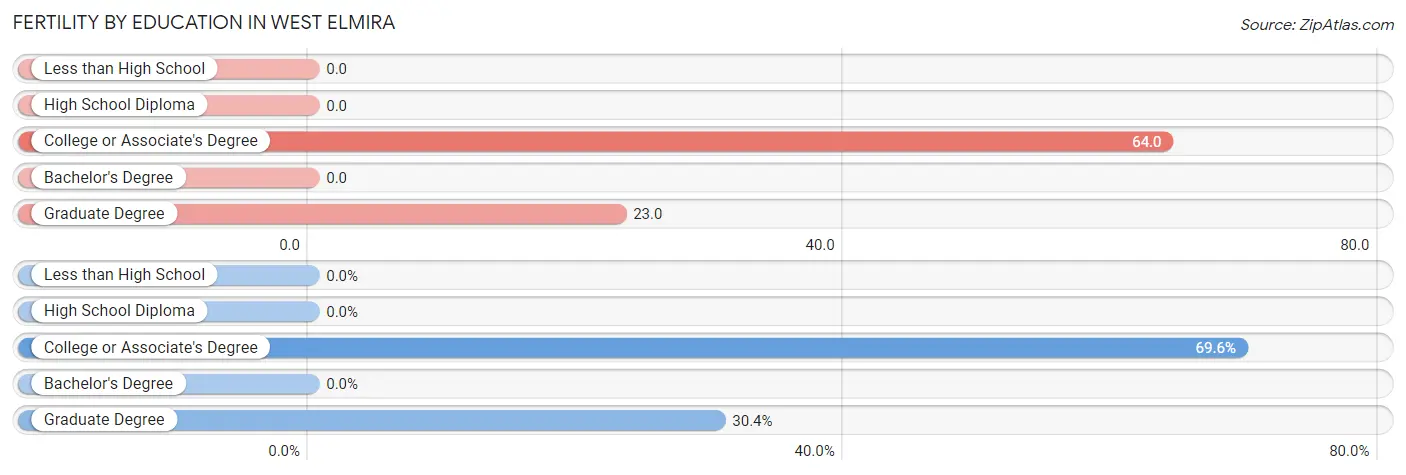
| Educational Attainment | Women with Births | Births / 1,000 Women |
| Less than High School | 0 (0.0%) | 0.0 |
| High School Diploma | 0 (0.0%) | 0.0 |
| College or Associate's Degree | 16 (69.6%) | 64.0 |
| Bachelor's Degree | 0 (0.0%) | 0.0 |
| Graduate Degree | 7 (30.4%) | 23.0 |
| Total | 23 (100.0%) | 20.0 |
Fertility by Education by Marriage Status in West Elmira
69.6% of women with births in West Elmira are unmarried. Women with the educational attainment of graduate degree are most likely to be married with 100.0% of them married at childbirth, while women with the educational attainment of college or associate's degree are least likely to be married with 100.0% of them unmarried at childbirth.
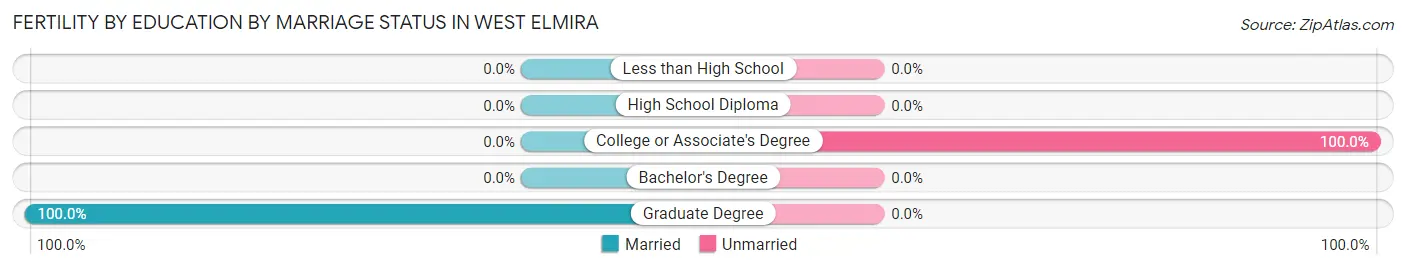
| Educational Attainment | Married | Unmarried |
| Less than High School | 0 (0.0%) | 0 (0.0%) |
| High School Diploma | 0 (0.0%) | 0 (0.0%) |
| College or Associate's Degree | 0 (0.0%) | 16 (100.0%) |
| Bachelor's Degree | 0 (0.0%) | 0 (0.0%) |
| Graduate Degree | 7 (100.0%) | 0 (0.0%) |
| Total | 7 (30.4%) | 16 (69.6%) |
Employment Characteristics in West Elmira
Employment by Class of Employer in West Elmira
Among the 2,530 employed individuals in West Elmira, private company employees (1,441 | 57.0%), not-for-profit organizations (315 | 12.4%), and state government employees (281 | 11.1%) make up the most common classes of employment.
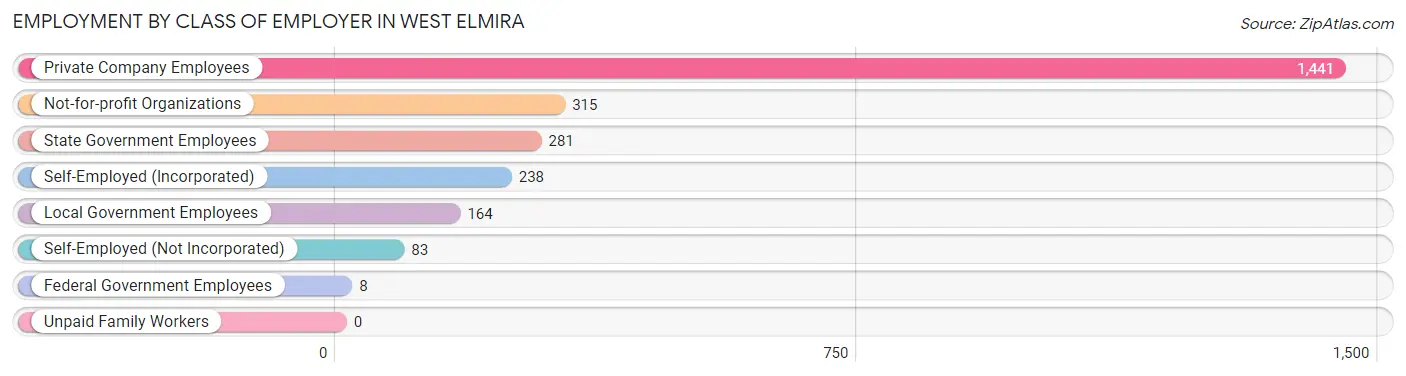
| Employer Class | # Employees | % Employees |
| Private Company Employees | 1,441 | 57.0% |
| Self-Employed (Incorporated) | 238 | 9.4% |
| Self-Employed (Not Incorporated) | 83 | 3.3% |
| Not-for-profit Organizations | 315 | 12.4% |
| Local Government Employees | 164 | 6.5% |
| State Government Employees | 281 | 11.1% |
| Federal Government Employees | 8 | 0.3% |
| Unpaid Family Workers | 0 | 0.0% |
| Total | 2,530 | 100.0% |
Employment Status by Age in West Elmira
According to the labor force statistics for West Elmira, out of the total population over 16 years of age (3,944), 67.3% or 2,654 individuals are in the labor force, with 4.2% or 111 of them unemployed. The age group with the highest labor force participation rate is 20 to 24 years, with 100.0% or 117 individuals in the labor force. Within the labor force, the 25 to 29 years age range has the highest percentage of unemployed individuals, with 22.0% or 54 of them being unemployed.
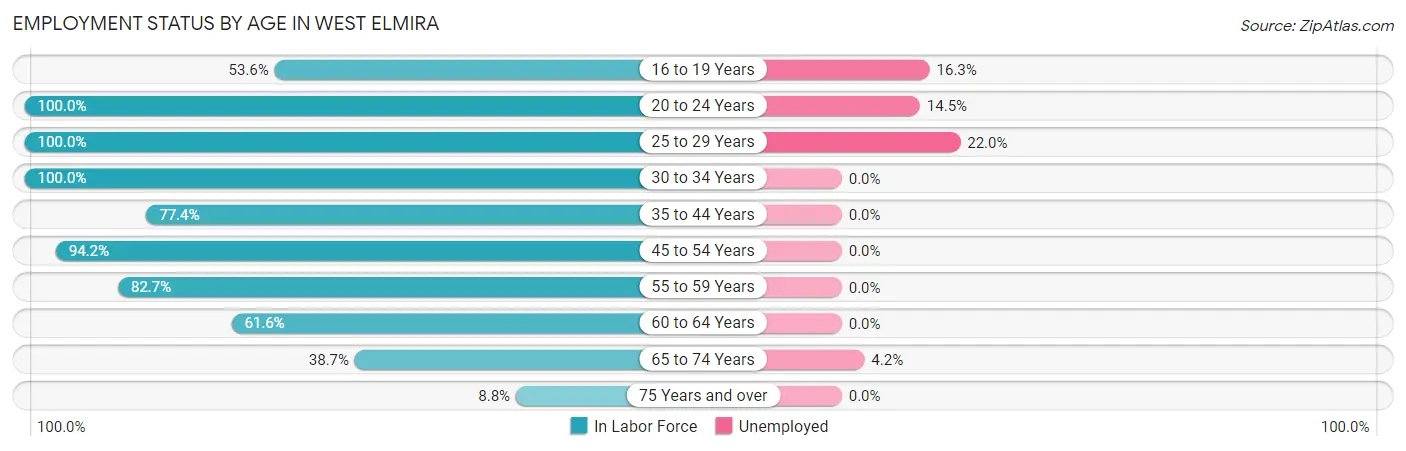
| Age Bracket | In Labor Force | Unemployed |
| 16 to 19 Years | 178 (53.6%) | 29 (16.3%) |
| 20 to 24 Years | 117 (100.0%) | 17 (14.5%) |
| 25 to 29 Years | 245 (100.0%) | 54 (22.0%) |
| 30 to 34 Years | 112 (100.0%) | 0 (0.0%) |
| 35 to 44 Years | 487 (77.4%) | 0 (0.0%) |
| 45 to 54 Years | 849 (94.2%) | 0 (0.0%) |
| 55 to 59 Years | 177 (82.7%) | 0 (0.0%) |
| 60 to 64 Years | 170 (61.6%) | 0 (0.0%) |
| 65 to 74 Years | 288 (38.7%) | 12 (4.2%) |
| 75 Years and over | 33 (8.8%) | 0 (0.0%) |
| Total | 2,654 (67.3%) | 111 (4.2%) |
Employment Status by Educational Attainment in West Elmira
According to labor force statistics for West Elmira, 85.8% of individuals (2,039) out of the total population between 25 and 64 years of age (2,377) are in the labor force, with 2.6% or 53 of them being unemployed. The group with the highest labor force participation rate are those with the educational attainment of bachelor's degree or higher, with 92.1% or 1,175 individuals in the labor force. Within the labor force, individuals with college / associate degree education have the highest percentage of unemployment, with 8.9% or 42 of them being unemployed.
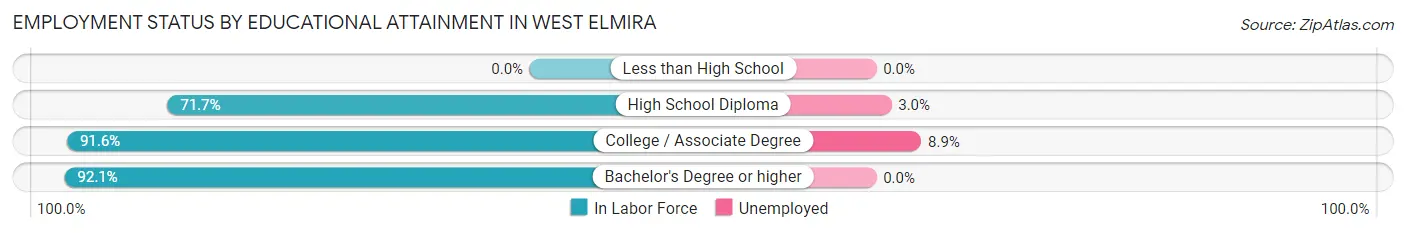
| Educational Attainment | In Labor Force | Unemployed |
| Less than High School | 0 (0.0%) | 0 (0.0%) |
| High School Diploma | 395 (71.7%) | 17 (3.0%) |
| College / Associate Degree | 470 (91.6%) | 46 (8.9%) |
| Bachelor's Degree or higher | 1,175 (92.1%) | 0 (0.0%) |
| Total | 2,039 (85.8%) | 62 (2.6%) |
Employment Occupations by Sex in West Elmira
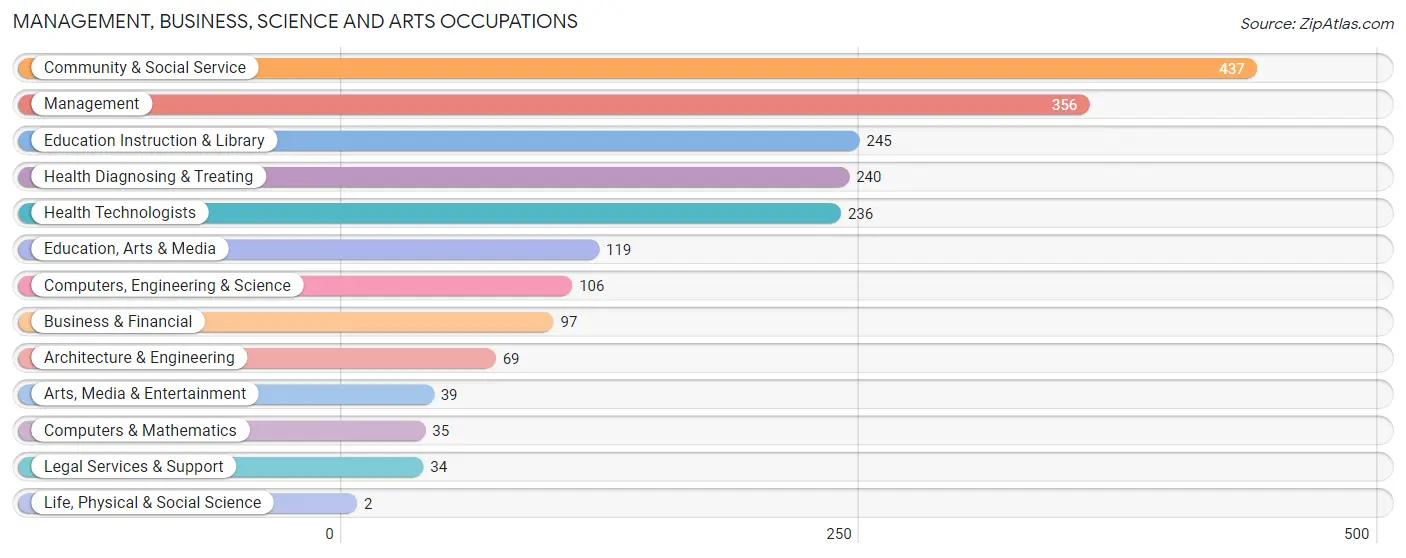
Management, Business, Science and Arts Occupations
The most common Management, Business, Science and Arts occupations in West Elmira are Community & Social Service (437 | 17.2%), Management (356 | 14.0%), Education Instruction & Library (245 | 9.6%), Health Diagnosing & Treating (240 | 9.4%), and Health Technologists (236 | 9.3%).
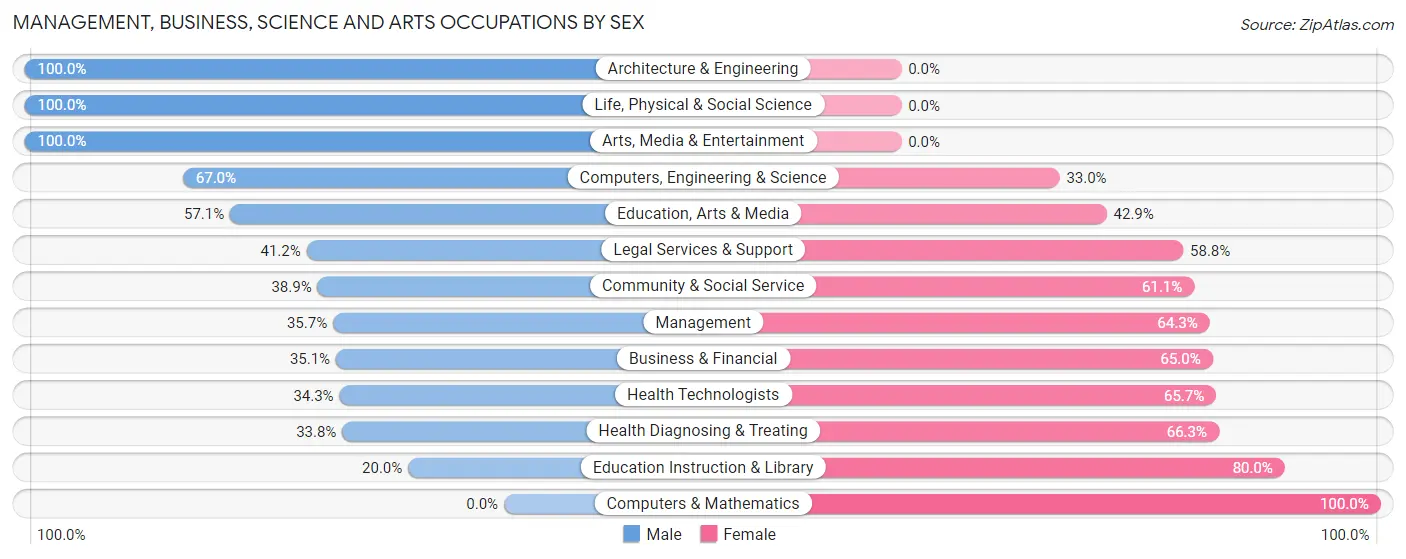
Management, Business, Science and Arts Occupations by Sex
Within the Management, Business, Science and Arts occupations in West Elmira, the most male-oriented occupations are Architecture & Engineering (100.0%), Life, Physical & Social Science (100.0%), and Arts, Media & Entertainment (100.0%), while the most female-oriented occupations are Computers & Mathematics (100.0%), Education Instruction & Library (80.0%), and Health Diagnosing & Treating (66.2%).
| Occupation | Male | Female |
| Management | 127 (35.7%) | 229 (64.3%) |
| Business & Financial | 34 (35.0%) | 63 (64.9%) |
| Computers, Engineering & Science | 71 (67.0%) | 35 (33.0%) |
| Computers & Mathematics | 0 (0.0%) | 35 (100.0%) |
| Architecture & Engineering | 69 (100.0%) | 0 (0.0%) |
| Life, Physical & Social Science | 2 (100.0%) | 0 (0.0%) |
| Community & Social Service | 170 (38.9%) | 267 (61.1%) |
| Education, Arts & Media | 68 (57.1%) | 51 (42.9%) |
| Legal Services & Support | 14 (41.2%) | 20 (58.8%) |
| Education Instruction & Library | 49 (20.0%) | 196 (80.0%) |
| Arts, Media & Entertainment | 39 (100.0%) | 0 (0.0%) |
| Health Diagnosing & Treating | 81 (33.8%) | 159 (66.2%) |
| Health Technologists | 81 (34.3%) | 155 (65.7%) |
| Total (Category) | 483 (39.1%) | 753 (60.9%) |
| Total (Overall) | 1,301 (51.1%) | 1,243 (48.9%) |
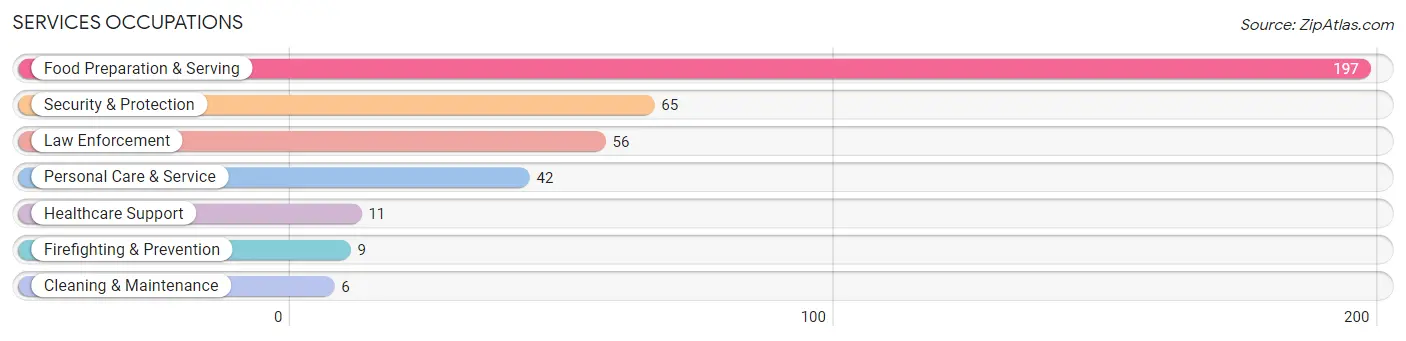
Services Occupations
The most common Services occupations in West Elmira are Food Preparation & Serving (197 | 7.7%), Security & Protection (65 | 2.6%), Law Enforcement (56 | 2.2%), Personal Care & Service (42 | 1.7%), and Healthcare Support (11 | 0.4%).
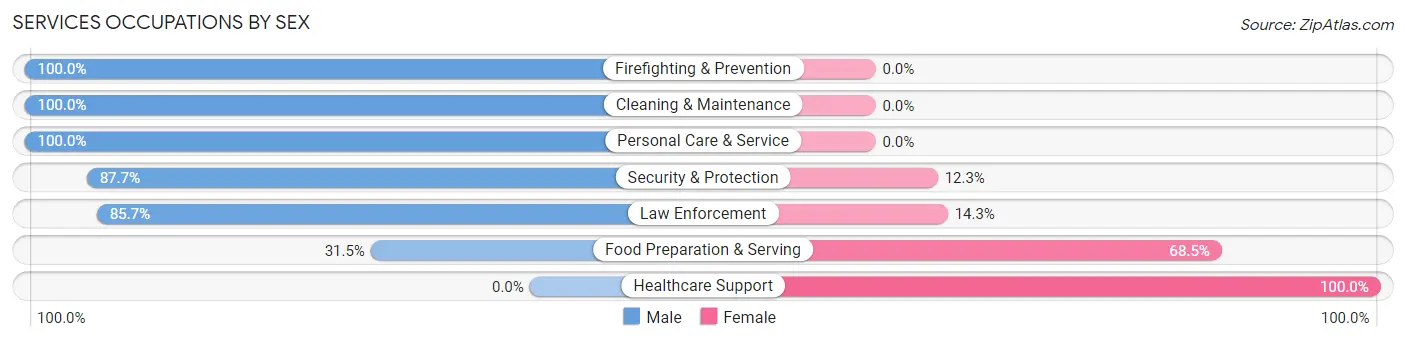
Services Occupations by Sex
Within the Services occupations in West Elmira, the most male-oriented occupations are Firefighting & Prevention (100.0%), Cleaning & Maintenance (100.0%), and Personal Care & Service (100.0%), while the most female-oriented occupations are Healthcare Support (100.0%), Food Preparation & Serving (68.5%), and Law Enforcement (14.3%).
| Occupation | Male | Female |
| Healthcare Support | 0 (0.0%) | 11 (100.0%) |
| Security & Protection | 57 (87.7%) | 8 (12.3%) |
| Firefighting & Prevention | 9 (100.0%) | 0 (0.0%) |
| Law Enforcement | 48 (85.7%) | 8 (14.3%) |
| Food Preparation & Serving | 62 (31.5%) | 135 (68.5%) |
| Cleaning & Maintenance | 6 (100.0%) | 0 (0.0%) |
| Personal Care & Service | 42 (100.0%) | 0 (0.0%) |
| Total (Category) | 167 (52.0%) | 154 (48.0%) |
| Total (Overall) | 1,301 (51.1%) | 1,243 (48.9%) |
Sales and Office Occupations
The most common Sales and Office occupations in West Elmira are Sales & Related (275 | 10.8%), and Office & Administration (166 | 6.5%).
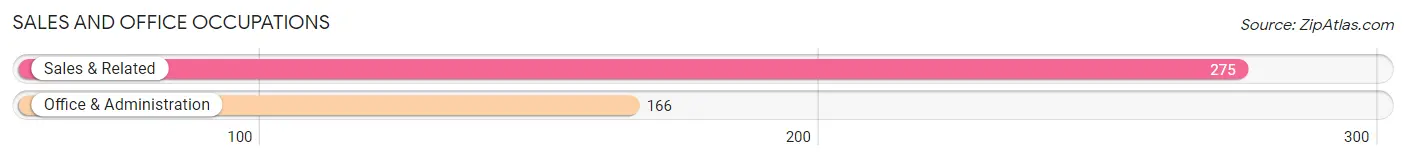
Sales and Office Occupations by Sex
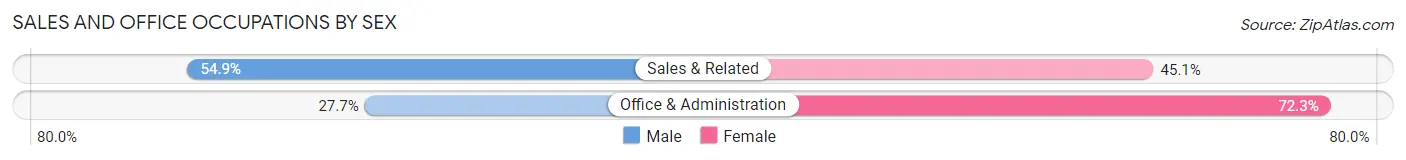
| Occupation | Male | Female |
| Sales & Related | 151 (54.9%) | 124 (45.1%) |
| Office & Administration | 46 (27.7%) | 120 (72.3%) |
| Total (Category) | 197 (44.7%) | 244 (55.3%) |
| Total (Overall) | 1,301 (51.1%) | 1,243 (48.9%) |
Natural Resources, Construction and Maintenance Occupations
The most common Natural Resources, Construction and Maintenance occupations in West Elmira are Construction & Extraction (160 | 6.3%), and Installation, Maintenance & Repair (54 | 2.1%).
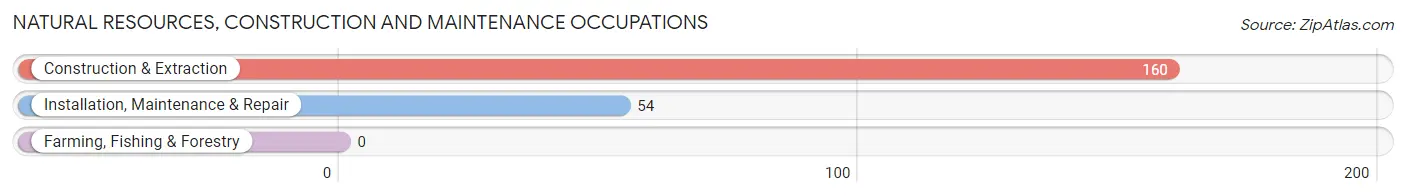
Natural Resources, Construction and Maintenance Occupations by Sex
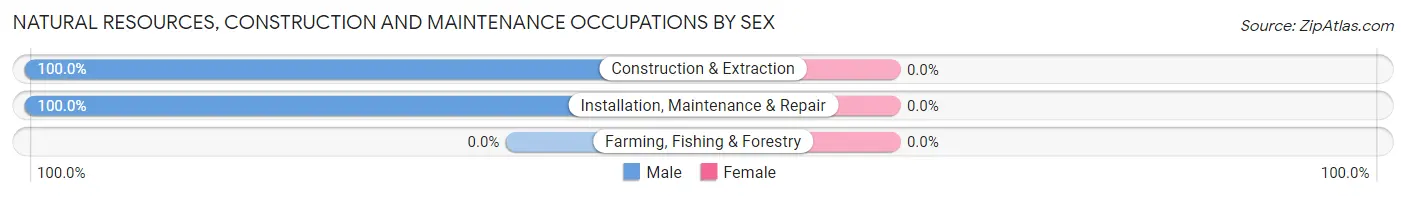
| Occupation | Male | Female |
| Farming, Fishing & Forestry | 0 (0.0%) | 0 (0.0%) |
| Construction & Extraction | 160 (100.0%) | 0 (0.0%) |
| Installation, Maintenance & Repair | 54 (100.0%) | 0 (0.0%) |
| Total (Category) | 214 (100.0%) | 0 (0.0%) |
| Total (Overall) | 1,301 (51.1%) | 1,243 (48.9%) |
Production, Transportation and Moving Occupations
The most common Production, Transportation and Moving occupations in West Elmira are Transportation (168 | 6.6%), Production (146 | 5.7%), and Material Moving (18 | 0.7%).
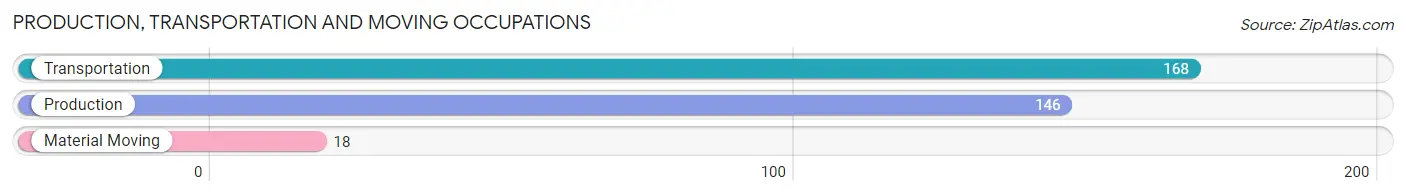
Production, Transportation and Moving Occupations by Sex
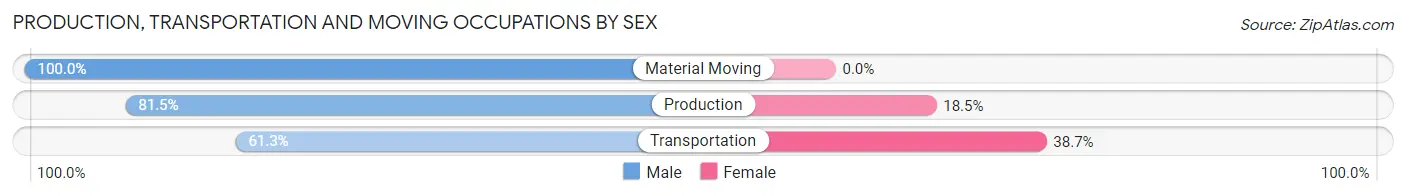
| Occupation | Male | Female |
| Production | 119 (81.5%) | 27 (18.5%) |
| Transportation | 103 (61.3%) | 65 (38.7%) |
| Material Moving | 18 (100.0%) | 0 (0.0%) |
| Total (Category) | 240 (72.3%) | 92 (27.7%) |
| Total (Overall) | 1,301 (51.1%) | 1,243 (48.9%) |
Employment Industries by Sex in West Elmira
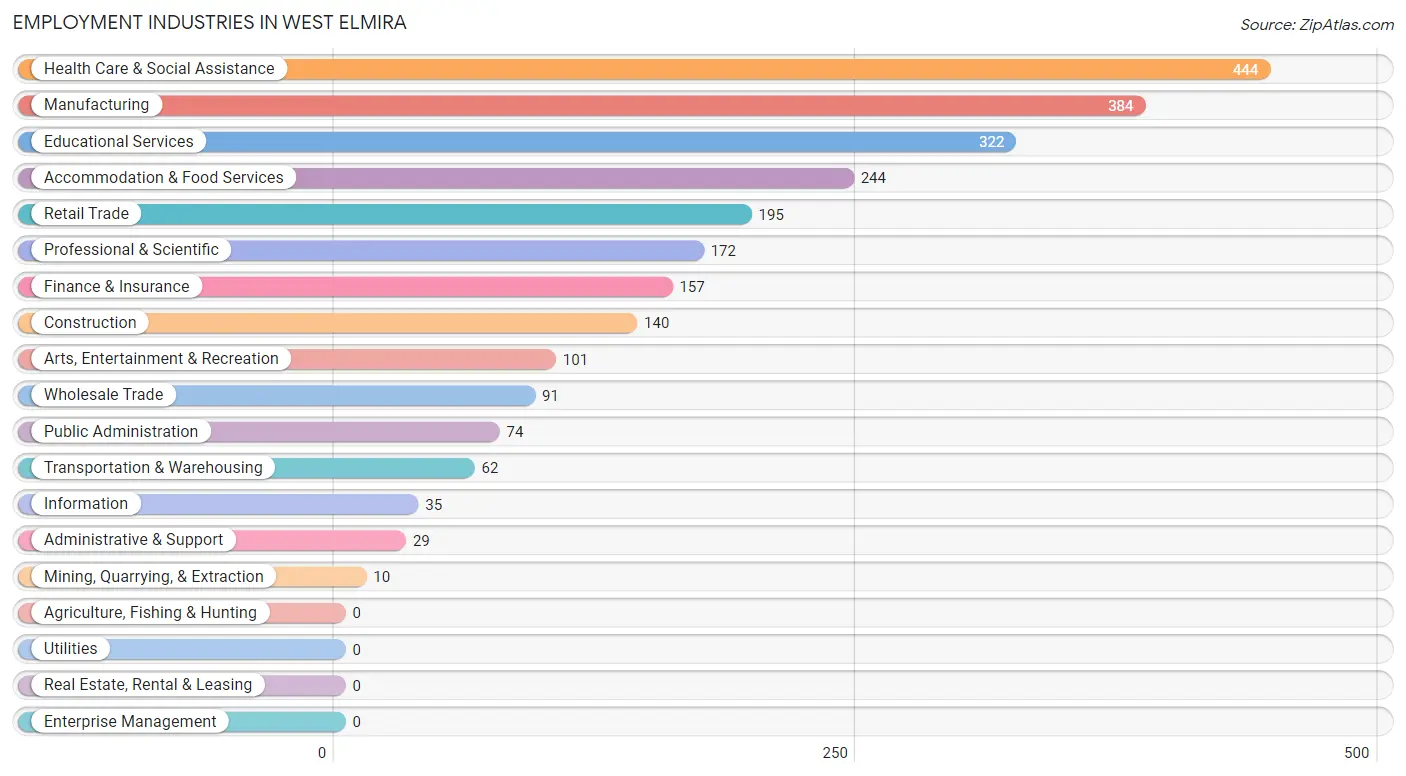
Employment Industries in West Elmira
The major employment industries in West Elmira include Health Care & Social Assistance (444 | 17.4%), Manufacturing (384 | 15.1%), Educational Services (322 | 12.7%), Accommodation & Food Services (244 | 9.6%), and Retail Trade (195 | 7.7%).
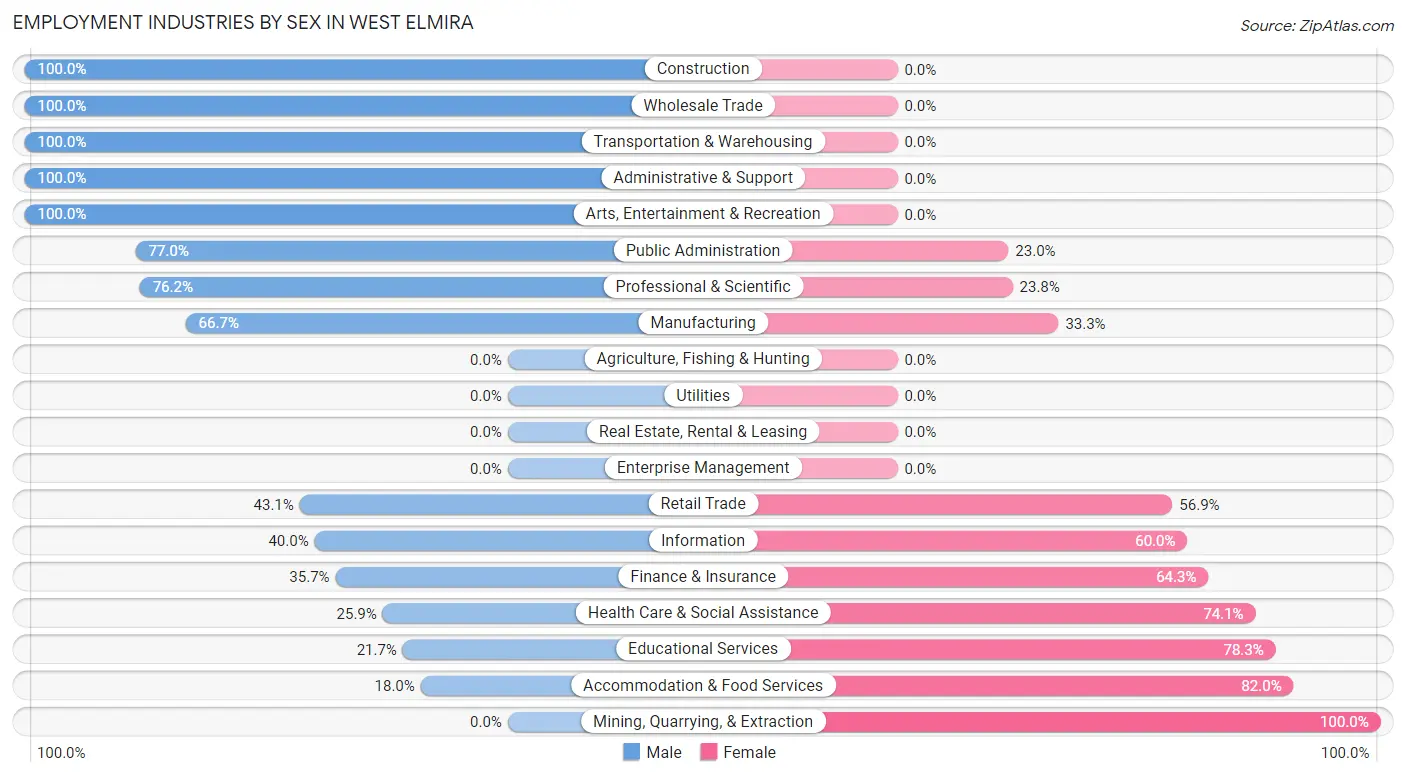
Employment Industries by Sex in West Elmira
The West Elmira industries that see more men than women are Construction (100.0%), Wholesale Trade (100.0%), and Transportation & Warehousing (100.0%), whereas the industries that tend to have a higher number of women are Mining, Quarrying, & Extraction (100.0%), Accommodation & Food Services (82.0%), and Educational Services (78.3%).
| Industry | Male | Female |
| Agriculture, Fishing & Hunting | 0 (0.0%) | 0 (0.0%) |
| Mining, Quarrying, & Extraction | 0 (0.0%) | 10 (100.0%) |
| Construction | 140 (100.0%) | 0 (0.0%) |
| Manufacturing | 256 (66.7%) | 128 (33.3%) |
| Wholesale Trade | 91 (100.0%) | 0 (0.0%) |
| Retail Trade | 84 (43.1%) | 111 (56.9%) |
| Transportation & Warehousing | 62 (100.0%) | 0 (0.0%) |
| Utilities | 0 (0.0%) | 0 (0.0%) |
| Information | 14 (40.0%) | 21 (60.0%) |
| Finance & Insurance | 56 (35.7%) | 101 (64.3%) |
| Real Estate, Rental & Leasing | 0 (0.0%) | 0 (0.0%) |
| Professional & Scientific | 131 (76.2%) | 41 (23.8%) |
| Enterprise Management | 0 (0.0%) | 0 (0.0%) |
| Administrative & Support | 29 (100.0%) | 0 (0.0%) |
| Educational Services | 70 (21.7%) | 252 (78.3%) |
| Health Care & Social Assistance | 115 (25.9%) | 329 (74.1%) |
| Arts, Entertainment & Recreation | 101 (100.0%) | 0 (0.0%) |
| Accommodation & Food Services | 44 (18.0%) | 200 (82.0%) |
| Public Administration | 57 (77.0%) | 17 (23.0%) |
| Total | 1,301 (51.1%) | 1,243 (48.9%) |
Education in West Elmira
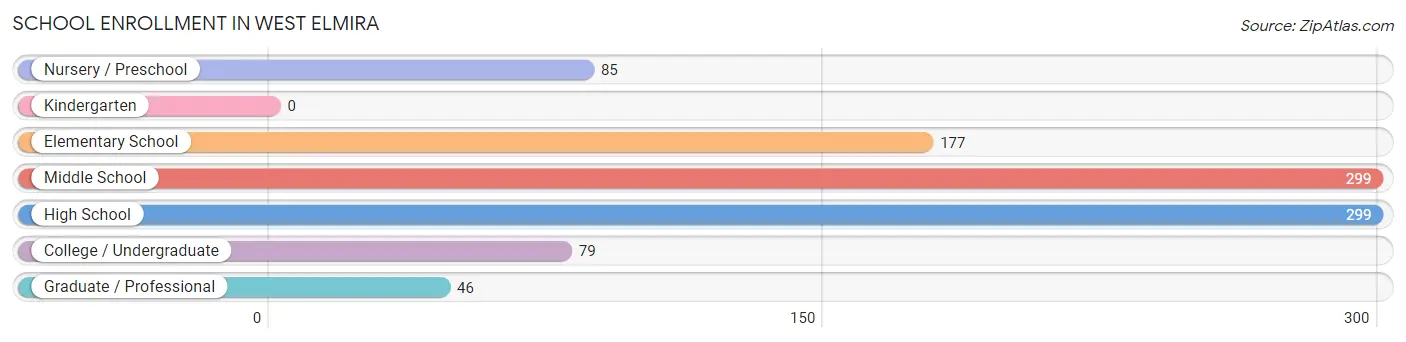
School Enrollment in West Elmira
The most common levels of schooling among the 985 students in West Elmira are middle school (299 | 30.4%), high school (299 | 30.4%), and elementary school (177 | 18.0%).
| School Level | # Students | % Students |
| Nursery / Preschool | 85 | 8.6% |
| Kindergarten | 0 | 0.0% |
| Elementary School | 177 | 18.0% |
| Middle School | 299 | 30.4% |
| High School | 299 | 30.4% |
| College / Undergraduate | 79 | 8.0% |
| Graduate / Professional | 46 | 4.7% |
| Total | 985 | 100.0% |
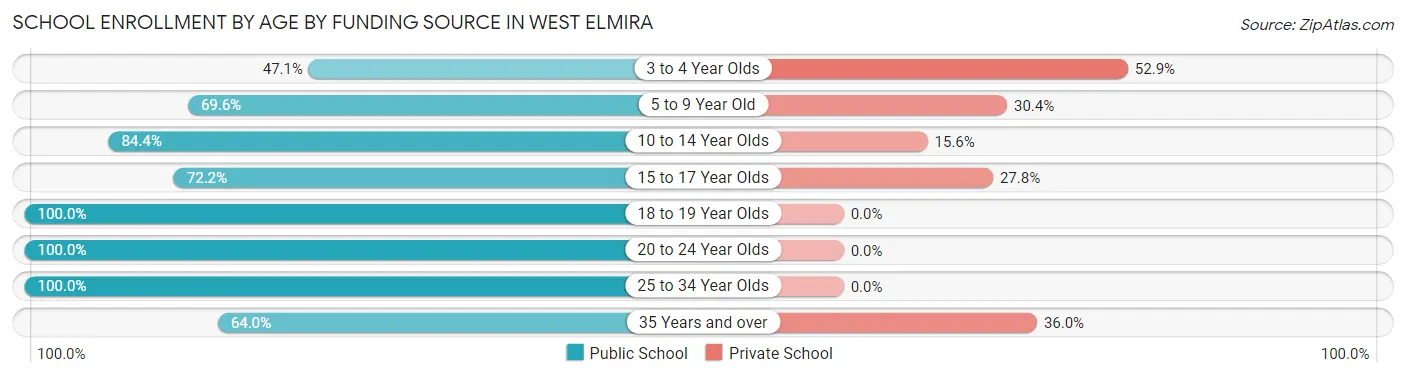
School Enrollment by Age by Funding Source in West Elmira
Out of a total of 985 students who are enrolled in schools in West Elmira, 217 (22.0%) attend a private institution, while the remaining 768 (78.0%) are enrolled in public schools. The age group of 3 to 4 year olds has the highest likelihood of being enrolled in private schools, with 45 (52.9% in the age bracket) enrolled. Conversely, the age group of 18 to 19 year olds has the lowest likelihood of being enrolled in a private school, with 74 (100.0% in the age bracket) attending a public institution.
| Age Bracket | Public School | Private School |
| 3 to 4 Year Olds | 40 (47.1%) | 45 (52.9%) |
| 5 to 9 Year Old | 112 (69.6%) | 49 (30.4%) |
| 10 to 14 Year Olds | 340 (84.4%) | 63 (15.6%) |
| 15 to 17 Year Olds | 109 (72.2%) | 42 (27.8%) |
| 18 to 19 Year Olds | 74 (100.0%) | 0 (0.0%) |
| 20 to 24 Year Olds | 17 (100.0%) | 0 (0.0%) |
| 25 to 34 Year Olds | 44 (100.0%) | 0 (0.0%) |
| 35 Years and over | 32 (64.0%) | 18 (36.0%) |
| Total | 768 (78.0%) | 217 (22.0%) |
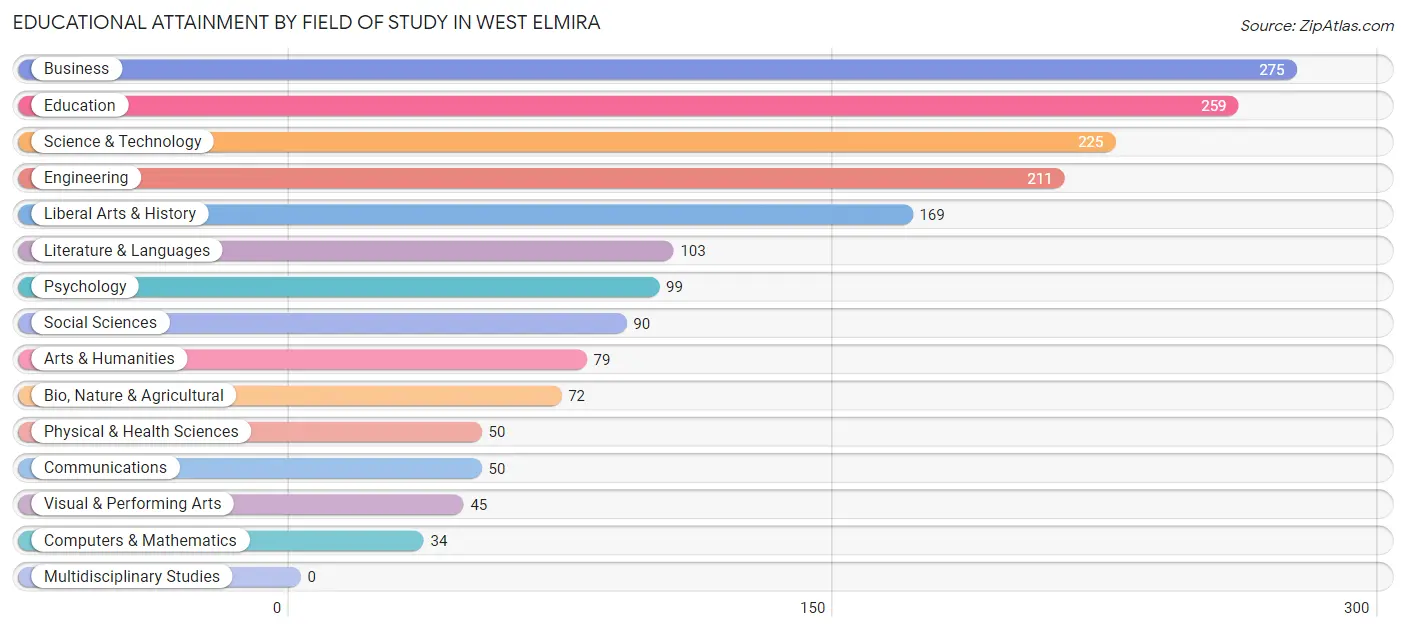
Educational Attainment by Field of Study in West Elmira
Business (275 | 15.6%), education (259 | 14.7%), science & technology (225 | 12.8%), engineering (211 | 12.0%), and liberal arts & history (169 | 9.6%) are the most common fields of study among 1,761 individuals in West Elmira who have obtained a bachelor's degree or higher.
| Field of Study | # Graduates | % Graduates |
| Computers & Mathematics | 34 | 1.9% |
| Bio, Nature & Agricultural | 72 | 4.1% |
| Physical & Health Sciences | 50 | 2.8% |
| Psychology | 99 | 5.6% |
| Social Sciences | 90 | 5.1% |
| Engineering | 211 | 12.0% |
| Multidisciplinary Studies | 0 | 0.0% |
| Science & Technology | 225 | 12.8% |
| Business | 275 | 15.6% |
| Education | 259 | 14.7% |
| Literature & Languages | 103 | 5.9% |
| Liberal Arts & History | 169 | 9.6% |
| Visual & Performing Arts | 45 | 2.6% |
| Communications | 50 | 2.8% |
| Arts & Humanities | 79 | 4.5% |
| Total | 1,761 | 100.0% |
Transportation & Commute in West Elmira
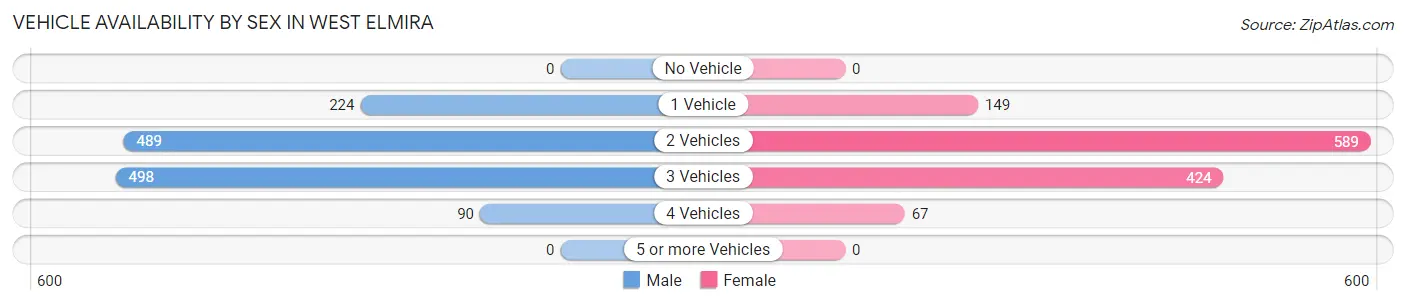
Vehicle Availability by Sex in West Elmira
The most prevalent vehicle ownership categories in West Elmira are males with 3 vehicles (498, accounting for 38.3%) and females with 3 vehicles (424, making up 40.5%).
| Vehicles Available | Male | Female |
| No Vehicle | 0 (0.0%) | 0 (0.0%) |
| 1 Vehicle | 224 (17.2%) | 149 (12.1%) |
| 2 Vehicles | 489 (37.6%) | 589 (47.9%) |
| 3 Vehicles | 498 (38.3%) | 424 (34.5%) |
| 4 Vehicles | 90 (6.9%) | 67 (5.4%) |
| 5 or more Vehicles | 0 (0.0%) | 0 (0.0%) |
| Total | 1,301 (100.0%) | 1,229 (100.0%) |
Commute Time in West Elmira
The most frequently occuring commute durations in West Elmira are 15 to 19 minutes (569 commuters, 24.6%), 10 to 14 minutes (553 commuters, 24.0%), and 5 to 9 minutes (248 commuters, 10.7%).
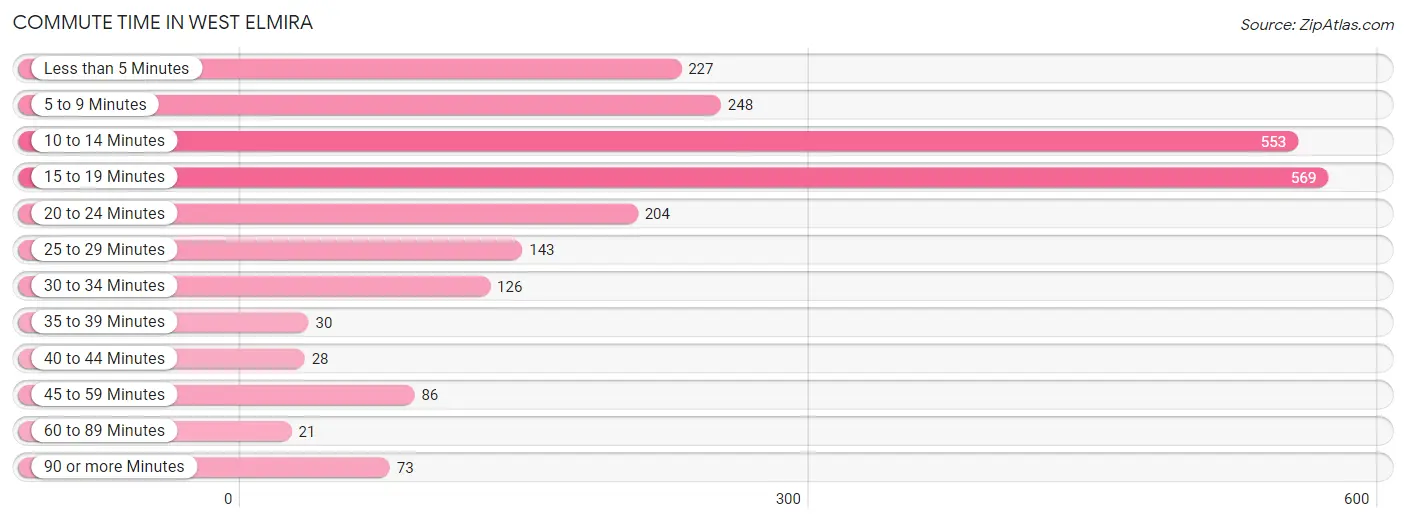
| Commute Time | # Commuters | % Commuters |
| Less than 5 Minutes | 227 | 9.8% |
| 5 to 9 Minutes | 248 | 10.7% |
| 10 to 14 Minutes | 553 | 24.0% |
| 15 to 19 Minutes | 569 | 24.6% |
| 20 to 24 Minutes | 204 | 8.8% |
| 25 to 29 Minutes | 143 | 6.2% |
| 30 to 34 Minutes | 126 | 5.5% |
| 35 to 39 Minutes | 30 | 1.3% |
| 40 to 44 Minutes | 28 | 1.2% |
| 45 to 59 Minutes | 86 | 3.7% |
| 60 to 89 Minutes | 21 | 0.9% |
| 90 or more Minutes | 73 | 3.2% |
Commute Time by Sex in West Elmira
The most common commute times in West Elmira are 15 to 19 minutes (403 commuters, 32.1%) for males and 10 to 14 minutes (286 commuters, 27.2%) for females.
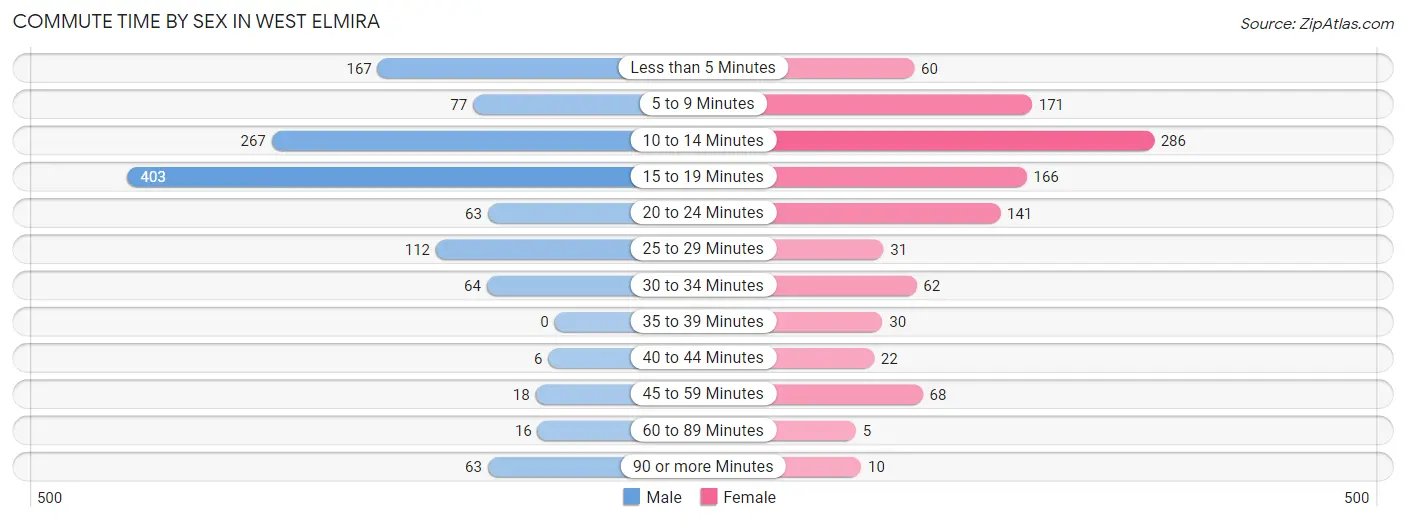
| Commute Time | Male | Female |
| Less than 5 Minutes | 167 (13.3%) | 60 (5.7%) |
| 5 to 9 Minutes | 77 (6.1%) | 171 (16.3%) |
| 10 to 14 Minutes | 267 (21.3%) | 286 (27.2%) |
| 15 to 19 Minutes | 403 (32.1%) | 166 (15.8%) |
| 20 to 24 Minutes | 63 (5.0%) | 141 (13.4%) |
| 25 to 29 Minutes | 112 (8.9%) | 31 (2.9%) |
| 30 to 34 Minutes | 64 (5.1%) | 62 (5.9%) |
| 35 to 39 Minutes | 0 (0.0%) | 30 (2.9%) |
| 40 to 44 Minutes | 6 (0.5%) | 22 (2.1%) |
| 45 to 59 Minutes | 18 (1.4%) | 68 (6.5%) |
| 60 to 89 Minutes | 16 (1.3%) | 5 (0.5%) |
| 90 or more Minutes | 63 (5.0%) | 10 (0.9%) |
Time of Departure to Work by Sex in West Elmira
The most frequent times of departure to work in West Elmira are 8:00 AM to 8:29 AM (211, 16.8%) for males and 7:00 AM to 7:29 AM (268, 25.5%) for females.
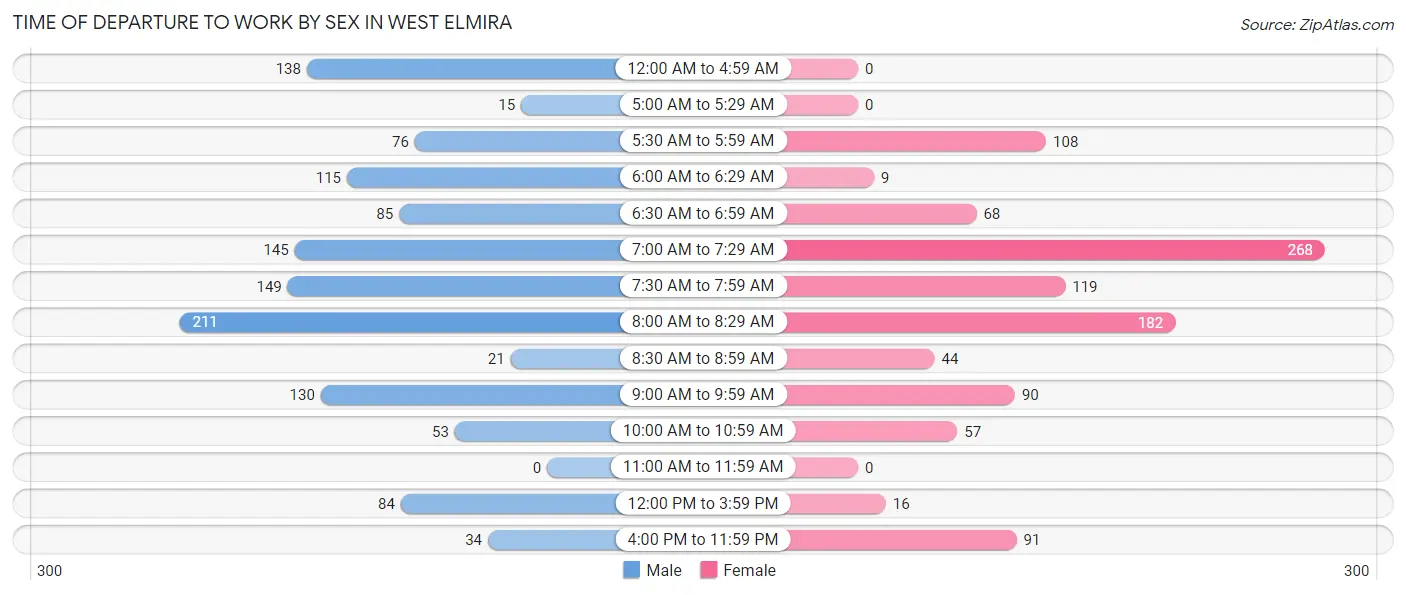
| Time of Departure | Male | Female |
| 12:00 AM to 4:59 AM | 138 (11.0%) | 0 (0.0%) |
| 5:00 AM to 5:29 AM | 15 (1.2%) | 0 (0.0%) |
| 5:30 AM to 5:59 AM | 76 (6.0%) | 108 (10.3%) |
| 6:00 AM to 6:29 AM | 115 (9.2%) | 9 (0.9%) |
| 6:30 AM to 6:59 AM | 85 (6.8%) | 68 (6.5%) |
| 7:00 AM to 7:29 AM | 145 (11.5%) | 268 (25.5%) |
| 7:30 AM to 7:59 AM | 149 (11.9%) | 119 (11.3%) |
| 8:00 AM to 8:29 AM | 211 (16.8%) | 182 (17.3%) |
| 8:30 AM to 8:59 AM | 21 (1.7%) | 44 (4.2%) |
| 9:00 AM to 9:59 AM | 130 (10.3%) | 90 (8.6%) |
| 10:00 AM to 10:59 AM | 53 (4.2%) | 57 (5.4%) |
| 11:00 AM to 11:59 AM | 0 (0.0%) | 0 (0.0%) |
| 12:00 PM to 3:59 PM | 84 (6.7%) | 16 (1.5%) |
| 4:00 PM to 11:59 PM | 34 (2.7%) | 91 (8.6%) |
| Total | 1,256 (100.0%) | 1,052 (100.0%) |
Housing Occupancy in West Elmira
Occupancy by Ownership in West Elmira
Of the total 2,030 dwellings in West Elmira, owner-occupied units account for 1,828 (90.0%), while renter-occupied units make up 202 (10.0%).
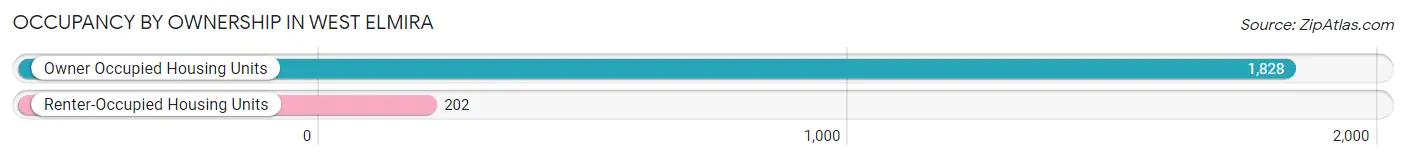
| Occupancy | # Housing Units | % Housing Units |
| Owner Occupied Housing Units | 1,828 | 90.0% |
| Renter-Occupied Housing Units | 202 | 10.0% |
| Total Occupied Housing Units | 2,030 | 100.0% |
Occupancy by Household Size in West Elmira
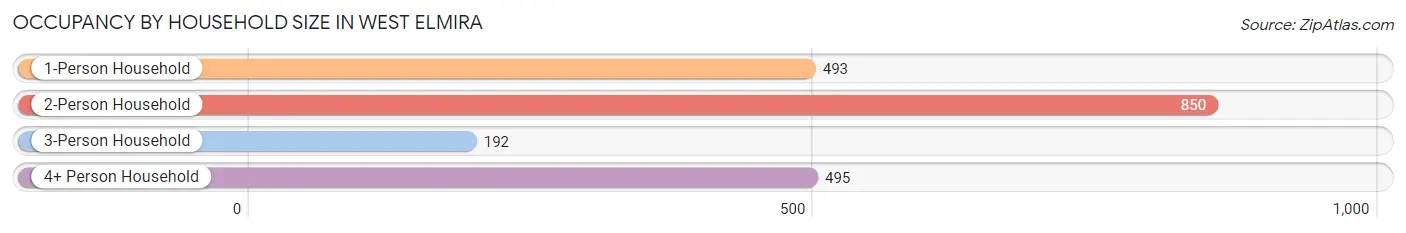
| Household Size | # Housing Units | % Housing Units |
| 1-Person Household | 493 | 24.3% |
| 2-Person Household | 850 | 41.9% |
| 3-Person Household | 192 | 9.5% |
| 4+ Person Household | 495 | 24.4% |
| Total Housing Units | 2,030 | 100.0% |
Occupancy by Ownership by Household Size in West Elmira
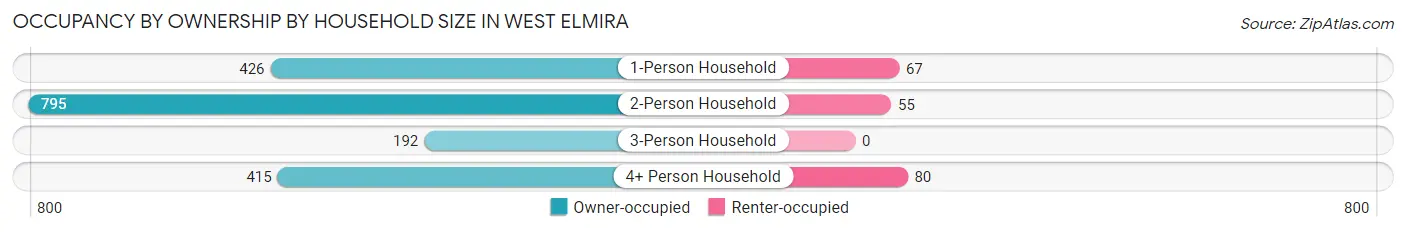
| Household Size | Owner-occupied | Renter-occupied |
| 1-Person Household | 426 (86.4%) | 67 (13.6%) |
| 2-Person Household | 795 (93.5%) | 55 (6.5%) |
| 3-Person Household | 192 (100.0%) | 0 (0.0%) |
| 4+ Person Household | 415 (83.8%) | 80 (16.2%) |
| Total Housing Units | 1,828 (90.0%) | 202 (10.0%) |
Occupancy by Educational Attainment in West Elmira
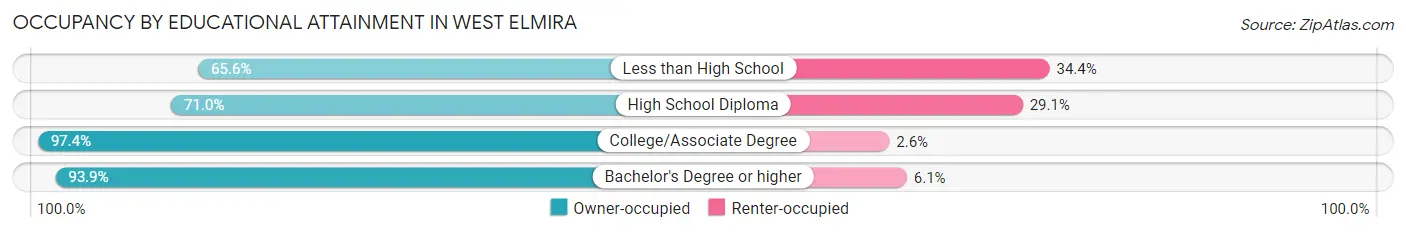
| Household Size | Owner-occupied | Renter-occupied |
| Less than High School | 21 (65.6%) | 11 (34.4%) |
| High School Diploma | 276 (71.0%) | 113 (29.0%) |
| College/Associate Degree | 560 (97.4%) | 15 (2.6%) |
| Bachelor's Degree or higher | 971 (93.9%) | 63 (6.1%) |
Occupancy by Age of Householder in West Elmira
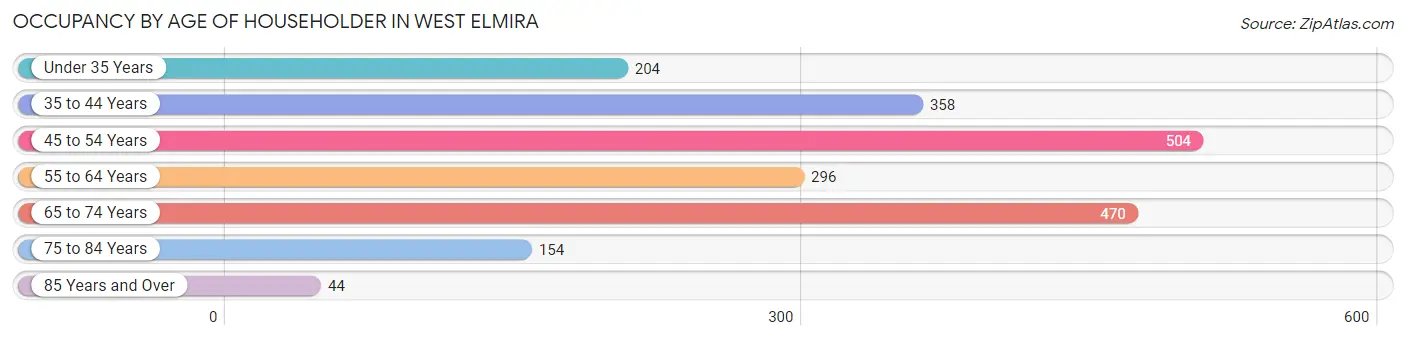
| Age Bracket | # Households | % Households |
| Under 35 Years | 204 | 10.1% |
| 35 to 44 Years | 358 | 17.6% |
| 45 to 54 Years | 504 | 24.8% |
| 55 to 64 Years | 296 | 14.6% |
| 65 to 74 Years | 470 | 23.2% |
| 75 to 84 Years | 154 | 7.6% |
| 85 Years and Over | 44 | 2.2% |
| Total | 2,030 | 100.0% |
Housing Finances in West Elmira
Median Income by Occupancy in West Elmira
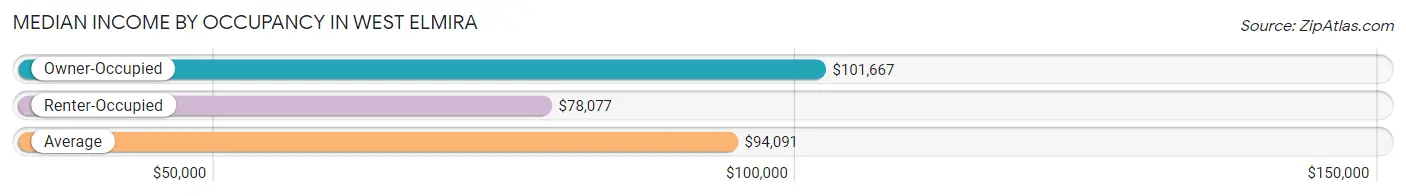
| Occupancy Type | # Households | Median Income |
| Owner-Occupied | 1,828 (90.0%) | $101,667 |
| Renter-Occupied | 202 (10.0%) | $78,077 |
| Average | 2,030 (100.0%) | $94,091 |
Occupancy by Householder Income Bracket in West Elmira
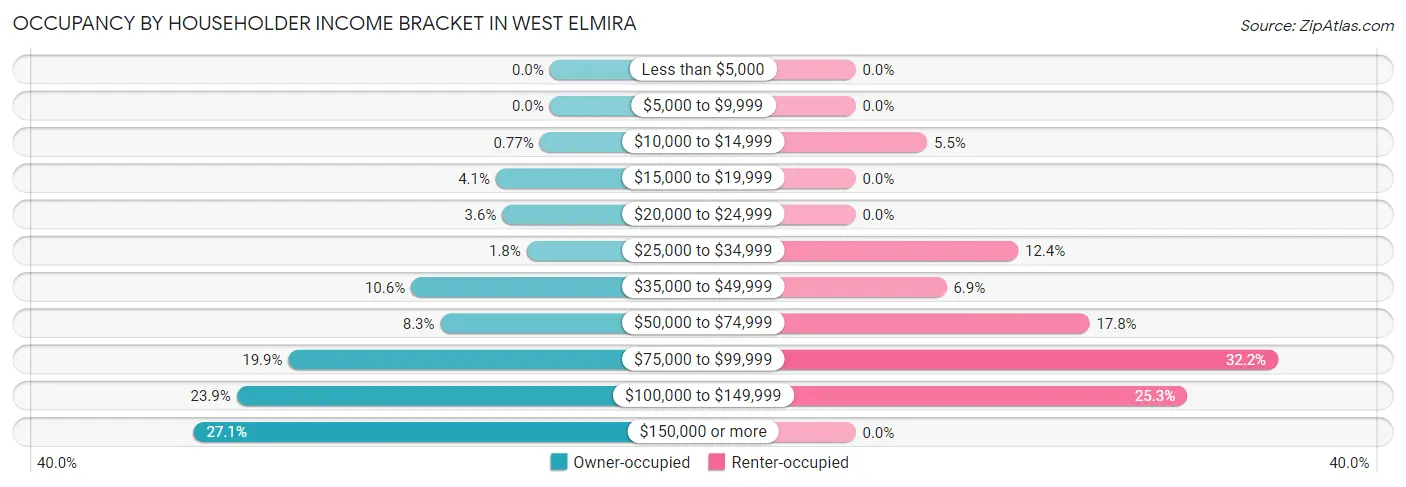
| Income Bracket | Owner-occupied | Renter-occupied |
| Less than $5,000 | 0 (0.0%) | 0 (0.0%) |
| $5,000 to $9,999 | 0 (0.0%) | 0 (0.0%) |
| $10,000 to $14,999 | 14 (0.8%) | 11 (5.4%) |
| $15,000 to $19,999 | 75 (4.1%) | 0 (0.0%) |
| $20,000 to $24,999 | 66 (3.6%) | 0 (0.0%) |
| $25,000 to $34,999 | 32 (1.8%) | 25 (12.4%) |
| $35,000 to $49,999 | 193 (10.6%) | 14 (6.9%) |
| $50,000 to $74,999 | 152 (8.3%) | 36 (17.8%) |
| $75,000 to $99,999 | 364 (19.9%) | 65 (32.2%) |
| $100,000 to $149,999 | 436 (23.8%) | 51 (25.3%) |
| $150,000 or more | 496 (27.1%) | 0 (0.0%) |
| Total | 1,828 (100.0%) | 202 (100.0%) |
Monthly Housing Cost Tiers in West Elmira
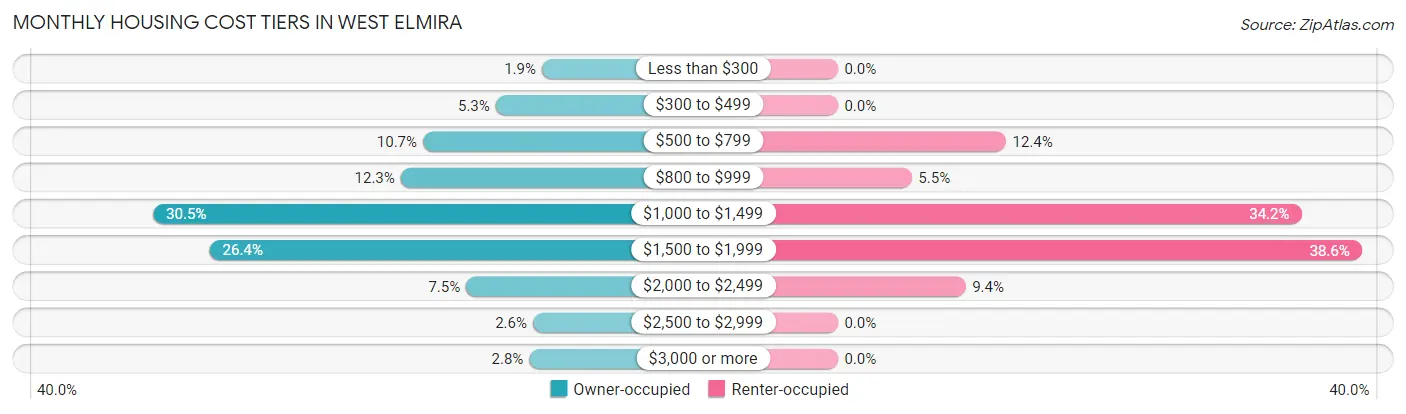
| Monthly Cost | Owner-occupied | Renter-occupied |
| Less than $300 | 35 (1.9%) | 0 (0.0%) |
| $300 to $499 | 97 (5.3%) | 0 (0.0%) |
| $500 to $799 | 195 (10.7%) | 25 (12.4%) |
| $800 to $999 | 225 (12.3%) | 11 (5.4%) |
| $1,000 to $1,499 | 558 (30.5%) | 69 (34.2%) |
| $1,500 to $1,999 | 482 (26.4%) | 78 (38.6%) |
| $2,000 to $2,499 | 137 (7.5%) | 19 (9.4%) |
| $2,500 to $2,999 | 47 (2.6%) | 0 (0.0%) |
| $3,000 or more | 52 (2.8%) | 0 (0.0%) |
| Total | 1,828 (100.0%) | 202 (100.0%) |
Physical Housing Characteristics in West Elmira
Housing Structures in West Elmira
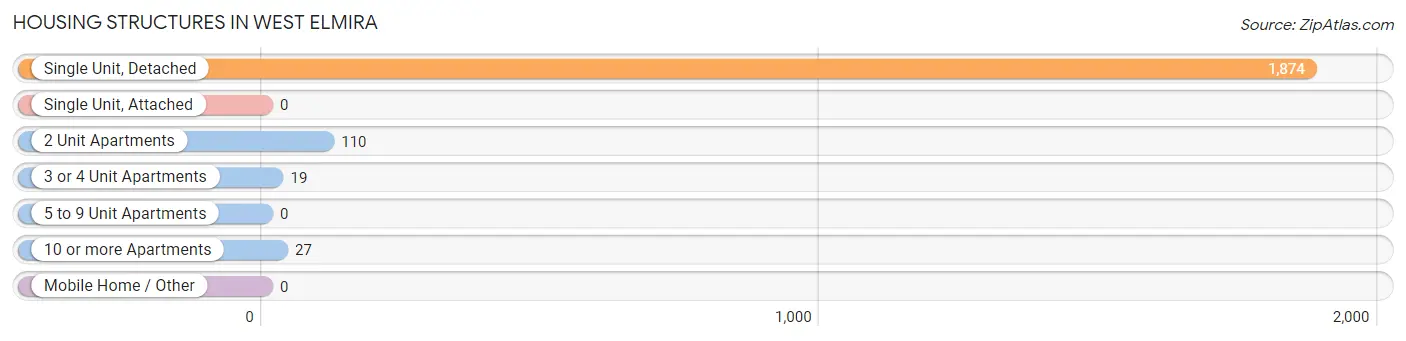
| Structure Type | # Housing Units | % Housing Units |
| Single Unit, Detached | 1,874 | 92.3% |
| Single Unit, Attached | 0 | 0.0% |
| 2 Unit Apartments | 110 | 5.4% |
| 3 or 4 Unit Apartments | 19 | 0.9% |
| 5 to 9 Unit Apartments | 0 | 0.0% |
| 10 or more Apartments | 27 | 1.3% |
| Mobile Home / Other | 0 | 0.0% |
| Total | 2,030 | 100.0% |
Housing Structures by Occupancy in West Elmira
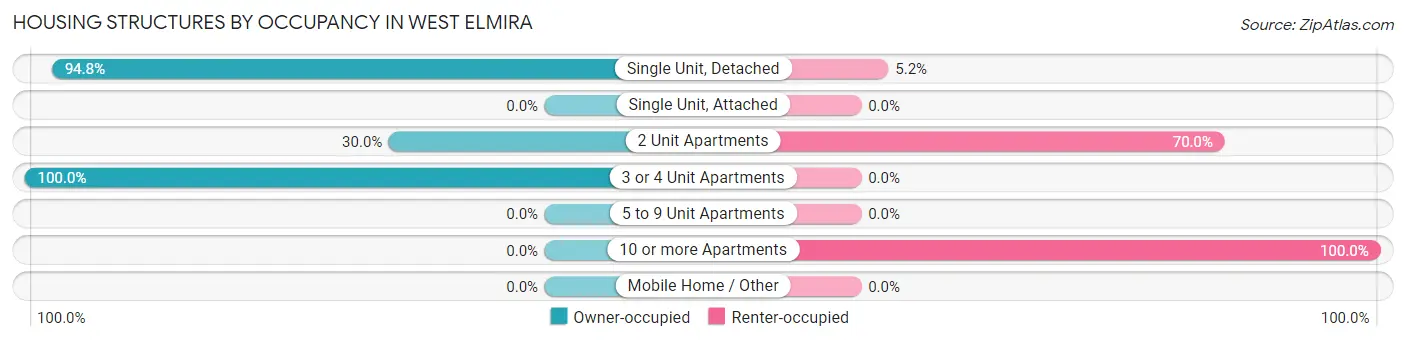
| Structure Type | Owner-occupied | Renter-occupied |
| Single Unit, Detached | 1,776 (94.8%) | 98 (5.2%) |
| Single Unit, Attached | 0 (0.0%) | 0 (0.0%) |
| 2 Unit Apartments | 33 (30.0%) | 77 (70.0%) |
| 3 or 4 Unit Apartments | 19 (100.0%) | 0 (0.0%) |
| 5 to 9 Unit Apartments | 0 (0.0%) | 0 (0.0%) |
| 10 or more Apartments | 0 (0.0%) | 27 (100.0%) |
| Mobile Home / Other | 0 (0.0%) | 0 (0.0%) |
| Total | 1,828 (90.0%) | 202 (10.0%) |
Housing Structures by Number of Rooms in West Elmira
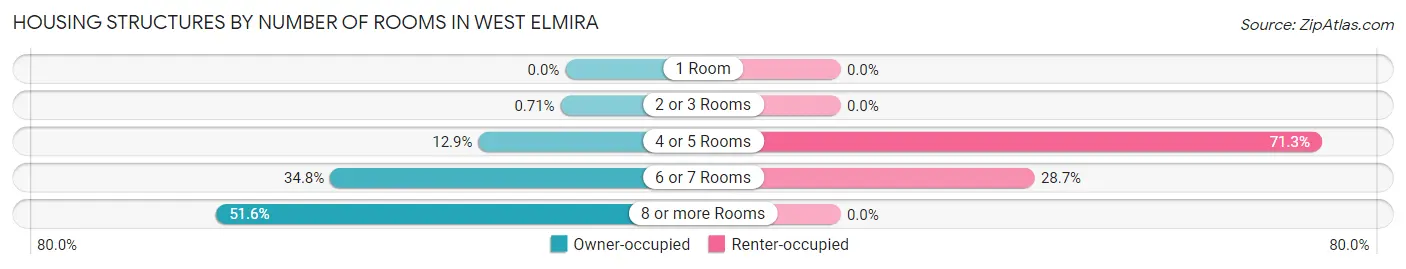
| Number of Rooms | Owner-occupied | Renter-occupied |
| 1 Room | 0 (0.0%) | 0 (0.0%) |
| 2 or 3 Rooms | 13 (0.7%) | 0 (0.0%) |
| 4 or 5 Rooms | 235 (12.9%) | 144 (71.3%) |
| 6 or 7 Rooms | 636 (34.8%) | 58 (28.7%) |
| 8 or more Rooms | 944 (51.6%) | 0 (0.0%) |
| Total | 1,828 (100.0%) | 202 (100.0%) |
Housing Structure by Heating Type in West Elmira
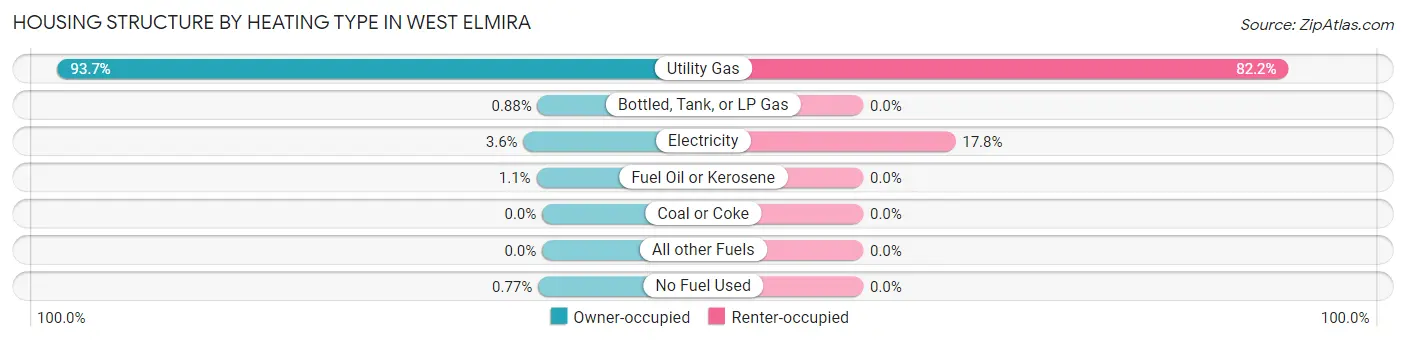
| Heating Type | Owner-occupied | Renter-occupied |
| Utility Gas | 1,712 (93.6%) | 166 (82.2%) |
| Bottled, Tank, or LP Gas | 16 (0.9%) | 0 (0.0%) |
| Electricity | 66 (3.6%) | 36 (17.8%) |
| Fuel Oil or Kerosene | 20 (1.1%) | 0 (0.0%) |
| Coal or Coke | 0 (0.0%) | 0 (0.0%) |
| All other Fuels | 0 (0.0%) | 0 (0.0%) |
| No Fuel Used | 14 (0.8%) | 0 (0.0%) |
| Total | 1,828 (100.0%) | 202 (100.0%) |
Household Vehicle Usage in West Elmira
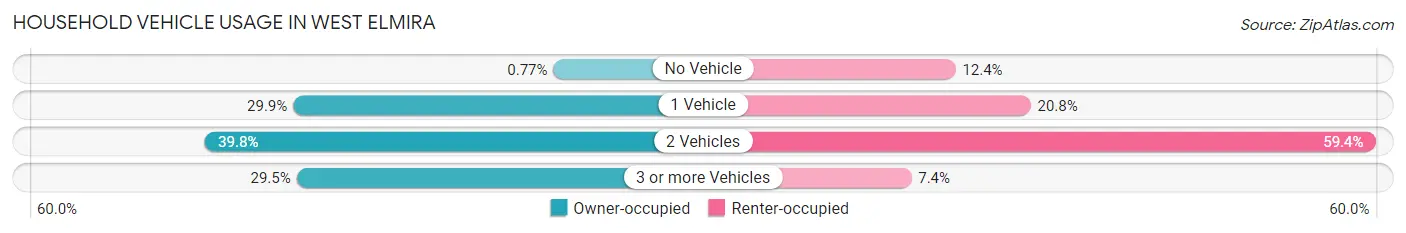
| Vehicles per Household | Owner-occupied | Renter-occupied |
| No Vehicle | 14 (0.8%) | 25 (12.4%) |
| 1 Vehicle | 547 (29.9%) | 42 (20.8%) |
| 2 Vehicles | 727 (39.8%) | 120 (59.4%) |
| 3 or more Vehicles | 540 (29.5%) | 15 (7.4%) |
| Total | 1,828 (100.0%) | 202 (100.0%) |
Real Estate & Mortgages in West Elmira
Real Estate and Mortgage Overview in West Elmira
| Characteristic | Without Mortgage | With Mortgage |
| Housing Units | 659 | 1,169 |
| Median Property Value | $201,700 | $182,200 |
| Median Household Income | $77,457 | $312 |
| Monthly Housing Costs | $843 | $52 |
| Real Estate Taxes | $5,048 | $0 |
Property Value by Mortgage Status in West Elmira
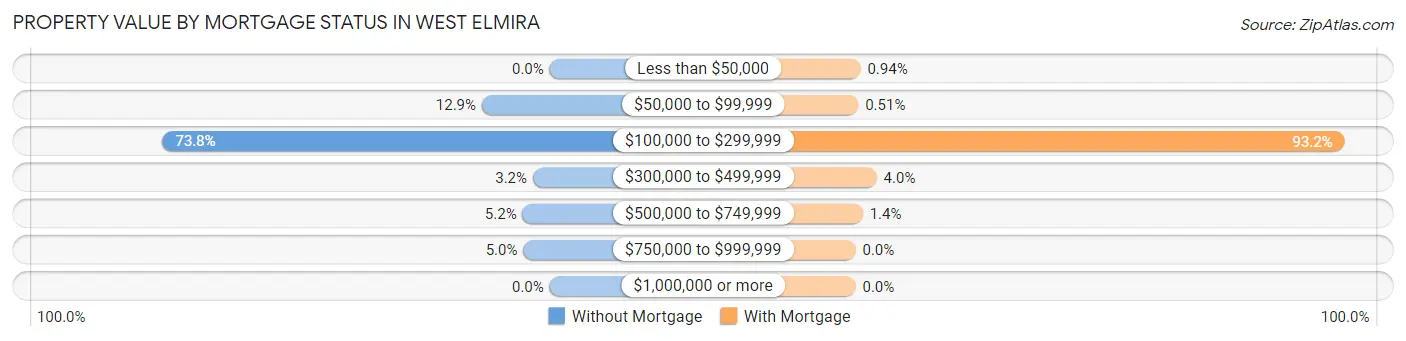
| Property Value | Without Mortgage | With Mortgage |
| Less than $50,000 | 0 (0.0%) | 11 (0.9%) |
| $50,000 to $99,999 | 85 (12.9%) | 6 (0.5%) |
| $100,000 to $299,999 | 486 (73.8%) | 1,089 (93.2%) |
| $300,000 to $499,999 | 21 (3.2%) | 47 (4.0%) |
| $500,000 to $749,999 | 34 (5.2%) | 16 (1.4%) |
| $750,000 to $999,999 | 33 (5.0%) | 0 (0.0%) |
| $1,000,000 or more | 0 (0.0%) | 0 (0.0%) |
| Total | 659 (100.0%) | 1,169 (100.0%) |
Household Income by Mortgage Status in West Elmira
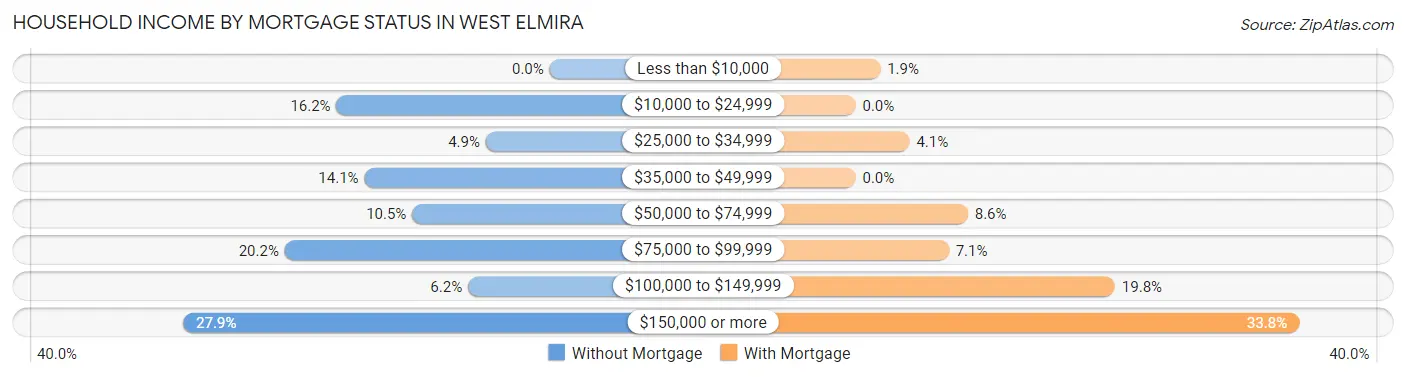
| Household Income | Without Mortgage | With Mortgage |
| Less than $10,000 | 0 (0.0%) | 22 (1.9%) |
| $10,000 to $24,999 | 107 (16.2%) | 0 (0.0%) |
| $25,000 to $34,999 | 32 (4.9%) | 48 (4.1%) |
| $35,000 to $49,999 | 93 (14.1%) | 0 (0.0%) |
| $50,000 to $74,999 | 69 (10.5%) | 100 (8.6%) |
| $75,000 to $99,999 | 133 (20.2%) | 83 (7.1%) |
| $100,000 to $149,999 | 41 (6.2%) | 231 (19.8%) |
| $150,000 or more | 184 (27.9%) | 395 (33.8%) |
| Total | 659 (100.0%) | 1,169 (100.0%) |
Property Value to Household Income Ratio in West Elmira
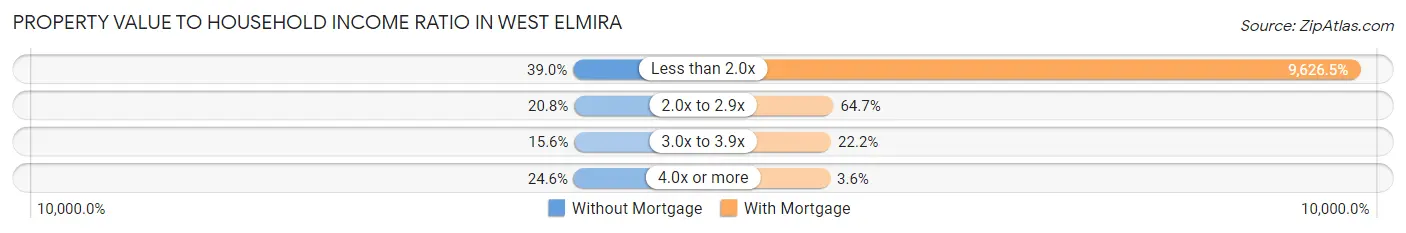
| Value-to-Income Ratio | Without Mortgage | With Mortgage |
| Less than 2.0x | 257 (39.0%) | 112,534 (9,626.5%) |
| 2.0x to 2.9x | 137 (20.8%) | 756 (64.7%) |
| 3.0x to 3.9x | 103 (15.6%) | 260 (22.2%) |
| 4.0x or more | 162 (24.6%) | 42 (3.6%) |
| Total | 659 (100.0%) | 1,169 (100.0%) |
Real Estate Taxes by Mortgage Status in West Elmira
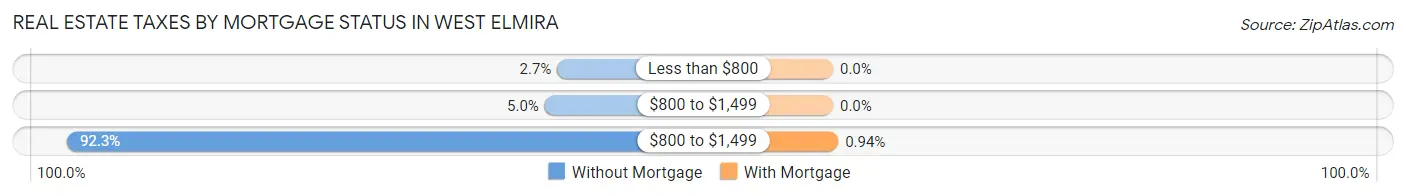
| Property Taxes | Without Mortgage | With Mortgage |
| Less than $800 | 18 (2.7%) | 0 (0.0%) |
| $800 to $1,499 | 33 (5.0%) | 0 (0.0%) |
| $800 to $1,499 | 608 (92.3%) | 11 (0.9%) |
| Total | 659 (100.0%) | 1,169 (100.0%) |
Health & Disability in West Elmira
Health Insurance Coverage by Age in West Elmira
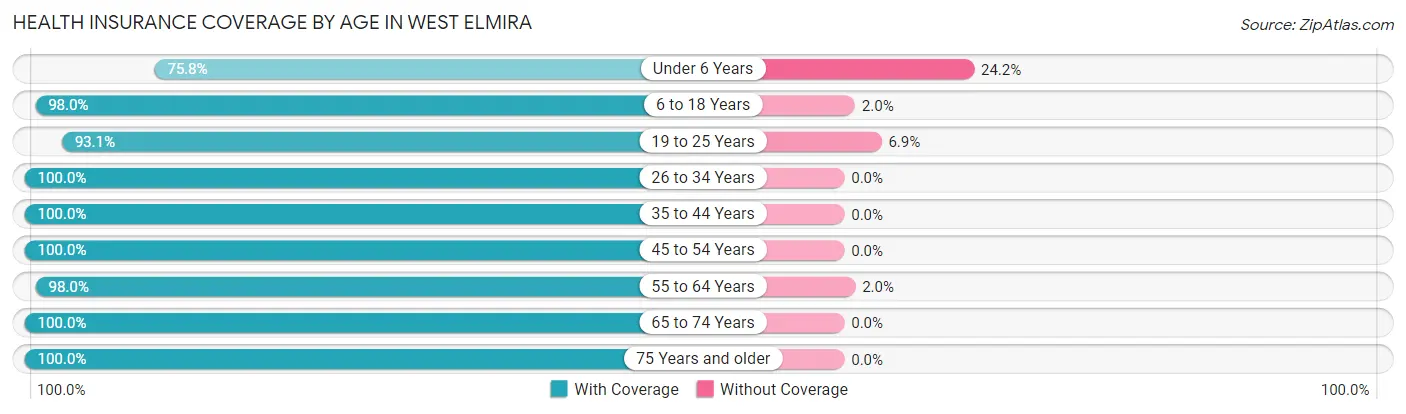
| Age Bracket | With Coverage | Without Coverage |
| Under 6 Years | 188 (75.8%) | 60 (24.2%) |
| 6 to 18 Years | 889 (98.0%) | 18 (2.0%) |
| 19 to 25 Years | 188 (93.1%) | 14 (6.9%) |
| 26 to 34 Years | 301 (100.0%) | 0 (0.0%) |
| 35 to 44 Years | 629 (100.0%) | 0 (0.0%) |
| 45 to 54 Years | 901 (100.0%) | 0 (0.0%) |
| 55 to 64 Years | 480 (98.0%) | 10 (2.0%) |
| 65 to 74 Years | 744 (100.0%) | 0 (0.0%) |
| 75 Years and older | 374 (100.0%) | 0 (0.0%) |
| Total | 4,694 (97.9%) | 102 (2.1%) |
Health Insurance Coverage by Citizenship Status in West Elmira
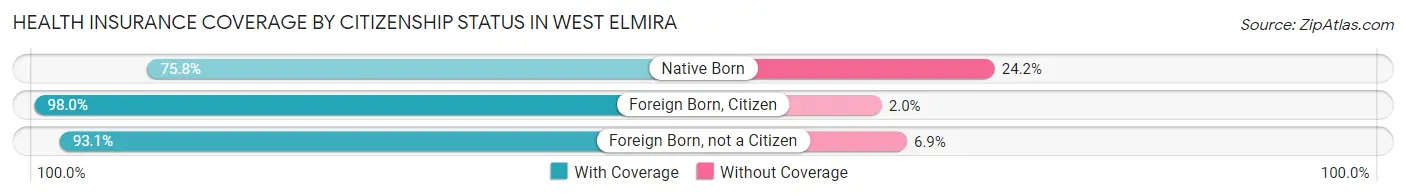
| Citizenship Status | With Coverage | Without Coverage |
| Native Born | 188 (75.8%) | 60 (24.2%) |
| Foreign Born, Citizen | 889 (98.0%) | 18 (2.0%) |
| Foreign Born, not a Citizen | 188 (93.1%) | 14 (6.9%) |
Health Insurance Coverage by Household Income in West Elmira
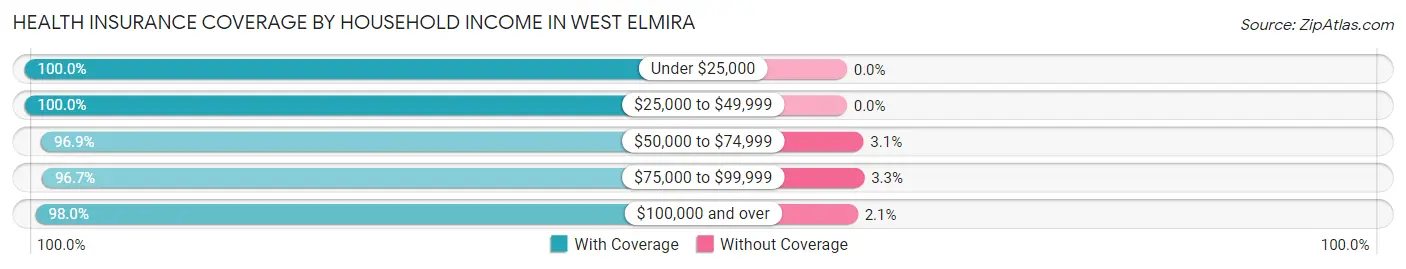
| Household Income | With Coverage | Without Coverage |
| Under $25,000 | 220 (100.0%) | 0 (0.0%) |
| $25,000 to $49,999 | 486 (100.0%) | 0 (0.0%) |
| $50,000 to $74,999 | 312 (96.9%) | 10 (3.1%) |
| $75,000 to $99,999 | 1,217 (96.7%) | 41 (3.3%) |
| $100,000 and over | 2,432 (98.0%) | 51 (2.1%) |
Public vs Private Health Insurance Coverage by Age in West Elmira
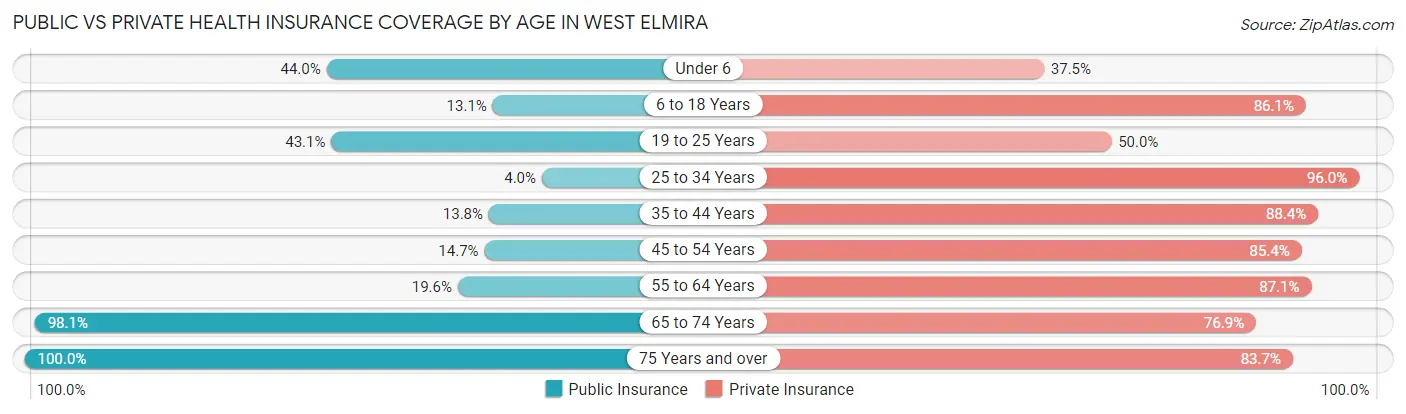
| Age Bracket | Public Insurance | Private Insurance |
| Under 6 | 109 (44.0%) | 93 (37.5%) |
| 6 to 18 Years | 119 (13.1%) | 781 (86.1%) |
| 19 to 25 Years | 87 (43.1%) | 101 (50.0%) |
| 25 to 34 Years | 12 (4.0%) | 289 (96.0%) |
| 35 to 44 Years | 87 (13.8%) | 556 (88.4%) |
| 45 to 54 Years | 132 (14.6%) | 769 (85.4%) |
| 55 to 64 Years | 96 (19.6%) | 427 (87.1%) |
| 65 to 74 Years | 730 (98.1%) | 572 (76.9%) |
| 75 Years and over | 374 (100.0%) | 313 (83.7%) |
| Total | 1,746 (36.4%) | 3,901 (81.3%) |
Disability Status by Sex by Age in West Elmira
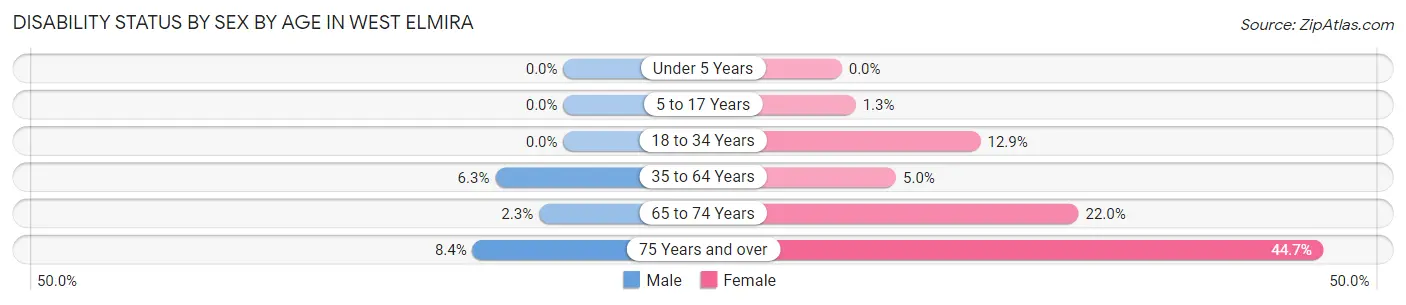
| Age Bracket | Male | Female |
| Under 5 Years | 0 (0.0%) | 0 (0.0%) |
| 5 to 17 Years | 0 (0.0%) | 6 (1.3%) |
| 18 to 34 Years | 0 (0.0%) | 42 (12.9%) |
| 35 to 64 Years | 55 (6.3%) | 58 (5.0%) |
| 65 to 74 Years | 9 (2.3%) | 76 (22.0%) |
| 75 Years and over | 14 (8.4%) | 93 (44.7%) |
Disability Class by Sex by Age in West Elmira
Disability Class: Hearing Difficulty
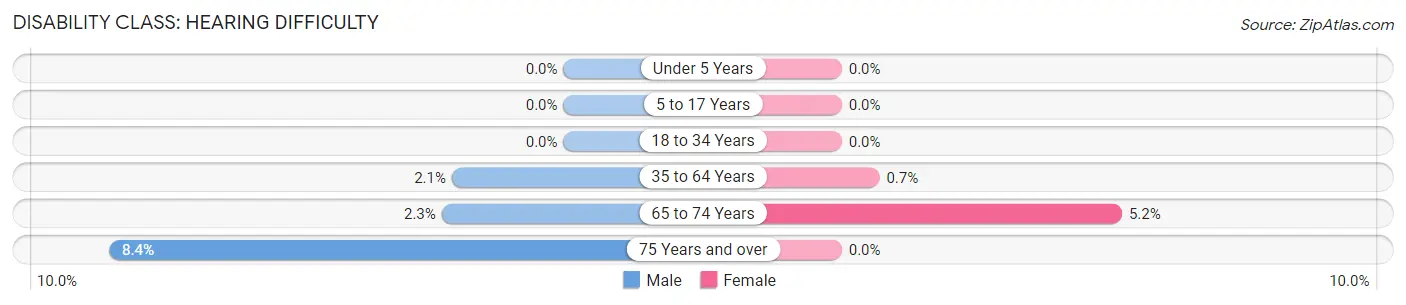
| Age Bracket | Male | Female |
| Under 5 Years | 0 (0.0%) | 0 (0.0%) |
| 5 to 17 Years | 0 (0.0%) | 0 (0.0%) |
| 18 to 34 Years | 0 (0.0%) | 0 (0.0%) |
| 35 to 64 Years | 18 (2.1%) | 8 (0.7%) |
| 65 to 74 Years | 9 (2.3%) | 18 (5.2%) |
| 75 Years and over | 14 (8.4%) | 0 (0.0%) |
Disability Class: Vision Difficulty
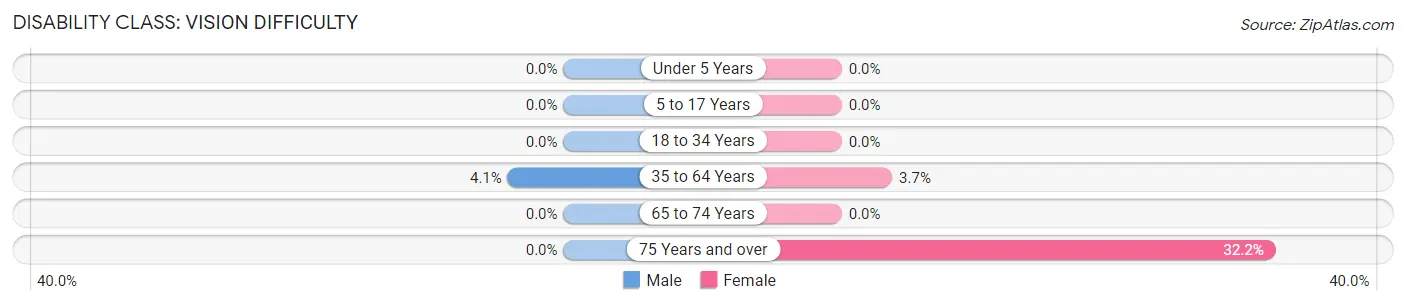
| Age Bracket | Male | Female |
| Under 5 Years | 0 (0.0%) | 0 (0.0%) |
| 5 to 17 Years | 0 (0.0%) | 0 (0.0%) |
| 18 to 34 Years | 0 (0.0%) | 0 (0.0%) |
| 35 to 64 Years | 36 (4.1%) | 43 (3.7%) |
| 65 to 74 Years | 0 (0.0%) | 0 (0.0%) |
| 75 Years and over | 0 (0.0%) | 67 (32.2%) |
Disability Class: Cognitive Difficulty
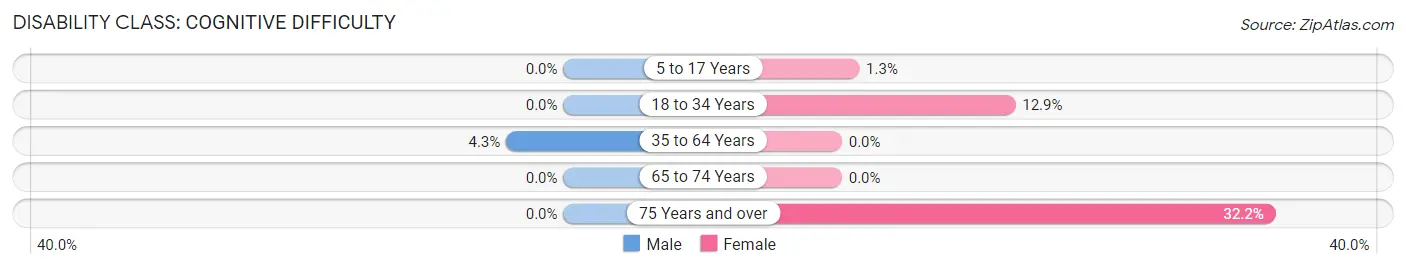
| Age Bracket | Male | Female |
| 5 to 17 Years | 0 (0.0%) | 6 (1.3%) |
| 18 to 34 Years | 0 (0.0%) | 42 (12.9%) |
| 35 to 64 Years | 37 (4.3%) | 0 (0.0%) |
| 65 to 74 Years | 0 (0.0%) | 0 (0.0%) |
| 75 Years and over | 0 (0.0%) | 67 (32.2%) |
Disability Class: Ambulatory Difficulty
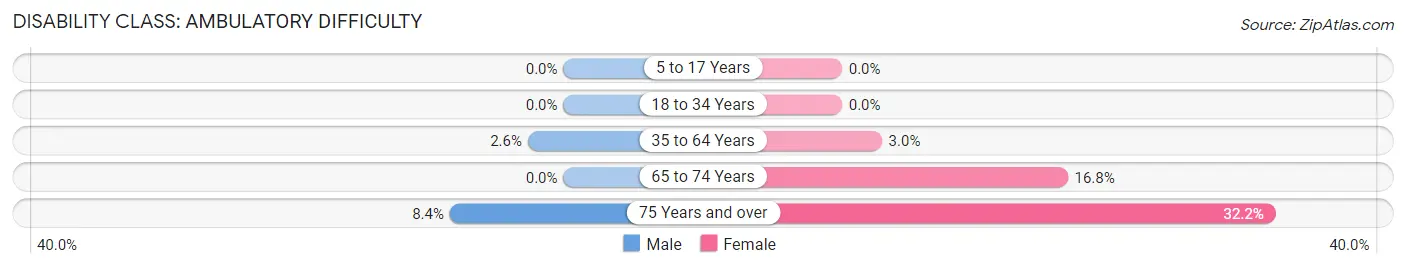
| Age Bracket | Male | Female |
| 5 to 17 Years | 0 (0.0%) | 0 (0.0%) |
| 18 to 34 Years | 0 (0.0%) | 0 (0.0%) |
| 35 to 64 Years | 23 (2.6%) | 34 (3.0%) |
| 65 to 74 Years | 0 (0.0%) | 58 (16.8%) |
| 75 Years and over | 14 (8.4%) | 67 (32.2%) |
Disability Class: Self-Care Difficulty
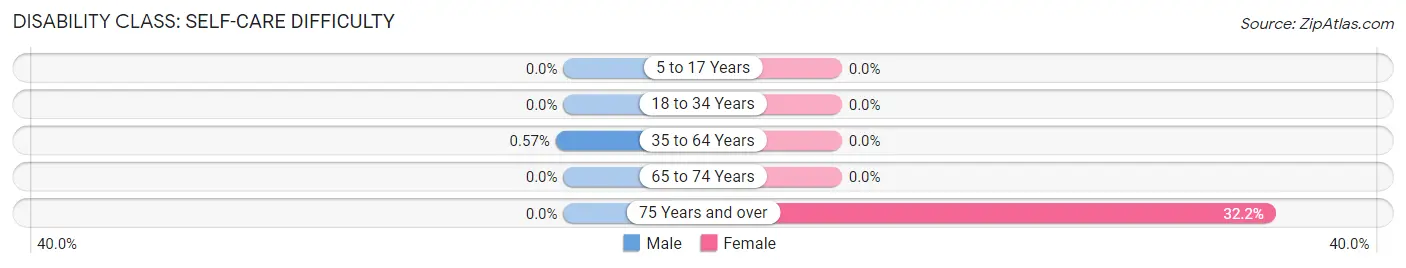
| Age Bracket | Male | Female |
| 5 to 17 Years | 0 (0.0%) | 0 (0.0%) |
| 18 to 34 Years | 0 (0.0%) | 0 (0.0%) |
| 35 to 64 Years | 5 (0.6%) | 0 (0.0%) |
| 65 to 74 Years | 0 (0.0%) | 0 (0.0%) |
| 75 Years and over | 0 (0.0%) | 67 (32.2%) |
Technology Access in West Elmira
Computing Device Access in West Elmira
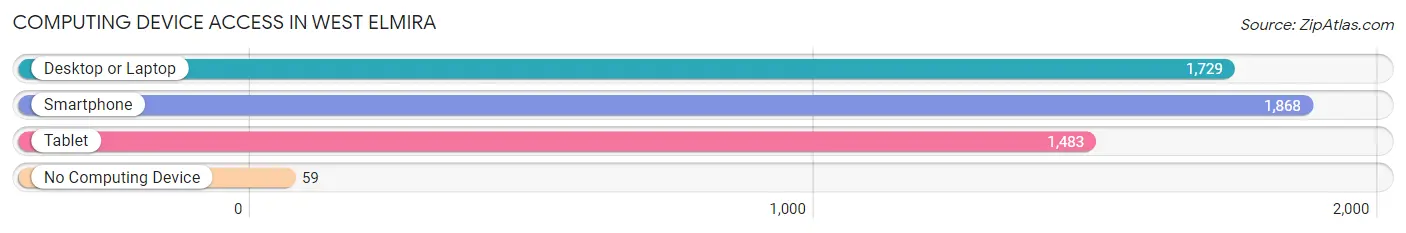
| Device Type | # Households | % Households |
| Desktop or Laptop | 1,729 | 85.2% |
| Smartphone | 1,868 | 92.0% |
| Tablet | 1,483 | 73.1% |
| No Computing Device | 59 | 2.9% |
| Total | 2,030 | 100.0% |
Internet Access in West Elmira
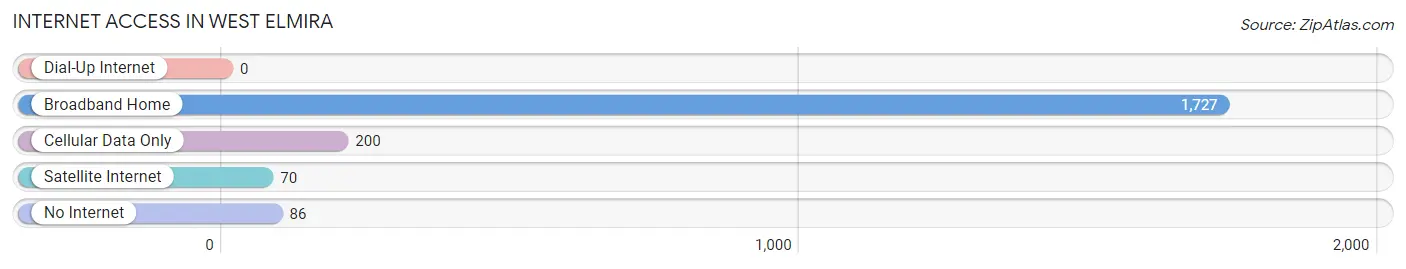
| Internet Type | # Households | % Households |
| Dial-Up Internet | 0 | 0.0% |
| Broadband Home | 1,727 | 85.1% |
| Cellular Data Only | 200 | 9.9% |
| Satellite Internet | 70 | 3.5% |
| No Internet | 86 | 4.2% |
| Total | 2,030 | 100.0% |
West Elmira Summary
History
West Elmira is a small city located in Chemung County, New York. It is situated on the Chemung River, just south of the city of Elmira. The city was originally part of the Town of Elmira, which was established in 1822. In 1854, the Town of Elmira was divided into two separate towns, East Elmira and West Elmira. West Elmira was incorporated as a village in 1867 and as a city in 1892.
The city of West Elmira has a rich history that dates back to the early 19th century. The area was first settled by the Iroquois Native Americans, who were later displaced by European settlers. The first settlers in the area were the Quakers, who established a settlement in 1808. The Quakers were followed by German immigrants, who established a settlement in 1820.
The city of West Elmira was an important industrial center during the 19th and early 20th centuries. The city was home to several factories, including the Elmira Stove Works, the Elmira Carriage Works, and the Elmira Foundry. The city was also home to several railroads, including the Erie Railroad, the Lehigh Valley Railroad, and the New York Central Railroad.
Geography
West Elmira is located in the Southern Tier region of New York State. The city is situated on the Chemung River, just south of the city of Elmira. The city has a total area of 4.2 square miles, all of which is land. The city is located in a hilly region, with elevations ranging from 500 to 1,000 feet above sea level.
The climate in West Elmira is classified as humid continental, with cold winters and warm summers. The average annual temperature is 48°F, with an average high of 68°F in July and an average low of 28°F in January. The average annual precipitation is 39 inches, with an average of 12 inches of snowfall per year.
Economy
West Elmira’s economy is largely based on manufacturing and services. The city is home to several factories, including the Elmira Stove Works, the Elmira Carriage Works, and the Elmira Foundry. The city is also home to several retail stores, restaurants, and other businesses.
The city is also home to several educational institutions, including Elmira College, Corning Community College, and the Elmira Business Institute. The city is also home to several healthcare facilities, including Arnot Ogden Medical Center and St. Joseph’s Hospital.
Demographics
As of the 2010 census, the population of West Elmira was 8,945. The population is predominantly white (90.2%), with small percentages of African American (3.2%), Asian (2.2%), and Hispanic (2.1%) residents. The median household income is $37,941, and the median age is 40.7 years. The city has a poverty rate of 17.3%.
Conclusion
West Elmira is a small city located in Chemung County, New York. It is situated on the Chemung River, just south of the city of Elmira. The city has a rich history that dates back to the early 19th century, and it was an important industrial center during the 19th and early 20th centuries. The city’s economy is largely based on manufacturing and services, and it is home to several educational institutions, healthcare facilities, and other businesses. The population of West Elmira is predominantly white, with small percentages of African American, Asian, and Hispanic residents. The median household income is $37,941, and the median age is 40.7 years.
Common Questions
What is Per Capita Income in West Elmira?
Per Capita income in West Elmira is $54,009.
What is the Median Family Income in West Elmira?
Median Family Income in West Elmira is $104,531.
What is the Median Household income in West Elmira?
Median Household Income in West Elmira is $94,091.
What is Income or Wage Gap in West Elmira?
Income or Wage Gap in West Elmira is 12.8%.
Women in West Elmira earn 87.2 cents for every dollar earned by a man.
What is Inequality or Gini Index in West Elmira?
Inequality or Gini Index in West Elmira is 0.42.
What is the Total Population of West Elmira?
Total Population of West Elmira is 4,796.
What is the Total Male Population of West Elmira?
Total Male Population of West Elmira is 2,164.
What is the Total Female Population of West Elmira?
Total Female Population of West Elmira is 2,632.
What is the Ratio of Males per 100 Females in West Elmira?
There are 82.22 Males per 100 Females in West Elmira.
What is the Ratio of Females per 100 Males in West Elmira?
There are 121.63 Females per 100 Males in West Elmira.
What is the Median Population Age in West Elmira?
Median Population Age in West Elmira is 46.6 Years.
What is the Average Family Size in West Elmira
Average Family Size in West Elmira is 2.8 People.
What is the Average Household Size in West Elmira
Average Household Size in West Elmira is 2.4 People.
How Large is the Labor Force in West Elmira?
There are 2,654 People in the Labor Forcein in West Elmira.
What is the Percentage of People in the Labor Force in West Elmira?
67.3% of People are in the Labor Force in West Elmira.
What is the Unemployment Rate in West Elmira?
Unemployment Rate in West Elmira is 4.2%.