Lyons, NY Map & Demographics
Lyons Map
Lyons Overview
$26,911
PER CAPITA INCOME
$73,974
AVG FAMILY INCOME
$61,576
AVG HOUSEHOLD INCOME
28.6%
WAGE / INCOME GAP [ % ]
71.4¢/ $1
WAGE / INCOME GAP [ $ ]
0.37
INEQUALITY / GINI INDEX
3,594
TOTAL POPULATION
1,693
MALE POPULATION
1,901
FEMALE POPULATION
89.06
MALES / 100 FEMALES
112.29
FEMALES / 100 MALES
42.9
MEDIAN AGE
2.9
AVG FAMILY SIZE
2.4
AVG HOUSEHOLD SIZE
1,887
LABOR FORCE [ PEOPLE ]
61.6%
PERCENT IN LABOR FORCE
15.3%
UNEMPLOYMENT RATE
Lyons Zip Codes
Lyons Area Codes
Income in Lyons
Income Overview in Lyons
Per Capita Income in Lyons is $26,911, while median incomes of families and households are $73,974 and $61,576 respectively.
| Characteristic | Number | Measure |
| Per Capita Income | 3,594 | $26,911 |
| Median Family Income | 908 | $73,974 |
| Mean Family Income | 908 | $72,653 |
| Median Household Income | 1,473 | $61,576 |
| Mean Household Income | 1,473 | $66,617 |
| Income Deficit | 908 | $0 |
| Wage / Income Gap (%) | 3,594 | 28.62% |
| Wage / Income Gap ($) | 3,594 | 71.38¢ per $1 |
| Gini / Inequality Index | 3,594 | 0.37 |
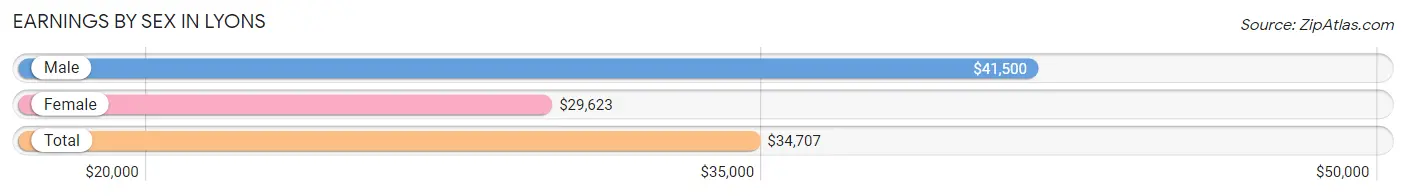
Earnings by Sex in Lyons
Average Earnings in Lyons are $34,707, $41,500 for men and $29,623 for women, a difference of 28.6%.
| Sex | Number | Average Earnings |
| Male | 830 (47.2%) | $41,500 |
| Female | 930 (52.8%) | $29,623 |
| Total | 1,760 (100.0%) | $34,707 |
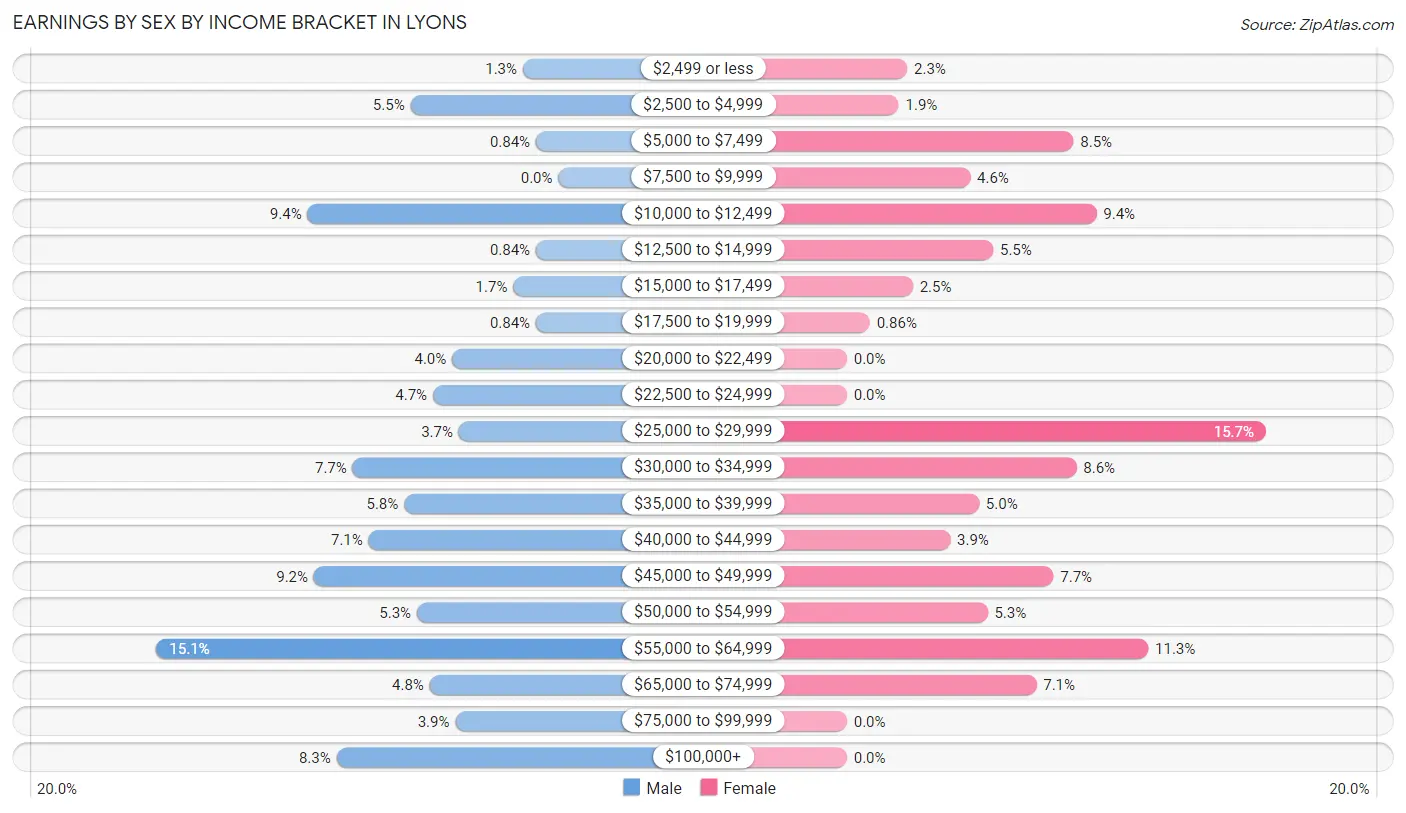
Earnings by Sex by Income Bracket in Lyons
The most common earnings brackets in Lyons are $55,000 to $64,999 for men (125 | 15.1%) and $25,000 to $29,999 for women (146 | 15.7%).
| Income | Male | Female |
| $2,499 or less | 11 (1.3%) | 21 (2.3%) |
| $2,500 to $4,999 | 46 (5.5%) | 18 (1.9%) |
| $5,000 to $7,499 | 7 (0.8%) | 79 (8.5%) |
| $7,500 to $9,999 | 0 (0.0%) | 43 (4.6%) |
| $10,000 to $12,499 | 78 (9.4%) | 87 (9.3%) |
| $12,500 to $14,999 | 7 (0.8%) | 51 (5.5%) |
| $15,000 to $17,499 | 14 (1.7%) | 23 (2.5%) |
| $17,500 to $19,999 | 7 (0.8%) | 8 (0.9%) |
| $20,000 to $22,499 | 33 (4.0%) | 0 (0.0%) |
| $22,500 to $24,999 | 39 (4.7%) | 0 (0.0%) |
| $25,000 to $29,999 | 31 (3.7%) | 146 (15.7%) |
| $30,000 to $34,999 | 64 (7.7%) | 80 (8.6%) |
| $35,000 to $39,999 | 48 (5.8%) | 46 (5.0%) |
| $40,000 to $44,999 | 59 (7.1%) | 36 (3.9%) |
| $45,000 to $49,999 | 76 (9.2%) | 72 (7.7%) |
| $50,000 to $54,999 | 44 (5.3%) | 49 (5.3%) |
| $55,000 to $64,999 | 125 (15.1%) | 105 (11.3%) |
| $65,000 to $74,999 | 40 (4.8%) | 66 (7.1%) |
| $75,000 to $99,999 | 32 (3.9%) | 0 (0.0%) |
| $100,000+ | 69 (8.3%) | 0 (0.0%) |
| Total | 830 (100.0%) | 930 (100.0%) |
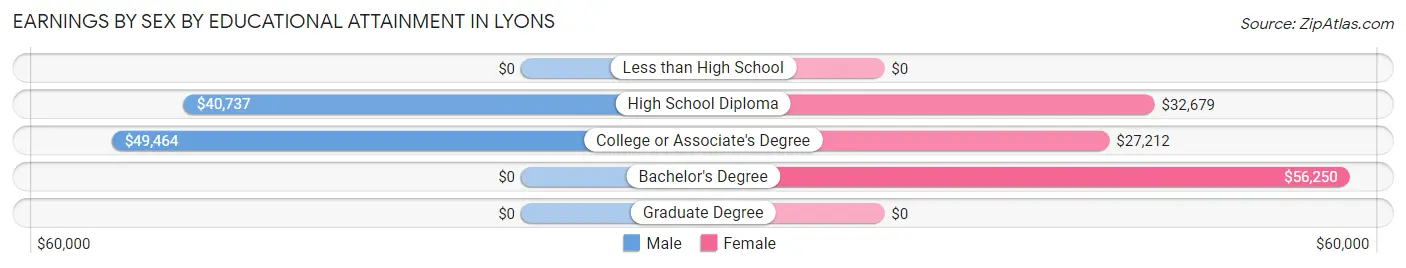
Earnings by Sex by Educational Attainment in Lyons
Average earnings in Lyons are $41,950 for men and $33,281 for women, a difference of 20.7%. Men with an educational attainment of college or associate's degree enjoy the highest average annual earnings of $49,464, while those with high school diploma education earn the least with $40,737. Women with an educational attainment of bachelor's degree earn the most with the average annual earnings of $56,250, while those with college or associate's degree education have the smallest earnings of $27,212.
| Educational Attainment | Male Income | Female Income |
| Less than High School | - | - |
| High School Diploma | $40,737 | $32,679 |
| College or Associate's Degree | $49,464 | $27,212 |
| Bachelor's Degree | - | - |
| Graduate Degree | - | - |
| Total | $41,950 | $33,281 |
Family Income in Lyons
Family Income Brackets in Lyons
According to the Lyons family income data, there are 213 families falling into the $100,000 to $149,999 income range, which is the most common income bracket and makes up 23.5% of all families.
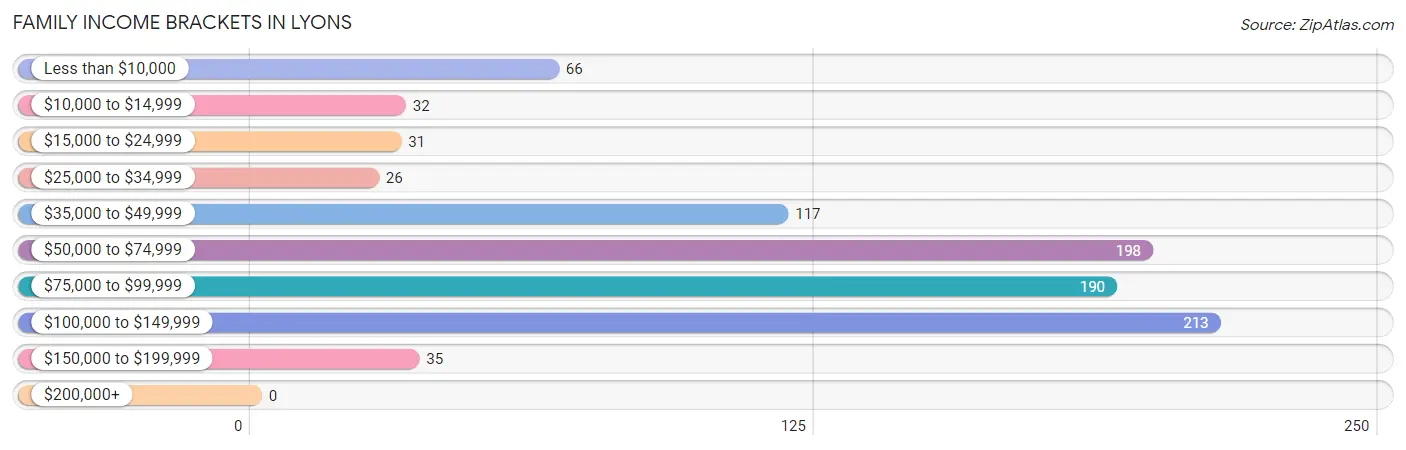
| Income Bracket | # Families | % Families |
| Less than $10,000 | 66 | 7.3% |
| $10,000 to $14,999 | 32 | 3.5% |
| $15,000 to $24,999 | 31 | 3.4% |
| $25,000 to $34,999 | 26 | 2.9% |
| $35,000 to $49,999 | 117 | 12.9% |
| $50,000 to $74,999 | 198 | 21.8% |
| $75,000 to $99,999 | 190 | 20.9% |
| $100,000 to $149,999 | 213 | 23.5% |
| $150,000 to $199,999 | 35 | 3.9% |
| $200,000+ | 0 | 0.0% |
Family Income by Famaliy Size in Lyons
5-person families (47 | 5.2%) account for the highest median family income in Lyons with $104,632 per family, while 2-person families (501 | 55.2%) have the highest median income of $37,146 per family member.
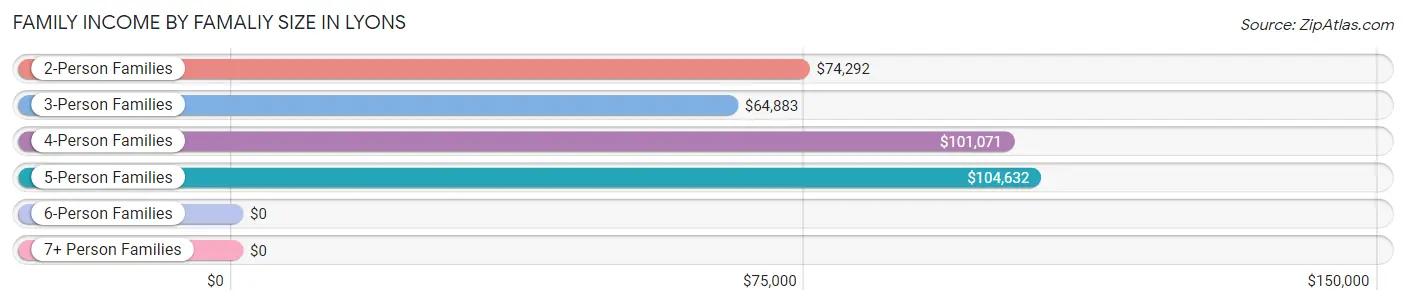
| Income Bracket | # Families | Median Income |
| 2-Person Families | 501 (55.2%) | $74,292 |
| 3-Person Families | 255 (28.1%) | $64,883 |
| 4-Person Families | 40 (4.4%) | $101,071 |
| 5-Person Families | 47 (5.2%) | $104,632 |
| 6-Person Families | 28 (3.1%) | $0 |
| 7+ Person Families | 37 (4.1%) | $0 |
| Total | 908 (100.0%) | $73,974 |
Family Income by Number of Earners in Lyons
The median family income in Lyons is $73,974, with families comprising 3+ earners (113) having the highest median family income of $112,042, while families with no earners (256) have the lowest median family income of $44,375, accounting for 12.4% and 28.2% of families, respectively.
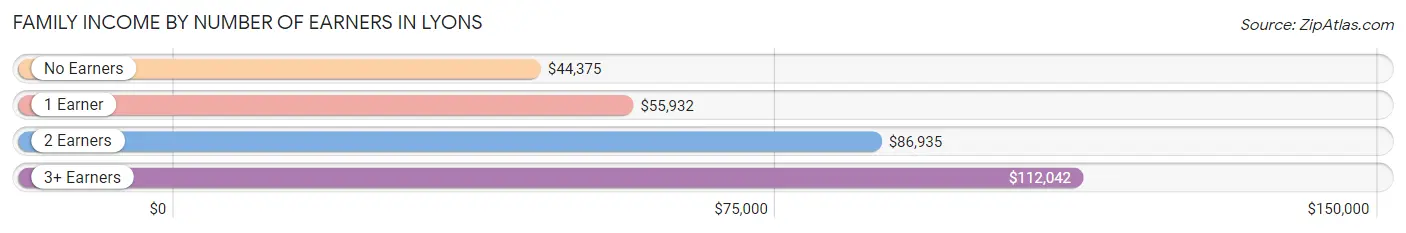
| Number of Earners | # Families | Median Income |
| No Earners | 256 (28.2%) | $44,375 |
| 1 Earner | 271 (29.8%) | $55,932 |
| 2 Earners | 268 (29.5%) | $86,935 |
| 3+ Earners | 113 (12.4%) | $112,042 |
| Total | 908 (100.0%) | $73,974 |
Household Income in Lyons
Household Income Brackets in Lyons
With 337 households falling in the category, the $100,000 to $149,999 income range is the most frequent in Lyons, accounting for 22.9% of all households. In contrast, only 15 households (1.0%) fall into the $200,000+ income bracket, making it the least populous group.
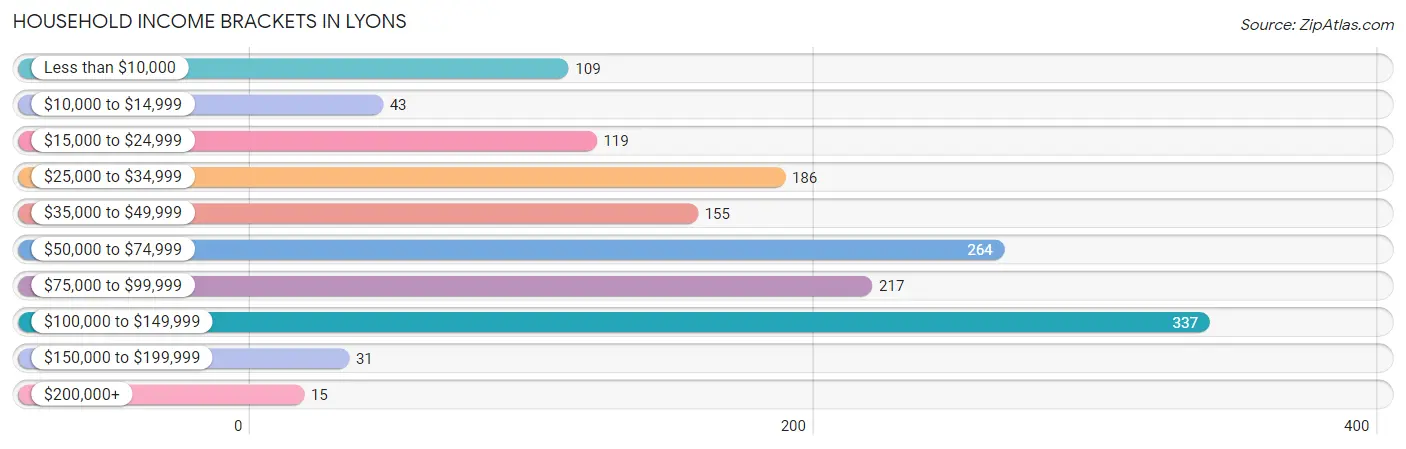
| Income Bracket | # Households | % Households |
| Less than $10,000 | 109 | 7.4% |
| $10,000 to $14,999 | 43 | 2.9% |
| $15,000 to $24,999 | 119 | 8.1% |
| $25,000 to $34,999 | 186 | 12.6% |
| $35,000 to $49,999 | 155 | 10.5% |
| $50,000 to $74,999 | 264 | 17.9% |
| $75,000 to $99,999 | 217 | 14.7% |
| $100,000 to $149,999 | 337 | 22.9% |
| $150,000 to $199,999 | 31 | 2.1% |
| $200,000+ | 15 | 1.0% |
Household Income by Householder Age in Lyons
The median household income in Lyons is $61,576, with the highest median household income of $73,500 found in the 65+ years age bracket for the primary householder. A total of 442 households (30.0%) fall into this category. Meanwhile, the 15 to 24 years age bracket for the primary householder has the lowest median household income of $0, with 9 households (0.6%) in this group.
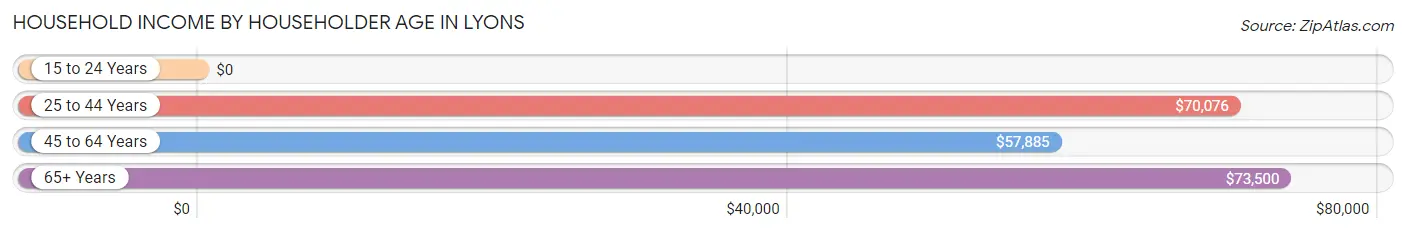
| Income Bracket | # Households | Median Income |
| 15 to 24 Years | 9 (0.6%) | $0 |
| 25 to 44 Years | 510 (34.6%) | $70,076 |
| 45 to 64 Years | 512 (34.8%) | $57,885 |
| 65+ Years | 442 (30.0%) | $73,500 |
| Total | 1,473 (100.0%) | $61,576 |
Poverty in Lyons
Income Below Poverty by Sex and Age in Lyons
With 22.0% poverty level for males and 27.7% for females among the residents of Lyons, 12 to 14 year old males and 12 to 14 year old females are the most vulnerable to poverty, with 70 males (71.4%) and 100 females (90.9%) in their respective age groups living below the poverty level.
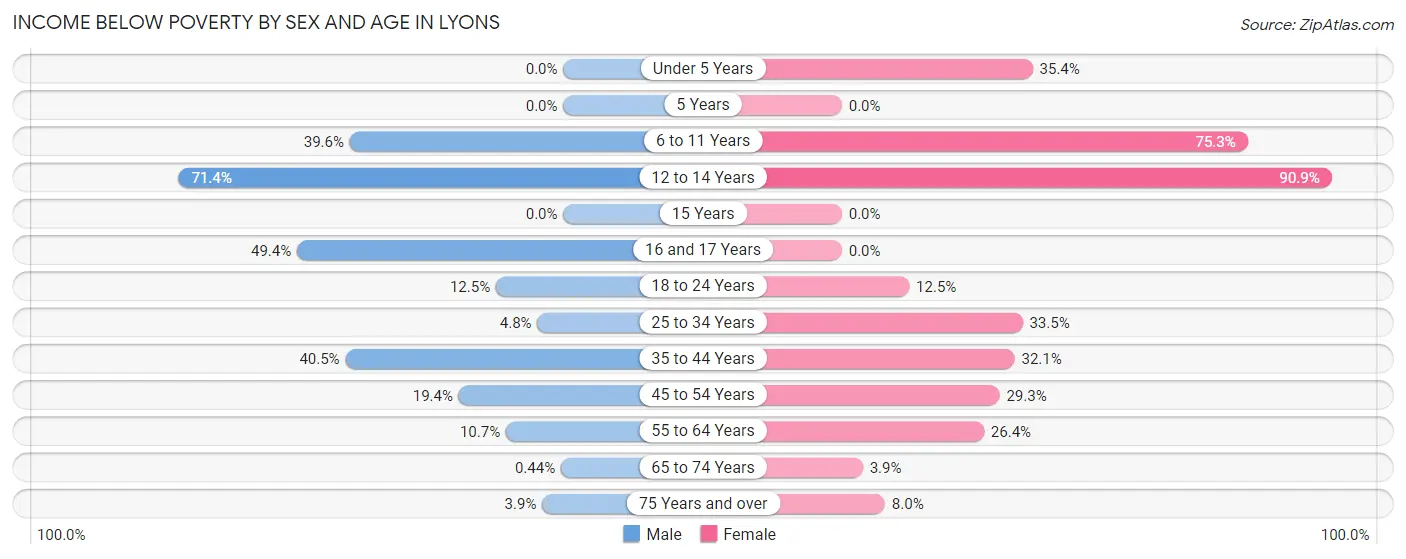
| Age Bracket | Male | Female |
| Under 5 Years | 0 (0.0%) | 34 (35.4%) |
| 5 Years | 0 (0.0%) | 0 (0.0%) |
| 6 to 11 Years | 44 (39.6%) | 61 (75.3%) |
| 12 to 14 Years | 70 (71.4%) | 100 (90.9%) |
| 15 Years | 0 (0.0%) | 0 (0.0%) |
| 16 and 17 Years | 43 (49.4%) | 0 (0.0%) |
| 18 to 24 Years | 9 (12.5%) | 20 (12.5%) |
| 25 to 34 Years | 9 (4.8%) | 53 (33.5%) |
| 35 to 44 Years | 125 (40.5%) | 93 (32.1%) |
| 45 to 54 Years | 39 (19.4%) | 60 (29.3%) |
| 55 to 64 Years | 28 (10.6%) | 86 (26.4%) |
| 65 to 74 Years | 1 (0.4%) | 10 (3.9%) |
| 75 Years and over | 4 (3.9%) | 10 (8.0%) |
| Total | 372 (22.0%) | 527 (27.7%) |
Income Above Poverty by Sex and Age in Lyons
According to the poverty statistics in Lyons, males aged under 5 years and females aged 16 and 17 years are the age groups that are most secure financially, with 100.0% of males and 100.0% of females in these age groups living above the poverty line.
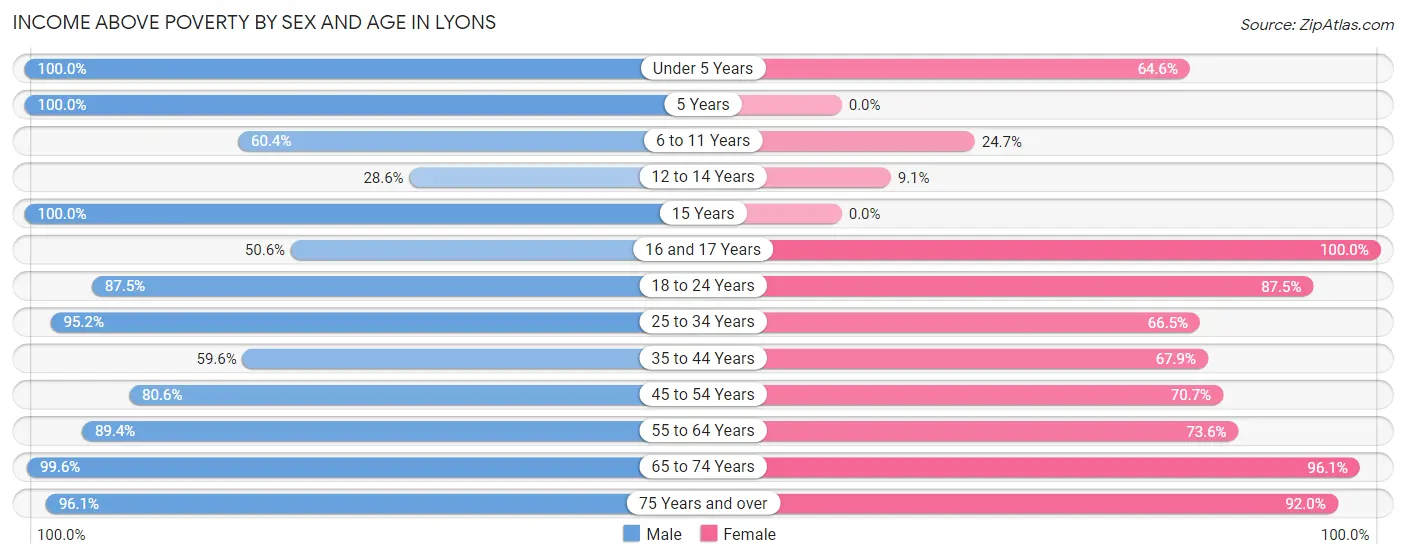
| Age Bracket | Male | Female |
| Under 5 Years | 12 (100.0%) | 62 (64.6%) |
| 5 Years | 12 (100.0%) | 0 (0.0%) |
| 6 to 11 Years | 67 (60.4%) | 20 (24.7%) |
| 12 to 14 Years | 28 (28.6%) | 10 (9.1%) |
| 15 Years | 11 (100.0%) | 0 (0.0%) |
| 16 and 17 Years | 44 (50.6%) | 92 (100.0%) |
| 18 to 24 Years | 63 (87.5%) | 140 (87.5%) |
| 25 to 34 Years | 178 (95.2%) | 105 (66.5%) |
| 35 to 44 Years | 184 (59.6%) | 197 (67.9%) |
| 45 to 54 Years | 162 (80.6%) | 145 (70.7%) |
| 55 to 64 Years | 235 (89.3%) | 240 (73.6%) |
| 65 to 74 Years | 227 (99.6%) | 248 (96.1%) |
| 75 Years and over | 98 (96.1%) | 115 (92.0%) |
| Total | 1,321 (78.0%) | 1,374 (72.3%) |
Income Below Poverty Among Married-Couple Families in Lyons
The poverty statistics for married-couple families in Lyons show that 9.3% or 56 of the total 604 families live below the poverty line. Families with 3 or 4 children have the highest poverty rate of 60.5%, comprising of 26 families. On the other hand, families with 1 or 2 children have the lowest poverty rate of 0.0%, which includes 0 families.
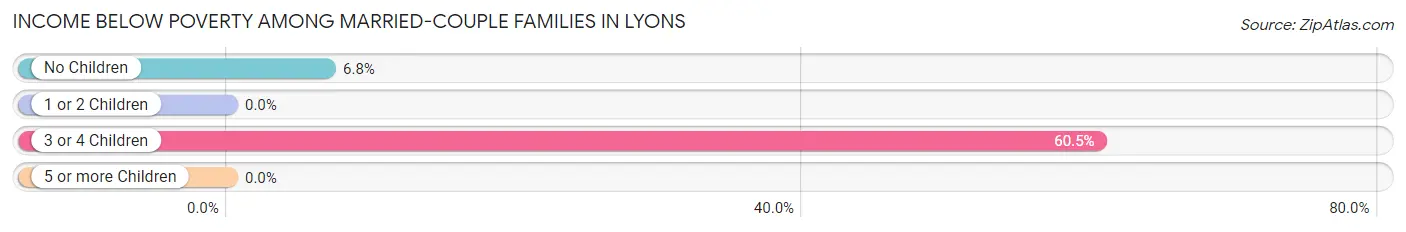
| Children | Above Poverty | Below Poverty |
| No Children | 409 (93.2%) | 30 (6.8%) |
| 1 or 2 Children | 122 (100.0%) | 0 (0.0%) |
| 3 or 4 Children | 17 (39.5%) | 26 (60.5%) |
| 5 or more Children | 0 (0.0%) | 0 (0.0%) |
| Total | 548 (90.7%) | 56 (9.3%) |
Income Below Poverty Among Single-Parent Households in Lyons
According to the poverty data in Lyons, 13.9% or 10 single-father households and 51.3% or 119 single-mother households are living below the poverty line. Among single-father households, those with 1 or 2 children have the highest poverty rate, with 10 households (31.2%) experiencing poverty. Likewise, among single-mother households, those with 5 or more children have the highest poverty rate, with 37 households (100.0%) falling below the poverty line.
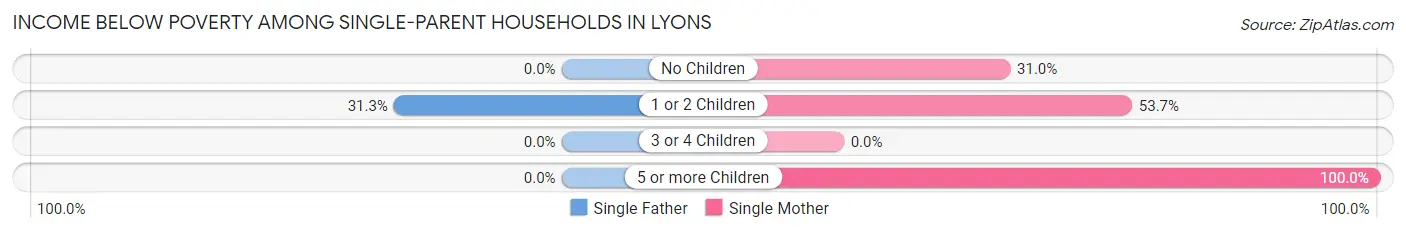
| Children | Single Father | Single Mother |
| No Children | 0 (0.0%) | 31 (31.0%) |
| 1 or 2 Children | 10 (31.2%) | 51 (53.7%) |
| 3 or 4 Children | 0 (0.0%) | 0 (0.0%) |
| 5 or more Children | 0 (0.0%) | 37 (100.0%) |
| Total | 10 (13.9%) | 119 (51.3%) |
Income Below Poverty Among Married-Couple vs Single-Parent Households in Lyons
The poverty data for Lyons shows that 56 of the married-couple family households (9.3%) and 129 of the single-parent households (42.4%) are living below the poverty level. Within the married-couple family households, those with 3 or 4 children have the highest poverty rate, with 26 households (60.5%) falling below the poverty line. Among the single-parent households, those with 5 or more children have the highest poverty rate, with 37 household (100.0%) living below poverty.
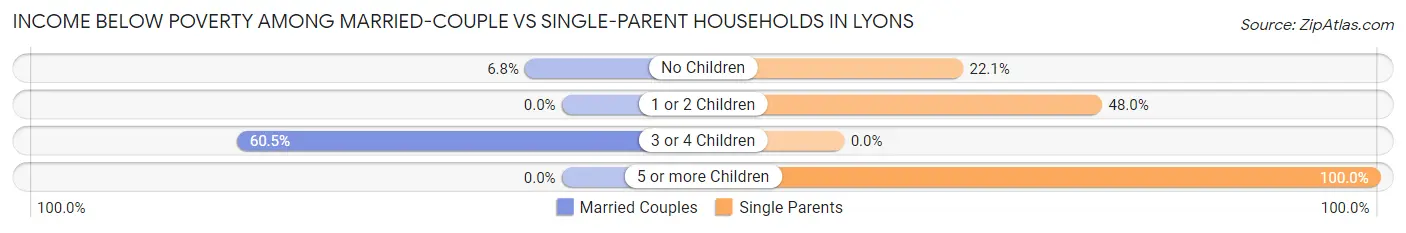
| Children | Married-Couple Families | Single-Parent Households |
| No Children | 30 (6.8%) | 31 (22.1%) |
| 1 or 2 Children | 0 (0.0%) | 61 (48.0%) |
| 3 or 4 Children | 26 (60.5%) | 0 (0.0%) |
| 5 or more Children | 0 (0.0%) | 37 (100.0%) |
| Total | 56 (9.3%) | 129 (42.4%) |
Race in Lyons
The most populous races in Lyons are White / Caucasian (2,748 | 76.5%), Hispanic or Latino (398 | 11.1%), and Two or more Races (363 | 10.1%).
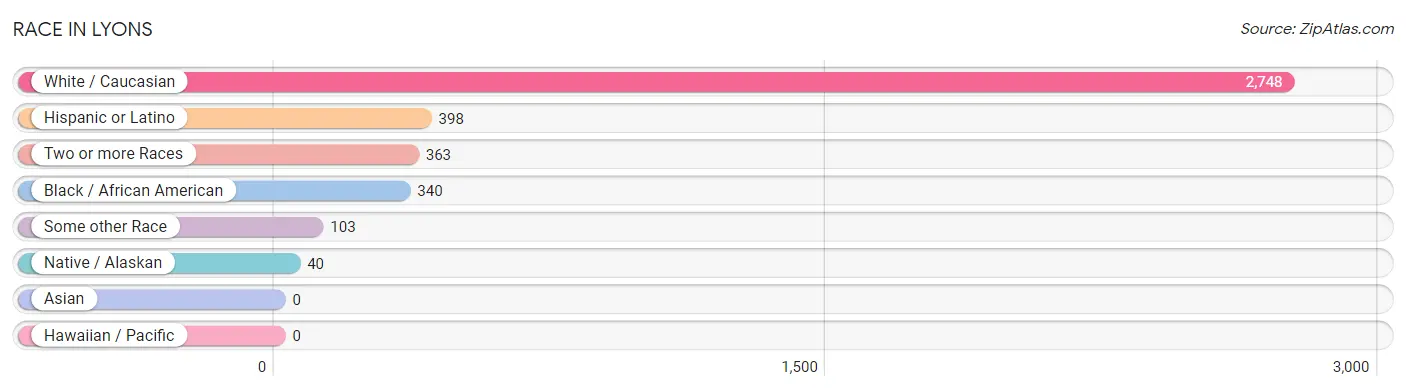
| Race | # Population | % Population |
| Asian | 0 | 0.0% |
| Black / African American | 340 | 9.5% |
| Hawaiian / Pacific | 0 | 0.0% |
| Hispanic or Latino | 398 | 11.1% |
| Native / Alaskan | 40 | 1.1% |
| White / Caucasian | 2,748 | 76.5% |
| Two or more Races | 363 | 10.1% |
| Some other Race | 103 | 2.9% |
| Total | 3,594 | 100.0% |
Ancestry in Lyons
The most populous ancestries reported in Lyons are Irish (799 | 22.2%), German (611 | 17.0%), Italian (414 | 11.5%), English (380 | 10.6%), and Puerto Rican (302 | 8.4%), together accounting for 69.7% of all Lyons residents.
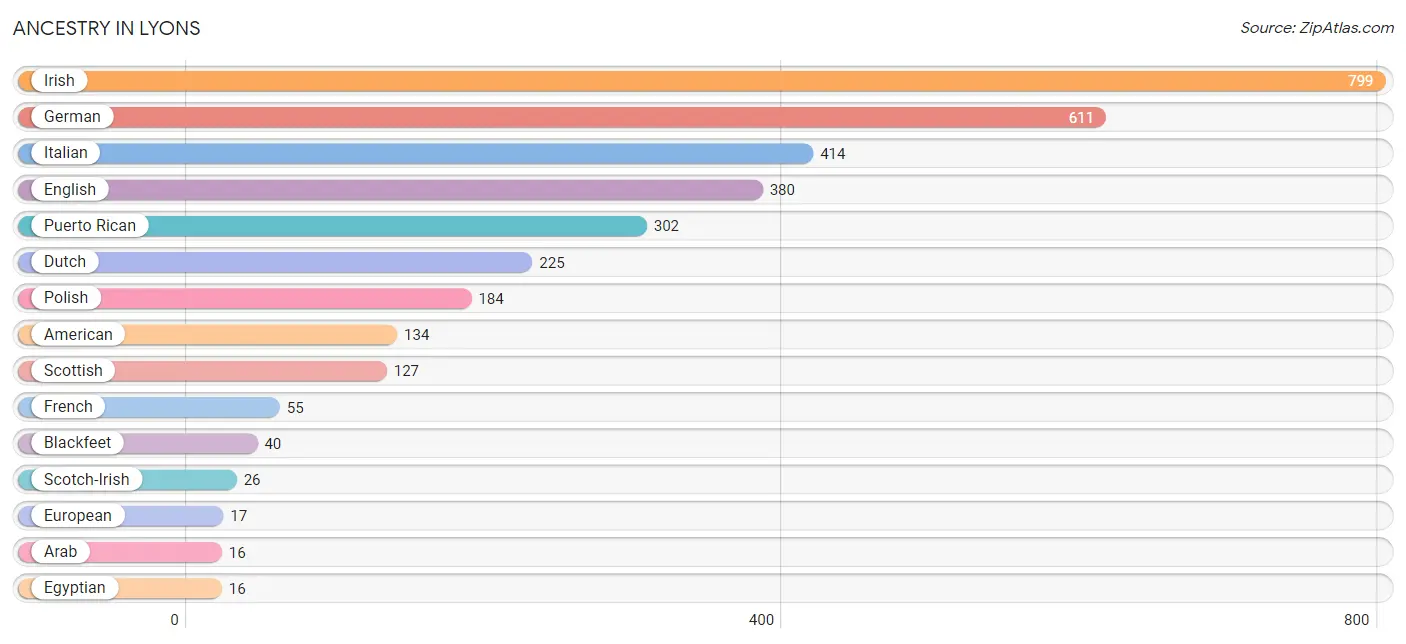
| Ancestry | # Population | % Population |
| American | 134 | 3.7% |
| Arab | 16 | 0.4% |
| Blackfeet | 40 | 1.1% |
| Central American | 14 | 0.4% |
| Cherokee | 12 | 0.3% |
| Dutch | 225 | 6.3% |
| Egyptian | 16 | 0.4% |
| English | 380 | 10.6% |
| European | 17 | 0.5% |
| French | 55 | 1.5% |
| French Canadian | 13 | 0.4% |
| German | 611 | 17.0% |
| Greek | 16 | 0.4% |
| Irish | 799 | 22.2% |
| Italian | 414 | 11.5% |
| Mexican | 9 | 0.3% |
| Polish | 184 | 5.1% |
| Puerto Rican | 302 | 8.4% |
| Russian | 13 | 0.4% |
| Salvadoran | 14 | 0.4% |
| Scotch-Irish | 26 | 0.7% |
| Scottish | 127 | 3.5% |
| Welsh | 10 | 0.3% | View All 23 Rows |
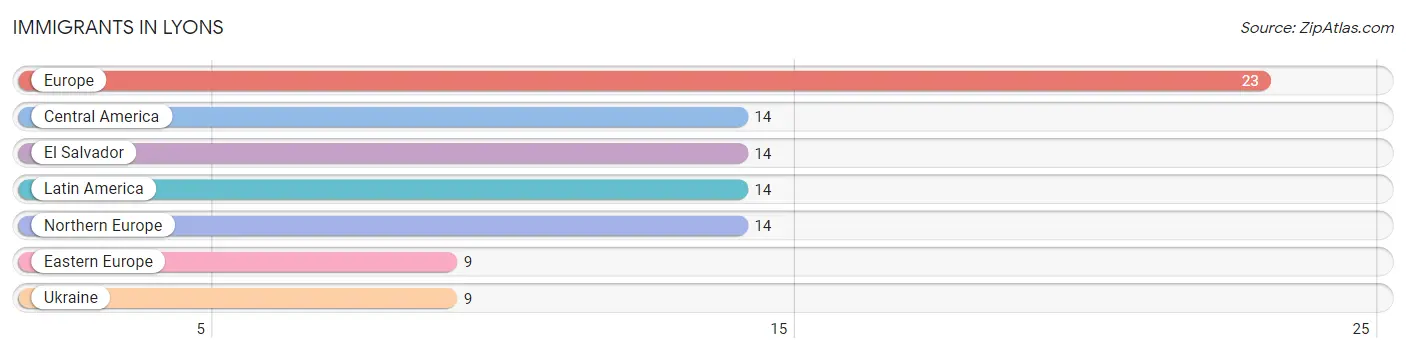
Immigrants in Lyons
The most numerous immigrant groups reported in Lyons came from Europe (23 | 0.6%), Central America (14 | 0.4%), El Salvador (14 | 0.4%), Latin America (14 | 0.4%), and Northern Europe (14 | 0.4%), together accounting for 2.2% of all Lyons residents.
| Immigration Origin | # Population | % Population |
| Central America | 14 | 0.4% |
| Eastern Europe | 9 | 0.3% |
| El Salvador | 14 | 0.4% |
| Europe | 23 | 0.6% |
| Latin America | 14 | 0.4% |
| Northern Europe | 14 | 0.4% |
| Ukraine | 9 | 0.3% | View All 7 Rows |
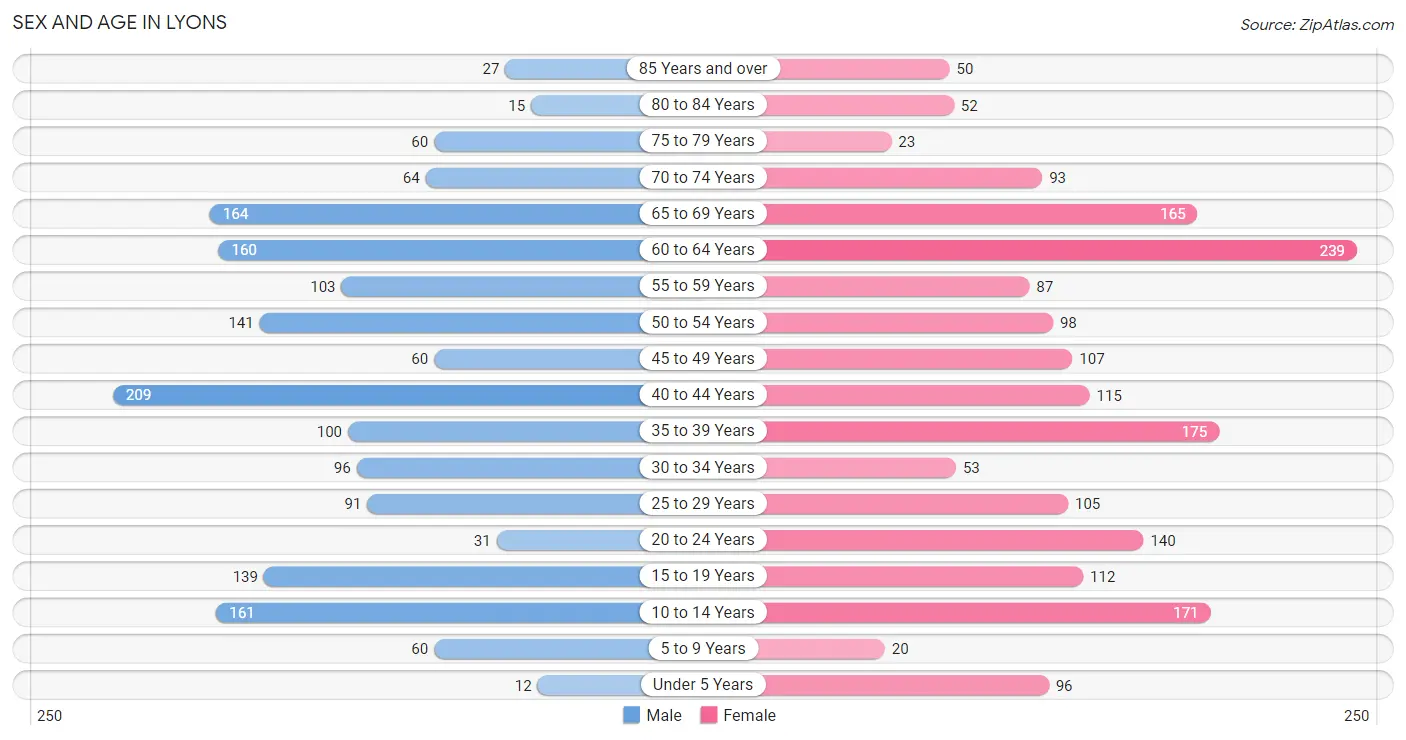
Sex and Age in Lyons
Sex and Age in Lyons
The most populous age groups in Lyons are 40 to 44 Years (209 | 12.3%) for men and 60 to 64 Years (239 | 12.6%) for women.
| Age Bracket | Male | Female |
| Under 5 Years | 12 (0.7%) | 96 (5.1%) |
| 5 to 9 Years | 60 (3.5%) | 20 (1.1%) |
| 10 to 14 Years | 161 (9.5%) | 171 (9.0%) |
| 15 to 19 Years | 139 (8.2%) | 112 (5.9%) |
| 20 to 24 Years | 31 (1.8%) | 140 (7.4%) |
| 25 to 29 Years | 91 (5.4%) | 105 (5.5%) |
| 30 to 34 Years | 96 (5.7%) | 53 (2.8%) |
| 35 to 39 Years | 100 (5.9%) | 175 (9.2%) |
| 40 to 44 Years | 209 (12.3%) | 115 (6.0%) |
| 45 to 49 Years | 60 (3.5%) | 107 (5.6%) |
| 50 to 54 Years | 141 (8.3%) | 98 (5.2%) |
| 55 to 59 Years | 103 (6.1%) | 87 (4.6%) |
| 60 to 64 Years | 160 (9.5%) | 239 (12.6%) |
| 65 to 69 Years | 164 (9.7%) | 165 (8.7%) |
| 70 to 74 Years | 64 (3.8%) | 93 (4.9%) |
| 75 to 79 Years | 60 (3.5%) | 23 (1.2%) |
| 80 to 84 Years | 15 (0.9%) | 52 (2.7%) |
| 85 Years and over | 27 (1.6%) | 50 (2.6%) |
| Total | 1,693 (100.0%) | 1,901 (100.0%) |
Families and Households in Lyons
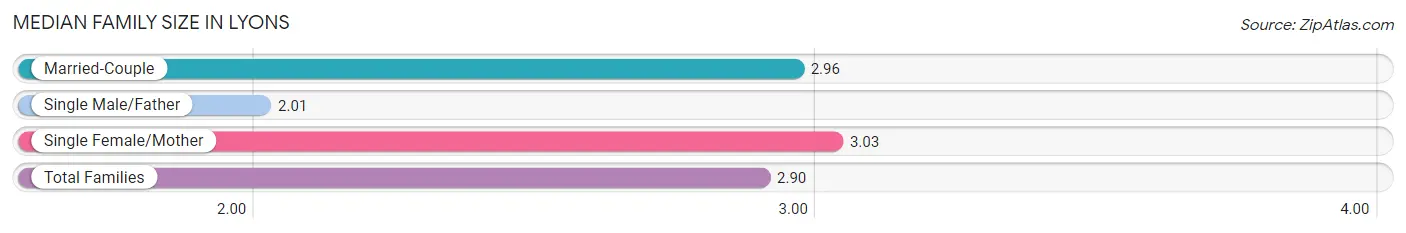
Median Family Size in Lyons
The median family size in Lyons is 2.90 persons per family, with single female/mother families (232 | 25.6%) accounting for the largest median family size of 3.03 persons per family. On the other hand, single male/father families (72 | 7.9%) represent the smallest median family size with 2.01 persons per family.
| Family Type | # Families | Family Size |
| Married-Couple | 604 (66.5%) | 2.96 |
| Single Male/Father | 72 (7.9%) | 2.01 |
| Single Female/Mother | 232 (25.6%) | 3.03 |
| Total Families | 908 (100.0%) | 2.90 |
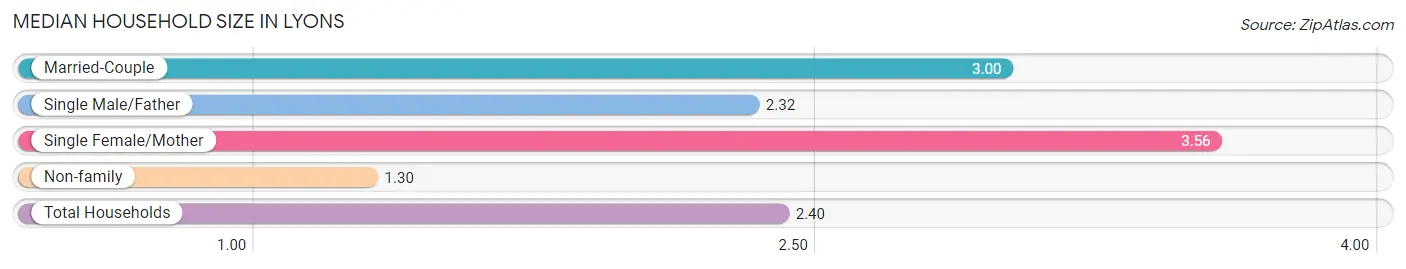
Median Household Size in Lyons
The median household size in Lyons is 2.40 persons per household, with single female/mother households (232 | 15.8%) accounting for the largest median household size of 3.56 persons per household. non-family households (565 | 38.4%) represent the smallest median household size with 1.30 persons per household.
| Household Type | # Households | Household Size |
| Married-Couple | 604 (41.0%) | 3.00 |
| Single Male/Father | 72 (4.9%) | 2.32 |
| Single Female/Mother | 232 (15.8%) | 3.56 |
| Non-family | 565 (38.4%) | 1.30 |
| Total Households | 1,473 (100.0%) | 2.40 |
Household Size by Marriage Status in Lyons
Out of a total of 1,473 households in Lyons, 908 (61.6%) are family households, while 565 (38.4%) are nonfamily households. The most numerous type of family households are 2-person households, comprising 458, and the most common type of nonfamily households are 1-person households, comprising 409.
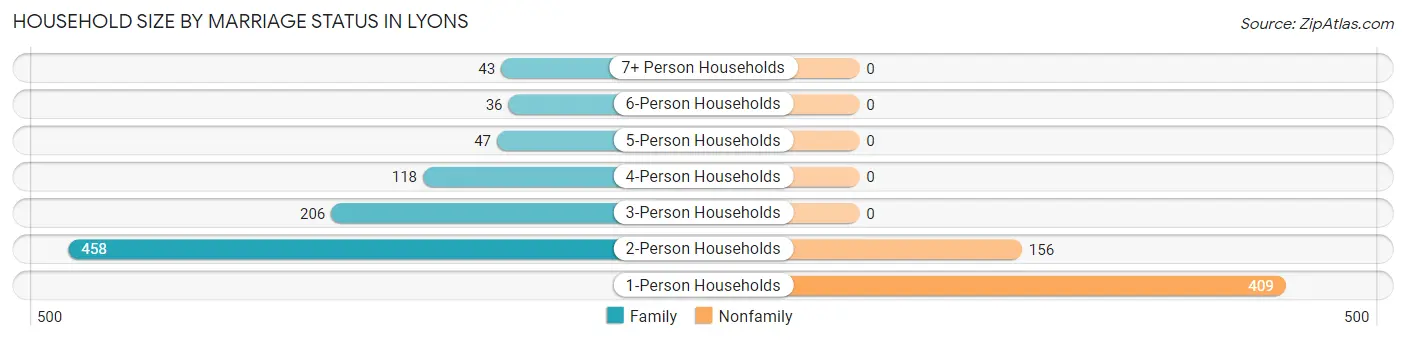
| Household Size | Family Households | Nonfamily Households |
| 1-Person Households | - | 409 (27.8%) |
| 2-Person Households | 458 (31.1%) | 156 (10.6%) |
| 3-Person Households | 206 (14.0%) | 0 (0.0%) |
| 4-Person Households | 118 (8.0%) | 0 (0.0%) |
| 5-Person Households | 47 (3.2%) | 0 (0.0%) |
| 6-Person Households | 36 (2.4%) | 0 (0.0%) |
| 7+ Person Households | 43 (2.9%) | 0 (0.0%) |
| Total | 908 (61.6%) | 565 (38.4%) |
Female Fertility in Lyons
Fertility by Age in Lyons
Average fertility rate in Lyons is 48.0 births per 1,000 women. Women in the age bracket of 20 to 34 years have the highest fertility rate with 104.0 births per 1,000 women. Women in the age bracket of 20 to 34 years acount for 77.5% of all women with births.
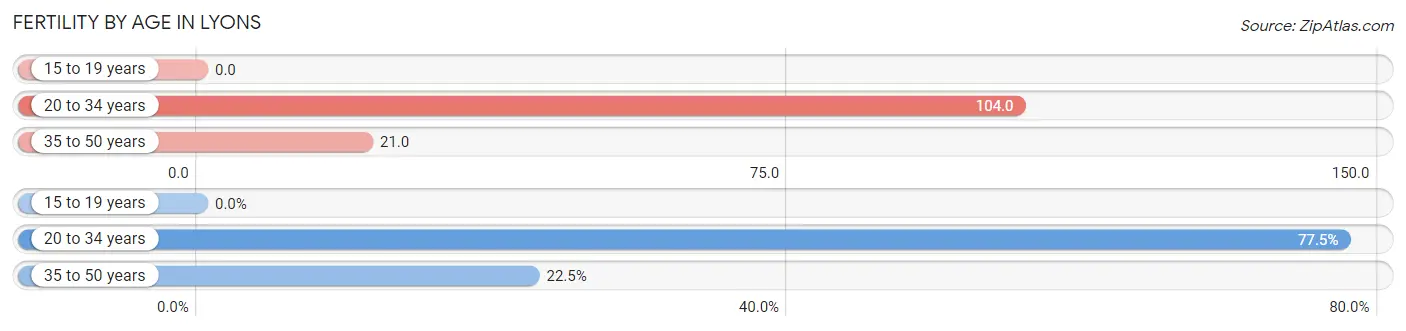
| Age Bracket | Women with Births | Births / 1,000 Women |
| 15 to 19 years | 0 (0.0%) | 0.0 |
| 20 to 34 years | 31 (77.5%) | 104.0 |
| 35 to 50 years | 9 (22.5%) | 21.0 |
| Total | 40 (100.0%) | 48.0 |
Fertility by Age by Marriage Status in Lyons
77.5% of women with births (40) in Lyons are married. The highest percentage of unmarried women with births falls into 35 to 50 years age bracket with 100.0% of them unmarried at the time of birth, while the lowest percentage of unmarried women with births belong to 20 to 34 years age bracket with 0.0% of them unmarried.
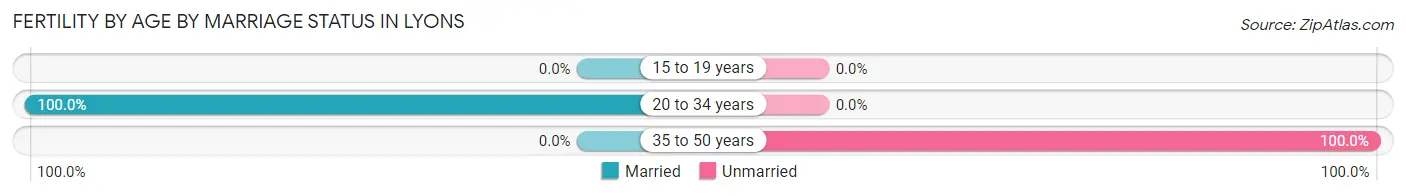
| Age Bracket | Married | Unmarried |
| 15 to 19 years | 0 (0.0%) | 0 (0.0%) |
| 20 to 34 years | 31 (100.0%) | 0 (0.0%) |
| 35 to 50 years | 0 (0.0%) | 9 (100.0%) |
| Total | 31 (77.5%) | 9 (22.5%) |
Fertility by Education in Lyons
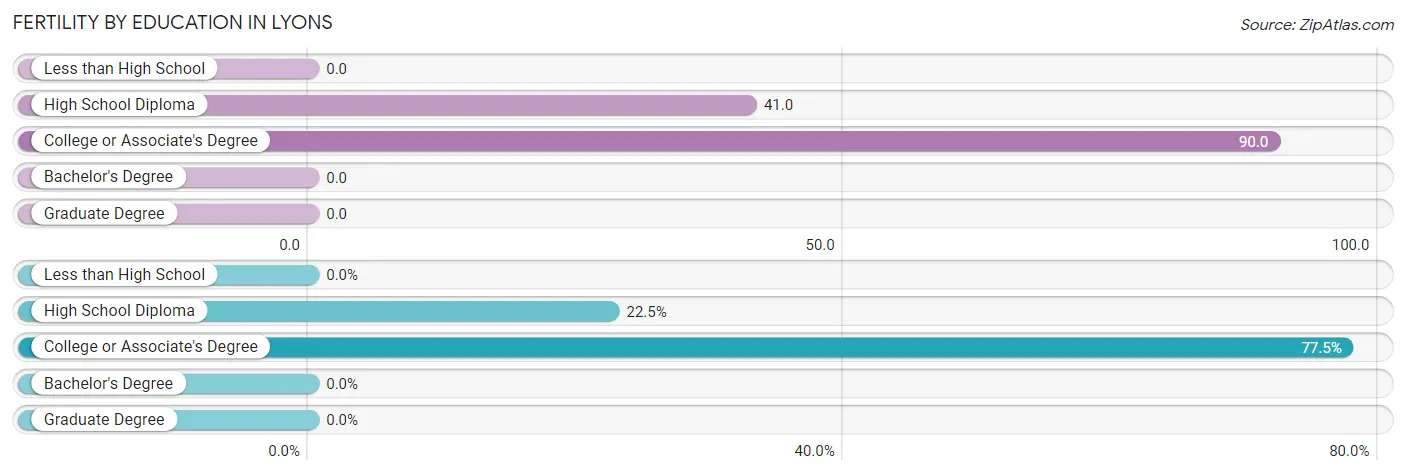
| Educational Attainment | Women with Births | Births / 1,000 Women |
| Less than High School | 0 (0.0%) | 0.0 |
| High School Diploma | 9 (22.5%) | 41.0 |
| College or Associate's Degree | 31 (77.5%) | 90.0 |
| Bachelor's Degree | 0 (0.0%) | 0.0 |
| Graduate Degree | 0 (0.0%) | 0.0 |
| Total | 40 (100.0%) | 48.0 |
Fertility by Education by Marriage Status in Lyons
22.5% of women with births in Lyons are unmarried. Women with the educational attainment of college or associate's degree are most likely to be married with 100.0% of them married at childbirth, while women with the educational attainment of high school diploma are least likely to be married with 100.0% of them unmarried at childbirth.
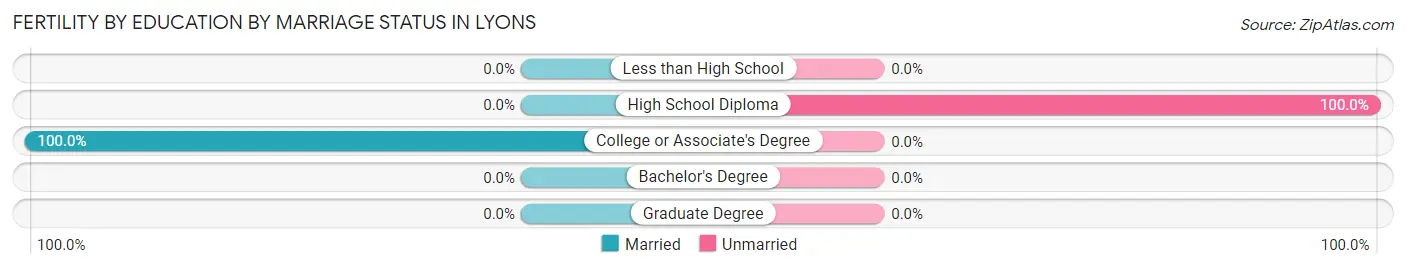
| Educational Attainment | Married | Unmarried |
| Less than High School | 0 (0.0%) | 0 (0.0%) |
| High School Diploma | 0 (0.0%) | 9 (100.0%) |
| College or Associate's Degree | 31 (100.0%) | 0 (0.0%) |
| Bachelor's Degree | 0 (0.0%) | 0 (0.0%) |
| Graduate Degree | 0 (0.0%) | 0 (0.0%) |
| Total | 31 (77.5%) | 9 (22.5%) |
Employment Characteristics in Lyons
Employment by Class of Employer in Lyons
Among the 1,568 employed individuals in Lyons, private company employees (1,033 | 65.9%), local government employees (210 | 13.4%), and state government employees (103 | 6.6%) make up the most common classes of employment.
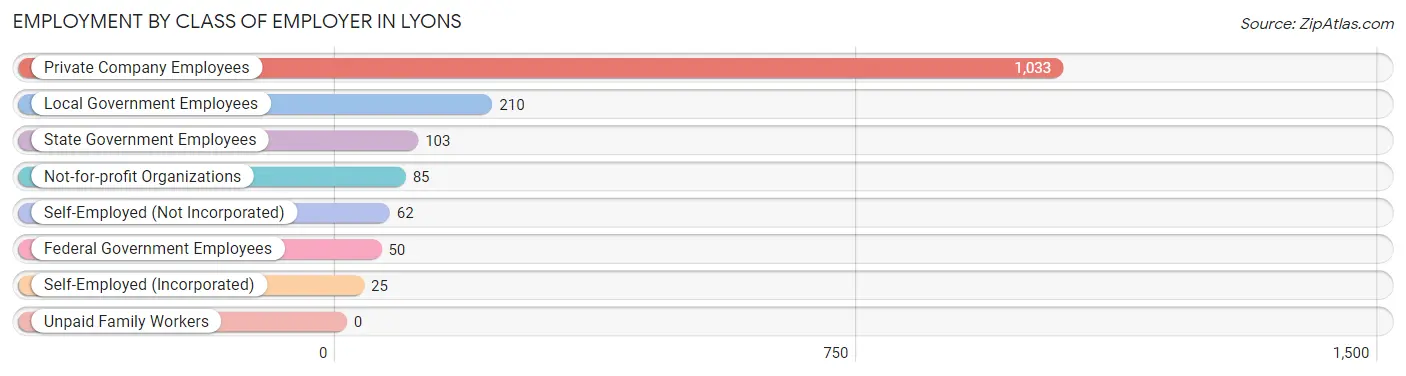
| Employer Class | # Employees | % Employees |
| Private Company Employees | 1,033 | 65.9% |
| Self-Employed (Incorporated) | 25 | 1.6% |
| Self-Employed (Not Incorporated) | 62 | 4.0% |
| Not-for-profit Organizations | 85 | 5.4% |
| Local Government Employees | 210 | 13.4% |
| State Government Employees | 103 | 6.6% |
| Federal Government Employees | 50 | 3.2% |
| Unpaid Family Workers | 0 | 0.0% |
| Total | 1,568 | 100.0% |
Employment Status by Age in Lyons
According to the labor force statistics for Lyons, out of the total population over 16 years of age (3,063), 61.6% or 1,887 individuals are in the labor force, with 15.3% or 289 of them unemployed. The age group with the highest labor force participation rate is 20 to 24 years, with 93.6% or 160 individuals in the labor force. Within the labor force, the 30 to 34 years age range has the highest percentage of unemployed individuals, with 63.5% or 80 of them being unemployed.
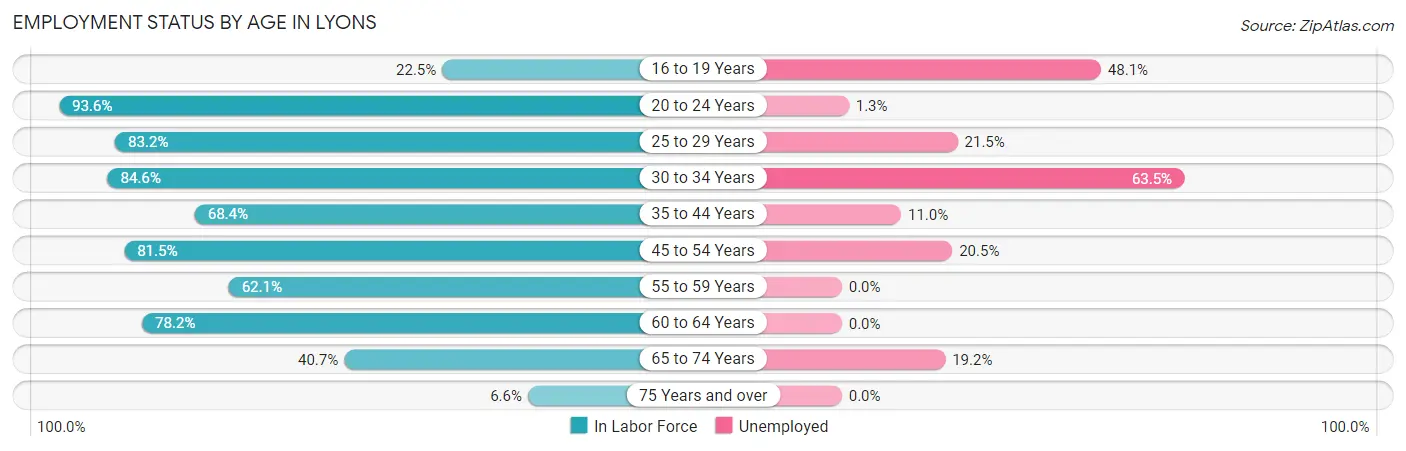
| Age Bracket | In Labor Force | Unemployed |
| 16 to 19 Years | 54 (22.5%) | 26 (48.1%) |
| 20 to 24 Years | 160 (93.6%) | 2 (1.3%) |
| 25 to 29 Years | 163 (83.2%) | 35 (21.5%) |
| 30 to 34 Years | 126 (84.6%) | 80 (63.5%) |
| 35 to 44 Years | 410 (68.4%) | 45 (11.0%) |
| 45 to 54 Years | 331 (81.5%) | 68 (20.5%) |
| 55 to 59 Years | 118 (62.1%) | 0 (0.0%) |
| 60 to 64 Years | 312 (78.2%) | 0 (0.0%) |
| 65 to 74 Years | 198 (40.7%) | 38 (19.2%) |
| 75 Years and over | 15 (6.6%) | 0 (0.0%) |
| Total | 1,887 (61.6%) | 289 (15.3%) |
Employment Status by Educational Attainment in Lyons
According to labor force statistics for Lyons, 75.3% of individuals (1,460) out of the total population between 25 and 64 years of age (1,939) are in the labor force, with 15.3% or 223 of them being unemployed. The group with the highest labor force participation rate are those with the educational attainment of college / associate degree, with 85.0% or 697 individuals in the labor force. Within the labor force, individuals with less than high school education have the highest percentage of unemployment, with 44.9% or 35 of them being unemployed.
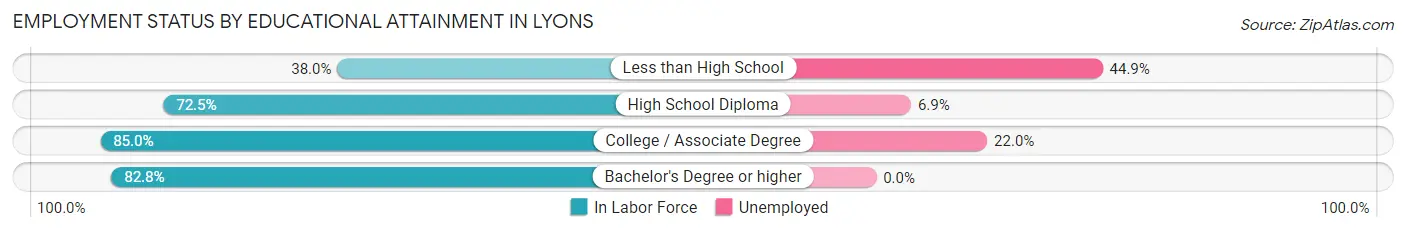
| Educational Attainment | In Labor Force | Unemployed |
| Less than High School | 78 (38.0%) | 92 (44.9%) |
| High School Diploma | 507 (72.5%) | 48 (6.9%) |
| College / Associate Degree | 697 (85.0%) | 180 (22.0%) |
| Bachelor's Degree or higher | 178 (82.8%) | 0 (0.0%) |
| Total | 1,460 (75.3%) | 297 (15.3%) |
Employment Occupations by Sex in Lyons
Management, Business, Science and Arts Occupations
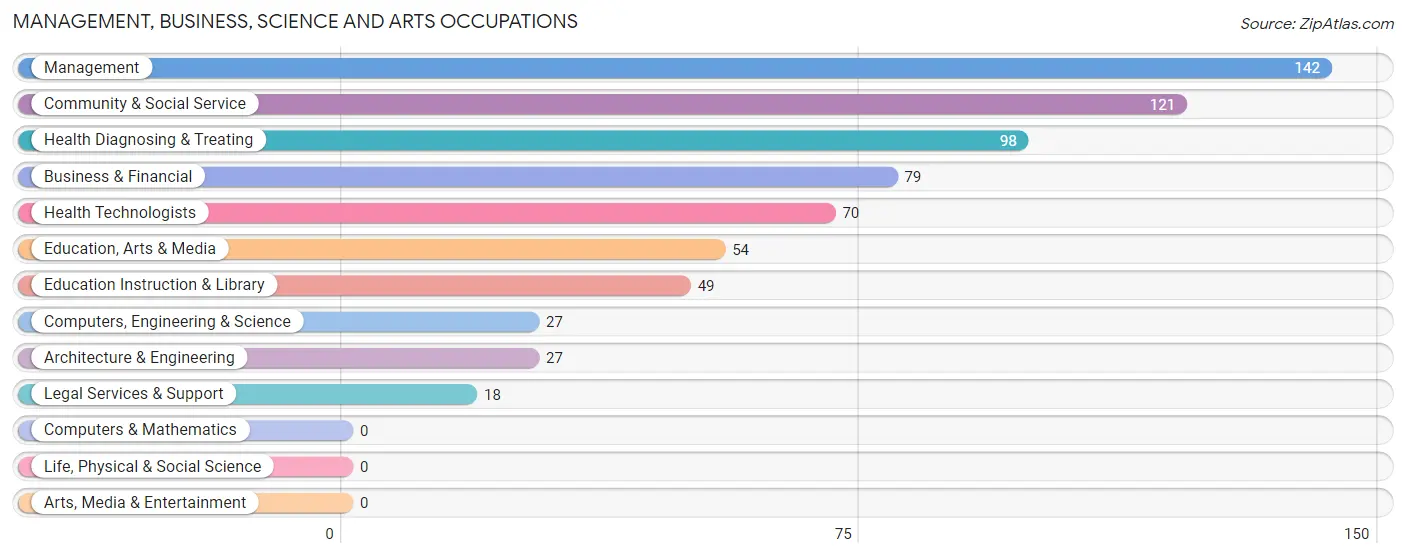
The most common Management, Business, Science and Arts occupations in Lyons are Management (142 | 8.9%), Community & Social Service (121 | 7.6%), Health Diagnosing & Treating (98 | 6.2%), Business & Financial (79 | 5.0%), and Health Technologists (70 | 4.4%).
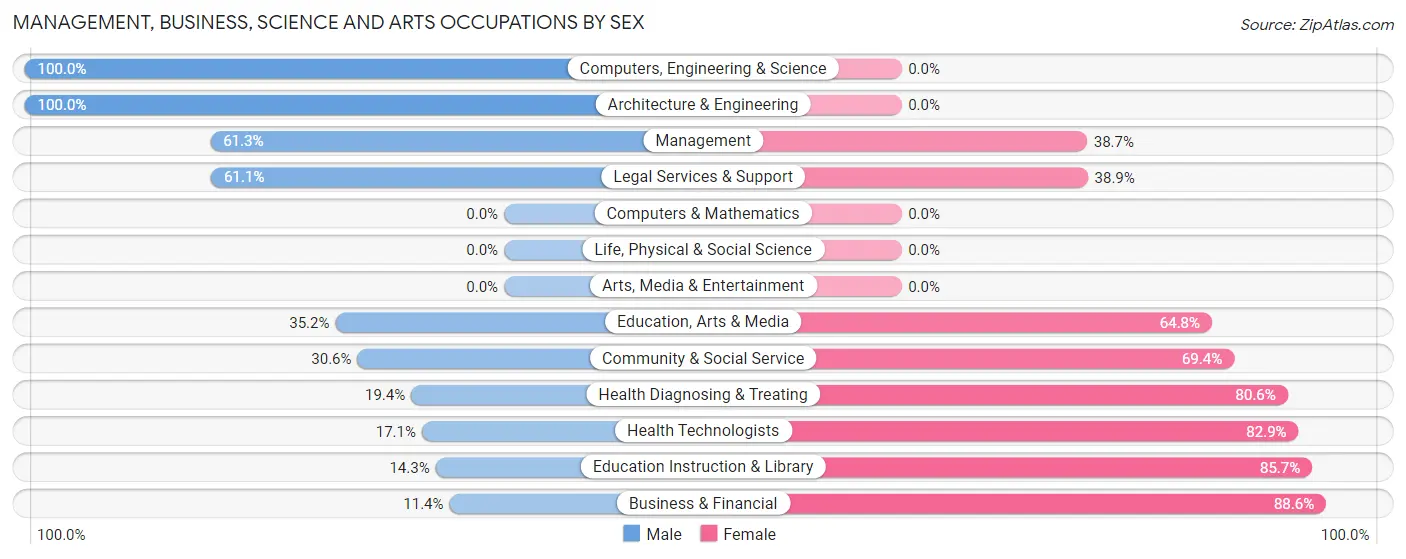
Management, Business, Science and Arts Occupations by Sex
Within the Management, Business, Science and Arts occupations in Lyons, the most male-oriented occupations are Computers, Engineering & Science (100.0%), Architecture & Engineering (100.0%), and Management (61.3%), while the most female-oriented occupations are Business & Financial (88.6%), Education Instruction & Library (85.7%), and Health Technologists (82.9%).
| Occupation | Male | Female |
| Management | 87 (61.3%) | 55 (38.7%) |
| Business & Financial | 9 (11.4%) | 70 (88.6%) |
| Computers, Engineering & Science | 27 (100.0%) | 0 (0.0%) |
| Computers & Mathematics | 0 (0.0%) | 0 (0.0%) |
| Architecture & Engineering | 27 (100.0%) | 0 (0.0%) |
| Life, Physical & Social Science | 0 (0.0%) | 0 (0.0%) |
| Community & Social Service | 37 (30.6%) | 84 (69.4%) |
| Education, Arts & Media | 19 (35.2%) | 35 (64.8%) |
| Legal Services & Support | 11 (61.1%) | 7 (38.9%) |
| Education Instruction & Library | 7 (14.3%) | 42 (85.7%) |
| Arts, Media & Entertainment | 0 (0.0%) | 0 (0.0%) |
| Health Diagnosing & Treating | 19 (19.4%) | 79 (80.6%) |
| Health Technologists | 12 (17.1%) | 58 (82.9%) |
| Total (Category) | 179 (38.3%) | 288 (61.7%) |
| Total (Overall) | 765 (48.1%) | 824 (51.9%) |
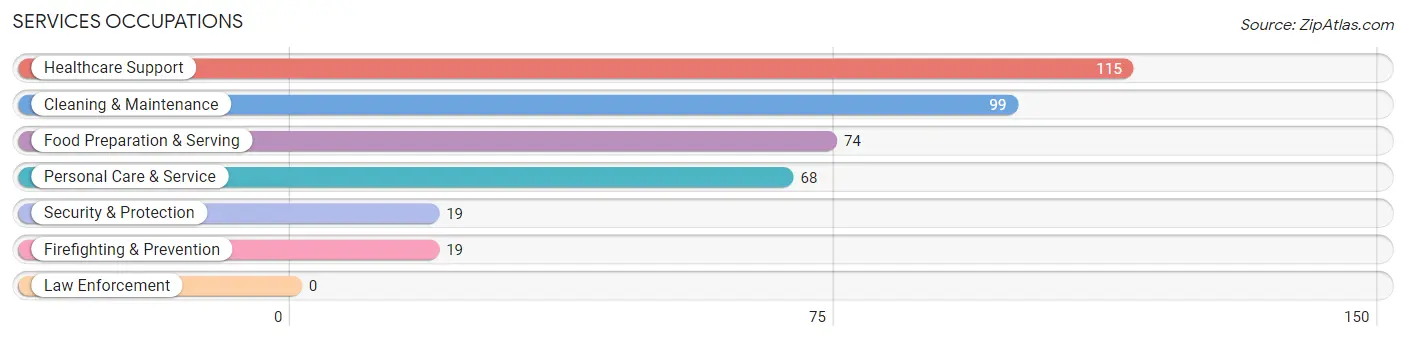
Services Occupations
The most common Services occupations in Lyons are Healthcare Support (115 | 7.2%), Cleaning & Maintenance (99 | 6.2%), Food Preparation & Serving (74 | 4.7%), Personal Care & Service (68 | 4.3%), and Security & Protection (19 | 1.2%).
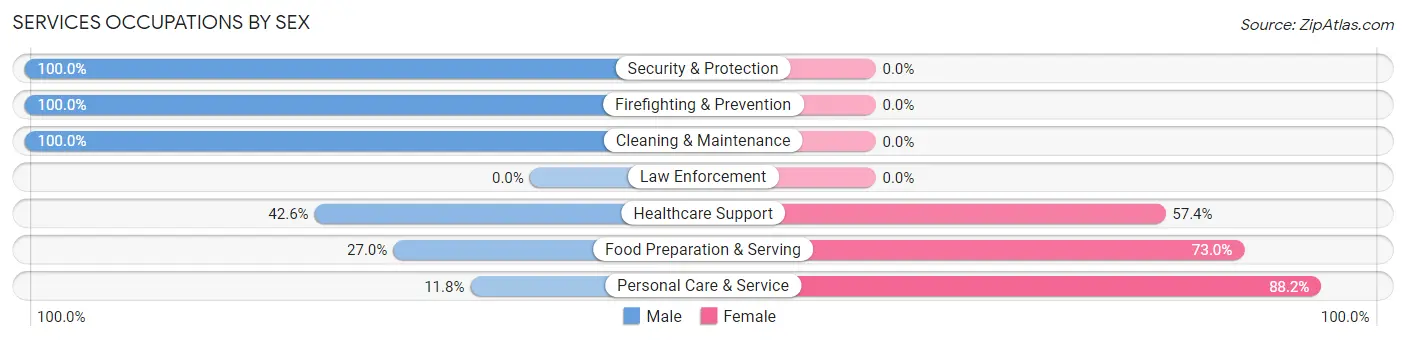
Services Occupations by Sex
Within the Services occupations in Lyons, the most male-oriented occupations are Security & Protection (100.0%), Firefighting & Prevention (100.0%), and Cleaning & Maintenance (100.0%), while the most female-oriented occupations are Personal Care & Service (88.2%), Food Preparation & Serving (73.0%), and Healthcare Support (57.4%).
| Occupation | Male | Female |
| Healthcare Support | 49 (42.6%) | 66 (57.4%) |
| Security & Protection | 19 (100.0%) | 0 (0.0%) |
| Firefighting & Prevention | 19 (100.0%) | 0 (0.0%) |
| Law Enforcement | 0 (0.0%) | 0 (0.0%) |
| Food Preparation & Serving | 20 (27.0%) | 54 (73.0%) |
| Cleaning & Maintenance | 99 (100.0%) | 0 (0.0%) |
| Personal Care & Service | 8 (11.8%) | 60 (88.2%) |
| Total (Category) | 195 (52.0%) | 180 (48.0%) |
| Total (Overall) | 765 (48.1%) | 824 (51.9%) |
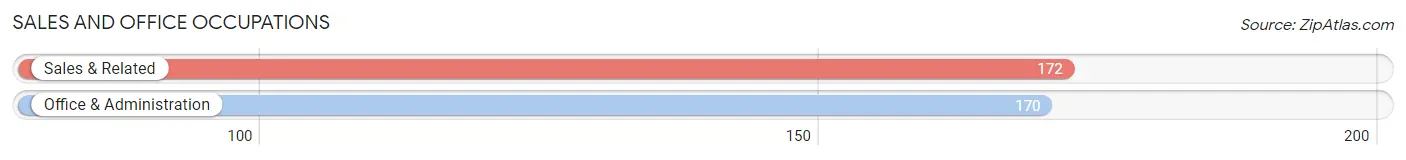
Sales and Office Occupations
The most common Sales and Office occupations in Lyons are Sales & Related (172 | 10.8%), and Office & Administration (170 | 10.7%).
Sales and Office Occupations by Sex
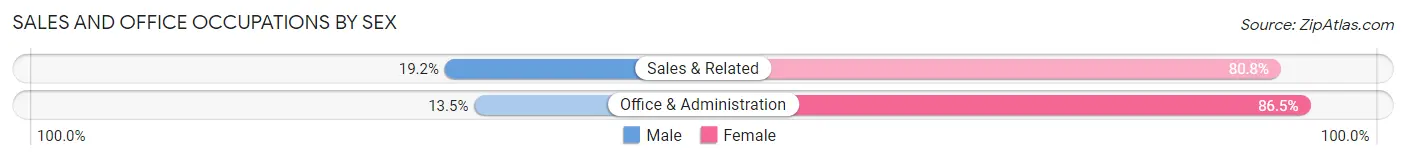
| Occupation | Male | Female |
| Sales & Related | 33 (19.2%) | 139 (80.8%) |
| Office & Administration | 23 (13.5%) | 147 (86.5%) |
| Total (Category) | 56 (16.4%) | 286 (83.6%) |
| Total (Overall) | 765 (48.1%) | 824 (51.9%) |
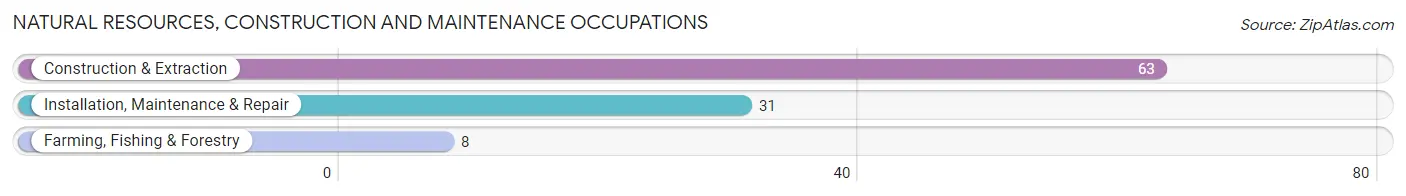
Natural Resources, Construction and Maintenance Occupations
The most common Natural Resources, Construction and Maintenance occupations in Lyons are Construction & Extraction (63 | 4.0%), Installation, Maintenance & Repair (31 | 1.9%), and Farming, Fishing & Forestry (8 | 0.5%).
Natural Resources, Construction and Maintenance Occupations by Sex
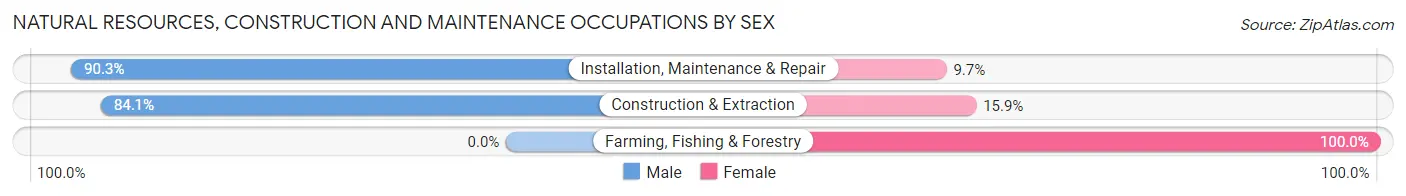
| Occupation | Male | Female |
| Farming, Fishing & Forestry | 0 (0.0%) | 8 (100.0%) |
| Construction & Extraction | 53 (84.1%) | 10 (15.9%) |
| Installation, Maintenance & Repair | 28 (90.3%) | 3 (9.7%) |
| Total (Category) | 81 (79.4%) | 21 (20.6%) |
| Total (Overall) | 765 (48.1%) | 824 (51.9%) |
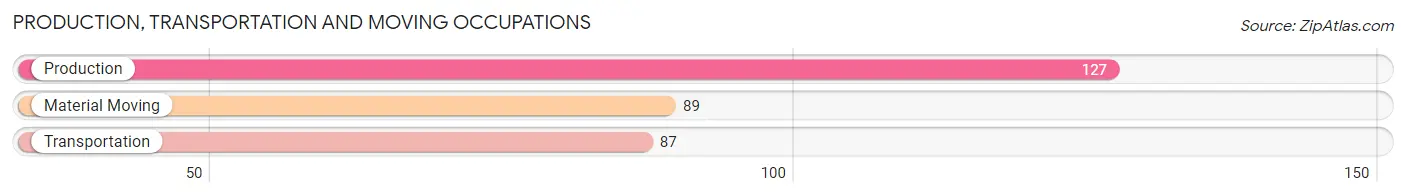
Production, Transportation and Moving Occupations
The most common Production, Transportation and Moving occupations in Lyons are Production (127 | 8.0%), Material Moving (89 | 5.6%), and Transportation (87 | 5.5%).
Production, Transportation and Moving Occupations by Sex
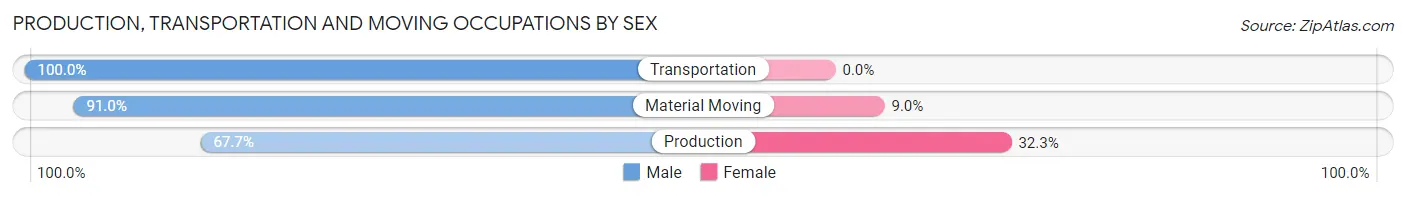
| Occupation | Male | Female |
| Production | 86 (67.7%) | 41 (32.3%) |
| Transportation | 87 (100.0%) | 0 (0.0%) |
| Material Moving | 81 (91.0%) | 8 (9.0%) |
| Total (Category) | 254 (83.8%) | 49 (16.2%) |
| Total (Overall) | 765 (48.1%) | 824 (51.9%) |
Employment Industries by Sex in Lyons
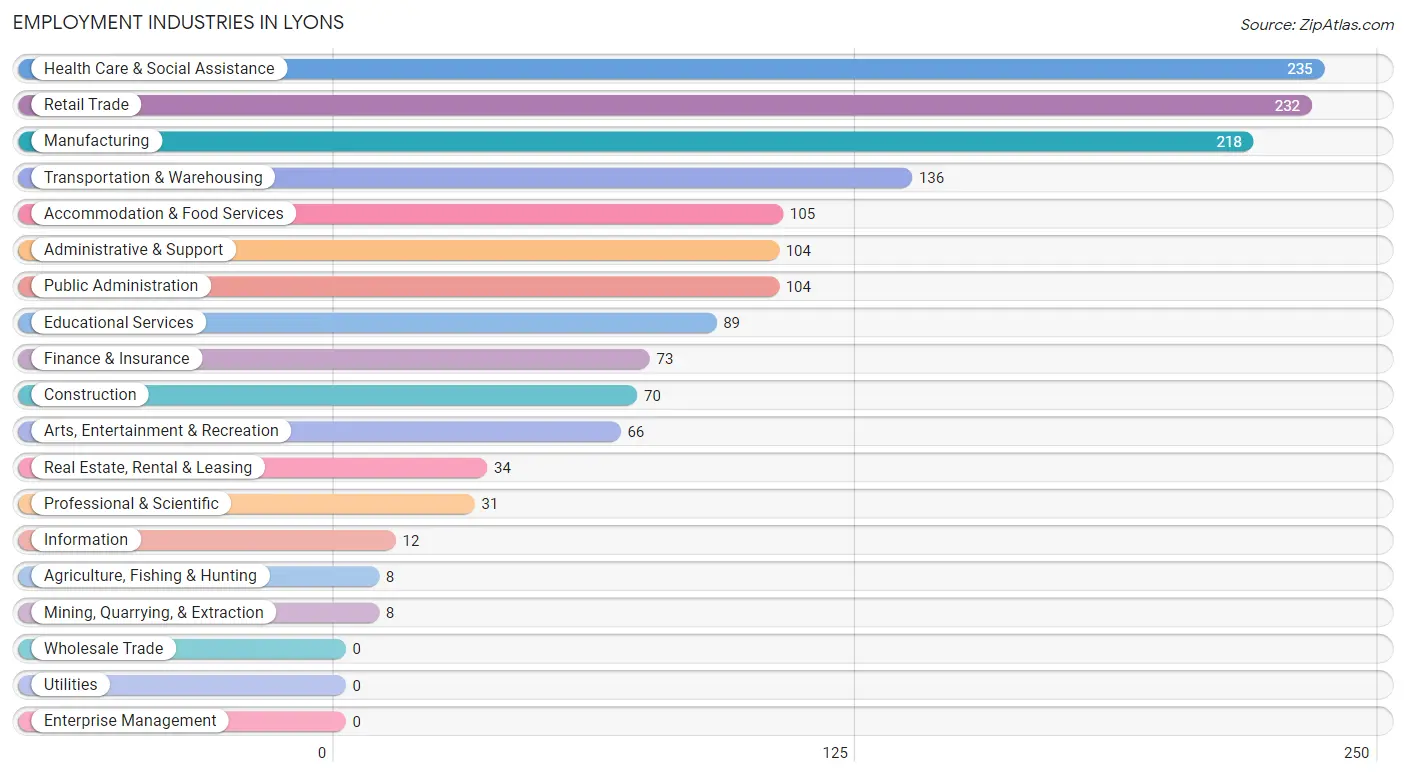
Employment Industries in Lyons
The major employment industries in Lyons include Health Care & Social Assistance (235 | 14.8%), Retail Trade (232 | 14.6%), Manufacturing (218 | 13.7%), Transportation & Warehousing (136 | 8.6%), and Accommodation & Food Services (105 | 6.6%).
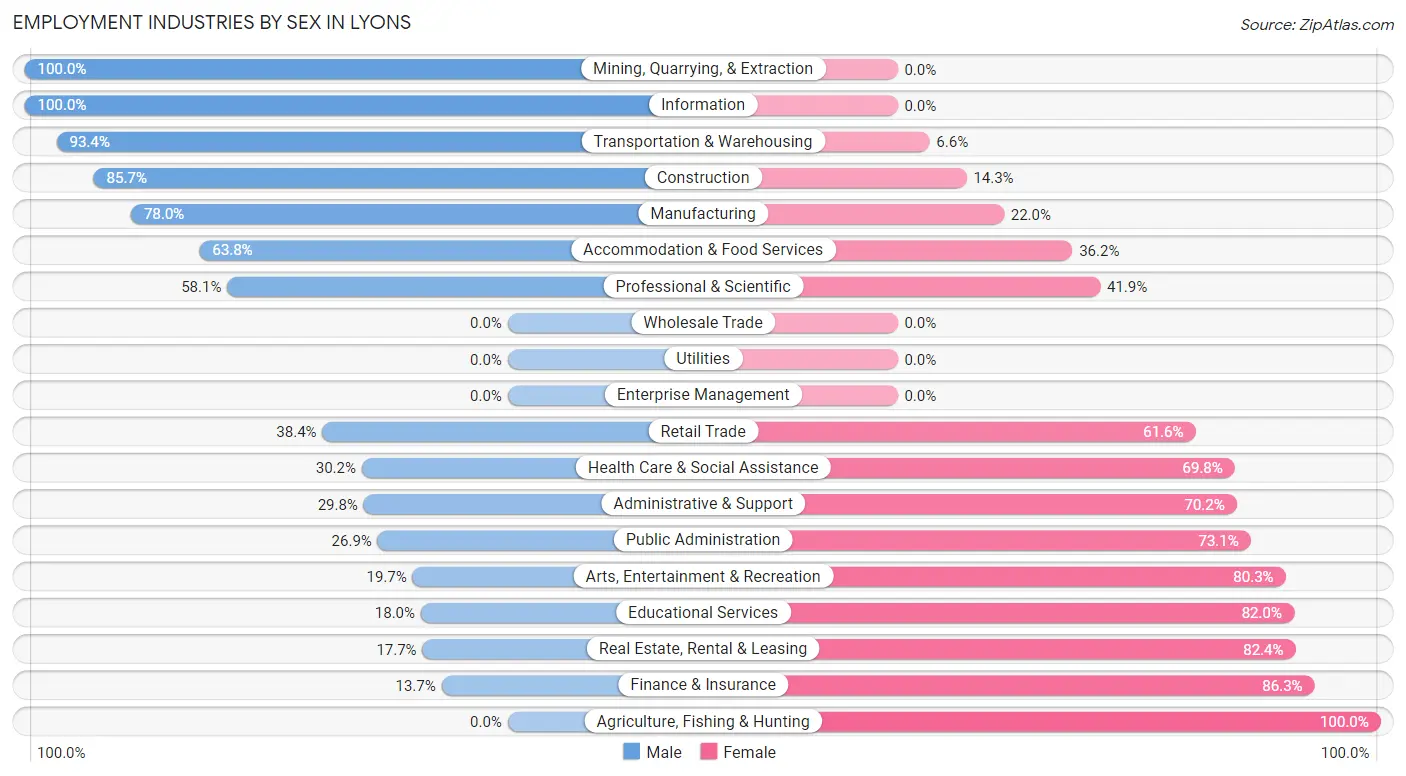
Employment Industries by Sex in Lyons
The Lyons industries that see more men than women are Mining, Quarrying, & Extraction (100.0%), Information (100.0%), and Transportation & Warehousing (93.4%), whereas the industries that tend to have a higher number of women are Agriculture, Fishing & Hunting (100.0%), Finance & Insurance (86.3%), and Real Estate, Rental & Leasing (82.4%).
| Industry | Male | Female |
| Agriculture, Fishing & Hunting | 0 (0.0%) | 8 (100.0%) |
| Mining, Quarrying, & Extraction | 8 (100.0%) | 0 (0.0%) |
| Construction | 60 (85.7%) | 10 (14.3%) |
| Manufacturing | 170 (78.0%) | 48 (22.0%) |
| Wholesale Trade | 0 (0.0%) | 0 (0.0%) |
| Retail Trade | 89 (38.4%) | 143 (61.6%) |
| Transportation & Warehousing | 127 (93.4%) | 9 (6.6%) |
| Utilities | 0 (0.0%) | 0 (0.0%) |
| Information | 12 (100.0%) | 0 (0.0%) |
| Finance & Insurance | 10 (13.7%) | 63 (86.3%) |
| Real Estate, Rental & Leasing | 6 (17.6%) | 28 (82.4%) |
| Professional & Scientific | 18 (58.1%) | 13 (41.9%) |
| Enterprise Management | 0 (0.0%) | 0 (0.0%) |
| Administrative & Support | 31 (29.8%) | 73 (70.2%) |
| Educational Services | 16 (18.0%) | 73 (82.0%) |
| Health Care & Social Assistance | 71 (30.2%) | 164 (69.8%) |
| Arts, Entertainment & Recreation | 13 (19.7%) | 53 (80.3%) |
| Accommodation & Food Services | 67 (63.8%) | 38 (36.2%) |
| Public Administration | 28 (26.9%) | 76 (73.1%) |
| Total | 765 (48.1%) | 824 (51.9%) |
Education in Lyons
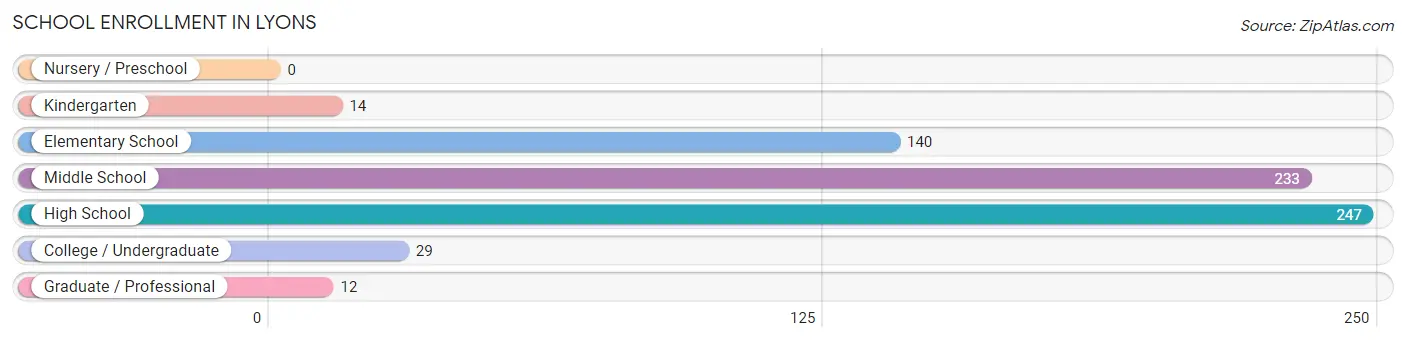
School Enrollment in Lyons
The most common levels of schooling among the 675 students in Lyons are high school (247 | 36.6%), middle school (233 | 34.5%), and elementary school (140 | 20.7%).
| School Level | # Students | % Students |
| Nursery / Preschool | 0 | 0.0% |
| Kindergarten | 14 | 2.1% |
| Elementary School | 140 | 20.7% |
| Middle School | 233 | 34.5% |
| High School | 247 | 36.6% |
| College / Undergraduate | 29 | 4.3% |
| Graduate / Professional | 12 | 1.8% |
| Total | 675 | 100.0% |
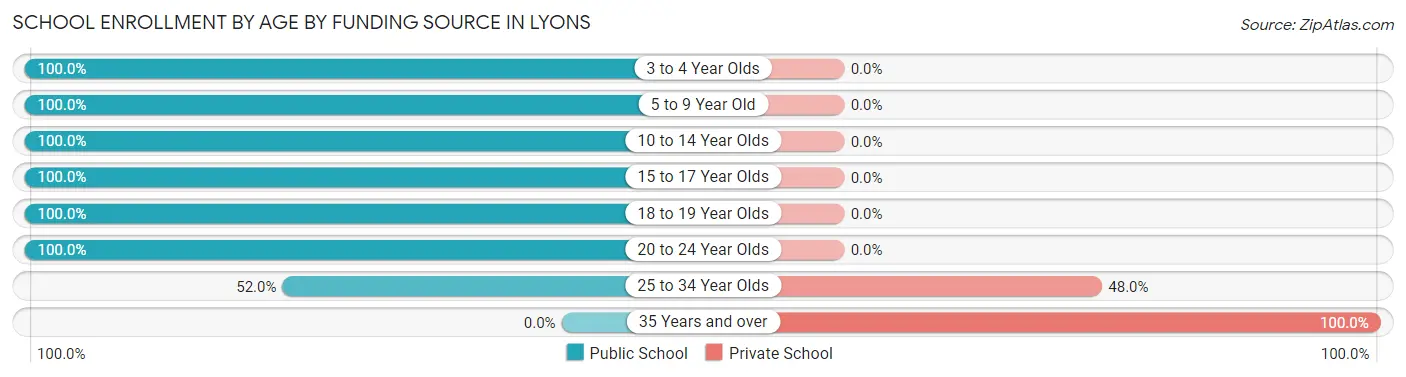
School Enrollment by Age by Funding Source in Lyons
Out of a total of 675 students who are enrolled in schools in Lyons, 26 (3.9%) attend a private institution, while the remaining 649 (96.1%) are enrolled in public schools. The age group of 35 years and over has the highest likelihood of being enrolled in private schools, with 14 (100.0% in the age bracket) enrolled. Conversely, the age group of 3 to 4 year olds has the lowest likelihood of being enrolled in a private school, with 2 (100.0% in the age bracket) attending a public institution.
| Age Bracket | Public School | Private School |
| 3 to 4 Year Olds | 2 (100.0%) | 0 (0.0%) |
| 5 to 9 Year Old | 80 (100.0%) | 0 (0.0%) |
| 10 to 14 Year Olds | 321 (100.0%) | 0 (0.0%) |
| 15 to 17 Year Olds | 190 (100.0%) | 0 (0.0%) |
| 18 to 19 Year Olds | 41 (100.0%) | 0 (0.0%) |
| 20 to 24 Year Olds | 2 (100.0%) | 0 (0.0%) |
| 25 to 34 Year Olds | 13 (52.0%) | 12 (48.0%) |
| 35 Years and over | 0 (0.0%) | 14 (100.0%) |
| Total | 649 (96.1%) | 26 (3.9%) |
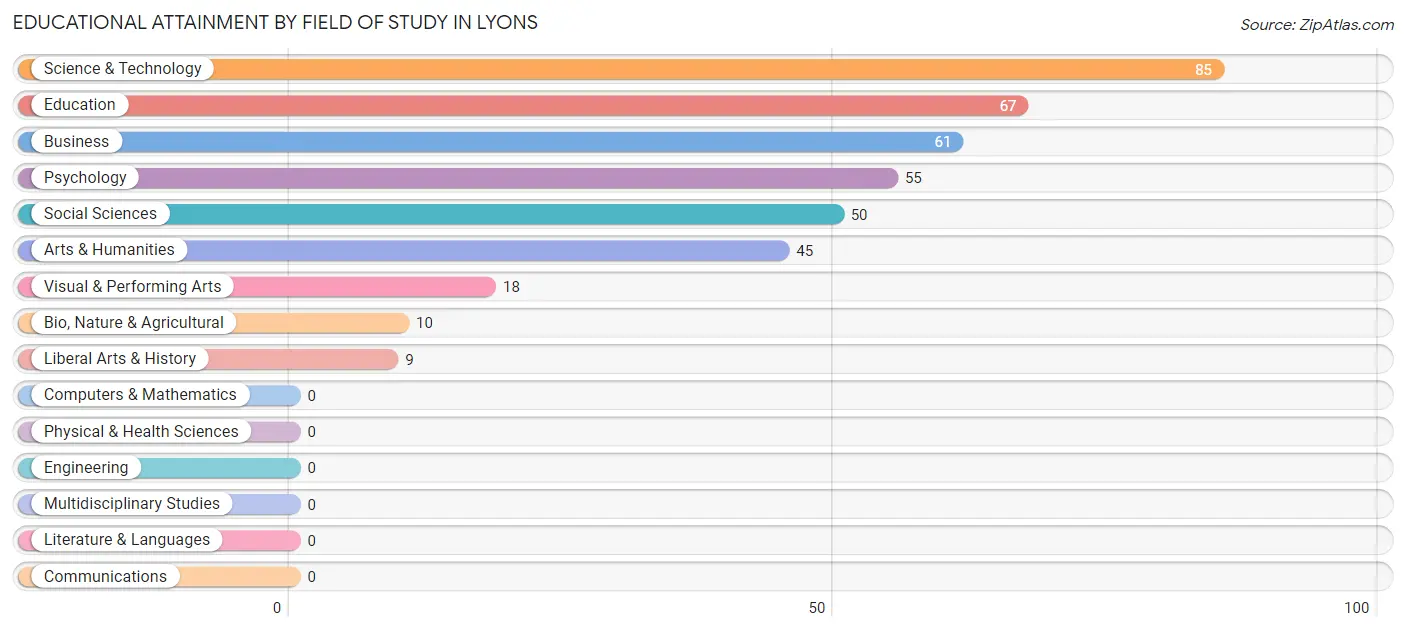
Educational Attainment by Field of Study in Lyons
Science & technology (85 | 21.2%), education (67 | 16.8%), business (61 | 15.2%), psychology (55 | 13.8%), and social sciences (50 | 12.5%) are the most common fields of study among 400 individuals in Lyons who have obtained a bachelor's degree or higher.
| Field of Study | # Graduates | % Graduates |
| Computers & Mathematics | 0 | 0.0% |
| Bio, Nature & Agricultural | 10 | 2.5% |
| Physical & Health Sciences | 0 | 0.0% |
| Psychology | 55 | 13.8% |
| Social Sciences | 50 | 12.5% |
| Engineering | 0 | 0.0% |
| Multidisciplinary Studies | 0 | 0.0% |
| Science & Technology | 85 | 21.2% |
| Business | 61 | 15.2% |
| Education | 67 | 16.8% |
| Literature & Languages | 0 | 0.0% |
| Liberal Arts & History | 9 | 2.2% |
| Visual & Performing Arts | 18 | 4.5% |
| Communications | 0 | 0.0% |
| Arts & Humanities | 45 | 11.3% |
| Total | 400 | 100.0% |
Transportation & Commute in Lyons
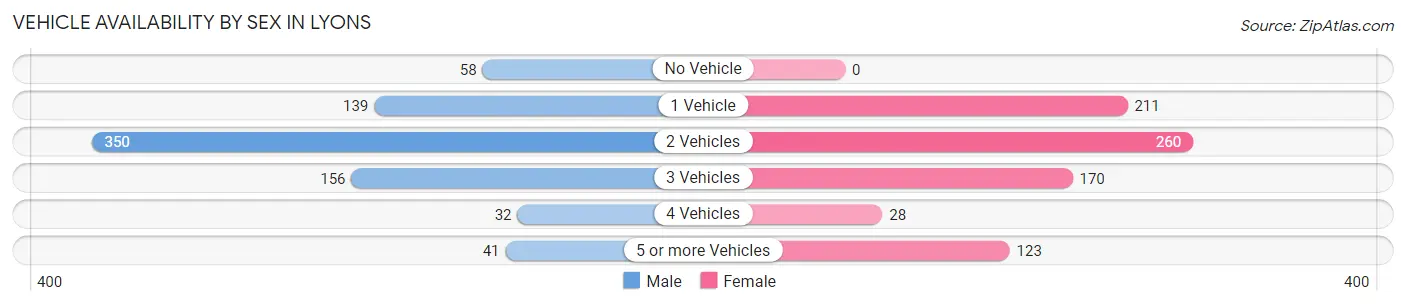
Vehicle Availability by Sex in Lyons
The most prevalent vehicle ownership categories in Lyons are males with 2 vehicles (350, accounting for 45.1%) and females with 2 vehicles (260, making up 44.2%).
| Vehicles Available | Male | Female |
| No Vehicle | 58 (7.5%) | 0 (0.0%) |
| 1 Vehicle | 139 (17.9%) | 211 (26.6%) |
| 2 Vehicles | 350 (45.1%) | 260 (32.8%) |
| 3 Vehicles | 156 (20.1%) | 170 (21.5%) |
| 4 Vehicles | 32 (4.1%) | 28 (3.5%) |
| 5 or more Vehicles | 41 (5.3%) | 123 (15.5%) |
| Total | 776 (100.0%) | 792 (100.0%) |
Commute Time in Lyons
The most frequently occuring commute durations in Lyons are 5 to 9 minutes (268 commuters, 17.3%), 15 to 19 minutes (246 commuters, 15.9%), and 20 to 24 minutes (184 commuters, 11.9%).
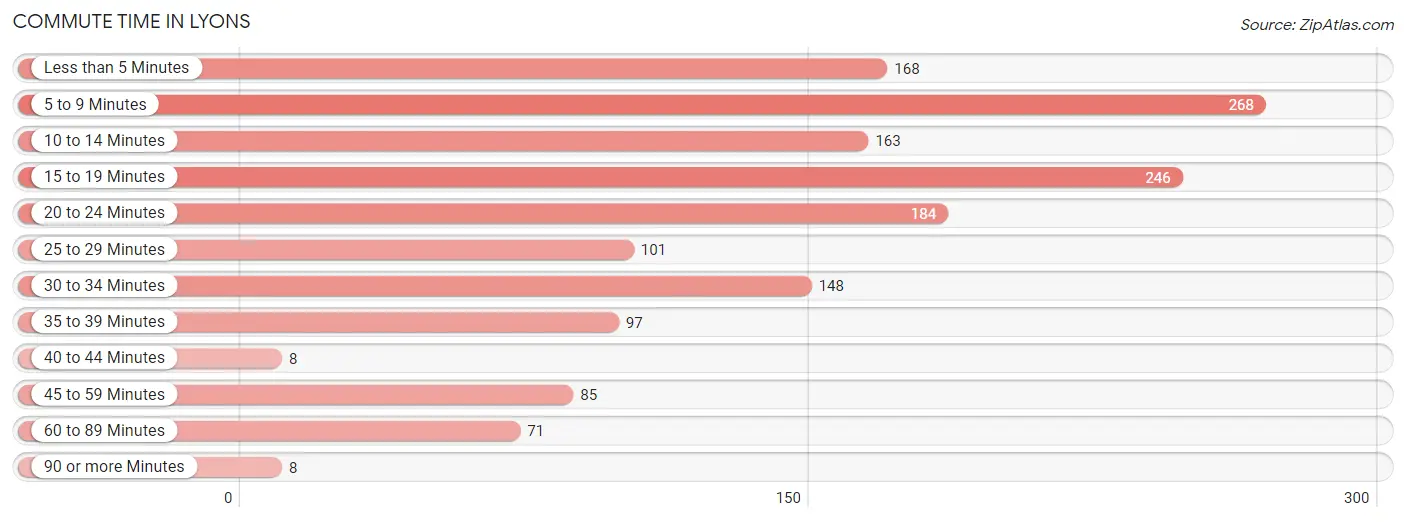
| Commute Time | # Commuters | % Commuters |
| Less than 5 Minutes | 168 | 10.9% |
| 5 to 9 Minutes | 268 | 17.3% |
| 10 to 14 Minutes | 163 | 10.5% |
| 15 to 19 Minutes | 246 | 15.9% |
| 20 to 24 Minutes | 184 | 11.9% |
| 25 to 29 Minutes | 101 | 6.5% |
| 30 to 34 Minutes | 148 | 9.6% |
| 35 to 39 Minutes | 97 | 6.3% |
| 40 to 44 Minutes | 8 | 0.5% |
| 45 to 59 Minutes | 85 | 5.5% |
| 60 to 89 Minutes | 71 | 4.6% |
| 90 or more Minutes | 8 | 0.5% |
Commute Time by Sex in Lyons
The most common commute times in Lyons are 20 to 24 minutes (124 commuters, 16.2%) for males and 5 to 9 minutes (188 commuters, 24.1%) for females.
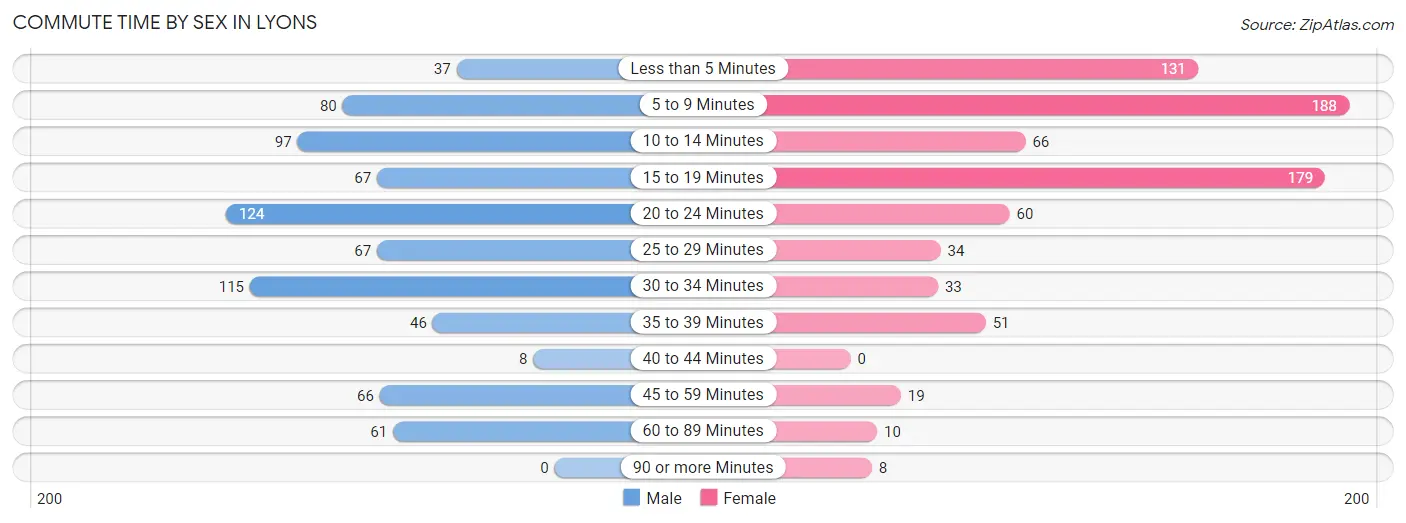
| Commute Time | Male | Female |
| Less than 5 Minutes | 37 (4.8%) | 131 (16.8%) |
| 5 to 9 Minutes | 80 (10.4%) | 188 (24.1%) |
| 10 to 14 Minutes | 97 (12.6%) | 66 (8.5%) |
| 15 to 19 Minutes | 67 (8.7%) | 179 (23.0%) |
| 20 to 24 Minutes | 124 (16.2%) | 60 (7.7%) |
| 25 to 29 Minutes | 67 (8.7%) | 34 (4.4%) |
| 30 to 34 Minutes | 115 (15.0%) | 33 (4.2%) |
| 35 to 39 Minutes | 46 (6.0%) | 51 (6.6%) |
| 40 to 44 Minutes | 8 (1.0%) | 0 (0.0%) |
| 45 to 59 Minutes | 66 (8.6%) | 19 (2.4%) |
| 60 to 89 Minutes | 61 (7.9%) | 10 (1.3%) |
| 90 or more Minutes | 0 (0.0%) | 8 (1.0%) |
Time of Departure to Work by Sex in Lyons
The most frequent times of departure to work in Lyons are 4:00 PM to 11:59 PM (139, 18.1%) for males and 12:00 PM to 3:59 PM (170, 21.8%) for females.
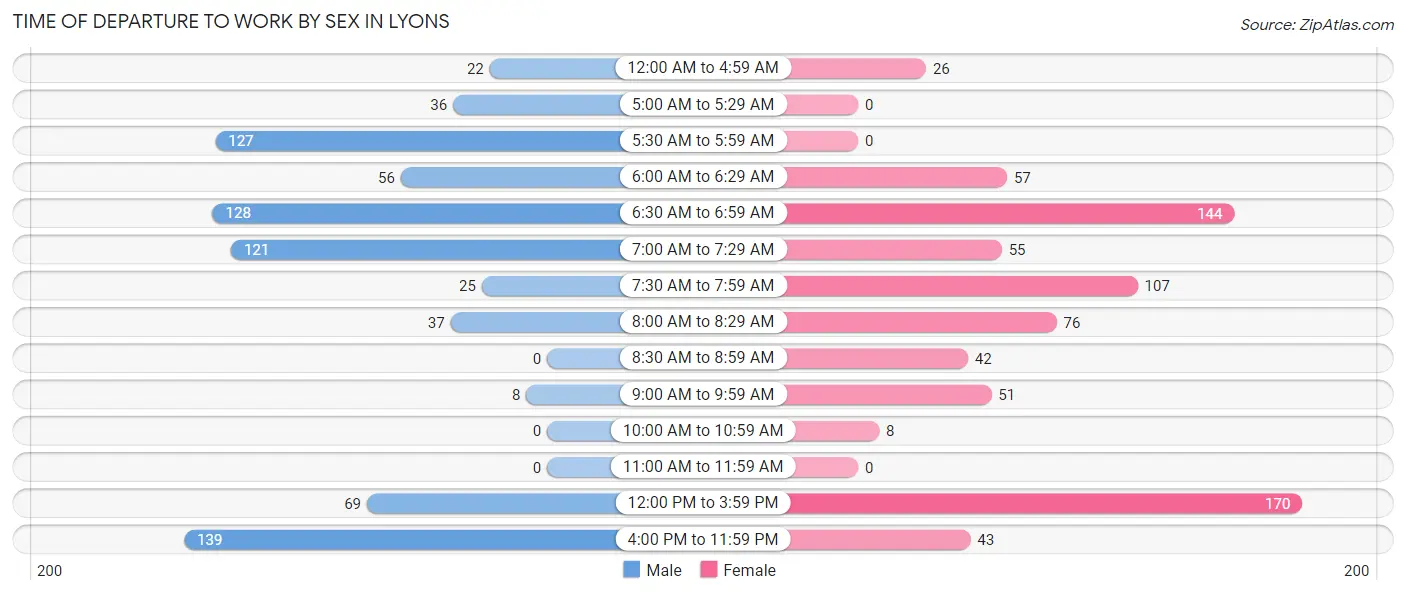
| Time of Departure | Male | Female |
| 12:00 AM to 4:59 AM | 22 (2.9%) | 26 (3.3%) |
| 5:00 AM to 5:29 AM | 36 (4.7%) | 0 (0.0%) |
| 5:30 AM to 5:59 AM | 127 (16.5%) | 0 (0.0%) |
| 6:00 AM to 6:29 AM | 56 (7.3%) | 57 (7.3%) |
| 6:30 AM to 6:59 AM | 128 (16.7%) | 144 (18.5%) |
| 7:00 AM to 7:29 AM | 121 (15.8%) | 55 (7.1%) |
| 7:30 AM to 7:59 AM | 25 (3.3%) | 107 (13.7%) |
| 8:00 AM to 8:29 AM | 37 (4.8%) | 76 (9.8%) |
| 8:30 AM to 8:59 AM | 0 (0.0%) | 42 (5.4%) |
| 9:00 AM to 9:59 AM | 8 (1.0%) | 51 (6.6%) |
| 10:00 AM to 10:59 AM | 0 (0.0%) | 8 (1.0%) |
| 11:00 AM to 11:59 AM | 0 (0.0%) | 0 (0.0%) |
| 12:00 PM to 3:59 PM | 69 (9.0%) | 170 (21.8%) |
| 4:00 PM to 11:59 PM | 139 (18.1%) | 43 (5.5%) |
| Total | 768 (100.0%) | 779 (100.0%) |
Housing Occupancy in Lyons
Occupancy by Ownership in Lyons
Of the total 1,473 dwellings in Lyons, owner-occupied units account for 1,007 (68.4%), while renter-occupied units make up 466 (31.6%).
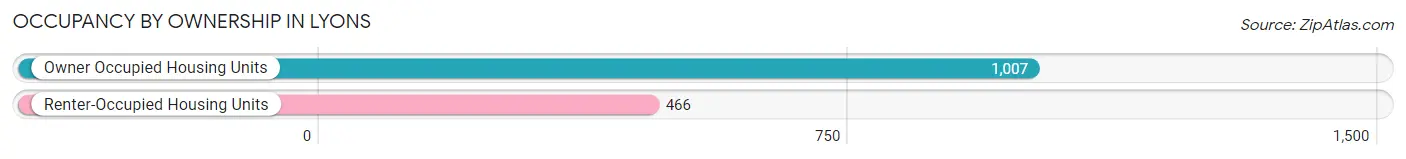
| Occupancy | # Housing Units | % Housing Units |
| Owner Occupied Housing Units | 1,007 | 68.4% |
| Renter-Occupied Housing Units | 466 | 31.6% |
| Total Occupied Housing Units | 1,473 | 100.0% |
Occupancy by Household Size in Lyons
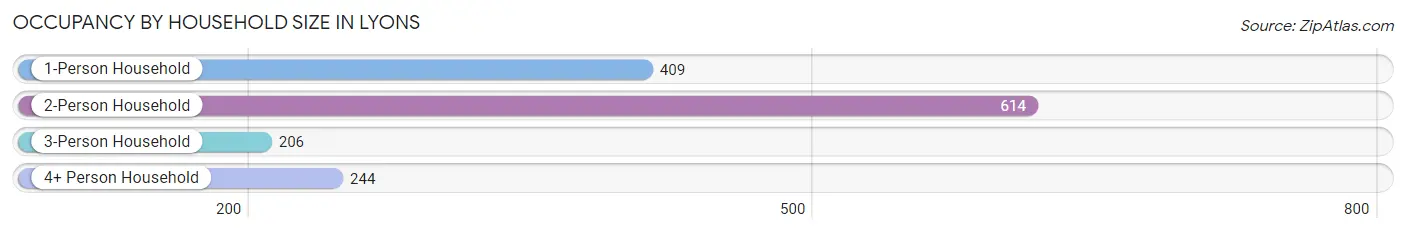
| Household Size | # Housing Units | % Housing Units |
| 1-Person Household | 409 | 27.8% |
| 2-Person Household | 614 | 41.7% |
| 3-Person Household | 206 | 14.0% |
| 4+ Person Household | 244 | 16.6% |
| Total Housing Units | 1,473 | 100.0% |
Occupancy by Ownership by Household Size in Lyons
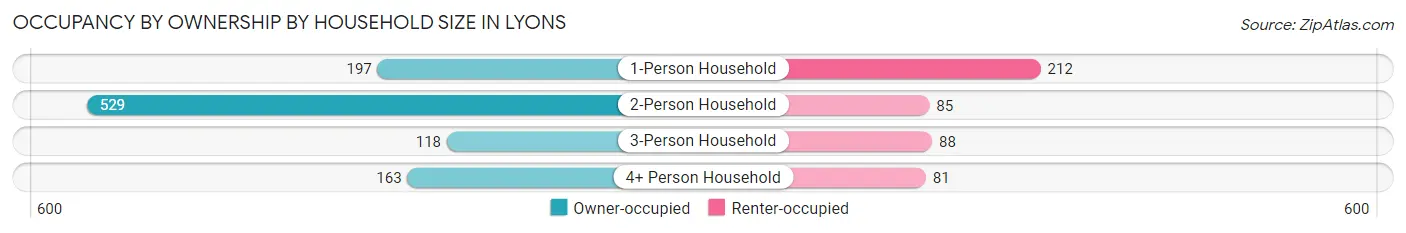
| Household Size | Owner-occupied | Renter-occupied |
| 1-Person Household | 197 (48.2%) | 212 (51.8%) |
| 2-Person Household | 529 (86.2%) | 85 (13.8%) |
| 3-Person Household | 118 (57.3%) | 88 (42.7%) |
| 4+ Person Household | 163 (66.8%) | 81 (33.2%) |
| Total Housing Units | 1,007 (68.4%) | 466 (31.6%) |
Occupancy by Educational Attainment in Lyons
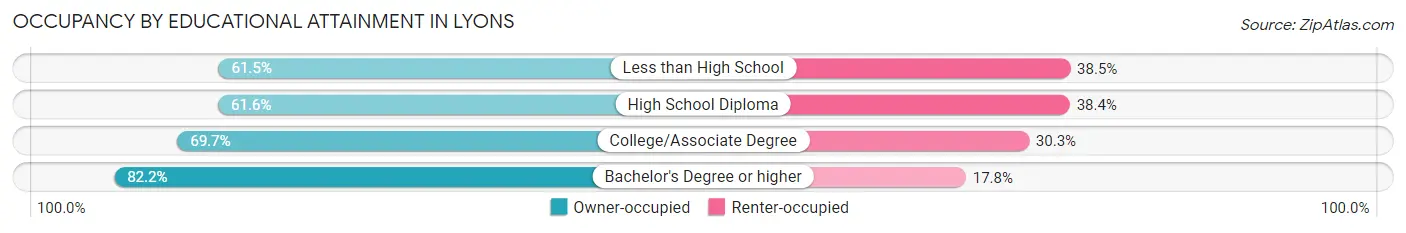
| Household Size | Owner-occupied | Renter-occupied |
| Less than High School | 56 (61.5%) | 35 (38.5%) |
| High School Diploma | 326 (61.6%) | 203 (38.4%) |
| College/Associate Degree | 426 (69.7%) | 185 (30.3%) |
| Bachelor's Degree or higher | 199 (82.2%) | 43 (17.8%) |
Occupancy by Age of Householder in Lyons
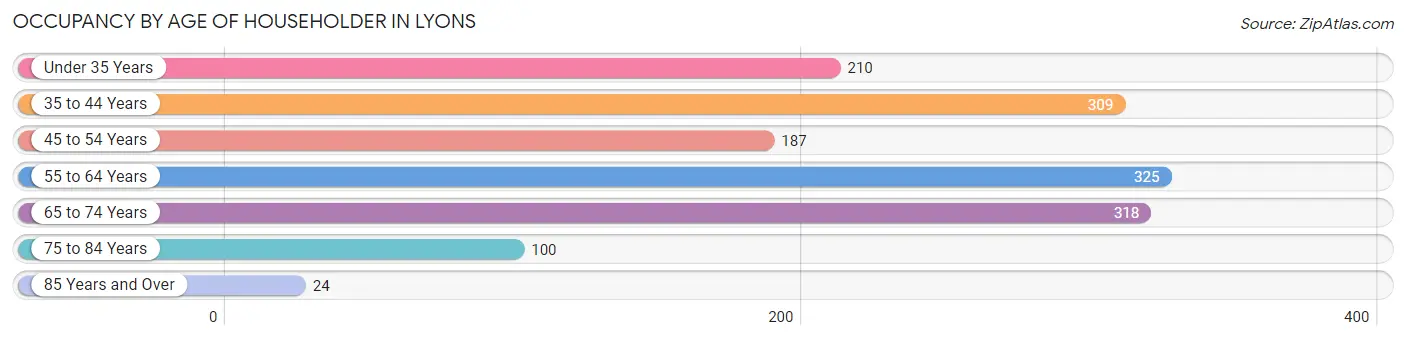
| Age Bracket | # Households | % Households |
| Under 35 Years | 210 | 14.3% |
| 35 to 44 Years | 309 | 21.0% |
| 45 to 54 Years | 187 | 12.7% |
| 55 to 64 Years | 325 | 22.1% |
| 65 to 74 Years | 318 | 21.6% |
| 75 to 84 Years | 100 | 6.8% |
| 85 Years and Over | 24 | 1.6% |
| Total | 1,473 | 100.0% |
Housing Finances in Lyons
Median Income by Occupancy in Lyons
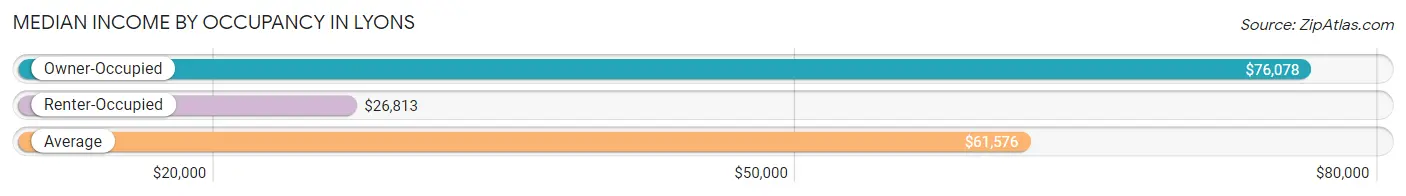
| Occupancy Type | # Households | Median Income |
| Owner-Occupied | 1,007 (68.4%) | $76,078 |
| Renter-Occupied | 466 (31.6%) | $26,813 |
| Average | 1,473 (100.0%) | $61,576 |
Occupancy by Householder Income Bracket in Lyons
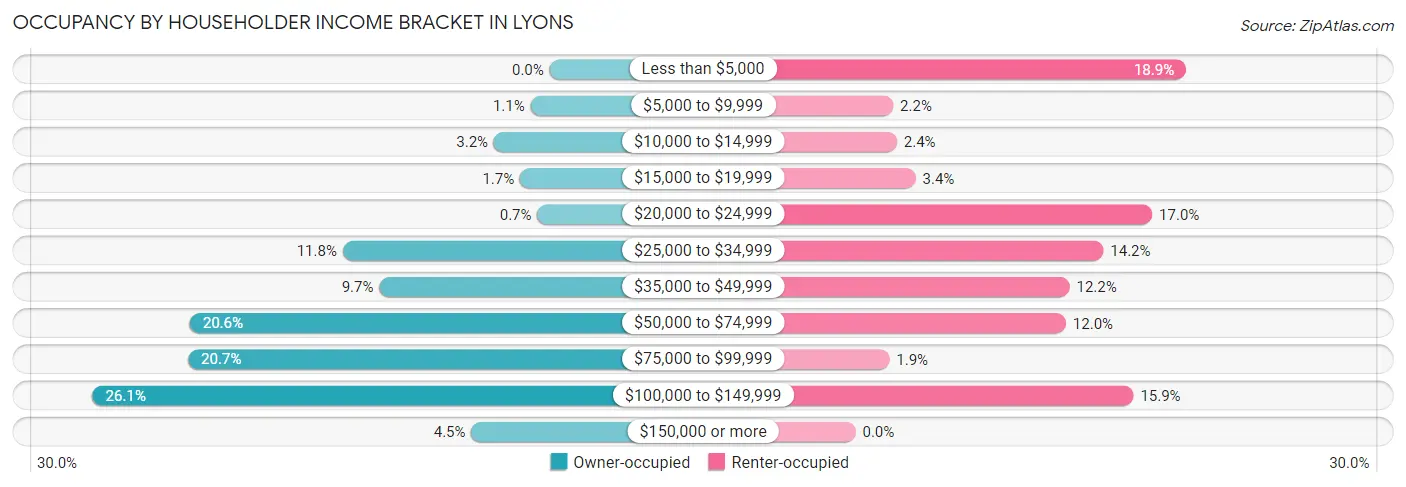
| Income Bracket | Owner-occupied | Renter-occupied |
| Less than $5,000 | 0 (0.0%) | 88 (18.9%) |
| $5,000 to $9,999 | 11 (1.1%) | 10 (2.1%) |
| $10,000 to $14,999 | 32 (3.2%) | 11 (2.4%) |
| $15,000 to $19,999 | 17 (1.7%) | 16 (3.4%) |
| $20,000 to $24,999 | 7 (0.7%) | 79 (17.0%) |
| $25,000 to $34,999 | 119 (11.8%) | 66 (14.2%) |
| $35,000 to $49,999 | 98 (9.7%) | 57 (12.2%) |
| $50,000 to $74,999 | 207 (20.6%) | 56 (12.0%) |
| $75,000 to $99,999 | 208 (20.7%) | 9 (1.9%) |
| $100,000 to $149,999 | 263 (26.1%) | 74 (15.9%) |
| $150,000 or more | 45 (4.5%) | 0 (0.0%) |
| Total | 1,007 (100.0%) | 466 (100.0%) |
Monthly Housing Cost Tiers in Lyons
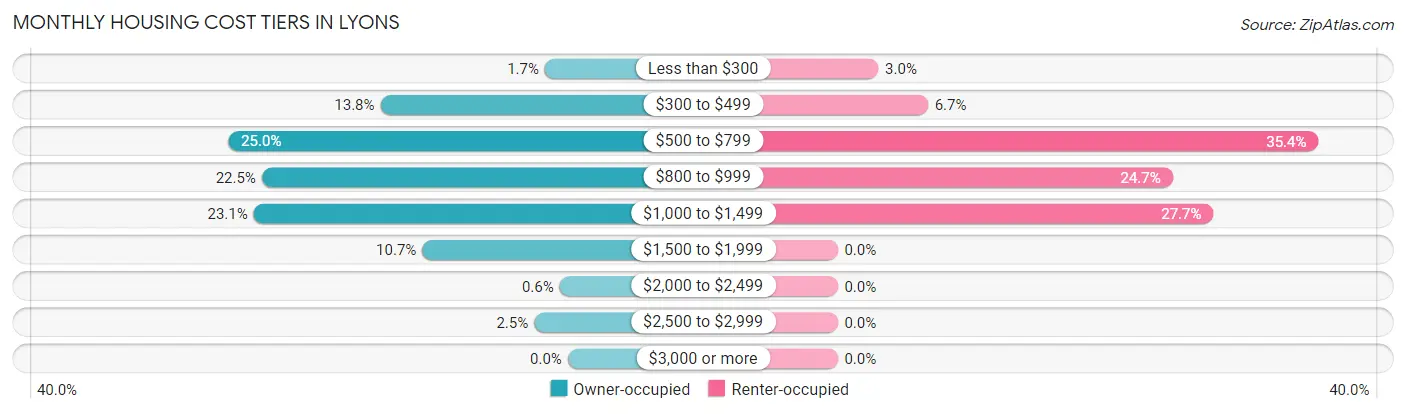
| Monthly Cost | Owner-occupied | Renter-occupied |
| Less than $300 | 17 (1.7%) | 14 (3.0%) |
| $300 to $499 | 139 (13.8%) | 31 (6.7%) |
| $500 to $799 | 252 (25.0%) | 165 (35.4%) |
| $800 to $999 | 227 (22.5%) | 115 (24.7%) |
| $1,000 to $1,499 | 233 (23.1%) | 129 (27.7%) |
| $1,500 to $1,999 | 108 (10.7%) | 0 (0.0%) |
| $2,000 to $2,499 | 6 (0.6%) | 0 (0.0%) |
| $2,500 to $2,999 | 25 (2.5%) | 0 (0.0%) |
| $3,000 or more | 0 (0.0%) | 0 (0.0%) |
| Total | 1,007 (100.0%) | 466 (100.0%) |
Physical Housing Characteristics in Lyons
Housing Structures in Lyons
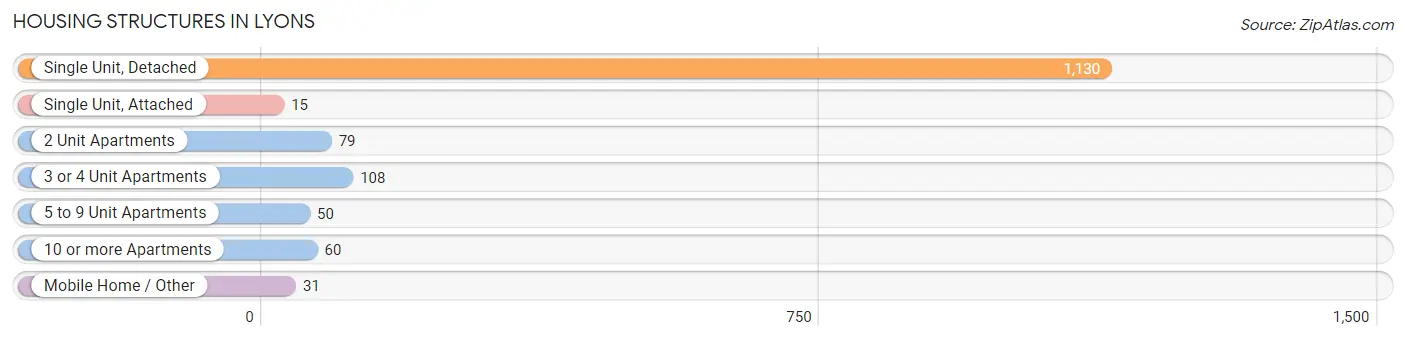
| Structure Type | # Housing Units | % Housing Units |
| Single Unit, Detached | 1,130 | 76.7% |
| Single Unit, Attached | 15 | 1.0% |
| 2 Unit Apartments | 79 | 5.4% |
| 3 or 4 Unit Apartments | 108 | 7.3% |
| 5 to 9 Unit Apartments | 50 | 3.4% |
| 10 or more Apartments | 60 | 4.1% |
| Mobile Home / Other | 31 | 2.1% |
| Total | 1,473 | 100.0% |
Housing Structures by Occupancy in Lyons
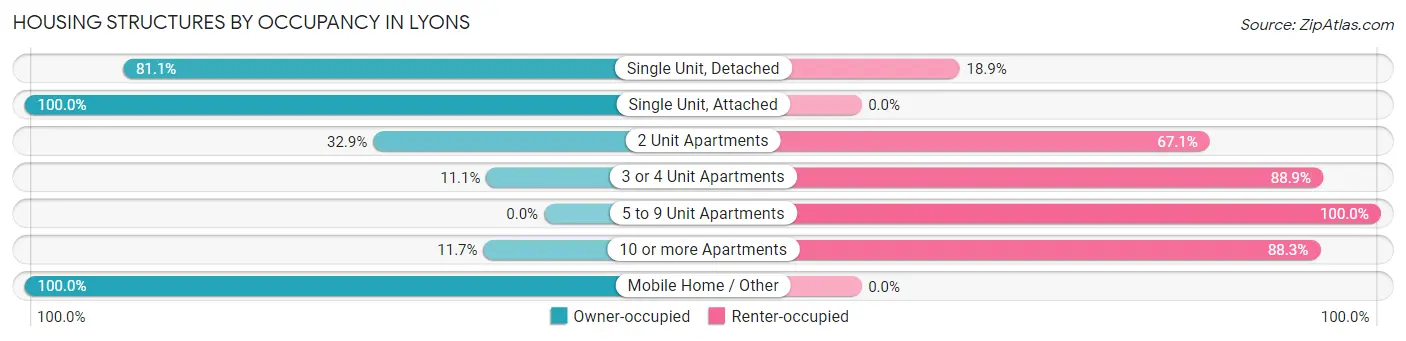
| Structure Type | Owner-occupied | Renter-occupied |
| Single Unit, Detached | 916 (81.1%) | 214 (18.9%) |
| Single Unit, Attached | 15 (100.0%) | 0 (0.0%) |
| 2 Unit Apartments | 26 (32.9%) | 53 (67.1%) |
| 3 or 4 Unit Apartments | 12 (11.1%) | 96 (88.9%) |
| 5 to 9 Unit Apartments | 0 (0.0%) | 50 (100.0%) |
| 10 or more Apartments | 7 (11.7%) | 53 (88.3%) |
| Mobile Home / Other | 31 (100.0%) | 0 (0.0%) |
| Total | 1,007 (68.4%) | 466 (31.6%) |
Housing Structures by Number of Rooms in Lyons
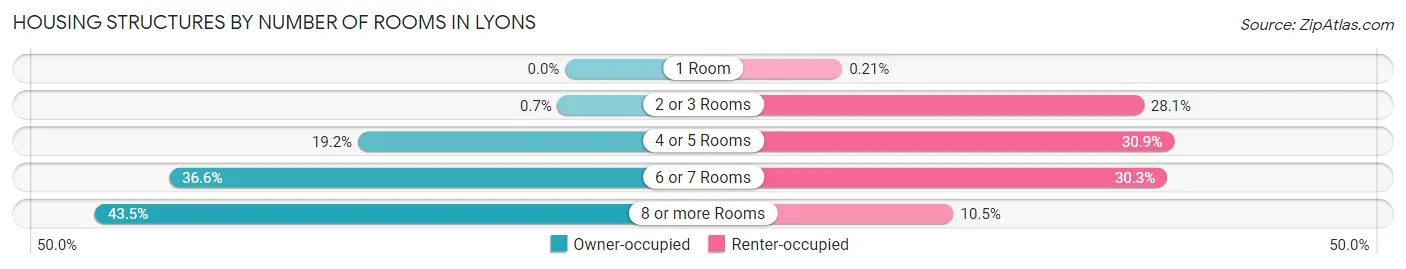
| Number of Rooms | Owner-occupied | Renter-occupied |
| 1 Room | 0 (0.0%) | 1 (0.2%) |
| 2 or 3 Rooms | 7 (0.7%) | 131 (28.1%) |
| 4 or 5 Rooms | 193 (19.2%) | 144 (30.9%) |
| 6 or 7 Rooms | 369 (36.6%) | 141 (30.3%) |
| 8 or more Rooms | 438 (43.5%) | 49 (10.5%) |
| Total | 1,007 (100.0%) | 466 (100.0%) |
Housing Structure by Heating Type in Lyons
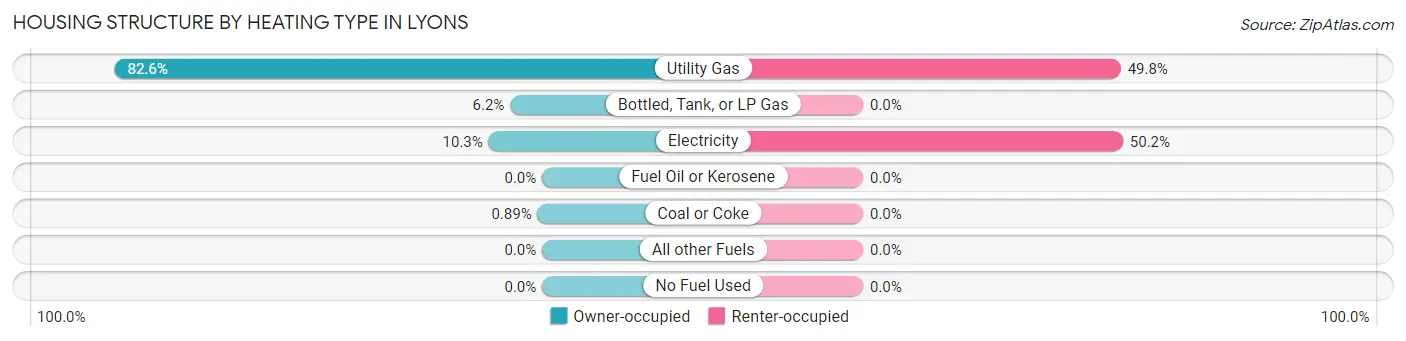
| Heating Type | Owner-occupied | Renter-occupied |
| Utility Gas | 832 (82.6%) | 232 (49.8%) |
| Bottled, Tank, or LP Gas | 62 (6.2%) | 0 (0.0%) |
| Electricity | 104 (10.3%) | 234 (50.2%) |
| Fuel Oil or Kerosene | 0 (0.0%) | 0 (0.0%) |
| Coal or Coke | 9 (0.9%) | 0 (0.0%) |
| All other Fuels | 0 (0.0%) | 0 (0.0%) |
| No Fuel Used | 0 (0.0%) | 0 (0.0%) |
| Total | 1,007 (100.0%) | 466 (100.0%) |
Household Vehicle Usage in Lyons
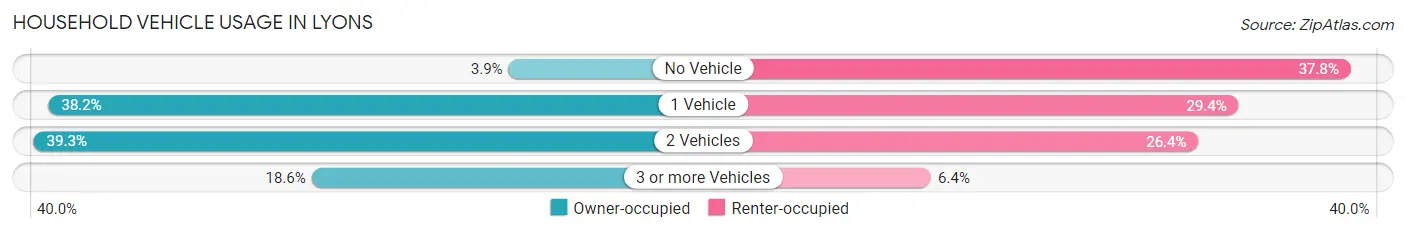
| Vehicles per Household | Owner-occupied | Renter-occupied |
| No Vehicle | 39 (3.9%) | 176 (37.8%) |
| 1 Vehicle | 385 (38.2%) | 137 (29.4%) |
| 2 Vehicles | 396 (39.3%) | 123 (26.4%) |
| 3 or more Vehicles | 187 (18.6%) | 30 (6.4%) |
| Total | 1,007 (100.0%) | 466 (100.0%) |
Real Estate & Mortgages in Lyons
Real Estate and Mortgage Overview in Lyons
| Characteristic | Without Mortgage | With Mortgage |
| Housing Units | 346 | 661 |
| Median Property Value | $84,400 | $86,100 |
| Median Household Income | $64,038 | $35 |
| Monthly Housing Costs | $531 | $0 |
| Real Estate Taxes | $1,776 | $23 |
Property Value by Mortgage Status in Lyons
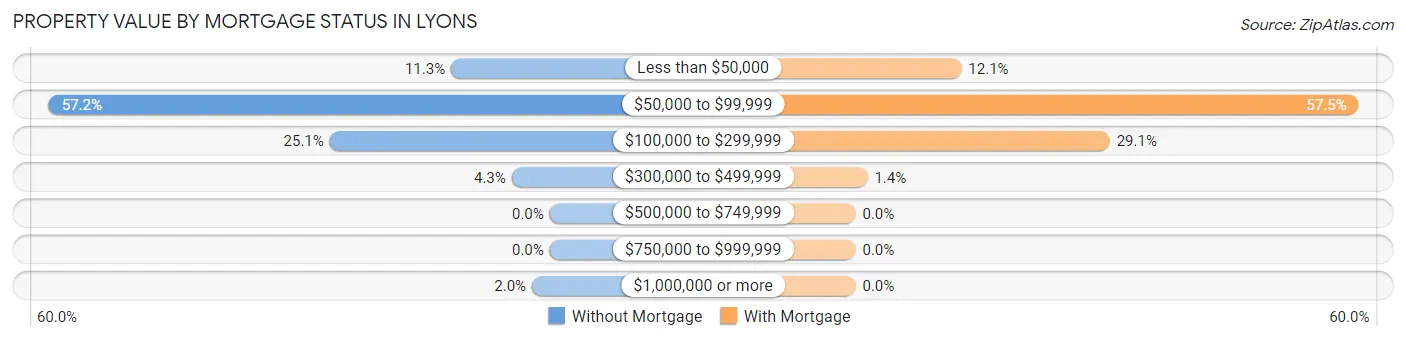
| Property Value | Without Mortgage | With Mortgage |
| Less than $50,000 | 39 (11.3%) | 80 (12.1%) |
| $50,000 to $99,999 | 198 (57.2%) | 380 (57.5%) |
| $100,000 to $299,999 | 87 (25.1%) | 192 (29.0%) |
| $300,000 to $499,999 | 15 (4.3%) | 9 (1.4%) |
| $500,000 to $749,999 | 0 (0.0%) | 0 (0.0%) |
| $750,000 to $999,999 | 0 (0.0%) | 0 (0.0%) |
| $1,000,000 or more | 7 (2.0%) | 0 (0.0%) |
| Total | 346 (100.0%) | 661 (100.0%) |
Household Income by Mortgage Status in Lyons
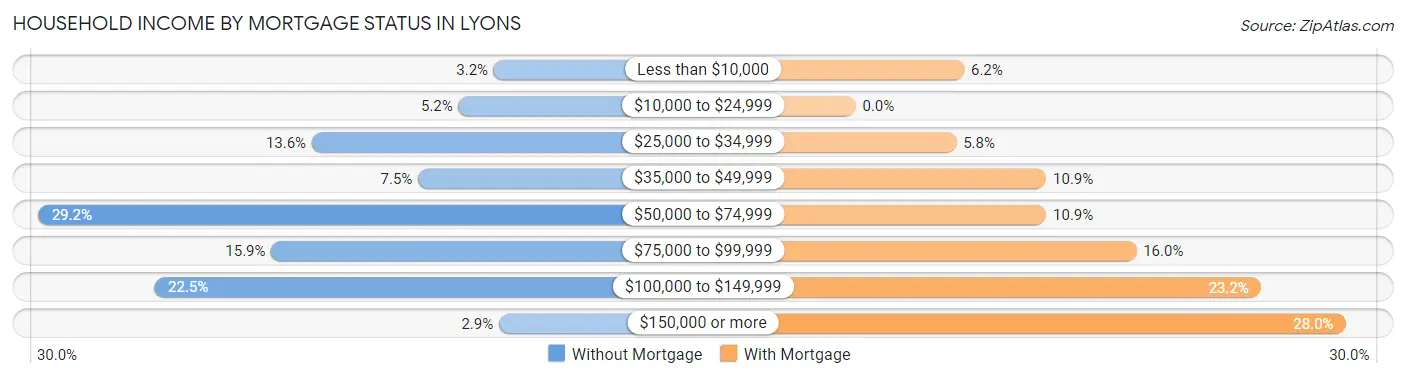
| Household Income | Without Mortgage | With Mortgage |
| Less than $10,000 | 11 (3.2%) | 41 (6.2%) |
| $10,000 to $24,999 | 18 (5.2%) | 0 (0.0%) |
| $25,000 to $34,999 | 47 (13.6%) | 38 (5.8%) |
| $35,000 to $49,999 | 26 (7.5%) | 72 (10.9%) |
| $50,000 to $74,999 | 101 (29.2%) | 72 (10.9%) |
| $75,000 to $99,999 | 55 (15.9%) | 106 (16.0%) |
| $100,000 to $149,999 | 78 (22.5%) | 153 (23.2%) |
| $150,000 or more | 10 (2.9%) | 185 (28.0%) |
| Total | 346 (100.0%) | 661 (100.0%) |
Property Value to Household Income Ratio in Lyons
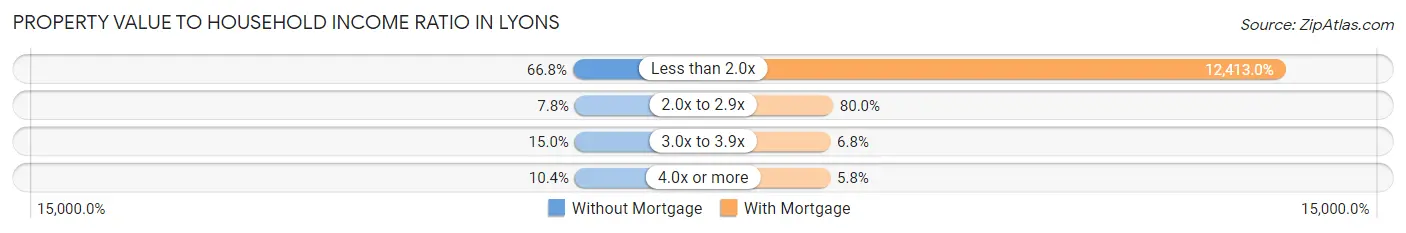
| Value-to-Income Ratio | Without Mortgage | With Mortgage |
| Less than 2.0x | 231 (66.8%) | 82,050 (12,413.0%) |
| 2.0x to 2.9x | 27 (7.8%) | 529 (80.0%) |
| 3.0x to 3.9x | 52 (15.0%) | 45 (6.8%) |
| 4.0x or more | 36 (10.4%) | 38 (5.8%) |
| Total | 346 (100.0%) | 661 (100.0%) |
Real Estate Taxes by Mortgage Status in Lyons
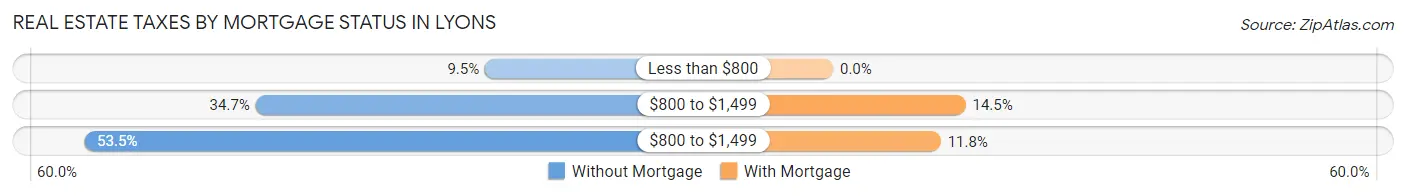
| Property Taxes | Without Mortgage | With Mortgage |
| Less than $800 | 33 (9.5%) | 0 (0.0%) |
| $800 to $1,499 | 120 (34.7%) | 96 (14.5%) |
| $800 to $1,499 | 185 (53.5%) | 78 (11.8%) |
| Total | 346 (100.0%) | 661 (100.0%) |
Health & Disability in Lyons
Health Insurance Coverage by Age in Lyons
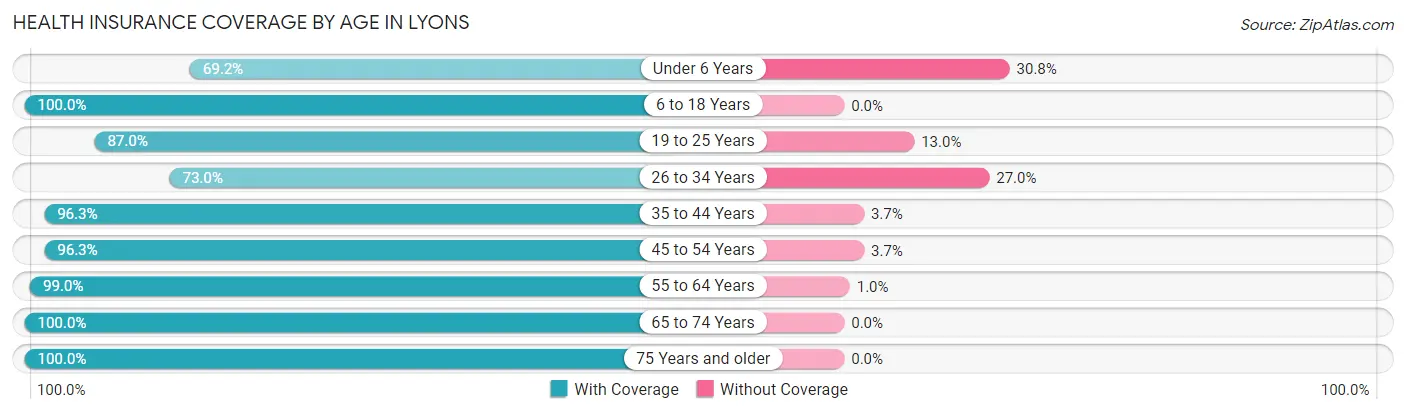
| Age Bracket | With Coverage | Without Coverage |
| Under 6 Years | 83 (69.2%) | 37 (30.8%) |
| 6 to 18 Years | 631 (100.0%) | 0 (0.0%) |
| 19 to 25 Years | 180 (87.0%) | 27 (13.0%) |
| 26 to 34 Years | 232 (73.0%) | 86 (27.0%) |
| 35 to 44 Years | 577 (96.3%) | 22 (3.7%) |
| 45 to 54 Years | 391 (96.3%) | 15 (3.7%) |
| 55 to 64 Years | 583 (99.0%) | 6 (1.0%) |
| 65 to 74 Years | 486 (100.0%) | 0 (0.0%) |
| 75 Years and older | 227 (100.0%) | 0 (0.0%) |
| Total | 3,390 (94.6%) | 193 (5.4%) |
Health Insurance Coverage by Citizenship Status in Lyons
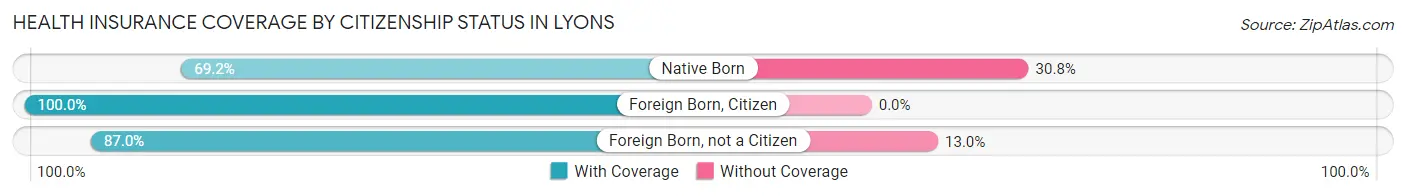
| Citizenship Status | With Coverage | Without Coverage |
| Native Born | 83 (69.2%) | 37 (30.8%) |
| Foreign Born, Citizen | 631 (100.0%) | 0 (0.0%) |
| Foreign Born, not a Citizen | 180 (87.0%) | 27 (13.0%) |
Health Insurance Coverage by Household Income in Lyons
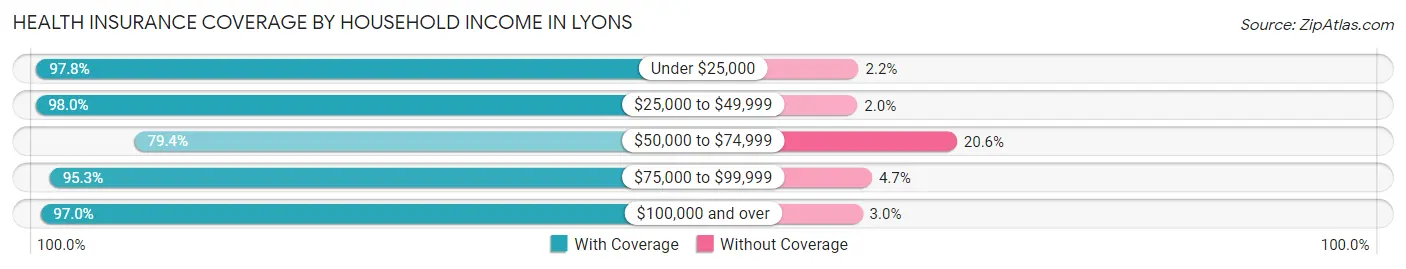
| Household Income | With Coverage | Without Coverage |
| Under $25,000 | 399 (97.8%) | 9 (2.2%) |
| $25,000 to $49,999 | 838 (98.0%) | 17 (2.0%) |
| $50,000 to $74,999 | 408 (79.4%) | 106 (20.6%) |
| $75,000 to $99,999 | 484 (95.3%) | 24 (4.7%) |
| $100,000 and over | 1,208 (97.0%) | 37 (3.0%) |
Public vs Private Health Insurance Coverage by Age in Lyons
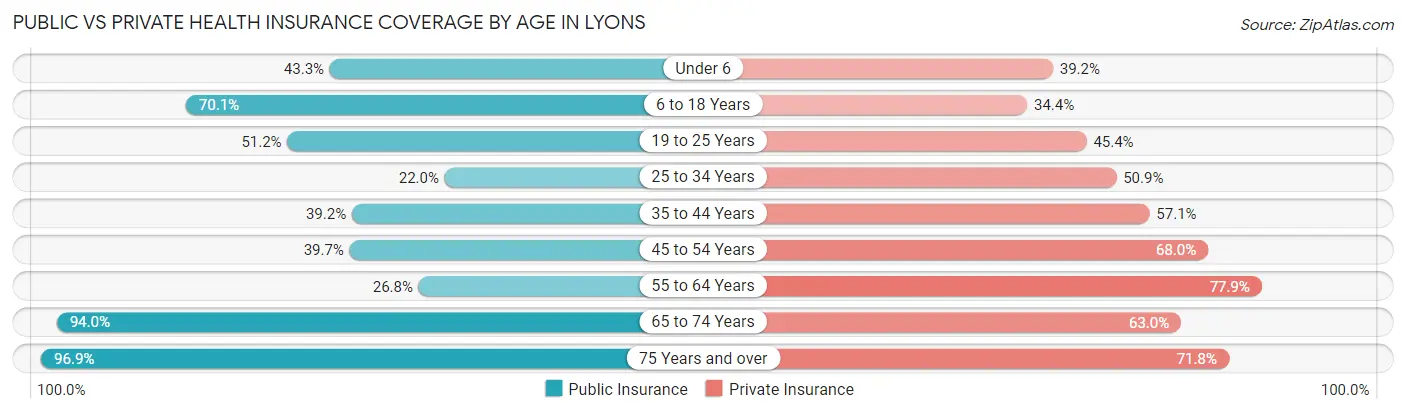
| Age Bracket | Public Insurance | Private Insurance |
| Under 6 | 52 (43.3%) | 47 (39.2%) |
| 6 to 18 Years | 442 (70.1%) | 217 (34.4%) |
| 19 to 25 Years | 106 (51.2%) | 94 (45.4%) |
| 25 to 34 Years | 70 (22.0%) | 162 (50.9%) |
| 35 to 44 Years | 235 (39.2%) | 342 (57.1%) |
| 45 to 54 Years | 161 (39.7%) | 276 (68.0%) |
| 55 to 64 Years | 158 (26.8%) | 459 (77.9%) |
| 65 to 74 Years | 457 (94.0%) | 306 (63.0%) |
| 75 Years and over | 220 (96.9%) | 163 (71.8%) |
| Total | 1,901 (53.1%) | 2,066 (57.7%) |
Disability Status by Sex by Age in Lyons
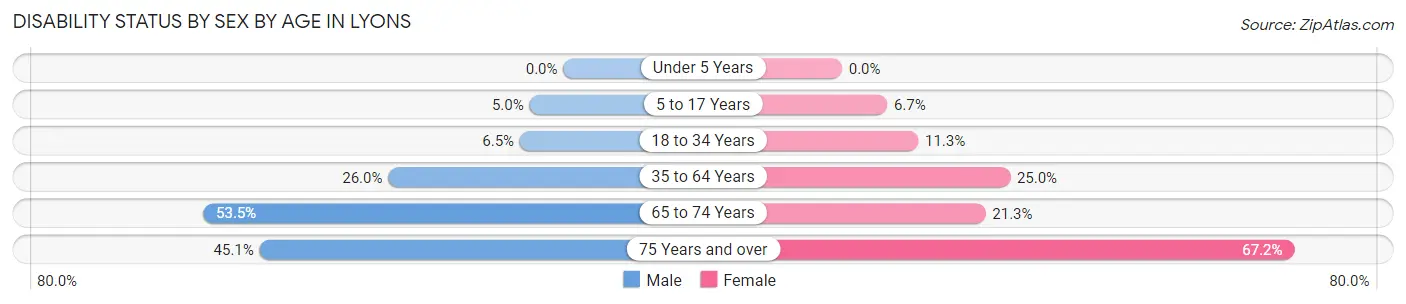
| Age Bracket | Male | Female |
| Under 5 Years | 0 (0.0%) | 0 (0.0%) |
| 5 to 17 Years | 16 (5.0%) | 19 (6.7%) |
| 18 to 34 Years | 16 (6.5%) | 36 (11.3%) |
| 35 to 64 Years | 201 (26.0%) | 205 (25.0%) |
| 65 to 74 Years | 122 (53.5%) | 55 (21.3%) |
| 75 Years and over | 46 (45.1%) | 84 (67.2%) |
Disability Class by Sex by Age in Lyons
Disability Class: Hearing Difficulty
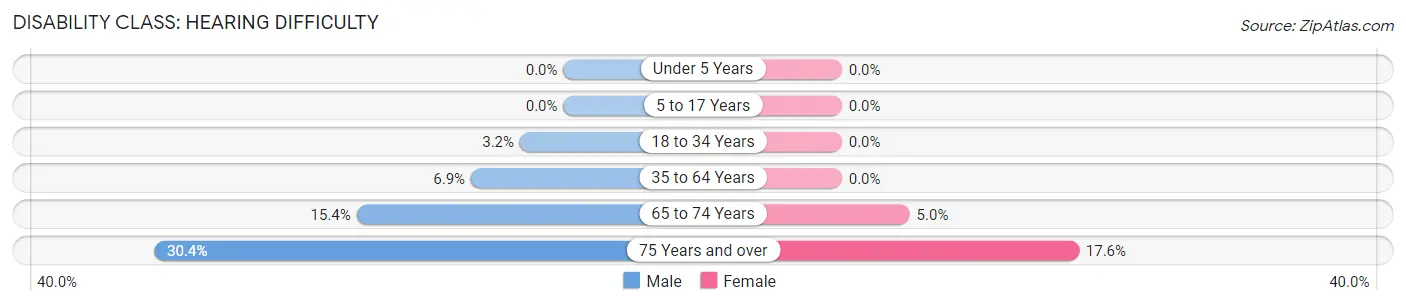
| Age Bracket | Male | Female |
| Under 5 Years | 0 (0.0%) | 0 (0.0%) |
| 5 to 17 Years | 0 (0.0%) | 0 (0.0%) |
| 18 to 34 Years | 8 (3.2%) | 0 (0.0%) |
| 35 to 64 Years | 53 (6.9%) | 0 (0.0%) |
| 65 to 74 Years | 35 (15.3%) | 13 (5.0%) |
| 75 Years and over | 31 (30.4%) | 22 (17.6%) |
Disability Class: Vision Difficulty
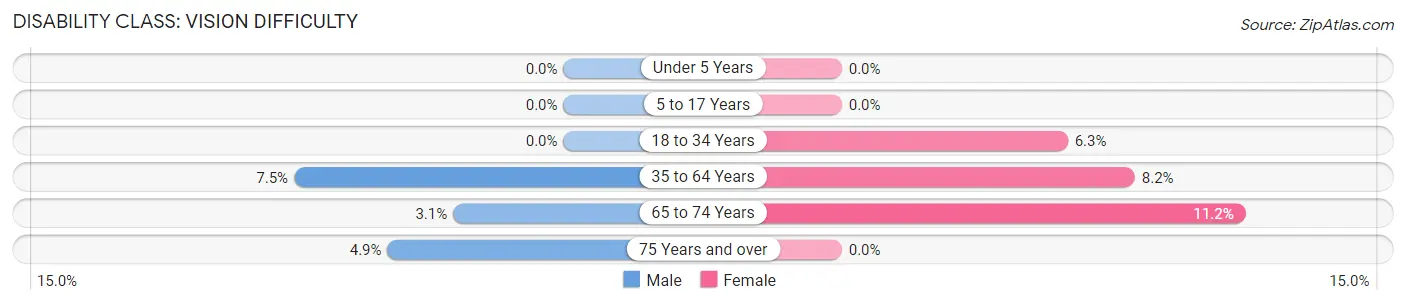
| Age Bracket | Male | Female |
| Under 5 Years | 0 (0.0%) | 0 (0.0%) |
| 5 to 17 Years | 0 (0.0%) | 0 (0.0%) |
| 18 to 34 Years | 0 (0.0%) | 20 (6.3%) |
| 35 to 64 Years | 58 (7.5%) | 67 (8.2%) |
| 65 to 74 Years | 7 (3.1%) | 29 (11.2%) |
| 75 Years and over | 5 (4.9%) | 0 (0.0%) |
Disability Class: Cognitive Difficulty
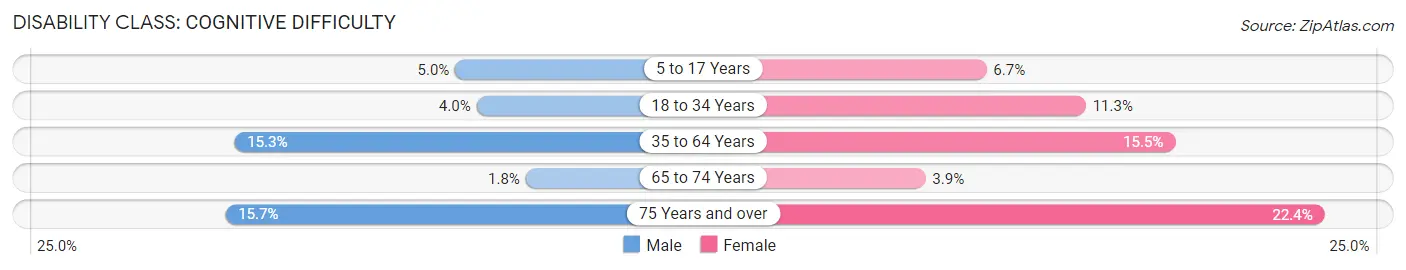
| Age Bracket | Male | Female |
| 5 to 17 Years | 16 (5.0%) | 19 (6.7%) |
| 18 to 34 Years | 10 (4.0%) | 36 (11.3%) |
| 35 to 64 Years | 118 (15.3%) | 127 (15.5%) |
| 65 to 74 Years | 4 (1.8%) | 10 (3.9%) |
| 75 Years and over | 16 (15.7%) | 28 (22.4%) |
Disability Class: Ambulatory Difficulty
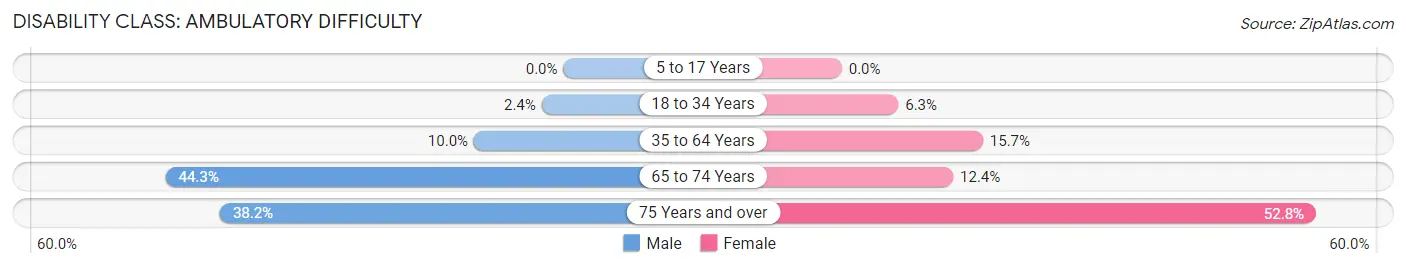
| Age Bracket | Male | Female |
| 5 to 17 Years | 0 (0.0%) | 0 (0.0%) |
| 18 to 34 Years | 6 (2.4%) | 20 (6.3%) |
| 35 to 64 Years | 77 (10.0%) | 129 (15.7%) |
| 65 to 74 Years | 101 (44.3%) | 32 (12.4%) |
| 75 Years and over | 39 (38.2%) | 66 (52.8%) |
Disability Class: Self-Care Difficulty
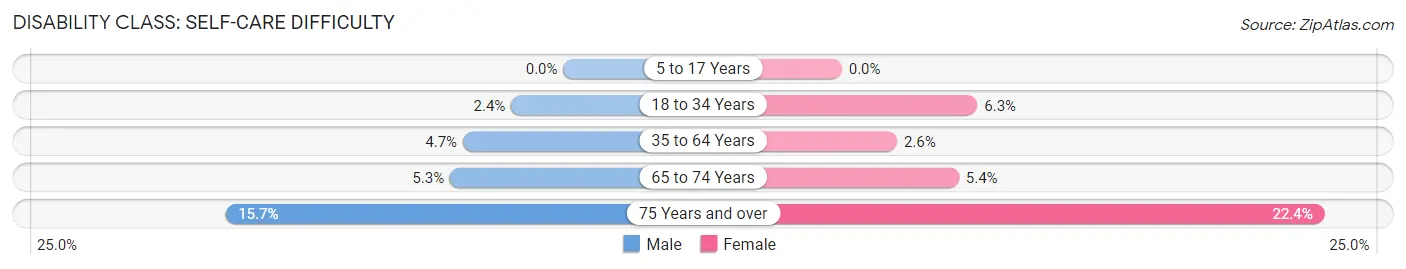
| Age Bracket | Male | Female |
| 5 to 17 Years | 0 (0.0%) | 0 (0.0%) |
| 18 to 34 Years | 6 (2.4%) | 20 (6.3%) |
| 35 to 64 Years | 36 (4.7%) | 21 (2.6%) |
| 65 to 74 Years | 12 (5.3%) | 14 (5.4%) |
| 75 Years and over | 16 (15.7%) | 28 (22.4%) |
Technology Access in Lyons
Computing Device Access in Lyons
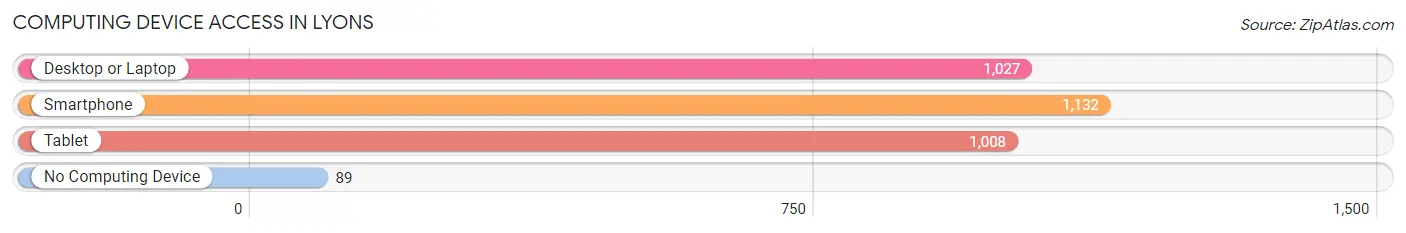
| Device Type | # Households | % Households |
| Desktop or Laptop | 1,027 | 69.7% |
| Smartphone | 1,132 | 76.8% |
| Tablet | 1,008 | 68.4% |
| No Computing Device | 89 | 6.0% |
| Total | 1,473 | 100.0% |
Internet Access in Lyons
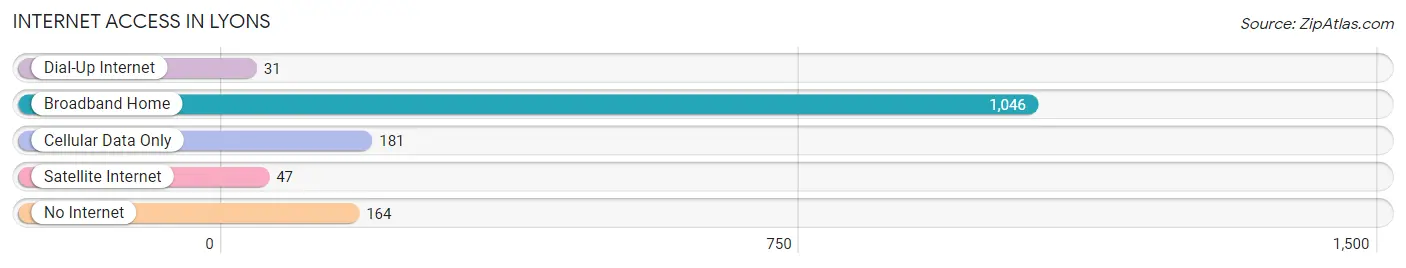
| Internet Type | # Households | % Households |
| Dial-Up Internet | 31 | 2.1% |
| Broadband Home | 1,046 | 71.0% |
| Cellular Data Only | 181 | 12.3% |
| Satellite Internet | 47 | 3.2% |
| No Internet | 164 | 11.1% |
| Total | 1,473 | 100.0% |
Lyons Summary
Lyons is a small town located in Wayne County, New York, United States. The population was 5,682 at the 2010 census. It is part of the Rochester Metropolitan Statistical Area.
History
The area that is now Lyons was first settled in 1789 by a group of Quakers from Pennsylvania. The town was originally known as "Quaker Settlement" and was later renamed "Lyons" after the city of Lyons, France. The town was officially established in 1811.
In the early 19th century, the town was a major center for the production of salt. The salt industry was so important to the town that it was nicknamed "Salt City". The salt industry declined in the late 19th century and the town shifted its focus to agriculture and manufacturing.
Geography
Lyons is located in the Finger Lakes region of New York. It is bordered by the towns of Arcadia, Galen, Huron, Macedon, Palmyra, and Sodus. The town is located on the north shore of Lake Ontario and is home to several small lakes, including Lake Ontario, Lake Seneca, and Lake Cayuga.
The town has a total area of 24.2 square miles, of which 23.9 square miles is land and 0.3 square miles is water.
Economy
The economy of Lyons is largely based on agriculture and manufacturing. The town is home to several large farms, including the Lyons Dairy Farm, which produces milk, cheese, and other dairy products. The town is also home to several manufacturing companies, including the Lyons Manufacturing Company, which produces metal products, and the Lyons Paper Company, which produces paper products.
The town is also home to several small businesses, including restaurants, retail stores, and service providers.
Demographics
As of the 2010 census, there were 5,682 people, 2,093 households, and 1,420 families residing in the town. The population density was 238.2 people per square mile. The racial makeup of the town was 94.2% White, 2.3% African American, 0.3% Native American, 0.7% Asian, 0.1% Pacific Islander, 0.9% from other races, and 1.5% from two or more races. Hispanic or Latino of any race were 3.2% of the population.
The median income for a household in the town was $41,944, and the median income for a family was $50,917. Males had a median income of $37,917 versus $27,917 for females. The per capita income for the town was $19,945. About 8.2% of families and 10.3% of the population were below the poverty line, including 14.2% of those under age 18 and 6.2% of those age 65 or over.
Common Questions
What is Per Capita Income in Lyons?
Per Capita income in Lyons is $26,911.
What is the Median Family Income in Lyons?
Median Family Income in Lyons is $73,974.
What is the Median Household income in Lyons?
Median Household Income in Lyons is $61,576.
What is Income or Wage Gap in Lyons?
Income or Wage Gap in Lyons is 28.6%.
Women in Lyons earn 71.4 cents for every dollar earned by a man.
What is Inequality or Gini Index in Lyons?
Inequality or Gini Index in Lyons is 0.37.
What is the Total Population of Lyons?
Total Population of Lyons is 3,594.
What is the Total Male Population of Lyons?
Total Male Population of Lyons is 1,693.
What is the Total Female Population of Lyons?
Total Female Population of Lyons is 1,901.
What is the Ratio of Males per 100 Females in Lyons?
There are 89.06 Males per 100 Females in Lyons.
What is the Ratio of Females per 100 Males in Lyons?
There are 112.29 Females per 100 Males in Lyons.
What is the Median Population Age in Lyons?
Median Population Age in Lyons is 42.9 Years.
What is the Average Family Size in Lyons
Average Family Size in Lyons is 2.9 People.
What is the Average Household Size in Lyons
Average Household Size in Lyons is 2.4 People.
How Large is the Labor Force in Lyons?
There are 1,887 People in the Labor Forcein in Lyons.
What is the Percentage of People in the Labor Force in Lyons?
61.6% of People are in the Labor Force in Lyons.
What is the Unemployment Rate in Lyons?
Unemployment Rate in Lyons is 15.3%.