Montour Falls, NY Map & Demographics
Montour Falls Map
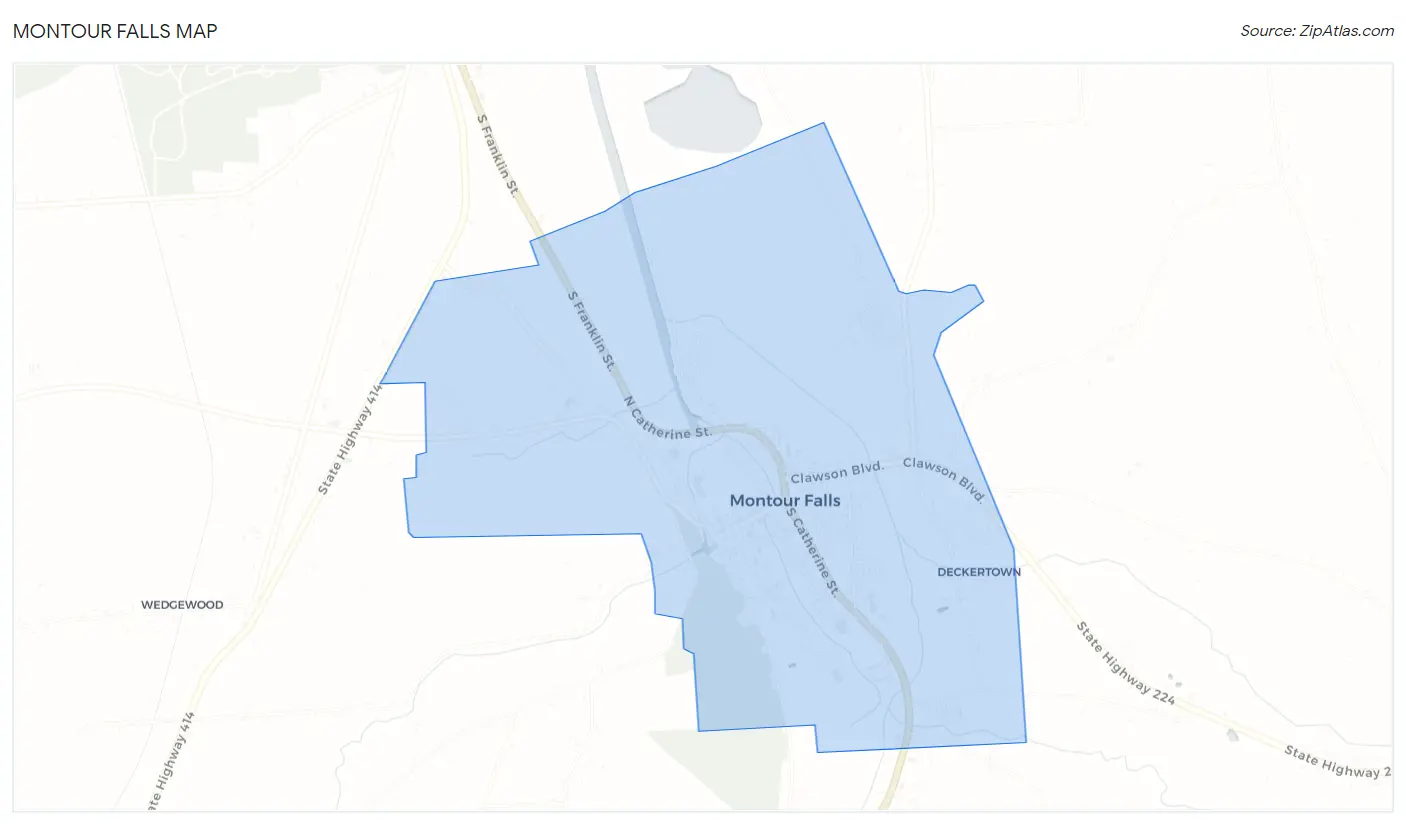
Montour Falls Overview
$24,880
PER CAPITA INCOME
$65,469
AVG FAMILY INCOME
$33,977
AVG HOUSEHOLD INCOME
44.9%
WAGE / INCOME GAP [ % ]
55.1¢/ $1
WAGE / INCOME GAP [ $ ]
0.46
INEQUALITY / GINI INDEX
1,830
TOTAL POPULATION
846
MALE POPULATION
984
FEMALE POPULATION
85.98
MALES / 100 FEMALES
116.31
FEMALES / 100 MALES
44.8
MEDIAN AGE
3.3
AVG FAMILY SIZE
2.3
AVG HOUSEHOLD SIZE
673
LABOR FORCE [ PEOPLE ]
44.6%
PERCENT IN LABOR FORCE
10.3%
UNEMPLOYMENT RATE
Montour Falls Zip Codes
Montour Falls Area Codes
Income in Montour Falls
Income Overview in Montour Falls
Per Capita Income in Montour Falls is $24,880, while median incomes of families and households are $65,469 and $33,977 respectively.
| Characteristic | Number | Measure |
| Per Capita Income | 1,830 | $24,880 |
| Median Family Income | 367 | $65,469 |
| Mean Family Income | 367 | $72,511 |
| Median Household Income | 724 | $33,977 |
| Mean Household Income | 724 | $55,738 |
| Income Deficit | 367 | $0 |
| Wage / Income Gap (%) | 1,830 | 44.89% |
| Wage / Income Gap ($) | 1,830 | 55.11¢ per $1 |
| Gini / Inequality Index | 1,830 | 0.46 |
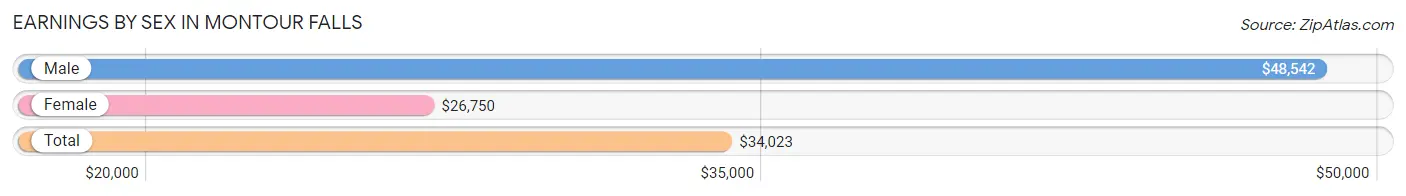
Earnings by Sex in Montour Falls
Average Earnings in Montour Falls are $34,023, $48,542 for men and $26,750 for women, a difference of 44.9%.
| Sex | Number | Average Earnings |
| Male | 347 (48.9%) | $48,542 |
| Female | 362 (51.1%) | $26,750 |
| Total | 709 (100.0%) | $34,023 |
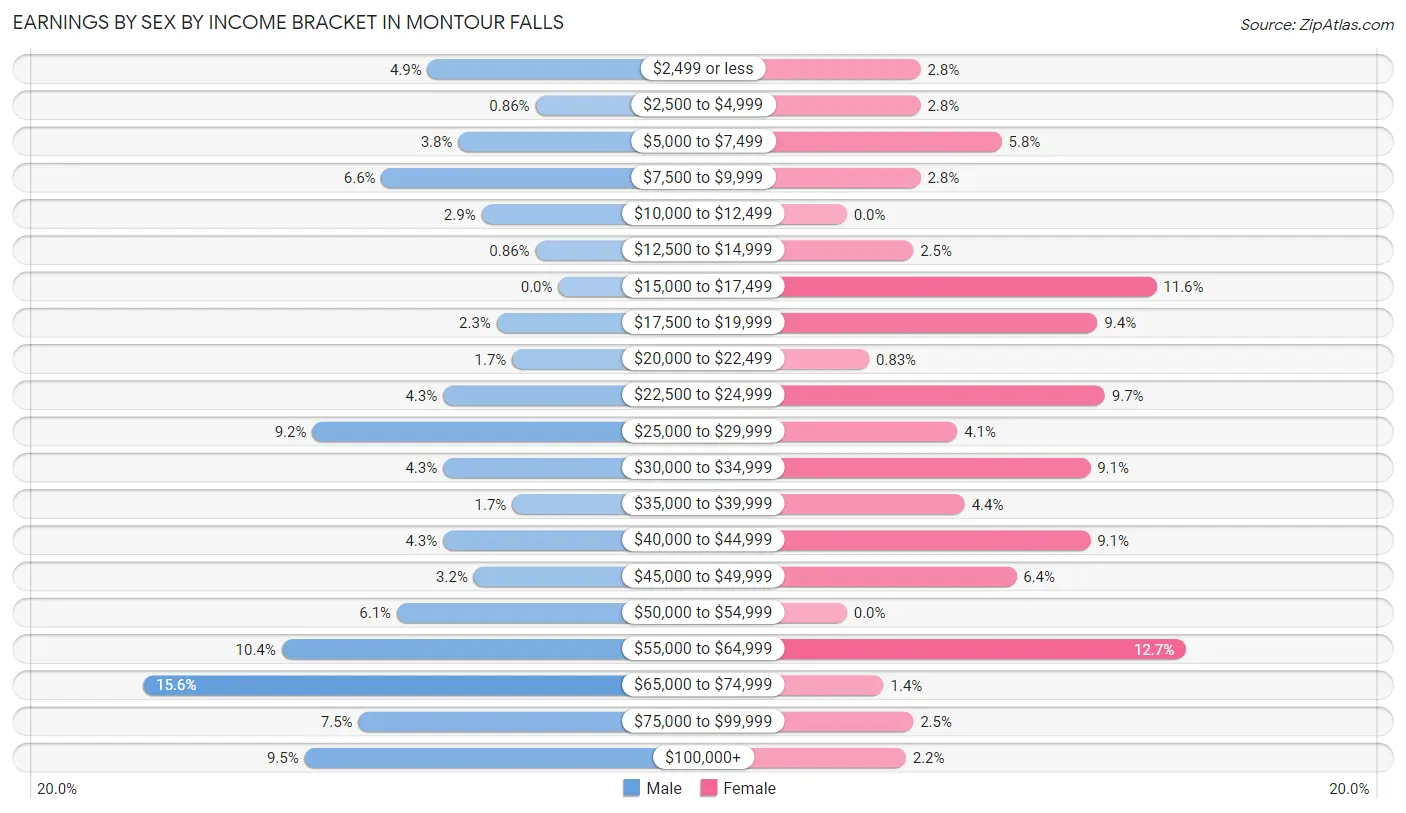
Earnings by Sex by Income Bracket in Montour Falls
The most common earnings brackets in Montour Falls are $65,000 to $74,999 for men (54 | 15.6%) and $55,000 to $64,999 for women (46 | 12.7%).
| Income | Male | Female |
| $2,499 or less | 17 (4.9%) | 10 (2.8%) |
| $2,500 to $4,999 | 3 (0.9%) | 10 (2.8%) |
| $5,000 to $7,499 | 13 (3.7%) | 21 (5.8%) |
| $7,500 to $9,999 | 23 (6.6%) | 10 (2.8%) |
| $10,000 to $12,499 | 10 (2.9%) | 0 (0.0%) |
| $12,500 to $14,999 | 3 (0.9%) | 9 (2.5%) |
| $15,000 to $17,499 | 0 (0.0%) | 42 (11.6%) |
| $17,500 to $19,999 | 8 (2.3%) | 34 (9.4%) |
| $20,000 to $22,499 | 6 (1.7%) | 3 (0.8%) |
| $22,500 to $24,999 | 15 (4.3%) | 35 (9.7%) |
| $25,000 to $29,999 | 32 (9.2%) | 15 (4.1%) |
| $30,000 to $34,999 | 15 (4.3%) | 33 (9.1%) |
| $35,000 to $39,999 | 6 (1.7%) | 16 (4.4%) |
| $40,000 to $44,999 | 15 (4.3%) | 33 (9.1%) |
| $45,000 to $49,999 | 11 (3.2%) | 23 (6.4%) |
| $50,000 to $54,999 | 21 (6.0%) | 0 (0.0%) |
| $55,000 to $64,999 | 36 (10.4%) | 46 (12.7%) |
| $65,000 to $74,999 | 54 (15.6%) | 5 (1.4%) |
| $75,000 to $99,999 | 26 (7.5%) | 9 (2.5%) |
| $100,000+ | 33 (9.5%) | 8 (2.2%) |
| Total | 347 (100.0%) | 362 (100.0%) |
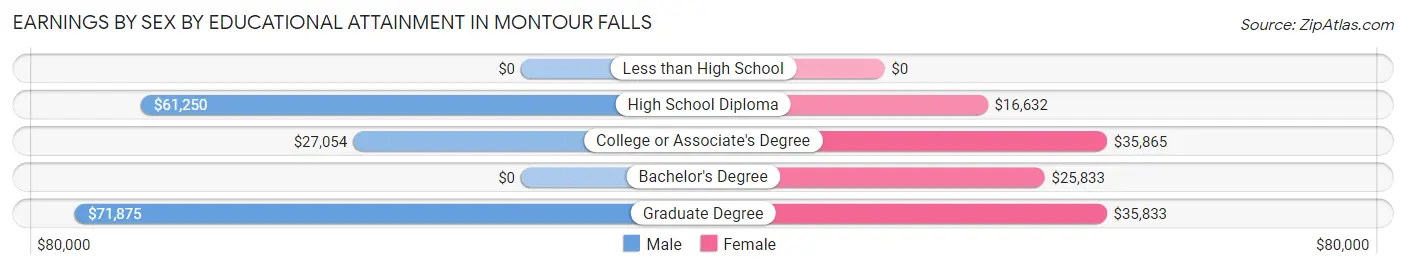
Earnings by Sex by Educational Attainment in Montour Falls
Average earnings in Montour Falls are $52,917 for men and $30,625 for women, a difference of 42.1%. Men with an educational attainment of graduate degree enjoy the highest average annual earnings of $71,875, while those with college or associate's degree education earn the least with $27,054. Women with an educational attainment of college or associate's degree earn the most with the average annual earnings of $35,865, while those with high school diploma education have the smallest earnings of $16,632.
| Educational Attainment | Male Income | Female Income |
| Less than High School | - | - |
| High School Diploma | $61,250 | $16,632 |
| College or Associate's Degree | $27,054 | $35,865 |
| Bachelor's Degree | - | - |
| Graduate Degree | $71,875 | $35,833 |
| Total | $52,917 | $30,625 |
Family Income in Montour Falls
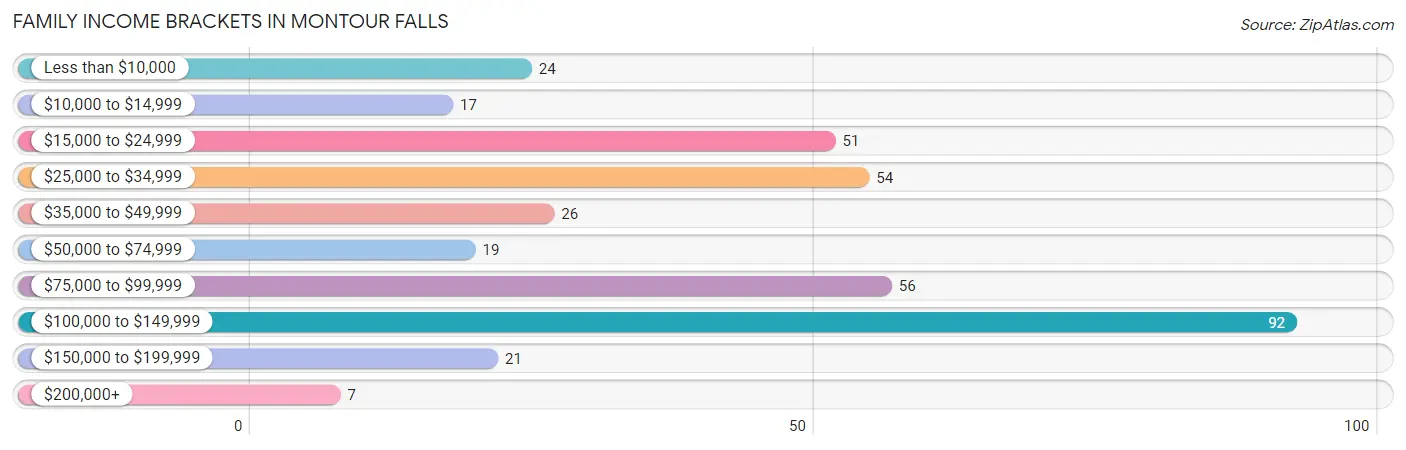
Family Income Brackets in Montour Falls
According to the Montour Falls family income data, there are 92 families falling into the $100,000 to $149,999 income range, which is the most common income bracket and makes up 25.1% of all families. Conversely, the $200,000+ income bracket is the least frequent group with only 7 families (1.9%) belonging to this category.
| Income Bracket | # Families | % Families |
| Less than $10,000 | 24 | 6.5% |
| $10,000 to $14,999 | 17 | 4.6% |
| $15,000 to $24,999 | 51 | 13.9% |
| $25,000 to $34,999 | 54 | 14.7% |
| $35,000 to $49,999 | 26 | 7.1% |
| $50,000 to $74,999 | 19 | 5.2% |
| $75,000 to $99,999 | 56 | 15.3% |
| $100,000 to $149,999 | 92 | 25.1% |
| $150,000 to $199,999 | 21 | 5.7% |
| $200,000+ | 7 | 1.9% |
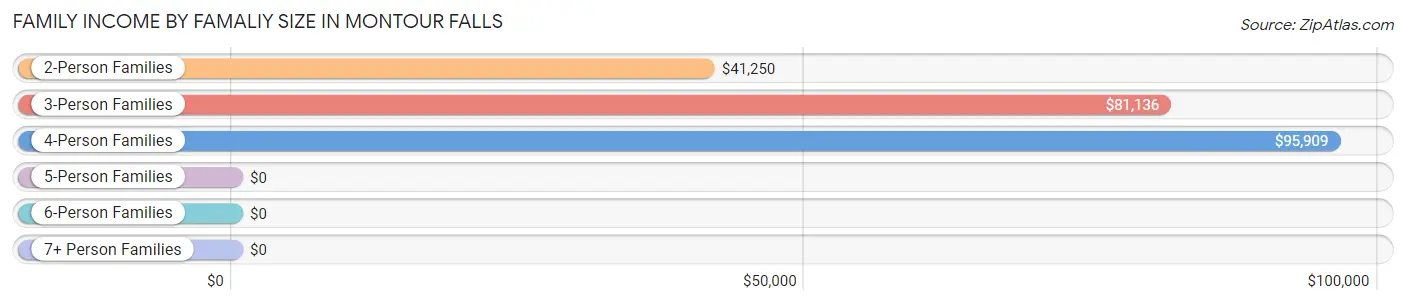
Family Income by Famaliy Size in Montour Falls
4-person families (60 | 16.4%) account for the highest median family income in Montour Falls with $95,909 per family, while 3-person families (72 | 19.6%) have the highest median income of $27,045 per family member.
| Income Bracket | # Families | Median Income |
| 2-Person Families | 152 (41.4%) | $41,250 |
| 3-Person Families | 72 (19.6%) | $81,136 |
| 4-Person Families | 60 (16.4%) | $95,909 |
| 5-Person Families | 76 (20.7%) | $0 |
| 6-Person Families | 7 (1.9%) | $0 |
| 7+ Person Families | 0 (0.0%) | $0 |
| Total | 367 (100.0%) | $65,469 |
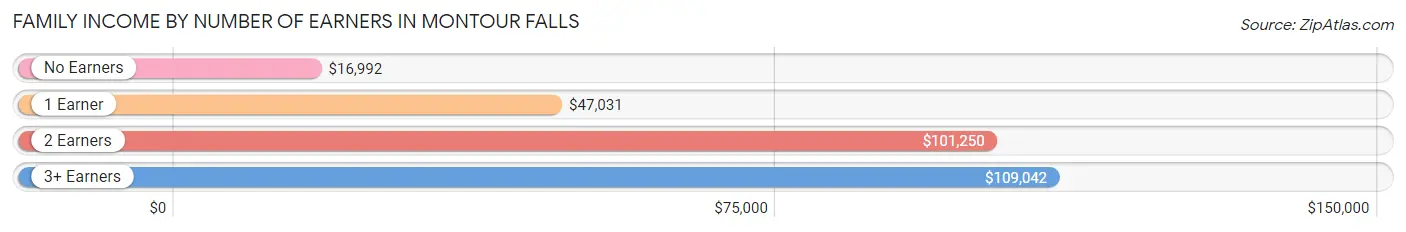
Family Income by Number of Earners in Montour Falls
The median family income in Montour Falls is $65,469, with families comprising 3+ earners (47) having the highest median family income of $109,042, while families with no earners (111) have the lowest median family income of $16,992, accounting for 12.8% and 30.2% of families, respectively.
| Number of Earners | # Families | Median Income |
| No Earners | 111 (30.2%) | $16,992 |
| 1 Earner | 103 (28.1%) | $47,031 |
| 2 Earners | 106 (28.9%) | $101,250 |
| 3+ Earners | 47 (12.8%) | $109,042 |
| Total | 367 (100.0%) | $65,469 |
Household Income in Montour Falls
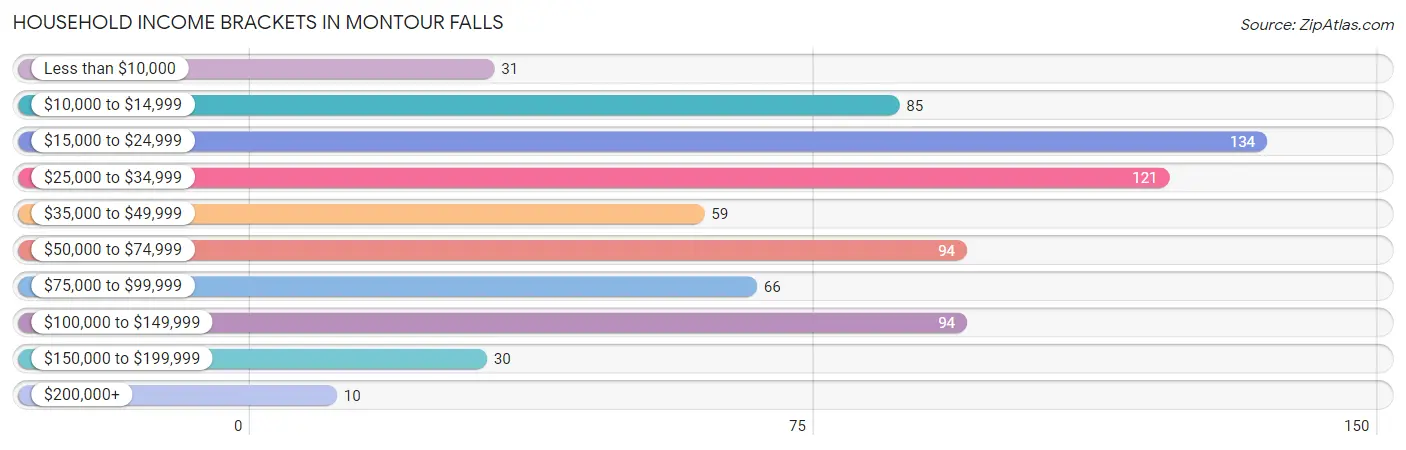
Household Income Brackets in Montour Falls
With 134 households falling in the category, the $15,000 to $24,999 income range is the most frequent in Montour Falls, accounting for 18.5% of all households. In contrast, only 10 households (1.4%) fall into the $200,000+ income bracket, making it the least populous group.
| Income Bracket | # Households | % Households |
| Less than $10,000 | 31 | 4.3% |
| $10,000 to $14,999 | 85 | 11.7% |
| $15,000 to $24,999 | 134 | 18.5% |
| $25,000 to $34,999 | 121 | 16.7% |
| $35,000 to $49,999 | 59 | 8.1% |
| $50,000 to $74,999 | 94 | 13.0% |
| $75,000 to $99,999 | 66 | 9.1% |
| $100,000 to $149,999 | 94 | 13.0% |
| $150,000 to $199,999 | 30 | 4.1% |
| $200,000+ | 10 | 1.4% |
Household Income by Householder Age in Montour Falls
The median household income in Montour Falls is $33,977, with the highest median household income of $63,750 found in the 25 to 44 years age bracket for the primary householder. A total of 191 households (26.4%) fall into this category. Meanwhile, the 15 to 24 years age bracket for the primary householder has the lowest median household income of $0, with 25 households (3.5%) in this group.
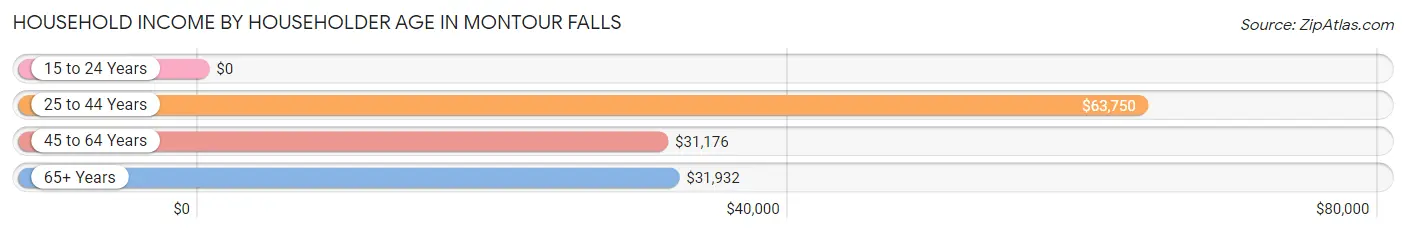
| Income Bracket | # Households | Median Income |
| 15 to 24 Years | 25 (3.5%) | $0 |
| 25 to 44 Years | 191 (26.4%) | $63,750 |
| 45 to 64 Years | 228 (31.5%) | $31,176 |
| 65+ Years | 280 (38.7%) | $31,932 |
| Total | 724 (100.0%) | $33,977 |
Poverty in Montour Falls
Income Below Poverty by Sex and Age in Montour Falls
With 23.4% poverty level for males and 20.0% for females among the residents of Montour Falls, 12 to 14 year old males and 5 year old females are the most vulnerable to poverty, with 14 males (63.6%) and 4 females (100.0%) in their respective age groups living below the poverty level.
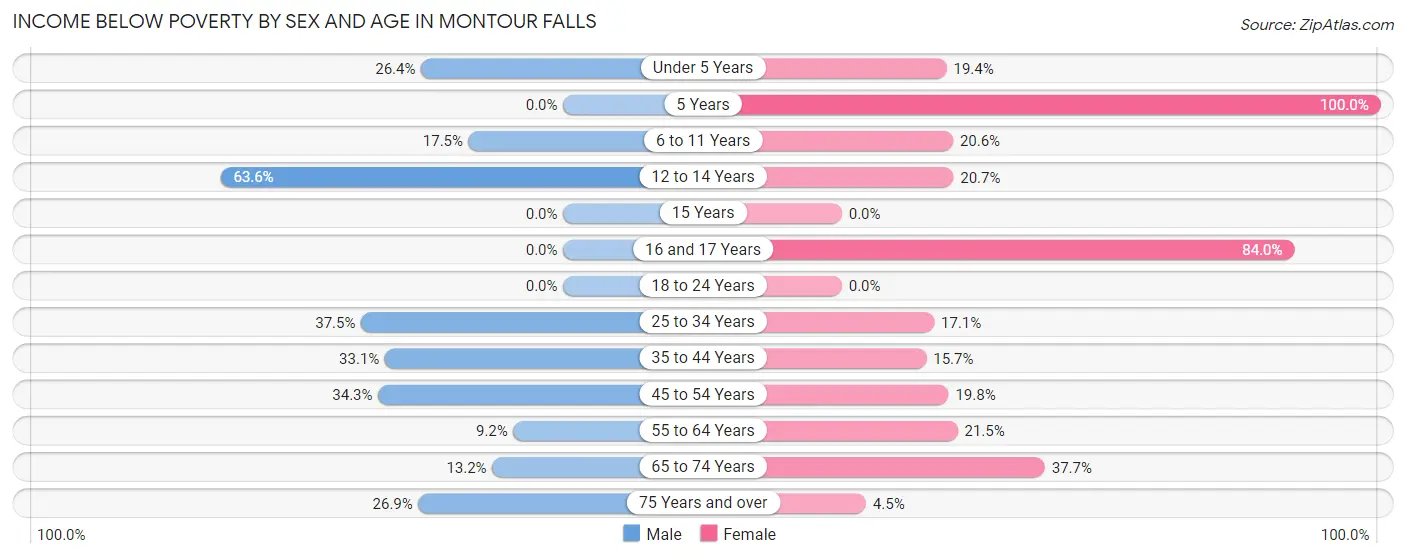
| Age Bracket | Male | Female |
| Under 5 Years | 24 (26.4%) | 7 (19.4%) |
| 5 Years | 0 (0.0%) | 4 (100.0%) |
| 6 to 11 Years | 10 (17.5%) | 13 (20.6%) |
| 12 to 14 Years | 14 (63.6%) | 6 (20.7%) |
| 15 Years | 0 (0.0%) | 0 (0.0%) |
| 16 and 17 Years | 0 (0.0%) | 21 (84.0%) |
| 18 to 24 Years | 0 (0.0%) | 0 (0.0%) |
| 25 to 34 Years | 24 (37.5%) | 12 (17.1%) |
| 35 to 44 Years | 44 (33.1%) | 24 (15.7%) |
| 45 to 54 Years | 34 (34.3%) | 20 (19.8%) |
| 55 to 64 Years | 12 (9.2%) | 29 (21.5%) |
| 65 to 74 Years | 10 (13.2%) | 52 (37.7%) |
| 75 Years and over | 18 (26.9%) | 6 (4.5%) |
| Total | 190 (23.4%) | 194 (20.0%) |
Income Above Poverty by Sex and Age in Montour Falls
According to the poverty statistics in Montour Falls, males aged 15 years and females aged 15 years are the age groups that are most secure financially, with 100.0% of males and 100.0% of females in these age groups living above the poverty line.
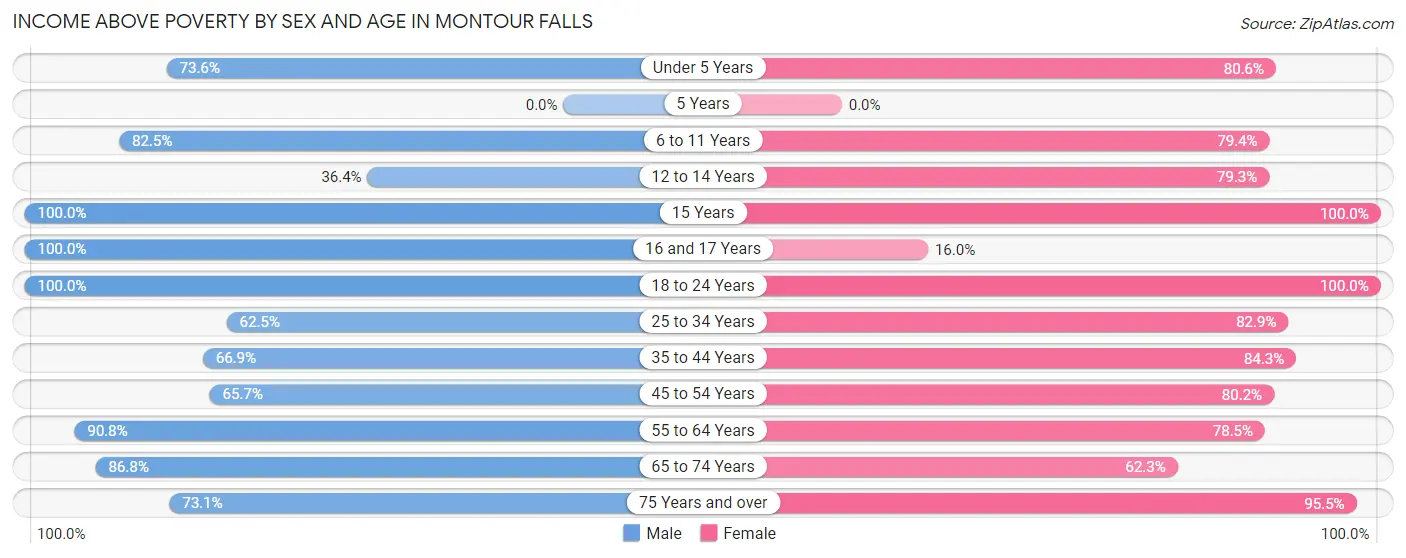
| Age Bracket | Male | Female |
| Under 5 Years | 67 (73.6%) | 29 (80.6%) |
| 5 Years | 0 (0.0%) | 0 (0.0%) |
| 6 to 11 Years | 47 (82.5%) | 50 (79.4%) |
| 12 to 14 Years | 8 (36.4%) | 23 (79.3%) |
| 15 Years | 6 (100.0%) | 10 (100.0%) |
| 16 and 17 Years | 14 (100.0%) | 4 (16.0%) |
| 18 to 24 Years | 53 (100.0%) | 70 (100.0%) |
| 25 to 34 Years | 40 (62.5%) | 58 (82.9%) |
| 35 to 44 Years | 89 (66.9%) | 129 (84.3%) |
| 45 to 54 Years | 65 (65.7%) | 81 (80.2%) |
| 55 to 64 Years | 118 (90.8%) | 106 (78.5%) |
| 65 to 74 Years | 66 (86.8%) | 86 (62.3%) |
| 75 Years and over | 49 (73.1%) | 128 (95.5%) |
| Total | 622 (76.6%) | 774 (80.0%) |
Income Below Poverty Among Married-Couple Families in Montour Falls
The poverty statistics for married-couple families in Montour Falls show that 7.4% or 21 of the total 283 families live below the poverty line. Families with no children have the highest poverty rate of 12.9%, comprising of 21 families. On the other hand, families with 1 or 2 children have the lowest poverty rate of 0.0%, which includes 0 families.
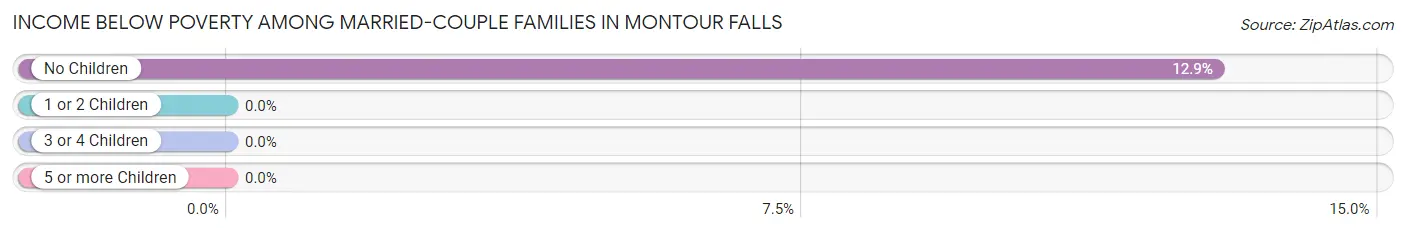
| Children | Above Poverty | Below Poverty |
| No Children | 142 (87.1%) | 21 (12.9%) |
| 1 or 2 Children | 111 (100.0%) | 0 (0.0%) |
| 3 or 4 Children | 9 (100.0%) | 0 (0.0%) |
| 5 or more Children | 0 (0.0%) | 0 (0.0%) |
| Total | 262 (92.6%) | 21 (7.4%) |
Income Below Poverty Among Single-Parent Households in Montour Falls
According to the poverty data in Montour Falls, 87.0% or 40 single-father households and 60.5% or 23 single-mother households are living below the poverty line. Among single-father households, those with 3 or 4 children have the highest poverty rate, with 32 households (100.0%) experiencing poverty. Likewise, among single-mother households, those with 3 or 4 children have the highest poverty rate, with 10 households (100.0%) falling below the poverty line.
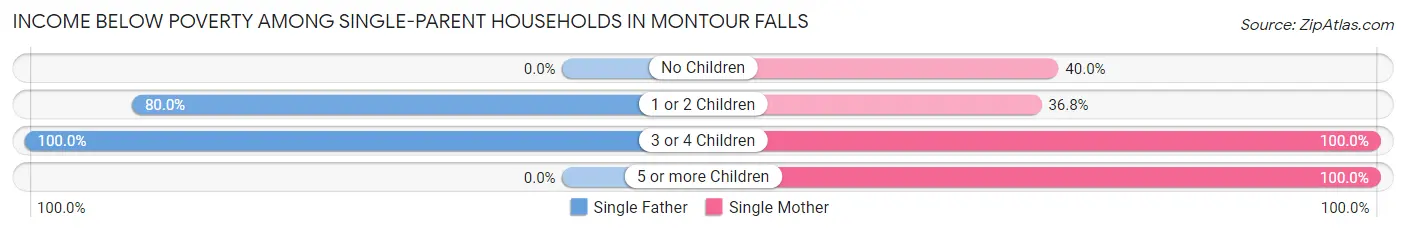
| Children | Single Father | Single Mother |
| No Children | 0 (0.0%) | 2 (40.0%) |
| 1 or 2 Children | 8 (80.0%) | 7 (36.8%) |
| 3 or 4 Children | 32 (100.0%) | 10 (100.0%) |
| 5 or more Children | 0 (0.0%) | 4 (100.0%) |
| Total | 40 (87.0%) | 23 (60.5%) |
Income Below Poverty Among Married-Couple vs Single-Parent Households in Montour Falls
The poverty data for Montour Falls shows that 21 of the married-couple family households (7.4%) and 63 of the single-parent households (75.0%) are living below the poverty level. Within the married-couple family households, those with no children have the highest poverty rate, with 21 households (12.9%) falling below the poverty line. Among the single-parent households, those with 3 or 4 children have the highest poverty rate, with 42 household (100.0%) living below poverty.
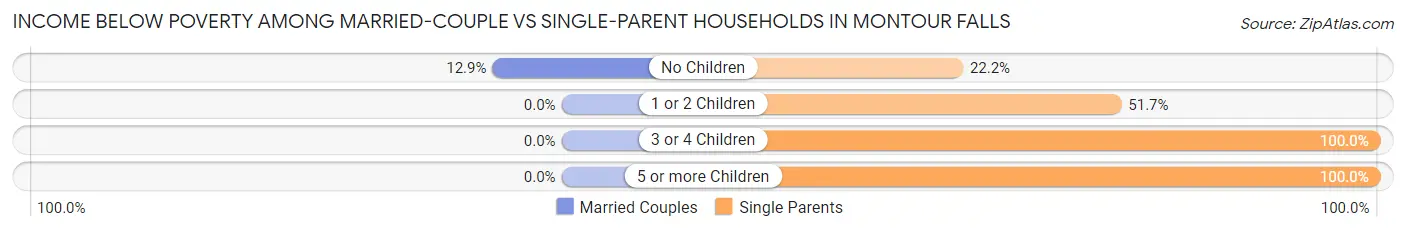
| Children | Married-Couple Families | Single-Parent Households |
| No Children | 21 (12.9%) | 2 (22.2%) |
| 1 or 2 Children | 0 (0.0%) | 15 (51.7%) |
| 3 or 4 Children | 0 (0.0%) | 42 (100.0%) |
| 5 or more Children | 0 (0.0%) | 4 (100.0%) |
| Total | 21 (7.4%) | 63 (75.0%) |
Race in Montour Falls
The most populous races in Montour Falls are White / Caucasian (1,720 | 94.0%), Two or more Races (68 | 3.7%), and Black / African American (26 | 1.4%).
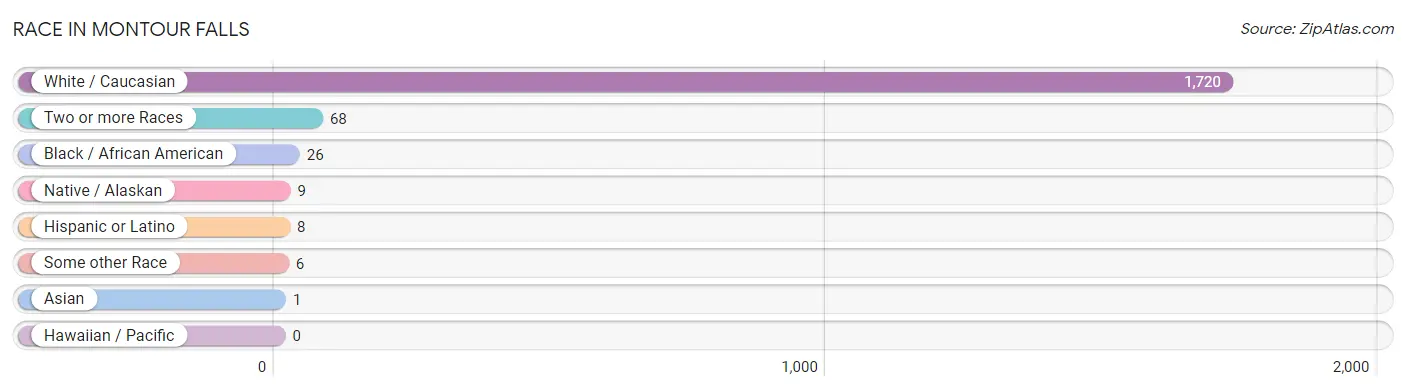
| Race | # Population | % Population |
| Asian | 1 | 0.1% |
| Black / African American | 26 | 1.4% |
| Hawaiian / Pacific | 0 | 0.0% |
| Hispanic or Latino | 8 | 0.4% |
| Native / Alaskan | 9 | 0.5% |
| White / Caucasian | 1,720 | 94.0% |
| Two or more Races | 68 | 3.7% |
| Some other Race | 6 | 0.3% |
| Total | 1,830 | 100.0% |
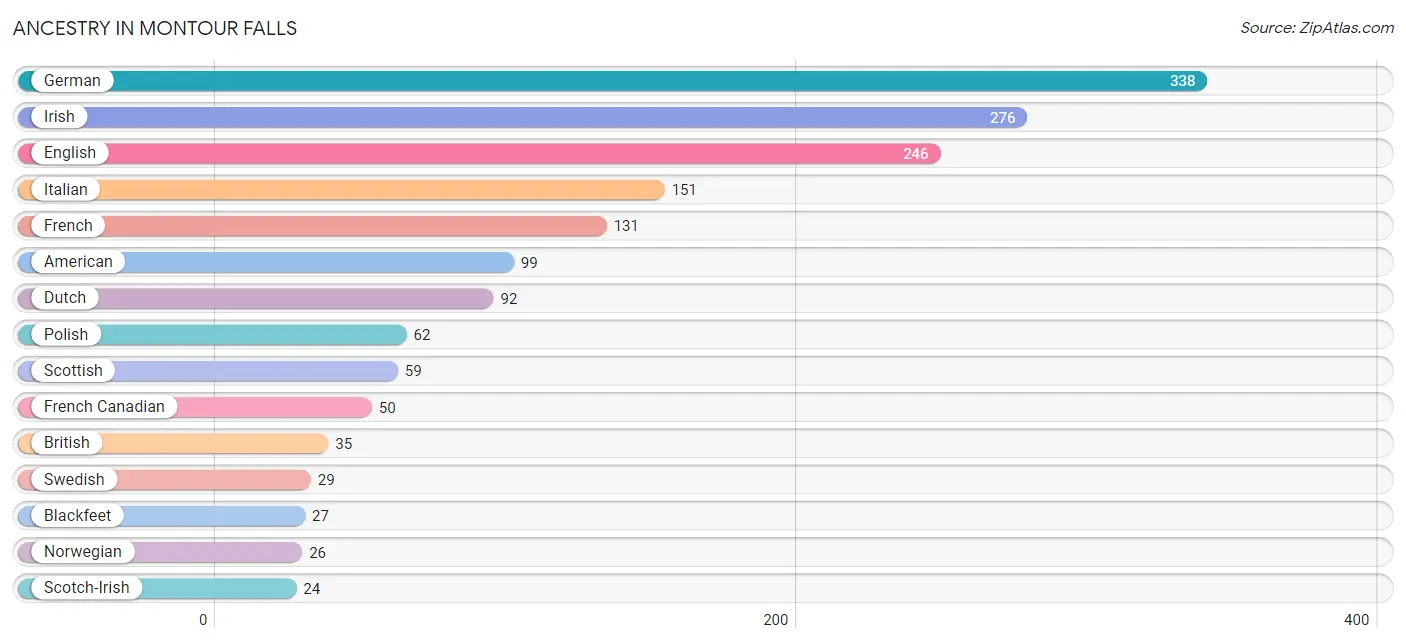
Ancestry in Montour Falls
The most populous ancestries reported in Montour Falls are German (338 | 18.5%), Irish (276 | 15.1%), English (246 | 13.4%), Italian (151 | 8.3%), and French (131 | 7.2%), together accounting for 62.4% of all Montour Falls residents.
| Ancestry | # Population | % Population |
| Afghan | 1 | 0.1% |
| Albanian | 4 | 0.2% |
| American | 99 | 5.4% |
| Belgian | 14 | 0.8% |
| Blackfeet | 27 | 1.5% |
| British | 35 | 1.9% |
| Central American | 1 | 0.1% |
| Cherokee | 3 | 0.2% |
| Cuban | 2 | 0.1% |
| Czech | 4 | 0.2% |
| Czechoslovakian | 4 | 0.2% |
| Danish | 10 | 0.5% |
| Dutch | 92 | 5.0% |
| English | 246 | 13.4% |
| European | 4 | 0.2% |
| French | 131 | 7.2% |
| French Canadian | 50 | 2.7% |
| German | 338 | 18.5% |
| Greek | 7 | 0.4% |
| Honduran | 1 | 0.1% |
| Hungarian | 14 | 0.8% |
| Irish | 276 | 15.1% |
| Iroquois | 19 | 1.0% |
| Italian | 151 | 8.3% |
| Jamaican | 5 | 0.3% |
| Korean | 1 | 0.1% |
| Lithuanian | 4 | 0.2% |
| Macedonian | 4 | 0.2% |
| Mexican | 2 | 0.1% |
| Norwegian | 26 | 1.4% |
| Pennsylvania German | 4 | 0.2% |
| Polish | 62 | 3.4% |
| Puerto Rican | 3 | 0.2% |
| Russian | 2 | 0.1% |
| Scotch-Irish | 24 | 1.3% |
| Scottish | 59 | 3.2% |
| Sri Lankan | 10 | 0.5% |
| Swedish | 29 | 1.6% |
| Swiss | 3 | 0.2% |
| Ukrainian | 5 | 0.3% |
| Welsh | 19 | 1.0% |
| West Indian | 8 | 0.4% | View All 42 Rows |
Immigrants in Montour Falls
The most numerous immigrant groups reported in Montour Falls came from Latin America (14 | 0.8%), Caribbean (13 | 0.7%), St. Vincent and the Grenadines (8 | 0.4%), Jamaica (5 | 0.3%), and Afghanistan (1 | 0.1%), together accounting for 2.2% of all Montour Falls residents.
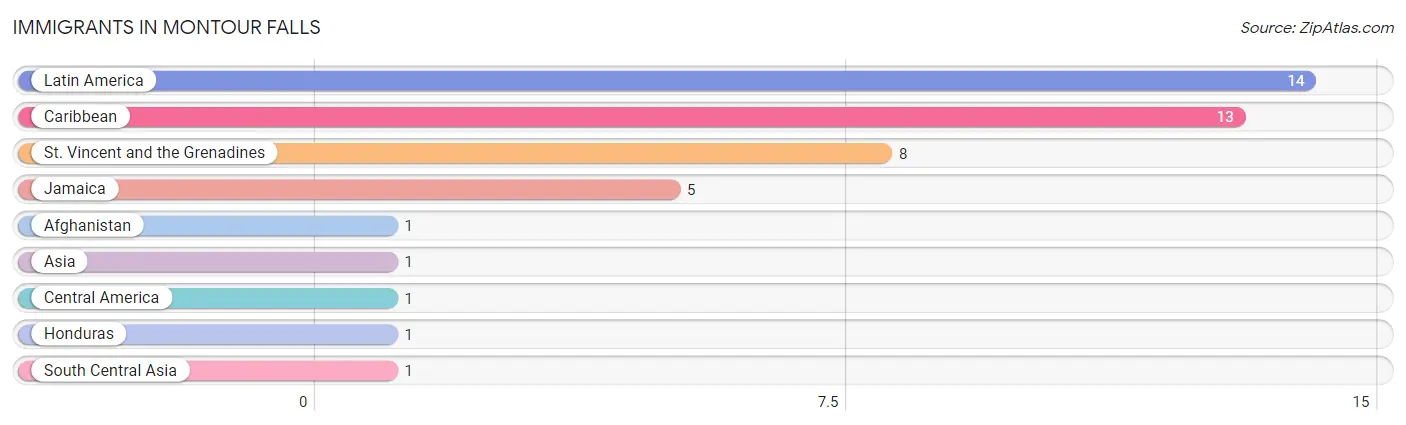
| Immigration Origin | # Population | % Population |
| Afghanistan | 1 | 0.1% |
| Asia | 1 | 0.1% |
| Caribbean | 13 | 0.7% |
| Central America | 1 | 0.1% |
| Honduras | 1 | 0.1% |
| Jamaica | 5 | 0.3% |
| Latin America | 14 | 0.8% |
| South Central Asia | 1 | 0.1% |
| St. Vincent and the Grenadines | 8 | 0.4% | View All 9 Rows |
Sex and Age in Montour Falls
Sex and Age in Montour Falls
The most populous age groups in Montour Falls are 40 to 44 Years (108 | 12.8%) for men and 60 to 64 Years (96 | 9.8%) for women.
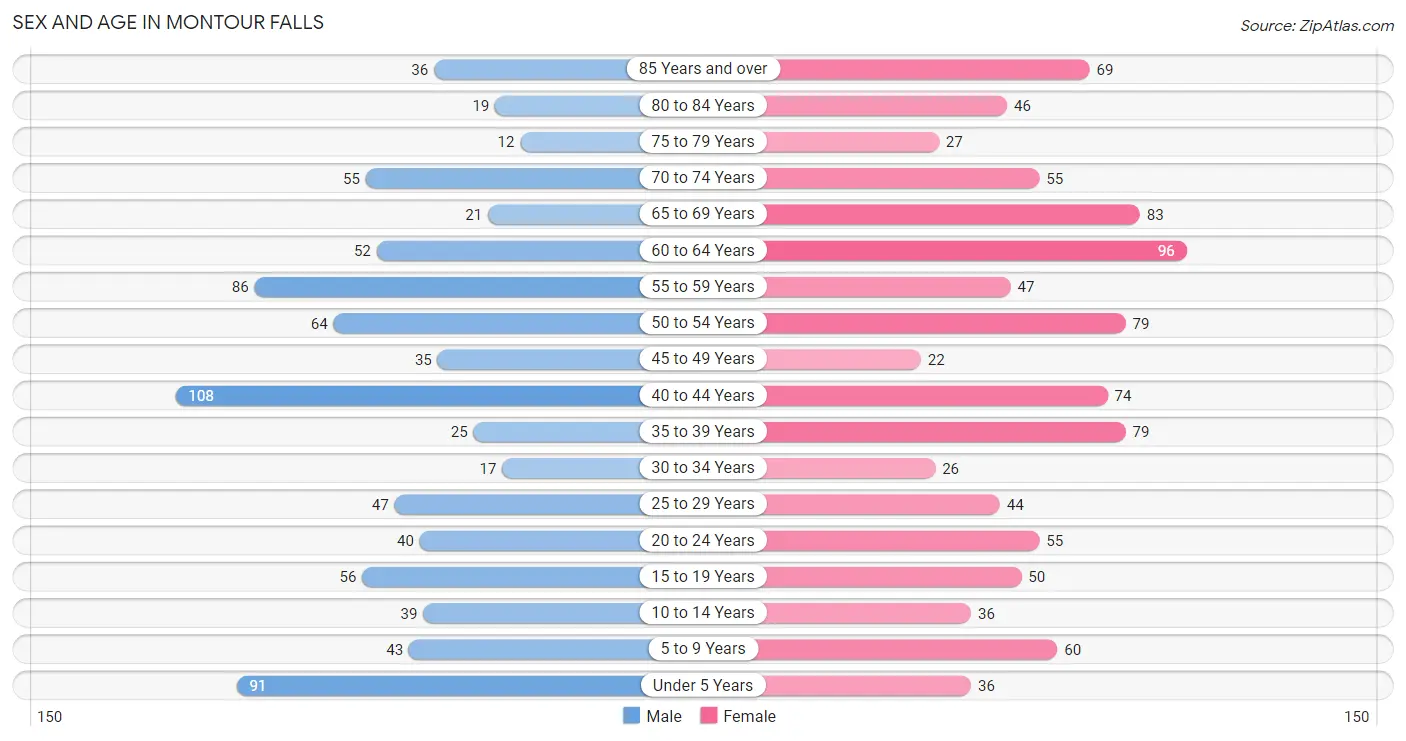
| Age Bracket | Male | Female |
| Under 5 Years | 91 (10.8%) | 36 (3.7%) |
| 5 to 9 Years | 43 (5.1%) | 60 (6.1%) |
| 10 to 14 Years | 39 (4.6%) | 36 (3.7%) |
| 15 to 19 Years | 56 (6.6%) | 50 (5.1%) |
| 20 to 24 Years | 40 (4.7%) | 55 (5.6%) |
| 25 to 29 Years | 47 (5.6%) | 44 (4.5%) |
| 30 to 34 Years | 17 (2.0%) | 26 (2.6%) |
| 35 to 39 Years | 25 (3.0%) | 79 (8.0%) |
| 40 to 44 Years | 108 (12.8%) | 74 (7.5%) |
| 45 to 49 Years | 35 (4.1%) | 22 (2.2%) |
| 50 to 54 Years | 64 (7.6%) | 79 (8.0%) |
| 55 to 59 Years | 86 (10.2%) | 47 (4.8%) |
| 60 to 64 Years | 52 (6.1%) | 96 (9.8%) |
| 65 to 69 Years | 21 (2.5%) | 83 (8.4%) |
| 70 to 74 Years | 55 (6.5%) | 55 (5.6%) |
| 75 to 79 Years | 12 (1.4%) | 27 (2.7%) |
| 80 to 84 Years | 19 (2.2%) | 46 (4.7%) |
| 85 Years and over | 36 (4.3%) | 69 (7.0%) |
| Total | 846 (100.0%) | 984 (100.0%) |
Families and Households in Montour Falls
Median Family Size in Montour Falls
The median family size in Montour Falls is 3.26 persons per family, with single female/mother families (38 | 10.3%) accounting for the largest median family size of 3.95 persons per family. On the other hand, single male/father families (46 | 12.5%) represent the smallest median family size with 2.20 persons per family.
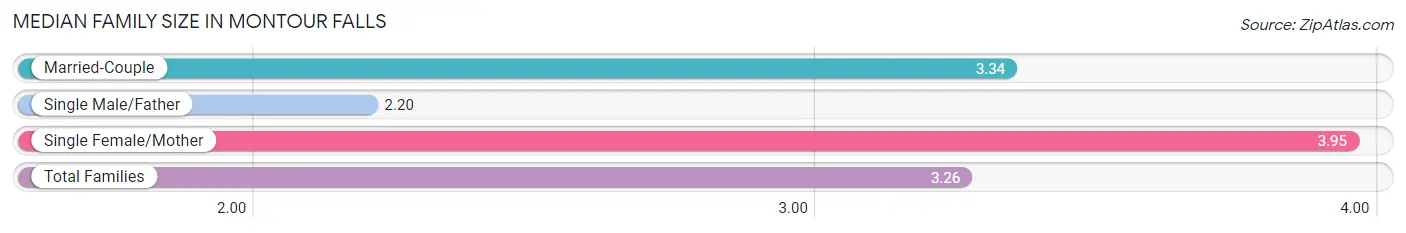
| Family Type | # Families | Family Size |
| Married-Couple | 283 (77.1%) | 3.34 |
| Single Male/Father | 46 (12.5%) | 2.20 |
| Single Female/Mother | 38 (10.3%) | 3.95 |
| Total Families | 367 (100.0%) | 3.26 |
Median Household Size in Montour Falls
The median household size in Montour Falls is 2.27 persons per household, with single female/mother households (38 | 5.2%) accounting for the largest median household size of 4.29 persons per household. non-family households (357 | 49.3%) represent the smallest median household size with 1.15 persons per household.
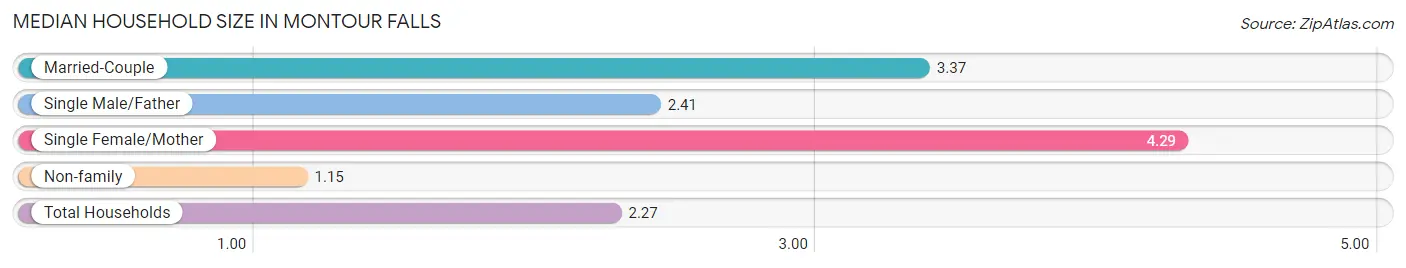
| Household Type | # Households | Household Size |
| Married-Couple | 283 (39.1%) | 3.37 |
| Single Male/Father | 46 (6.4%) | 2.41 |
| Single Female/Mother | 38 (5.2%) | 4.29 |
| Non-family | 357 (49.3%) | 1.15 |
| Total Households | 724 (100.0%) | 2.27 |
Household Size by Marriage Status in Montour Falls
Out of a total of 724 households in Montour Falls, 367 (50.7%) are family households, while 357 (49.3%) are nonfamily households. The most numerous type of family households are 2-person households, comprising 142, and the most common type of nonfamily households are 1-person households, comprising 292.
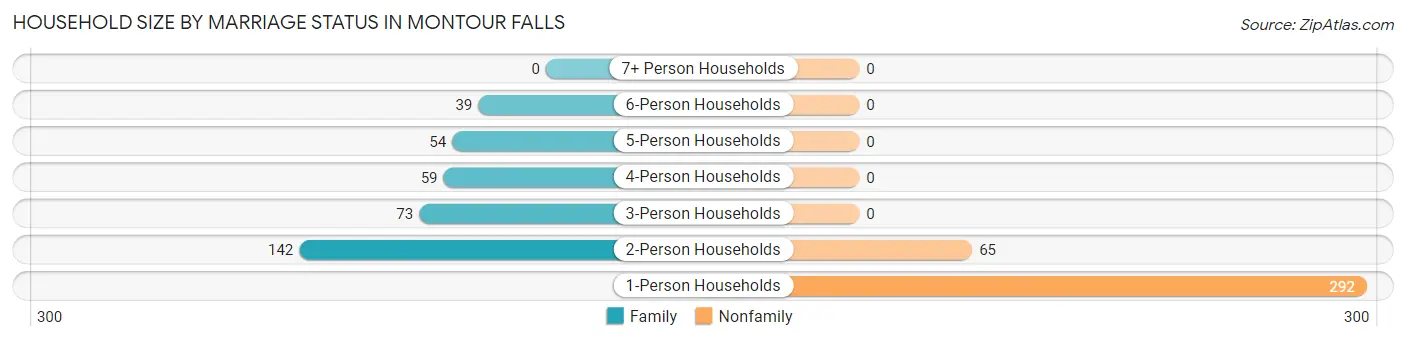
| Household Size | Family Households | Nonfamily Households |
| 1-Person Households | - | 292 (40.3%) |
| 2-Person Households | 142 (19.6%) | 65 (9.0%) |
| 3-Person Households | 73 (10.1%) | 0 (0.0%) |
| 4-Person Households | 59 (8.2%) | 0 (0.0%) |
| 5-Person Households | 54 (7.5%) | 0 (0.0%) |
| 6-Person Households | 39 (5.4%) | 0 (0.0%) |
| 7+ Person Households | 0 (0.0%) | 0 (0.0%) |
| Total | 367 (50.7%) | 357 (49.3%) |
Female Fertility in Montour Falls
Fertility by Age in Montour Falls
Average fertility rate in Montour Falls is 6.0 births per 1,000 women. Women in the age bracket of 35 to 50 years have the highest fertility rate with 11.0 births per 1,000 women. Women in the age bracket of 35 to 50 years acount for 100.0% of all women with births.
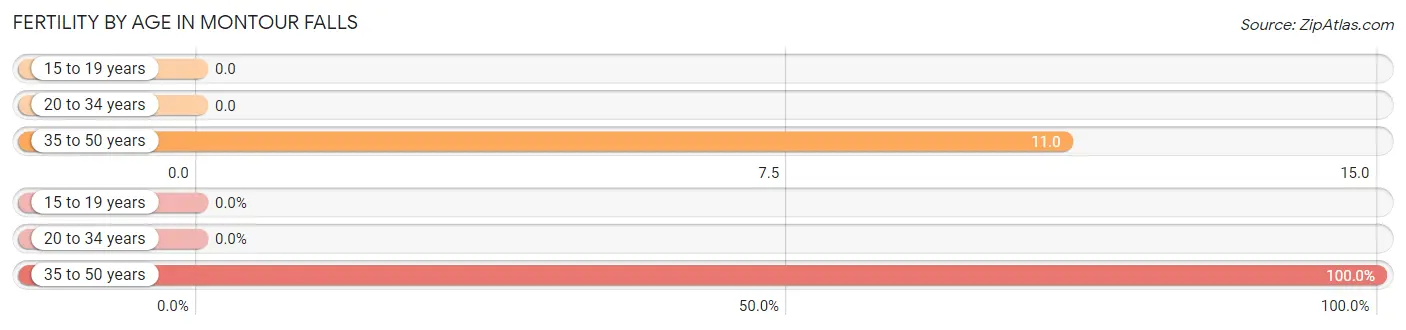
| Age Bracket | Women with Births | Births / 1,000 Women |
| 15 to 19 years | 0 (0.0%) | 0.0 |
| 20 to 34 years | 0 (0.0%) | 0.0 |
| 35 to 50 years | 2 (100.0%) | 11.0 |
| Total | 2 (100.0%) | 6.0 |
Fertility by Age by Marriage Status in Montour Falls
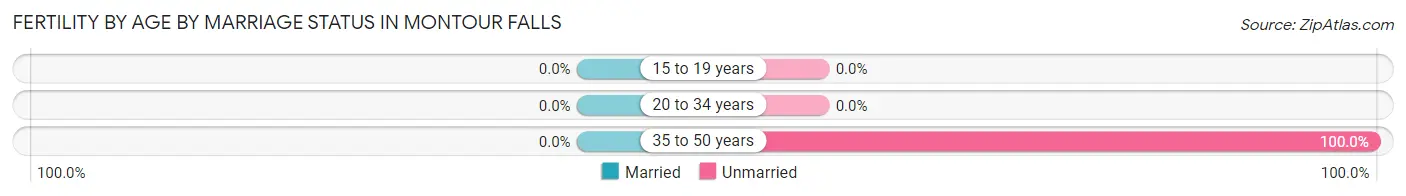
| Age Bracket | Married | Unmarried |
| 15 to 19 years | 0 (0.0%) | 0 (0.0%) |
| 20 to 34 years | 0 (0.0%) | 0 (0.0%) |
| 35 to 50 years | 0 (0.0%) | 2 (100.0%) |
| Total | 0 (0.0%) | 2 (100.0%) |
Fertility by Education in Montour Falls
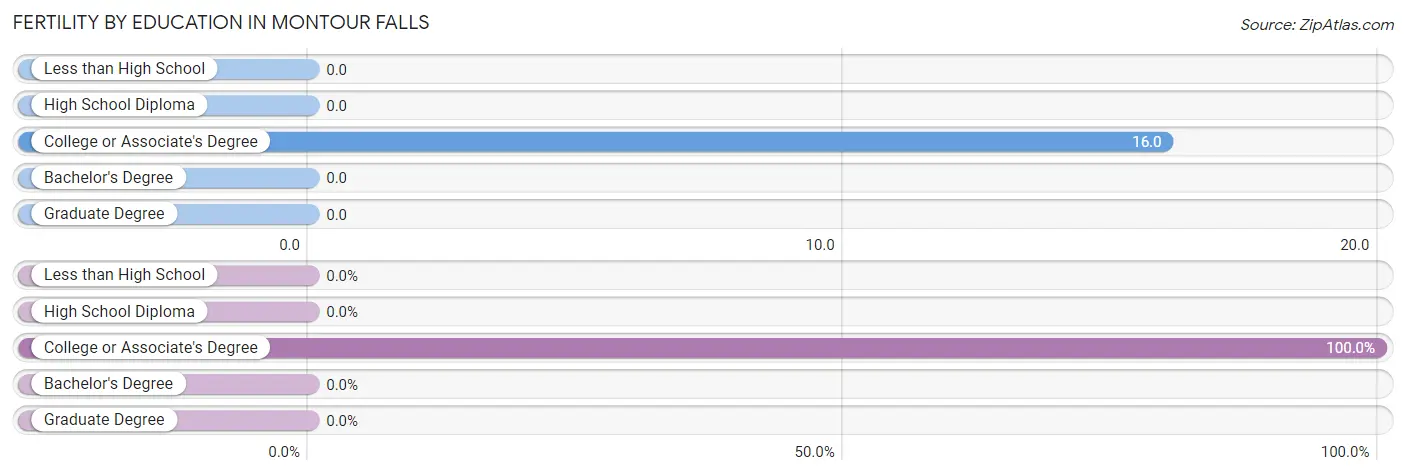
| Educational Attainment | Women with Births | Births / 1,000 Women |
| Less than High School | 0 (0.0%) | 0.0 |
| High School Diploma | 0 (0.0%) | 0.0 |
| College or Associate's Degree | 2 (100.0%) | 16.0 |
| Bachelor's Degree | 0 (0.0%) | 0.0 |
| Graduate Degree | 0 (0.0%) | 0.0 |
| Total | 2 (100.0%) | 6.0 |
Fertility by Education by Marriage Status in Montour Falls
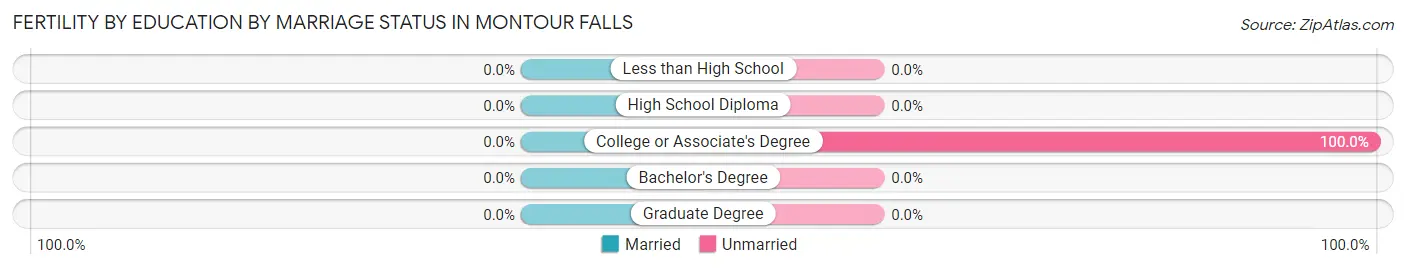
| Educational Attainment | Married | Unmarried |
| Less than High School | 0 (0.0%) | 0 (0.0%) |
| High School Diploma | 0 (0.0%) | 0 (0.0%) |
| College or Associate's Degree | 0 (0.0%) | 2 (100.0%) |
| Bachelor's Degree | 0 (0.0%) | 0 (0.0%) |
| Graduate Degree | 0 (0.0%) | 0 (0.0%) |
| Total | 0 (0.0%) | 2 (100.0%) |
Employment Characteristics in Montour Falls
Employment by Class of Employer in Montour Falls
Among the 591 employed individuals in Montour Falls, private company employees (310 | 52.4%), local government employees (132 | 22.3%), and not-for-profit organizations (78 | 13.2%) make up the most common classes of employment.
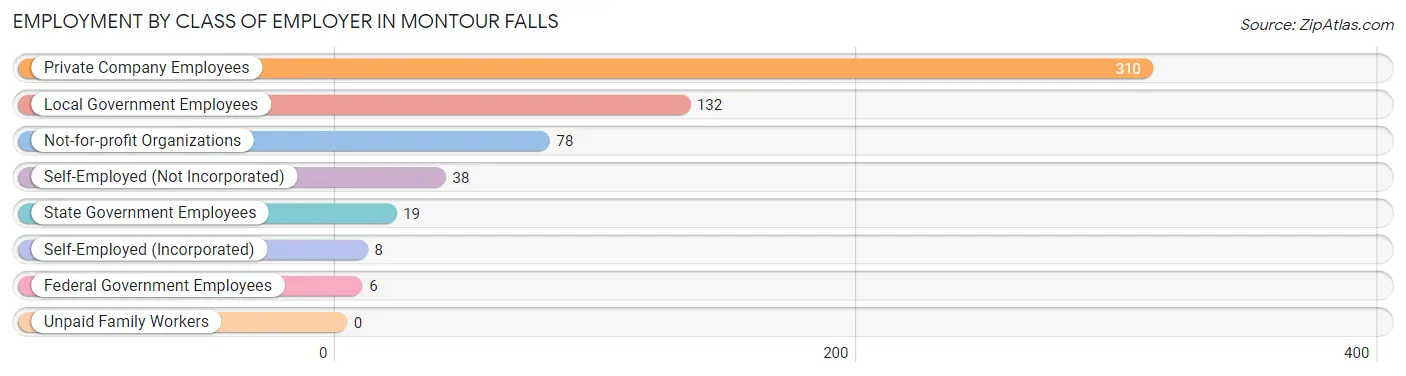
| Employer Class | # Employees | % Employees |
| Private Company Employees | 310 | 52.4% |
| Self-Employed (Incorporated) | 8 | 1.3% |
| Self-Employed (Not Incorporated) | 38 | 6.4% |
| Not-for-profit Organizations | 78 | 13.2% |
| Local Government Employees | 132 | 22.3% |
| State Government Employees | 19 | 3.2% |
| Federal Government Employees | 6 | 1.0% |
| Unpaid Family Workers | 0 | 0.0% |
| Total | 591 | 100.0% |
Employment Status by Age in Montour Falls
According to the labor force statistics for Montour Falls, out of the total population over 16 years of age (1,508), 44.6% or 673 individuals are in the labor force, with 10.3% or 69 of them unemployed. The age group with the highest labor force participation rate is 20 to 24 years, with 89.5% or 85 individuals in the labor force. Within the labor force, the 20 to 24 years age range has the highest percentage of unemployed individuals, with 29.4% or 25 of them being unemployed.
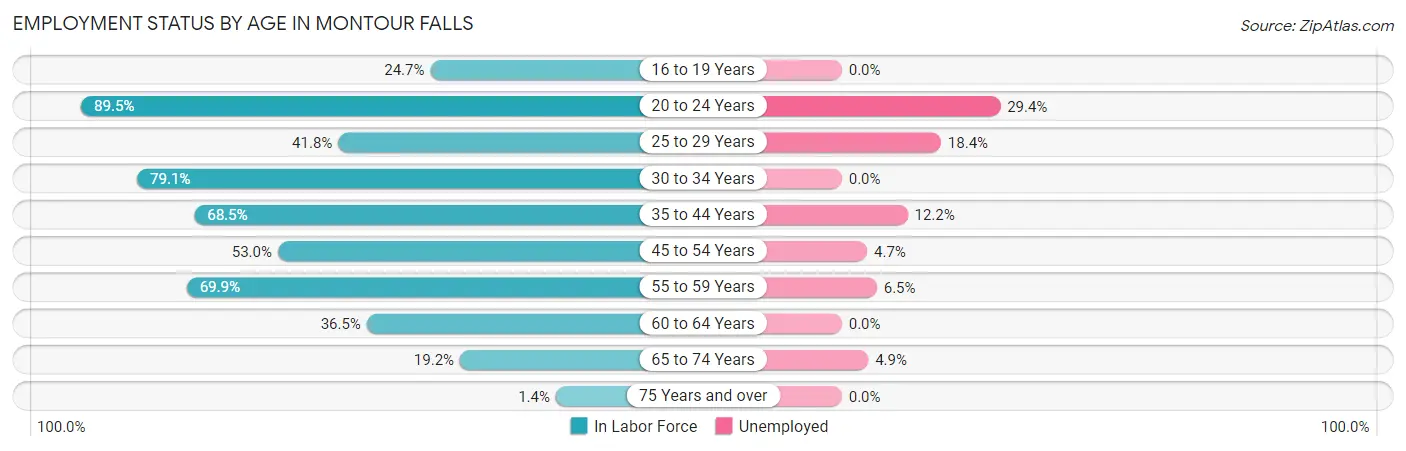
| Age Bracket | In Labor Force | Unemployed |
| 16 to 19 Years | 22 (24.7%) | 0 (0.0%) |
| 20 to 24 Years | 85 (89.5%) | 25 (29.4%) |
| 25 to 29 Years | 38 (41.8%) | 7 (18.4%) |
| 30 to 34 Years | 34 (79.1%) | 0 (0.0%) |
| 35 to 44 Years | 196 (68.5%) | 24 (12.2%) |
| 45 to 54 Years | 106 (53.0%) | 5 (4.7%) |
| 55 to 59 Years | 93 (69.9%) | 6 (6.5%) |
| 60 to 64 Years | 54 (36.5%) | 0 (0.0%) |
| 65 to 74 Years | 41 (19.2%) | 2 (4.9%) |
| 75 Years and over | 3 (1.4%) | 0 (0.0%) |
| Total | 673 (44.6%) | 69 (10.3%) |
Employment Status by Educational Attainment in Montour Falls
According to labor force statistics for Montour Falls, 57.8% of individuals (521) out of the total population between 25 and 64 years of age (901) are in the labor force, with 8.1% or 42 of them being unemployed. The group with the highest labor force participation rate are those with the educational attainment of bachelor's degree or higher, with 65.5% or 114 individuals in the labor force. Within the labor force, individuals with less than high school education have the highest percentage of unemployment, with 50.0% or 8 of them being unemployed.
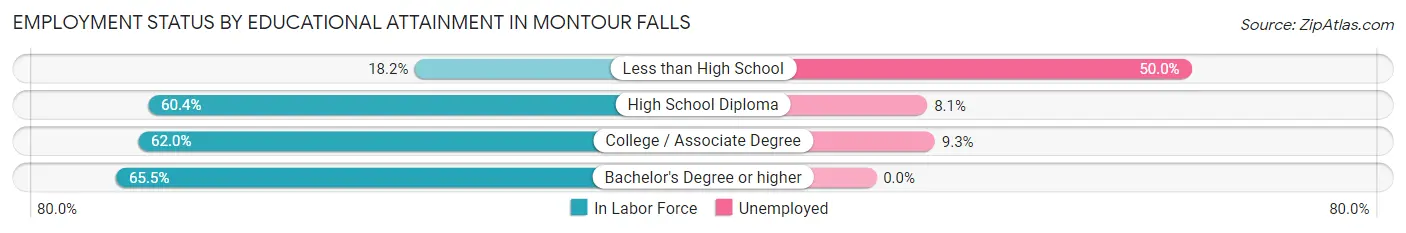
| Educational Attainment | In Labor Force | Unemployed |
| Less than High School | 16 (18.2%) | 44 (50.0%) |
| High School Diploma | 197 (60.4%) | 26 (8.1%) |
| College / Associate Degree | 194 (62.0%) | 29 (9.3%) |
| Bachelor's Degree or higher | 114 (65.5%) | 0 (0.0%) |
| Total | 521 (57.8%) | 73 (8.1%) |
Employment Occupations by Sex in Montour Falls
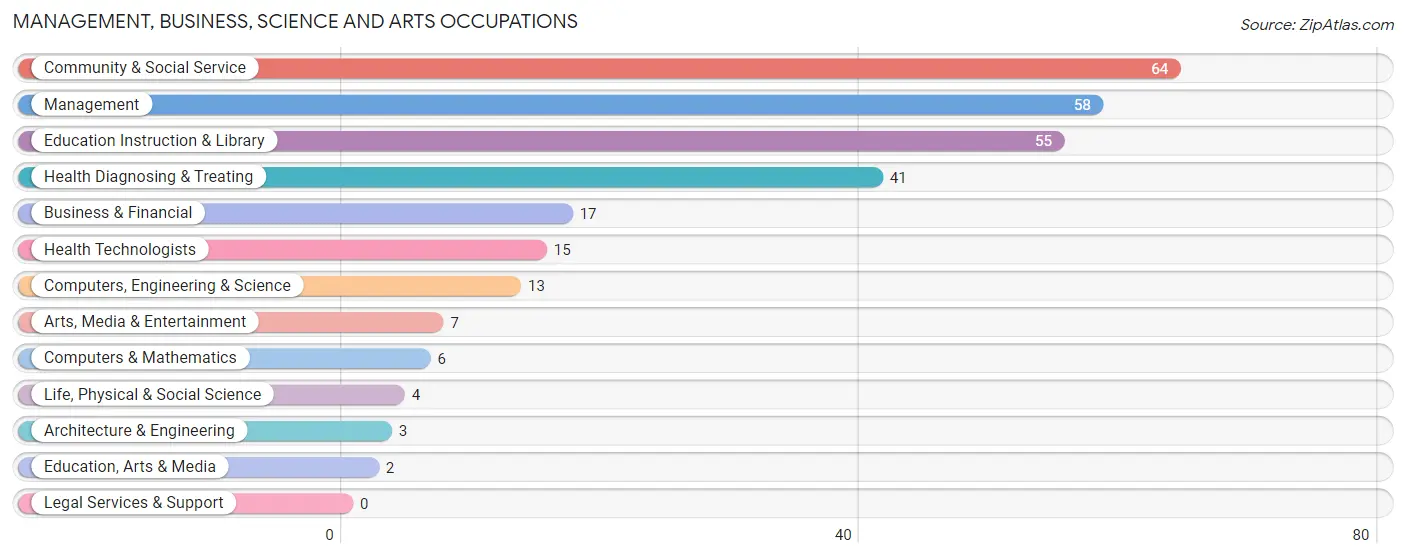
Management, Business, Science and Arts Occupations
The most common Management, Business, Science and Arts occupations in Montour Falls are Community & Social Service (64 | 10.6%), Management (58 | 9.6%), Education Instruction & Library (55 | 9.1%), Health Diagnosing & Treating (41 | 6.8%), and Business & Financial (17 | 2.8%).
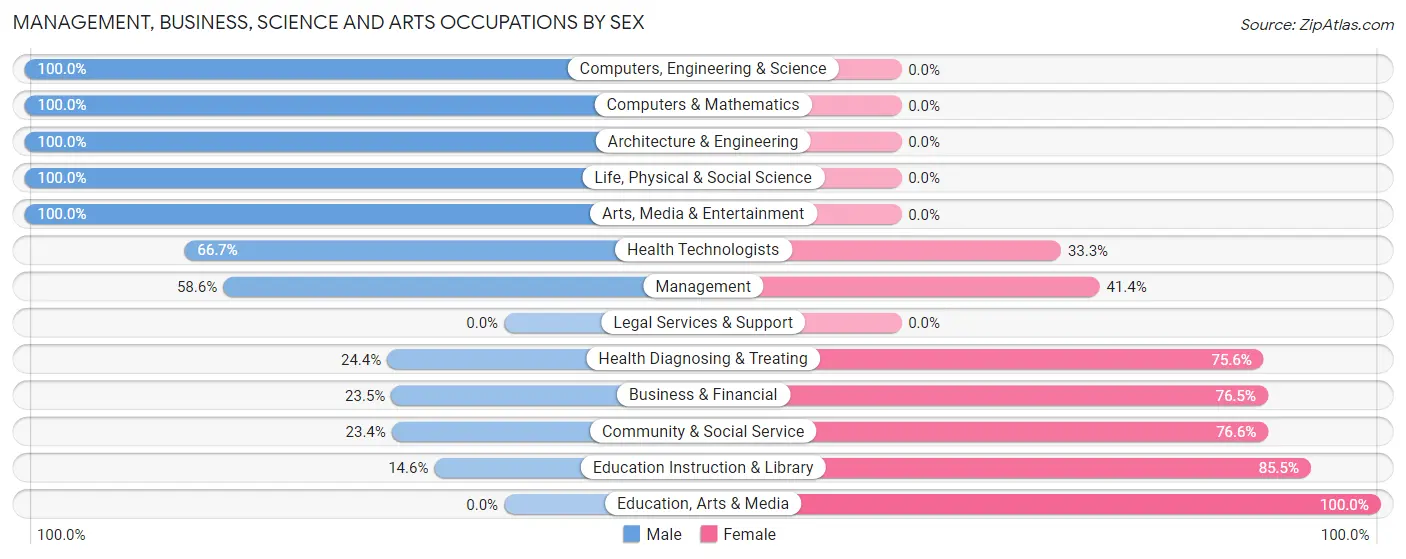
Management, Business, Science and Arts Occupations by Sex
Within the Management, Business, Science and Arts occupations in Montour Falls, the most male-oriented occupations are Computers, Engineering & Science (100.0%), Computers & Mathematics (100.0%), and Architecture & Engineering (100.0%), while the most female-oriented occupations are Education, Arts & Media (100.0%), Education Instruction & Library (85.5%), and Community & Social Service (76.6%).
| Occupation | Male | Female |
| Management | 34 (58.6%) | 24 (41.4%) |
| Business & Financial | 4 (23.5%) | 13 (76.5%) |
| Computers, Engineering & Science | 13 (100.0%) | 0 (0.0%) |
| Computers & Mathematics | 6 (100.0%) | 0 (0.0%) |
| Architecture & Engineering | 3 (100.0%) | 0 (0.0%) |
| Life, Physical & Social Science | 4 (100.0%) | 0 (0.0%) |
| Community & Social Service | 15 (23.4%) | 49 (76.6%) |
| Education, Arts & Media | 0 (0.0%) | 2 (100.0%) |
| Legal Services & Support | 0 (0.0%) | 0 (0.0%) |
| Education Instruction & Library | 8 (14.5%) | 47 (85.5%) |
| Arts, Media & Entertainment | 7 (100.0%) | 0 (0.0%) |
| Health Diagnosing & Treating | 10 (24.4%) | 31 (75.6%) |
| Health Technologists | 10 (66.7%) | 5 (33.3%) |
| Total (Category) | 76 (39.4%) | 117 (60.6%) |
| Total (Overall) | 306 (50.7%) | 297 (49.2%) |
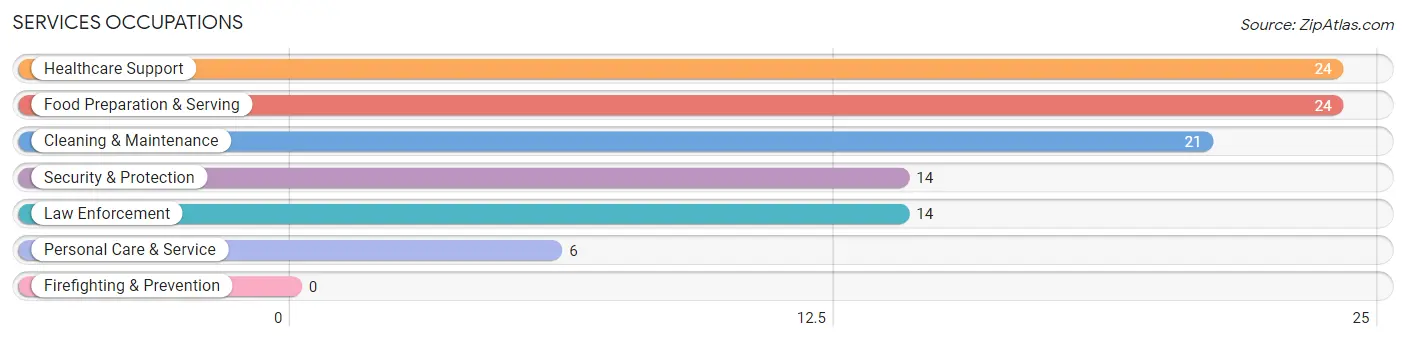
Services Occupations
The most common Services occupations in Montour Falls are Healthcare Support (24 | 4.0%), Food Preparation & Serving (24 | 4.0%), Cleaning & Maintenance (21 | 3.5%), Security & Protection (14 | 2.3%), and Law Enforcement (14 | 2.3%).
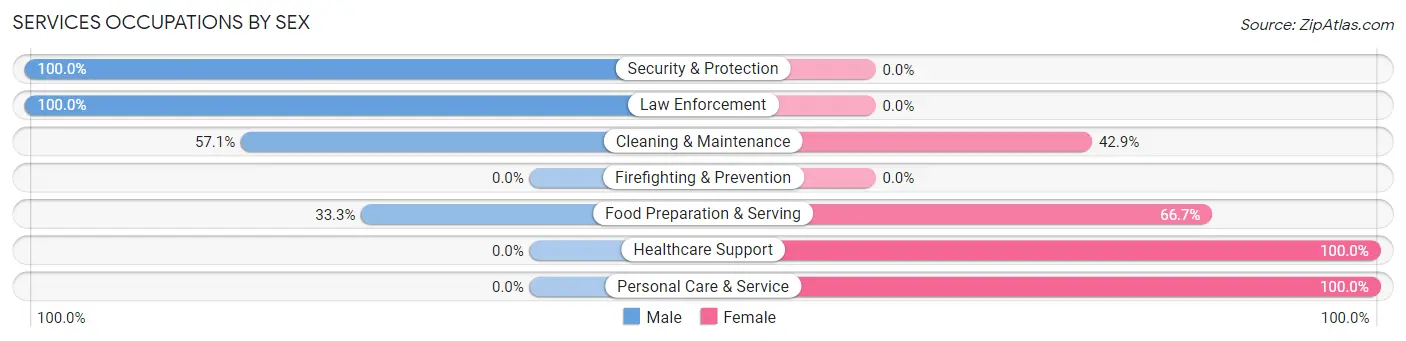
Services Occupations by Sex
Within the Services occupations in Montour Falls, the most male-oriented occupations are Security & Protection (100.0%), Law Enforcement (100.0%), and Cleaning & Maintenance (57.1%), while the most female-oriented occupations are Healthcare Support (100.0%), Personal Care & Service (100.0%), and Food Preparation & Serving (66.7%).
| Occupation | Male | Female |
| Healthcare Support | 0 (0.0%) | 24 (100.0%) |
| Security & Protection | 14 (100.0%) | 0 (0.0%) |
| Firefighting & Prevention | 0 (0.0%) | 0 (0.0%) |
| Law Enforcement | 14 (100.0%) | 0 (0.0%) |
| Food Preparation & Serving | 8 (33.3%) | 16 (66.7%) |
| Cleaning & Maintenance | 12 (57.1%) | 9 (42.9%) |
| Personal Care & Service | 0 (0.0%) | 6 (100.0%) |
| Total (Category) | 34 (38.2%) | 55 (61.8%) |
| Total (Overall) | 306 (50.7%) | 297 (49.2%) |
Sales and Office Occupations
The most common Sales and Office occupations in Montour Falls are Office & Administration (135 | 22.4%), and Sales & Related (25 | 4.2%).
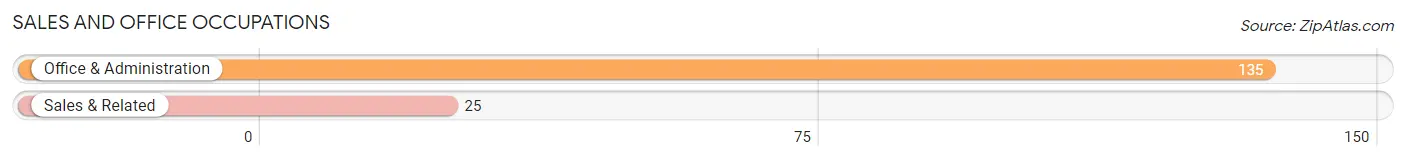
Sales and Office Occupations by Sex
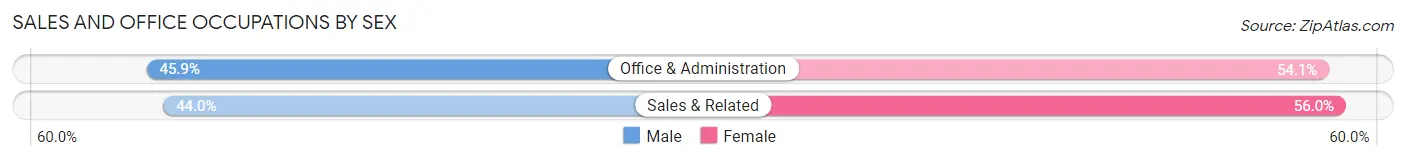
| Occupation | Male | Female |
| Sales & Related | 11 (44.0%) | 14 (56.0%) |
| Office & Administration | 62 (45.9%) | 73 (54.1%) |
| Total (Category) | 73 (45.6%) | 87 (54.4%) |
| Total (Overall) | 306 (50.7%) | 297 (49.2%) |
Natural Resources, Construction and Maintenance Occupations
The most common Natural Resources, Construction and Maintenance occupations in Montour Falls are Installation, Maintenance & Repair (33 | 5.5%), and Construction & Extraction (23 | 3.8%).
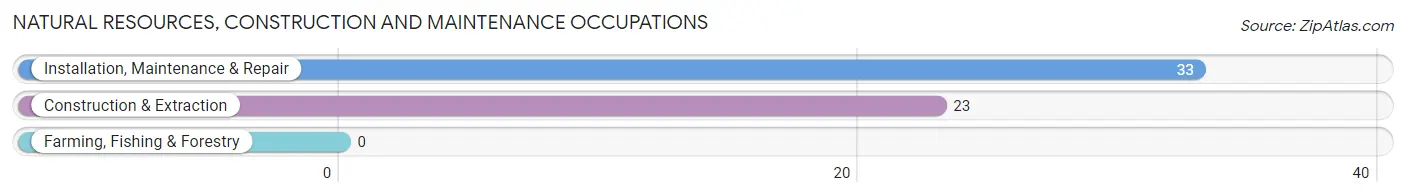
Natural Resources, Construction and Maintenance Occupations by Sex
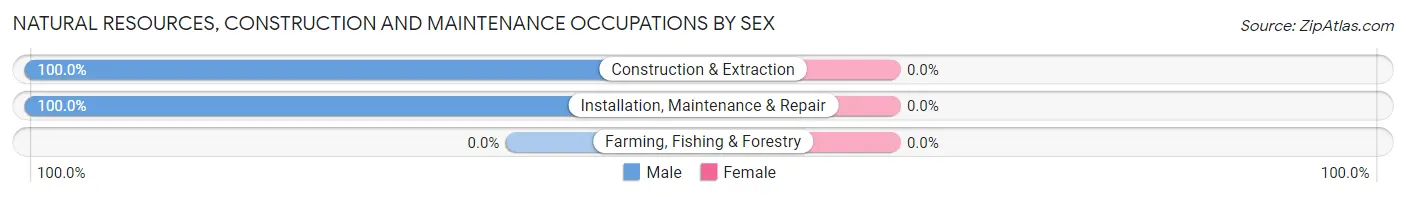
| Occupation | Male | Female |
| Farming, Fishing & Forestry | 0 (0.0%) | 0 (0.0%) |
| Construction & Extraction | 23 (100.0%) | 0 (0.0%) |
| Installation, Maintenance & Repair | 33 (100.0%) | 0 (0.0%) |
| Total (Category) | 56 (100.0%) | 0 (0.0%) |
| Total (Overall) | 306 (50.7%) | 297 (49.2%) |
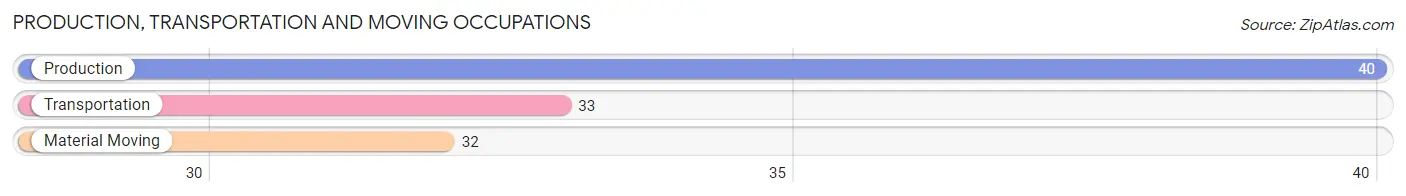
Production, Transportation and Moving Occupations
The most common Production, Transportation and Moving occupations in Montour Falls are Production (40 | 6.6%), Transportation (33 | 5.5%), and Material Moving (32 | 5.3%).
Production, Transportation and Moving Occupations by Sex
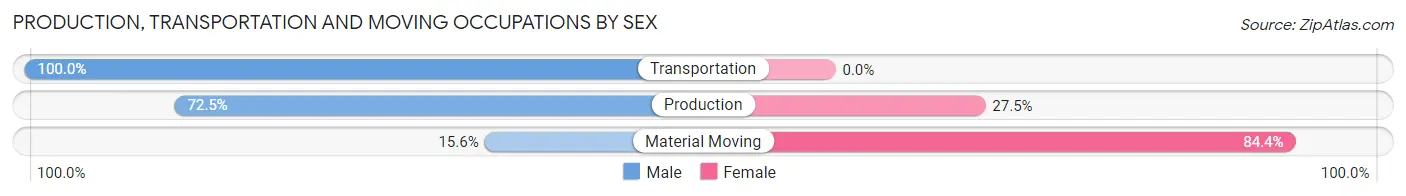
| Occupation | Male | Female |
| Production | 29 (72.5%) | 11 (27.5%) |
| Transportation | 33 (100.0%) | 0 (0.0%) |
| Material Moving | 5 (15.6%) | 27 (84.4%) |
| Total (Category) | 67 (63.8%) | 38 (36.2%) |
| Total (Overall) | 306 (50.7%) | 297 (49.2%) |
Employment Industries by Sex in Montour Falls
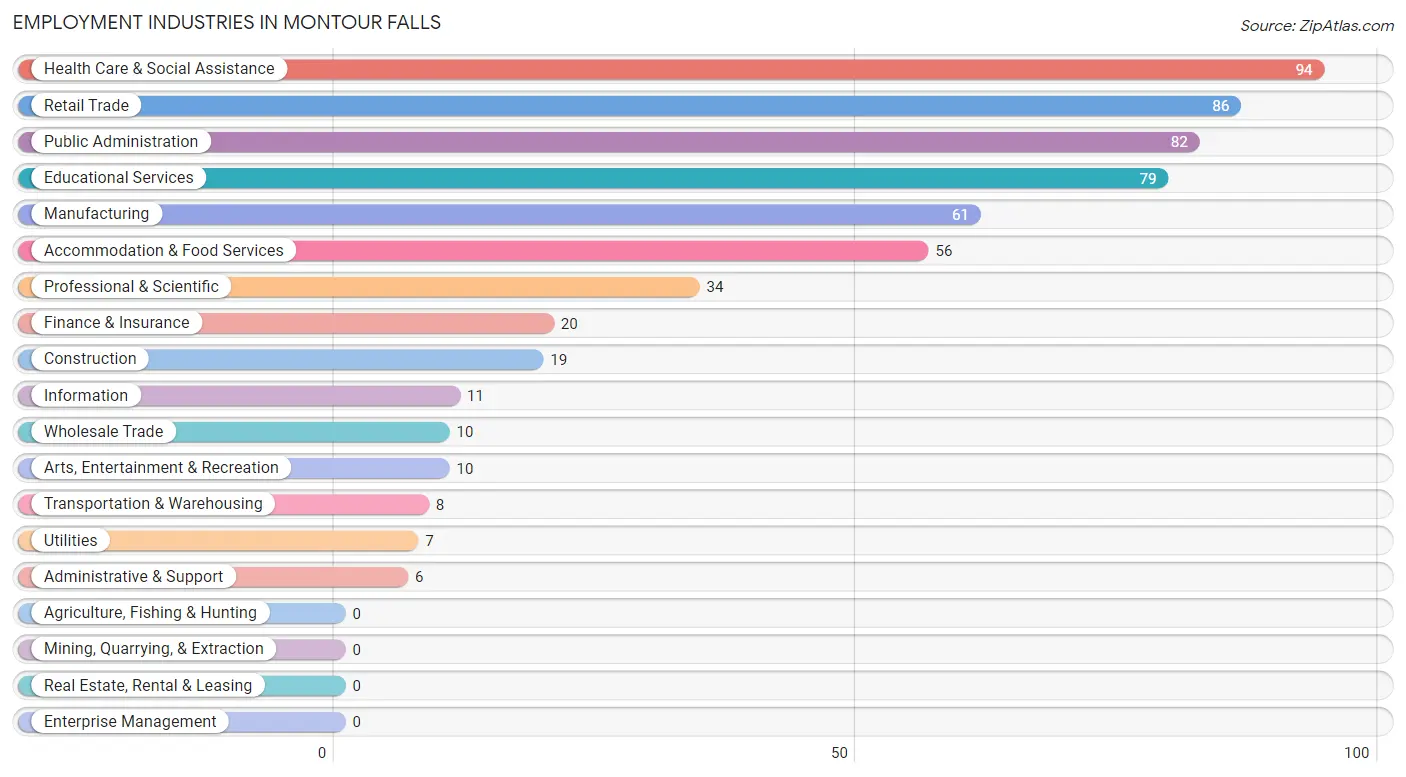
Employment Industries in Montour Falls
The major employment industries in Montour Falls include Health Care & Social Assistance (94 | 15.6%), Retail Trade (86 | 14.3%), Public Administration (82 | 13.6%), Educational Services (79 | 13.1%), and Manufacturing (61 | 10.1%).
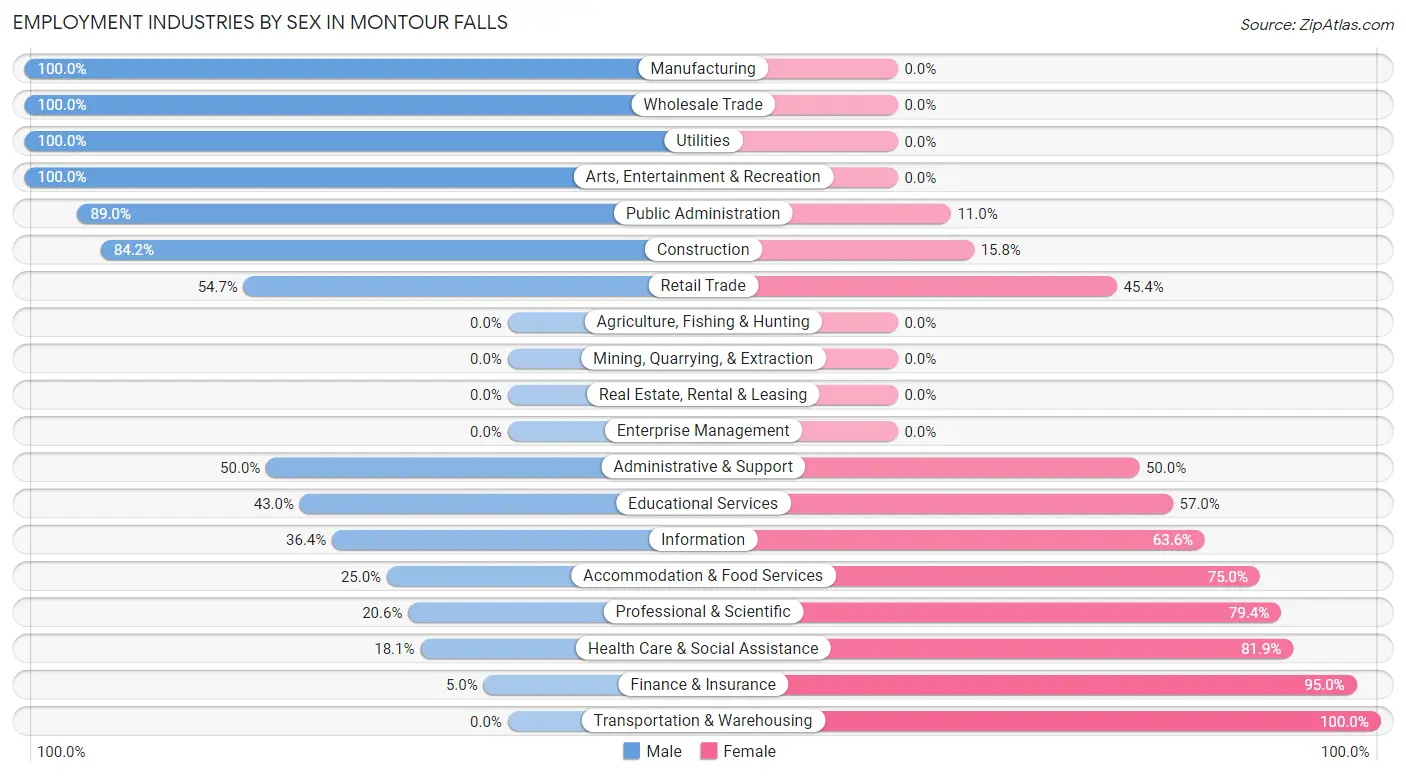
Employment Industries by Sex in Montour Falls
The Montour Falls industries that see more men than women are Manufacturing (100.0%), Wholesale Trade (100.0%), and Utilities (100.0%), whereas the industries that tend to have a higher number of women are Transportation & Warehousing (100.0%), Finance & Insurance (95.0%), and Health Care & Social Assistance (81.9%).
| Industry | Male | Female |
| Agriculture, Fishing & Hunting | 0 (0.0%) | 0 (0.0%) |
| Mining, Quarrying, & Extraction | 0 (0.0%) | 0 (0.0%) |
| Construction | 16 (84.2%) | 3 (15.8%) |
| Manufacturing | 61 (100.0%) | 0 (0.0%) |
| Wholesale Trade | 10 (100.0%) | 0 (0.0%) |
| Retail Trade | 47 (54.6%) | 39 (45.4%) |
| Transportation & Warehousing | 0 (0.0%) | 8 (100.0%) |
| Utilities | 7 (100.0%) | 0 (0.0%) |
| Information | 4 (36.4%) | 7 (63.6%) |
| Finance & Insurance | 1 (5.0%) | 19 (95.0%) |
| Real Estate, Rental & Leasing | 0 (0.0%) | 0 (0.0%) |
| Professional & Scientific | 7 (20.6%) | 27 (79.4%) |
| Enterprise Management | 0 (0.0%) | 0 (0.0%) |
| Administrative & Support | 3 (50.0%) | 3 (50.0%) |
| Educational Services | 34 (43.0%) | 45 (57.0%) |
| Health Care & Social Assistance | 17 (18.1%) | 77 (81.9%) |
| Arts, Entertainment & Recreation | 10 (100.0%) | 0 (0.0%) |
| Accommodation & Food Services | 14 (25.0%) | 42 (75.0%) |
| Public Administration | 73 (89.0%) | 9 (11.0%) |
| Total | 306 (50.7%) | 297 (49.2%) |
Education in Montour Falls
School Enrollment in Montour Falls
The most common levels of schooling among the 327 students in Montour Falls are elementary school (95 | 29.0%), middle school (82 | 25.1%), and high school (70 | 21.4%).
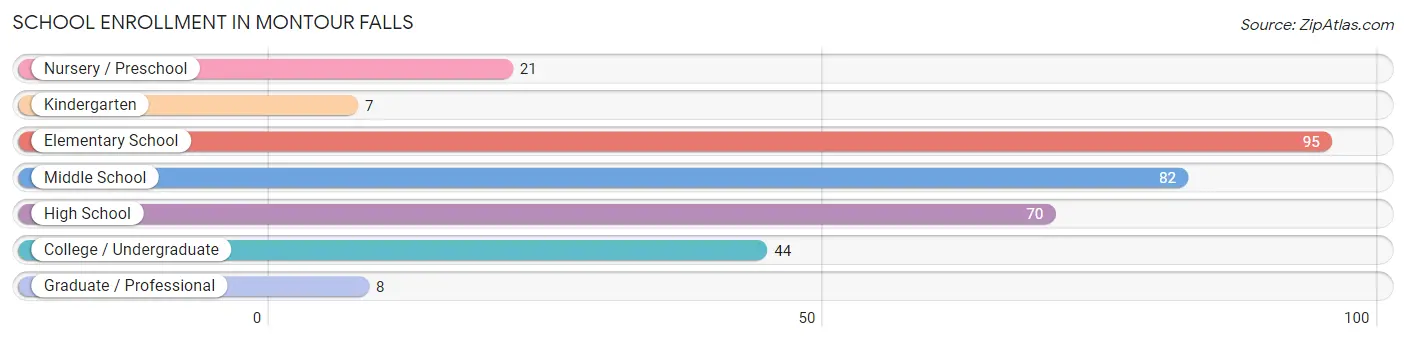
| School Level | # Students | % Students |
| Nursery / Preschool | 21 | 6.4% |
| Kindergarten | 7 | 2.1% |
| Elementary School | 95 | 29.0% |
| Middle School | 82 | 25.1% |
| High School | 70 | 21.4% |
| College / Undergraduate | 44 | 13.5% |
| Graduate / Professional | 8 | 2.5% |
| Total | 327 | 100.0% |
School Enrollment by Age by Funding Source in Montour Falls
Out of a total of 327 students who are enrolled in schools in Montour Falls, 29 (8.9%) attend a private institution, while the remaining 298 (91.1%) are enrolled in public schools. The age group of 25 to 34 year olds has the highest likelihood of being enrolled in private schools, with 4 (100.0% in the age bracket) enrolled. Conversely, the age group of 3 to 4 year olds has the lowest likelihood of being enrolled in a private school, with 20 (100.0% in the age bracket) attending a public institution.
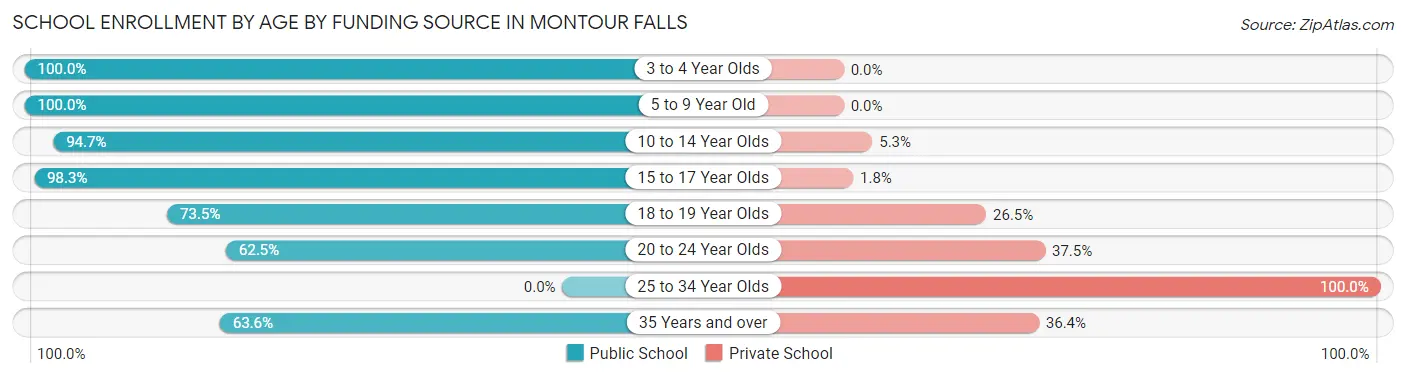
| Age Bracket | Public School | Private School |
| 3 to 4 Year Olds | 20 (100.0%) | 0 (0.0%) |
| 5 to 9 Year Old | 103 (100.0%) | 0 (0.0%) |
| 10 to 14 Year Olds | 71 (94.7%) | 4 (5.3%) |
| 15 to 17 Year Olds | 56 (98.3%) | 1 (1.8%) |
| 18 to 19 Year Olds | 36 (73.5%) | 13 (26.5%) |
| 20 to 24 Year Olds | 5 (62.5%) | 3 (37.5%) |
| 25 to 34 Year Olds | 0 (0.0%) | 4 (100.0%) |
| 35 Years and over | 7 (63.6%) | 4 (36.4%) |
| Total | 298 (91.1%) | 29 (8.9%) |
Educational Attainment by Field of Study in Montour Falls
Education (89 | 30.8%), business (36 | 12.5%), science & technology (28 | 9.7%), bio, nature & agricultural (21 | 7.3%), and psychology (16 | 5.5%) are the most common fields of study among 289 individuals in Montour Falls who have obtained a bachelor's degree or higher.
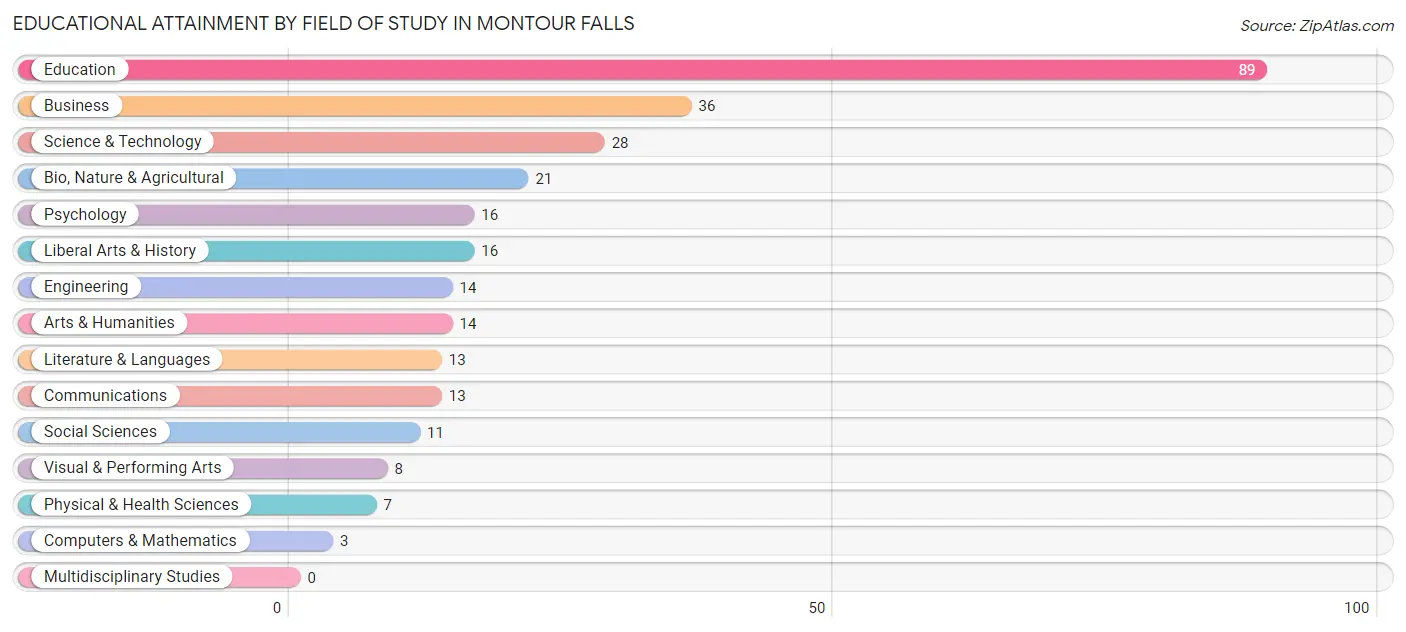
| Field of Study | # Graduates | % Graduates |
| Computers & Mathematics | 3 | 1.0% |
| Bio, Nature & Agricultural | 21 | 7.3% |
| Physical & Health Sciences | 7 | 2.4% |
| Psychology | 16 | 5.5% |
| Social Sciences | 11 | 3.8% |
| Engineering | 14 | 4.8% |
| Multidisciplinary Studies | 0 | 0.0% |
| Science & Technology | 28 | 9.7% |
| Business | 36 | 12.5% |
| Education | 89 | 30.8% |
| Literature & Languages | 13 | 4.5% |
| Liberal Arts & History | 16 | 5.5% |
| Visual & Performing Arts | 8 | 2.8% |
| Communications | 13 | 4.5% |
| Arts & Humanities | 14 | 4.8% |
| Total | 289 | 100.0% |
Transportation & Commute in Montour Falls
Vehicle Availability by Sex in Montour Falls
The most prevalent vehicle ownership categories in Montour Falls are males with 2 vehicles (139, accounting for 47.0%) and females with 2 vehicles (99, making up 47.1%).
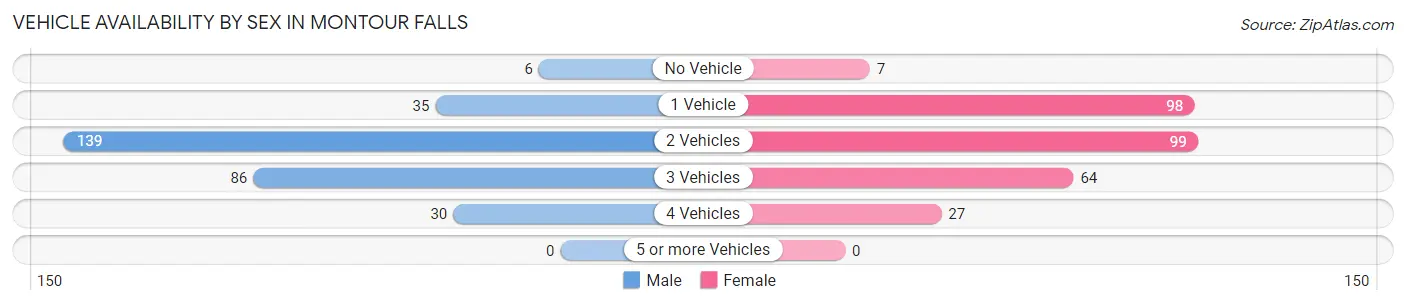
| Vehicles Available | Male | Female |
| No Vehicle | 6 (2.0%) | 7 (2.4%) |
| 1 Vehicle | 35 (11.8%) | 98 (33.2%) |
| 2 Vehicles | 139 (47.0%) | 99 (33.6%) |
| 3 Vehicles | 86 (29.0%) | 64 (21.7%) |
| 4 Vehicles | 30 (10.1%) | 27 (9.1%) |
| 5 or more Vehicles | 0 (0.0%) | 0 (0.0%) |
| Total | 296 (100.0%) | 295 (100.0%) |
Commute Time in Montour Falls
The most frequently occuring commute durations in Montour Falls are less than 5 minutes (121 commuters, 23.2%), 10 to 14 minutes (120 commuters, 23.0%), and 45 to 59 minutes (58 commuters, 11.1%).
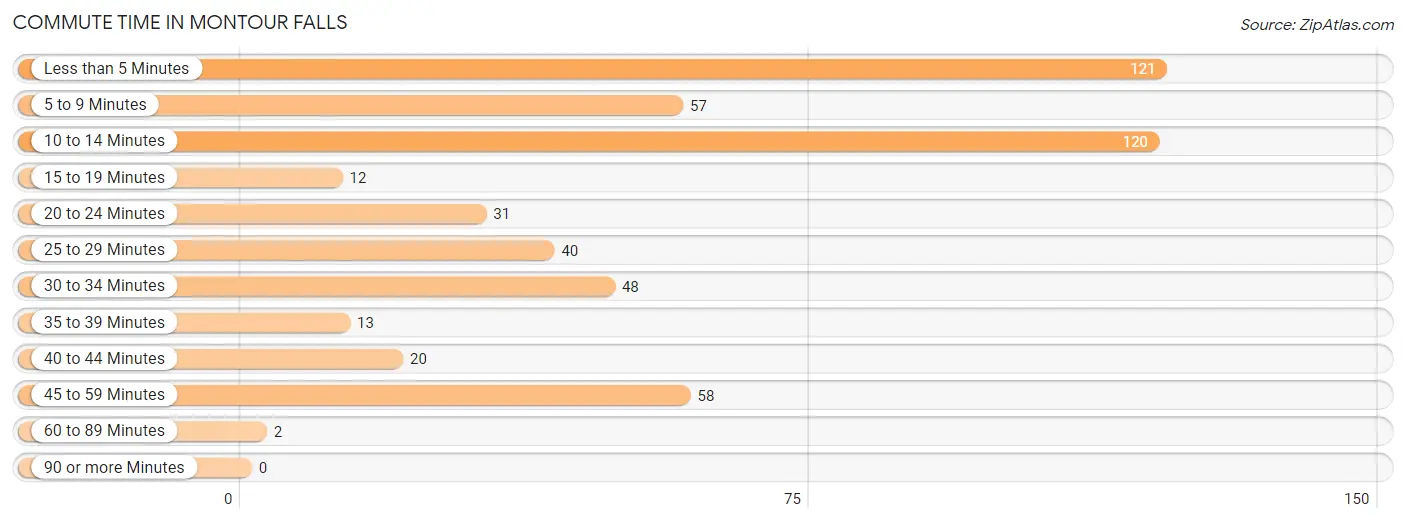
| Commute Time | # Commuters | % Commuters |
| Less than 5 Minutes | 121 | 23.2% |
| 5 to 9 Minutes | 57 | 10.9% |
| 10 to 14 Minutes | 120 | 23.0% |
| 15 to 19 Minutes | 12 | 2.3% |
| 20 to 24 Minutes | 31 | 5.9% |
| 25 to 29 Minutes | 40 | 7.7% |
| 30 to 34 Minutes | 48 | 9.2% |
| 35 to 39 Minutes | 13 | 2.5% |
| 40 to 44 Minutes | 20 | 3.8% |
| 45 to 59 Minutes | 58 | 11.1% |
| 60 to 89 Minutes | 2 | 0.4% |
| 90 or more Minutes | 0 | 0.0% |
Commute Time by Sex in Montour Falls
The most common commute times in Montour Falls are less than 5 minutes (76 commuters, 28.1%) for males and 10 to 14 minutes (89 commuters, 35.3%) for females.
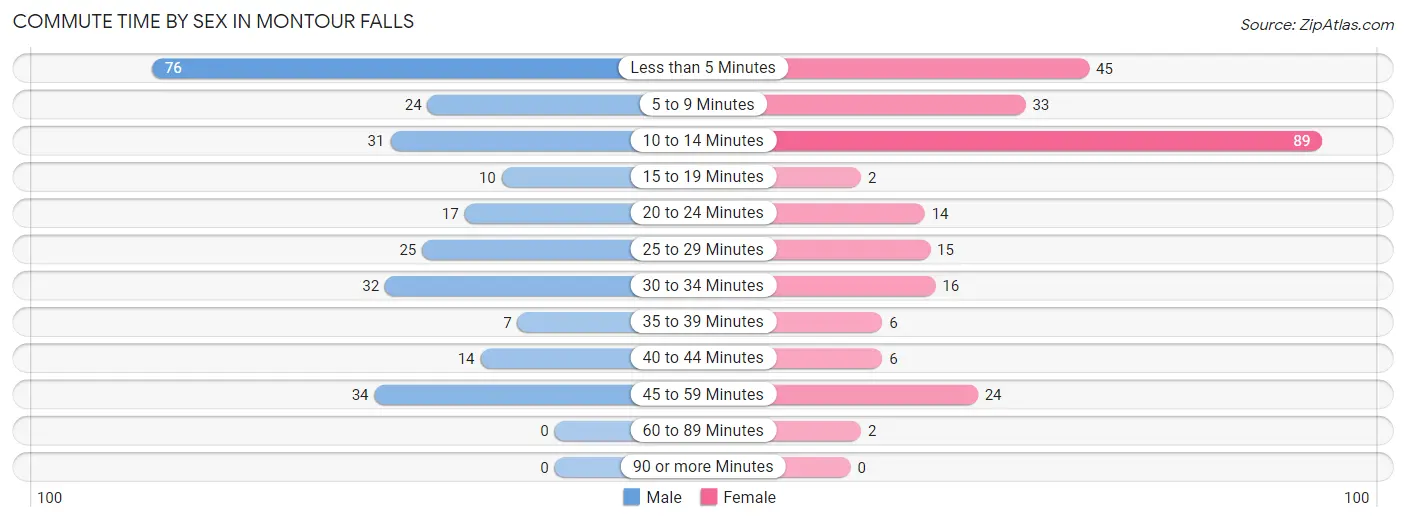
| Commute Time | Male | Female |
| Less than 5 Minutes | 76 (28.1%) | 45 (17.9%) |
| 5 to 9 Minutes | 24 (8.9%) | 33 (13.1%) |
| 10 to 14 Minutes | 31 (11.5%) | 89 (35.3%) |
| 15 to 19 Minutes | 10 (3.7%) | 2 (0.8%) |
| 20 to 24 Minutes | 17 (6.3%) | 14 (5.6%) |
| 25 to 29 Minutes | 25 (9.3%) | 15 (5.9%) |
| 30 to 34 Minutes | 32 (11.8%) | 16 (6.4%) |
| 35 to 39 Minutes | 7 (2.6%) | 6 (2.4%) |
| 40 to 44 Minutes | 14 (5.2%) | 6 (2.4%) |
| 45 to 59 Minutes | 34 (12.6%) | 24 (9.5%) |
| 60 to 89 Minutes | 0 (0.0%) | 2 (0.8%) |
| 90 or more Minutes | 0 (0.0%) | 0 (0.0%) |
Time of Departure to Work by Sex in Montour Falls
The most frequent times of departure to work in Montour Falls are 5:30 AM to 5:59 AM (71, 26.3%) for males and 12:00 PM to 3:59 PM (50, 19.8%) for females.
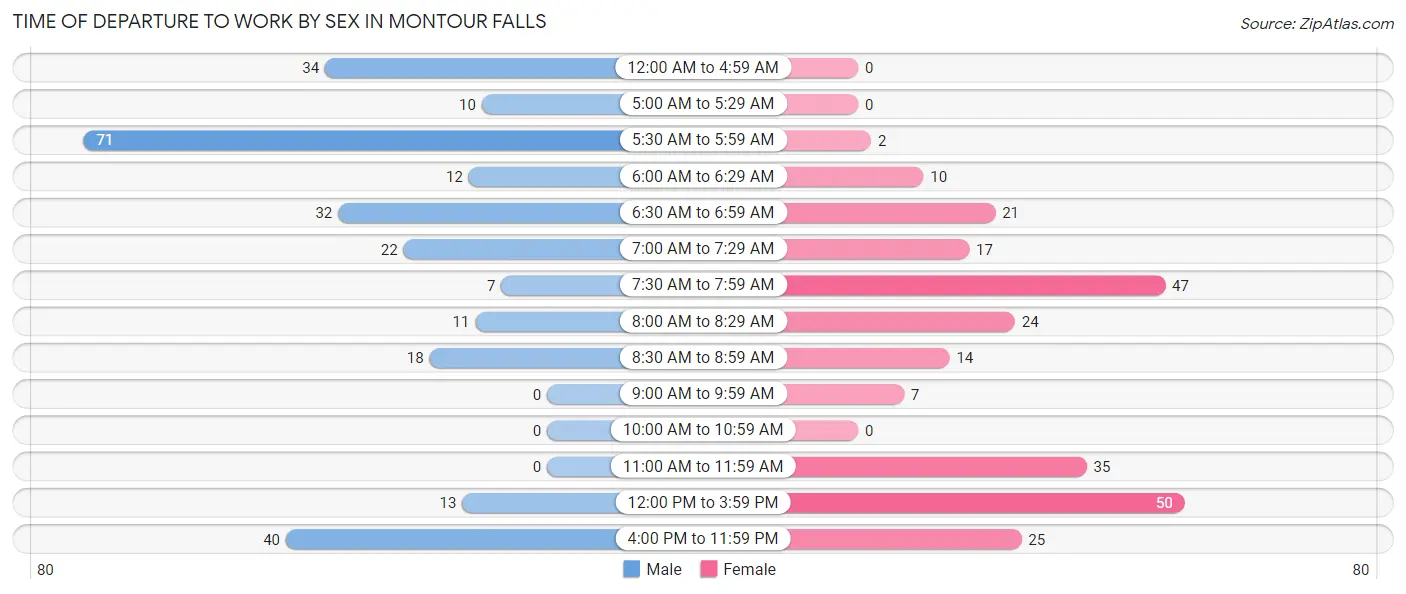
| Time of Departure | Male | Female |
| 12:00 AM to 4:59 AM | 34 (12.6%) | 0 (0.0%) |
| 5:00 AM to 5:29 AM | 10 (3.7%) | 0 (0.0%) |
| 5:30 AM to 5:59 AM | 71 (26.3%) | 2 (0.8%) |
| 6:00 AM to 6:29 AM | 12 (4.4%) | 10 (4.0%) |
| 6:30 AM to 6:59 AM | 32 (11.8%) | 21 (8.3%) |
| 7:00 AM to 7:29 AM | 22 (8.2%) | 17 (6.8%) |
| 7:30 AM to 7:59 AM | 7 (2.6%) | 47 (18.6%) |
| 8:00 AM to 8:29 AM | 11 (4.1%) | 24 (9.5%) |
| 8:30 AM to 8:59 AM | 18 (6.7%) | 14 (5.6%) |
| 9:00 AM to 9:59 AM | 0 (0.0%) | 7 (2.8%) |
| 10:00 AM to 10:59 AM | 0 (0.0%) | 0 (0.0%) |
| 11:00 AM to 11:59 AM | 0 (0.0%) | 35 (13.9%) |
| 12:00 PM to 3:59 PM | 13 (4.8%) | 50 (19.8%) |
| 4:00 PM to 11:59 PM | 40 (14.8%) | 25 (9.9%) |
| Total | 270 (100.0%) | 252 (100.0%) |
Housing Occupancy in Montour Falls
Occupancy by Ownership in Montour Falls
Of the total 724 dwellings in Montour Falls, owner-occupied units account for 462 (63.8%), while renter-occupied units make up 262 (36.2%).
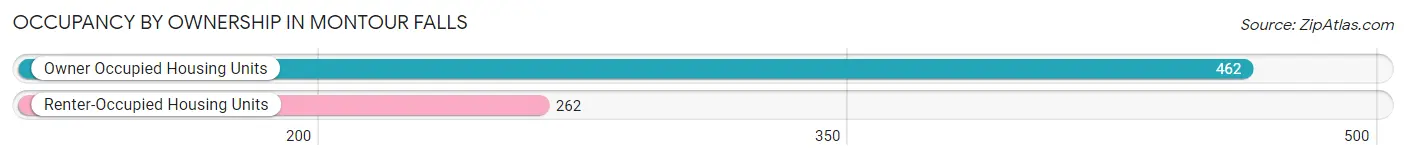
| Occupancy | # Housing Units | % Housing Units |
| Owner Occupied Housing Units | 462 | 63.8% |
| Renter-Occupied Housing Units | 262 | 36.2% |
| Total Occupied Housing Units | 724 | 100.0% |
Occupancy by Household Size in Montour Falls
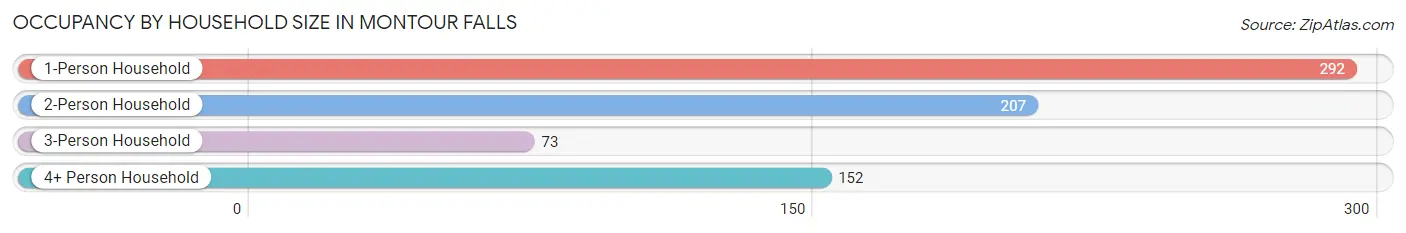
| Household Size | # Housing Units | % Housing Units |
| 1-Person Household | 292 | 40.3% |
| 2-Person Household | 207 | 28.6% |
| 3-Person Household | 73 | 10.1% |
| 4+ Person Household | 152 | 21.0% |
| Total Housing Units | 724 | 100.0% |
Occupancy by Ownership by Household Size in Montour Falls
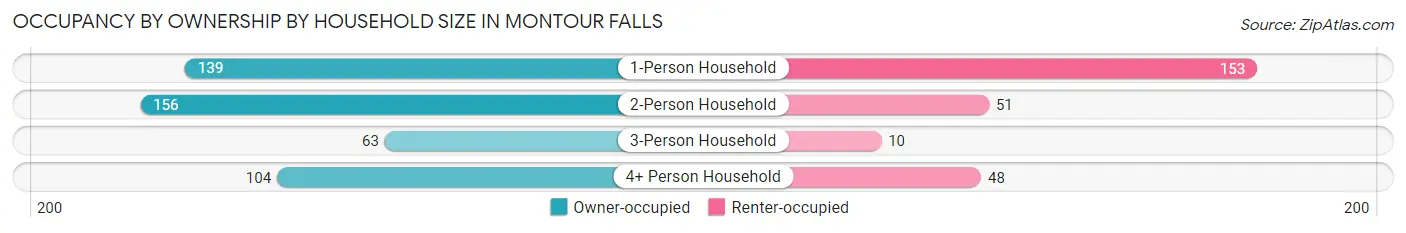
| Household Size | Owner-occupied | Renter-occupied |
| 1-Person Household | 139 (47.6%) | 153 (52.4%) |
| 2-Person Household | 156 (75.4%) | 51 (24.6%) |
| 3-Person Household | 63 (86.3%) | 10 (13.7%) |
| 4+ Person Household | 104 (68.4%) | 48 (31.6%) |
| Total Housing Units | 462 (63.8%) | 262 (36.2%) |
Occupancy by Educational Attainment in Montour Falls
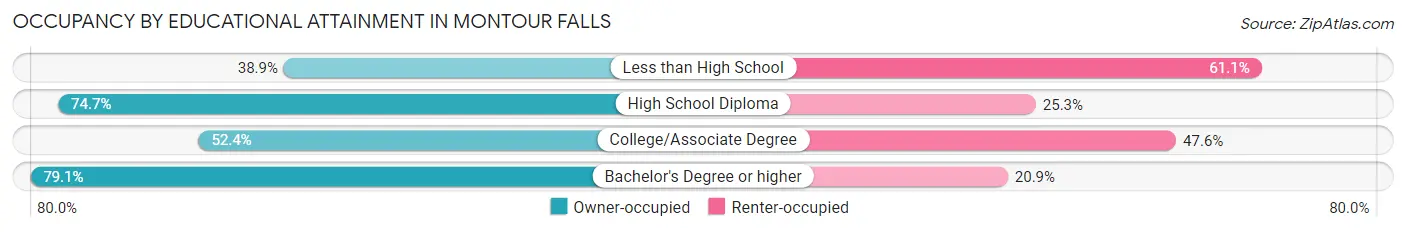
| Household Size | Owner-occupied | Renter-occupied |
| Less than High School | 28 (38.9%) | 44 (61.1%) |
| High School Diploma | 168 (74.7%) | 57 (25.3%) |
| College/Associate Degree | 141 (52.4%) | 128 (47.6%) |
| Bachelor's Degree or higher | 125 (79.1%) | 33 (20.9%) |
Occupancy by Age of Householder in Montour Falls
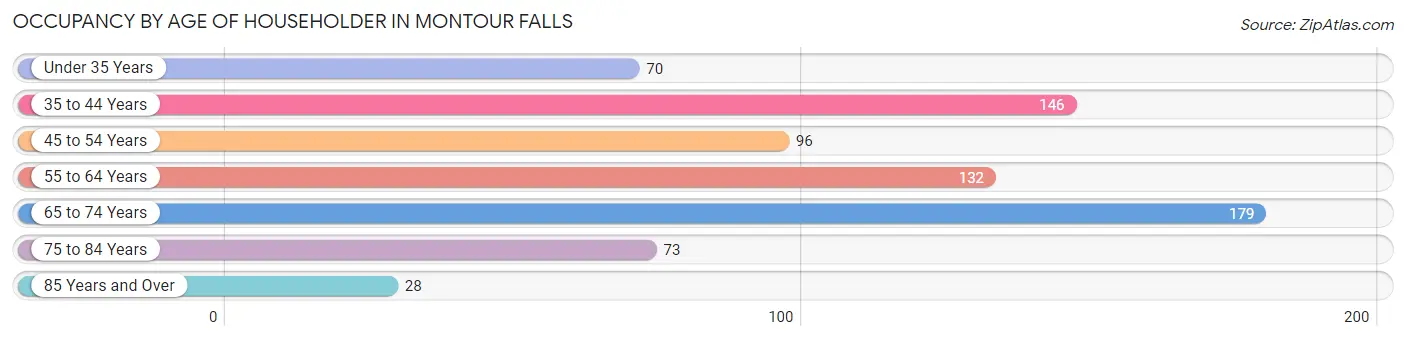
| Age Bracket | # Households | % Households |
| Under 35 Years | 70 | 9.7% |
| 35 to 44 Years | 146 | 20.2% |
| 45 to 54 Years | 96 | 13.3% |
| 55 to 64 Years | 132 | 18.2% |
| 65 to 74 Years | 179 | 24.7% |
| 75 to 84 Years | 73 | 10.1% |
| 85 Years and Over | 28 | 3.9% |
| Total | 724 | 100.0% |
Housing Finances in Montour Falls
Median Income by Occupancy in Montour Falls
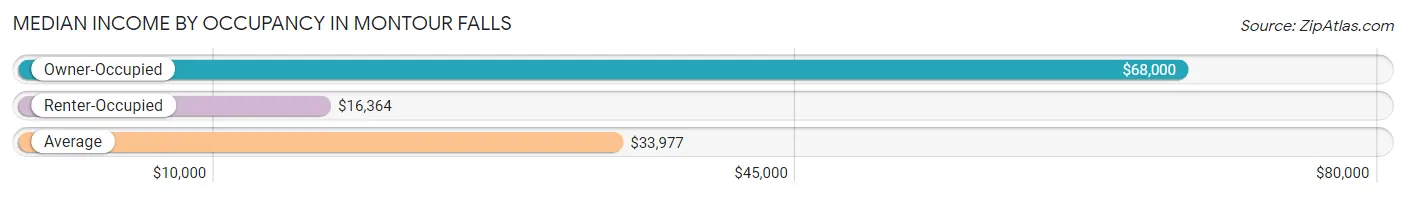
| Occupancy Type | # Households | Median Income |
| Owner-Occupied | 462 (63.8%) | $68,000 |
| Renter-Occupied | 262 (36.2%) | $16,364 |
| Average | 724 (100.0%) | $33,977 |
Occupancy by Householder Income Bracket in Montour Falls
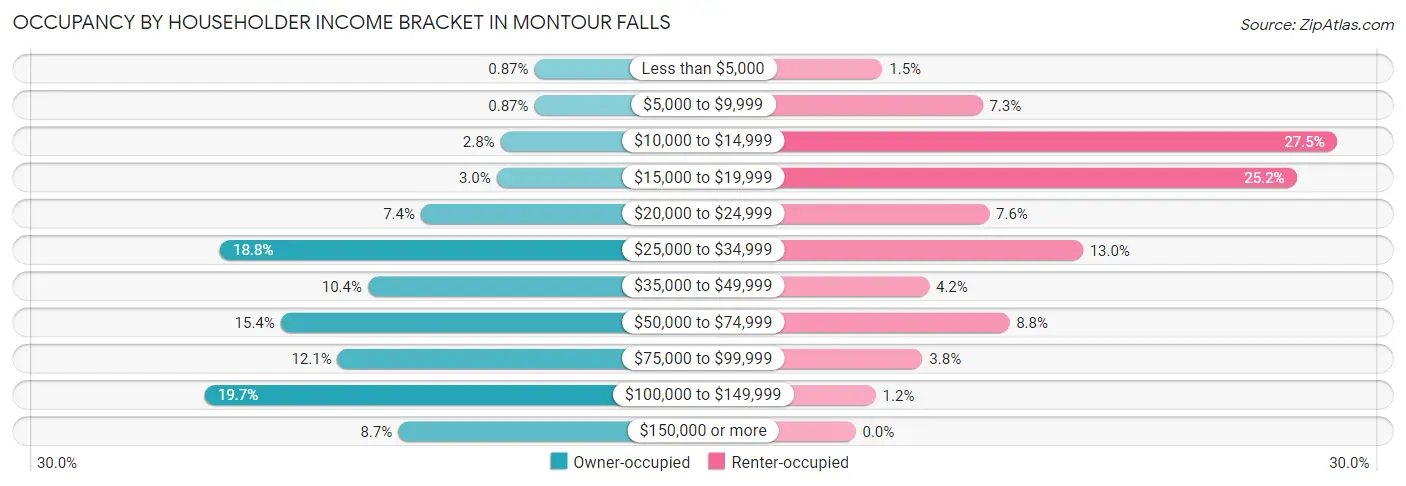
| Income Bracket | Owner-occupied | Renter-occupied |
| Less than $5,000 | 4 (0.9%) | 4 (1.5%) |
| $5,000 to $9,999 | 4 (0.9%) | 19 (7.2%) |
| $10,000 to $14,999 | 13 (2.8%) | 72 (27.5%) |
| $15,000 to $19,999 | 14 (3.0%) | 66 (25.2%) |
| $20,000 to $24,999 | 34 (7.4%) | 20 (7.6%) |
| $25,000 to $34,999 | 87 (18.8%) | 34 (13.0%) |
| $35,000 to $49,999 | 48 (10.4%) | 11 (4.2%) |
| $50,000 to $74,999 | 71 (15.4%) | 23 (8.8%) |
| $75,000 to $99,999 | 56 (12.1%) | 10 (3.8%) |
| $100,000 to $149,999 | 91 (19.7%) | 3 (1.1%) |
| $150,000 or more | 40 (8.7%) | 0 (0.0%) |
| Total | 462 (100.0%) | 262 (100.0%) |
Monthly Housing Cost Tiers in Montour Falls
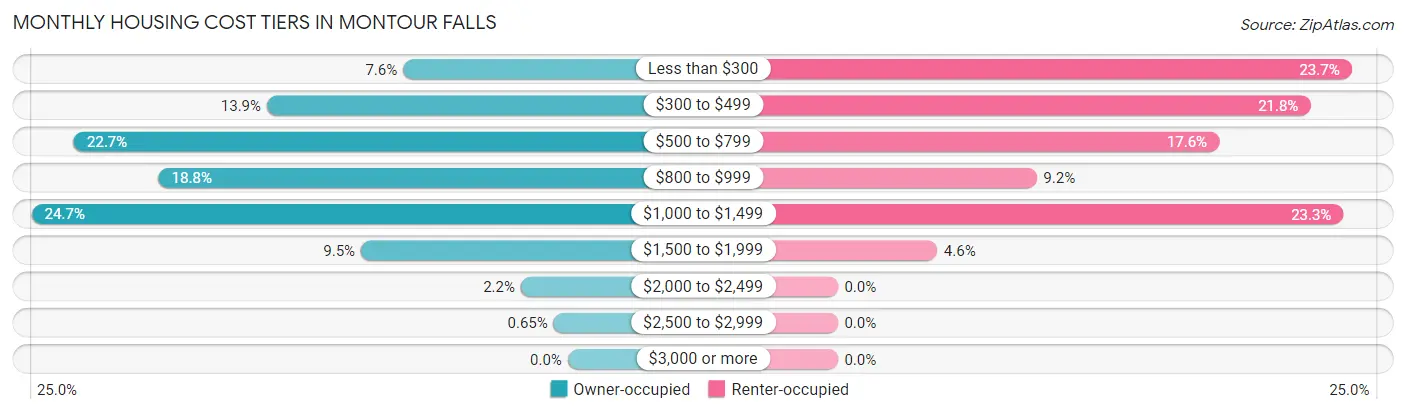
| Monthly Cost | Owner-occupied | Renter-occupied |
| Less than $300 | 35 (7.6%) | 62 (23.7%) |
| $300 to $499 | 64 (13.9%) | 57 (21.8%) |
| $500 to $799 | 105 (22.7%) | 46 (17.6%) |
| $800 to $999 | 87 (18.8%) | 24 (9.2%) |
| $1,000 to $1,499 | 114 (24.7%) | 61 (23.3%) |
| $1,500 to $1,999 | 44 (9.5%) | 12 (4.6%) |
| $2,000 to $2,499 | 10 (2.2%) | 0 (0.0%) |
| $2,500 to $2,999 | 3 (0.6%) | 0 (0.0%) |
| $3,000 or more | 0 (0.0%) | 0 (0.0%) |
| Total | 462 (100.0%) | 262 (100.0%) |
Physical Housing Characteristics in Montour Falls
Housing Structures in Montour Falls
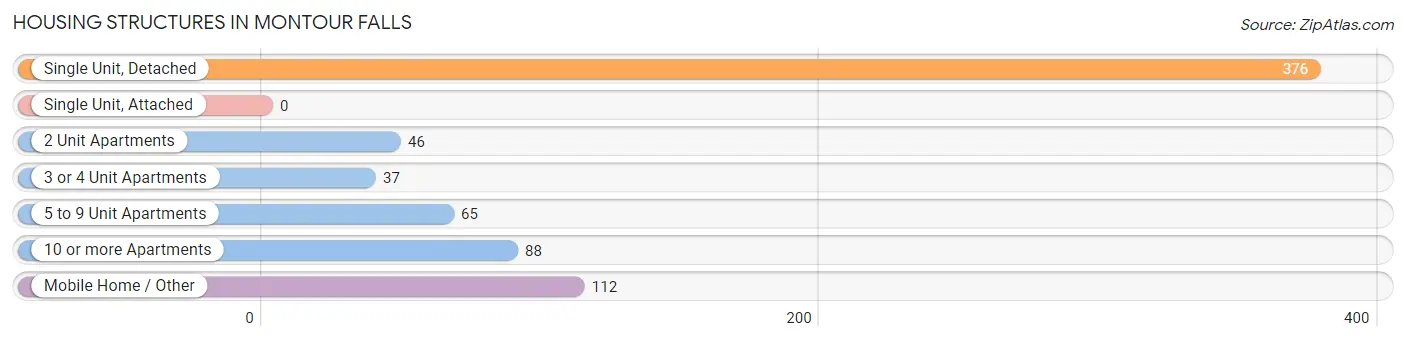
| Structure Type | # Housing Units | % Housing Units |
| Single Unit, Detached | 376 | 51.9% |
| Single Unit, Attached | 0 | 0.0% |
| 2 Unit Apartments | 46 | 6.4% |
| 3 or 4 Unit Apartments | 37 | 5.1% |
| 5 to 9 Unit Apartments | 65 | 9.0% |
| 10 or more Apartments | 88 | 12.1% |
| Mobile Home / Other | 112 | 15.5% |
| Total | 724 | 100.0% |
Housing Structures by Occupancy in Montour Falls
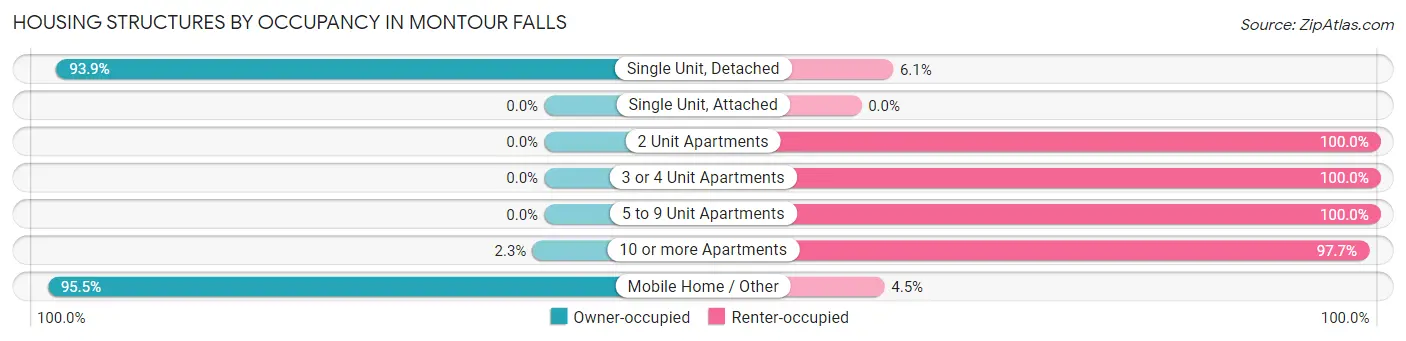
| Structure Type | Owner-occupied | Renter-occupied |
| Single Unit, Detached | 353 (93.9%) | 23 (6.1%) |
| Single Unit, Attached | 0 (0.0%) | 0 (0.0%) |
| 2 Unit Apartments | 0 (0.0%) | 46 (100.0%) |
| 3 or 4 Unit Apartments | 0 (0.0%) | 37 (100.0%) |
| 5 to 9 Unit Apartments | 0 (0.0%) | 65 (100.0%) |
| 10 or more Apartments | 2 (2.3%) | 86 (97.7%) |
| Mobile Home / Other | 107 (95.5%) | 5 (4.5%) |
| Total | 462 (63.8%) | 262 (36.2%) |
Housing Structures by Number of Rooms in Montour Falls
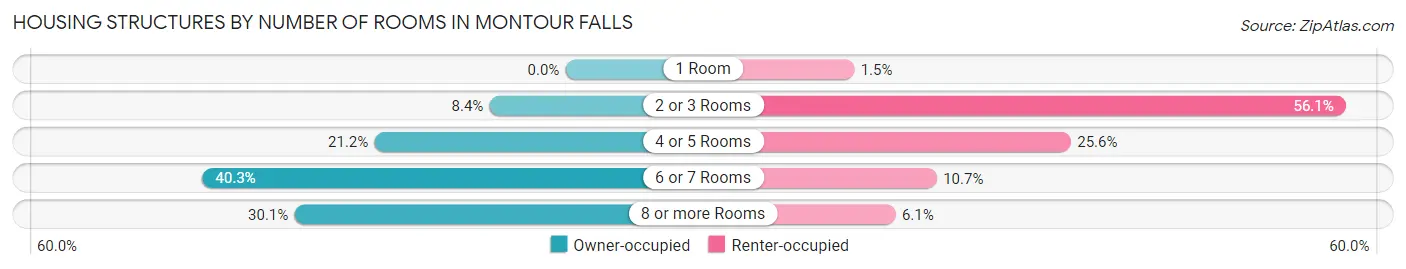
| Number of Rooms | Owner-occupied | Renter-occupied |
| 1 Room | 0 (0.0%) | 4 (1.5%) |
| 2 or 3 Rooms | 39 (8.4%) | 147 (56.1%) |
| 4 or 5 Rooms | 98 (21.2%) | 67 (25.6%) |
| 6 or 7 Rooms | 186 (40.3%) | 28 (10.7%) |
| 8 or more Rooms | 139 (30.1%) | 16 (6.1%) |
| Total | 462 (100.0%) | 262 (100.0%) |
Housing Structure by Heating Type in Montour Falls
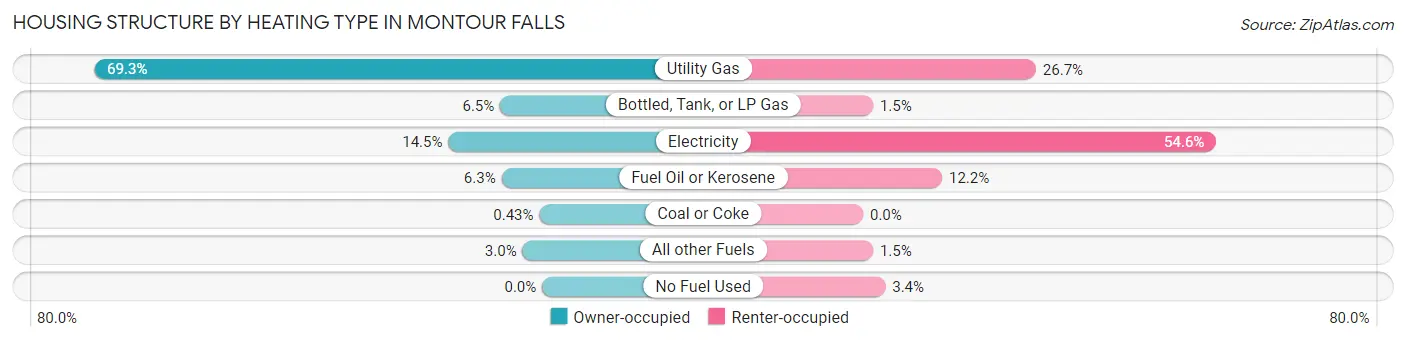
| Heating Type | Owner-occupied | Renter-occupied |
| Utility Gas | 320 (69.3%) | 70 (26.7%) |
| Bottled, Tank, or LP Gas | 30 (6.5%) | 4 (1.5%) |
| Electricity | 67 (14.5%) | 143 (54.6%) |
| Fuel Oil or Kerosene | 29 (6.3%) | 32 (12.2%) |
| Coal or Coke | 2 (0.4%) | 0 (0.0%) |
| All other Fuels | 14 (3.0%) | 4 (1.5%) |
| No Fuel Used | 0 (0.0%) | 9 (3.4%) |
| Total | 462 (100.0%) | 262 (100.0%) |
Household Vehicle Usage in Montour Falls
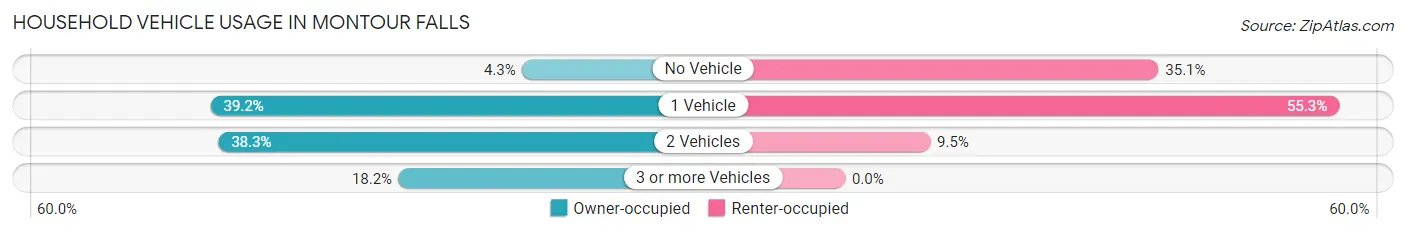
| Vehicles per Household | Owner-occupied | Renter-occupied |
| No Vehicle | 20 (4.3%) | 92 (35.1%) |
| 1 Vehicle | 181 (39.2%) | 145 (55.3%) |
| 2 Vehicles | 177 (38.3%) | 25 (9.5%) |
| 3 or more Vehicles | 84 (18.2%) | 0 (0.0%) |
| Total | 462 (100.0%) | 262 (100.0%) |
Real Estate & Mortgages in Montour Falls
Real Estate and Mortgage Overview in Montour Falls
| Characteristic | Without Mortgage | With Mortgage |
| Housing Units | 241 | 221 |
| Median Property Value | $102,900 | $117,300 |
| Median Household Income | $38,646 | $20 |
| Monthly Housing Costs | $577 | $0 |
| Real Estate Taxes | $3,450 | $2 |
Property Value by Mortgage Status in Montour Falls
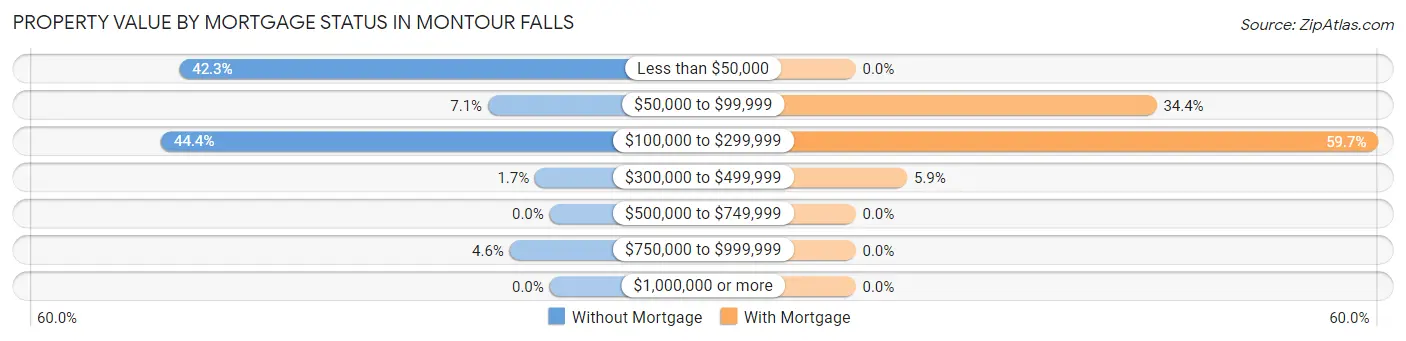
| Property Value | Without Mortgage | With Mortgage |
| Less than $50,000 | 102 (42.3%) | 0 (0.0%) |
| $50,000 to $99,999 | 17 (7.0%) | 76 (34.4%) |
| $100,000 to $299,999 | 107 (44.4%) | 132 (59.7%) |
| $300,000 to $499,999 | 4 (1.7%) | 13 (5.9%) |
| $500,000 to $749,999 | 0 (0.0%) | 0 (0.0%) |
| $750,000 to $999,999 | 11 (4.6%) | 0 (0.0%) |
| $1,000,000 or more | 0 (0.0%) | 0 (0.0%) |
| Total | 241 (100.0%) | 221 (100.0%) |
Household Income by Mortgage Status in Montour Falls
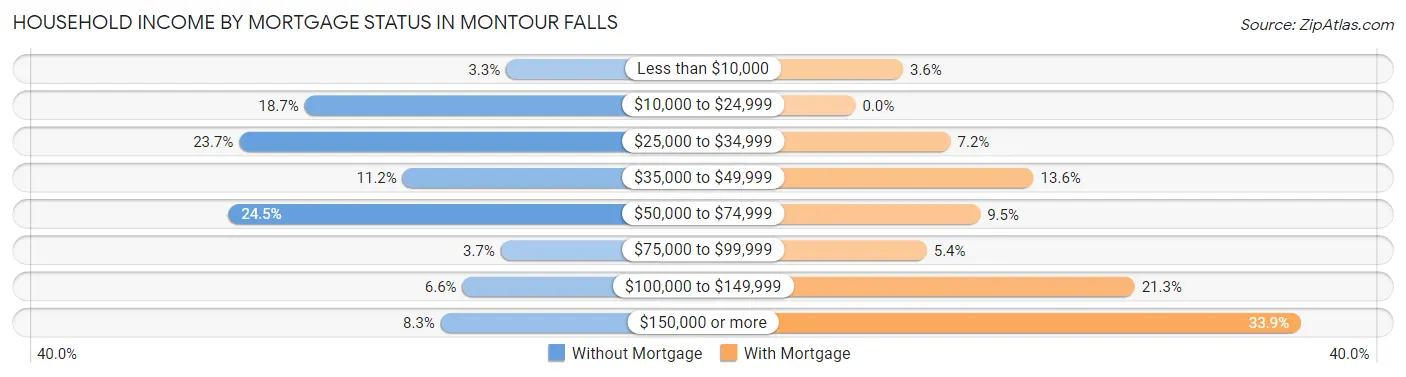
| Household Income | Without Mortgage | With Mortgage |
| Less than $10,000 | 8 (3.3%) | 8 (3.6%) |
| $10,000 to $24,999 | 45 (18.7%) | 0 (0.0%) |
| $25,000 to $34,999 | 57 (23.6%) | 16 (7.2%) |
| $35,000 to $49,999 | 27 (11.2%) | 30 (13.6%) |
| $50,000 to $74,999 | 59 (24.5%) | 21 (9.5%) |
| $75,000 to $99,999 | 9 (3.7%) | 12 (5.4%) |
| $100,000 to $149,999 | 16 (6.6%) | 47 (21.3%) |
| $150,000 or more | 20 (8.3%) | 75 (33.9%) |
| Total | 241 (100.0%) | 221 (100.0%) |
Property Value to Household Income Ratio in Montour Falls
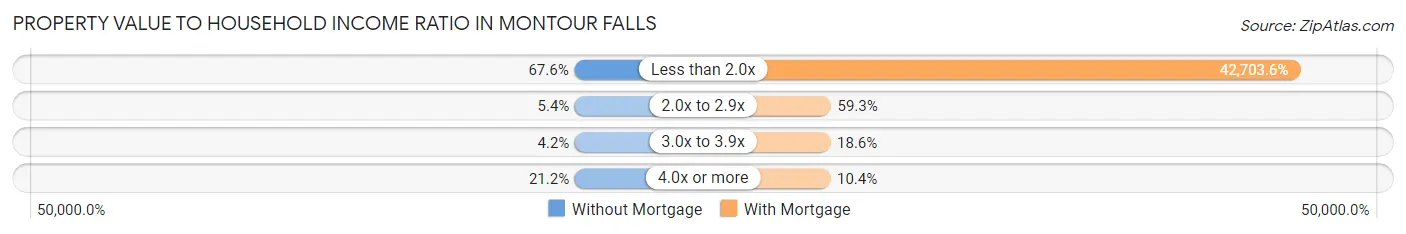
| Value-to-Income Ratio | Without Mortgage | With Mortgage |
| Less than 2.0x | 163 (67.6%) | 94,375 (42,703.6%) |
| 2.0x to 2.9x | 13 (5.4%) | 131 (59.3%) |
| 3.0x to 3.9x | 10 (4.2%) | 41 (18.5%) |
| 4.0x or more | 51 (21.2%) | 23 (10.4%) |
| Total | 241 (100.0%) | 221 (100.0%) |
Real Estate Taxes by Mortgage Status in Montour Falls
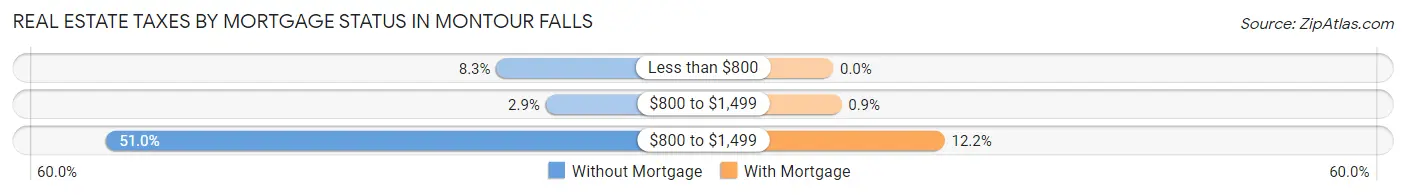
| Property Taxes | Without Mortgage | With Mortgage |
| Less than $800 | 20 (8.3%) | 0 (0.0%) |
| $800 to $1,499 | 7 (2.9%) | 2 (0.9%) |
| $800 to $1,499 | 123 (51.0%) | 27 (12.2%) |
| Total | 241 (100.0%) | 221 (100.0%) |
Health & Disability in Montour Falls
Health Insurance Coverage by Age in Montour Falls
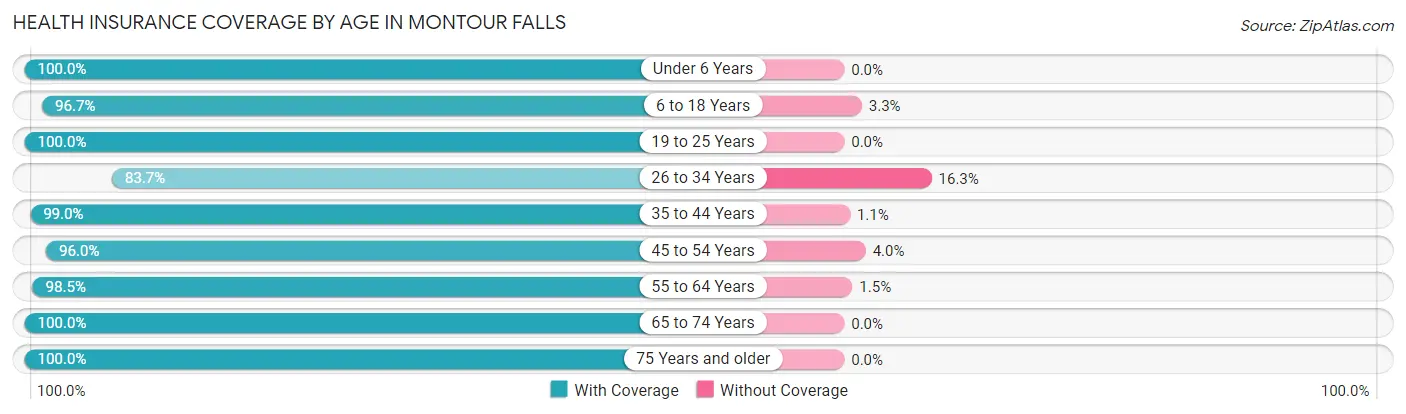
| Age Bracket | With Coverage | Without Coverage |
| Under 6 Years | 131 (100.0%) | 0 (0.0%) |
| 6 to 18 Years | 236 (96.7%) | 8 (3.3%) |
| 19 to 25 Years | 131 (100.0%) | 0 (0.0%) |
| 26 to 34 Years | 108 (83.7%) | 21 (16.3%) |
| 35 to 44 Years | 283 (99.0%) | 3 (1.1%) |
| 45 to 54 Years | 192 (96.0%) | 8 (4.0%) |
| 55 to 64 Years | 261 (98.5%) | 4 (1.5%) |
| 65 to 74 Years | 214 (100.0%) | 0 (0.0%) |
| 75 Years and older | 201 (100.0%) | 0 (0.0%) |
| Total | 1,757 (97.6%) | 44 (2.4%) |
Health Insurance Coverage by Citizenship Status in Montour Falls
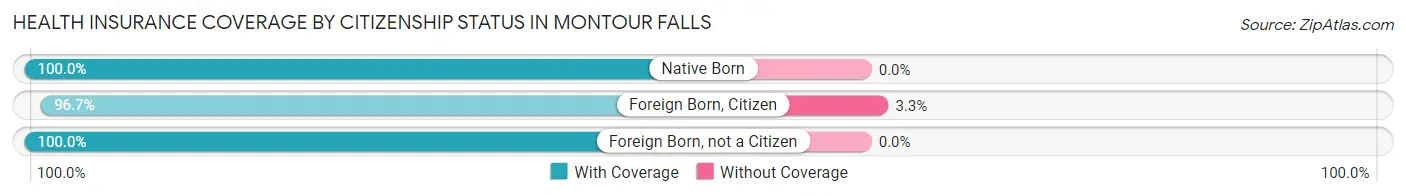
| Citizenship Status | With Coverage | Without Coverage |
| Native Born | 131 (100.0%) | 0 (0.0%) |
| Foreign Born, Citizen | 236 (96.7%) | 8 (3.3%) |
| Foreign Born, not a Citizen | 131 (100.0%) | 0 (0.0%) |
Health Insurance Coverage by Household Income in Montour Falls
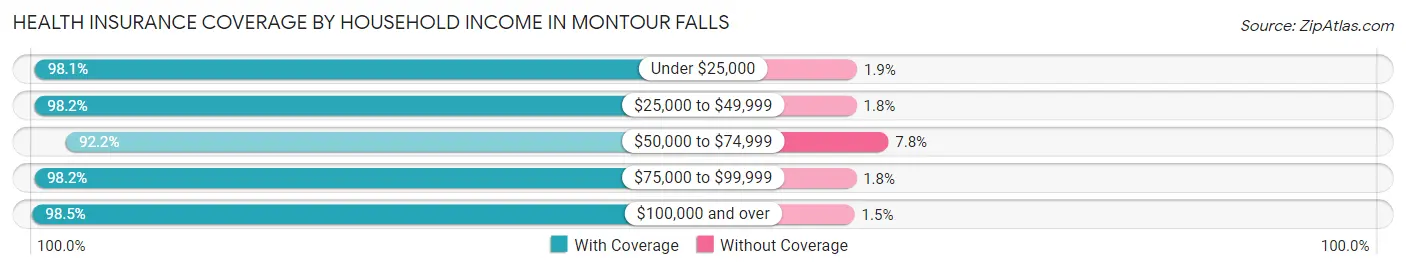
| Household Income | With Coverage | Without Coverage |
| Under $25,000 | 357 (98.1%) | 7 (1.9%) |
| $25,000 to $49,999 | 374 (98.2%) | 7 (1.8%) |
| $50,000 to $74,999 | 166 (92.2%) | 14 (7.8%) |
| $75,000 to $99,999 | 167 (98.2%) | 3 (1.8%) |
| $100,000 and over | 538 (98.5%) | 8 (1.5%) |
Public vs Private Health Insurance Coverage by Age in Montour Falls
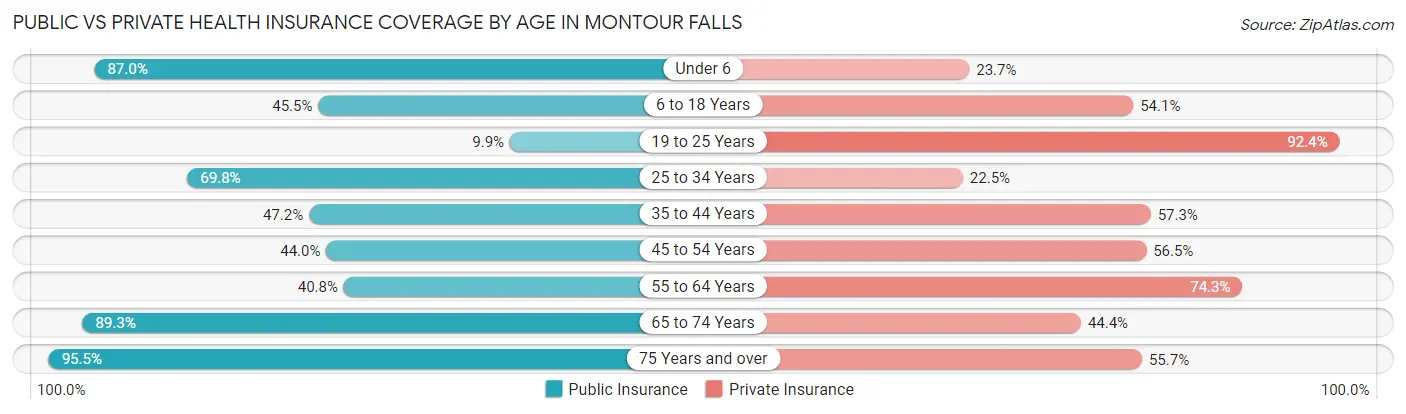
| Age Bracket | Public Insurance | Private Insurance |
| Under 6 | 114 (87.0%) | 31 (23.7%) |
| 6 to 18 Years | 111 (45.5%) | 132 (54.1%) |
| 19 to 25 Years | 13 (9.9%) | 121 (92.4%) |
| 25 to 34 Years | 90 (69.8%) | 29 (22.5%) |
| 35 to 44 Years | 135 (47.2%) | 164 (57.3%) |
| 45 to 54 Years | 88 (44.0%) | 113 (56.5%) |
| 55 to 64 Years | 108 (40.7%) | 197 (74.3%) |
| 65 to 74 Years | 191 (89.2%) | 95 (44.4%) |
| 75 Years and over | 192 (95.5%) | 112 (55.7%) |
| Total | 1,042 (57.9%) | 994 (55.2%) |
Disability Status by Sex by Age in Montour Falls
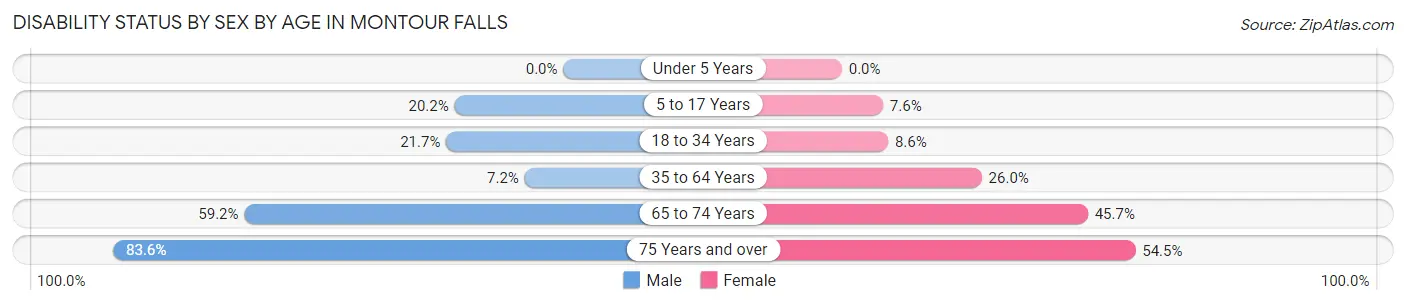
| Age Bracket | Male | Female |
| Under 5 Years | 0 (0.0%) | 0 (0.0%) |
| 5 to 17 Years | 20 (20.2%) | 10 (7.6%) |
| 18 to 34 Years | 30 (21.7%) | 12 (8.6%) |
| 35 to 64 Years | 26 (7.2%) | 101 (26.0%) |
| 65 to 74 Years | 45 (59.2%) | 63 (45.7%) |
| 75 Years and over | 56 (83.6%) | 73 (54.5%) |
Disability Class by Sex by Age in Montour Falls
Disability Class: Hearing Difficulty
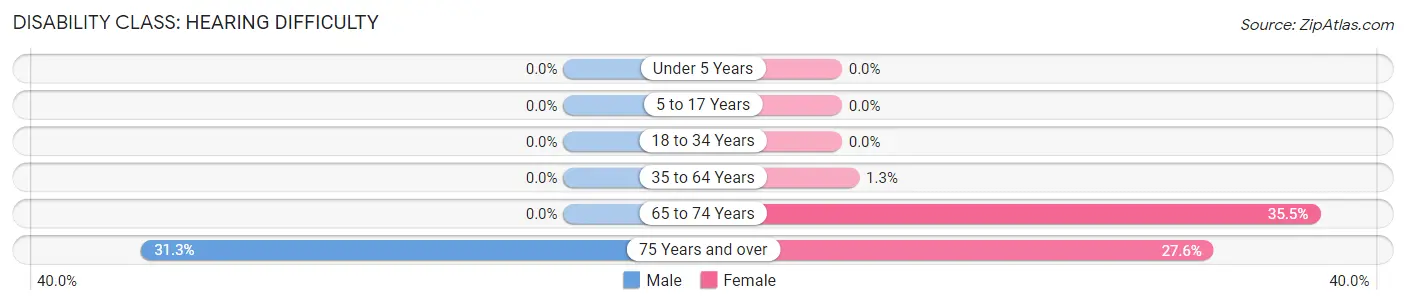
| Age Bracket | Male | Female |
| Under 5 Years | 0 (0.0%) | 0 (0.0%) |
| 5 to 17 Years | 0 (0.0%) | 0 (0.0%) |
| 18 to 34 Years | 0 (0.0%) | 0 (0.0%) |
| 35 to 64 Years | 0 (0.0%) | 5 (1.3%) |
| 65 to 74 Years | 0 (0.0%) | 49 (35.5%) |
| 75 Years and over | 21 (31.3%) | 37 (27.6%) |
Disability Class: Vision Difficulty
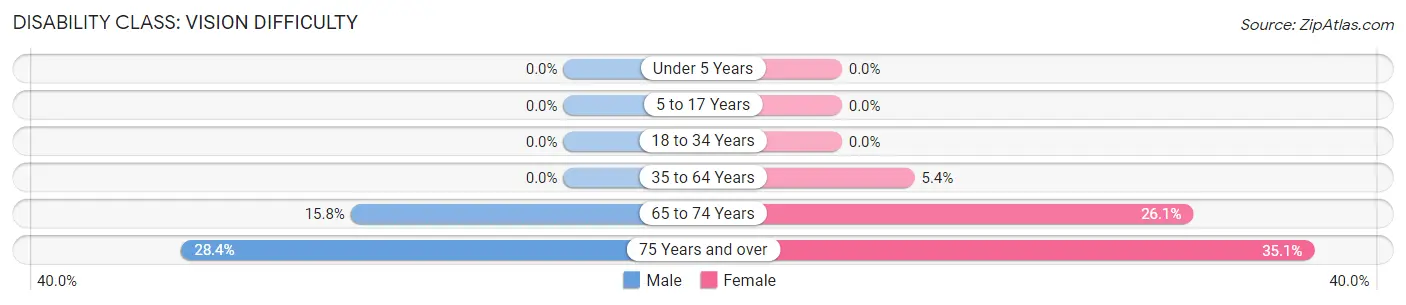
| Age Bracket | Male | Female |
| Under 5 Years | 0 (0.0%) | 0 (0.0%) |
| 5 to 17 Years | 0 (0.0%) | 0 (0.0%) |
| 18 to 34 Years | 0 (0.0%) | 0 (0.0%) |
| 35 to 64 Years | 0 (0.0%) | 21 (5.4%) |
| 65 to 74 Years | 12 (15.8%) | 36 (26.1%) |
| 75 Years and over | 19 (28.4%) | 47 (35.1%) |
Disability Class: Cognitive Difficulty
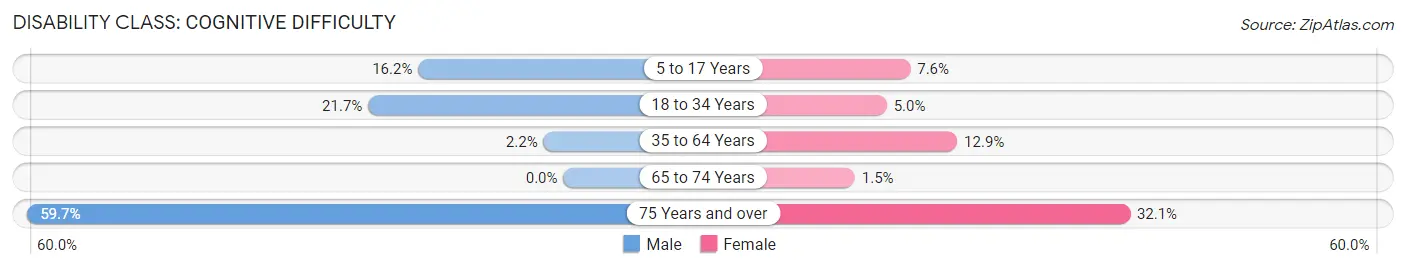
| Age Bracket | Male | Female |
| 5 to 17 Years | 16 (16.2%) | 10 (7.6%) |
| 18 to 34 Years | 30 (21.7%) | 7 (5.0%) |
| 35 to 64 Years | 8 (2.2%) | 50 (12.9%) |
| 65 to 74 Years | 0 (0.0%) | 2 (1.5%) |
| 75 Years and over | 40 (59.7%) | 43 (32.1%) |
Disability Class: Ambulatory Difficulty
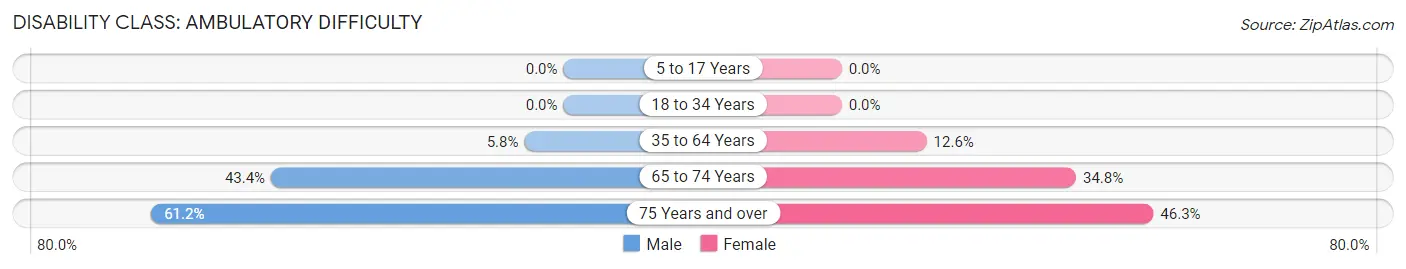
| Age Bracket | Male | Female |
| 5 to 17 Years | 0 (0.0%) | 0 (0.0%) |
| 18 to 34 Years | 0 (0.0%) | 0 (0.0%) |
| 35 to 64 Years | 21 (5.8%) | 49 (12.6%) |
| 65 to 74 Years | 33 (43.4%) | 48 (34.8%) |
| 75 Years and over | 41 (61.2%) | 62 (46.3%) |
Disability Class: Self-Care Difficulty
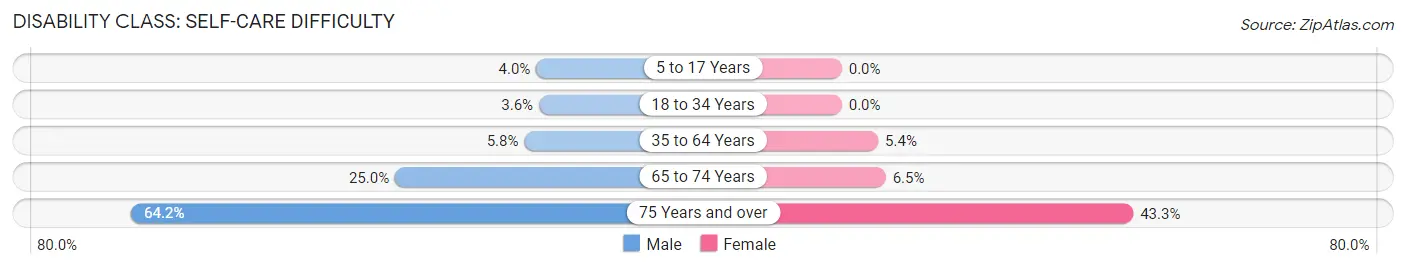
| Age Bracket | Male | Female |
| 5 to 17 Years | 4 (4.0%) | 0 (0.0%) |
| 18 to 34 Years | 5 (3.6%) | 0 (0.0%) |
| 35 to 64 Years | 21 (5.8%) | 21 (5.4%) |
| 65 to 74 Years | 19 (25.0%) | 9 (6.5%) |
| 75 Years and over | 43 (64.2%) | 58 (43.3%) |
Technology Access in Montour Falls
Computing Device Access in Montour Falls
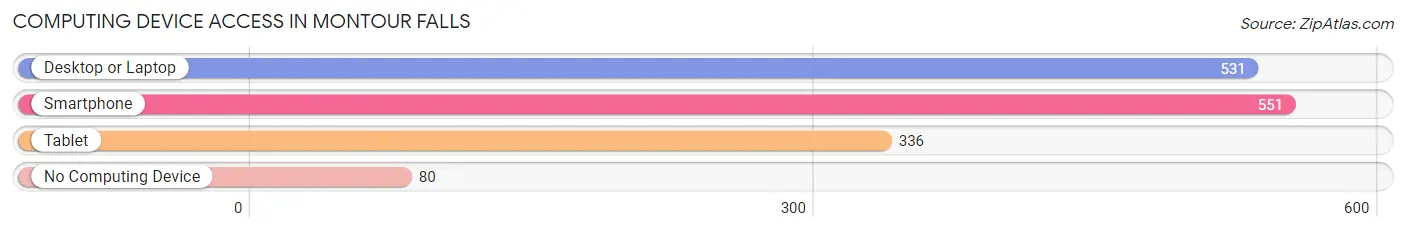
| Device Type | # Households | % Households |
| Desktop or Laptop | 531 | 73.3% |
| Smartphone | 551 | 76.1% |
| Tablet | 336 | 46.4% |
| No Computing Device | 80 | 11.1% |
| Total | 724 | 100.0% |
Internet Access in Montour Falls
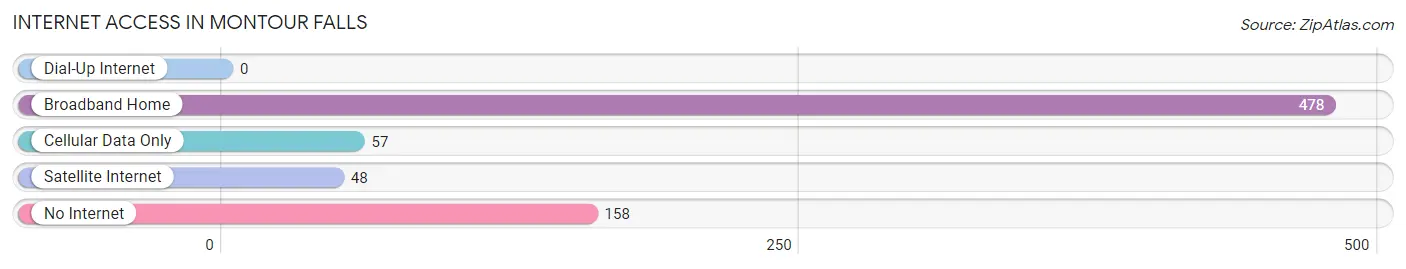
| Internet Type | # Households | % Households |
| Dial-Up Internet | 0 | 0.0% |
| Broadband Home | 478 | 66.0% |
| Cellular Data Only | 57 | 7.9% |
| Satellite Internet | 48 | 6.6% |
| No Internet | 158 | 21.8% |
| Total | 724 | 100.0% |
Montour Falls Summary
Introduction
Located in the Finger Lakes region of New York State, the village of Montour Falls is a small community of approximately 1,800 people. The village is situated in Schuyler County, which is part of the Southern Tier region of the state. The village is located on the east side of Seneca Lake, the largest of the Finger Lakes. Montour Falls is a popular tourist destination due to its proximity to the lake and its many attractions.
History
The area that is now Montour Falls was originally inhabited by the Seneca Nation of the Iroquois Confederacy. The Seneca were the largest of the Iroquois tribes and occupied much of the Finger Lakes region. The village of Montour Falls was founded in 1829 by William Montgomery, a local landowner. The village was named after his wife, Mary Montour, who was of Seneca descent.
The village grew slowly over the next few decades, but by the late 19th century, it had become a popular tourist destination. The village was home to several hotels and resorts, as well as a number of attractions, including Watkins Glen State Park and the Montour Falls Aqueduct.
In the early 20th century, the village experienced a period of growth and development. The village was incorporated in 1921 and the population grew to over 2,000 by the 1950s. The village has remained relatively stable since then, with a population of around 1,800 in 2020.
Geography
Montour Falls is located in the Finger Lakes region of New York State. The village is situated in Schuyler County, which is part of the Southern Tier region of the state. The village is located on the east side of Seneca Lake, the largest of the Finger Lakes. The village is surrounded by rolling hills and is situated at the base of a steep gorge.
The village is located at the intersection of two major highways, NY-14 and NY-224. The village is also served by a number of local roads, including NY-226 and NY-227. The nearest major cities are Rochester, Syracuse, and Ithaca, all of which are located within a two-hour drive of the village.
Economy
The economy of Montour Falls is largely based on tourism. The village is home to several hotels and resorts, as well as a number of attractions, including Watkins Glen State Park and the Montour Falls Aqueduct. The village is also home to a number of small businesses, including restaurants, shops, and galleries.
The village is also home to a number of manufacturing companies, including a paper mill and a plastics factory. The village is also home to a number of agricultural businesses, including dairy farms and vineyards.
Demographics
As of the 2010 census, the population of Montour Falls was 1,819. The population is predominantly white (94.3%), with small percentages of African American (2.2%), Asian (1.2%), and Hispanic (1.2%) residents. The median household income is $41,944, and the median age is 43.
Conclusion
Montour Falls is a small village located in the Finger Lakes region of New York State. The village is situated in Schuyler County and is located on the east side of Seneca Lake. The village has a long history, dating back to the early 19th century, and has remained relatively stable since then. The economy of the village is largely based on tourism, with a number of hotels and resorts, as well as a number of attractions. The population of the village is predominantly white, with a median household income of $41,944 and a median age of 43.
Common Questions
What is Per Capita Income in Montour Falls?
Per Capita income in Montour Falls is $24,880.
What is the Median Family Income in Montour Falls?
Median Family Income in Montour Falls is $65,469.
What is the Median Household income in Montour Falls?
Median Household Income in Montour Falls is $33,977.
What is Income or Wage Gap in Montour Falls?
Income or Wage Gap in Montour Falls is 44.9%.
Women in Montour Falls earn 55.1 cents for every dollar earned by a man.
What is Inequality or Gini Index in Montour Falls?
Inequality or Gini Index in Montour Falls is 0.46.
What is the Total Population of Montour Falls?
Total Population of Montour Falls is 1,830.
What is the Total Male Population of Montour Falls?
Total Male Population of Montour Falls is 846.
What is the Total Female Population of Montour Falls?
Total Female Population of Montour Falls is 984.
What is the Ratio of Males per 100 Females in Montour Falls?
There are 85.98 Males per 100 Females in Montour Falls.
What is the Ratio of Females per 100 Males in Montour Falls?
There are 116.31 Females per 100 Males in Montour Falls.
What is the Median Population Age in Montour Falls?
Median Population Age in Montour Falls is 44.8 Years.
What is the Average Family Size in Montour Falls
Average Family Size in Montour Falls is 3.3 People.
What is the Average Household Size in Montour Falls
Average Household Size in Montour Falls is 2.3 People.
How Large is the Labor Force in Montour Falls?
There are 673 People in the Labor Forcein in Montour Falls.
What is the Percentage of People in the Labor Force in Montour Falls?
44.6% of People are in the Labor Force in Montour Falls.
What is the Unemployment Rate in Montour Falls?
Unemployment Rate in Montour Falls is 10.3%.