Groton, NY Map & Demographics
Groton Map
Groton Overview
$33,029
PER CAPITA INCOME
$79,567
AVG FAMILY INCOME
$59,861
AVG HOUSEHOLD INCOME
16.0%
WAGE / INCOME GAP [ % ]
84.0¢/ $1
WAGE / INCOME GAP [ $ ]
0.37
INEQUALITY / GINI INDEX
2,036
TOTAL POPULATION
984
MALE POPULATION
1,052
FEMALE POPULATION
93.54
MALES / 100 FEMALES
106.91
FEMALES / 100 MALES
46.2
MEDIAN AGE
2.8
AVG FAMILY SIZE
2.1
AVG HOUSEHOLD SIZE
1,053
LABOR FORCE [ PEOPLE ]
62.4%
PERCENT IN LABOR FORCE
2.6%
UNEMPLOYMENT RATE
Groton Zip Codes
Groton Area Codes
Income in Groton
Income Overview in Groton
Per Capita Income in Groton is $33,029, while median incomes of families and households are $79,567 and $59,861 respectively.
| Characteristic | Number | Measure |
| Per Capita Income | 2,036 | $33,029 |
| Median Family Income | 507 | $79,567 |
| Mean Family Income | 507 | $87,580 |
| Median Household Income | 937 | $59,861 |
| Mean Household Income | 937 | $72,228 |
| Income Deficit | 507 | $0 |
| Wage / Income Gap (%) | 2,036 | 16.00% |
| Wage / Income Gap ($) | 2,036 | 84.00¢ per $1 |
| Gini / Inequality Index | 2,036 | 0.37 |
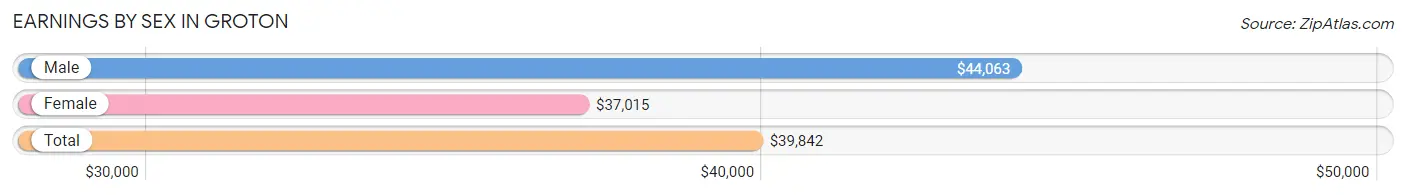
Earnings by Sex in Groton
Average Earnings in Groton are $39,842, $44,063 for men and $37,015 for women, a difference of 16.0%.
| Sex | Number | Average Earnings |
| Male | 589 (53.3%) | $44,063 |
| Female | 516 (46.7%) | $37,015 |
| Total | 1,105 (100.0%) | $39,842 |
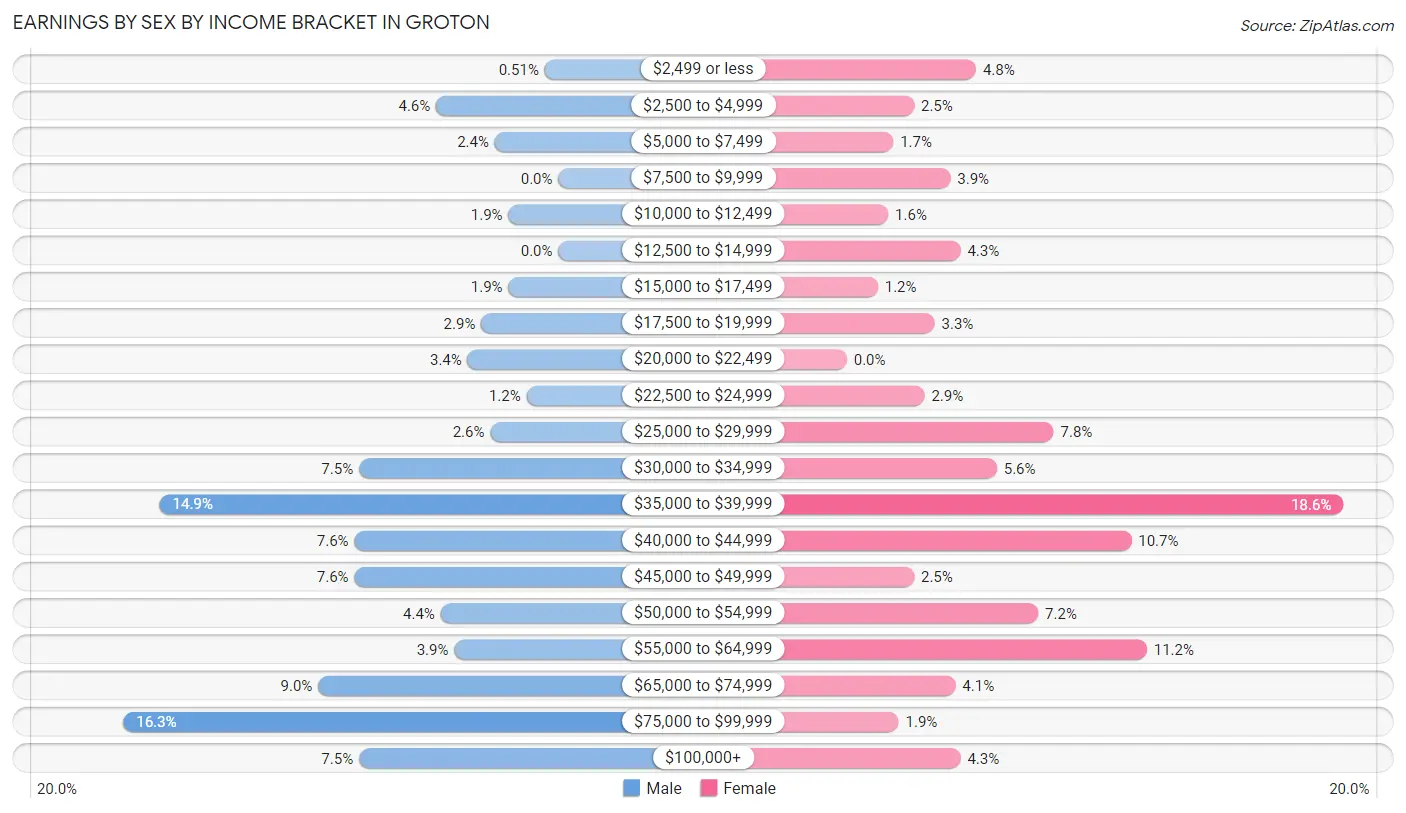
Earnings by Sex by Income Bracket in Groton
The most common earnings brackets in Groton are $75,000 to $99,999 for men (96 | 16.3%) and $35,000 to $39,999 for women (96 | 18.6%).
| Income | Male | Female |
| $2,499 or less | 3 (0.5%) | 25 (4.8%) |
| $2,500 to $4,999 | 27 (4.6%) | 13 (2.5%) |
| $5,000 to $7,499 | 14 (2.4%) | 9 (1.7%) |
| $7,500 to $9,999 | 0 (0.0%) | 20 (3.9%) |
| $10,000 to $12,499 | 11 (1.9%) | 8 (1.5%) |
| $12,500 to $14,999 | 0 (0.0%) | 22 (4.3%) |
| $15,000 to $17,499 | 11 (1.9%) | 6 (1.2%) |
| $17,500 to $19,999 | 17 (2.9%) | 17 (3.3%) |
| $20,000 to $22,499 | 20 (3.4%) | 0 (0.0%) |
| $22,500 to $24,999 | 7 (1.2%) | 15 (2.9%) |
| $25,000 to $29,999 | 15 (2.5%) | 40 (7.7%) |
| $30,000 to $34,999 | 44 (7.5%) | 29 (5.6%) |
| $35,000 to $39,999 | 88 (14.9%) | 96 (18.6%) |
| $40,000 to $44,999 | 45 (7.6%) | 55 (10.7%) |
| $45,000 to $49,999 | 45 (7.6%) | 13 (2.5%) |
| $50,000 to $54,999 | 26 (4.4%) | 37 (7.2%) |
| $55,000 to $64,999 | 23 (3.9%) | 58 (11.2%) |
| $65,000 to $74,999 | 53 (9.0%) | 21 (4.1%) |
| $75,000 to $99,999 | 96 (16.3%) | 10 (1.9%) |
| $100,000+ | 44 (7.5%) | 22 (4.3%) |
| Total | 589 (100.0%) | 516 (100.0%) |
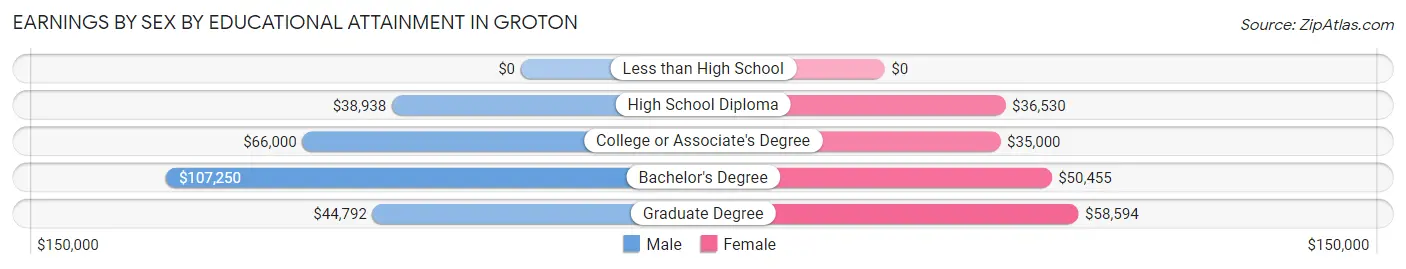
Earnings by Sex by Educational Attainment in Groton
Average earnings in Groton are $45,493 for men and $37,500 for women, a difference of 17.6%. Men with an educational attainment of bachelor's degree enjoy the highest average annual earnings of $107,250, while those with high school diploma education earn the least with $38,938. Women with an educational attainment of graduate degree earn the most with the average annual earnings of $58,594, while those with college or associate's degree education have the smallest earnings of $35,000.
| Educational Attainment | Male Income | Female Income |
| Less than High School | - | - |
| High School Diploma | $38,938 | $36,530 |
| College or Associate's Degree | $66,000 | $35,000 |
| Bachelor's Degree | $107,250 | $50,455 |
| Graduate Degree | $44,792 | $58,594 |
| Total | $45,493 | $37,500 |
Family Income in Groton
Family Income Brackets in Groton
According to the Groton family income data, there are 141 families falling into the $100,000 to $149,999 income range, which is the most common income bracket and makes up 27.8% of all families.
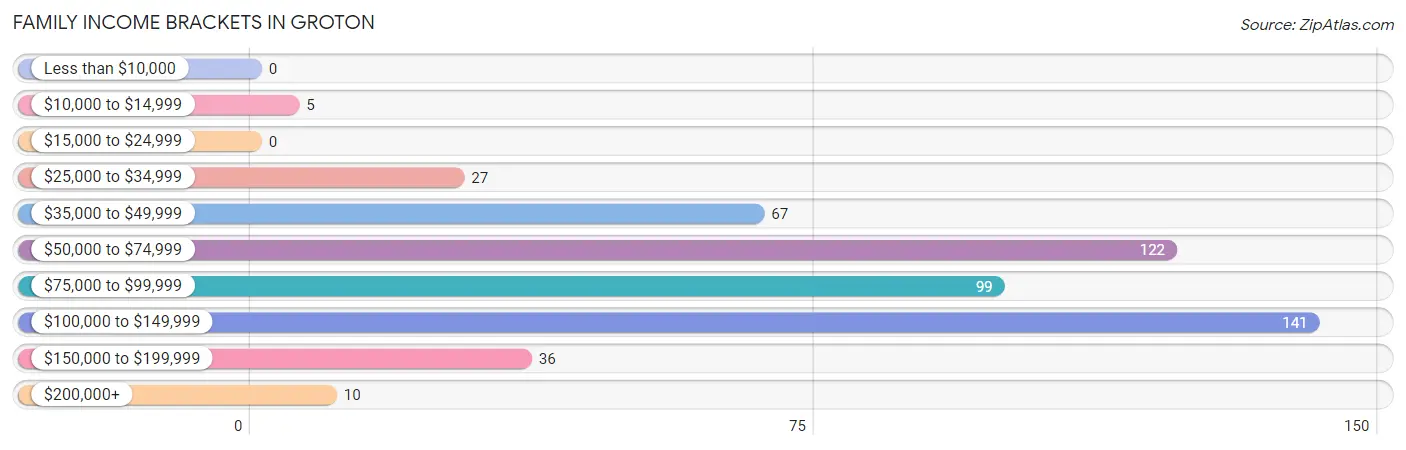
| Income Bracket | # Families | % Families |
| Less than $10,000 | 0 | 0.0% |
| $10,000 to $14,999 | 5 | 1.0% |
| $15,000 to $24,999 | 0 | 0.0% |
| $25,000 to $34,999 | 27 | 5.3% |
| $35,000 to $49,999 | 67 | 13.2% |
| $50,000 to $74,999 | 122 | 24.1% |
| $75,000 to $99,999 | 99 | 19.5% |
| $100,000 to $149,999 | 141 | 27.8% |
| $150,000 to $199,999 | 36 | 7.1% |
| $200,000+ | 10 | 2.0% |
Family Income by Famaliy Size in Groton
7+ person families (19 | 3.7%) account for the highest median family income in Groton with $161,146 per family, while 3-person families (114 | 22.5%) have the highest median income of $38,353 per family member.
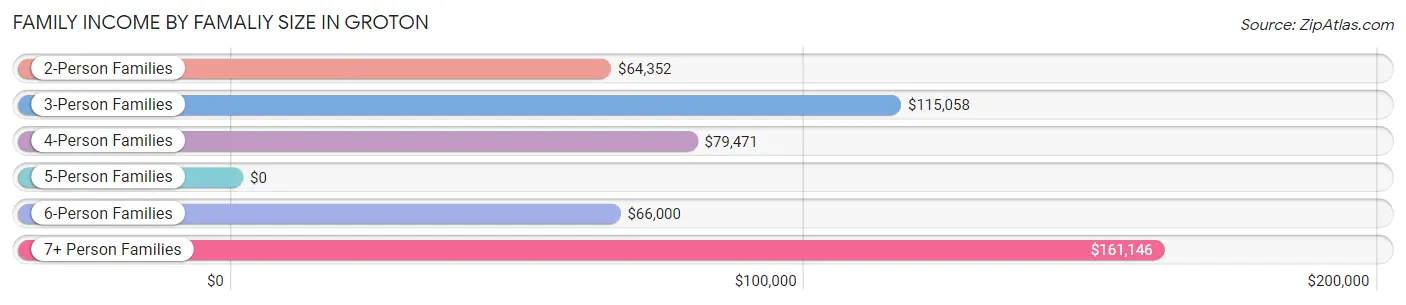
| Income Bracket | # Families | Median Income |
| 2-Person Families | 274 (54.0%) | $64,352 |
| 3-Person Families | 114 (22.5%) | $115,058 |
| 4-Person Families | 65 (12.8%) | $79,471 |
| 5-Person Families | 17 (3.4%) | $0 |
| 6-Person Families | 18 (3.5%) | $66,000 |
| 7+ Person Families | 19 (3.7%) | $161,146 |
| Total | 507 (100.0%) | $79,567 |
Family Income by Number of Earners in Groton
The median family income in Groton is $79,567, with families comprising 3+ earners (50) having the highest median family income of $161,029, while families with no earners (76) have the lowest median family income of $42,083, accounting for 9.9% and 15.0% of families, respectively.
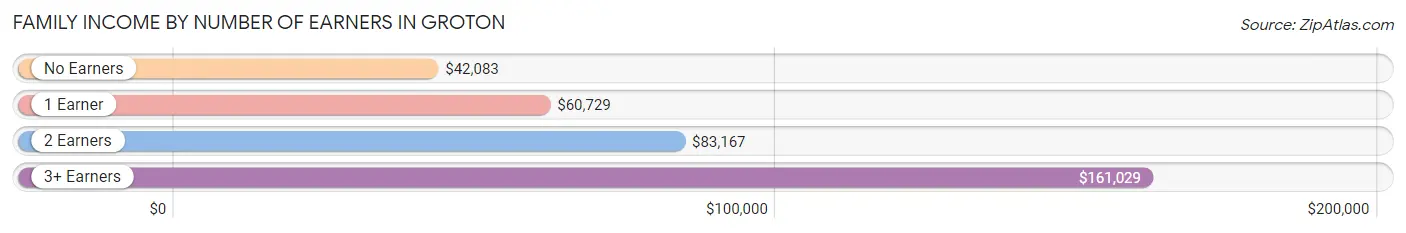
| Number of Earners | # Families | Median Income |
| No Earners | 76 (15.0%) | $42,083 |
| 1 Earner | 113 (22.3%) | $60,729 |
| 2 Earners | 268 (52.9%) | $83,167 |
| 3+ Earners | 50 (9.9%) | $161,029 |
| Total | 507 (100.0%) | $79,567 |
Household Income in Groton
Household Income Brackets in Groton
With 234 households falling in the category, the $50,000 to $74,999 income range is the most frequent in Groton, accounting for 25.0% of all households. In contrast, only 21 households (2.2%) fall into the $200,000+ income bracket, making it the least populous group.
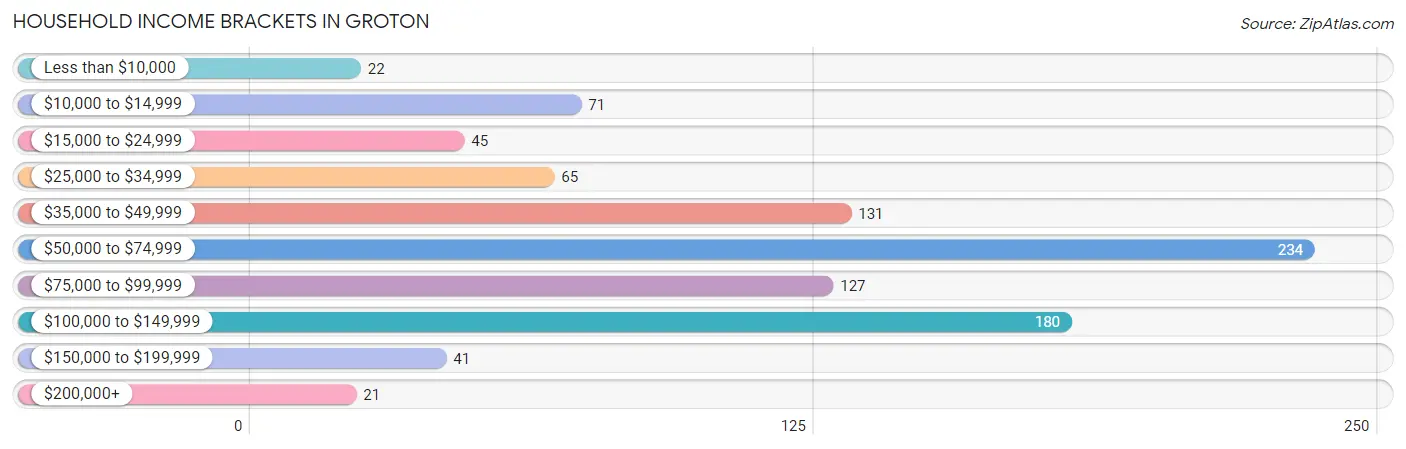
| Income Bracket | # Households | % Households |
| Less than $10,000 | 22 | 2.3% |
| $10,000 to $14,999 | 71 | 7.6% |
| $15,000 to $24,999 | 45 | 4.8% |
| $25,000 to $34,999 | 65 | 6.9% |
| $35,000 to $49,999 | 131 | 14.0% |
| $50,000 to $74,999 | 234 | 25.0% |
| $75,000 to $99,999 | 127 | 13.6% |
| $100,000 to $149,999 | 180 | 19.2% |
| $150,000 to $199,999 | 41 | 4.4% |
| $200,000+ | 21 | 2.2% |
Household Income by Householder Age in Groton
The median household income in Groton is $59,861, with the highest median household income of $76,000 found in the 25 to 44 years age bracket for the primary householder. A total of 302 households (32.2%) fall into this category. Meanwhile, the 15 to 24 years age bracket for the primary householder has the lowest median household income of $49,038, with 28 households (3.0%) in this group.
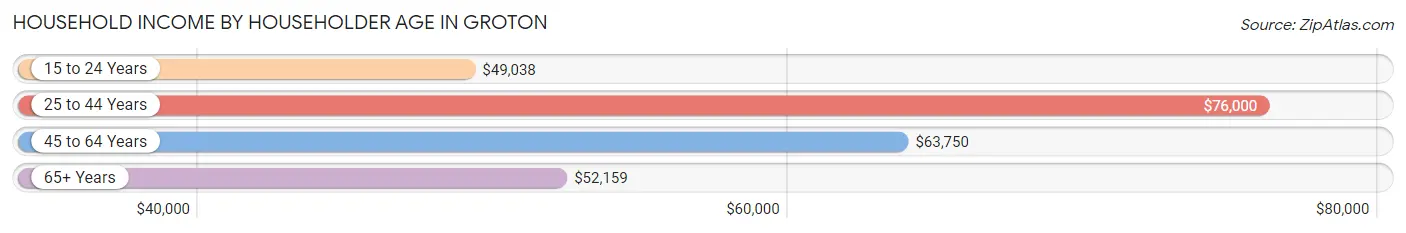
| Income Bracket | # Households | Median Income |
| 15 to 24 Years | 28 (3.0%) | $49,038 |
| 25 to 44 Years | 302 (32.2%) | $76,000 |
| 45 to 64 Years | 303 (32.3%) | $63,750 |
| 65+ Years | 304 (32.4%) | $52,159 |
| Total | 937 (100.0%) | $59,861 |
Poverty in Groton
Income Below Poverty by Sex and Age in Groton
With 8.7% poverty level for males and 10.5% for females among the residents of Groton, 16 and 17 year old males and 25 to 34 year old females are the most vulnerable to poverty, with 7 males (33.3%) and 36 females (29.5%) in their respective age groups living below the poverty level.
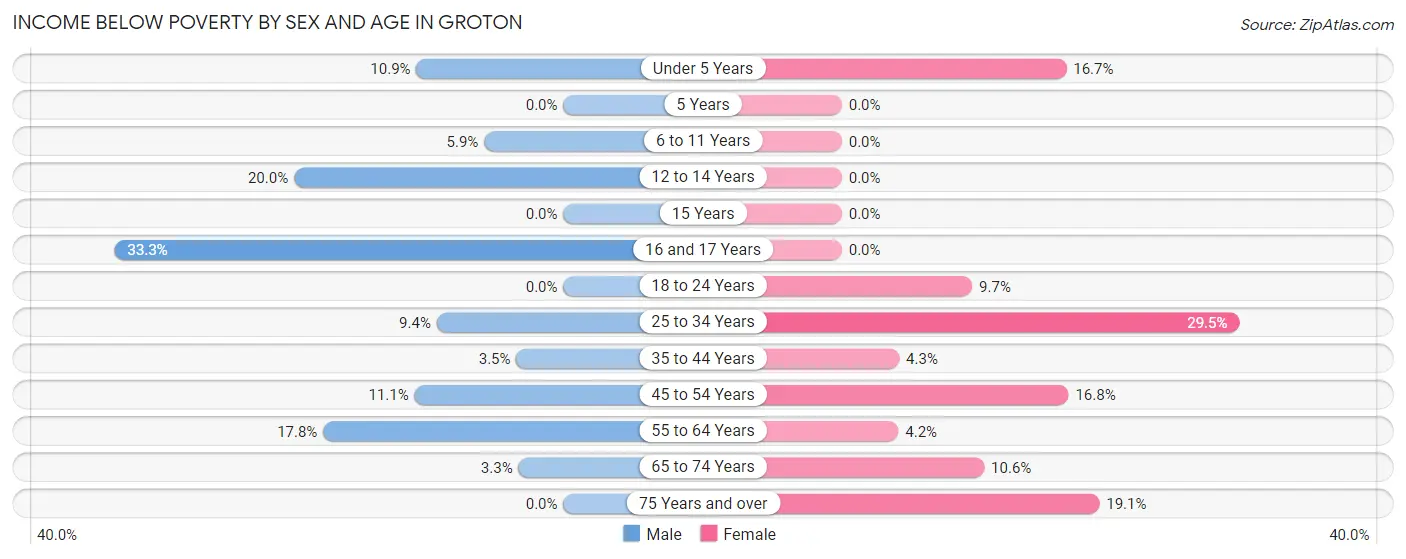
| Age Bracket | Male | Female |
| Under 5 Years | 6 (10.9%) | 8 (16.7%) |
| 5 Years | 0 (0.0%) | 0 (0.0%) |
| 6 to 11 Years | 3 (5.9%) | 0 (0.0%) |
| 12 to 14 Years | 3 (20.0%) | 0 (0.0%) |
| 15 Years | 0 (0.0%) | 0 (0.0%) |
| 16 and 17 Years | 7 (33.3%) | 0 (0.0%) |
| 18 to 24 Years | 0 (0.0%) | 3 (9.7%) |
| 25 to 34 Years | 11 (9.4%) | 36 (29.5%) |
| 35 to 44 Years | 3 (3.5%) | 8 (4.3%) |
| 45 to 54 Years | 20 (11.1%) | 17 (16.8%) |
| 55 to 64 Years | 23 (17.8%) | 6 (4.2%) |
| 65 to 74 Years | 6 (3.3%) | 13 (10.6%) |
| 75 Years and over | 0 (0.0%) | 13 (19.1%) |
| Total | 82 (8.7%) | 104 (10.5%) |
Income Above Poverty by Sex and Age in Groton
According to the poverty statistics in Groton, males aged 5 years and females aged 5 years are the age groups that are most secure financially, with 100.0% of males and 100.0% of females in these age groups living above the poverty line.
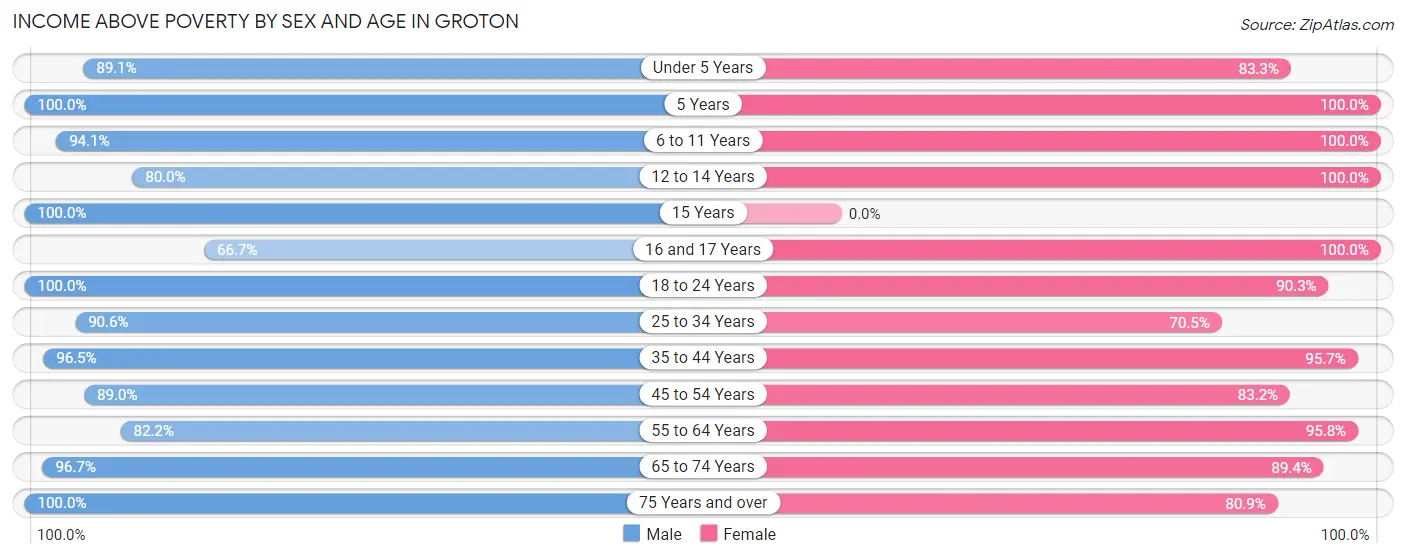
| Age Bracket | Male | Female |
| Under 5 Years | 49 (89.1%) | 40 (83.3%) |
| 5 Years | 11 (100.0%) | 5 (100.0%) |
| 6 to 11 Years | 48 (94.1%) | 106 (100.0%) |
| 12 to 14 Years | 12 (80.0%) | 21 (100.0%) |
| 15 Years | 16 (100.0%) | 0 (0.0%) |
| 16 and 17 Years | 14 (66.7%) | 34 (100.0%) |
| 18 to 24 Years | 48 (100.0%) | 28 (90.3%) |
| 25 to 34 Years | 106 (90.6%) | 86 (70.5%) |
| 35 to 44 Years | 83 (96.5%) | 180 (95.7%) |
| 45 to 54 Years | 161 (88.9%) | 84 (83.2%) |
| 55 to 64 Years | 106 (82.2%) | 137 (95.8%) |
| 65 to 74 Years | 174 (96.7%) | 110 (89.4%) |
| 75 Years and over | 36 (100.0%) | 55 (80.9%) |
| Total | 864 (91.3%) | 886 (89.5%) |
Income Below Poverty Among Married-Couple Families in Groton
The poverty statistics for married-couple families in Groton show that 1.8% or 7 of the total 394 families live below the poverty line. Families with 1 or 2 children have the highest poverty rate of 5.9%, comprising of 7 families. On the other hand, families with no children have the lowest poverty rate of 0.0%, which includes 0 families.
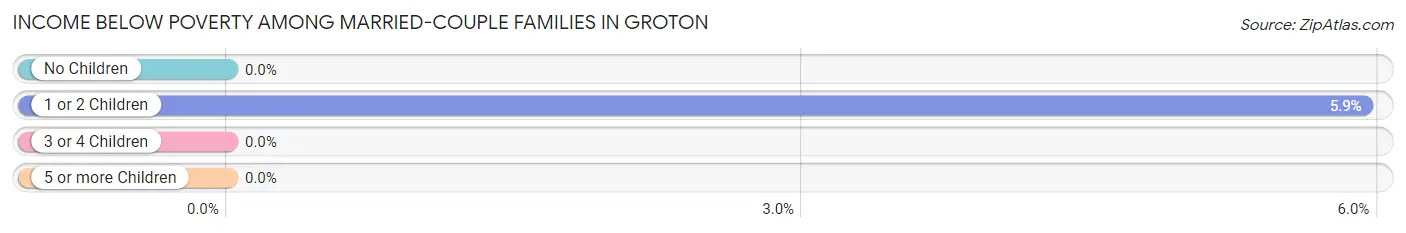
| Children | Above Poverty | Below Poverty |
| No Children | 229 (100.0%) | 0 (0.0%) |
| 1 or 2 Children | 111 (94.1%) | 7 (5.9%) |
| 3 or 4 Children | 47 (100.0%) | 0 (0.0%) |
| 5 or more Children | 0 (0.0%) | 0 (0.0%) |
| Total | 387 (98.2%) | 7 (1.8%) |
Income Below Poverty Among Single-Parent Households in Groton
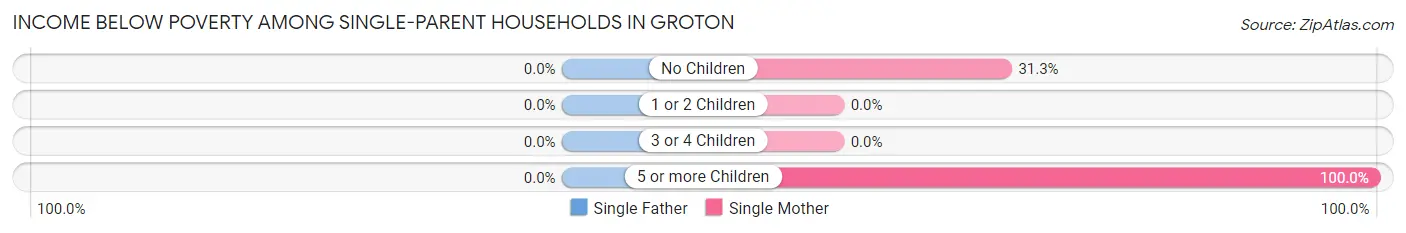
| Children | Single Father | Single Mother |
| No Children | 0 (0.0%) | 5 (31.2%) |
| 1 or 2 Children | 0 (0.0%) | 0 (0.0%) |
| 3 or 4 Children | 0 (0.0%) | 0 (0.0%) |
| 5 or more Children | 0 (0.0%) | 4 (100.0%) |
| Total | 0 (0.0%) | 9 (14.5%) |
Income Below Poverty Among Married-Couple vs Single-Parent Households in Groton
The poverty data for Groton shows that 7 of the married-couple family households (1.8%) and 9 of the single-parent households (8.0%) are living below the poverty level. Within the married-couple family households, those with 1 or 2 children have the highest poverty rate, with 7 households (5.9%) falling below the poverty line. Among the single-parent households, those with 5 or more children have the highest poverty rate, with 4 household (100.0%) living below poverty.
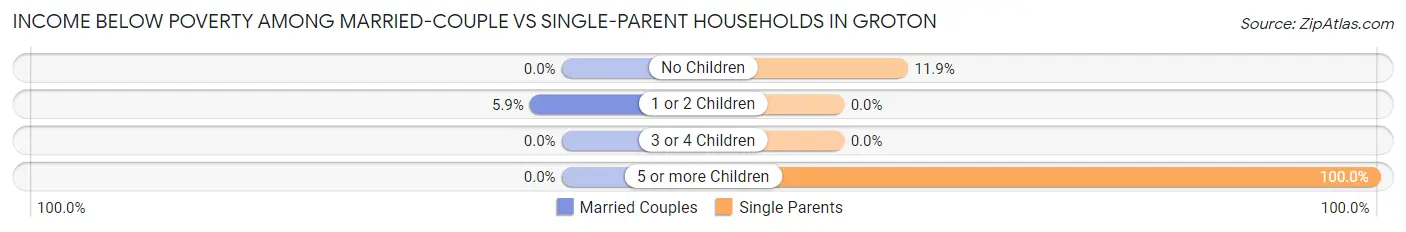
| Children | Married-Couple Families | Single-Parent Households |
| No Children | 0 (0.0%) | 5 (11.9%) |
| 1 or 2 Children | 7 (5.9%) | 0 (0.0%) |
| 3 or 4 Children | 0 (0.0%) | 0 (0.0%) |
| 5 or more Children | 0 (0.0%) | 4 (100.0%) |
| Total | 7 (1.8%) | 9 (8.0%) |
Race in Groton
The most populous races in Groton are White / Caucasian (1,852 | 91.0%), Two or more Races (125 | 6.1%), and Black / African American (48 | 2.4%).
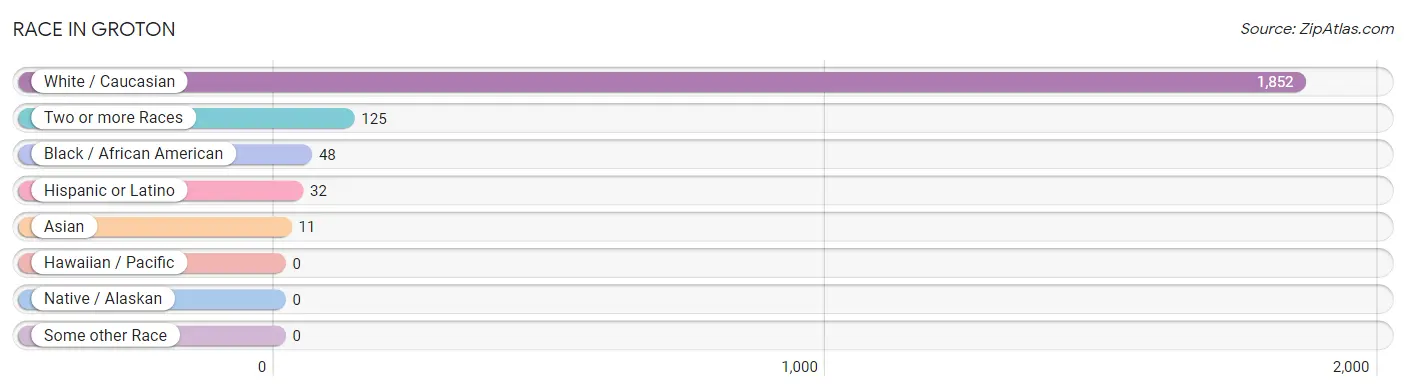
| Race | # Population | % Population |
| Asian | 11 | 0.5% |
| Black / African American | 48 | 2.4% |
| Hawaiian / Pacific | 0 | 0.0% |
| Hispanic or Latino | 32 | 1.6% |
| Native / Alaskan | 0 | 0.0% |
| White / Caucasian | 1,852 | 91.0% |
| Two or more Races | 125 | 6.1% |
| Some other Race | 0 | 0.0% |
| Total | 2,036 | 100.0% |
Ancestry in Groton
The most populous ancestries reported in Groton are English (393 | 19.3%), German (344 | 16.9%), Irish (344 | 16.9%), Italian (185 | 9.1%), and American (150 | 7.4%), together accounting for 69.6% of all Groton residents.
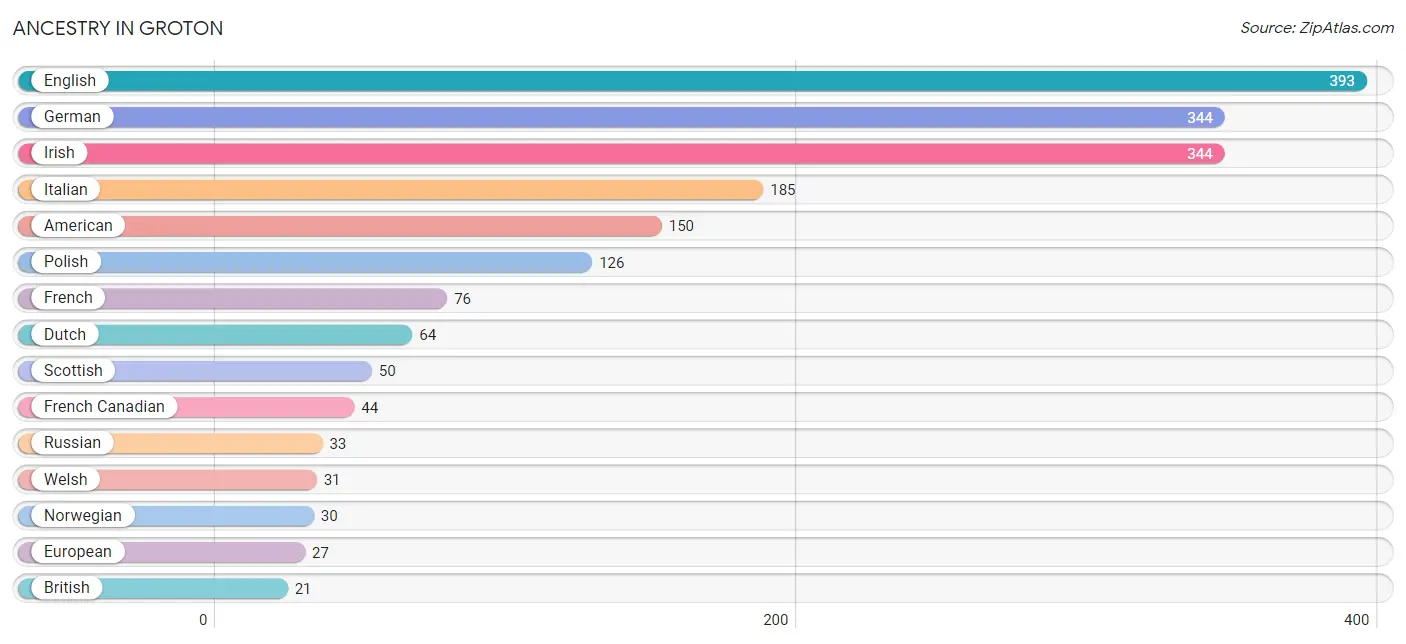
| Ancestry | # Population | % Population |
| American | 150 | 7.4% |
| Austrian | 5 | 0.3% |
| Blackfeet | 8 | 0.4% |
| British | 21 | 1.0% |
| Canadian | 1 | 0.1% |
| Central American | 7 | 0.3% |
| Croatian | 5 | 0.3% |
| Danish | 19 | 0.9% |
| Dominican | 6 | 0.3% |
| Dutch | 64 | 3.1% |
| Eastern European | 5 | 0.3% |
| English | 393 | 19.3% |
| European | 27 | 1.3% |
| French | 76 | 3.7% |
| French Canadian | 44 | 2.2% |
| German | 344 | 16.9% |
| Greek | 5 | 0.3% |
| Hungarian | 13 | 0.6% |
| Iranian | 5 | 0.3% |
| Irish | 344 | 16.9% |
| Iroquois | 15 | 0.7% |
| Italian | 185 | 9.1% |
| Korean | 9 | 0.4% |
| Native Hawaiian | 10 | 0.5% |
| Norwegian | 30 | 1.5% |
| Pennsylvania German | 10 | 0.5% |
| Polish | 126 | 6.2% |
| Portuguese | 3 | 0.2% |
| Puerto Rican | 19 | 0.9% |
| Russian | 33 | 1.6% |
| Salvadoran | 7 | 0.3% |
| Scotch-Irish | 13 | 0.6% |
| Scottish | 50 | 2.5% |
| Slovak | 11 | 0.5% |
| Thai | 11 | 0.5% |
| Trinidadian and Tobagonian | 9 | 0.4% |
| Ukrainian | 3 | 0.2% |
| Welsh | 31 | 1.5% |
| Yugoslavian | 7 | 0.3% | View All 39 Rows |
Immigrants in Groton
The most numerous immigrant groups reported in Groton came from Canada (17 | 0.8%), Latin America (13 | 0.6%), Asia (10 | 0.5%), South Central Asia (10 | 0.5%), and Central America (7 | 0.3%), together accounting for 2.8% of all Groton residents.
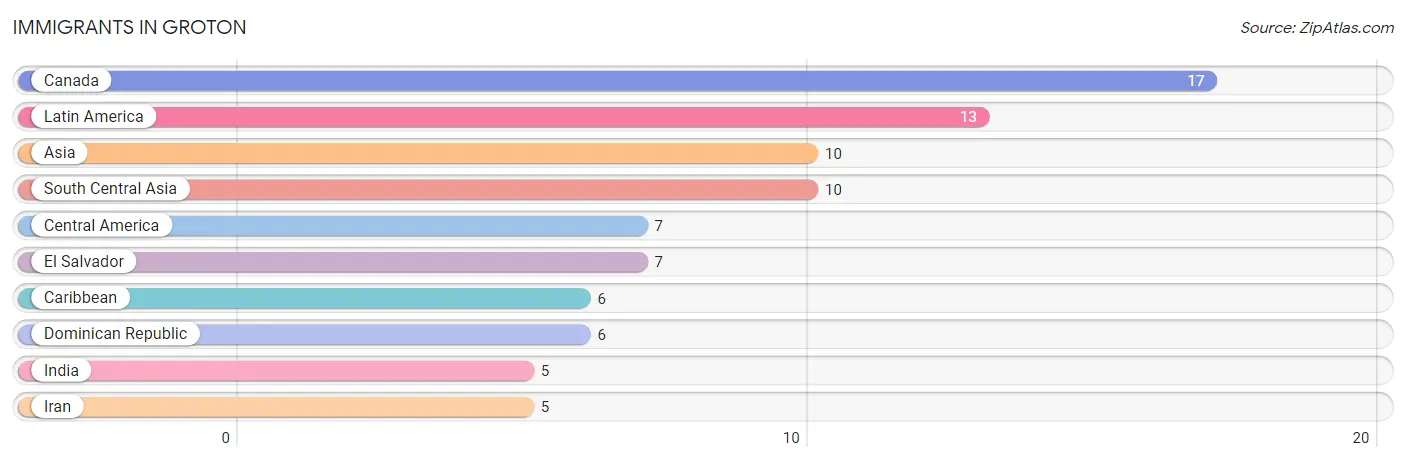
| Immigration Origin | # Population | % Population |
| Asia | 10 | 0.5% |
| Canada | 17 | 0.8% |
| Caribbean | 6 | 0.3% |
| Central America | 7 | 0.3% |
| Dominican Republic | 6 | 0.3% |
| El Salvador | 7 | 0.3% |
| India | 5 | 0.3% |
| Iran | 5 | 0.3% |
| Latin America | 13 | 0.6% |
| South Central Asia | 10 | 0.5% | View All 10 Rows |
Sex and Age in Groton
Sex and Age in Groton
The most populous age groups in Groton are 65 to 69 Years (120 | 12.2%) for men and 40 to 44 Years (158 | 15.0%) for women.
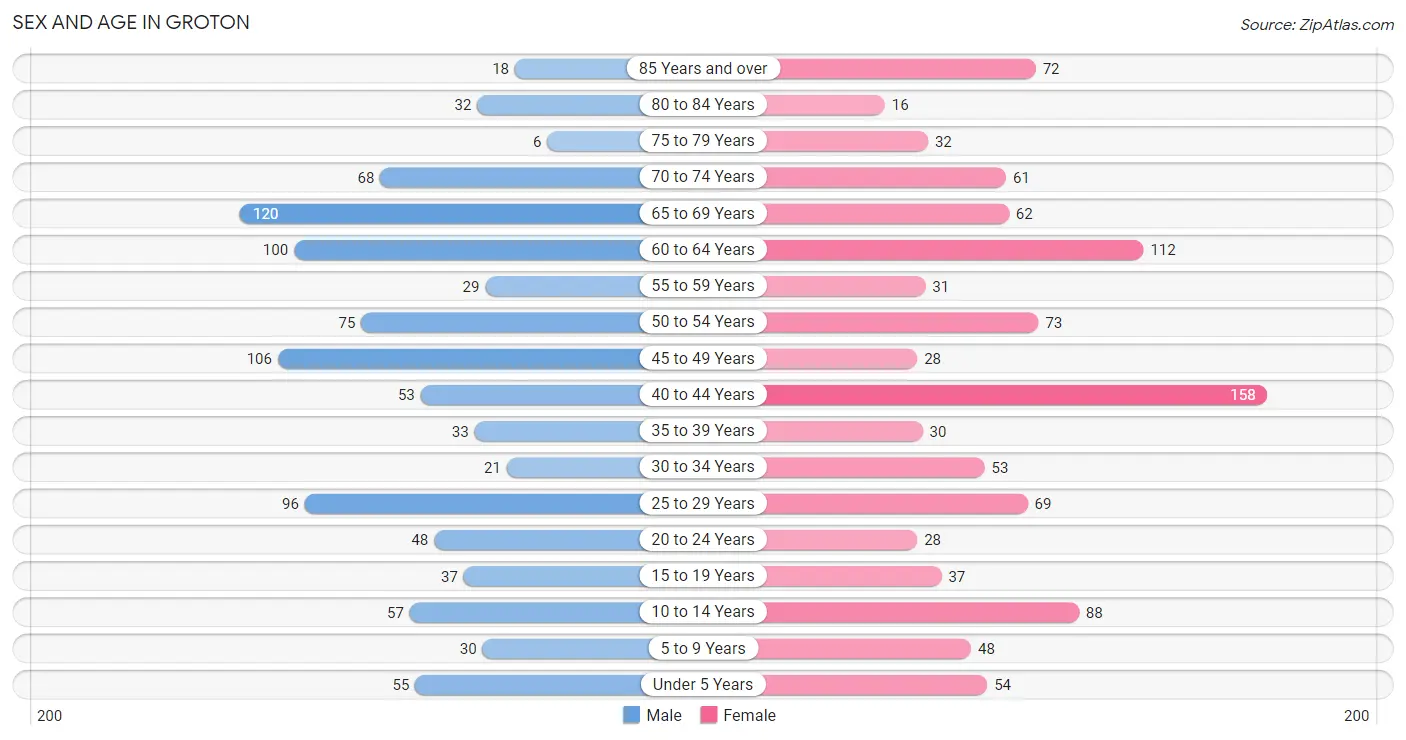
| Age Bracket | Male | Female |
| Under 5 Years | 55 (5.6%) | 54 (5.1%) |
| 5 to 9 Years | 30 (3.0%) | 48 (4.6%) |
| 10 to 14 Years | 57 (5.8%) | 88 (8.4%) |
| 15 to 19 Years | 37 (3.8%) | 37 (3.5%) |
| 20 to 24 Years | 48 (4.9%) | 28 (2.7%) |
| 25 to 29 Years | 96 (9.8%) | 69 (6.6%) |
| 30 to 34 Years | 21 (2.1%) | 53 (5.0%) |
| 35 to 39 Years | 33 (3.4%) | 30 (2.9%) |
| 40 to 44 Years | 53 (5.4%) | 158 (15.0%) |
| 45 to 49 Years | 106 (10.8%) | 28 (2.7%) |
| 50 to 54 Years | 75 (7.6%) | 73 (6.9%) |
| 55 to 59 Years | 29 (2.9%) | 31 (2.9%) |
| 60 to 64 Years | 100 (10.2%) | 112 (10.6%) |
| 65 to 69 Years | 120 (12.2%) | 62 (5.9%) |
| 70 to 74 Years | 68 (6.9%) | 61 (5.8%) |
| 75 to 79 Years | 6 (0.6%) | 32 (3.0%) |
| 80 to 84 Years | 32 (3.3%) | 16 (1.5%) |
| 85 Years and over | 18 (1.8%) | 72 (6.8%) |
| Total | 984 (100.0%) | 1,052 (100.0%) |
Families and Households in Groton
Median Family Size in Groton
The median family size in Groton is 2.77 persons per family, with married-couple families (394 | 77.7%) accounting for the largest median family size of 2.92 persons per family. On the other hand, single male/father families (51 | 10.1%) represent the smallest median family size with 2.04 persons per family.
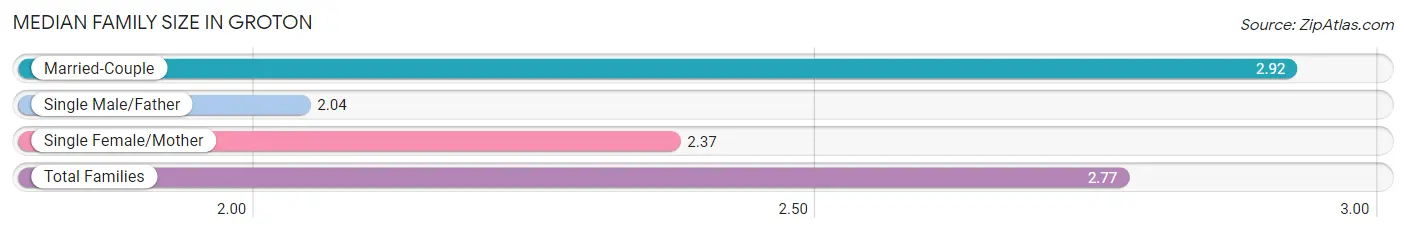
| Family Type | # Families | Family Size |
| Married-Couple | 394 (77.7%) | 2.92 |
| Single Male/Father | 51 (10.1%) | 2.04 |
| Single Female/Mother | 62 (12.2%) | 2.37 |
| Total Families | 507 (100.0%) | 2.77 |
Median Household Size in Groton
The median household size in Groton is 2.07 persons per household, with married-couple households (394 | 42.0%) accounting for the largest median household size of 2.92 persons per household. non-family households (430 | 45.9%) represent the smallest median household size with 1.18 persons per household.
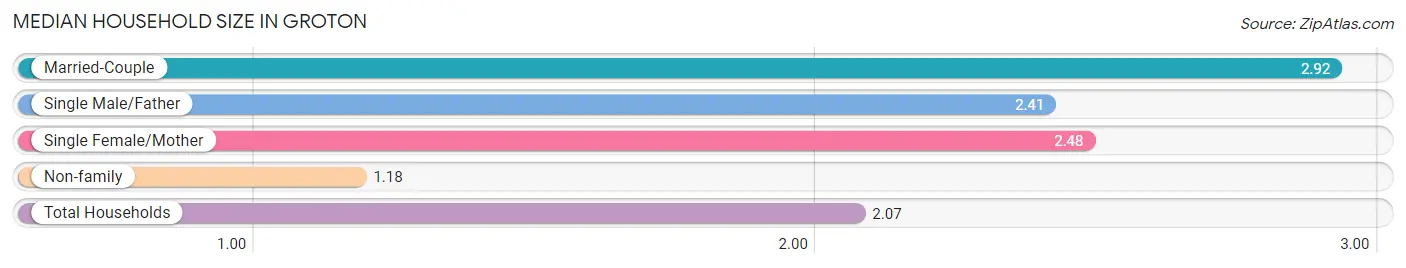
| Household Type | # Households | Household Size |
| Married-Couple | 394 (42.0%) | 2.92 |
| Single Male/Father | 51 (5.4%) | 2.41 |
| Single Female/Mother | 62 (6.6%) | 2.48 |
| Non-family | 430 (45.9%) | 1.18 |
| Total Households | 937 (100.0%) | 2.07 |
Household Size by Marriage Status in Groton
Out of a total of 937 households in Groton, 507 (54.1%) are family households, while 430 (45.9%) are nonfamily households. The most numerous type of family households are 2-person households, comprising 246, and the most common type of nonfamily households are 1-person households, comprising 349.
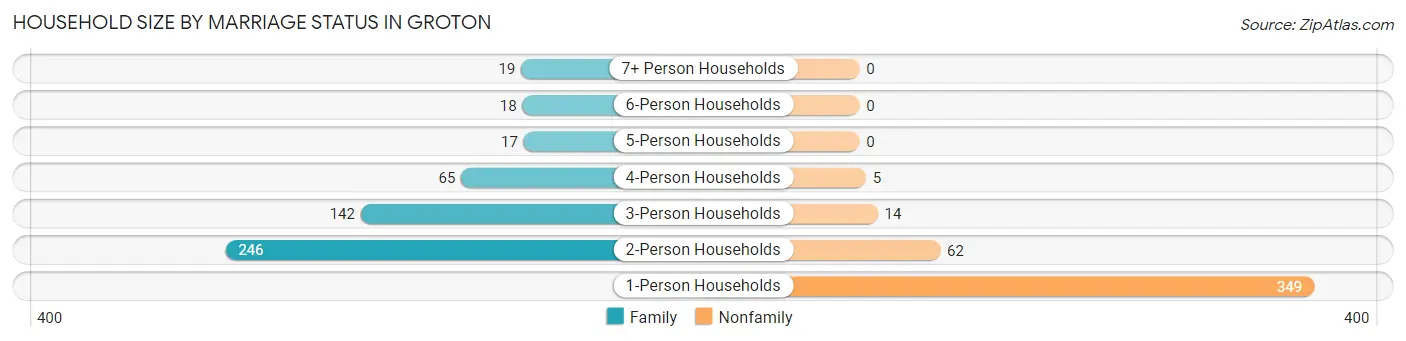
| Household Size | Family Households | Nonfamily Households |
| 1-Person Households | - | 349 (37.2%) |
| 2-Person Households | 246 (26.3%) | 62 (6.6%) |
| 3-Person Households | 142 (15.1%) | 14 (1.5%) |
| 4-Person Households | 65 (6.9%) | 5 (0.5%) |
| 5-Person Households | 17 (1.8%) | 0 (0.0%) |
| 6-Person Households | 18 (1.9%) | 0 (0.0%) |
| 7+ Person Households | 19 (2.0%) | 0 (0.0%) |
| Total | 507 (54.1%) | 430 (45.9%) |
Female Fertility in Groton
Fertility by Age in Groton
Average fertility rate in Groton is 61.0 births per 1,000 women. Women in the age bracket of 20 to 34 years have the highest fertility rate with 113.0 births per 1,000 women. Women in the age bracket of 20 to 34 years acount for 68.0% of all women with births.
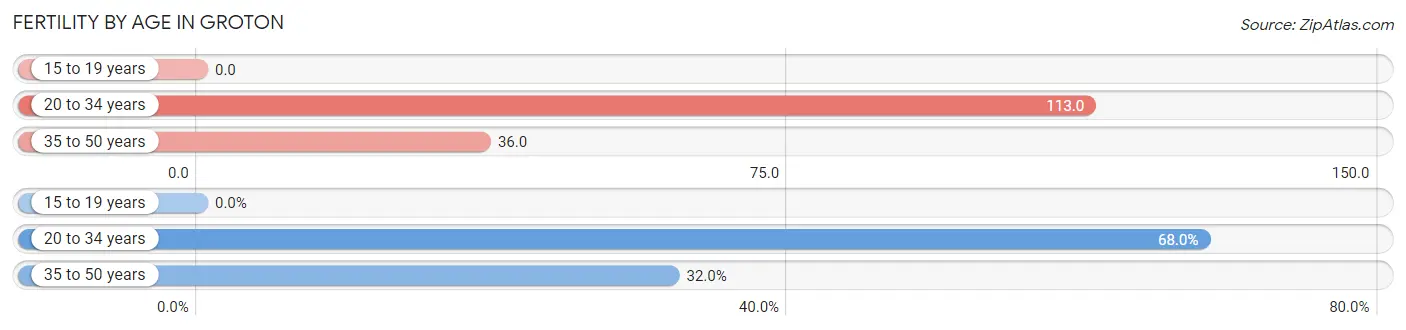
| Age Bracket | Women with Births | Births / 1,000 Women |
| 15 to 19 years | 0 (0.0%) | 0.0 |
| 20 to 34 years | 17 (68.0%) | 113.0 |
| 35 to 50 years | 8 (32.0%) | 36.0 |
| Total | 25 (100.0%) | 61.0 |
Fertility by Age by Marriage Status in Groton
48.0% of women with births (25) in Groton are married. The highest percentage of unmarried women with births falls into 35 to 50 years age bracket with 100.0% of them unmarried at the time of birth, while the lowest percentage of unmarried women with births belong to 20 to 34 years age bracket with 29.4% of them unmarried.
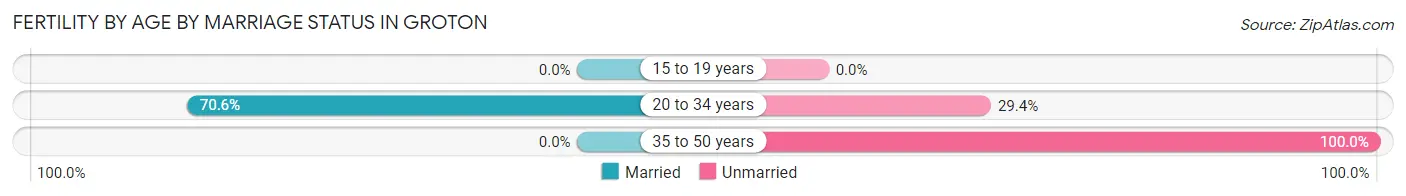
| Age Bracket | Married | Unmarried |
| 15 to 19 years | 0 (0.0%) | 0 (0.0%) |
| 20 to 34 years | 12 (70.6%) | 5 (29.4%) |
| 35 to 50 years | 0 (0.0%) | 8 (100.0%) |
| Total | 12 (48.0%) | 13 (52.0%) |
Fertility by Education in Groton
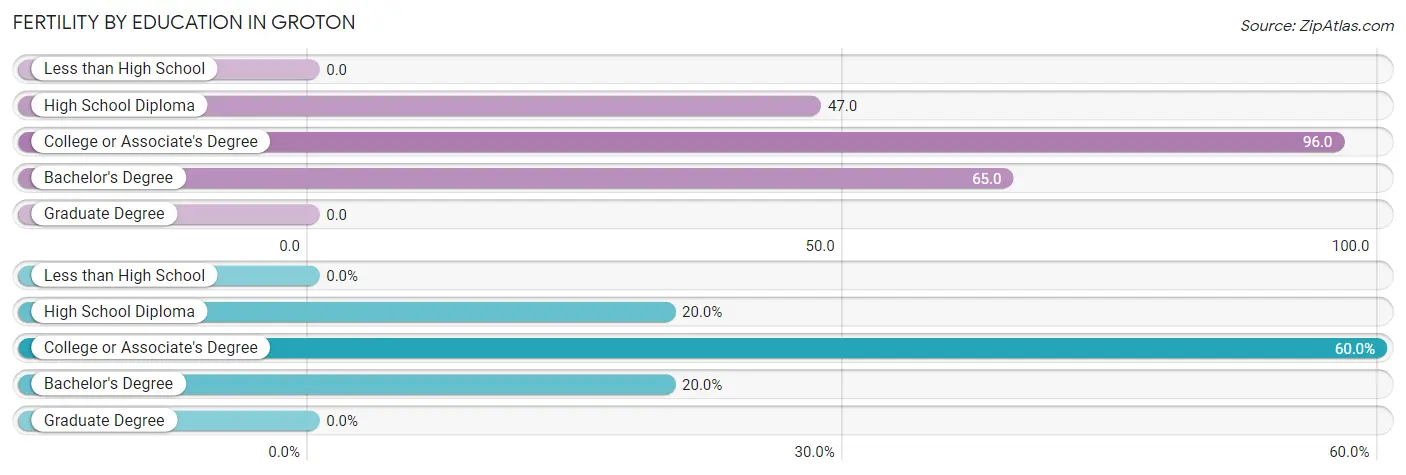
| Educational Attainment | Women with Births | Births / 1,000 Women |
| Less than High School | 0 (0.0%) | 0.0 |
| High School Diploma | 5 (20.0%) | 47.0 |
| College or Associate's Degree | 15 (60.0%) | 96.0 |
| Bachelor's Degree | 5 (20.0%) | 65.0 |
| Graduate Degree | 0 (0.0%) | 0.0 |
| Total | 25 (100.0%) | 61.0 |
Fertility by Education by Marriage Status in Groton
52.0% of women with births in Groton are unmarried. Women with the educational attainment of bachelor's degree are most likely to be married with 100.0% of them married at childbirth, while women with the educational attainment of high school diploma are least likely to be married with 100.0% of them unmarried at childbirth.
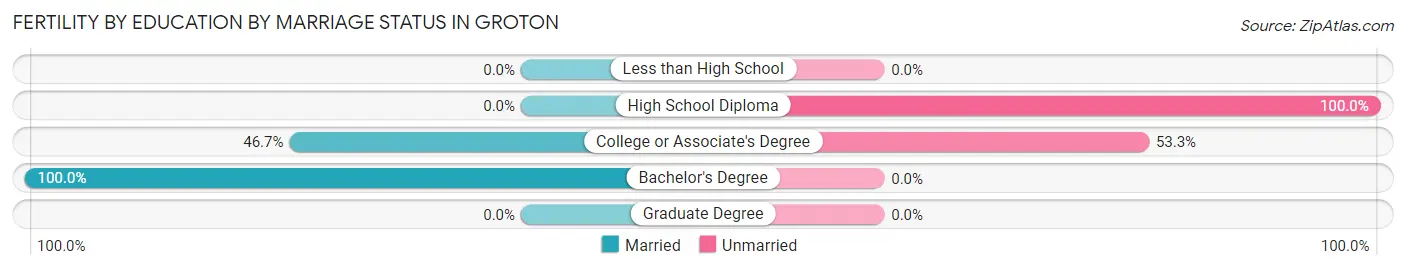
| Educational Attainment | Married | Unmarried |
| Less than High School | 0 (0.0%) | 0 (0.0%) |
| High School Diploma | 0 (0.0%) | 5 (100.0%) |
| College or Associate's Degree | 7 (46.7%) | 8 (53.3%) |
| Bachelor's Degree | 5 (100.0%) | 0 (0.0%) |
| Graduate Degree | 0 (0.0%) | 0 (0.0%) |
| Total | 12 (48.0%) | 13 (52.0%) |
Employment Characteristics in Groton
Employment by Class of Employer in Groton
Among the 995 employed individuals in Groton, private company employees (551 | 55.4%), not-for-profit organizations (256 | 25.7%), and local government employees (56 | 5.6%) make up the most common classes of employment.
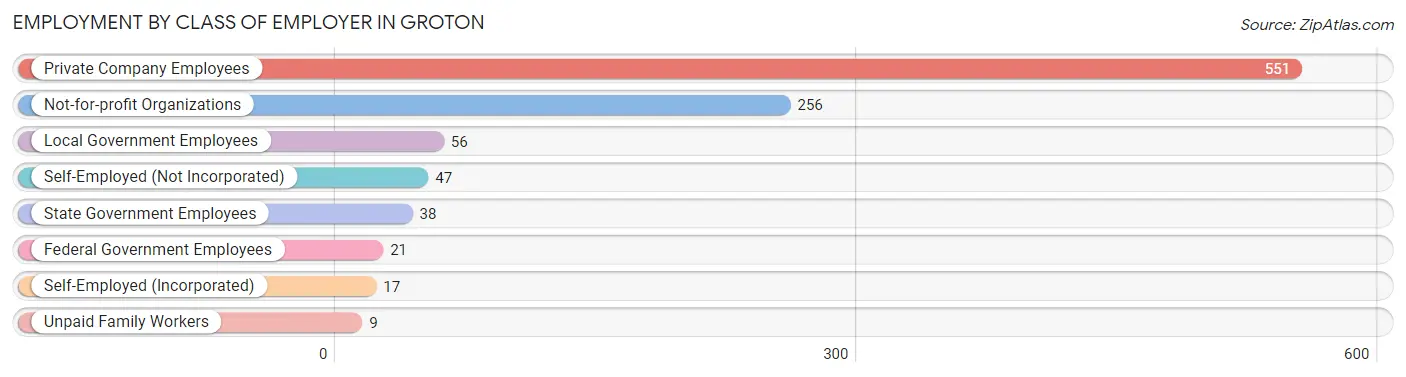
| Employer Class | # Employees | % Employees |
| Private Company Employees | 551 | 55.4% |
| Self-Employed (Incorporated) | 17 | 1.7% |
| Self-Employed (Not Incorporated) | 47 | 4.7% |
| Not-for-profit Organizations | 256 | 25.7% |
| Local Government Employees | 56 | 5.6% |
| State Government Employees | 38 | 3.8% |
| Federal Government Employees | 21 | 2.1% |
| Unpaid Family Workers | 9 | 0.9% |
| Total | 995 | 100.0% |
Employment Status by Age in Groton
According to the labor force statistics for Groton, out of the total population over 16 years of age (1,688), 62.4% or 1,053 individuals are in the labor force, with 2.6% or 27 of them unemployed. The age group with the highest labor force participation rate is 45 to 54 years, with 96.1% or 271 individuals in the labor force. Within the labor force, the 45 to 54 years age range has the highest percentage of unemployed individuals, with 6.3% or 17 of them being unemployed.
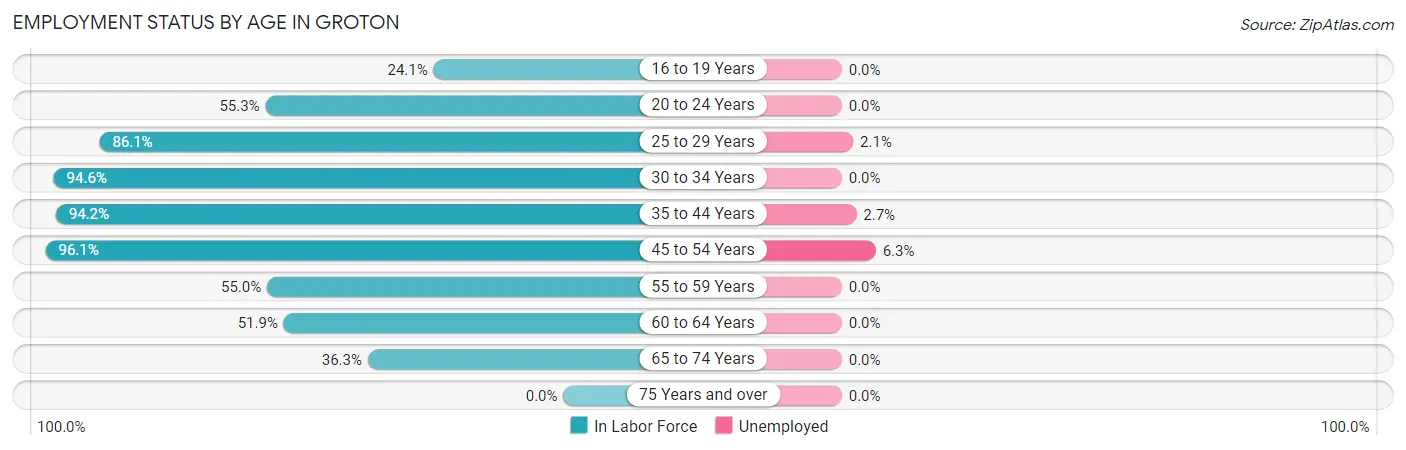
| Age Bracket | In Labor Force | Unemployed |
| 16 to 19 Years | 14 (24.1%) | 0 (0.0%) |
| 20 to 24 Years | 42 (55.3%) | 0 (0.0%) |
| 25 to 29 Years | 142 (86.1%) | 3 (2.1%) |
| 30 to 34 Years | 70 (94.6%) | 0 (0.0%) |
| 35 to 44 Years | 258 (94.2%) | 7 (2.7%) |
| 45 to 54 Years | 271 (96.1%) | 17 (6.3%) |
| 55 to 59 Years | 33 (55.0%) | 0 (0.0%) |
| 60 to 64 Years | 110 (51.9%) | 0 (0.0%) |
| 65 to 74 Years | 113 (36.3%) | 0 (0.0%) |
| 75 Years and over | 0 (0.0%) | 0 (0.0%) |
| Total | 1,053 (62.4%) | 27 (2.6%) |
Employment Status by Educational Attainment in Groton
According to labor force statistics for Groton, 82.8% of individuals (883) out of the total population between 25 and 64 years of age (1,067) are in the labor force, with 3.1% or 27 of them being unemployed. The group with the highest labor force participation rate are those with the educational attainment of bachelor's degree or higher, with 93.2% or 221 individuals in the labor force. Within the labor force, individuals with less than high school education have the highest percentage of unemployment, with 17.4% or 4 of them being unemployed.
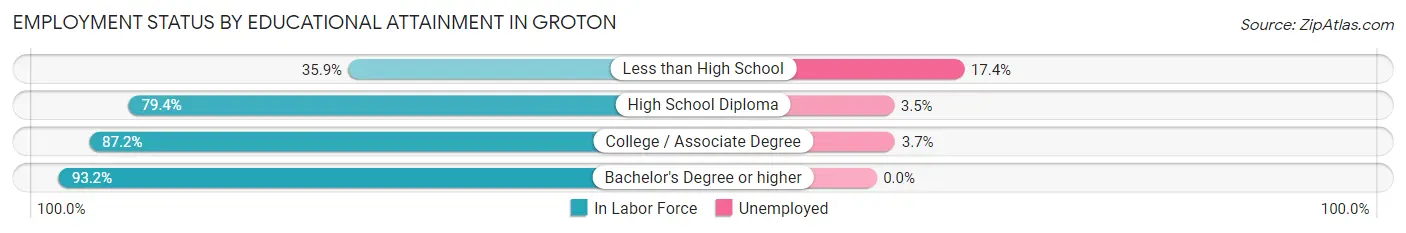
| Educational Attainment | In Labor Force | Unemployed |
| Less than High School | 23 (35.9%) | 11 (17.4%) |
| High School Diploma | 286 (79.4%) | 13 (3.5%) |
| College / Associate Degree | 354 (87.2%) | 15 (3.7%) |
| Bachelor's Degree or higher | 221 (93.2%) | 0 (0.0%) |
| Total | 883 (82.8%) | 33 (3.1%) |
Employment Occupations by Sex in Groton
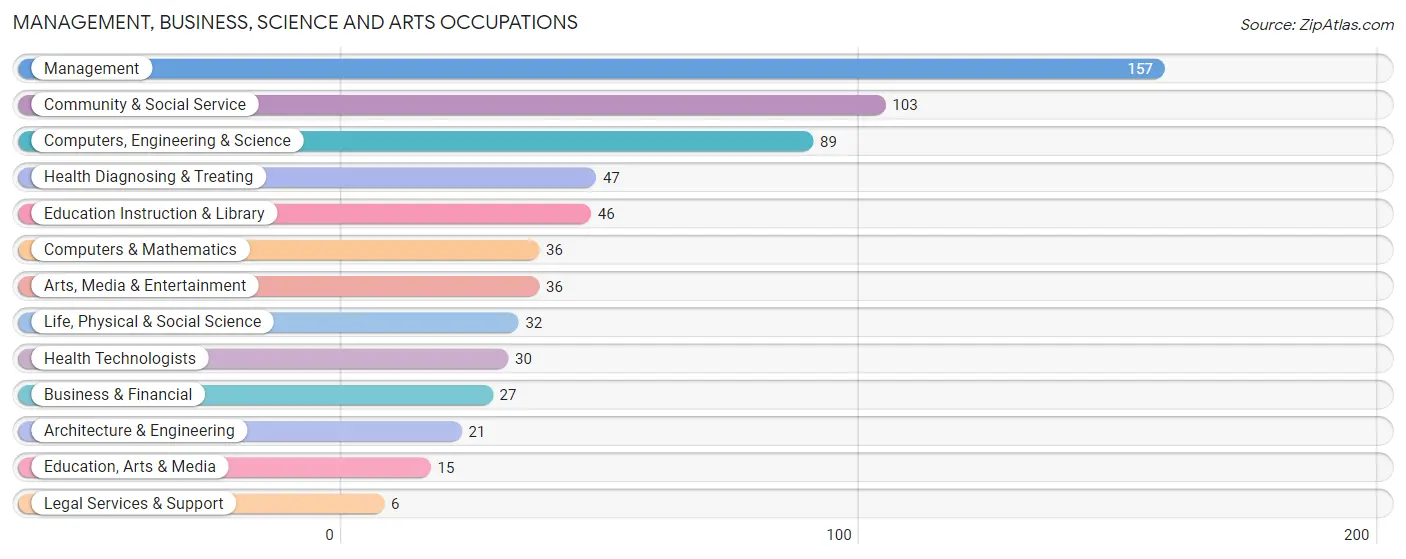
Management, Business, Science and Arts Occupations
The most common Management, Business, Science and Arts occupations in Groton are Management (157 | 15.3%), Community & Social Service (103 | 10.0%), Computers, Engineering & Science (89 | 8.7%), Health Diagnosing & Treating (47 | 4.6%), and Education Instruction & Library (46 | 4.5%).
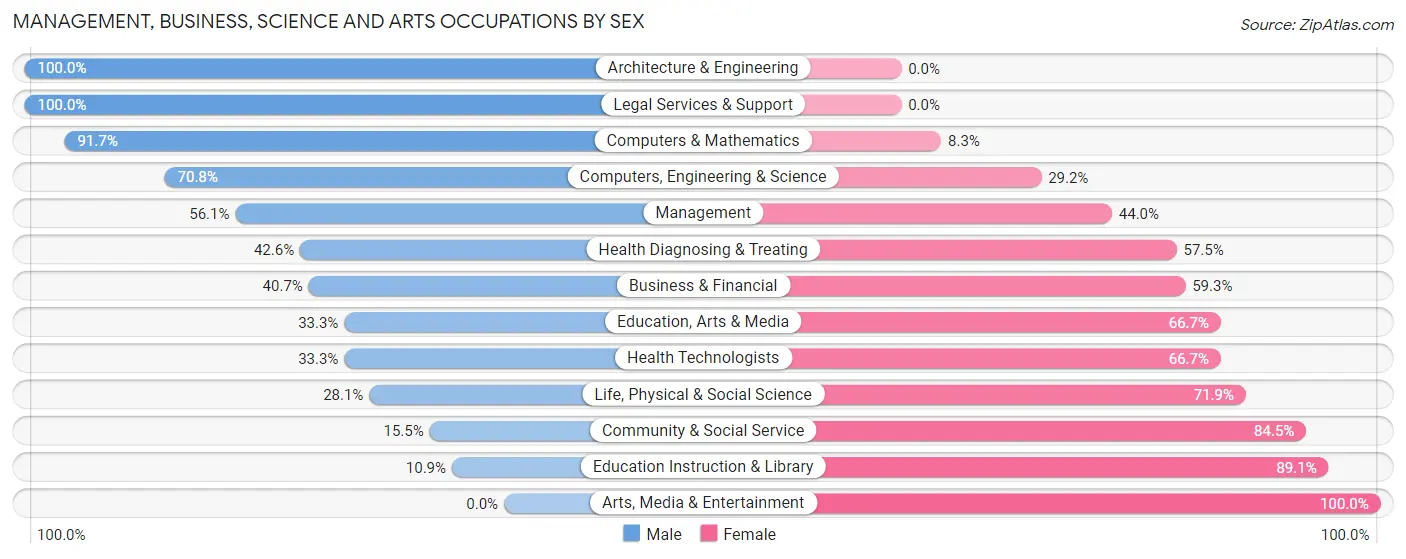
Management, Business, Science and Arts Occupations by Sex
Within the Management, Business, Science and Arts occupations in Groton, the most male-oriented occupations are Architecture & Engineering (100.0%), Legal Services & Support (100.0%), and Computers & Mathematics (91.7%), while the most female-oriented occupations are Arts, Media & Entertainment (100.0%), Education Instruction & Library (89.1%), and Community & Social Service (84.5%).
| Occupation | Male | Female |
| Management | 88 (56.0%) | 69 (44.0%) |
| Business & Financial | 11 (40.7%) | 16 (59.3%) |
| Computers, Engineering & Science | 63 (70.8%) | 26 (29.2%) |
| Computers & Mathematics | 33 (91.7%) | 3 (8.3%) |
| Architecture & Engineering | 21 (100.0%) | 0 (0.0%) |
| Life, Physical & Social Science | 9 (28.1%) | 23 (71.9%) |
| Community & Social Service | 16 (15.5%) | 87 (84.5%) |
| Education, Arts & Media | 5 (33.3%) | 10 (66.7%) |
| Legal Services & Support | 6 (100.0%) | 0 (0.0%) |
| Education Instruction & Library | 5 (10.9%) | 41 (89.1%) |
| Arts, Media & Entertainment | 0 (0.0%) | 36 (100.0%) |
| Health Diagnosing & Treating | 20 (42.5%) | 27 (57.5%) |
| Health Technologists | 10 (33.3%) | 20 (66.7%) |
| Total (Category) | 198 (46.8%) | 225 (53.2%) |
| Total (Overall) | 550 (53.6%) | 476 (46.4%) |
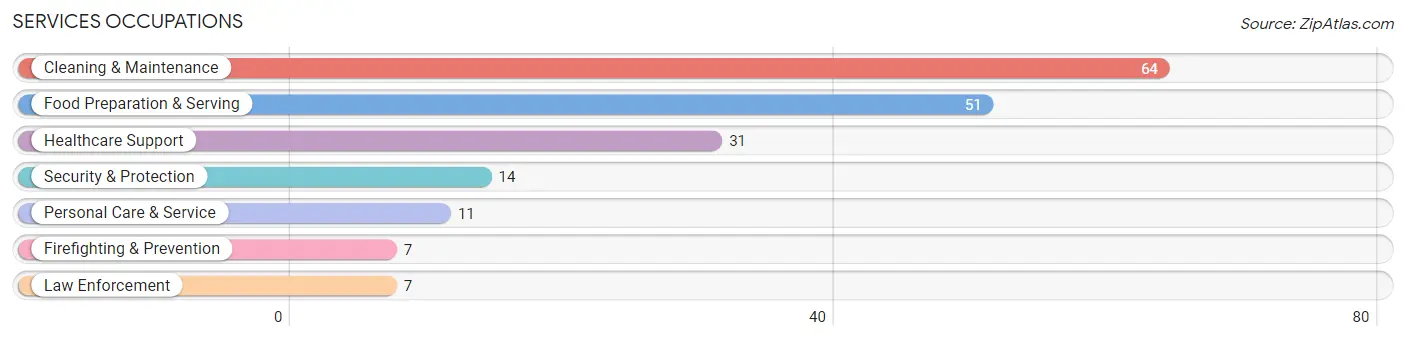
Services Occupations
The most common Services occupations in Groton are Cleaning & Maintenance (64 | 6.2%), Food Preparation & Serving (51 | 5.0%), Healthcare Support (31 | 3.0%), Security & Protection (14 | 1.4%), and Personal Care & Service (11 | 1.1%).
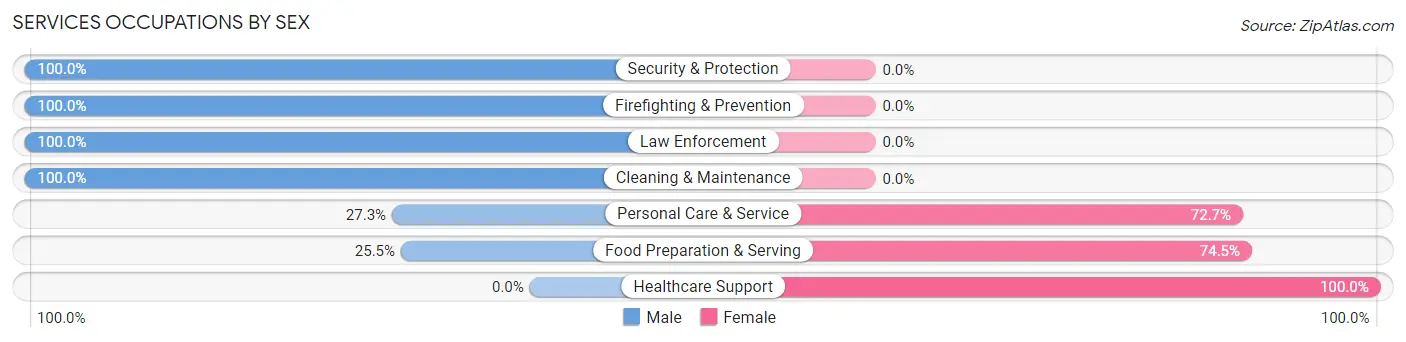
Services Occupations by Sex
Within the Services occupations in Groton, the most male-oriented occupations are Security & Protection (100.0%), Firefighting & Prevention (100.0%), and Law Enforcement (100.0%), while the most female-oriented occupations are Healthcare Support (100.0%), Food Preparation & Serving (74.5%), and Personal Care & Service (72.7%).
| Occupation | Male | Female |
| Healthcare Support | 0 (0.0%) | 31 (100.0%) |
| Security & Protection | 14 (100.0%) | 0 (0.0%) |
| Firefighting & Prevention | 7 (100.0%) | 0 (0.0%) |
| Law Enforcement | 7 (100.0%) | 0 (0.0%) |
| Food Preparation & Serving | 13 (25.5%) | 38 (74.5%) |
| Cleaning & Maintenance | 64 (100.0%) | 0 (0.0%) |
| Personal Care & Service | 3 (27.3%) | 8 (72.7%) |
| Total (Category) | 94 (55.0%) | 77 (45.0%) |
| Total (Overall) | 550 (53.6%) | 476 (46.4%) |
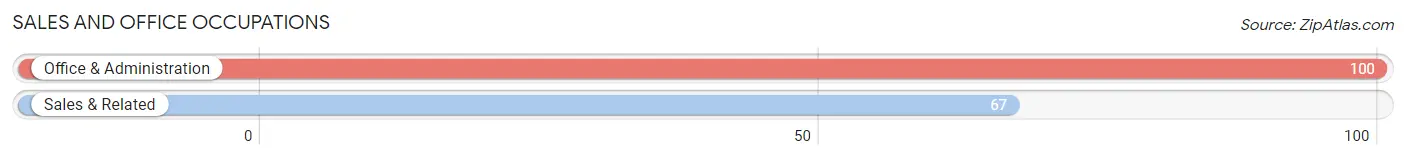
Sales and Office Occupations
The most common Sales and Office occupations in Groton are Office & Administration (100 | 9.8%), and Sales & Related (67 | 6.5%).
Sales and Office Occupations by Sex
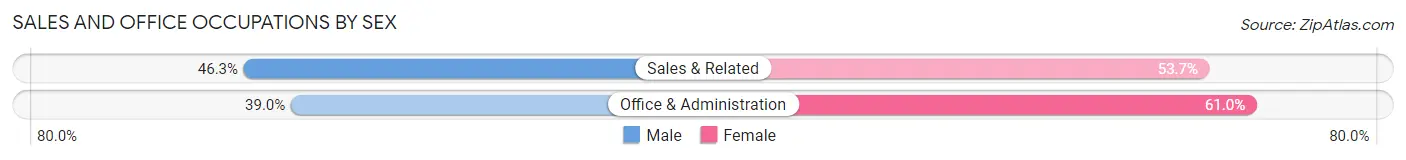
| Occupation | Male | Female |
| Sales & Related | 31 (46.3%) | 36 (53.7%) |
| Office & Administration | 39 (39.0%) | 61 (61.0%) |
| Total (Category) | 70 (41.9%) | 97 (58.1%) |
| Total (Overall) | 550 (53.6%) | 476 (46.4%) |
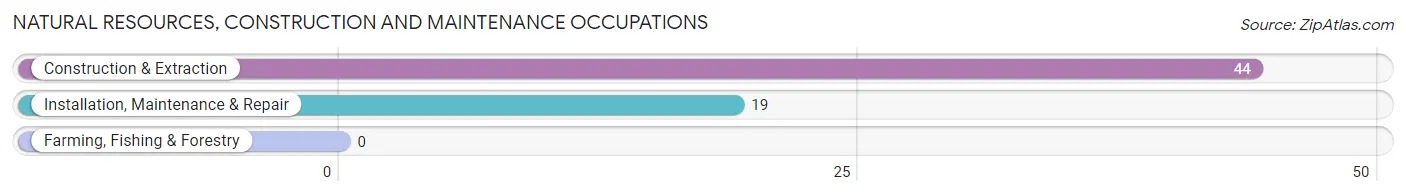
Natural Resources, Construction and Maintenance Occupations
The most common Natural Resources, Construction and Maintenance occupations in Groton are Construction & Extraction (44 | 4.3%), and Installation, Maintenance & Repair (19 | 1.8%).
Natural Resources, Construction and Maintenance Occupations by Sex
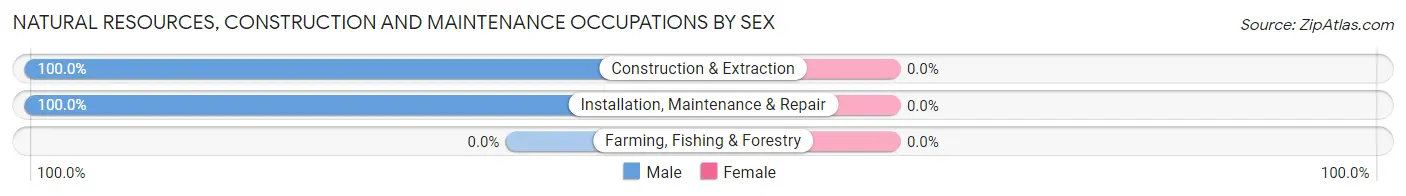
| Occupation | Male | Female |
| Farming, Fishing & Forestry | 0 (0.0%) | 0 (0.0%) |
| Construction & Extraction | 44 (100.0%) | 0 (0.0%) |
| Installation, Maintenance & Repair | 19 (100.0%) | 0 (0.0%) |
| Total (Category) | 63 (100.0%) | 0 (0.0%) |
| Total (Overall) | 550 (53.6%) | 476 (46.4%) |
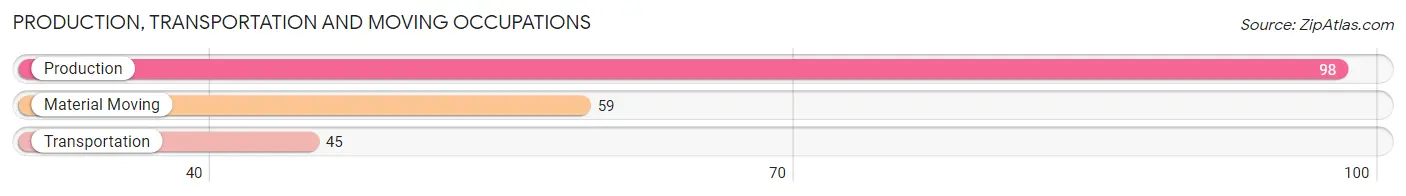
Production, Transportation and Moving Occupations
The most common Production, Transportation and Moving occupations in Groton are Production (98 | 9.6%), Material Moving (59 | 5.8%), and Transportation (45 | 4.4%).
Production, Transportation and Moving Occupations by Sex
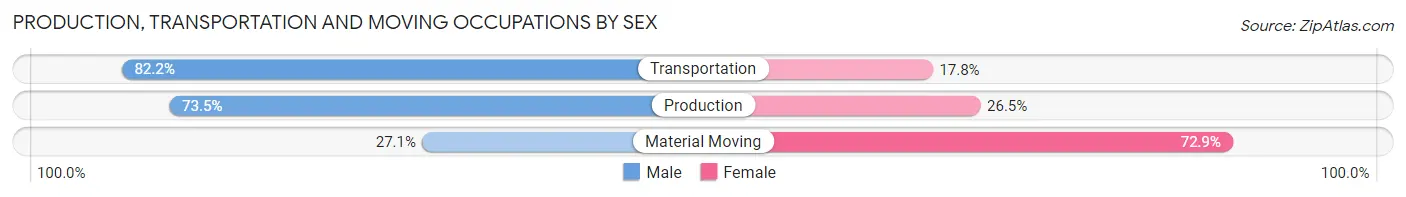
| Occupation | Male | Female |
| Production | 72 (73.5%) | 26 (26.5%) |
| Transportation | 37 (82.2%) | 8 (17.8%) |
| Material Moving | 16 (27.1%) | 43 (72.9%) |
| Total (Category) | 125 (61.9%) | 77 (38.1%) |
| Total (Overall) | 550 (53.6%) | 476 (46.4%) |
Employment Industries by Sex in Groton
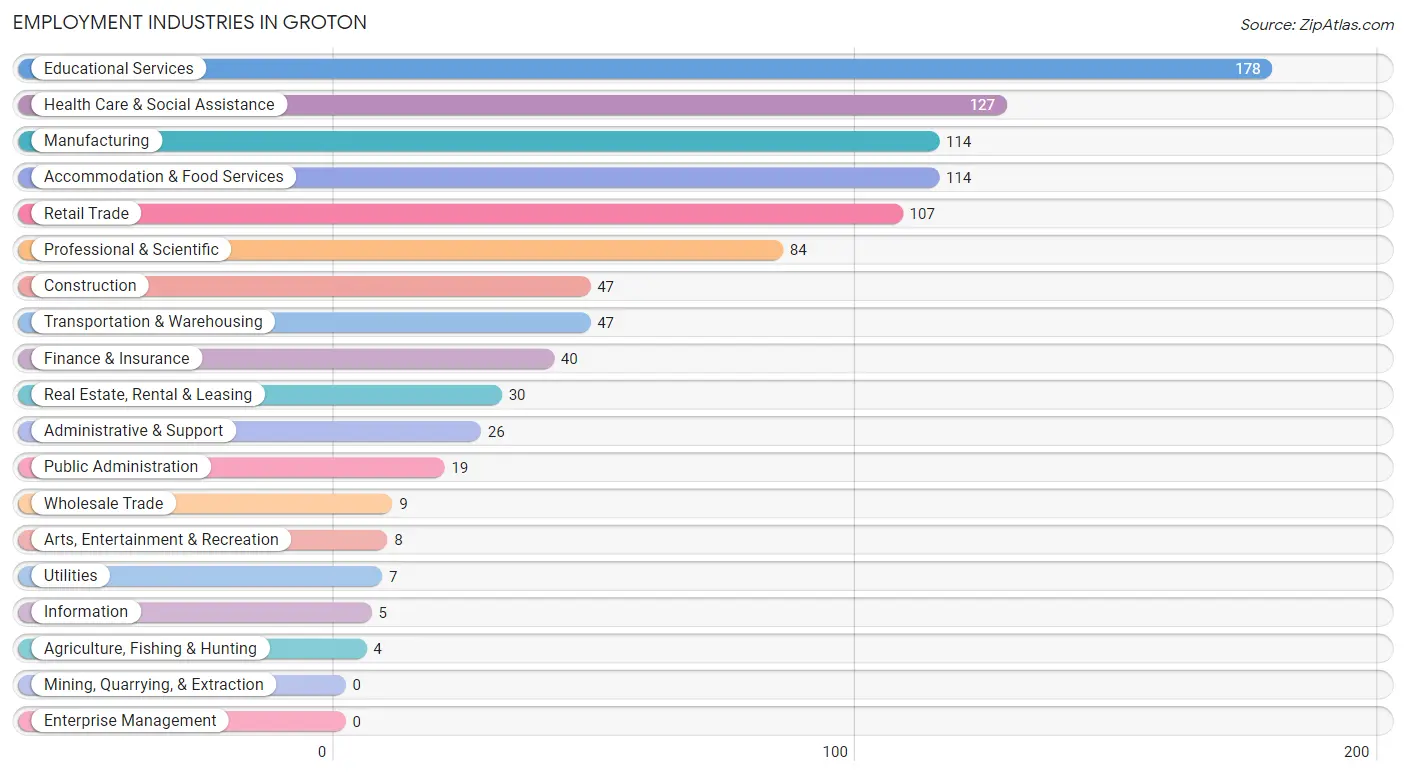
Employment Industries in Groton
The major employment industries in Groton include Educational Services (178 | 17.3%), Health Care & Social Assistance (127 | 12.4%), Manufacturing (114 | 11.1%), Accommodation & Food Services (114 | 11.1%), and Retail Trade (107 | 10.4%).
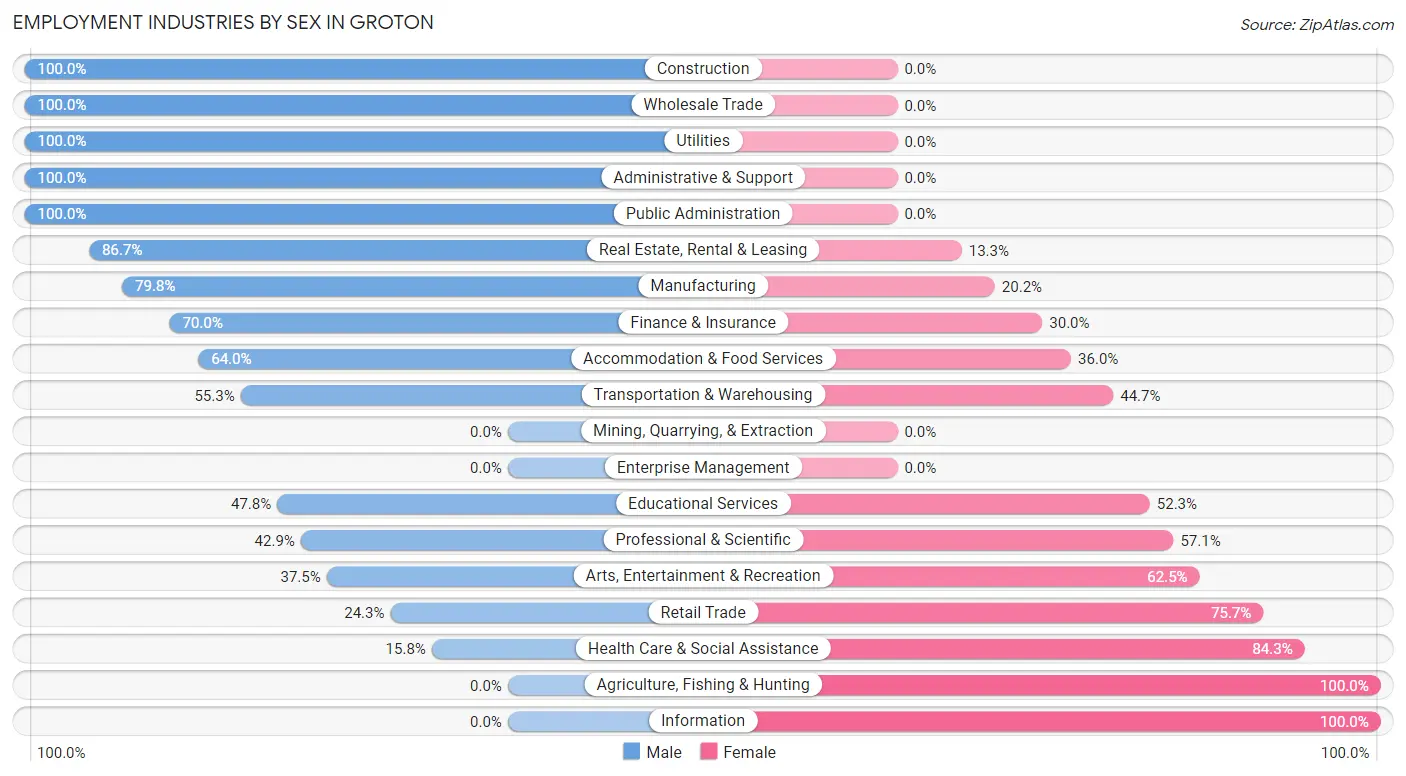
Employment Industries by Sex in Groton
The Groton industries that see more men than women are Construction (100.0%), Wholesale Trade (100.0%), and Utilities (100.0%), whereas the industries that tend to have a higher number of women are Agriculture, Fishing & Hunting (100.0%), Information (100.0%), and Health Care & Social Assistance (84.3%).
| Industry | Male | Female |
| Agriculture, Fishing & Hunting | 0 (0.0%) | 4 (100.0%) |
| Mining, Quarrying, & Extraction | 0 (0.0%) | 0 (0.0%) |
| Construction | 47 (100.0%) | 0 (0.0%) |
| Manufacturing | 91 (79.8%) | 23 (20.2%) |
| Wholesale Trade | 9 (100.0%) | 0 (0.0%) |
| Retail Trade | 26 (24.3%) | 81 (75.7%) |
| Transportation & Warehousing | 26 (55.3%) | 21 (44.7%) |
| Utilities | 7 (100.0%) | 0 (0.0%) |
| Information | 0 (0.0%) | 5 (100.0%) |
| Finance & Insurance | 28 (70.0%) | 12 (30.0%) |
| Real Estate, Rental & Leasing | 26 (86.7%) | 4 (13.3%) |
| Professional & Scientific | 36 (42.9%) | 48 (57.1%) |
| Enterprise Management | 0 (0.0%) | 0 (0.0%) |
| Administrative & Support | 26 (100.0%) | 0 (0.0%) |
| Educational Services | 85 (47.7%) | 93 (52.2%) |
| Health Care & Social Assistance | 20 (15.8%) | 107 (84.3%) |
| Arts, Entertainment & Recreation | 3 (37.5%) | 5 (62.5%) |
| Accommodation & Food Services | 73 (64.0%) | 41 (36.0%) |
| Public Administration | 19 (100.0%) | 0 (0.0%) |
| Total | 550 (53.6%) | 476 (46.4%) |
Education in Groton
School Enrollment in Groton
The most common levels of schooling among the 396 students in Groton are middle school (112 | 28.3%), high school (95 | 24.0%), and college / undergraduate (72 | 18.2%).
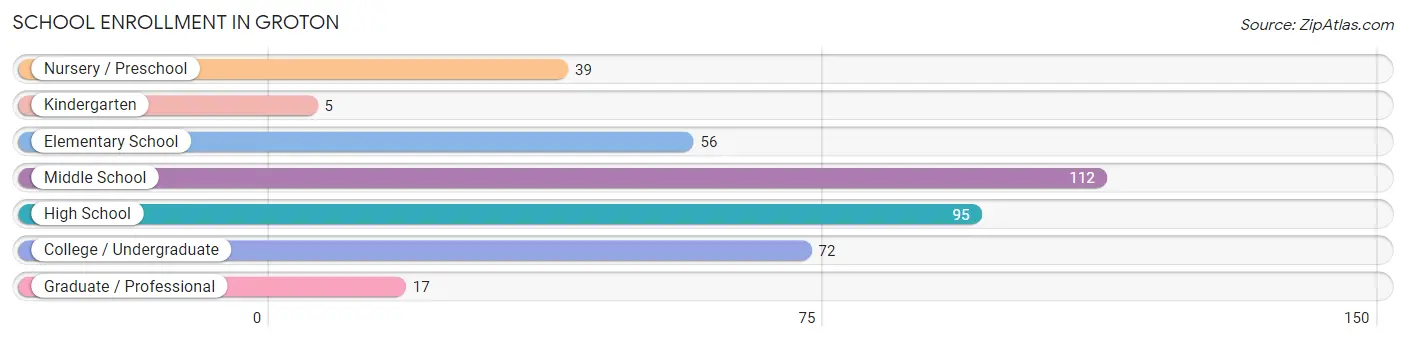
| School Level | # Students | % Students |
| Nursery / Preschool | 39 | 9.9% |
| Kindergarten | 5 | 1.3% |
| Elementary School | 56 | 14.1% |
| Middle School | 112 | 28.3% |
| High School | 95 | 24.0% |
| College / Undergraduate | 72 | 18.2% |
| Graduate / Professional | 17 | 4.3% |
| Total | 396 | 100.0% |
School Enrollment by Age by Funding Source in Groton
Out of a total of 396 students who are enrolled in schools in Groton, 72 (18.2%) attend a private institution, while the remaining 324 (81.8%) are enrolled in public schools. The age group of 20 to 24 year olds has the highest likelihood of being enrolled in private schools, with 9 (42.9% in the age bracket) enrolled. Conversely, the age group of 18 to 19 year olds has the lowest likelihood of being enrolled in a private school, with 3 (100.0% in the age bracket) attending a public institution.
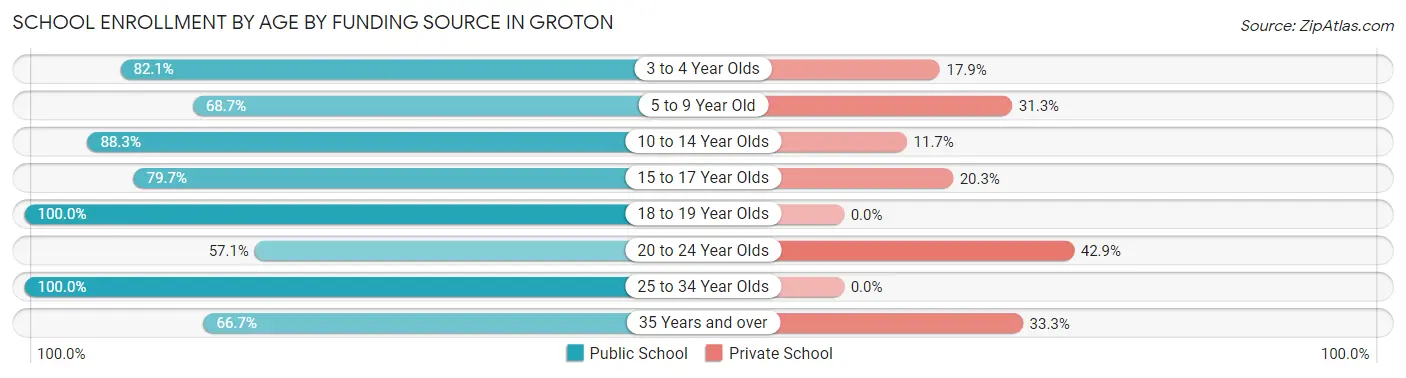
| Age Bracket | Public School | Private School |
| 3 to 4 Year Olds | 23 (82.1%) | 5 (17.9%) |
| 5 to 9 Year Old | 46 (68.7%) | 21 (31.3%) |
| 10 to 14 Year Olds | 128 (88.3%) | 17 (11.7%) |
| 15 to 17 Year Olds | 51 (79.7%) | 13 (20.3%) |
| 18 to 19 Year Olds | 3 (100.0%) | 0 (0.0%) |
| 20 to 24 Year Olds | 12 (57.1%) | 9 (42.9%) |
| 25 to 34 Year Olds | 47 (100.0%) | 0 (0.0%) |
| 35 Years and over | 14 (66.7%) | 7 (33.3%) |
| Total | 324 (81.8%) | 72 (18.2%) |
Educational Attainment by Field of Study in Groton
Education (51 | 16.1%), bio, nature & agricultural (37 | 11.7%), arts & humanities (34 | 10.7%), psychology (31 | 9.8%), and visual & performing arts (28 | 8.8%) are the most common fields of study among 317 individuals in Groton who have obtained a bachelor's degree or higher.
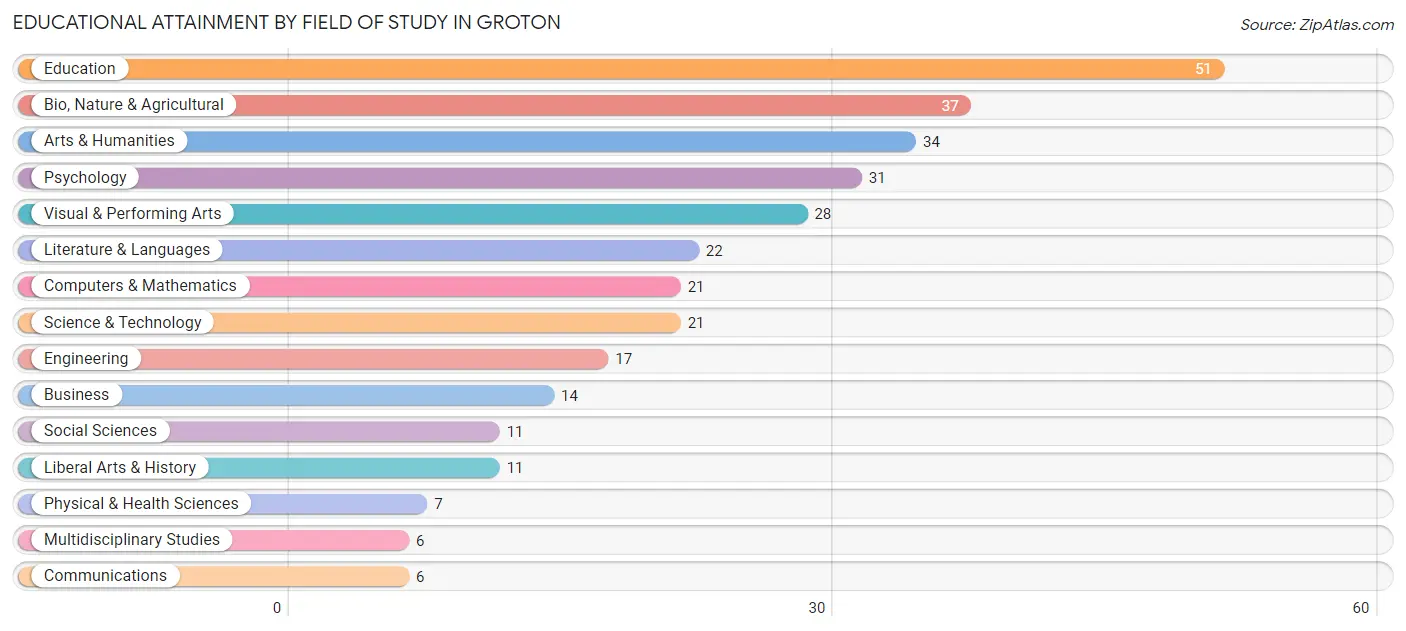
| Field of Study | # Graduates | % Graduates |
| Computers & Mathematics | 21 | 6.6% |
| Bio, Nature & Agricultural | 37 | 11.7% |
| Physical & Health Sciences | 7 | 2.2% |
| Psychology | 31 | 9.8% |
| Social Sciences | 11 | 3.5% |
| Engineering | 17 | 5.4% |
| Multidisciplinary Studies | 6 | 1.9% |
| Science & Technology | 21 | 6.6% |
| Business | 14 | 4.4% |
| Education | 51 | 16.1% |
| Literature & Languages | 22 | 6.9% |
| Liberal Arts & History | 11 | 3.5% |
| Visual & Performing Arts | 28 | 8.8% |
| Communications | 6 | 1.9% |
| Arts & Humanities | 34 | 10.7% |
| Total | 317 | 100.0% |
Transportation & Commute in Groton
Vehicle Availability by Sex in Groton
The most prevalent vehicle ownership categories in Groton are males with 2 vehicles (252, accounting for 47.9%) and females with 2 vehicles (152, making up 53.7%).
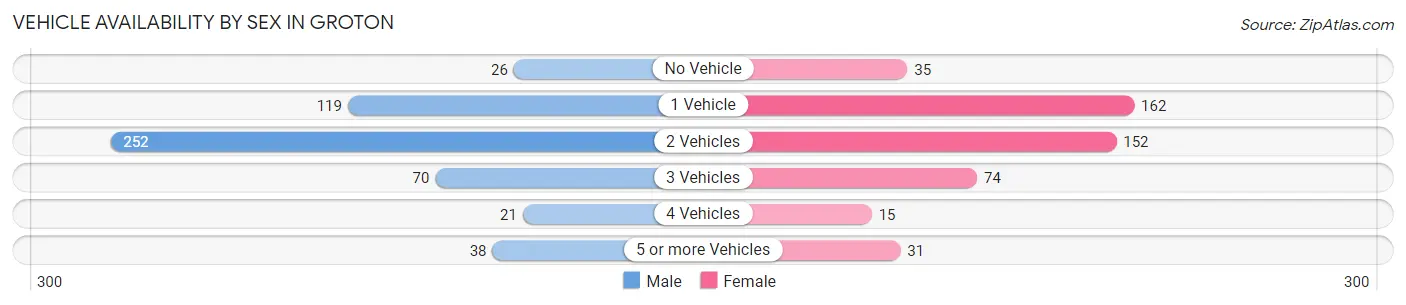
| Vehicles Available | Male | Female |
| No Vehicle | 26 (4.9%) | 35 (7.5%) |
| 1 Vehicle | 119 (22.6%) | 162 (34.5%) |
| 2 Vehicles | 252 (47.9%) | 152 (32.4%) |
| 3 Vehicles | 70 (13.3%) | 74 (15.8%) |
| 4 Vehicles | 21 (4.0%) | 15 (3.2%) |
| 5 or more Vehicles | 38 (7.2%) | 31 (6.6%) |
| Total | 526 (100.0%) | 469 (100.0%) |
Commute Time in Groton
The most frequently occuring commute durations in Groton are 20 to 24 minutes (138 commuters, 15.0%), 30 to 34 minutes (138 commuters, 15.0%), and 15 to 19 minutes (125 commuters, 13.6%).
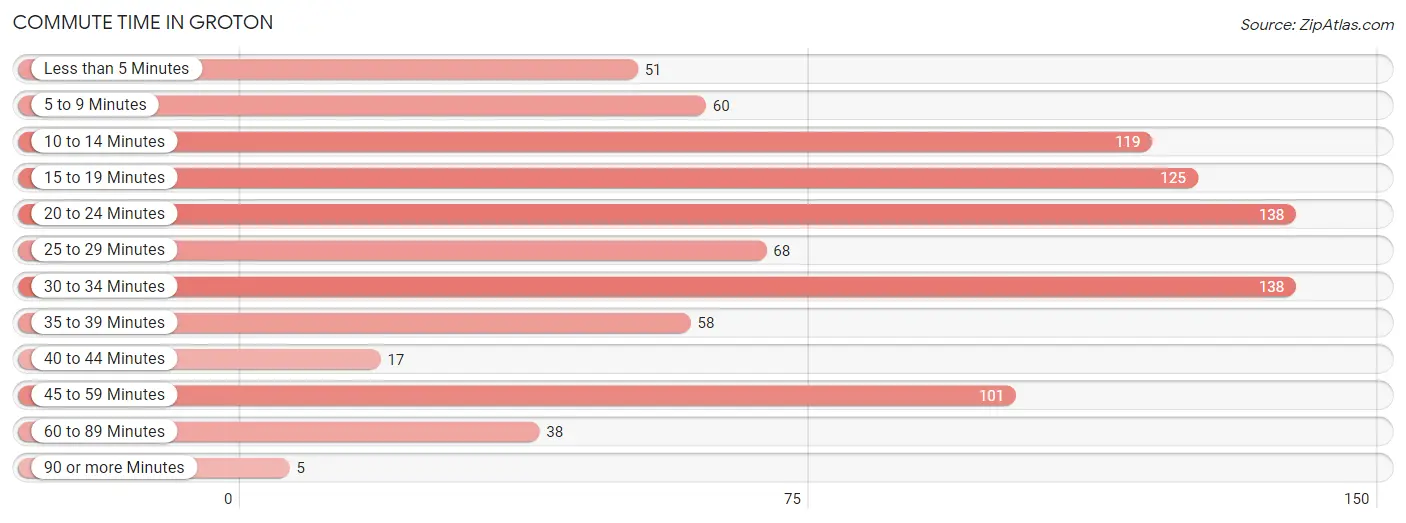
| Commute Time | # Commuters | % Commuters |
| Less than 5 Minutes | 51 | 5.6% |
| 5 to 9 Minutes | 60 | 6.5% |
| 10 to 14 Minutes | 119 | 13.0% |
| 15 to 19 Minutes | 125 | 13.6% |
| 20 to 24 Minutes | 138 | 15.0% |
| 25 to 29 Minutes | 68 | 7.4% |
| 30 to 34 Minutes | 138 | 15.0% |
| 35 to 39 Minutes | 58 | 6.3% |
| 40 to 44 Minutes | 17 | 1.8% |
| 45 to 59 Minutes | 101 | 11.0% |
| 60 to 89 Minutes | 38 | 4.1% |
| 90 or more Minutes | 5 | 0.5% |
Commute Time by Sex in Groton
The most common commute times in Groton are 10 to 14 minutes (102 commuters, 20.5%) for males and 15 to 19 minutes (76 commuters, 18.0%) for females.
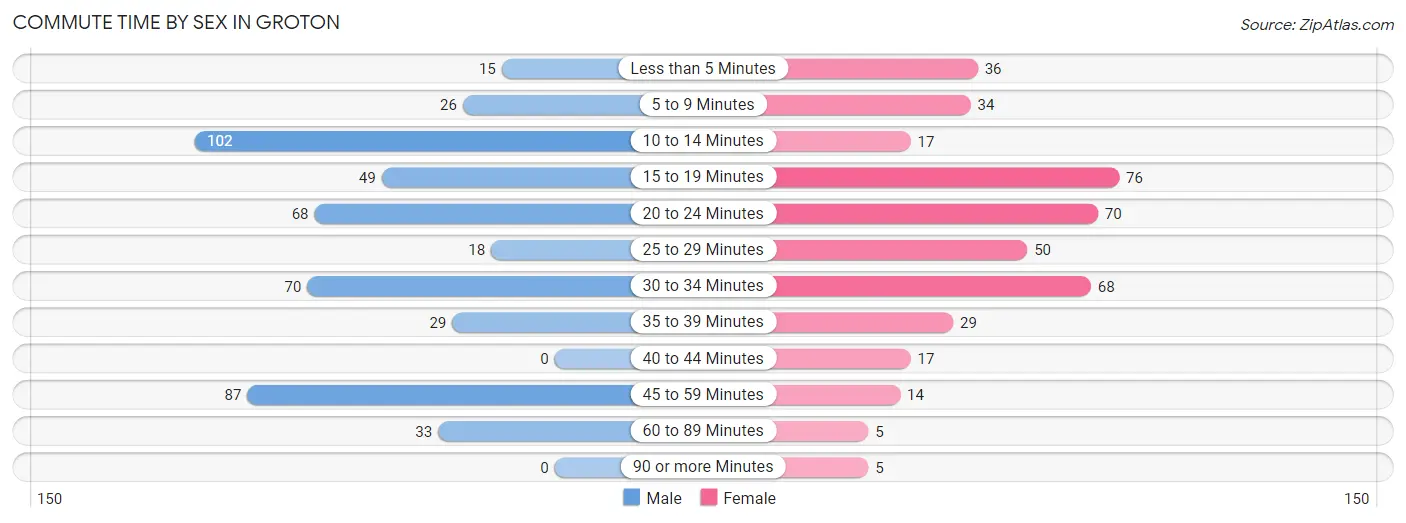
| Commute Time | Male | Female |
| Less than 5 Minutes | 15 (3.0%) | 36 (8.6%) |
| 5 to 9 Minutes | 26 (5.2%) | 34 (8.1%) |
| 10 to 14 Minutes | 102 (20.5%) | 17 (4.0%) |
| 15 to 19 Minutes | 49 (9.9%) | 76 (18.0%) |
| 20 to 24 Minutes | 68 (13.7%) | 70 (16.6%) |
| 25 to 29 Minutes | 18 (3.6%) | 50 (11.9%) |
| 30 to 34 Minutes | 70 (14.1%) | 68 (16.2%) |
| 35 to 39 Minutes | 29 (5.8%) | 29 (6.9%) |
| 40 to 44 Minutes | 0 (0.0%) | 17 (4.0%) |
| 45 to 59 Minutes | 87 (17.5%) | 14 (3.3%) |
| 60 to 89 Minutes | 33 (6.6%) | 5 (1.2%) |
| 90 or more Minutes | 0 (0.0%) | 5 (1.2%) |
Time of Departure to Work by Sex in Groton
The most frequent times of departure to work in Groton are 6:30 AM to 6:59 AM (106, 21.3%) for males and 6:00 AM to 6:29 AM (72, 17.1%) for females.
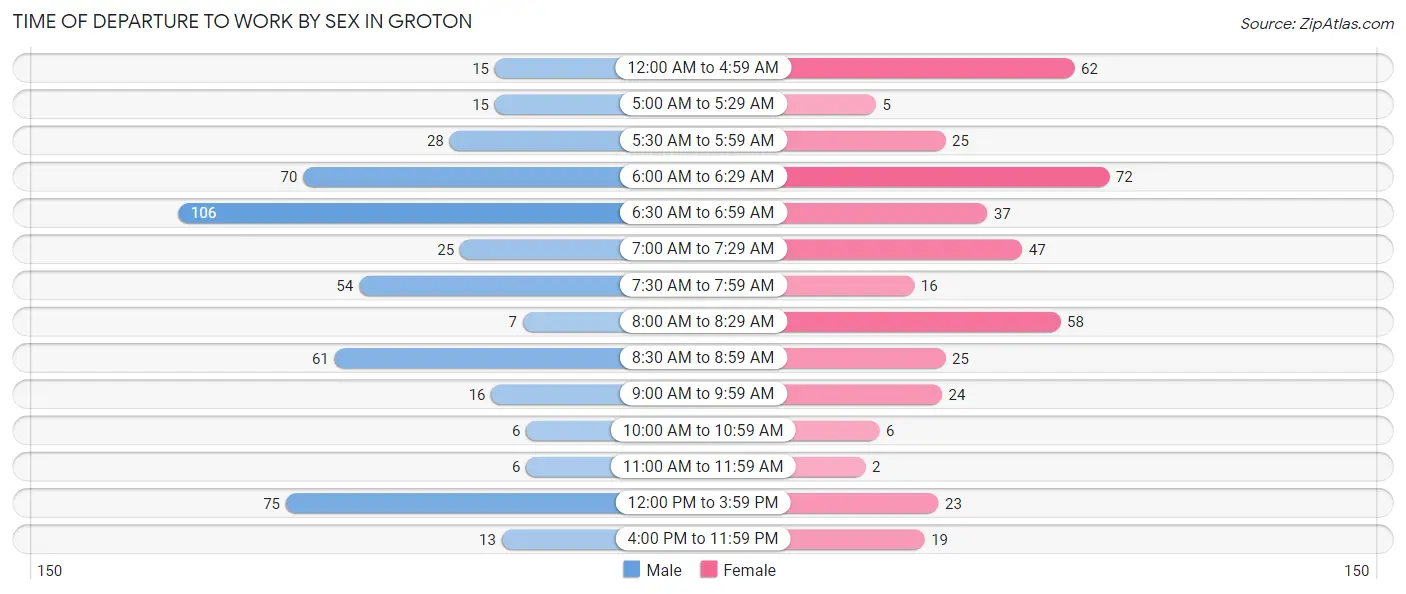
| Time of Departure | Male | Female |
| 12:00 AM to 4:59 AM | 15 (3.0%) | 62 (14.7%) |
| 5:00 AM to 5:29 AM | 15 (3.0%) | 5 (1.2%) |
| 5:30 AM to 5:59 AM | 28 (5.6%) | 25 (5.9%) |
| 6:00 AM to 6:29 AM | 70 (14.1%) | 72 (17.1%) |
| 6:30 AM to 6:59 AM | 106 (21.3%) | 37 (8.8%) |
| 7:00 AM to 7:29 AM | 25 (5.0%) | 47 (11.2%) |
| 7:30 AM to 7:59 AM | 54 (10.9%) | 16 (3.8%) |
| 8:00 AM to 8:29 AM | 7 (1.4%) | 58 (13.8%) |
| 8:30 AM to 8:59 AM | 61 (12.3%) | 25 (5.9%) |
| 9:00 AM to 9:59 AM | 16 (3.2%) | 24 (5.7%) |
| 10:00 AM to 10:59 AM | 6 (1.2%) | 6 (1.4%) |
| 11:00 AM to 11:59 AM | 6 (1.2%) | 2 (0.5%) |
| 12:00 PM to 3:59 PM | 75 (15.1%) | 23 (5.5%) |
| 4:00 PM to 11:59 PM | 13 (2.6%) | 19 (4.5%) |
| Total | 497 (100.0%) | 421 (100.0%) |
Housing Occupancy in Groton
Occupancy by Ownership in Groton
Of the total 937 dwellings in Groton, owner-occupied units account for 613 (65.4%), while renter-occupied units make up 324 (34.6%).
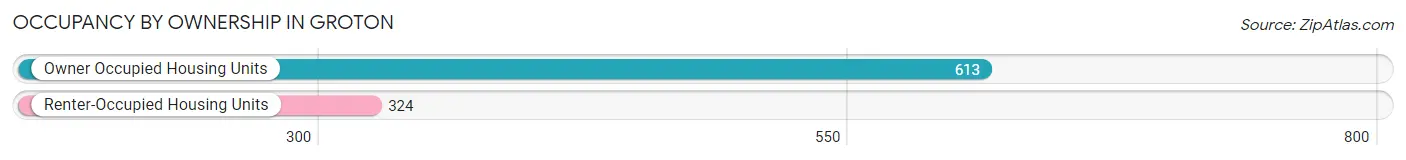
| Occupancy | # Housing Units | % Housing Units |
| Owner Occupied Housing Units | 613 | 65.4% |
| Renter-Occupied Housing Units | 324 | 34.6% |
| Total Occupied Housing Units | 937 | 100.0% |
Occupancy by Household Size in Groton
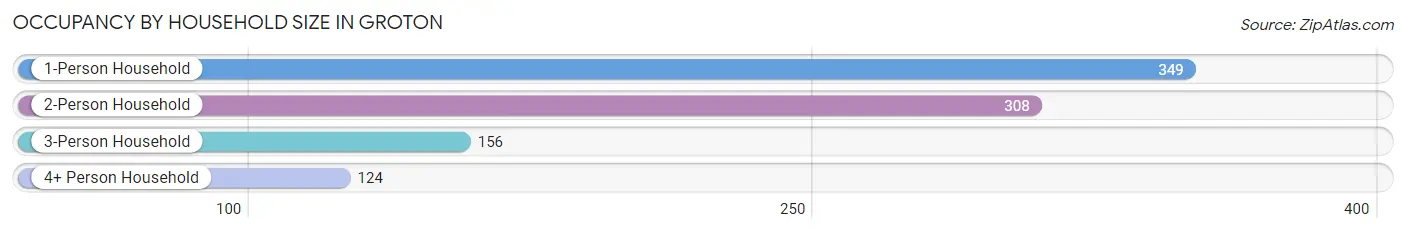
| Household Size | # Housing Units | % Housing Units |
| 1-Person Household | 349 | 37.2% |
| 2-Person Household | 308 | 32.9% |
| 3-Person Household | 156 | 16.7% |
| 4+ Person Household | 124 | 13.2% |
| Total Housing Units | 937 | 100.0% |
Occupancy by Ownership by Household Size in Groton
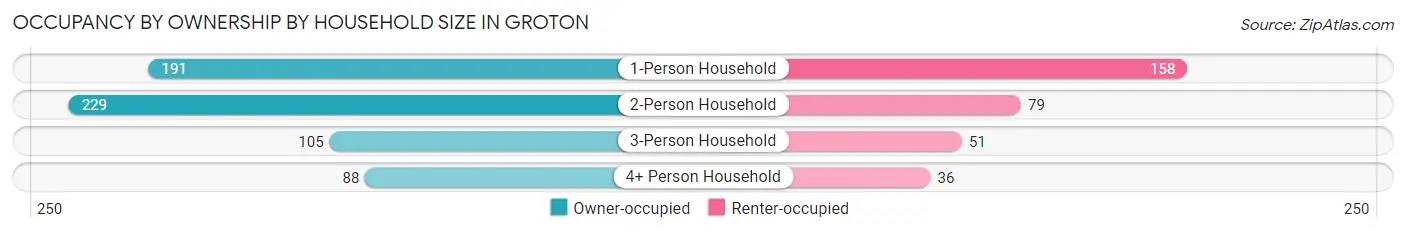
| Household Size | Owner-occupied | Renter-occupied |
| 1-Person Household | 191 (54.7%) | 158 (45.3%) |
| 2-Person Household | 229 (74.4%) | 79 (25.7%) |
| 3-Person Household | 105 (67.3%) | 51 (32.7%) |
| 4+ Person Household | 88 (71.0%) | 36 (29.0%) |
| Total Housing Units | 613 (65.4%) | 324 (34.6%) |
Occupancy by Educational Attainment in Groton
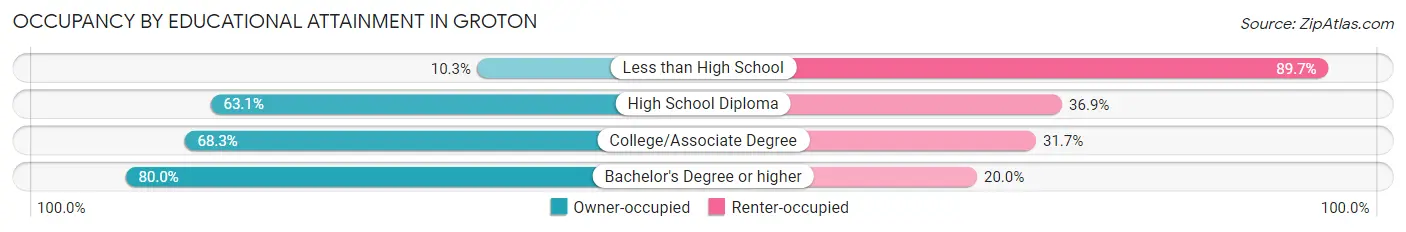
| Household Size | Owner-occupied | Renter-occupied |
| Less than High School | 6 (10.3%) | 52 (89.7%) |
| High School Diploma | 226 (63.1%) | 132 (36.9%) |
| College/Associate Degree | 209 (68.3%) | 97 (31.7%) |
| Bachelor's Degree or higher | 172 (80.0%) | 43 (20.0%) |
Occupancy by Age of Householder in Groton
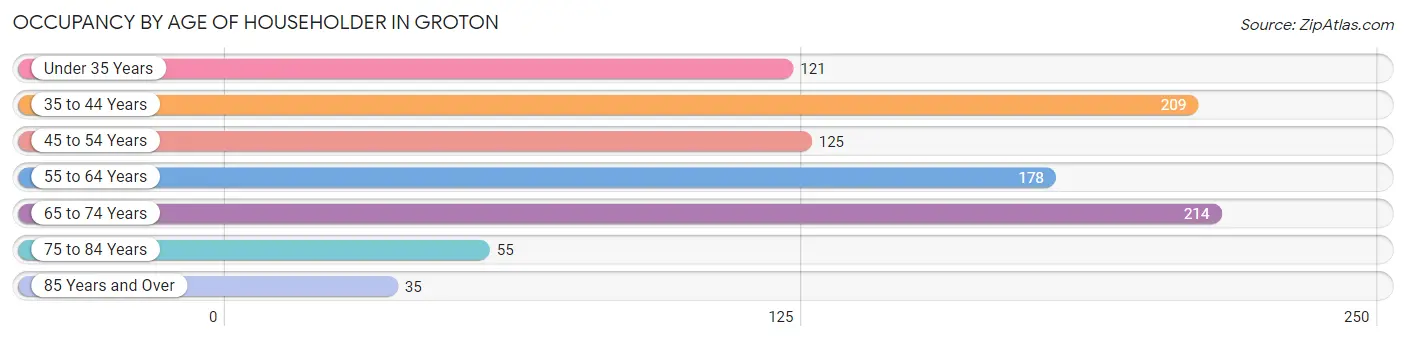
| Age Bracket | # Households | % Households |
| Under 35 Years | 121 | 12.9% |
| 35 to 44 Years | 209 | 22.3% |
| 45 to 54 Years | 125 | 13.3% |
| 55 to 64 Years | 178 | 19.0% |
| 65 to 74 Years | 214 | 22.8% |
| 75 to 84 Years | 55 | 5.9% |
| 85 Years and Over | 35 | 3.7% |
| Total | 937 | 100.0% |
Housing Finances in Groton
Median Income by Occupancy in Groton
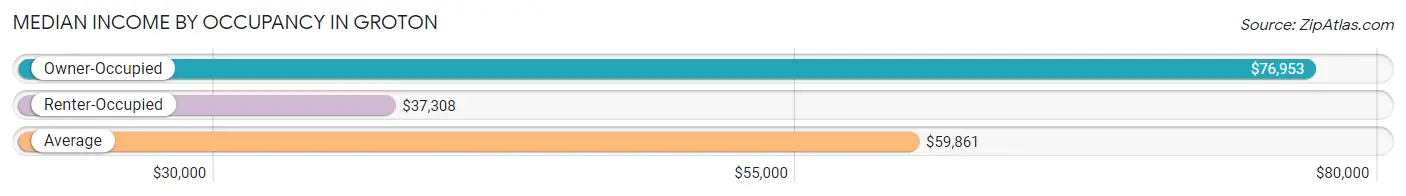
| Occupancy Type | # Households | Median Income |
| Owner-Occupied | 613 (65.4%) | $76,953 |
| Renter-Occupied | 324 (34.6%) | $37,308 |
| Average | 937 (100.0%) | $59,861 |
Occupancy by Householder Income Bracket in Groton
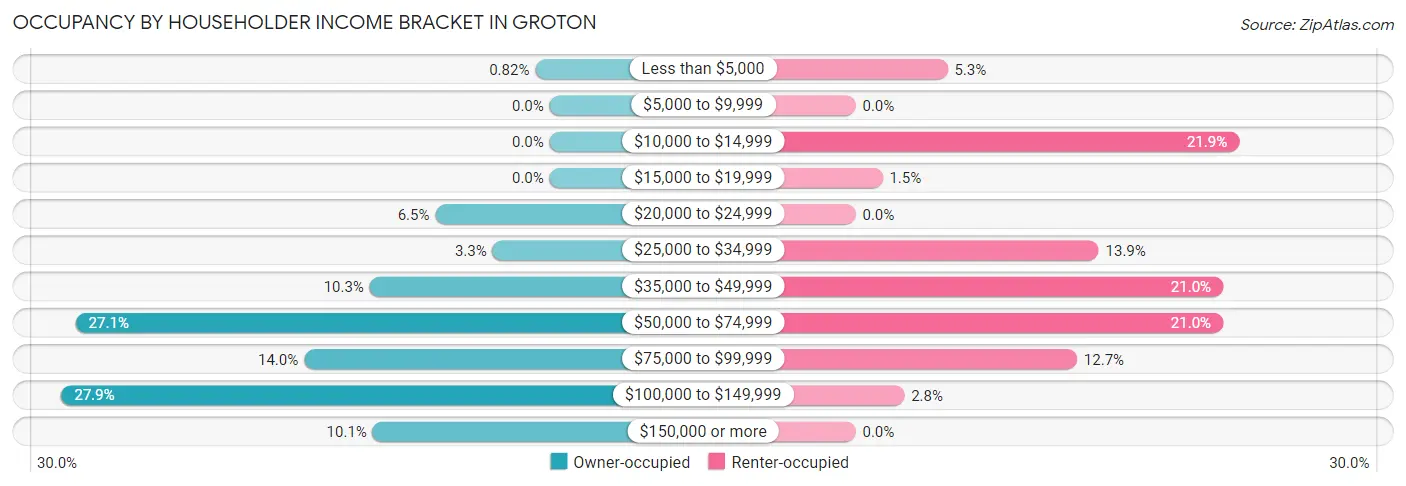
| Income Bracket | Owner-occupied | Renter-occupied |
| Less than $5,000 | 5 (0.8%) | 17 (5.2%) |
| $5,000 to $9,999 | 0 (0.0%) | 0 (0.0%) |
| $10,000 to $14,999 | 0 (0.0%) | 71 (21.9%) |
| $15,000 to $19,999 | 0 (0.0%) | 5 (1.5%) |
| $20,000 to $24,999 | 40 (6.5%) | 0 (0.0%) |
| $25,000 to $34,999 | 20 (3.3%) | 45 (13.9%) |
| $35,000 to $49,999 | 63 (10.3%) | 68 (21.0%) |
| $50,000 to $74,999 | 166 (27.1%) | 68 (21.0%) |
| $75,000 to $99,999 | 86 (14.0%) | 41 (12.7%) |
| $100,000 to $149,999 | 171 (27.9%) | 9 (2.8%) |
| $150,000 or more | 62 (10.1%) | 0 (0.0%) |
| Total | 613 (100.0%) | 324 (100.0%) |
Monthly Housing Cost Tiers in Groton
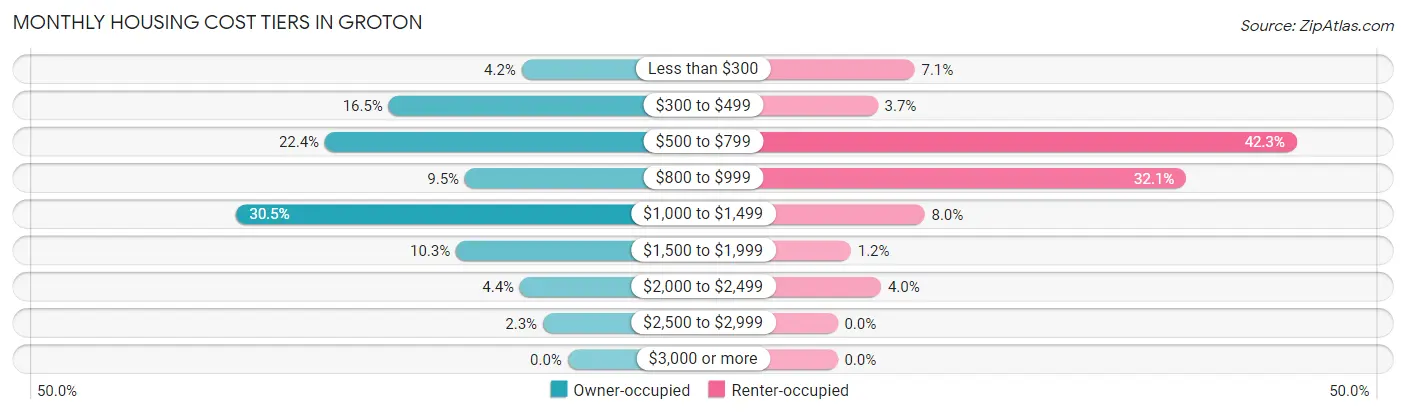
| Monthly Cost | Owner-occupied | Renter-occupied |
| Less than $300 | 26 (4.2%) | 23 (7.1%) |
| $300 to $499 | 101 (16.5%) | 12 (3.7%) |
| $500 to $799 | 137 (22.4%) | 137 (42.3%) |
| $800 to $999 | 58 (9.5%) | 104 (32.1%) |
| $1,000 to $1,499 | 187 (30.5%) | 26 (8.0%) |
| $1,500 to $1,999 | 63 (10.3%) | 4 (1.2%) |
| $2,000 to $2,499 | 27 (4.4%) | 13 (4.0%) |
| $2,500 to $2,999 | 14 (2.3%) | 0 (0.0%) |
| $3,000 or more | 0 (0.0%) | 0 (0.0%) |
| Total | 613 (100.0%) | 324 (100.0%) |
Physical Housing Characteristics in Groton
Housing Structures in Groton
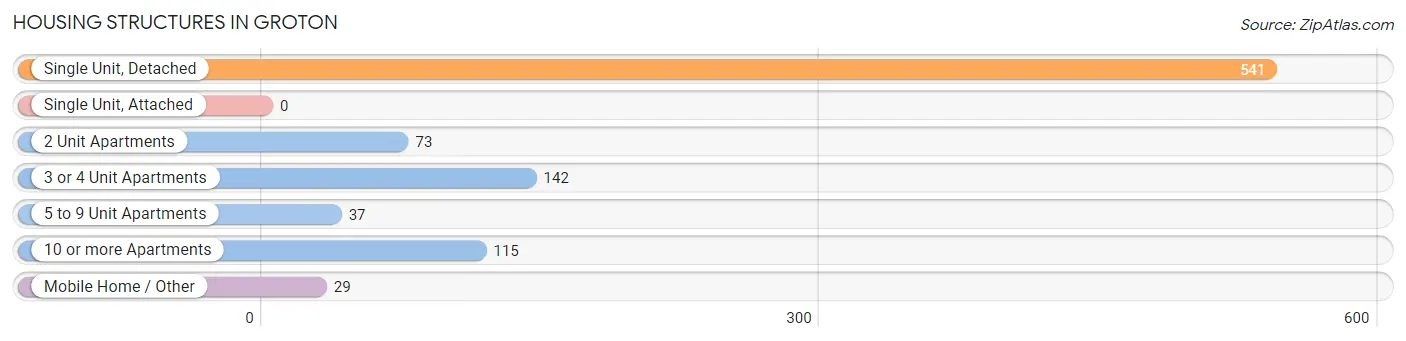
| Structure Type | # Housing Units | % Housing Units |
| Single Unit, Detached | 541 | 57.7% |
| Single Unit, Attached | 0 | 0.0% |
| 2 Unit Apartments | 73 | 7.8% |
| 3 or 4 Unit Apartments | 142 | 15.1% |
| 5 to 9 Unit Apartments | 37 | 4.0% |
| 10 or more Apartments | 115 | 12.3% |
| Mobile Home / Other | 29 | 3.1% |
| Total | 937 | 100.0% |
Housing Structures by Occupancy in Groton
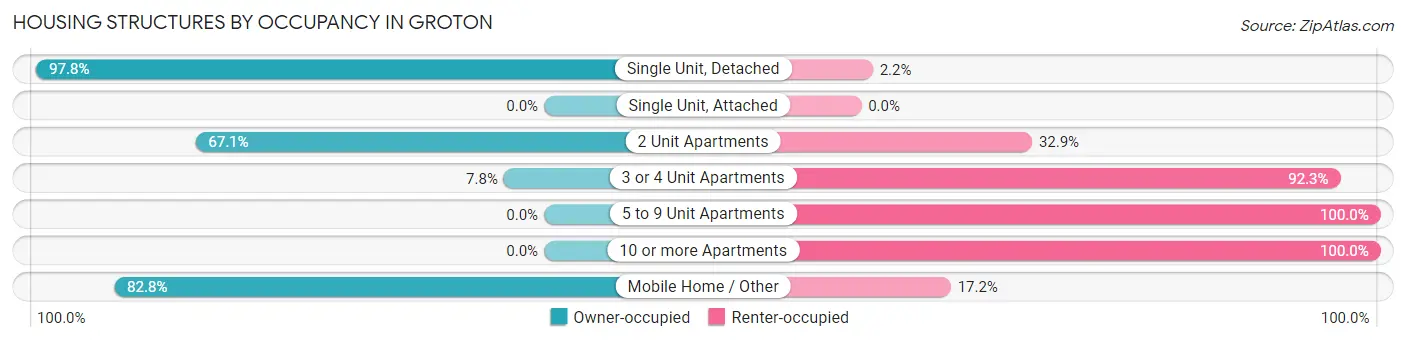
| Structure Type | Owner-occupied | Renter-occupied |
| Single Unit, Detached | 529 (97.8%) | 12 (2.2%) |
| Single Unit, Attached | 0 (0.0%) | 0 (0.0%) |
| 2 Unit Apartments | 49 (67.1%) | 24 (32.9%) |
| 3 or 4 Unit Apartments | 11 (7.7%) | 131 (92.2%) |
| 5 to 9 Unit Apartments | 0 (0.0%) | 37 (100.0%) |
| 10 or more Apartments | 0 (0.0%) | 115 (100.0%) |
| Mobile Home / Other | 24 (82.8%) | 5 (17.2%) |
| Total | 613 (65.4%) | 324 (34.6%) |
Housing Structures by Number of Rooms in Groton
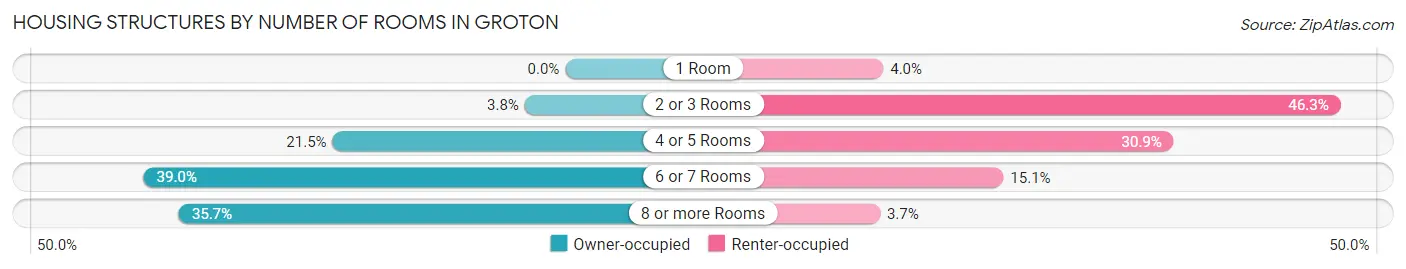
| Number of Rooms | Owner-occupied | Renter-occupied |
| 1 Room | 0 (0.0%) | 13 (4.0%) |
| 2 or 3 Rooms | 23 (3.7%) | 150 (46.3%) |
| 4 or 5 Rooms | 132 (21.5%) | 100 (30.9%) |
| 6 or 7 Rooms | 239 (39.0%) | 49 (15.1%) |
| 8 or more Rooms | 219 (35.7%) | 12 (3.7%) |
| Total | 613 (100.0%) | 324 (100.0%) |
Housing Structure by Heating Type in Groton
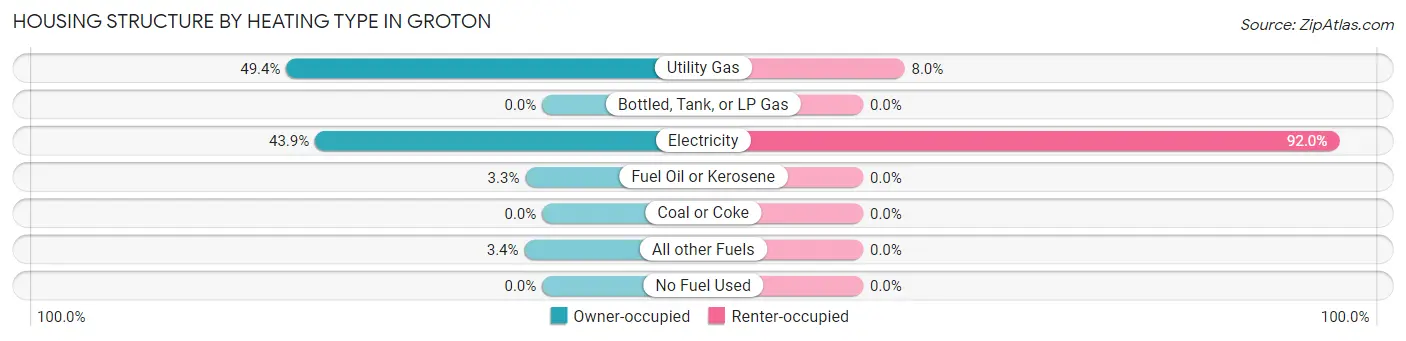
| Heating Type | Owner-occupied | Renter-occupied |
| Utility Gas | 303 (49.4%) | 26 (8.0%) |
| Bottled, Tank, or LP Gas | 0 (0.0%) | 0 (0.0%) |
| Electricity | 269 (43.9%) | 298 (92.0%) |
| Fuel Oil or Kerosene | 20 (3.3%) | 0 (0.0%) |
| Coal or Coke | 0 (0.0%) | 0 (0.0%) |
| All other Fuels | 21 (3.4%) | 0 (0.0%) |
| No Fuel Used | 0 (0.0%) | 0 (0.0%) |
| Total | 613 (100.0%) | 324 (100.0%) |
Household Vehicle Usage in Groton
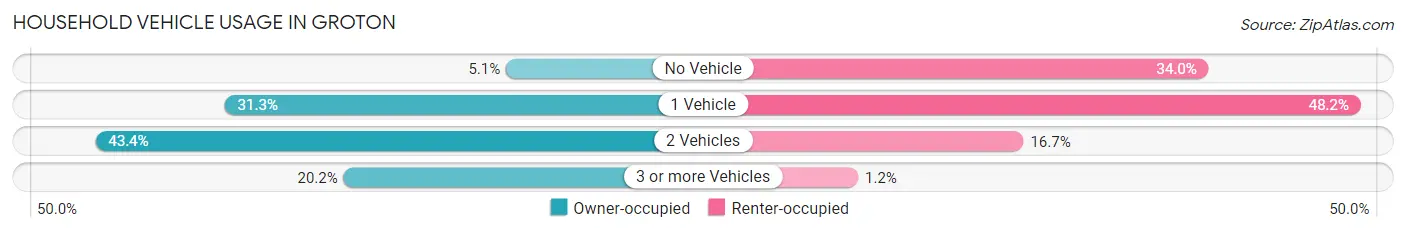
| Vehicles per Household | Owner-occupied | Renter-occupied |
| No Vehicle | 31 (5.1%) | 110 (34.0%) |
| 1 Vehicle | 192 (31.3%) | 156 (48.1%) |
| 2 Vehicles | 266 (43.4%) | 54 (16.7%) |
| 3 or more Vehicles | 124 (20.2%) | 4 (1.2%) |
| Total | 613 (100.0%) | 324 (100.0%) |
Real Estate & Mortgages in Groton
Real Estate and Mortgage Overview in Groton
| Characteristic | Without Mortgage | With Mortgage |
| Housing Units | 248 | 365 |
| Median Property Value | $143,800 | $145,900 |
| Median Household Income | $59,167 | $24 |
| Monthly Housing Costs | $493 | $0 |
| Real Estate Taxes | $3,633 | $8 |
Property Value by Mortgage Status in Groton
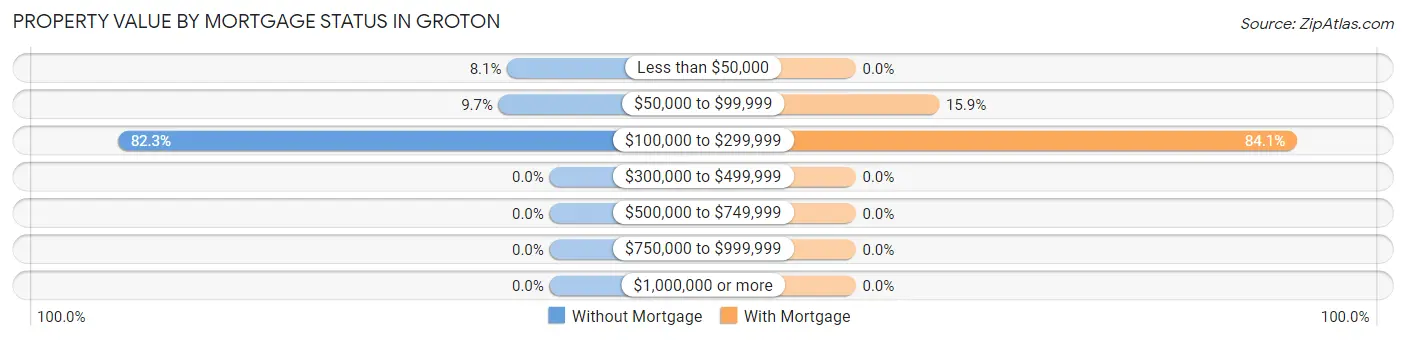
| Property Value | Without Mortgage | With Mortgage |
| Less than $50,000 | 20 (8.1%) | 0 (0.0%) |
| $50,000 to $99,999 | 24 (9.7%) | 58 (15.9%) |
| $100,000 to $299,999 | 204 (82.3%) | 307 (84.1%) |
| $300,000 to $499,999 | 0 (0.0%) | 0 (0.0%) |
| $500,000 to $749,999 | 0 (0.0%) | 0 (0.0%) |
| $750,000 to $999,999 | 0 (0.0%) | 0 (0.0%) |
| $1,000,000 or more | 0 (0.0%) | 0 (0.0%) |
| Total | 248 (100.0%) | 365 (100.0%) |
Household Income by Mortgage Status in Groton
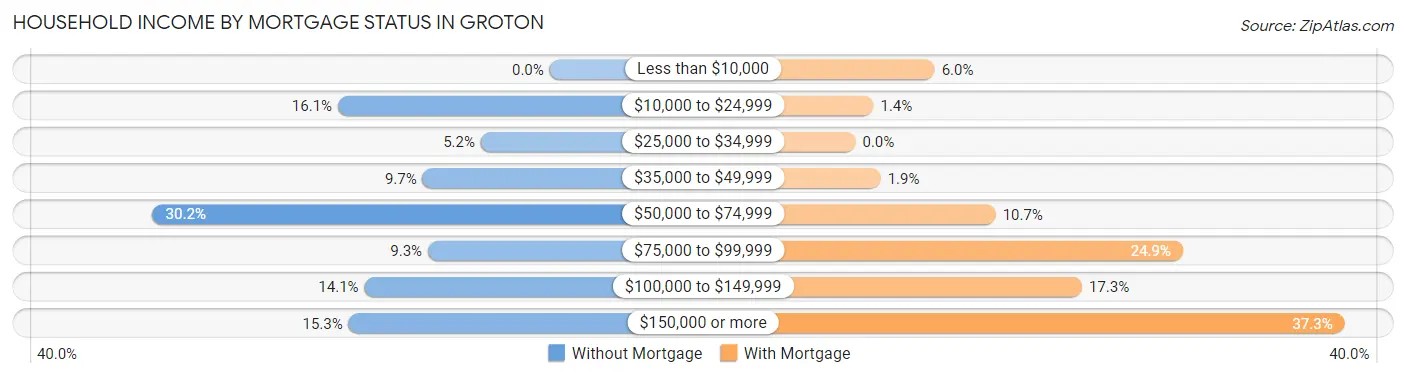
| Household Income | Without Mortgage | With Mortgage |
| Less than $10,000 | 0 (0.0%) | 22 (6.0%) |
| $10,000 to $24,999 | 40 (16.1%) | 5 (1.4%) |
| $25,000 to $34,999 | 13 (5.2%) | 0 (0.0%) |
| $35,000 to $49,999 | 24 (9.7%) | 7 (1.9%) |
| $50,000 to $74,999 | 75 (30.2%) | 39 (10.7%) |
| $75,000 to $99,999 | 23 (9.3%) | 91 (24.9%) |
| $100,000 to $149,999 | 35 (14.1%) | 63 (17.3%) |
| $150,000 or more | 38 (15.3%) | 136 (37.3%) |
| Total | 248 (100.0%) | 365 (100.0%) |
Property Value to Household Income Ratio in Groton
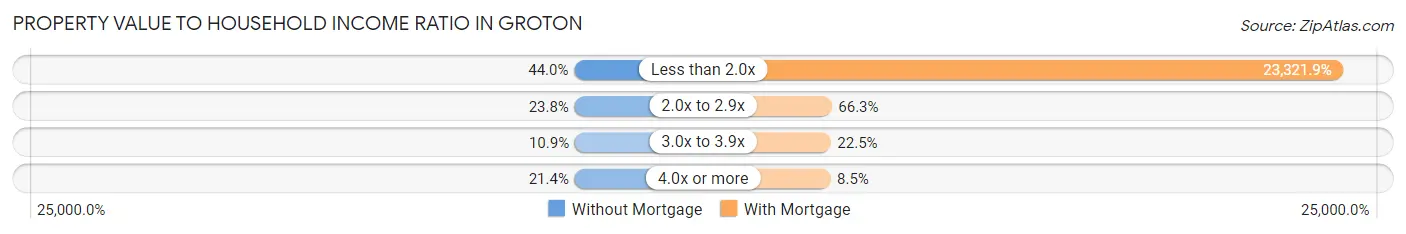
| Value-to-Income Ratio | Without Mortgage | With Mortgage |
| Less than 2.0x | 109 (44.0%) | 85,125 (23,321.9%) |
| 2.0x to 2.9x | 59 (23.8%) | 242 (66.3%) |
| 3.0x to 3.9x | 27 (10.9%) | 82 (22.5%) |
| 4.0x or more | 53 (21.4%) | 31 (8.5%) |
| Total | 248 (100.0%) | 365 (100.0%) |
Real Estate Taxes by Mortgage Status in Groton
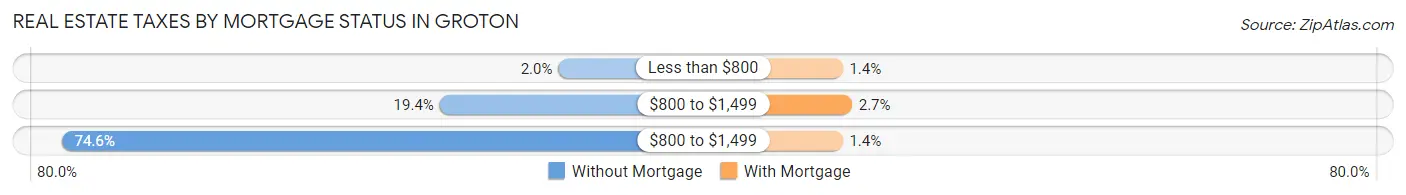
| Property Taxes | Without Mortgage | With Mortgage |
| Less than $800 | 5 (2.0%) | 5 (1.4%) |
| $800 to $1,499 | 48 (19.4%) | 10 (2.7%) |
| $800 to $1,499 | 185 (74.6%) | 5 (1.4%) |
| Total | 248 (100.0%) | 365 (100.0%) |
Health & Disability in Groton
Health Insurance Coverage by Age in Groton
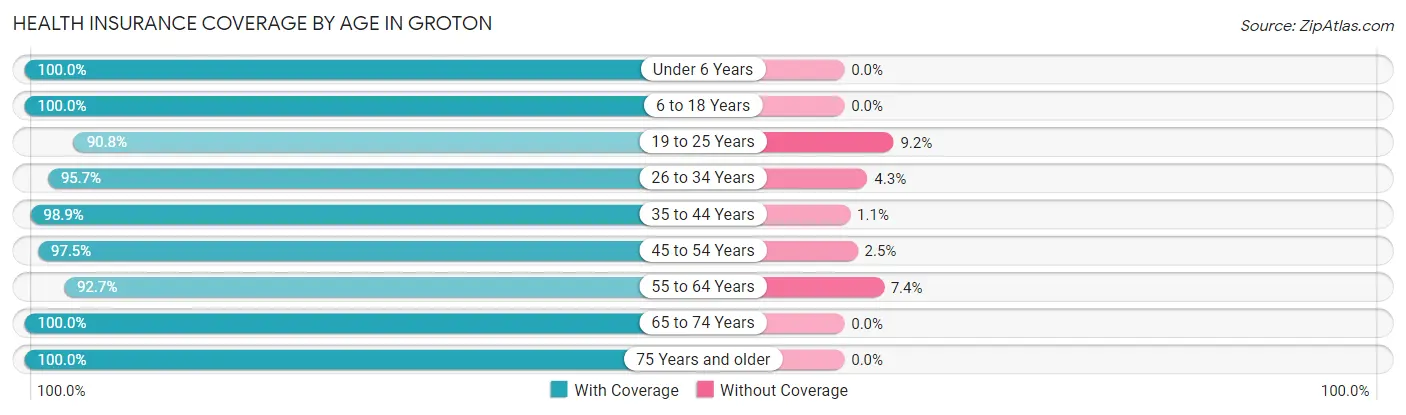
| Age Bracket | With Coverage | Without Coverage |
| Under 6 Years | 125 (100.0%) | 0 (0.0%) |
| 6 to 18 Years | 278 (100.0%) | 0 (0.0%) |
| 19 to 25 Years | 99 (90.8%) | 10 (9.2%) |
| 26 to 34 Years | 200 (95.7%) | 9 (4.3%) |
| 35 to 44 Years | 271 (98.9%) | 3 (1.1%) |
| 45 to 54 Years | 275 (97.5%) | 7 (2.5%) |
| 55 to 64 Years | 252 (92.6%) | 20 (7.3%) |
| 65 to 74 Years | 303 (100.0%) | 0 (0.0%) |
| 75 Years and older | 104 (100.0%) | 0 (0.0%) |
| Total | 1,907 (97.5%) | 49 (2.5%) |
Health Insurance Coverage by Citizenship Status in Groton
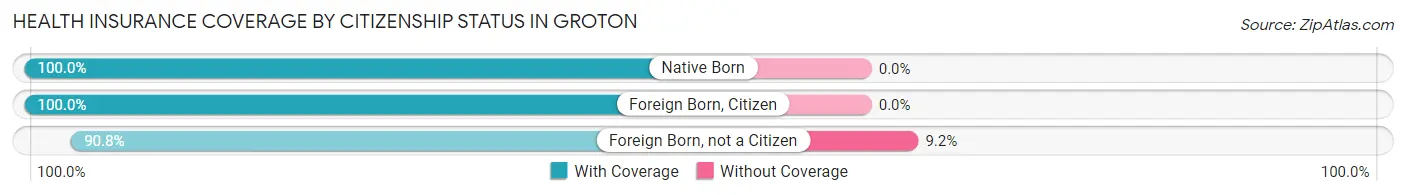
| Citizenship Status | With Coverage | Without Coverage |
| Native Born | 125 (100.0%) | 0 (0.0%) |
| Foreign Born, Citizen | 278 (100.0%) | 0 (0.0%) |
| Foreign Born, not a Citizen | 99 (90.8%) | 10 (9.2%) |
Health Insurance Coverage by Household Income in Groton
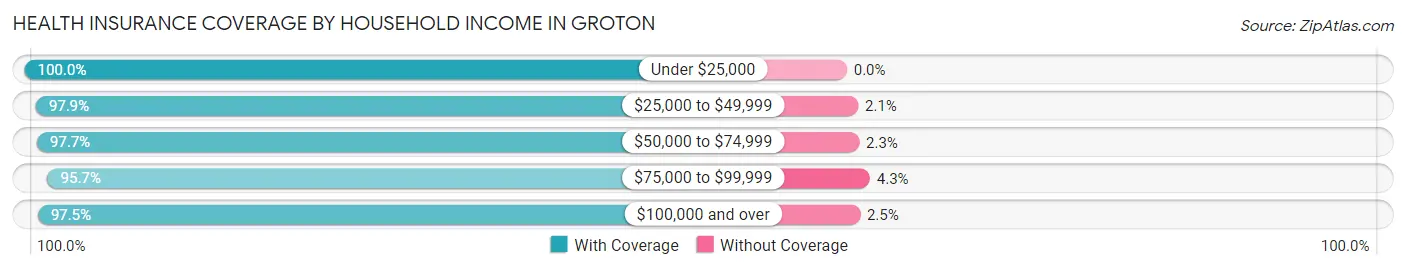
| Household Income | With Coverage | Without Coverage |
| Under $25,000 | 139 (100.0%) | 0 (0.0%) |
| $25,000 to $49,999 | 323 (97.9%) | 7 (2.1%) |
| $50,000 to $74,999 | 422 (97.7%) | 10 (2.3%) |
| $75,000 to $99,999 | 332 (95.7%) | 15 (4.3%) |
| $100,000 and over | 671 (97.5%) | 17 (2.5%) |
Public vs Private Health Insurance Coverage by Age in Groton
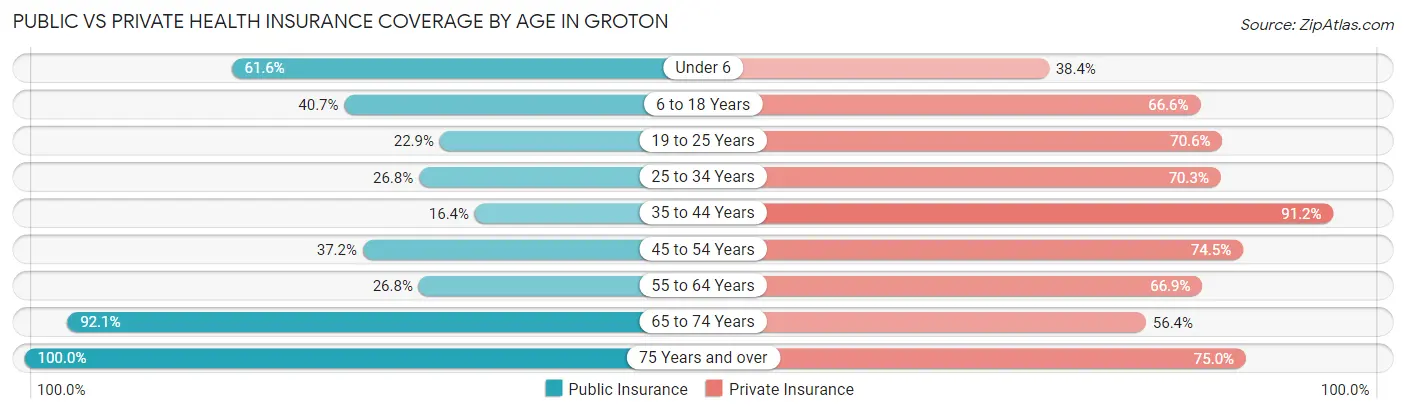
| Age Bracket | Public Insurance | Private Insurance |
| Under 6 | 77 (61.6%) | 48 (38.4%) |
| 6 to 18 Years | 113 (40.6%) | 185 (66.5%) |
| 19 to 25 Years | 25 (22.9%) | 77 (70.6%) |
| 25 to 34 Years | 56 (26.8%) | 147 (70.3%) |
| 35 to 44 Years | 45 (16.4%) | 250 (91.2%) |
| 45 to 54 Years | 105 (37.2%) | 210 (74.5%) |
| 55 to 64 Years | 73 (26.8%) | 182 (66.9%) |
| 65 to 74 Years | 279 (92.1%) | 171 (56.4%) |
| 75 Years and over | 104 (100.0%) | 78 (75.0%) |
| Total | 877 (44.8%) | 1,348 (68.9%) |
Disability Status by Sex by Age in Groton
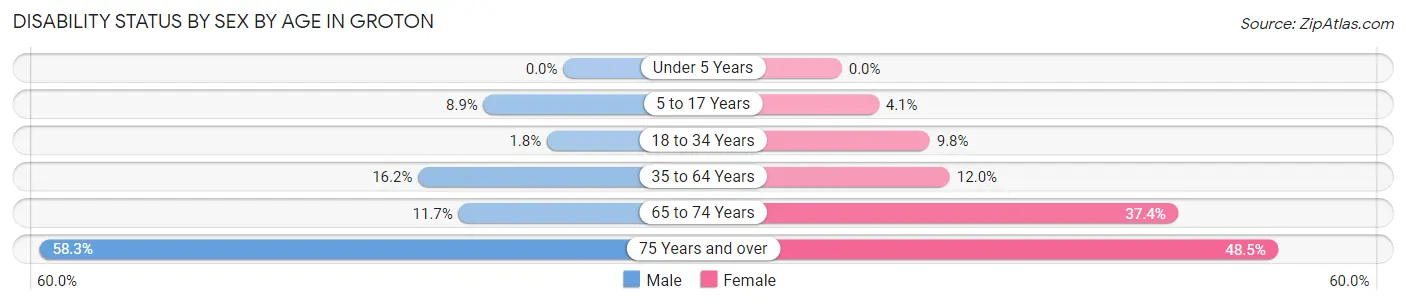
| Age Bracket | Male | Female |
| Under 5 Years | 0 (0.0%) | 0 (0.0%) |
| 5 to 17 Years | 11 (8.9%) | 7 (4.1%) |
| 18 to 34 Years | 3 (1.8%) | 15 (9.8%) |
| 35 to 64 Years | 64 (16.2%) | 52 (12.0%) |
| 65 to 74 Years | 21 (11.7%) | 46 (37.4%) |
| 75 Years and over | 21 (58.3%) | 33 (48.5%) |
Disability Class by Sex by Age in Groton
Disability Class: Hearing Difficulty
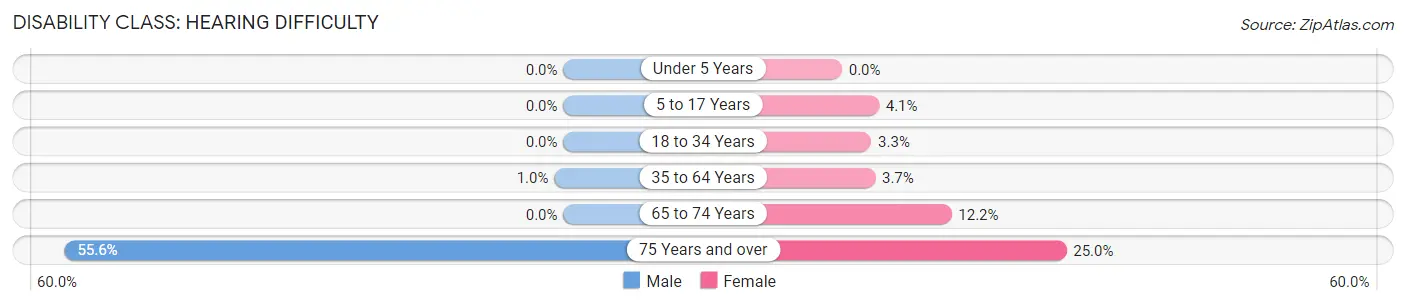
| Age Bracket | Male | Female |
| Under 5 Years | 0 (0.0%) | 0 (0.0%) |
| 5 to 17 Years | 0 (0.0%) | 7 (4.1%) |
| 18 to 34 Years | 0 (0.0%) | 5 (3.3%) |
| 35 to 64 Years | 4 (1.0%) | 16 (3.7%) |
| 65 to 74 Years | 0 (0.0%) | 15 (12.2%) |
| 75 Years and over | 20 (55.6%) | 17 (25.0%) |
Disability Class: Vision Difficulty
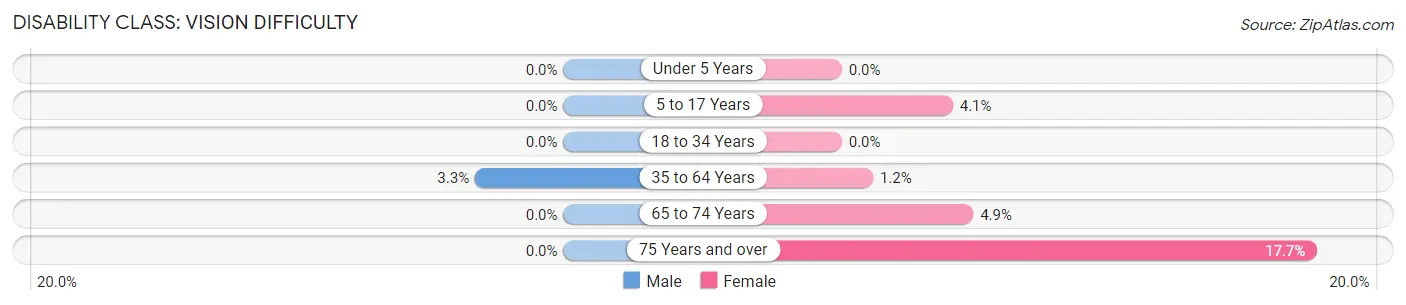
| Age Bracket | Male | Female |
| Under 5 Years | 0 (0.0%) | 0 (0.0%) |
| 5 to 17 Years | 0 (0.0%) | 7 (4.1%) |
| 18 to 34 Years | 0 (0.0%) | 0 (0.0%) |
| 35 to 64 Years | 13 (3.3%) | 5 (1.2%) |
| 65 to 74 Years | 0 (0.0%) | 6 (4.9%) |
| 75 Years and over | 0 (0.0%) | 12 (17.6%) |
Disability Class: Cognitive Difficulty
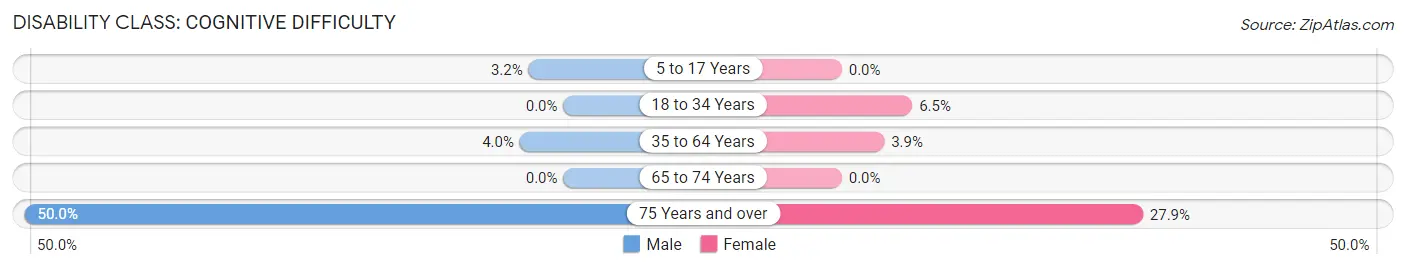
| Age Bracket | Male | Female |
| 5 to 17 Years | 4 (3.2%) | 0 (0.0%) |
| 18 to 34 Years | 0 (0.0%) | 10 (6.5%) |
| 35 to 64 Years | 16 (4.0%) | 17 (3.9%) |
| 65 to 74 Years | 0 (0.0%) | 0 (0.0%) |
| 75 Years and over | 18 (50.0%) | 19 (27.9%) |
Disability Class: Ambulatory Difficulty
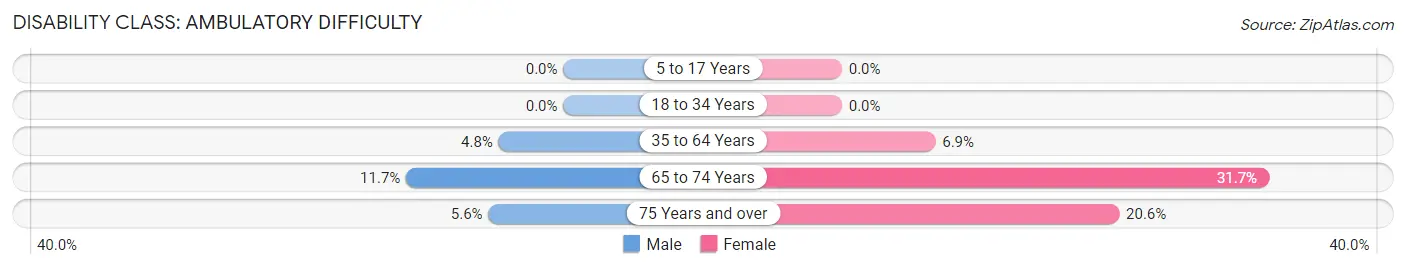
| Age Bracket | Male | Female |
| 5 to 17 Years | 0 (0.0%) | 0 (0.0%) |
| 18 to 34 Years | 0 (0.0%) | 0 (0.0%) |
| 35 to 64 Years | 19 (4.8%) | 30 (6.9%) |
| 65 to 74 Years | 21 (11.7%) | 39 (31.7%) |
| 75 Years and over | 2 (5.6%) | 14 (20.6%) |
Disability Class: Self-Care Difficulty
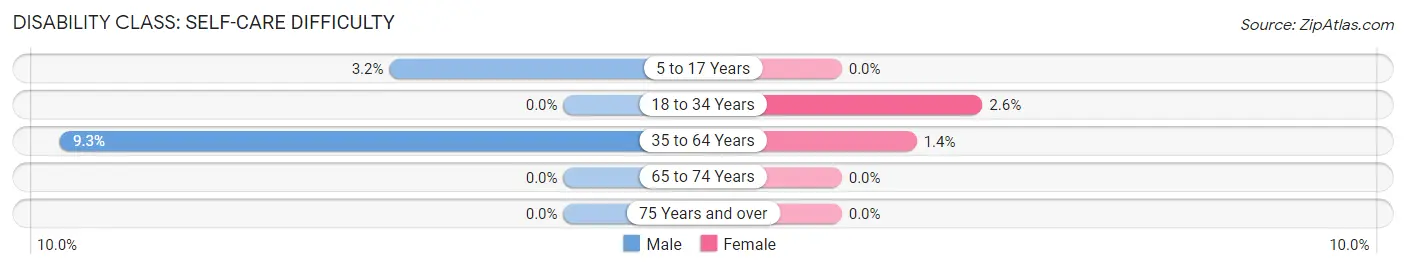
| Age Bracket | Male | Female |
| 5 to 17 Years | 4 (3.2%) | 0 (0.0%) |
| 18 to 34 Years | 0 (0.0%) | 4 (2.6%) |
| 35 to 64 Years | 37 (9.3%) | 6 (1.4%) |
| 65 to 74 Years | 0 (0.0%) | 0 (0.0%) |
| 75 Years and over | 0 (0.0%) | 0 (0.0%) |
Technology Access in Groton
Computing Device Access in Groton
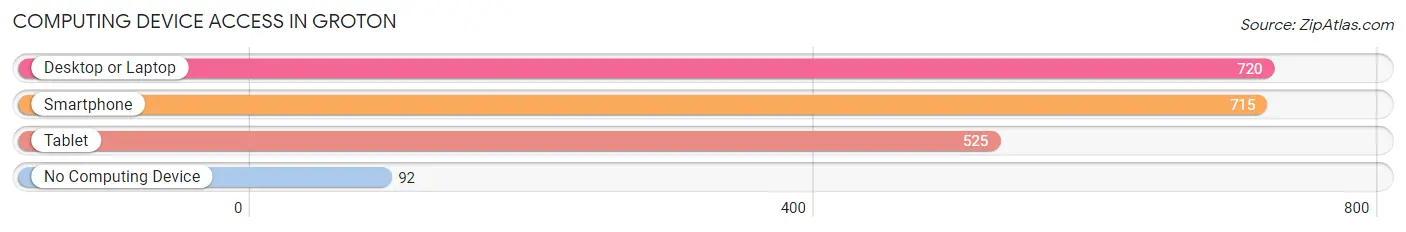
| Device Type | # Households | % Households |
| Desktop or Laptop | 720 | 76.8% |
| Smartphone | 715 | 76.3% |
| Tablet | 525 | 56.0% |
| No Computing Device | 92 | 9.8% |
| Total | 937 | 100.0% |
Internet Access in Groton
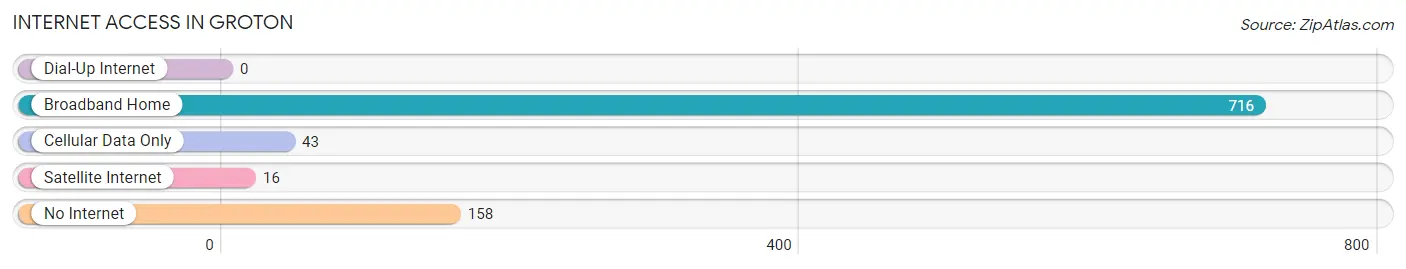
| Internet Type | # Households | % Households |
| Dial-Up Internet | 0 | 0.0% |
| Broadband Home | 716 | 76.4% |
| Cellular Data Only | 43 | 4.6% |
| Satellite Internet | 16 | 1.7% |
| No Internet | 158 | 16.9% |
| Total | 937 | 100.0% |
Groton Summary
Introduction
Groton is a small town located in Tompkins County, New York. It is situated in the Finger Lakes region of the state and is home to a population of approximately 1,500 people. The town is known for its rural charm and its proximity to the Finger Lakes, which provide a variety of recreational activities. Groton is also home to a number of historic sites, including the Groton Historic District, which is listed on the National Register of Historic Places.
History
The area that is now Groton was first settled in 1790 by a group of settlers from Connecticut. The town was originally known as “Groton Corners” and was part of the Town of Ulysses. In 1817, the Town of Groton was officially established and the name was changed to Groton.
The town was an important agricultural center in the 19th century, with a variety of crops being grown in the area. The town was also home to a number of mills, including a grist mill, a saw mill, and a woolen mill.
In the late 19th century, the town began to experience a period of growth and development. The railroad arrived in 1872, and the town was connected to the rest of the state by the Cayuga Lake Railroad. This allowed for the transportation of goods and people to and from the town.
The town continued to grow in the early 20th century, and in the 1920s, the town was home to a number of businesses, including a bank, a hotel, a movie theater, and a variety of stores.
Geography
Groton is located in the Finger Lakes region of New York, in the northwest corner of Tompkins County. The town is situated on the east side of Cayuga Lake, and is bordered by the towns of Ulysses to the north, Lansing to the east, and Dryden to the south.
The town has a total area of 8.2 square miles, of which 8.1 square miles is land and 0.1 square miles is water. The terrain of the town is mostly flat, with some rolling hills in the northern part of the town.
Economy
The economy of Groton is largely based on agriculture and tourism. The town is home to a number of farms, which produce a variety of crops, including corn, soybeans, hay, and apples. The town is also home to a number of wineries, which produce a variety of wines.
The town is also home to a number of businesses, including a bank, a hotel, a movie theater, and a variety of stores. The town is also home to a number of restaurants, which serve a variety of cuisines.
Demographics
As of the 2010 census, the population of Groton was 1,521. The racial makeup of the town was 97.2% White, 0.7% African American, 0.2% Native American, 0.3% Asian, 0.1% Pacific Islander, 0.3% from other races, and 1.3% from two or more races. Hispanic or Latino of any race were 1.3% of the population.
The median income for a household in the town was $45,000, and the median income for a family was $50,000. The per capita income for the town was $20,000.
Conclusion
Groton is a small town located in Tompkins County, New York. It is situated in the Finger Lakes region of the state and is home to a population of approximately 1,500 people. The town is known for its rural charm and its proximity to the Finger Lakes, which provide a variety of recreational activities. Groton is also home to a number of historic sites, including the Groton Historic District, which is listed on the National Register of Historic Places. The economy of Groton is largely based on agriculture and tourism, and the town is home to a number of businesses, including a bank, a hotel, a movie theater, and a variety of stores. The population of Groton is predominantly white, with a median household income of $45,000 and a median family income of $50,000.
Common Questions
What is Per Capita Income in Groton?
Per Capita income in Groton is $33,029.
What is the Median Family Income in Groton?
Median Family Income in Groton is $79,567.
What is the Median Household income in Groton?
Median Household Income in Groton is $59,861.
What is Income or Wage Gap in Groton?
Income or Wage Gap in Groton is 16.0%.
Women in Groton earn 84.0 cents for every dollar earned by a man.
What is Inequality or Gini Index in Groton?
Inequality or Gini Index in Groton is 0.37.
What is the Total Population of Groton?
Total Population of Groton is 2,036.
What is the Total Male Population of Groton?
Total Male Population of Groton is 984.
What is the Total Female Population of Groton?
Total Female Population of Groton is 1,052.
What is the Ratio of Males per 100 Females in Groton?
There are 93.54 Males per 100 Females in Groton.
What is the Ratio of Females per 100 Males in Groton?
There are 106.91 Females per 100 Males in Groton.
What is the Median Population Age in Groton?
Median Population Age in Groton is 46.2 Years.
What is the Average Family Size in Groton
Average Family Size in Groton is 2.8 People.
What is the Average Household Size in Groton
Average Household Size in Groton is 2.1 People.
How Large is the Labor Force in Groton?
There are 1,053 People in the Labor Forcein in Groton.
What is the Percentage of People in the Labor Force in Groton?
62.4% of People are in the Labor Force in Groton.
What is the Unemployment Rate in Groton?
Unemployment Rate in Groton is 2.6%.