Lyon Mountain, NY Map & Demographics
Lyon Mountain Map
Lyon Mountain Overview
$16,820
PER CAPITA INCOME
$51,146
AVG FAMILY INCOME
$37,292
AVG HOUSEHOLD INCOME
12.6%
WAGE / INCOME GAP [ % ]
87.4¢/ $1
WAGE / INCOME GAP [ $ ]
0.37
INEQUALITY / GINI INDEX
250
TOTAL POPULATION
104
MALE POPULATION
146
FEMALE POPULATION
71.23
MALES / 100 FEMALES
140.38
FEMALES / 100 MALES
30.5
MEDIAN AGE
3.6
AVG FAMILY SIZE
2.4
AVG HOUSEHOLD SIZE
82
LABOR FORCE [ PEOPLE ]
52.6%
PERCENT IN LABOR FORCE
14.6%
UNEMPLOYMENT RATE
Lyon Mountain Area Codes
Income in Lyon Mountain
Income Overview in Lyon Mountain
Per Capita Income in Lyon Mountain is $16,820, while median incomes of families and households are $51,146 and $37,292 respectively.
| Characteristic | Number | Measure |
| Per Capita Income | 250 | $16,820 |
| Median Family Income | 51 | $51,146 |
| Mean Family Income | 51 | $59,125 |
| Median Household Income | 103 | $37,292 |
| Mean Household Income | 103 | $38,535 |
| Income Deficit | 51 | $0 |
| Wage / Income Gap (%) | 250 | 12.60% |
| Wage / Income Gap ($) | 250 | 87.40¢ per $1 |
| Gini / Inequality Index | 250 | 0.37 |
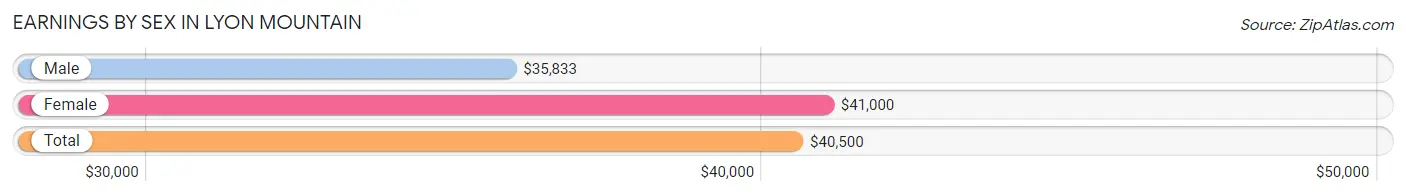
Earnings by Sex in Lyon Mountain
Average Earnings in Lyon Mountain are $40,500, $35,833 for men and $41,000 for women, a difference of 12.6%.
| Sex | Number | Average Earnings |
| Male | 28 (34.2%) | $35,833 |
| Female | 54 (65.8%) | $41,000 |
| Total | 82 (100.0%) | $40,500 |
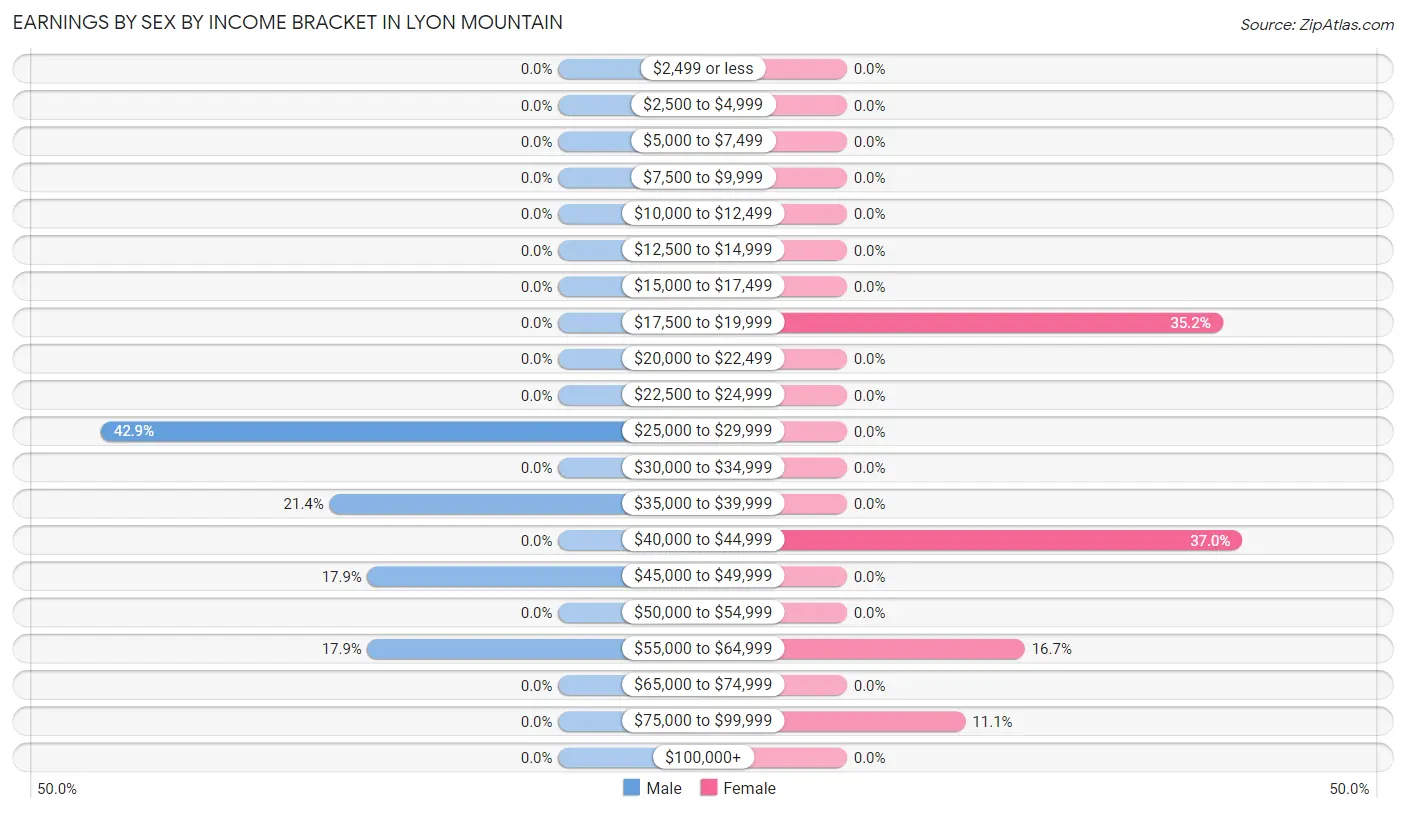
Earnings by Sex by Income Bracket in Lyon Mountain
The most common earnings brackets in Lyon Mountain are $25,000 to $29,999 for men (12 | 42.9%) and $40,000 to $44,999 for women (20 | 37.0%).
| Income | Male | Female |
| $2,499 or less | 0 (0.0%) | 0 (0.0%) |
| $2,500 to $4,999 | 0 (0.0%) | 0 (0.0%) |
| $5,000 to $7,499 | 0 (0.0%) | 0 (0.0%) |
| $7,500 to $9,999 | 0 (0.0%) | 0 (0.0%) |
| $10,000 to $12,499 | 0 (0.0%) | 0 (0.0%) |
| $12,500 to $14,999 | 0 (0.0%) | 0 (0.0%) |
| $15,000 to $17,499 | 0 (0.0%) | 0 (0.0%) |
| $17,500 to $19,999 | 0 (0.0%) | 19 (35.2%) |
| $20,000 to $22,499 | 0 (0.0%) | 0 (0.0%) |
| $22,500 to $24,999 | 0 (0.0%) | 0 (0.0%) |
| $25,000 to $29,999 | 12 (42.9%) | 0 (0.0%) |
| $30,000 to $34,999 | 0 (0.0%) | 0 (0.0%) |
| $35,000 to $39,999 | 6 (21.4%) | 0 (0.0%) |
| $40,000 to $44,999 | 0 (0.0%) | 20 (37.0%) |
| $45,000 to $49,999 | 5 (17.9%) | 0 (0.0%) |
| $50,000 to $54,999 | 0 (0.0%) | 0 (0.0%) |
| $55,000 to $64,999 | 5 (17.9%) | 9 (16.7%) |
| $65,000 to $74,999 | 0 (0.0%) | 0 (0.0%) |
| $75,000 to $99,999 | 0 (0.0%) | 6 (11.1%) |
| $100,000+ | 0 (0.0%) | 0 (0.0%) |
| Total | 28 (100.0%) | 54 (100.0%) |
Earnings by Sex by Educational Attainment in Lyon Mountain
| Educational Attainment | Male Income | Female Income |
| Less than High School | - | - |
| High School Diploma | - | - |
| College or Associate's Degree | - | - |
| Bachelor's Degree | - | - |
| Graduate Degree | - | - |
| Total | $35,833 | $41,000 |
Family Income in Lyon Mountain
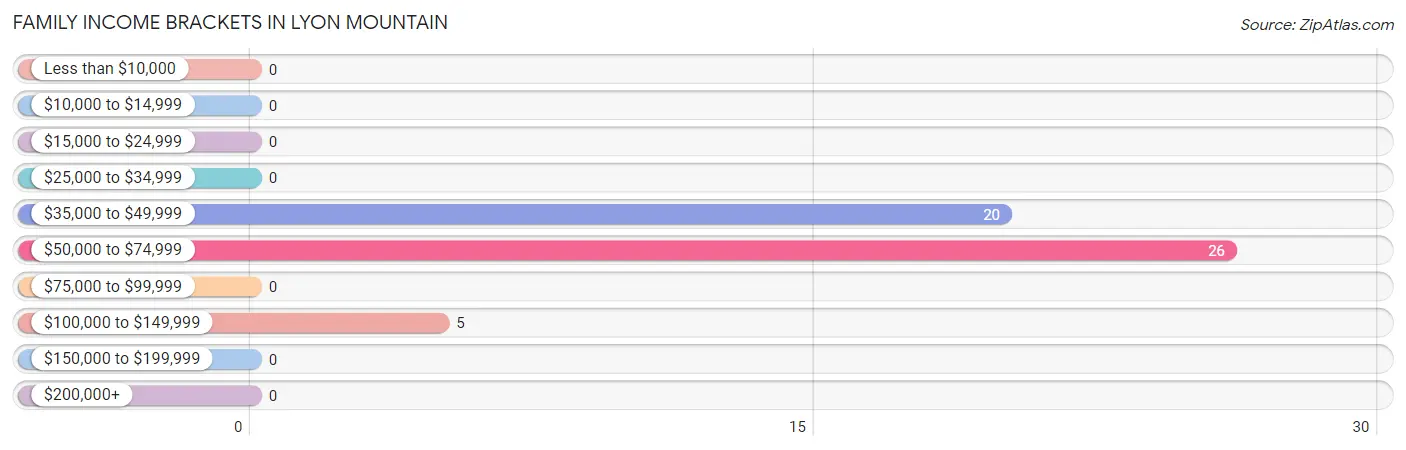
Family Income Brackets in Lyon Mountain
According to the Lyon Mountain family income data, there are 26 families falling into the $50,000 to $74,999 income range, which is the most common income bracket and makes up 51.0% of all families.
| Income Bracket | # Families | % Families |
| Less than $10,000 | 0 | 0.0% |
| $10,000 to $14,999 | 0 | 0.0% |
| $15,000 to $24,999 | 0 | 0.0% |
| $25,000 to $34,999 | 0 | 0.0% |
| $35,000 to $49,999 | 20 | 39.2% |
| $50,000 to $74,999 | 26 | 51.0% |
| $75,000 to $99,999 | 0 | 0.0% |
| $100,000 to $149,999 | 5 | 9.8% |
| $150,000 to $199,999 | 0 | 0.0% |
| $200,000+ | 0 | 0.0% |
Family Income by Famaliy Size in Lyon Mountain
| Income Bracket | # Families | Median Income |
| 2-Person Families | 14 (27.5%) | $0 |
| 3-Person Families | 0 (0.0%) | $0 |
| 4-Person Families | 0 (0.0%) | $0 |
| 5-Person Families | 32 (62.7%) | $0 |
| 6-Person Families | 5 (9.8%) | $0 |
| 7+ Person Families | 0 (0.0%) | $0 |
| Total | 51 (100.0%) | $51,146 |
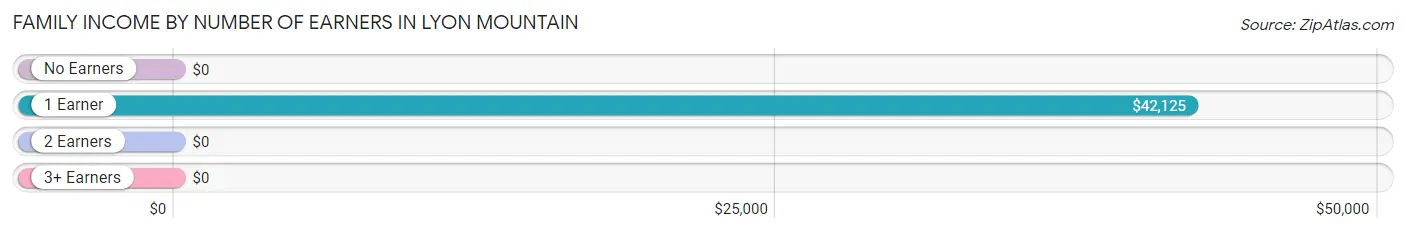
Family Income by Number of Earners in Lyon Mountain
| Number of Earners | # Families | Median Income |
| No Earners | 0 (0.0%) | $0 |
| 1 Earner | 34 (66.7%) | $42,125 |
| 2 Earners | 17 (33.3%) | $0 |
| 3+ Earners | 0 (0.0%) | $0 |
| Total | 51 (100.0%) | $51,146 |
Household Income in Lyon Mountain
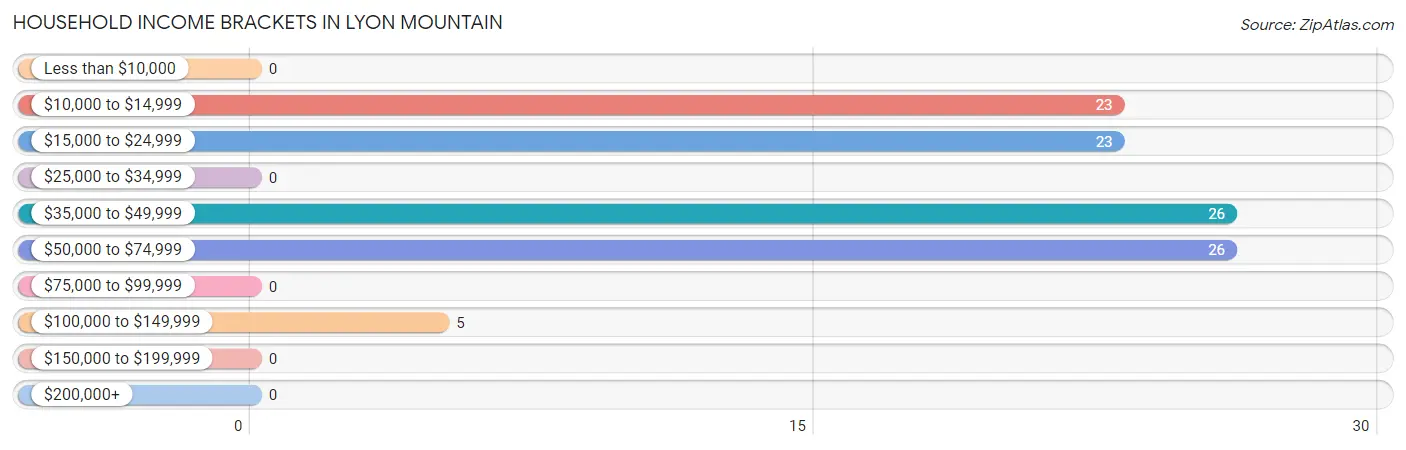
Household Income Brackets in Lyon Mountain
With 26 households falling in the category, the $35,000 to $49,999 income range is the most frequent in Lyon Mountain, accounting for 25.2% of all households.
| Income Bracket | # Households | % Households |
| Less than $10,000 | 0 | 0.0% |
| $10,000 to $14,999 | 23 | 22.3% |
| $15,000 to $24,999 | 23 | 22.3% |
| $25,000 to $34,999 | 0 | 0.0% |
| $35,000 to $49,999 | 26 | 25.2% |
| $50,000 to $74,999 | 26 | 25.2% |
| $75,000 to $99,999 | 0 | 0.0% |
| $100,000 to $149,999 | 5 | 4.9% |
| $150,000 to $199,999 | 0 | 0.0% |
| $200,000+ | 0 | 0.0% |
Household Income by Householder Age in Lyon Mountain
The median household income in Lyon Mountain is $37,292, with the highest median household income of $41,938 found in the 25 to 44 years age bracket for the primary householder. A total of 43 households (41.7%) fall into this category.
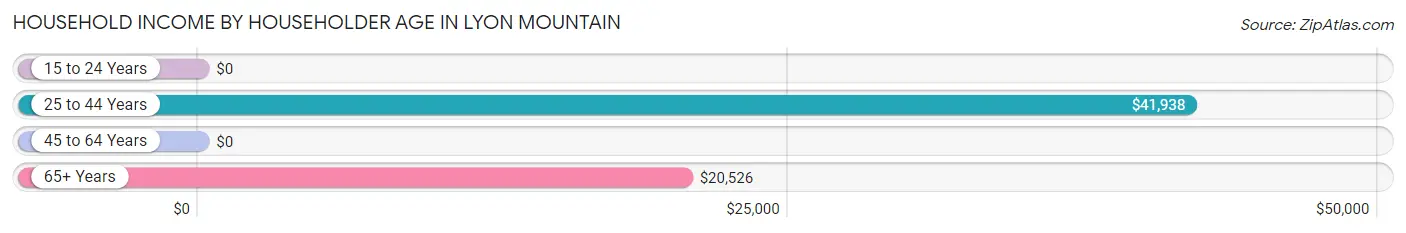
| Income Bracket | # Households | Median Income |
| 15 to 24 Years | 0 (0.0%) | $0 |
| 25 to 44 Years | 43 (41.7%) | $41,938 |
| 45 to 64 Years | 20 (19.4%) | $0 |
| 65+ Years | 40 (38.8%) | $20,526 |
| Total | 103 (100.0%) | $37,292 |
Poverty in Lyon Mountain
Income Below Poverty by Sex and Age in Lyon Mountain
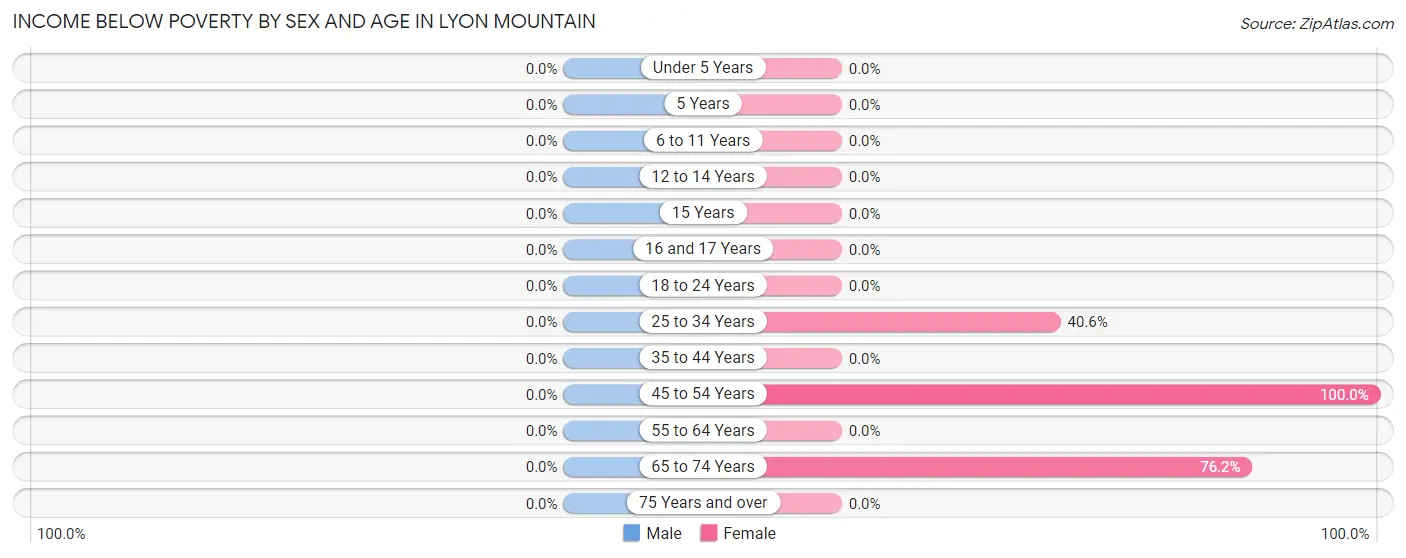
| Age Bracket | Male | Female |
| Under 5 Years | 0 (0.0%) | 0 (0.0%) |
| 5 Years | 0 (0.0%) | 0 (0.0%) |
| 6 to 11 Years | 0 (0.0%) | 0 (0.0%) |
| 12 to 14 Years | 0 (0.0%) | 0 (0.0%) |
| 15 Years | 0 (0.0%) | 0 (0.0%) |
| 16 and 17 Years | 0 (0.0%) | 0 (0.0%) |
| 18 to 24 Years | 0 (0.0%) | 0 (0.0%) |
| 25 to 34 Years | 0 (0.0%) | 13 (40.6%) |
| 35 to 44 Years | 0 (0.0%) | 0 (0.0%) |
| 45 to 54 Years | 0 (0.0%) | 7 (100.0%) |
| 55 to 64 Years | 0 (0.0%) | 0 (0.0%) |
| 65 to 74 Years | 0 (0.0%) | 16 (76.2%) |
| 75 Years and over | 0 (0.0%) | 0 (0.0%) |
| Total | 0 (0.0%) | 36 (24.7%) |
Income Above Poverty by Sex and Age in Lyon Mountain
According to the poverty statistics in Lyon Mountain, males aged under 5 years and females aged under 5 years are the age groups that are most secure financially, with 100.0% of males and 100.0% of females in these age groups living above the poverty line.
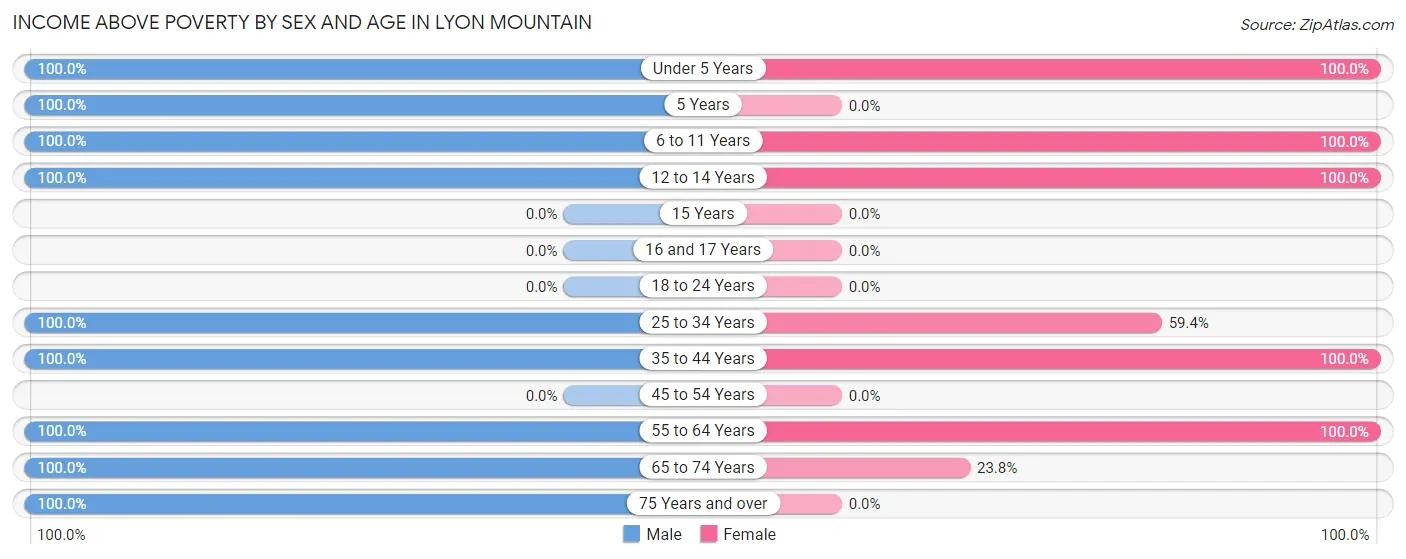
| Age Bracket | Male | Female |
| Under 5 Years | 3 (100.0%) | 26 (100.0%) |
| 5 Years | 8 (100.0%) | 0 (0.0%) |
| 6 to 11 Years | 18 (100.0%) | 20 (100.0%) |
| 12 to 14 Years | 14 (100.0%) | 5 (100.0%) |
| 15 Years | 0 (0.0%) | 0 (0.0%) |
| 16 and 17 Years | 0 (0.0%) | 0 (0.0%) |
| 18 to 24 Years | 0 (0.0%) | 0 (0.0%) |
| 25 to 34 Years | 12 (100.0%) | 19 (59.4%) |
| 35 to 44 Years | 21 (100.0%) | 26 (100.0%) |
| 45 to 54 Years | 0 (0.0%) | 0 (0.0%) |
| 55 to 64 Years | 4 (100.0%) | 9 (100.0%) |
| 65 to 74 Years | 5 (100.0%) | 5 (23.8%) |
| 75 Years and over | 19 (100.0%) | 0 (0.0%) |
| Total | 104 (100.0%) | 110 (75.3%) |
Income Below Poverty Among Married-Couple Families in Lyon Mountain
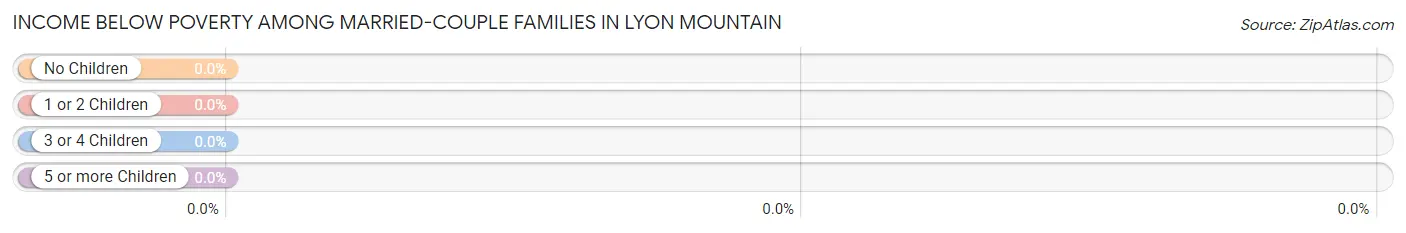
| Children | Above Poverty | Below Poverty |
| No Children | 5 (100.0%) | 0 (0.0%) |
| 1 or 2 Children | 0 (0.0%) | 0 (0.0%) |
| 3 or 4 Children | 17 (100.0%) | 0 (0.0%) |
| 5 or more Children | 0 (0.0%) | 0 (0.0%) |
| Total | 22 (100.0%) | 0 (0.0%) |
Income Below Poverty Among Single-Parent Households in Lyon Mountain
| Children | Single Father | Single Mother |
| No Children | 0 (0.0%) | 0 (0.0%) |
| 1 or 2 Children | 0 (0.0%) | 0 (0.0%) |
| 3 or 4 Children | 0 (0.0%) | 0 (0.0%) |
| 5 or more Children | 0 (0.0%) | 0 (0.0%) |
| Total | 0 (0.0%) | 0 (0.0%) |
Income Below Poverty Among Married-Couple vs Single-Parent Households in Lyon Mountain
| Children | Married-Couple Families | Single-Parent Households |
| No Children | 0 (0.0%) | 0 (0.0%) |
| 1 or 2 Children | 0 (0.0%) | 0 (0.0%) |
| 3 or 4 Children | 0 (0.0%) | 0 (0.0%) |
| 5 or more Children | 0 (0.0%) | 0 (0.0%) |
| Total | 0 (0.0%) | 0 (0.0%) |
Race in Lyon Mountain
The most populous races in Lyon Mountain are White / Caucasian (179 | 71.6%), Two or more Races (53 | 21.2%), and Some other Race (15 | 6.0%).
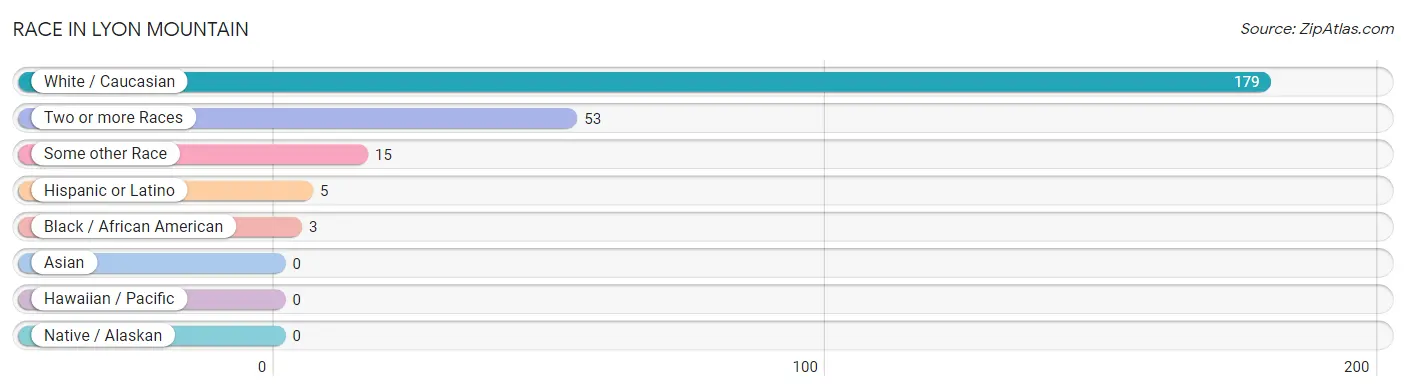
| Race | # Population | % Population |
| Asian | 0 | 0.0% |
| Black / African American | 3 | 1.2% |
| Hawaiian / Pacific | 0 | 0.0% |
| Hispanic or Latino | 5 | 2.0% |
| Native / Alaskan | 0 | 0.0% |
| White / Caucasian | 179 | 71.6% |
| Two or more Races | 53 | 21.2% |
| Some other Race | 15 | 6.0% |
| Total | 250 | 100.0% |
Ancestry in Lyon Mountain
The most populous ancestries reported in Lyon Mountain are French (72 | 28.8%), English (50 | 20.0%), Polish (16 | 6.4%), Irish (15 | 6.0%), and Central American (5 | 2.0%), together accounting for 63.2% of all Lyon Mountain residents.
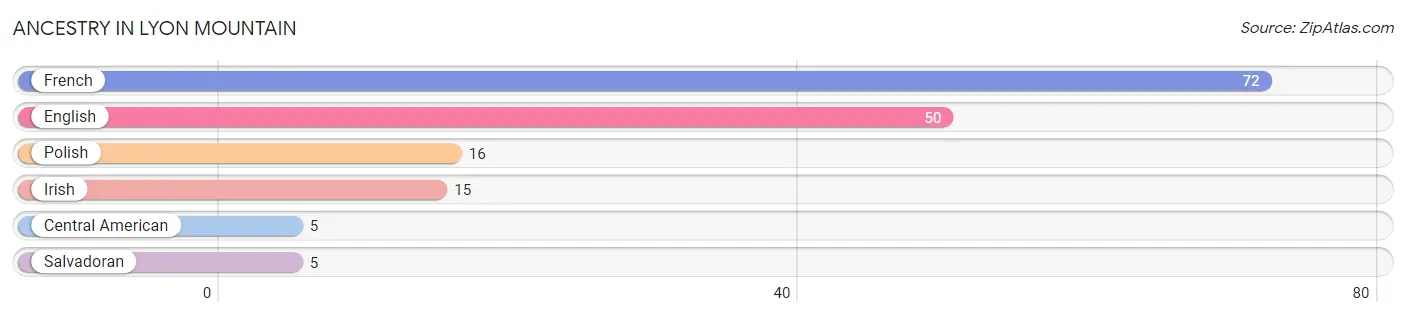
| Ancestry | # Population | % Population |
| Central American | 5 | 2.0% |
| English | 50 | 20.0% |
| French | 72 | 28.8% |
| Irish | 15 | 6.0% |
| Polish | 16 | 6.4% |
| Salvadoran | 5 | 2.0% | View All 6 Rows |
Immigrants in Lyon Mountain

| Immigration Origin | # Population | % Population | View All 0 Rows |
Sex and Age in Lyon Mountain
Sex and Age in Lyon Mountain
The most populous age groups in Lyon Mountain are 5 to 9 Years (21 | 20.2%) for men and Under 5 Years (26 | 17.8%) for women.
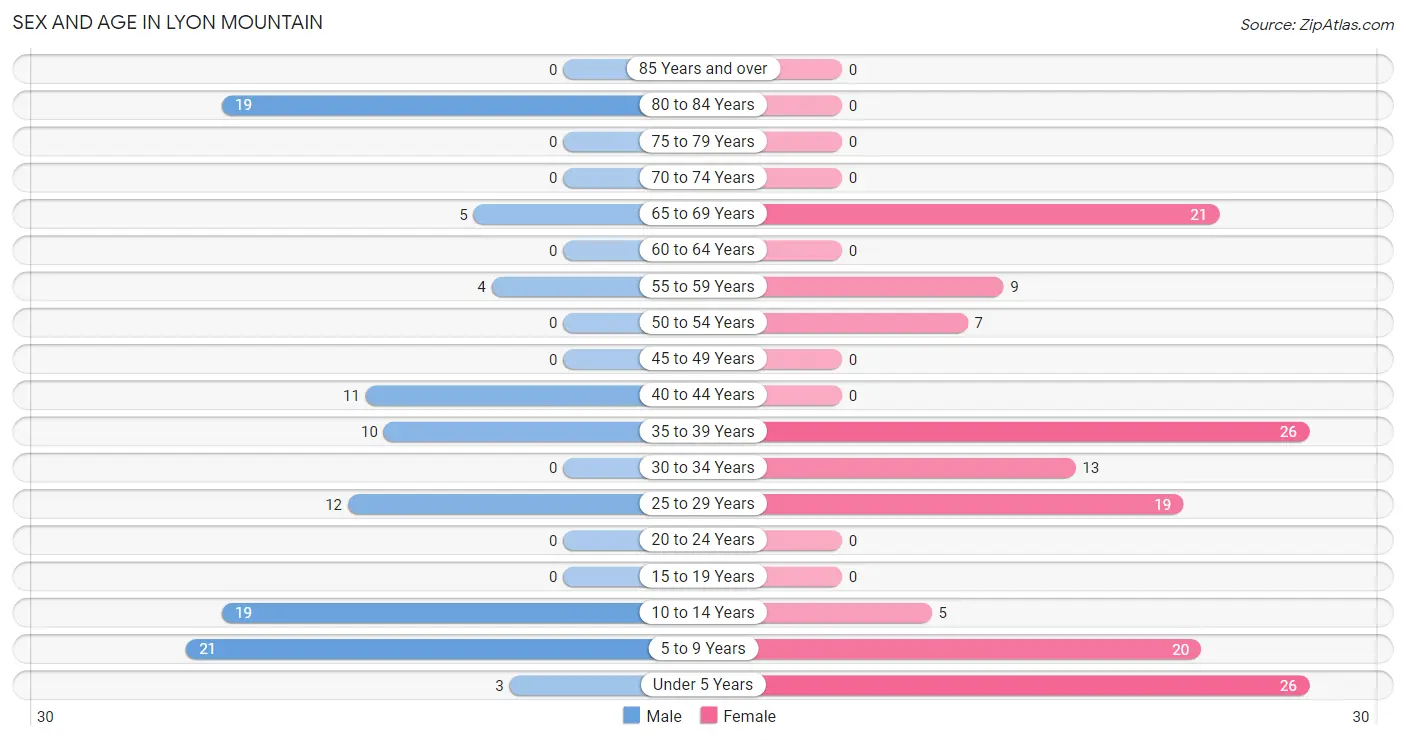
| Age Bracket | Male | Female |
| Under 5 Years | 3 (2.9%) | 26 (17.8%) |
| 5 to 9 Years | 21 (20.2%) | 20 (13.7%) |
| 10 to 14 Years | 19 (18.3%) | 5 (3.4%) |
| 15 to 19 Years | 0 (0.0%) | 0 (0.0%) |
| 20 to 24 Years | 0 (0.0%) | 0 (0.0%) |
| 25 to 29 Years | 12 (11.5%) | 19 (13.0%) |
| 30 to 34 Years | 0 (0.0%) | 13 (8.9%) |
| 35 to 39 Years | 10 (9.6%) | 26 (17.8%) |
| 40 to 44 Years | 11 (10.6%) | 0 (0.0%) |
| 45 to 49 Years | 0 (0.0%) | 0 (0.0%) |
| 50 to 54 Years | 0 (0.0%) | 7 (4.8%) |
| 55 to 59 Years | 4 (3.8%) | 9 (6.2%) |
| 60 to 64 Years | 0 (0.0%) | 0 (0.0%) |
| 65 to 69 Years | 5 (4.8%) | 21 (14.4%) |
| 70 to 74 Years | 0 (0.0%) | 0 (0.0%) |
| 75 to 79 Years | 0 (0.0%) | 0 (0.0%) |
| 80 to 84 Years | 19 (18.3%) | 0 (0.0%) |
| 85 Years and over | 0 (0.0%) | 0 (0.0%) |
| Total | 104 (100.0%) | 146 (100.0%) |
Families and Households in Lyon Mountain
Median Family Size in Lyon Mountain
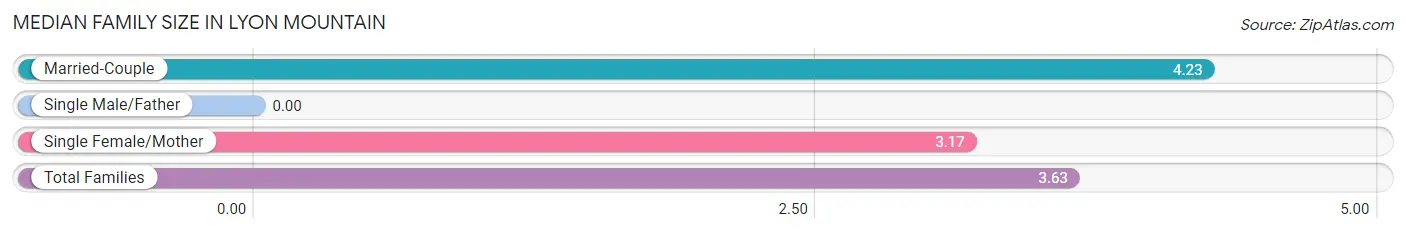
| Family Type | # Families | Family Size |
| Married-Couple | 22 (43.1%) | 4.23 |
| Single Male/Father | 0 (0.0%) | - |
| Single Female/Mother | 29 (56.9%) | 3.17 |
| Total Families | 51 (100.0%) | 3.63 |
Median Household Size in Lyon Mountain
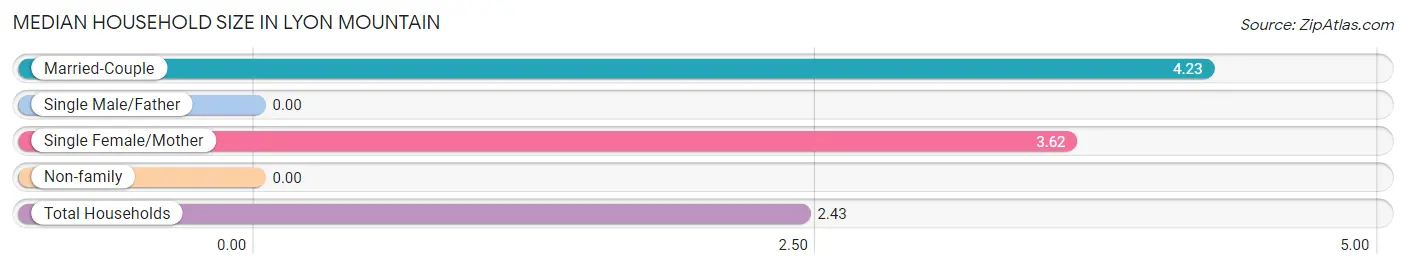
| Household Type | # Households | Household Size |
| Married-Couple | 22 (21.4%) | 4.23 |
| Single Male/Father | 0 (0.0%) | - |
| Single Female/Mother | 29 (28.2%) | 3.62 |
| Non-family | 52 (50.5%) | - |
| Total Households | 103 (100.0%) | 2.43 |
Household Size by Marriage Status in Lyon Mountain
Out of a total of 103 households in Lyon Mountain, 51 (49.5%) are family households, while 52 (50.5%) are nonfamily households. The most numerous type of family households are 5-person households, comprising 32, and the most common type of nonfamily households are 1-person households, comprising 52.
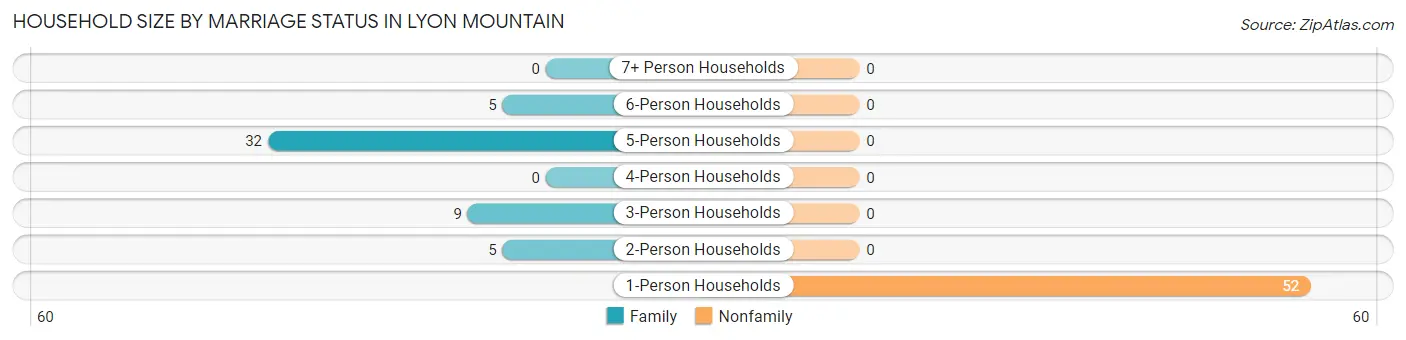
| Household Size | Family Households | Nonfamily Households |
| 1-Person Households | - | 52 (50.5%) |
| 2-Person Households | 5 (4.9%) | 0 (0.0%) |
| 3-Person Households | 9 (8.7%) | 0 (0.0%) |
| 4-Person Households | 0 (0.0%) | 0 (0.0%) |
| 5-Person Households | 32 (31.1%) | 0 (0.0%) |
| 6-Person Households | 5 (4.9%) | 0 (0.0%) |
| 7+ Person Households | 0 (0.0%) | 0 (0.0%) |
| Total | 51 (49.5%) | 52 (50.5%) |
Female Fertility in Lyon Mountain
Fertility by Age in Lyon Mountain
Average fertility rate in Lyon Mountain is 672.0 births per 1,000 women. Women in the age bracket of 35 to 50 years have the highest fertility rate with 769.0 births per 1,000 women. Women in the age bracket of 35 to 50 years acount for 51.3% of all women with births.
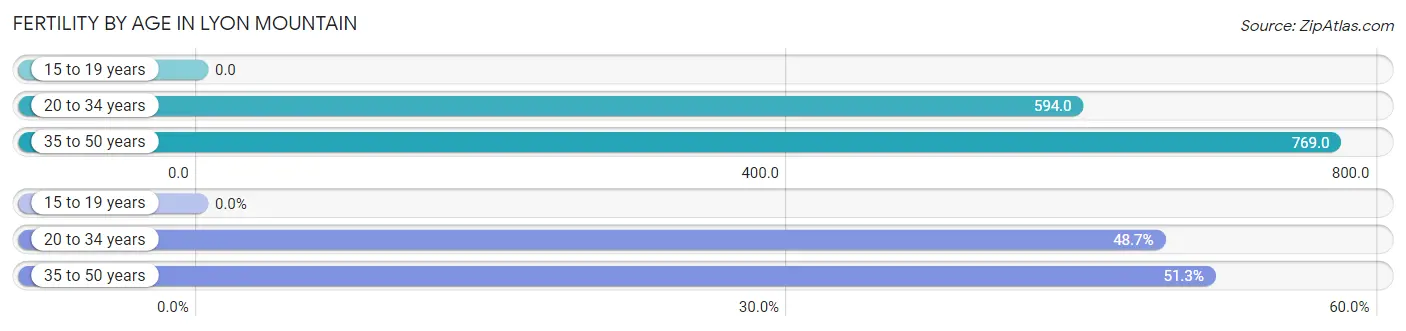
| Age Bracket | Women with Births | Births / 1,000 Women |
| 15 to 19 years | 0 (0.0%) | 0.0 |
| 20 to 34 years | 19 (48.7%) | 594.0 |
| 35 to 50 years | 20 (51.3%) | 769.0 |
| Total | 39 (100.0%) | 672.0 |
Fertility by Age by Marriage Status in Lyon Mountain
48.7% of women with births (39) in Lyon Mountain are married. The highest percentage of unmarried women with births falls into 35 to 50 years age bracket with 100.0% of them unmarried at the time of birth, while the lowest percentage of unmarried women with births belong to 20 to 34 years age bracket with 0.0% of them unmarried.
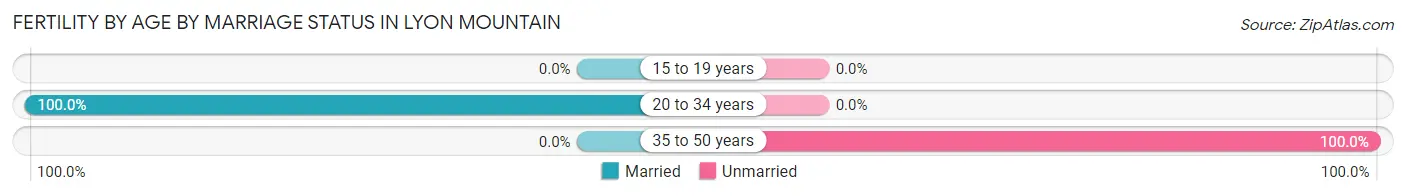
| Age Bracket | Married | Unmarried |
| 15 to 19 years | 0 (0.0%) | 0 (0.0%) |
| 20 to 34 years | 19 (100.0%) | 0 (0.0%) |
| 35 to 50 years | 0 (0.0%) | 20 (100.0%) |
| Total | 19 (48.7%) | 20 (51.3%) |
Fertility by Education in Lyon Mountain
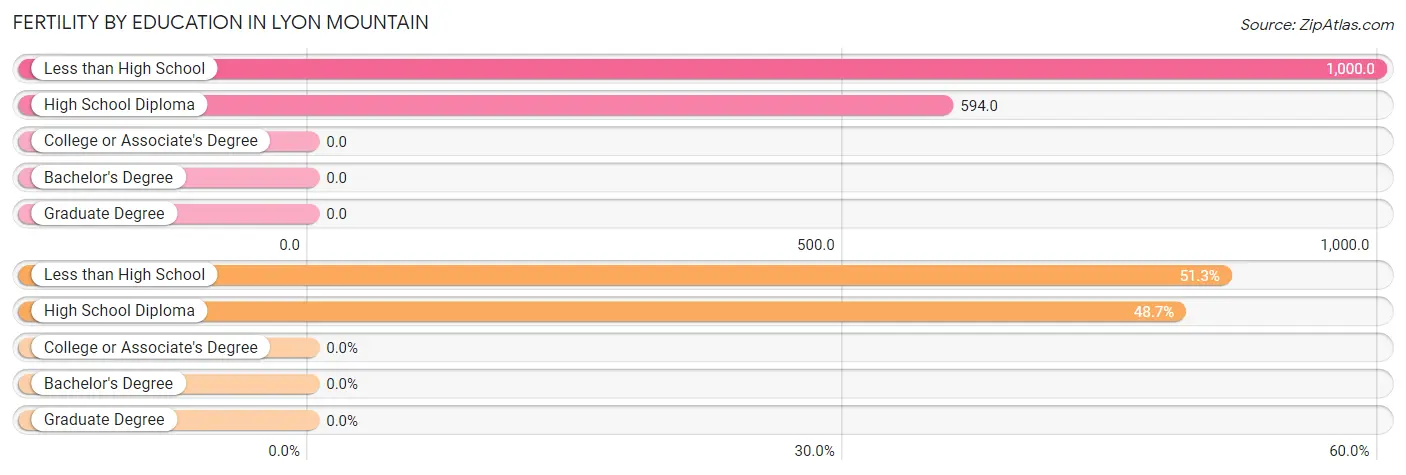
| Educational Attainment | Women with Births | Births / 1,000 Women |
| Less than High School | 20 (51.3%) | 1,000.0 |
| High School Diploma | 19 (48.7%) | 594.0 |
| College or Associate's Degree | 0 (0.0%) | 0.0 |
| Bachelor's Degree | 0 (0.0%) | 0.0 |
| Graduate Degree | 0 (0.0%) | 0.0 |
| Total | 39 (100.0%) | 672.0 |
Fertility by Education by Marriage Status in Lyon Mountain
51.3% of women with births in Lyon Mountain are unmarried. Women with the educational attainment of high school diploma are most likely to be married with 100.0% of them married at childbirth, while women with the educational attainment of less than high school are least likely to be married with 100.0% of them unmarried at childbirth.
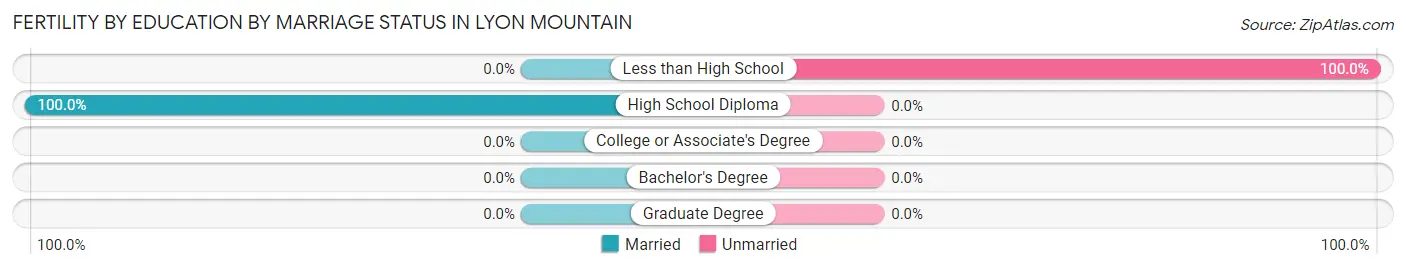
| Educational Attainment | Married | Unmarried |
| Less than High School | 0 (0.0%) | 20 (100.0%) |
| High School Diploma | 19 (100.0%) | 0 (0.0%) |
| College or Associate's Degree | 0 (0.0%) | 0 (0.0%) |
| Bachelor's Degree | 0 (0.0%) | 0 (0.0%) |
| Graduate Degree | 0 (0.0%) | 0 (0.0%) |
| Total | 19 (48.7%) | 20 (51.3%) |
Employment Characteristics in Lyon Mountain
Employment by Class of Employer in Lyon Mountain
Among the 70 employed individuals in Lyon Mountain, private company employees (35 | 50.0%), not-for-profit organizations (20 | 28.6%), and state government employees (9 | 12.9%) make up the most common classes of employment.
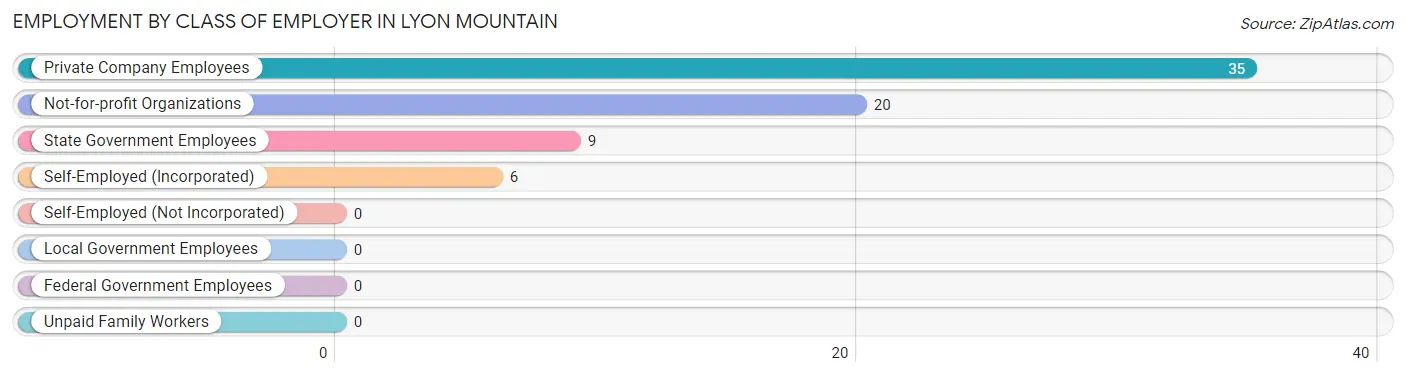
| Employer Class | # Employees | % Employees |
| Private Company Employees | 35 | 50.0% |
| Self-Employed (Incorporated) | 6 | 8.6% |
| Self-Employed (Not Incorporated) | 0 | 0.0% |
| Not-for-profit Organizations | 20 | 28.6% |
| Local Government Employees | 0 | 0.0% |
| State Government Employees | 9 | 12.9% |
| Federal Government Employees | 0 | 0.0% |
| Unpaid Family Workers | 0 | 0.0% |
| Total | 70 | 100.0% |
Employment Status by Age in Lyon Mountain
According to the labor force statistics for Lyon Mountain, out of the total population over 16 years of age (156), 52.6% or 82 individuals are in the labor force, with 14.6% or 12 of them unemployed. The age group with the highest labor force participation rate is 25 to 29 years, with 100.0% or 31 individuals in the labor force. Within the labor force, the 25 to 29 years age range has the highest percentage of unemployed individuals, with 38.7% or 12 of them being unemployed.
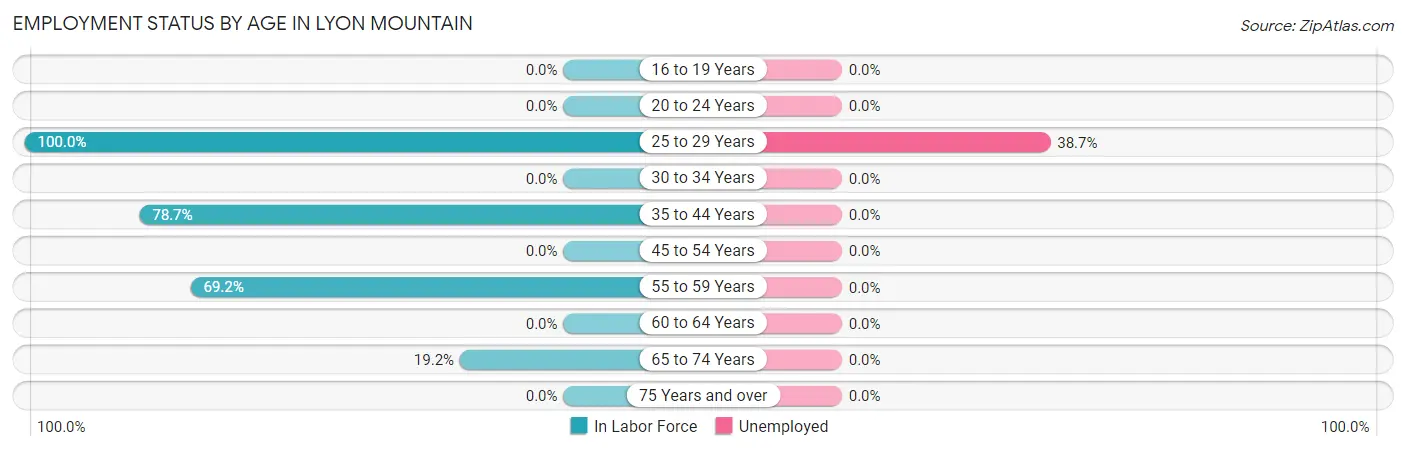
| Age Bracket | In Labor Force | Unemployed |
| 16 to 19 Years | 0 (0.0%) | 0 (0.0%) |
| 20 to 24 Years | 0 (0.0%) | 0 (0.0%) |
| 25 to 29 Years | 31 (100.0%) | 12 (38.7%) |
| 30 to 34 Years | 0 (0.0%) | 0 (0.0%) |
| 35 to 44 Years | 37 (78.7%) | 0 (0.0%) |
| 45 to 54 Years | 0 (0.0%) | 0 (0.0%) |
| 55 to 59 Years | 9 (69.2%) | 0 (0.0%) |
| 60 to 64 Years | 0 (0.0%) | 0 (0.0%) |
| 65 to 74 Years | 5 (19.2%) | 0 (0.0%) |
| 75 Years and over | 0 (0.0%) | 0 (0.0%) |
| Total | 82 (52.6%) | 12 (14.6%) |
Employment Status by Educational Attainment in Lyon Mountain
According to labor force statistics for Lyon Mountain, 69.4% of individuals (77) out of the total population between 25 and 64 years of age (111) are in the labor force, with 15.6% or 12 of them being unemployed. The group with the highest labor force participation rate are those with the educational attainment of less than high school, with 100.0% or 25 individuals in the labor force. Within the labor force, individuals with high school diploma education have the highest percentage of unemployment, with 38.7% or 12 of them being unemployed.
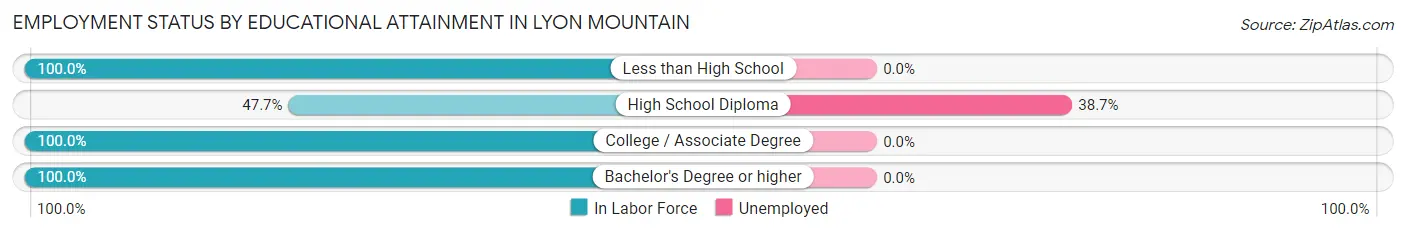
| Educational Attainment | In Labor Force | Unemployed |
| Less than High School | 25 (100.0%) | 0 (0.0%) |
| High School Diploma | 31 (47.7%) | 25 (38.7%) |
| College / Associate Degree | 9 (100.0%) | 0 (0.0%) |
| Bachelor's Degree or higher | 12 (100.0%) | 0 (0.0%) |
| Total | 77 (69.4%) | 17 (15.6%) |
Employment Occupations by Sex in Lyon Mountain
Management, Business, Science and Arts Occupations
Management, Business, Science and Arts Occupations by Sex
| Occupation | Male | Female |
| Management | 0 (0.0%) | 0 (0.0%) |
| Business & Financial | 0 (0.0%) | 0 (0.0%) |
| Computers, Engineering & Science | 0 (0.0%) | 0 (0.0%) |
| Computers & Mathematics | 0 (0.0%) | 0 (0.0%) |
| Architecture & Engineering | 0 (0.0%) | 0 (0.0%) |
| Life, Physical & Social Science | 0 (0.0%) | 0 (0.0%) |
| Community & Social Service | 0 (0.0%) | 0 (0.0%) |
| Education, Arts & Media | 0 (0.0%) | 0 (0.0%) |
| Legal Services & Support | 0 (0.0%) | 0 (0.0%) |
| Education Instruction & Library | 0 (0.0%) | 0 (0.0%) |
| Arts, Media & Entertainment | 0 (0.0%) | 0 (0.0%) |
| Health Diagnosing & Treating | 0 (0.0%) | 0 (0.0%) |
| Health Technologists | 0 (0.0%) | 0 (0.0%) |
| Total (Category) | 0 (0.0%) | 0 (0.0%) |
| Total (Overall) | 16 (22.9%) | 54 (77.1%) |
Services Occupations
The most common Services occupations in Lyon Mountain are Healthcare Support (20 | 28.6%), Personal Care & Service (6 | 8.6%), and Food Preparation & Serving (5 | 7.1%).
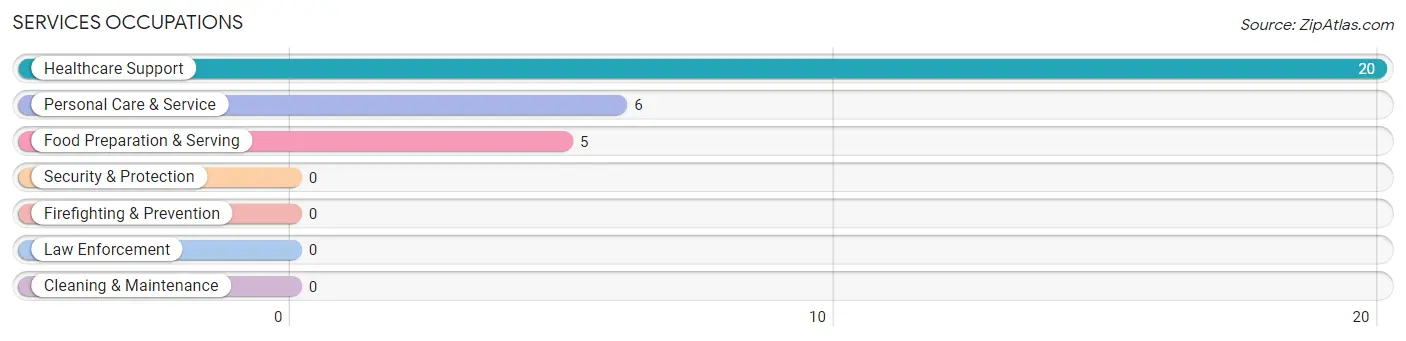
Services Occupations by Sex
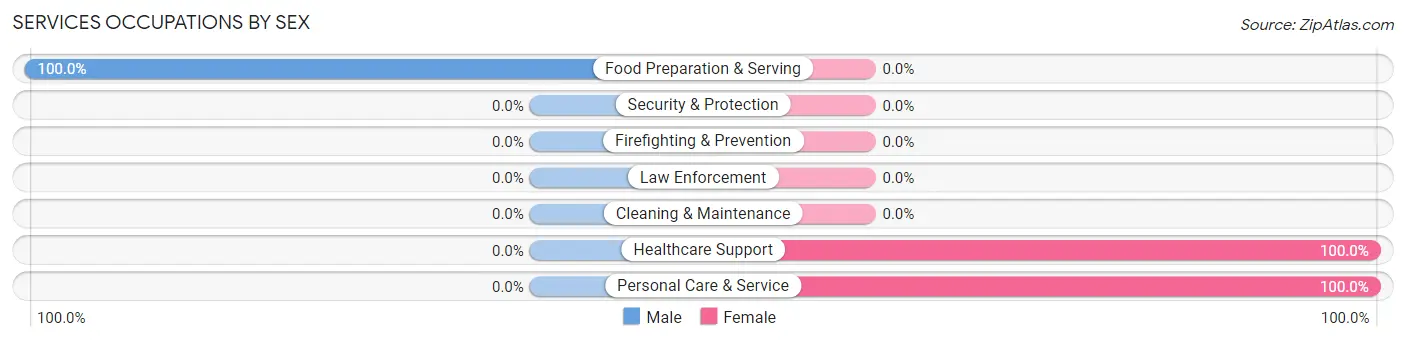
| Occupation | Male | Female |
| Healthcare Support | 0 (0.0%) | 20 (100.0%) |
| Security & Protection | 0 (0.0%) | 0 (0.0%) |
| Firefighting & Prevention | 0 (0.0%) | 0 (0.0%) |
| Law Enforcement | 0 (0.0%) | 0 (0.0%) |
| Food Preparation & Serving | 5 (100.0%) | 0 (0.0%) |
| Cleaning & Maintenance | 0 (0.0%) | 0 (0.0%) |
| Personal Care & Service | 0 (0.0%) | 6 (100.0%) |
| Total (Category) | 5 (16.1%) | 26 (83.9%) |
| Total (Overall) | 16 (22.9%) | 54 (77.1%) |
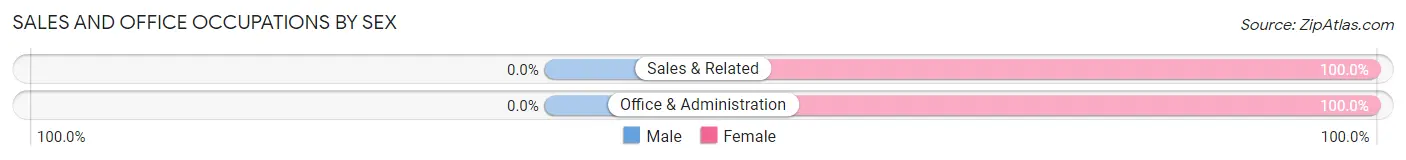
Sales and Office Occupations
The most common Sales and Office occupations in Lyon Mountain are Sales & Related (19 | 27.1%), and Office & Administration (9 | 12.9%).
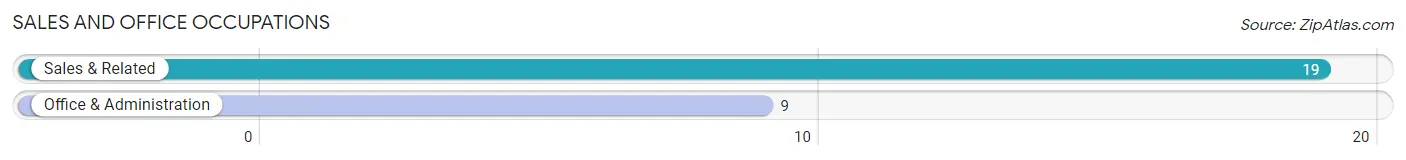
Sales and Office Occupations by Sex
| Occupation | Male | Female |
| Sales & Related | 0 (0.0%) | 19 (100.0%) |
| Office & Administration | 0 (0.0%) | 9 (100.0%) |
| Total (Category) | 0 (0.0%) | 28 (100.0%) |
| Total (Overall) | 16 (22.9%) | 54 (77.1%) |
Natural Resources, Construction and Maintenance Occupations
The most common Natural Resources, Construction and Maintenance occupations in Lyon Mountain are , and Construction & Extraction (5 | 7.1%).
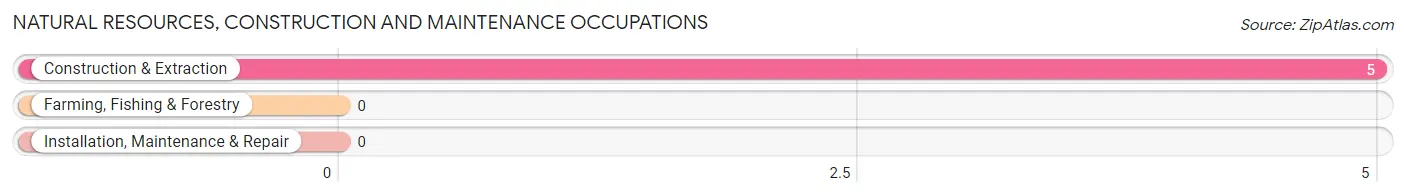
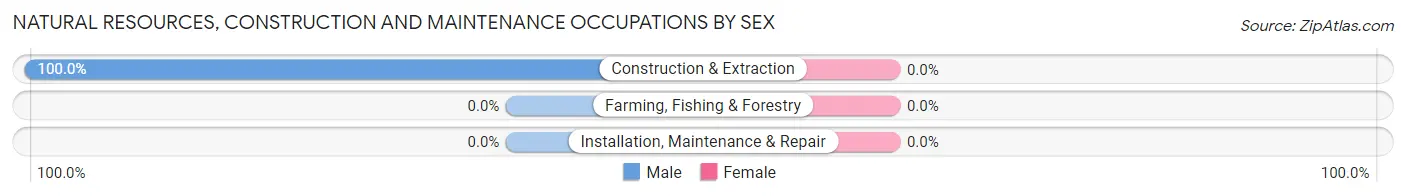
Natural Resources, Construction and Maintenance Occupations by Sex
| Occupation | Male | Female |
| Farming, Fishing & Forestry | 0 (0.0%) | 0 (0.0%) |
| Construction & Extraction | 5 (100.0%) | 0 (0.0%) |
| Installation, Maintenance & Repair | 0 (0.0%) | 0 (0.0%) |
| Total (Category) | 5 (100.0%) | 0 (0.0%) |
| Total (Overall) | 16 (22.9%) | 54 (77.1%) |
Production, Transportation and Moving Occupations
The most common Production, Transportation and Moving occupations in Lyon Mountain are , and Production (6 | 8.6%).
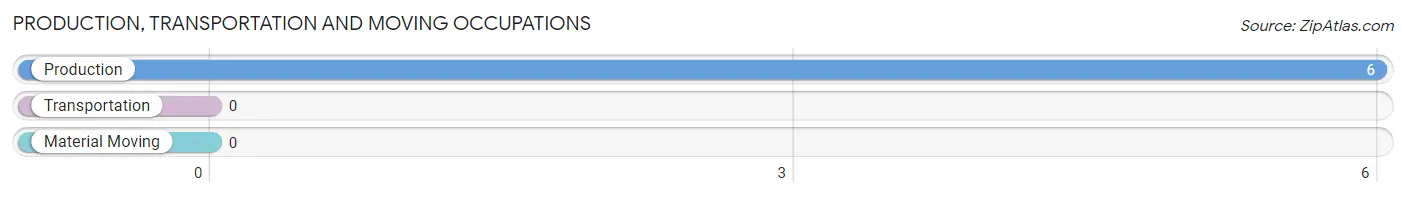
Production, Transportation and Moving Occupations by Sex
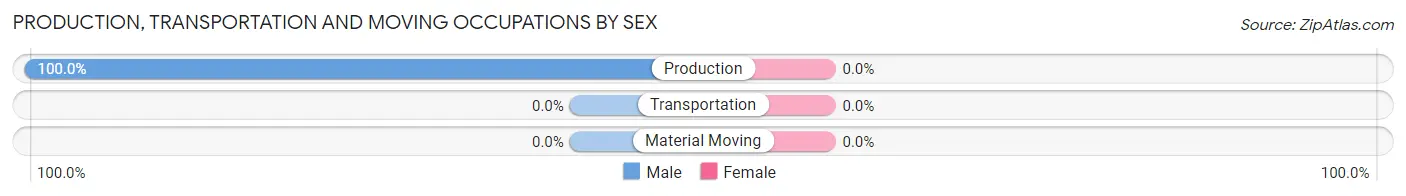
| Occupation | Male | Female |
| Production | 6 (100.0%) | 0 (0.0%) |
| Transportation | 0 (0.0%) | 0 (0.0%) |
| Material Moving | 0 (0.0%) | 0 (0.0%) |
| Total (Category) | 6 (100.0%) | 0 (0.0%) |
| Total (Overall) | 16 (22.9%) | 54 (77.1%) |
Employment Industries by Sex in Lyon Mountain
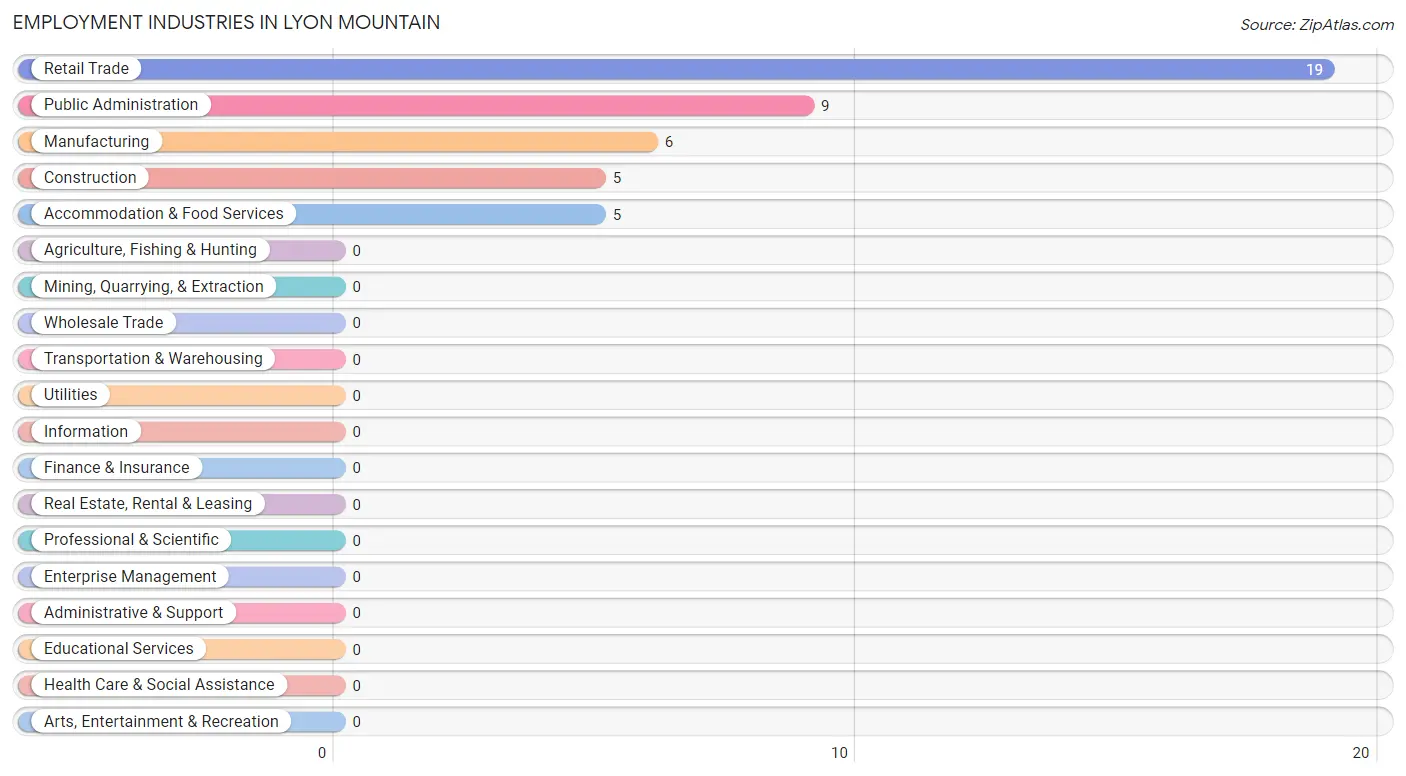
Employment Industries in Lyon Mountain
The major employment industries in Lyon Mountain include Retail Trade (19 | 27.1%), Public Administration (9 | 12.9%), Manufacturing (6 | 8.6%), Construction (5 | 7.1%), and Accommodation & Food Services (5 | 7.1%).
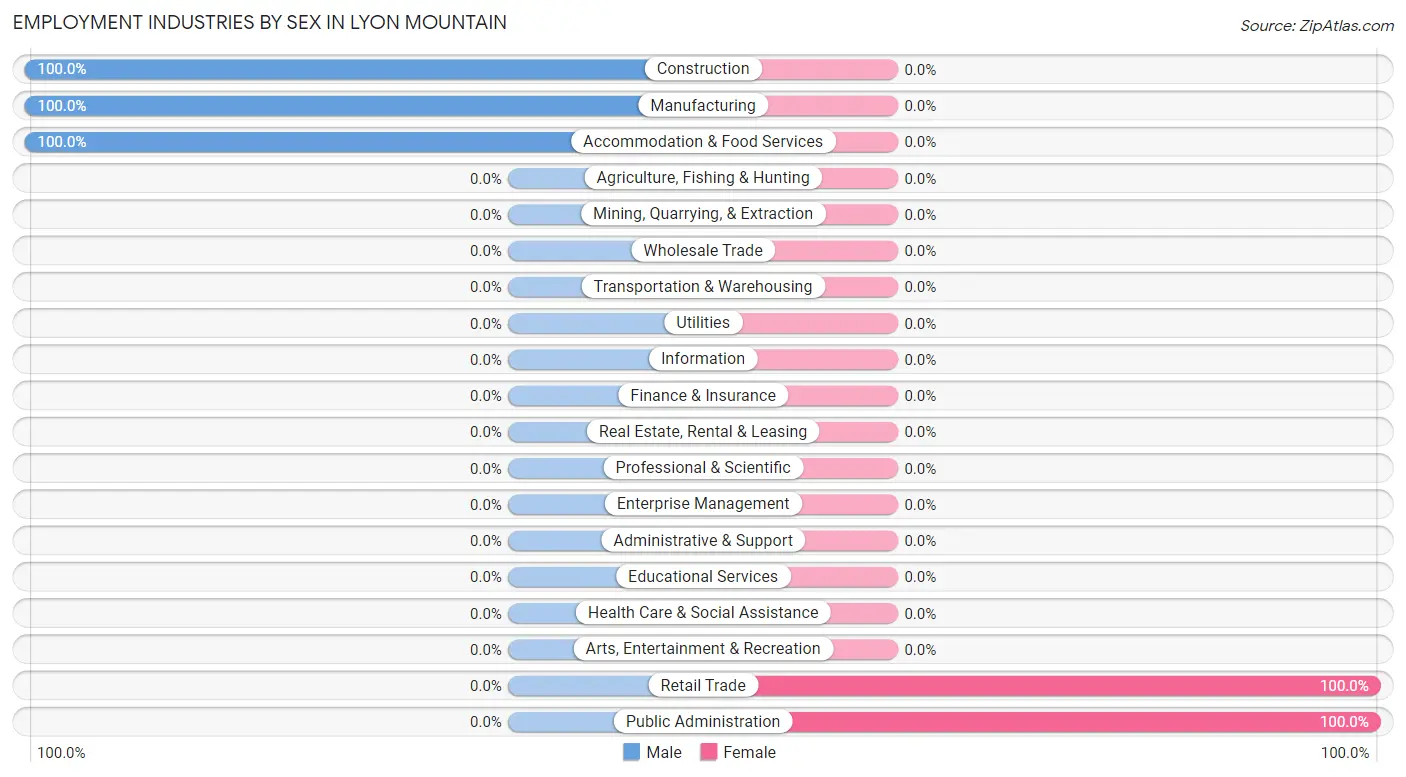
Employment Industries by Sex in Lyon Mountain
The Lyon Mountain industries that see more men than women are Construction (100.0%), Manufacturing (100.0%), and Accommodation & Food Services (100.0%), whereas the industries that tend to have a higher number of women are Retail Trade (100.0%), and Public Administration (100.0%).
| Industry | Male | Female |
| Agriculture, Fishing & Hunting | 0 (0.0%) | 0 (0.0%) |
| Mining, Quarrying, & Extraction | 0 (0.0%) | 0 (0.0%) |
| Construction | 5 (100.0%) | 0 (0.0%) |
| Manufacturing | 6 (100.0%) | 0 (0.0%) |
| Wholesale Trade | 0 (0.0%) | 0 (0.0%) |
| Retail Trade | 0 (0.0%) | 19 (100.0%) |
| Transportation & Warehousing | 0 (0.0%) | 0 (0.0%) |
| Utilities | 0 (0.0%) | 0 (0.0%) |
| Information | 0 (0.0%) | 0 (0.0%) |
| Finance & Insurance | 0 (0.0%) | 0 (0.0%) |
| Real Estate, Rental & Leasing | 0 (0.0%) | 0 (0.0%) |
| Professional & Scientific | 0 (0.0%) | 0 (0.0%) |
| Enterprise Management | 0 (0.0%) | 0 (0.0%) |
| Administrative & Support | 0 (0.0%) | 0 (0.0%) |
| Educational Services | 0 (0.0%) | 0 (0.0%) |
| Health Care & Social Assistance | 0 (0.0%) | 0 (0.0%) |
| Arts, Entertainment & Recreation | 0 (0.0%) | 0 (0.0%) |
| Accommodation & Food Services | 5 (100.0%) | 0 (0.0%) |
| Public Administration | 0 (0.0%) | 9 (100.0%) |
| Total | 16 (22.9%) | 54 (77.1%) |
Education in Lyon Mountain
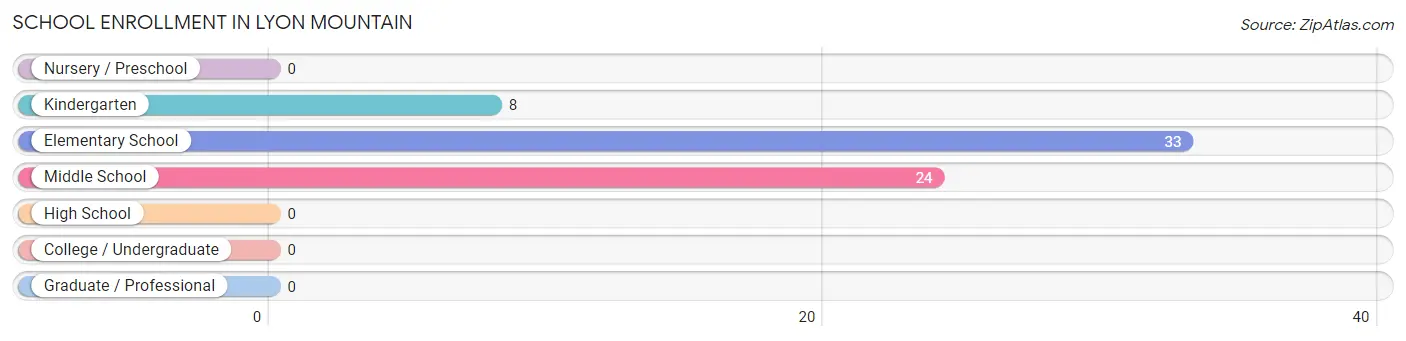
School Enrollment in Lyon Mountain
The most common levels of schooling among the 65 students in Lyon Mountain are elementary school (33 | 50.8%), middle school (24 | 36.9%), and kindergarten (8 | 12.3%).
| School Level | # Students | % Students |
| Nursery / Preschool | 0 | 0.0% |
| Kindergarten | 8 | 12.3% |
| Elementary School | 33 | 50.8% |
| Middle School | 24 | 36.9% |
| High School | 0 | 0.0% |
| College / Undergraduate | 0 | 0.0% |
| Graduate / Professional | 0 | 0.0% |
| Total | 65 | 100.0% |
School Enrollment by Age by Funding Source in Lyon Mountain
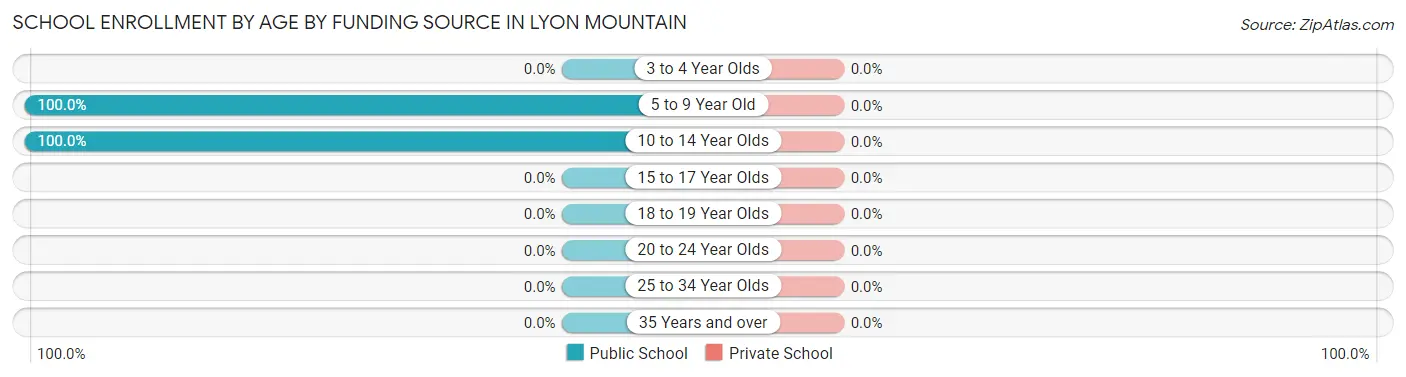
| Age Bracket | Public School | Private School |
| 3 to 4 Year Olds | 0 (0.0%) | 0 (0.0%) |
| 5 to 9 Year Old | 41 (100.0%) | 0 (0.0%) |
| 10 to 14 Year Olds | 24 (100.0%) | 0 (0.0%) |
| 15 to 17 Year Olds | 0 (0.0%) | 0 (0.0%) |
| 18 to 19 Year Olds | 0 (0.0%) | 0 (0.0%) |
| 20 to 24 Year Olds | 0 (0.0%) | 0 (0.0%) |
| 25 to 34 Year Olds | 0 (0.0%) | 0 (0.0%) |
| 35 Years and over | 0 (0.0%) | 0 (0.0%) |
| Total | 65 (100.0%) | 0 (0.0%) |
Educational Attainment by Field of Study in Lyon Mountain
Psychology (6 | 50.0%), and business (6 | 50.0%) are the most common fields of study among 12 individuals in Lyon Mountain who have obtained a bachelor's degree or higher.
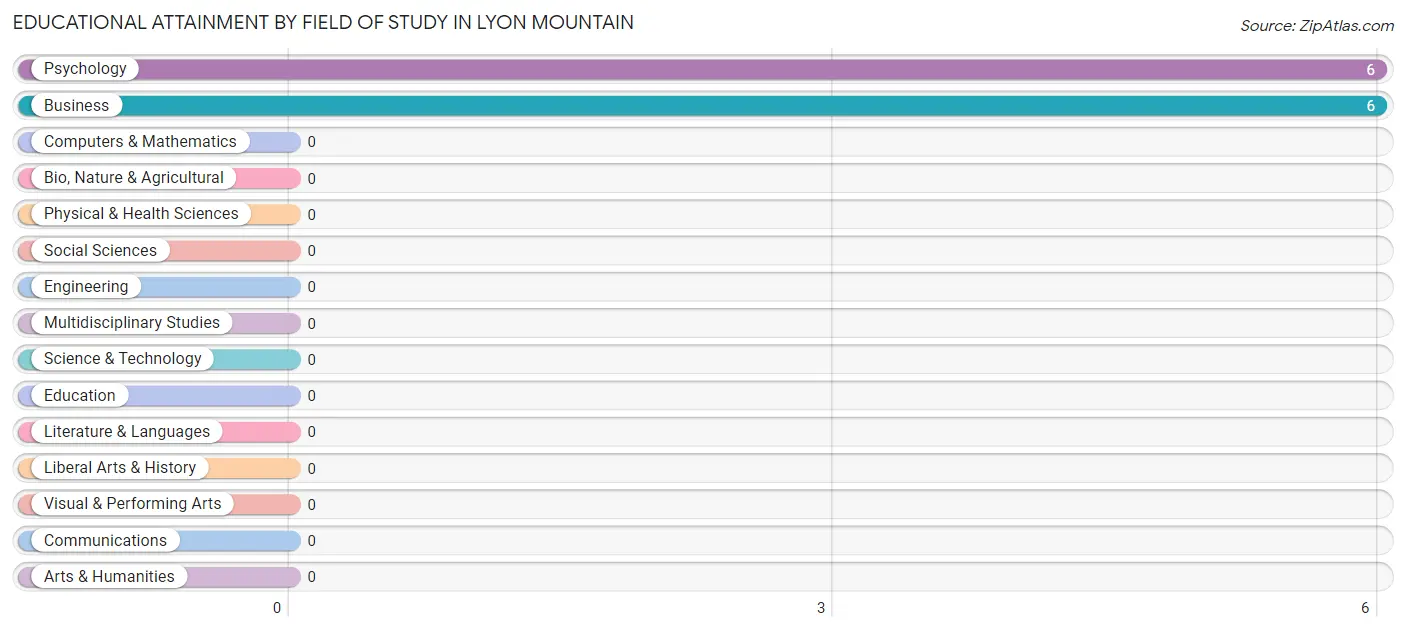
| Field of Study | # Graduates | % Graduates |
| Computers & Mathematics | 0 | 0.0% |
| Bio, Nature & Agricultural | 0 | 0.0% |
| Physical & Health Sciences | 0 | 0.0% |
| Psychology | 6 | 50.0% |
| Social Sciences | 0 | 0.0% |
| Engineering | 0 | 0.0% |
| Multidisciplinary Studies | 0 | 0.0% |
| Science & Technology | 0 | 0.0% |
| Business | 6 | 50.0% |
| Education | 0 | 0.0% |
| Literature & Languages | 0 | 0.0% |
| Liberal Arts & History | 0 | 0.0% |
| Visual & Performing Arts | 0 | 0.0% |
| Communications | 0 | 0.0% |
| Arts & Humanities | 0 | 0.0% |
| Total | 12 | 100.0% |
Transportation & Commute in Lyon Mountain
Vehicle Availability by Sex in Lyon Mountain
The most prevalent vehicle ownership categories in Lyon Mountain are males with 2 vehicles (10, accounting for 62.5%) and females with 2 vehicles (25, making up 18.5%).
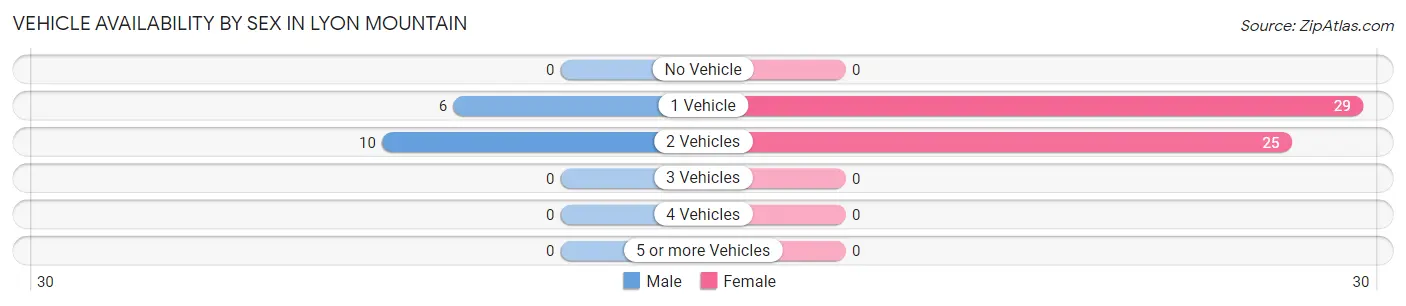
| Vehicles Available | Male | Female |
| No Vehicle | 0 (0.0%) | 0 (0.0%) |
| 1 Vehicle | 6 (37.5%) | 29 (53.7%) |
| 2 Vehicles | 10 (62.5%) | 25 (46.3%) |
| 3 Vehicles | 0 (0.0%) | 0 (0.0%) |
| 4 Vehicles | 0 (0.0%) | 0 (0.0%) |
| 5 or more Vehicles | 0 (0.0%) | 0 (0.0%) |
| Total | 16 (100.0%) | 54 (100.0%) |
Commute Time in Lyon Mountain
The most frequently occuring commute durations in Lyon Mountain are 35 to 39 minutes (30 commuters, 42.9%), 45 to 59 minutes (20 commuters, 28.6%), and 60 to 89 minutes (15 commuters, 21.4%).
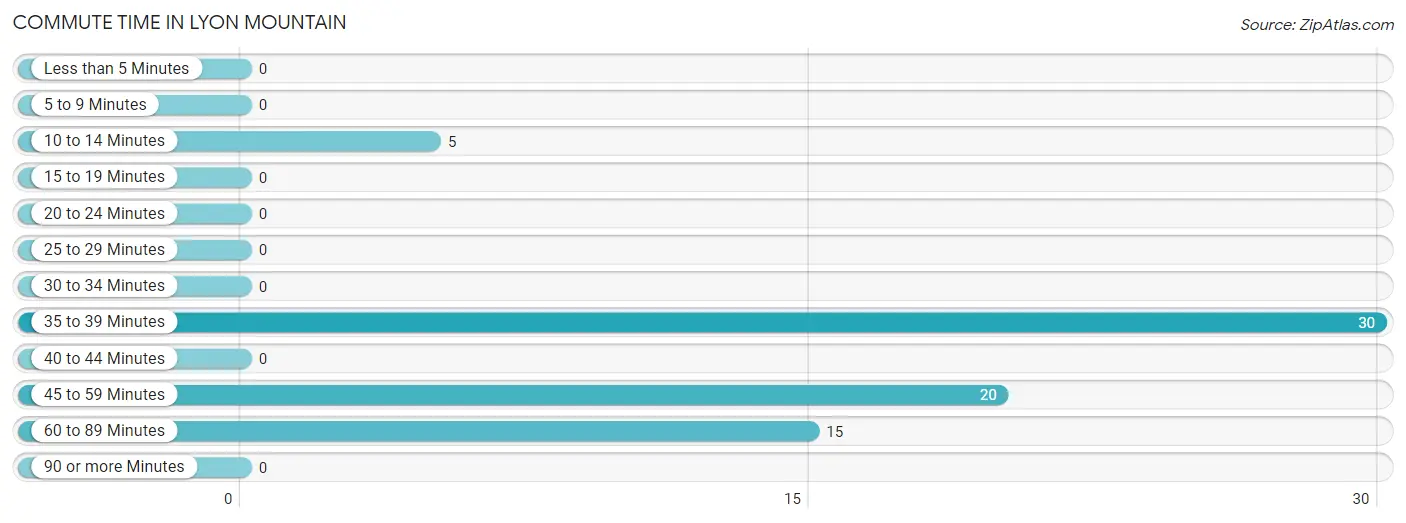
| Commute Time | # Commuters | % Commuters |
| Less than 5 Minutes | 0 | 0.0% |
| 5 to 9 Minutes | 0 | 0.0% |
| 10 to 14 Minutes | 5 | 7.1% |
| 15 to 19 Minutes | 0 | 0.0% |
| 20 to 24 Minutes | 0 | 0.0% |
| 25 to 29 Minutes | 0 | 0.0% |
| 30 to 34 Minutes | 0 | 0.0% |
| 35 to 39 Minutes | 30 | 42.9% |
| 40 to 44 Minutes | 0 | 0.0% |
| 45 to 59 Minutes | 20 | 28.6% |
| 60 to 89 Minutes | 15 | 21.4% |
| 90 or more Minutes | 0 | 0.0% |
Commute Time by Sex in Lyon Mountain
The most common commute times in Lyon Mountain are 35 to 39 minutes (11 commuters, 68.8%) for males and 45 to 59 minutes (20 commuters, 37.0%) for females.
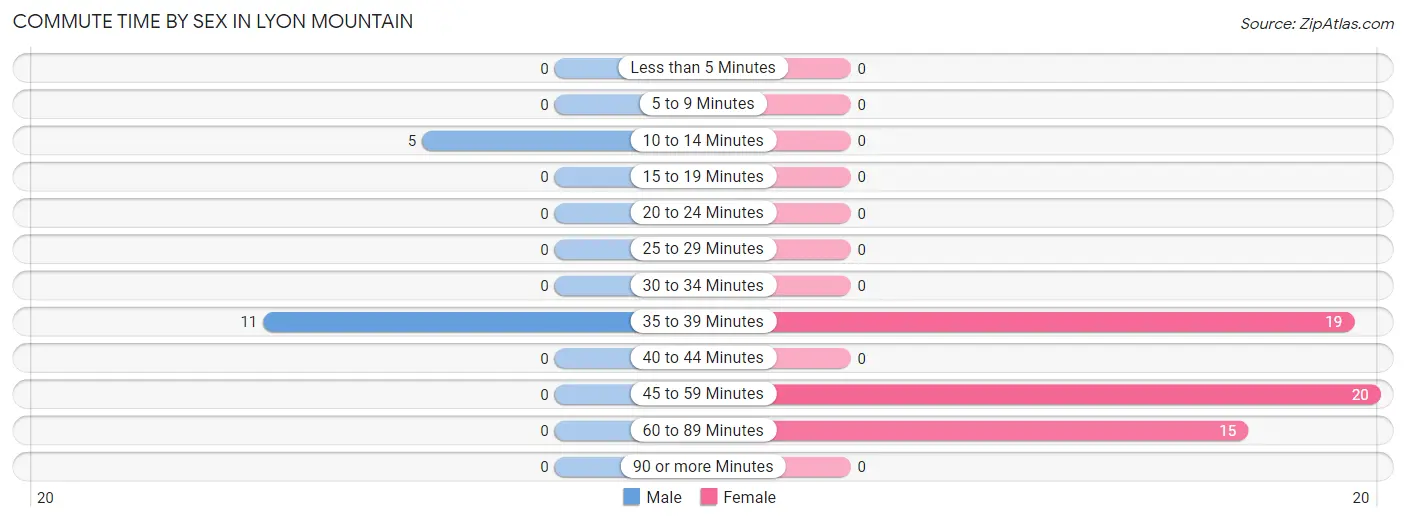
| Commute Time | Male | Female |
| Less than 5 Minutes | 0 (0.0%) | 0 (0.0%) |
| 5 to 9 Minutes | 0 (0.0%) | 0 (0.0%) |
| 10 to 14 Minutes | 5 (31.2%) | 0 (0.0%) |
| 15 to 19 Minutes | 0 (0.0%) | 0 (0.0%) |
| 20 to 24 Minutes | 0 (0.0%) | 0 (0.0%) |
| 25 to 29 Minutes | 0 (0.0%) | 0 (0.0%) |
| 30 to 34 Minutes | 0 (0.0%) | 0 (0.0%) |
| 35 to 39 Minutes | 11 (68.8%) | 19 (35.2%) |
| 40 to 44 Minutes | 0 (0.0%) | 0 (0.0%) |
| 45 to 59 Minutes | 0 (0.0%) | 20 (37.0%) |
| 60 to 89 Minutes | 0 (0.0%) | 15 (27.8%) |
| 90 or more Minutes | 0 (0.0%) | 0 (0.0%) |
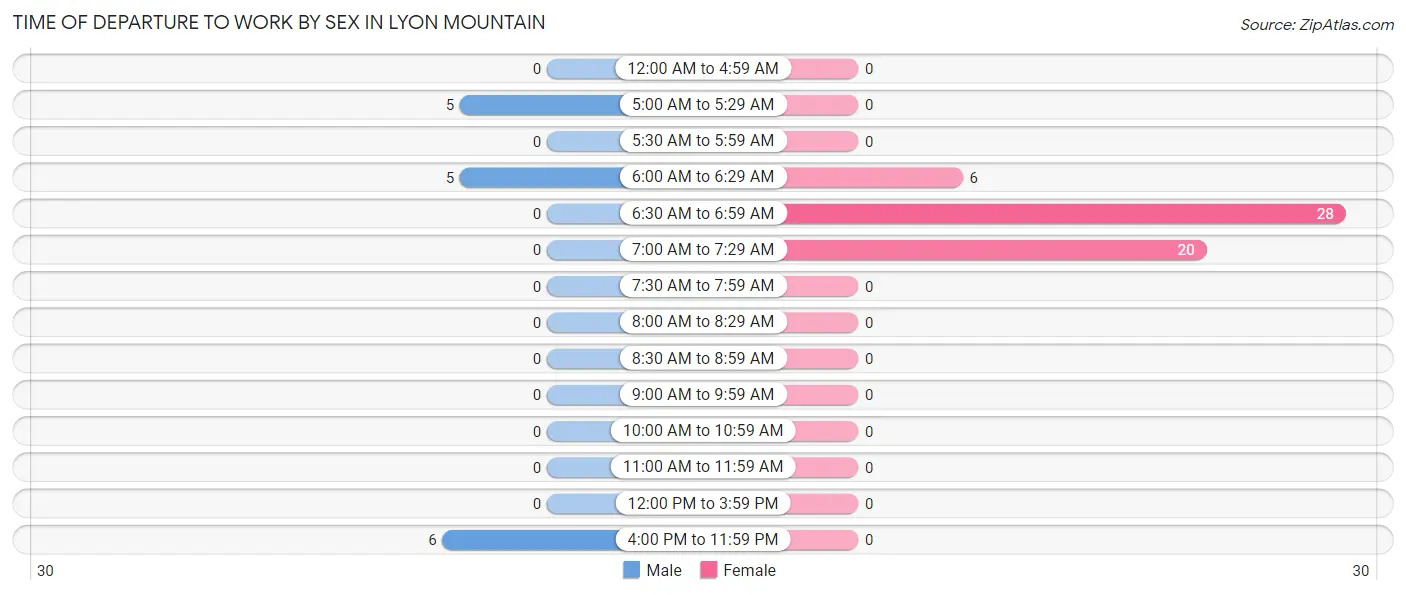
Time of Departure to Work by Sex in Lyon Mountain
The most frequent times of departure to work in Lyon Mountain are 4:00 PM to 11:59 PM (6, 37.5%) for males and 6:30 AM to 6:59 AM (28, 51.8%) for females.
| Time of Departure | Male | Female |
| 12:00 AM to 4:59 AM | 0 (0.0%) | 0 (0.0%) |
| 5:00 AM to 5:29 AM | 5 (31.2%) | 0 (0.0%) |
| 5:30 AM to 5:59 AM | 0 (0.0%) | 0 (0.0%) |
| 6:00 AM to 6:29 AM | 5 (31.2%) | 6 (11.1%) |
| 6:30 AM to 6:59 AM | 0 (0.0%) | 28 (51.8%) |
| 7:00 AM to 7:29 AM | 0 (0.0%) | 20 (37.0%) |
| 7:30 AM to 7:59 AM | 0 (0.0%) | 0 (0.0%) |
| 8:00 AM to 8:29 AM | 0 (0.0%) | 0 (0.0%) |
| 8:30 AM to 8:59 AM | 0 (0.0%) | 0 (0.0%) |
| 9:00 AM to 9:59 AM | 0 (0.0%) | 0 (0.0%) |
| 10:00 AM to 10:59 AM | 0 (0.0%) | 0 (0.0%) |
| 11:00 AM to 11:59 AM | 0 (0.0%) | 0 (0.0%) |
| 12:00 PM to 3:59 PM | 0 (0.0%) | 0 (0.0%) |
| 4:00 PM to 11:59 PM | 6 (37.5%) | 0 (0.0%) |
| Total | 16 (100.0%) | 54 (100.0%) |
Housing Occupancy in Lyon Mountain
Occupancy by Ownership in Lyon Mountain
Of the total 103 dwellings in Lyon Mountain, owner-occupied units account for 66 (64.1%), while renter-occupied units make up 37 (35.9%).
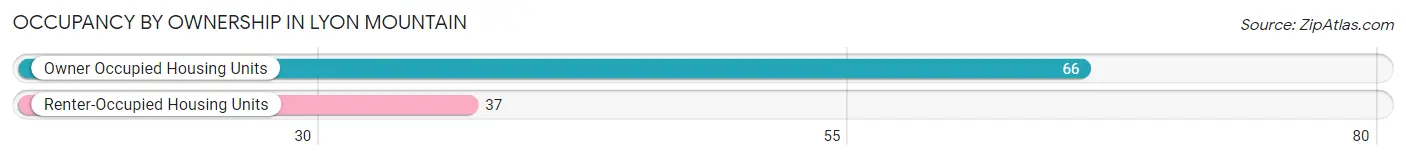
| Occupancy | # Housing Units | % Housing Units |
| Owner Occupied Housing Units | 66 | 64.1% |
| Renter-Occupied Housing Units | 37 | 35.9% |
| Total Occupied Housing Units | 103 | 100.0% |
Occupancy by Household Size in Lyon Mountain
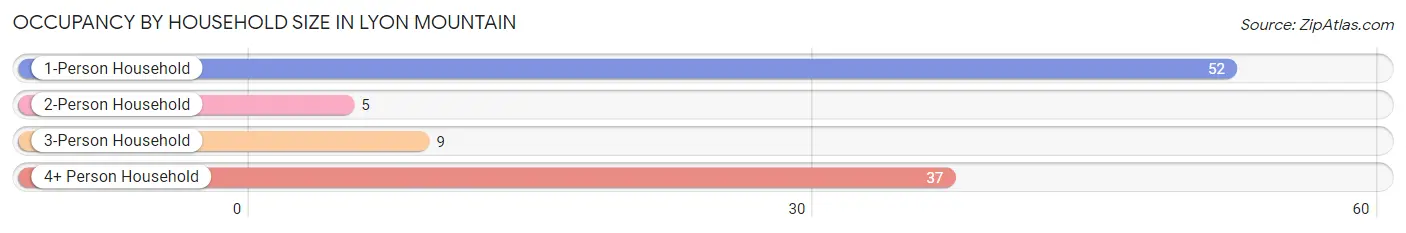
| Household Size | # Housing Units | % Housing Units |
| 1-Person Household | 52 | 50.5% |
| 2-Person Household | 5 | 4.9% |
| 3-Person Household | 9 | 8.7% |
| 4+ Person Household | 37 | 35.9% |
| Total Housing Units | 103 | 100.0% |
Occupancy by Ownership by Household Size in Lyon Mountain
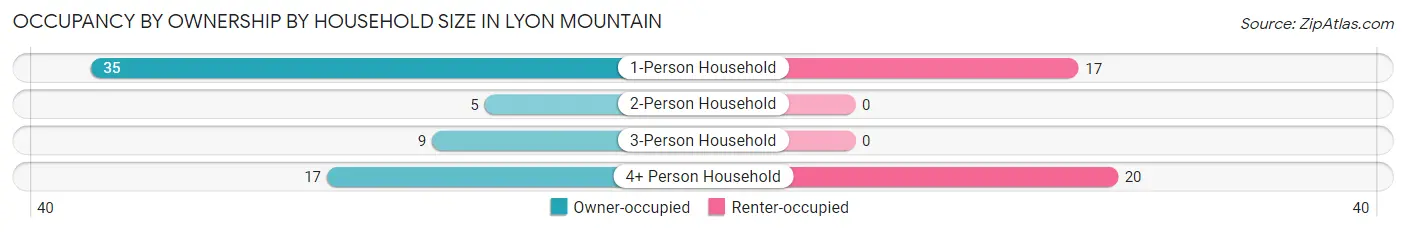
| Household Size | Owner-occupied | Renter-occupied |
| 1-Person Household | 35 (67.3%) | 17 (32.7%) |
| 2-Person Household | 5 (100.0%) | 0 (0.0%) |
| 3-Person Household | 9 (100.0%) | 0 (0.0%) |
| 4+ Person Household | 17 (46.0%) | 20 (54.0%) |
| Total Housing Units | 66 (64.1%) | 37 (35.9%) |
Occupancy by Educational Attainment in Lyon Mountain
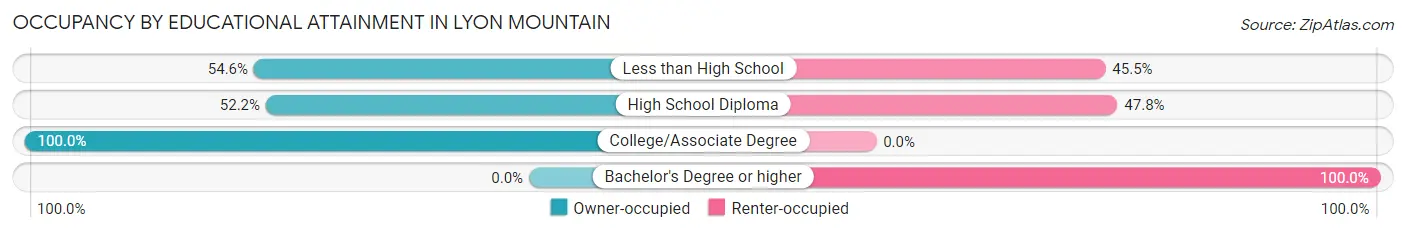
| Household Size | Owner-occupied | Renter-occupied |
| Less than High School | 24 (54.5%) | 20 (45.5%) |
| High School Diploma | 12 (52.2%) | 11 (47.8%) |
| College/Associate Degree | 30 (100.0%) | 0 (0.0%) |
| Bachelor's Degree or higher | 0 (0.0%) | 6 (100.0%) |
Occupancy by Age of Householder in Lyon Mountain
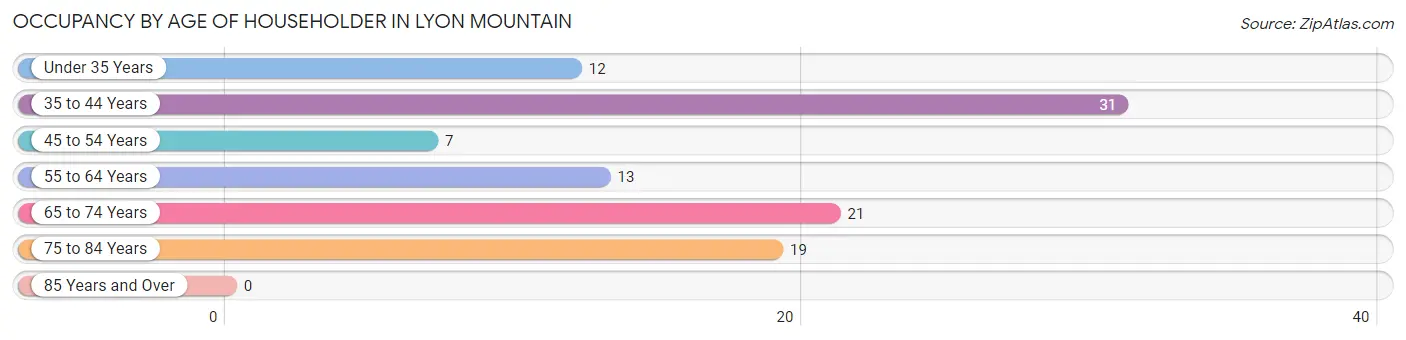
| Age Bracket | # Households | % Households |
| Under 35 Years | 12 | 11.7% |
| 35 to 44 Years | 31 | 30.1% |
| 45 to 54 Years | 7 | 6.8% |
| 55 to 64 Years | 13 | 12.6% |
| 65 to 74 Years | 21 | 20.4% |
| 75 to 84 Years | 19 | 18.4% |
| 85 Years and Over | 0 | 0.0% |
| Total | 103 | 100.0% |
Housing Finances in Lyon Mountain
Median Income by Occupancy in Lyon Mountain
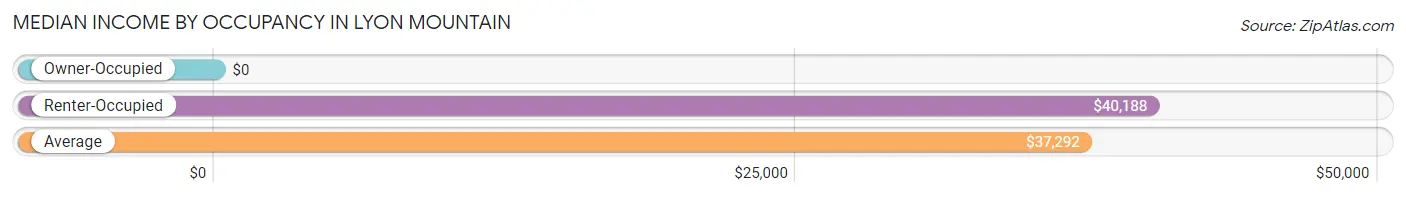
| Occupancy Type | # Households | Median Income |
| Owner-Occupied | 66 (64.1%) | $0 |
| Renter-Occupied | 37 (35.9%) | $40,188 |
| Average | 103 (100.0%) | $37,292 |
Occupancy by Householder Income Bracket in Lyon Mountain
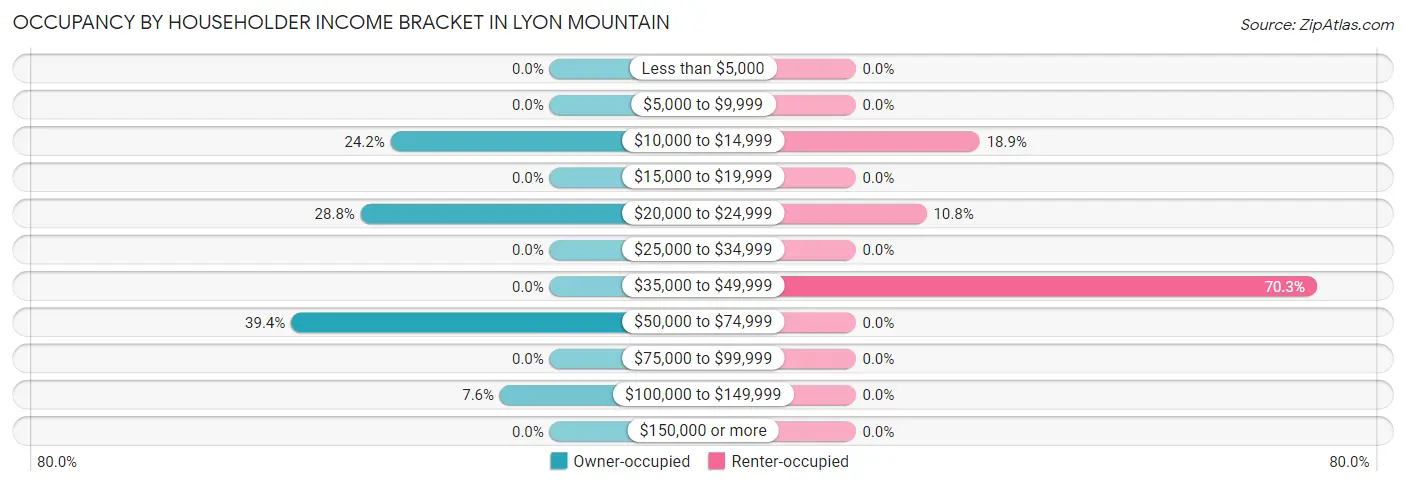
| Income Bracket | Owner-occupied | Renter-occupied |
| Less than $5,000 | 0 (0.0%) | 0 (0.0%) |
| $5,000 to $9,999 | 0 (0.0%) | 0 (0.0%) |
| $10,000 to $14,999 | 16 (24.2%) | 7 (18.9%) |
| $15,000 to $19,999 | 0 (0.0%) | 0 (0.0%) |
| $20,000 to $24,999 | 19 (28.8%) | 4 (10.8%) |
| $25,000 to $34,999 | 0 (0.0%) | 0 (0.0%) |
| $35,000 to $49,999 | 0 (0.0%) | 26 (70.3%) |
| $50,000 to $74,999 | 26 (39.4%) | 0 (0.0%) |
| $75,000 to $99,999 | 0 (0.0%) | 0 (0.0%) |
| $100,000 to $149,999 | 5 (7.6%) | 0 (0.0%) |
| $150,000 or more | 0 (0.0%) | 0 (0.0%) |
| Total | 66 (100.0%) | 37 (100.0%) |
Monthly Housing Cost Tiers in Lyon Mountain
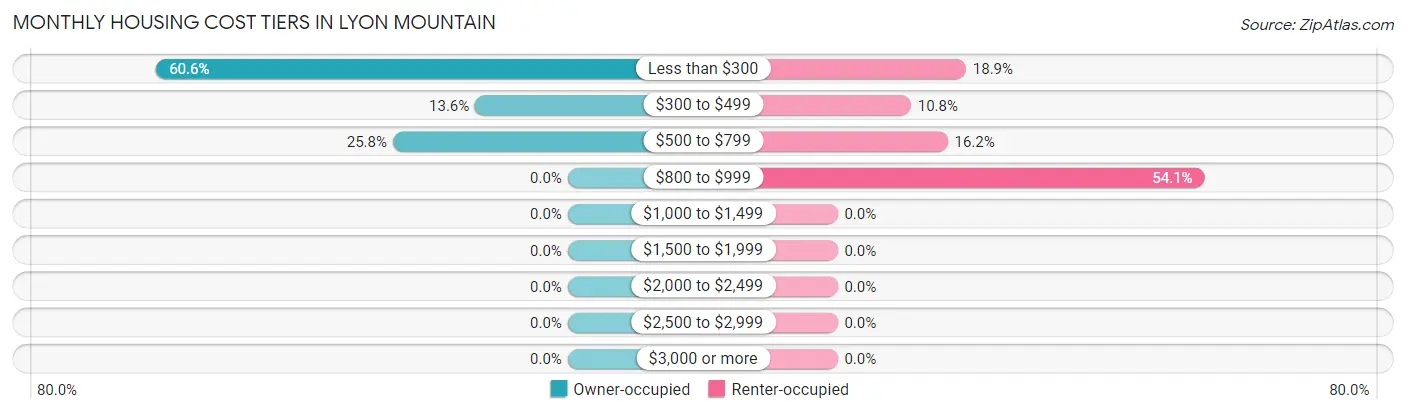
| Monthly Cost | Owner-occupied | Renter-occupied |
| Less than $300 | 40 (60.6%) | 7 (18.9%) |
| $300 to $499 | 9 (13.6%) | 4 (10.8%) |
| $500 to $799 | 17 (25.8%) | 6 (16.2%) |
| $800 to $999 | 0 (0.0%) | 20 (54.0%) |
| $1,000 to $1,499 | 0 (0.0%) | 0 (0.0%) |
| $1,500 to $1,999 | 0 (0.0%) | 0 (0.0%) |
| $2,000 to $2,499 | 0 (0.0%) | 0 (0.0%) |
| $2,500 to $2,999 | 0 (0.0%) | 0 (0.0%) |
| $3,000 or more | 0 (0.0%) | 0 (0.0%) |
| Total | 66 (100.0%) | 37 (100.0%) |
Physical Housing Characteristics in Lyon Mountain
Housing Structures in Lyon Mountain
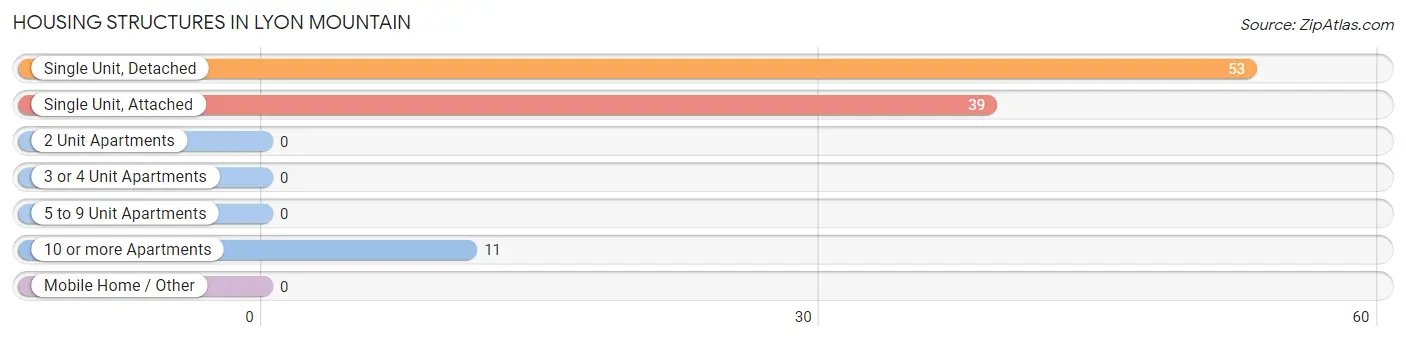
| Structure Type | # Housing Units | % Housing Units |
| Single Unit, Detached | 53 | 51.5% |
| Single Unit, Attached | 39 | 37.9% |
| 2 Unit Apartments | 0 | 0.0% |
| 3 or 4 Unit Apartments | 0 | 0.0% |
| 5 to 9 Unit Apartments | 0 | 0.0% |
| 10 or more Apartments | 11 | 10.7% |
| Mobile Home / Other | 0 | 0.0% |
| Total | 103 | 100.0% |
Housing Structures by Occupancy in Lyon Mountain
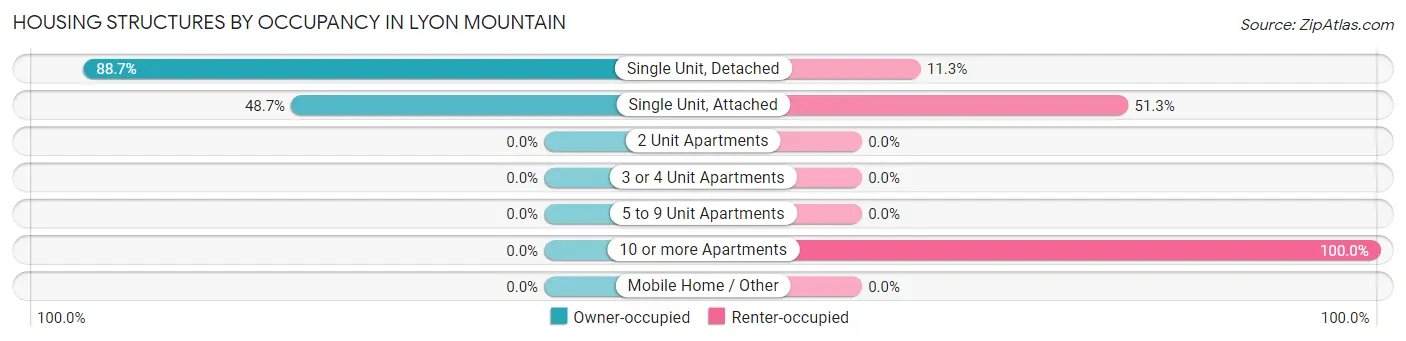
| Structure Type | Owner-occupied | Renter-occupied |
| Single Unit, Detached | 47 (88.7%) | 6 (11.3%) |
| Single Unit, Attached | 19 (48.7%) | 20 (51.3%) |
| 2 Unit Apartments | 0 (0.0%) | 0 (0.0%) |
| 3 or 4 Unit Apartments | 0 (0.0%) | 0 (0.0%) |
| 5 to 9 Unit Apartments | 0 (0.0%) | 0 (0.0%) |
| 10 or more Apartments | 0 (0.0%) | 11 (100.0%) |
| Mobile Home / Other | 0 (0.0%) | 0 (0.0%) |
| Total | 66 (64.1%) | 37 (35.9%) |
Housing Structures by Number of Rooms in Lyon Mountain
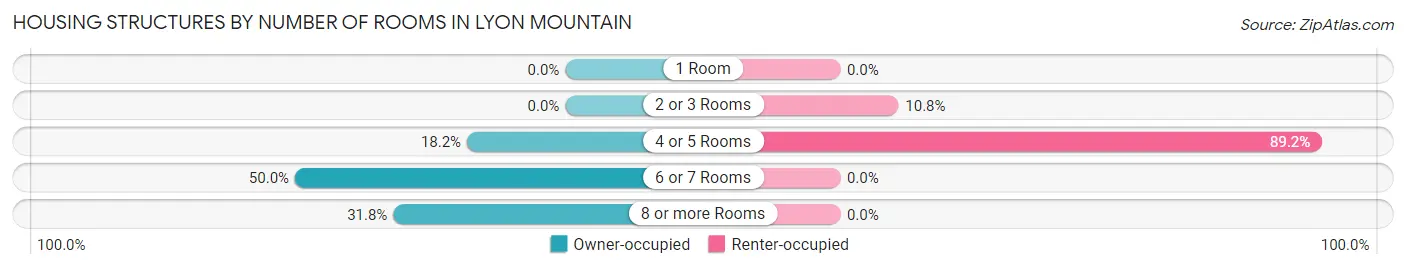
| Number of Rooms | Owner-occupied | Renter-occupied |
| 1 Room | 0 (0.0%) | 0 (0.0%) |
| 2 or 3 Rooms | 0 (0.0%) | 4 (10.8%) |
| 4 or 5 Rooms | 12 (18.2%) | 33 (89.2%) |
| 6 or 7 Rooms | 33 (50.0%) | 0 (0.0%) |
| 8 or more Rooms | 21 (31.8%) | 0 (0.0%) |
| Total | 66 (100.0%) | 37 (100.0%) |
Housing Structure by Heating Type in Lyon Mountain
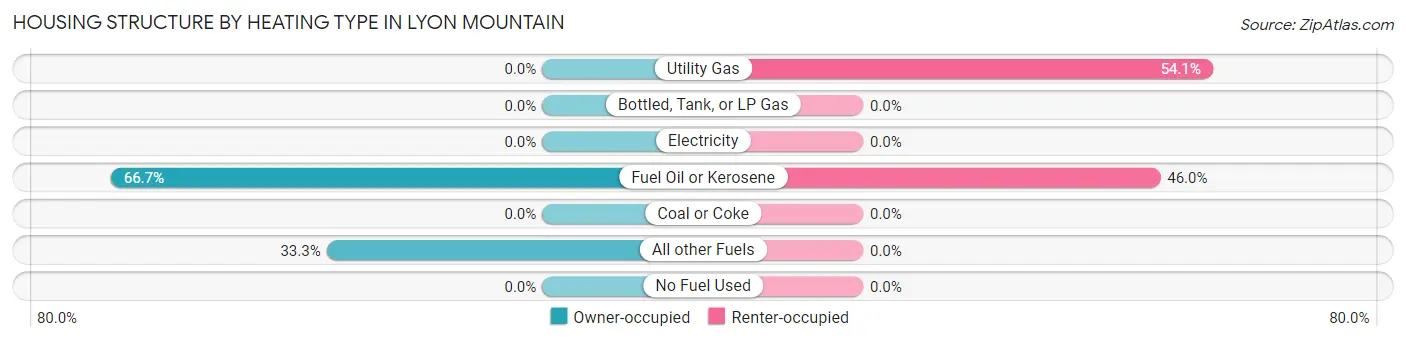
| Heating Type | Owner-occupied | Renter-occupied |
| Utility Gas | 0 (0.0%) | 20 (54.0%) |
| Bottled, Tank, or LP Gas | 0 (0.0%) | 0 (0.0%) |
| Electricity | 0 (0.0%) | 0 (0.0%) |
| Fuel Oil or Kerosene | 44 (66.7%) | 17 (46.0%) |
| Coal or Coke | 0 (0.0%) | 0 (0.0%) |
| All other Fuels | 22 (33.3%) | 0 (0.0%) |
| No Fuel Used | 0 (0.0%) | 0 (0.0%) |
| Total | 66 (100.0%) | 37 (100.0%) |
Household Vehicle Usage in Lyon Mountain
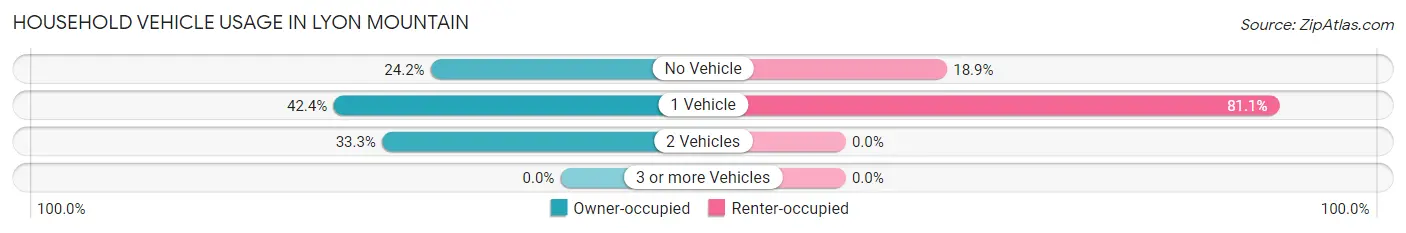
| Vehicles per Household | Owner-occupied | Renter-occupied |
| No Vehicle | 16 (24.2%) | 7 (18.9%) |
| 1 Vehicle | 28 (42.4%) | 30 (81.1%) |
| 2 Vehicles | 22 (33.3%) | 0 (0.0%) |
| 3 or more Vehicles | 0 (0.0%) | 0 (0.0%) |
| Total | 66 (100.0%) | 37 (100.0%) |
Real Estate & Mortgages in Lyon Mountain
Real Estate and Mortgage Overview in Lyon Mountain
| Characteristic | Without Mortgage | With Mortgage |
| Housing Units | 45 | 21 |
| Median Property Value | $41,300 | $0 |
| Median Household Income | $20,855 | $0 |
| Monthly Housing Costs | $258 | $0 |
| Real Estate Taxes | $1,190 | $0 |
Property Value by Mortgage Status in Lyon Mountain
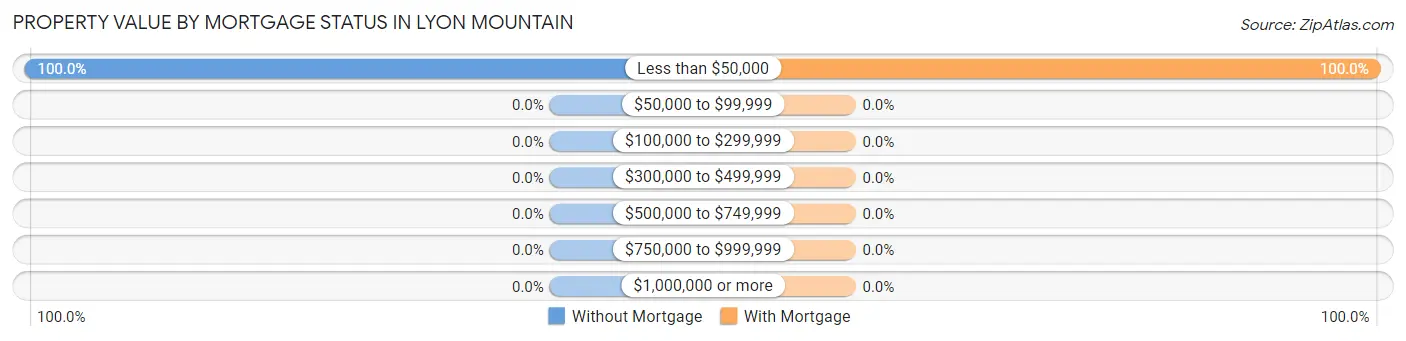
| Property Value | Without Mortgage | With Mortgage |
| Less than $50,000 | 45 (100.0%) | 21 (100.0%) |
| $50,000 to $99,999 | 0 (0.0%) | 0 (0.0%) |
| $100,000 to $299,999 | 0 (0.0%) | 0 (0.0%) |
| $300,000 to $499,999 | 0 (0.0%) | 0 (0.0%) |
| $500,000 to $749,999 | 0 (0.0%) | 0 (0.0%) |
| $750,000 to $999,999 | 0 (0.0%) | 0 (0.0%) |
| $1,000,000 or more | 0 (0.0%) | 0 (0.0%) |
| Total | 45 (100.0%) | 21 (100.0%) |
Household Income by Mortgage Status in Lyon Mountain
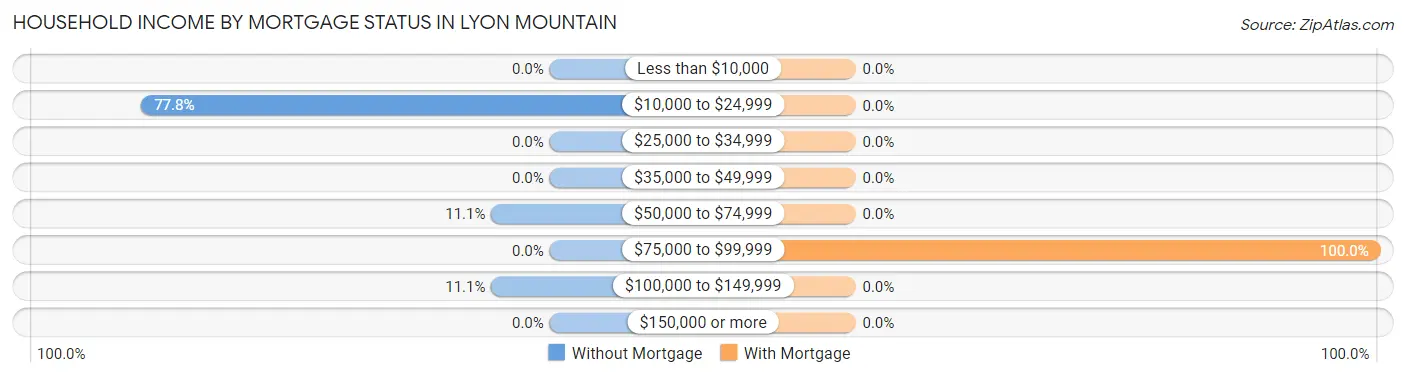
| Household Income | Without Mortgage | With Mortgage |
| Less than $10,000 | 0 (0.0%) | 0 (0.0%) |
| $10,000 to $24,999 | 35 (77.8%) | 0 (0.0%) |
| $25,000 to $34,999 | 0 (0.0%) | 0 (0.0%) |
| $35,000 to $49,999 | 0 (0.0%) | 0 (0.0%) |
| $50,000 to $74,999 | 5 (11.1%) | 0 (0.0%) |
| $75,000 to $99,999 | 0 (0.0%) | 21 (100.0%) |
| $100,000 to $149,999 | 5 (11.1%) | 0 (0.0%) |
| $150,000 or more | 0 (0.0%) | 0 (0.0%) |
| Total | 45 (100.0%) | 21 (100.0%) |
Property Value to Household Income Ratio in Lyon Mountain
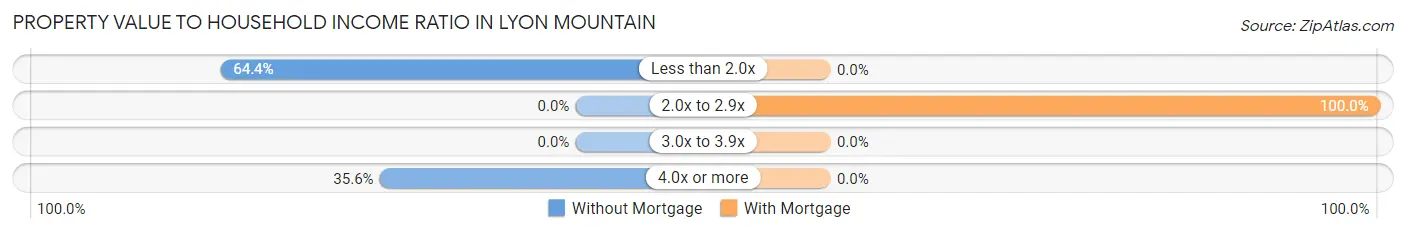
| Value-to-Income Ratio | Without Mortgage | With Mortgage |
| Less than 2.0x | 29 (64.4%) | 0 (0.0%) |
| 2.0x to 2.9x | 0 (0.0%) | 21 (100.0%) |
| 3.0x to 3.9x | 0 (0.0%) | 0 (0.0%) |
| 4.0x or more | 16 (35.6%) | 0 (0.0%) |
| Total | 45 (100.0%) | 21 (100.0%) |
Real Estate Taxes by Mortgage Status in Lyon Mountain
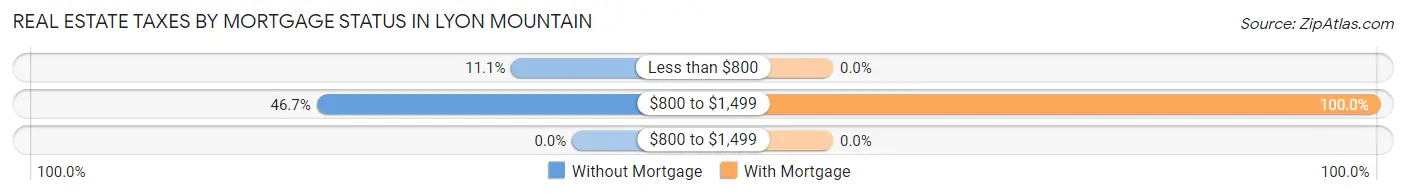
| Property Taxes | Without Mortgage | With Mortgage |
| Less than $800 | 5 (11.1%) | 0 (0.0%) |
| $800 to $1,499 | 21 (46.7%) | 21 (100.0%) |
| $800 to $1,499 | 0 (0.0%) | 0 (0.0%) |
| Total | 45 (100.0%) | 21 (100.0%) |
Health & Disability in Lyon Mountain
Health Insurance Coverage by Age in Lyon Mountain
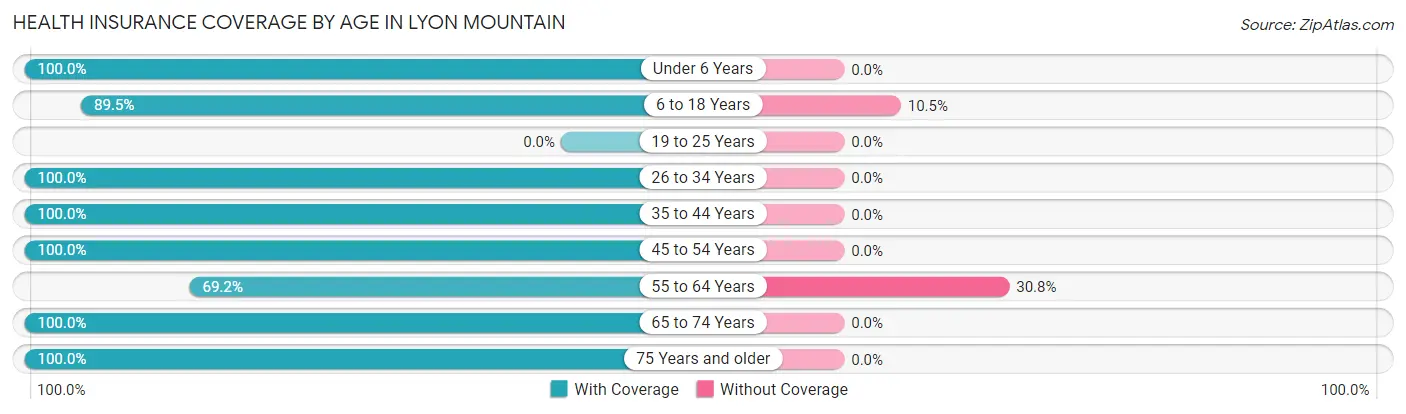
| Age Bracket | With Coverage | Without Coverage |
| Under 6 Years | 37 (100.0%) | 0 (0.0%) |
| 6 to 18 Years | 51 (89.5%) | 6 (10.5%) |
| 19 to 25 Years | 0 (0.0%) | 0 (0.0%) |
| 26 to 34 Years | 44 (100.0%) | 0 (0.0%) |
| 35 to 44 Years | 47 (100.0%) | 0 (0.0%) |
| 45 to 54 Years | 7 (100.0%) | 0 (0.0%) |
| 55 to 64 Years | 9 (69.2%) | 4 (30.8%) |
| 65 to 74 Years | 26 (100.0%) | 0 (0.0%) |
| 75 Years and older | 19 (100.0%) | 0 (0.0%) |
| Total | 240 (96.0%) | 10 (4.0%) |
Health Insurance Coverage by Citizenship Status in Lyon Mountain
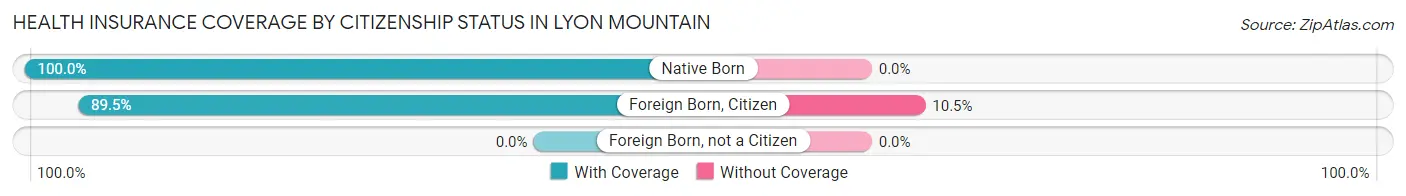
| Citizenship Status | With Coverage | Without Coverage |
| Native Born | 37 (100.0%) | 0 (0.0%) |
| Foreign Born, Citizen | 51 (89.5%) | 6 (10.5%) |
| Foreign Born, not a Citizen | 0 (0.0%) | 0 (0.0%) |
Health Insurance Coverage by Household Income in Lyon Mountain
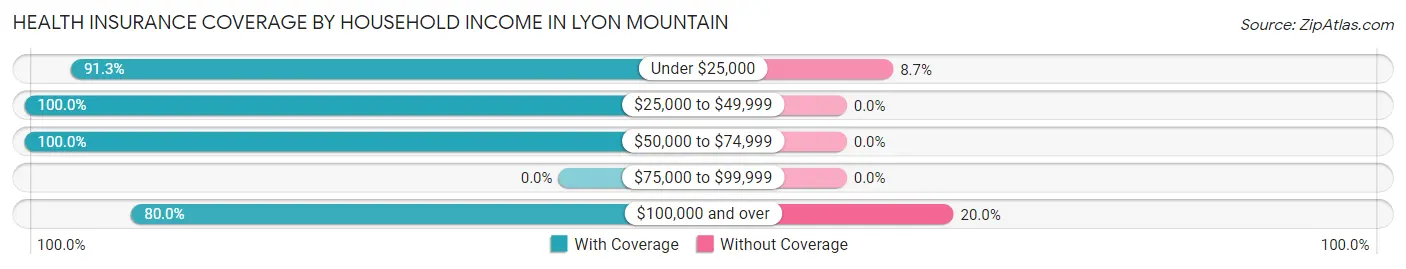
| Household Income | With Coverage | Without Coverage |
| Under $25,000 | 42 (91.3%) | 4 (8.7%) |
| $25,000 to $49,999 | 79 (100.0%) | 0 (0.0%) |
| $50,000 to $74,999 | 95 (100.0%) | 0 (0.0%) |
| $75,000 to $99,999 | 0 (0.0%) | 0 (0.0%) |
| $100,000 and over | 24 (80.0%) | 6 (20.0%) |
Public vs Private Health Insurance Coverage by Age in Lyon Mountain
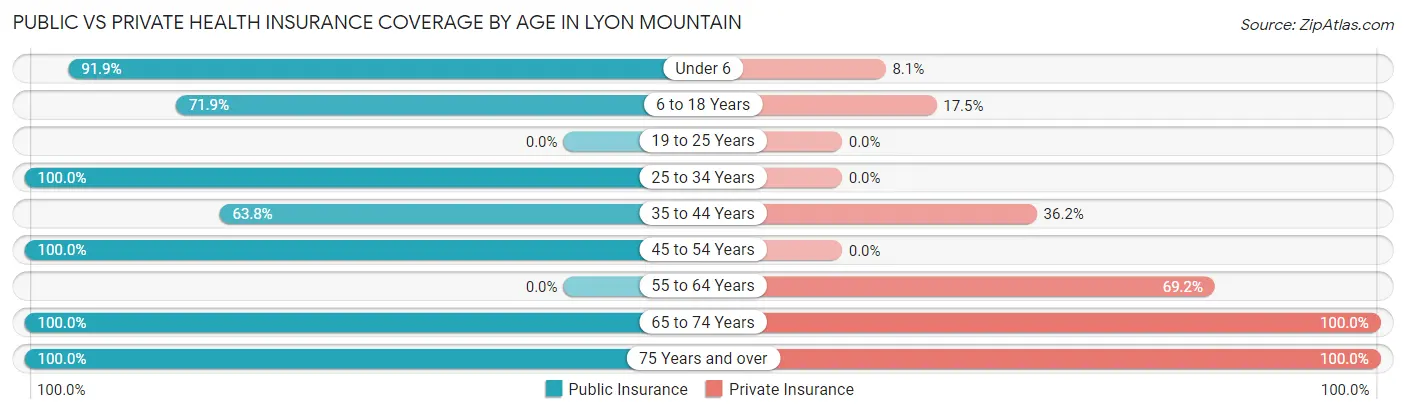
| Age Bracket | Public Insurance | Private Insurance |
| Under 6 | 34 (91.9%) | 3 (8.1%) |
| 6 to 18 Years | 41 (71.9%) | 10 (17.5%) |
| 19 to 25 Years | 0 (0.0%) | 0 (0.0%) |
| 25 to 34 Years | 44 (100.0%) | 0 (0.0%) |
| 35 to 44 Years | 30 (63.8%) | 17 (36.2%) |
| 45 to 54 Years | 7 (100.0%) | 0 (0.0%) |
| 55 to 64 Years | 0 (0.0%) | 9 (69.2%) |
| 65 to 74 Years | 26 (100.0%) | 26 (100.0%) |
| 75 Years and over | 19 (100.0%) | 19 (100.0%) |
| Total | 201 (80.4%) | 84 (33.6%) |
Disability Status by Sex by Age in Lyon Mountain
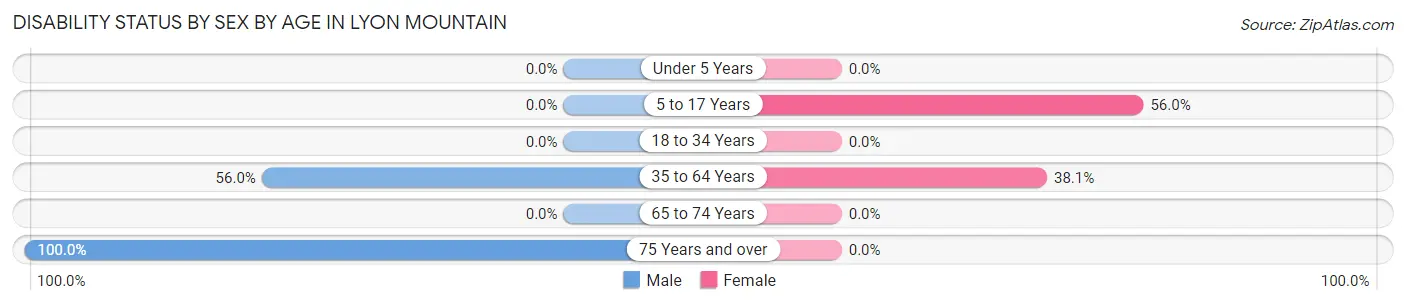
| Age Bracket | Male | Female |
| Under 5 Years | 0 (0.0%) | 0 (0.0%) |
| 5 to 17 Years | 0 (0.0%) | 14 (56.0%) |
| 18 to 34 Years | 0 (0.0%) | 0 (0.0%) |
| 35 to 64 Years | 14 (56.0%) | 16 (38.1%) |
| 65 to 74 Years | 0 (0.0%) | 0 (0.0%) |
| 75 Years and over | 19 (100.0%) | 0 (0.0%) |
Disability Class by Sex by Age in Lyon Mountain
Disability Class: Hearing Difficulty
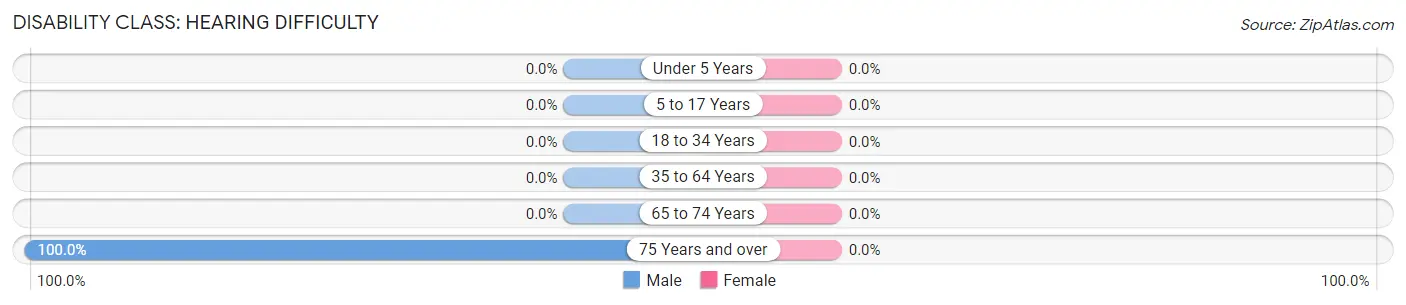
| Age Bracket | Male | Female |
| Under 5 Years | 0 (0.0%) | 0 (0.0%) |
| 5 to 17 Years | 0 (0.0%) | 0 (0.0%) |
| 18 to 34 Years | 0 (0.0%) | 0 (0.0%) |
| 35 to 64 Years | 0 (0.0%) | 0 (0.0%) |
| 65 to 74 Years | 0 (0.0%) | 0 (0.0%) |
| 75 Years and over | 19 (100.0%) | 0 (0.0%) |
Disability Class: Vision Difficulty
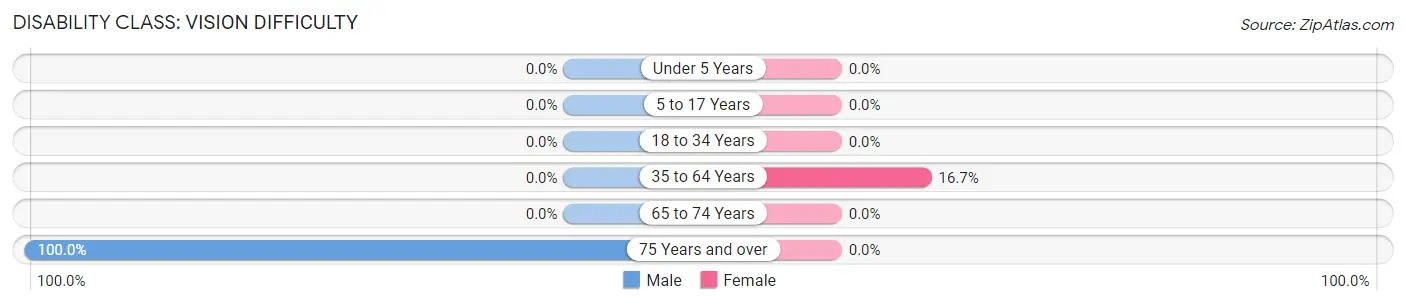
| Age Bracket | Male | Female |
| Under 5 Years | 0 (0.0%) | 0 (0.0%) |
| 5 to 17 Years | 0 (0.0%) | 0 (0.0%) |
| 18 to 34 Years | 0 (0.0%) | 0 (0.0%) |
| 35 to 64 Years | 0 (0.0%) | 7 (16.7%) |
| 65 to 74 Years | 0 (0.0%) | 0 (0.0%) |
| 75 Years and over | 19 (100.0%) | 0 (0.0%) |
Disability Class: Cognitive Difficulty
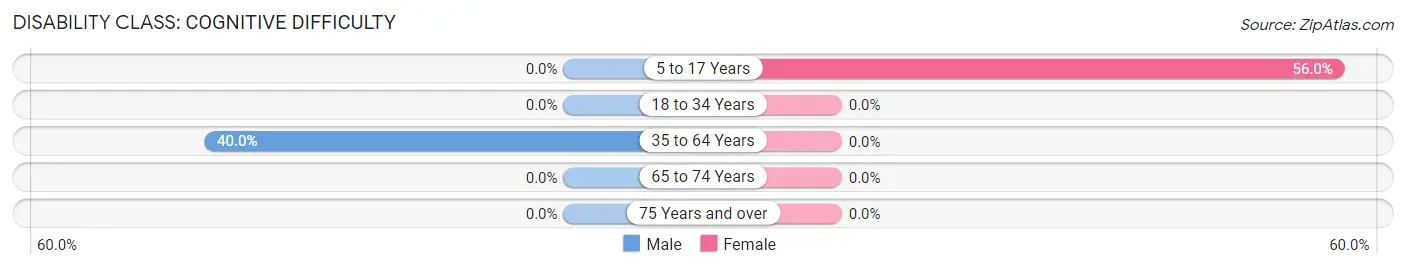
| Age Bracket | Male | Female |
| 5 to 17 Years | 0 (0.0%) | 14 (56.0%) |
| 18 to 34 Years | 0 (0.0%) | 0 (0.0%) |
| 35 to 64 Years | 10 (40.0%) | 0 (0.0%) |
| 65 to 74 Years | 0 (0.0%) | 0 (0.0%) |
| 75 Years and over | 0 (0.0%) | 0 (0.0%) |
Disability Class: Ambulatory Difficulty
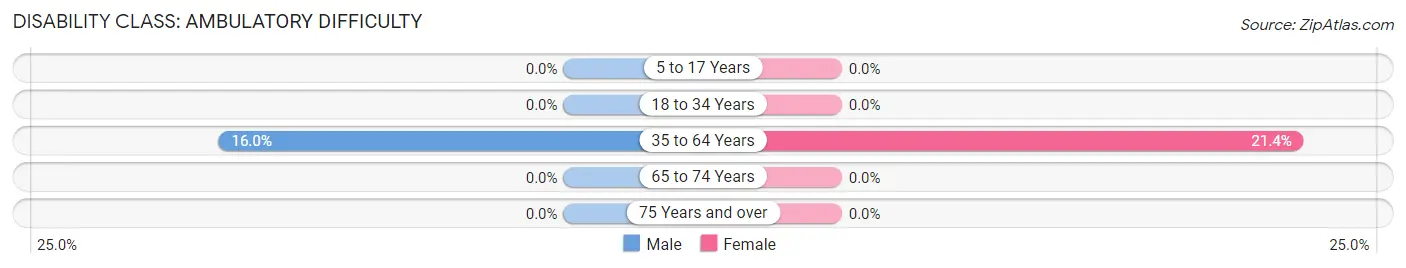
| Age Bracket | Male | Female |
| 5 to 17 Years | 0 (0.0%) | 0 (0.0%) |
| 18 to 34 Years | 0 (0.0%) | 0 (0.0%) |
| 35 to 64 Years | 4 (16.0%) | 9 (21.4%) |
| 65 to 74 Years | 0 (0.0%) | 0 (0.0%) |
| 75 Years and over | 0 (0.0%) | 0 (0.0%) |
Disability Class: Self-Care Difficulty
| Age Bracket | Male | Female |
| 5 to 17 Years | 0 (0.0%) | 0 (0.0%) |
| 18 to 34 Years | 0 (0.0%) | 0 (0.0%) |
| 35 to 64 Years | 0 (0.0%) | 0 (0.0%) |
| 65 to 74 Years | 0 (0.0%) | 0 (0.0%) |
| 75 Years and over | 0 (0.0%) | 0 (0.0%) |
Technology Access in Lyon Mountain
Computing Device Access in Lyon Mountain
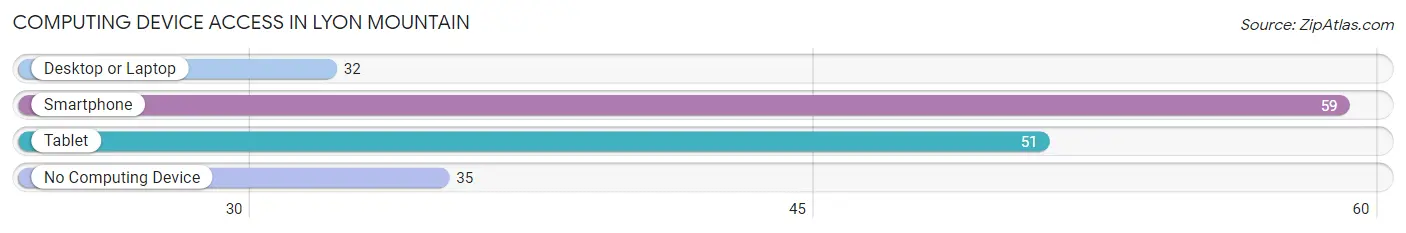
| Device Type | # Households | % Households |
| Desktop or Laptop | 32 | 31.1% |
| Smartphone | 59 | 57.3% |
| Tablet | 51 | 49.5% |
| No Computing Device | 35 | 34.0% |
| Total | 103 | 100.0% |
Internet Access in Lyon Mountain
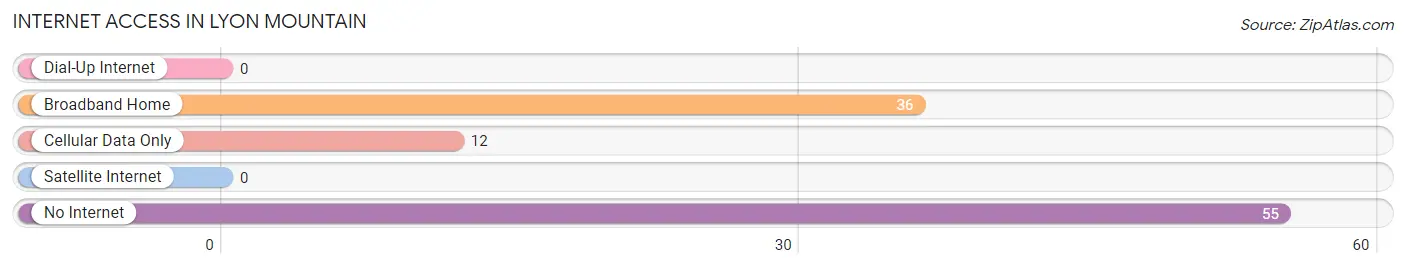
| Internet Type | # Households | % Households |
| Dial-Up Internet | 0 | 0.0% |
| Broadband Home | 36 | 34.9% |
| Cellular Data Only | 12 | 11.7% |
| Satellite Internet | 0 | 0.0% |
| No Internet | 55 | 53.4% |
| Total | 103 | 100.0% |
Lyon Mountain Summary
Lyon Mountain is a hamlet located in the town of Dannemora in Clinton County, New York. It is situated in the Adirondack Mountains, approximately 20 miles south of the Canadian border. The hamlet is home to a population of approximately 500 people, and is known for its rich history and culture.
Geography
Lyon Mountain is located in the Adirondack Mountains, in the northern part of Clinton County. It is situated in the foothills of Lyon Mountain, which is the highest peak in the county. The hamlet is located approximately 20 miles south of the Canadian border, and is bordered by the towns of Dannemora, Saranac, and Chazy. The terrain of the area is mostly mountainous, with rolling hills and valleys. The climate is generally cold and snowy in the winter, and mild and humid in the summer.
History
Lyon Mountain was first settled in the early 1800s by French-Canadian immigrants. The hamlet was named after the mountain, which was named after General Nathaniel Lyon, who fought in the Civil War. The area was primarily used for logging and farming, and the hamlet grew slowly over the years. In the late 1800s, the hamlet became a popular tourist destination, and several hotels and resorts were built in the area. The hamlet was also home to several iron ore mines, which were in operation until the early 1900s.
Economy
The economy of Lyon Mountain is primarily based on tourism and recreation. The hamlet is home to several resorts and hotels, as well as a variety of outdoor activities such as hiking, fishing, and skiing. The hamlet is also home to several small businesses, including restaurants, shops, and galleries.
Demographics
As of the 2010 census, the population of Lyon Mountain was 498. The racial makeup of the hamlet was 97.2% White, 0.6% African American, 0.2% Native American, 0.2% Asian, 0.2% from other races, and 1.8% from two or more races. The median household income was $37,500, and the median family income was $45,000. The per capita income was $19,000.
Conclusion
Lyon Mountain is a small hamlet located in the Adirondack Mountains of Clinton County, New York. It is home to a population of approximately 500 people, and is known for its rich history and culture. The economy of the hamlet is primarily based on tourism and recreation, and the population is mostly White. The hamlet is a popular tourist destination, and is home to several resorts and hotels, as well as a variety of outdoor activities.
Common Questions
What is Per Capita Income in Lyon Mountain?
Per Capita income in Lyon Mountain is $16,820.
What is the Median Family Income in Lyon Mountain?
Median Family Income in Lyon Mountain is $51,146.
What is the Median Household income in Lyon Mountain?
Median Household Income in Lyon Mountain is $37,292.
What is Income or Wage Gap in Lyon Mountain?
Income or Wage Gap in Lyon Mountain is 12.6%.
Women in Lyon Mountain earn 87.4 cents for every dollar earned by a man.
What is Inequality or Gini Index in Lyon Mountain?
Inequality or Gini Index in Lyon Mountain is 0.37.
What is the Total Population of Lyon Mountain?
Total Population of Lyon Mountain is 250.
What is the Total Male Population of Lyon Mountain?
Total Male Population of Lyon Mountain is 104.
What is the Total Female Population of Lyon Mountain?
Total Female Population of Lyon Mountain is 146.
What is the Ratio of Males per 100 Females in Lyon Mountain?
There are 71.23 Males per 100 Females in Lyon Mountain.
What is the Ratio of Females per 100 Males in Lyon Mountain?
There are 140.38 Females per 100 Males in Lyon Mountain.
What is the Median Population Age in Lyon Mountain?
Median Population Age in Lyon Mountain is 30.5 Years.
What is the Average Family Size in Lyon Mountain
Average Family Size in Lyon Mountain is 3.6 People.
What is the Average Household Size in Lyon Mountain
Average Household Size in Lyon Mountain is 2.4 People.
How Large is the Labor Force in Lyon Mountain?
There are 82 People in the Labor Forcein in Lyon Mountain.
What is the Percentage of People in the Labor Force in Lyon Mountain?
52.6% of People are in the Labor Force in Lyon Mountain.
What is the Unemployment Rate in Lyon Mountain?
Unemployment Rate in Lyon Mountain is 14.6%.