Mattydale, NY Map & Demographics
Mattydale Map
Mattydale Overview
$31,391
PER CAPITA INCOME
$73,895
AVG FAMILY INCOME
$69,824
AVG HOUSEHOLD INCOME
16.4%
WAGE / INCOME GAP [ % ]
83.6¢/ $1
WAGE / INCOME GAP [ $ ]
0.35
INEQUALITY / GINI INDEX
5,825
TOTAL POPULATION
2,588
MALE POPULATION
3,237
FEMALE POPULATION
79.95
MALES / 100 FEMALES
125.08
FEMALES / 100 MALES
36.4
MEDIAN AGE
3.1
AVG FAMILY SIZE
2.5
AVG HOUSEHOLD SIZE
3,348
LABOR FORCE [ PEOPLE ]
72.3%
PERCENT IN LABOR FORCE
5.8%
UNEMPLOYMENT RATE
Mattydale Area Codes
Income in Mattydale
Income Overview in Mattydale
Per Capita Income in Mattydale is $31,391, while median incomes of families and households are $73,895 and $69,824 respectively.
| Characteristic | Number | Measure |
| Per Capita Income | 5,825 | $31,391 |
| Median Family Income | 1,379 | $73,895 |
| Mean Family Income | 1,379 | $89,286 |
| Median Household Income | 2,352 | $69,824 |
| Mean Household Income | 2,352 | $76,295 |
| Income Deficit | 1,379 | $0 |
| Wage / Income Gap (%) | 5,825 | 16.39% |
| Wage / Income Gap ($) | 5,825 | 83.61¢ per $1 |
| Gini / Inequality Index | 5,825 | 0.35 |
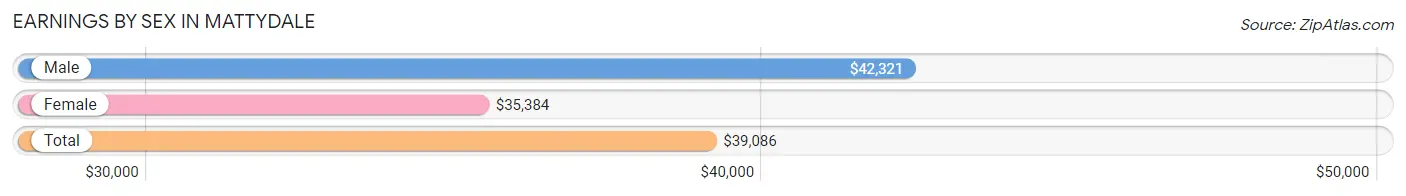
Earnings by Sex in Mattydale
Average Earnings in Mattydale are $39,086, $42,321 for men and $35,384 for women, a difference of 16.4%.
| Sex | Number | Average Earnings |
| Male | 1,566 (46.3%) | $42,321 |
| Female | 1,815 (53.7%) | $35,384 |
| Total | 3,381 (100.0%) | $39,086 |
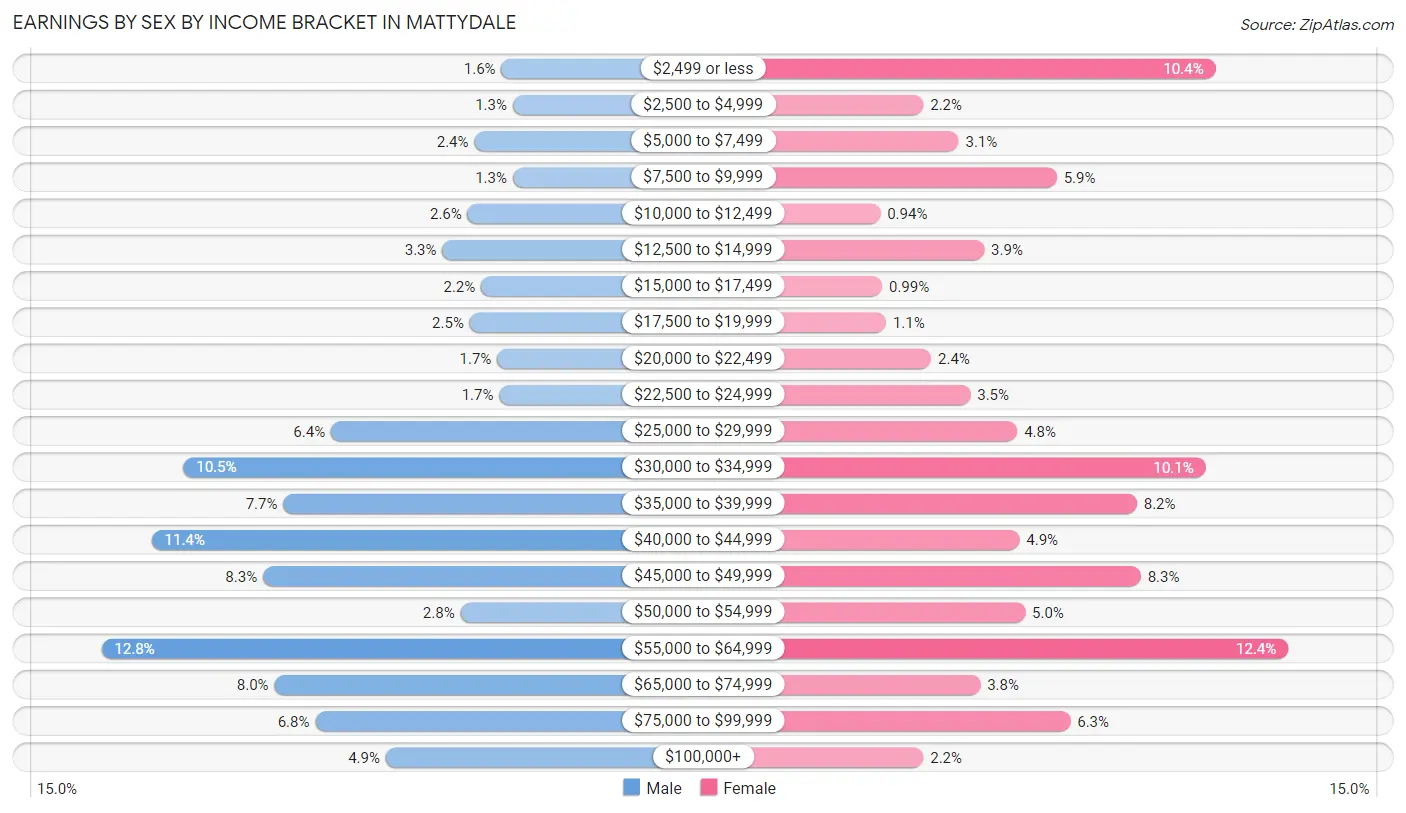
Earnings by Sex by Income Bracket in Mattydale
The most common earnings brackets in Mattydale are $55,000 to $64,999 for men (201 | 12.8%) and $55,000 to $64,999 for women (225 | 12.4%).
| Income | Male | Female |
| $2,499 or less | 25 (1.6%) | 188 (10.4%) |
| $2,500 to $4,999 | 20 (1.3%) | 39 (2.1%) |
| $5,000 to $7,499 | 37 (2.4%) | 57 (3.1%) |
| $7,500 to $9,999 | 20 (1.3%) | 107 (5.9%) |
| $10,000 to $12,499 | 40 (2.5%) | 17 (0.9%) |
| $12,500 to $14,999 | 51 (3.3%) | 70 (3.9%) |
| $15,000 to $17,499 | 34 (2.2%) | 18 (1.0%) |
| $17,500 to $19,999 | 39 (2.5%) | 20 (1.1%) |
| $20,000 to $22,499 | 27 (1.7%) | 43 (2.4%) |
| $22,500 to $24,999 | 26 (1.7%) | 63 (3.5%) |
| $25,000 to $29,999 | 100 (6.4%) | 87 (4.8%) |
| $30,000 to $34,999 | 165 (10.5%) | 183 (10.1%) |
| $35,000 to $39,999 | 121 (7.7%) | 148 (8.2%) |
| $40,000 to $44,999 | 179 (11.4%) | 88 (4.9%) |
| $45,000 to $49,999 | 130 (8.3%) | 150 (8.3%) |
| $50,000 to $54,999 | 43 (2.8%) | 91 (5.0%) |
| $55,000 to $64,999 | 201 (12.8%) | 225 (12.4%) |
| $65,000 to $74,999 | 125 (8.0%) | 68 (3.7%) |
| $75,000 to $99,999 | 107 (6.8%) | 114 (6.3%) |
| $100,000+ | 76 (4.9%) | 39 (2.1%) |
| Total | 1,566 (100.0%) | 1,815 (100.0%) |
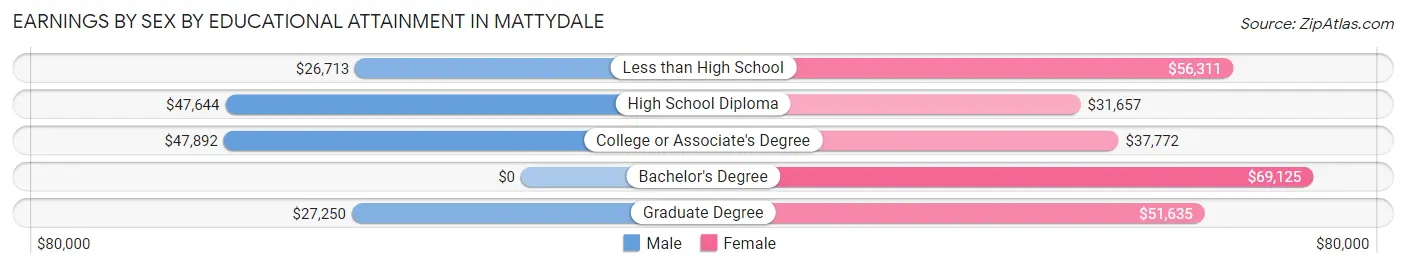
Earnings by Sex by Educational Attainment in Mattydale
Average earnings in Mattydale are $44,563 for men and $40,772 for women, a difference of 8.5%. Men with an educational attainment of college or associate's degree enjoy the highest average annual earnings of $47,892, while those with less than high school education earn the least with $26,713. Women with an educational attainment of bachelor's degree earn the most with the average annual earnings of $69,125, while those with high school diploma education have the smallest earnings of $31,657.
| Educational Attainment | Male Income | Female Income |
| Less than High School | $26,713 | $56,311 |
| High School Diploma | $47,644 | $31,657 |
| College or Associate's Degree | $47,892 | $37,772 |
| Bachelor's Degree | - | - |
| Graduate Degree | $27,250 | $51,635 |
| Total | $44,563 | $40,772 |
Family Income in Mattydale
Family Income Brackets in Mattydale
According to the Mattydale family income data, there are 403 families falling into the $50,000 to $74,999 income range, which is the most common income bracket and makes up 29.2% of all families.
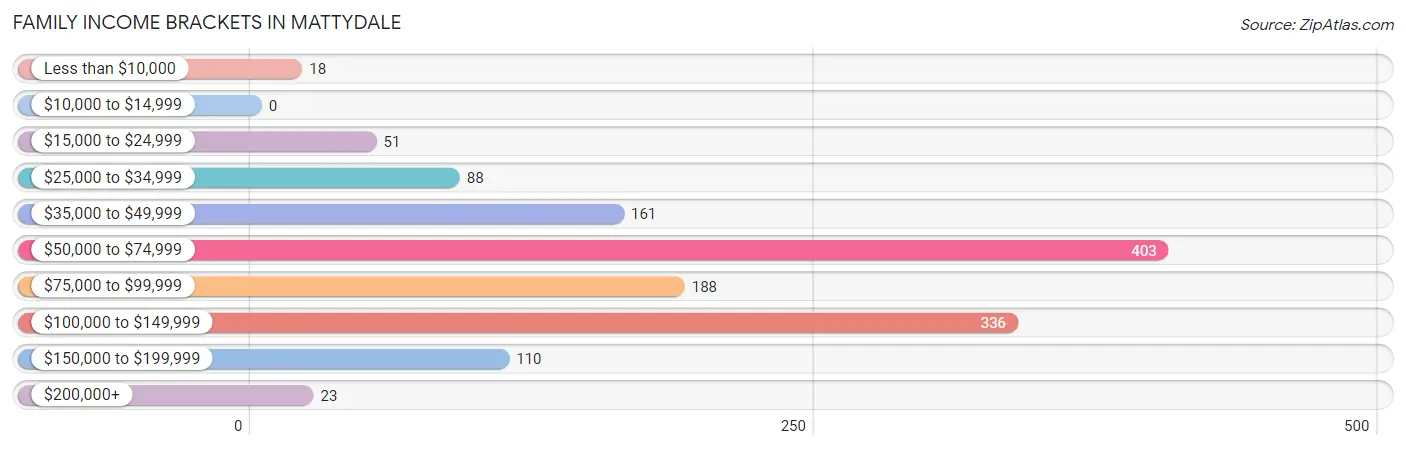
| Income Bracket | # Families | % Families |
| Less than $10,000 | 18 | 1.3% |
| $10,000 to $14,999 | 0 | 0.0% |
| $15,000 to $24,999 | 51 | 3.7% |
| $25,000 to $34,999 | 88 | 6.4% |
| $35,000 to $49,999 | 161 | 11.7% |
| $50,000 to $74,999 | 403 | 29.2% |
| $75,000 to $99,999 | 188 | 13.6% |
| $100,000 to $149,999 | 336 | 24.4% |
| $150,000 to $199,999 | 110 | 8.0% |
| $200,000+ | 23 | 1.7% |
Family Income by Famaliy Size in Mattydale
5-person families (125 | 9.1%) account for the highest median family income in Mattydale with $123,813 per family, while 2-person families (595 | 43.1%) have the highest median income of $34,110 per family member.
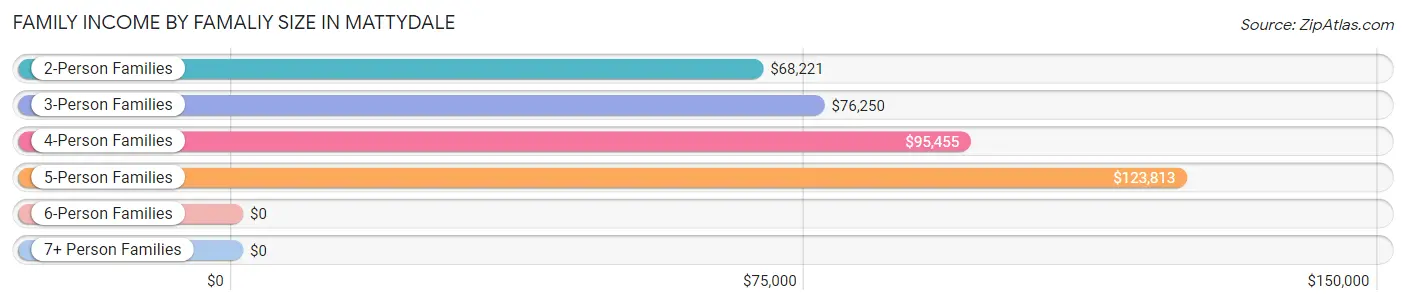
| Income Bracket | # Families | Median Income |
| 2-Person Families | 595 (43.1%) | $68,221 |
| 3-Person Families | 435 (31.5%) | $76,250 |
| 4-Person Families | 198 (14.4%) | $95,455 |
| 5-Person Families | 125 (9.1%) | $123,813 |
| 6-Person Families | 11 (0.8%) | $0 |
| 7+ Person Families | 15 (1.1%) | $0 |
| Total | 1,379 (100.0%) | $73,895 |
Family Income by Number of Earners in Mattydale
The median family income in Mattydale is $73,895, with families comprising 3+ earners (186) having the highest median family income of $143,214, while families with no earners (142) have the lowest median family income of $42,115, accounting for 13.5% and 10.3% of families, respectively.
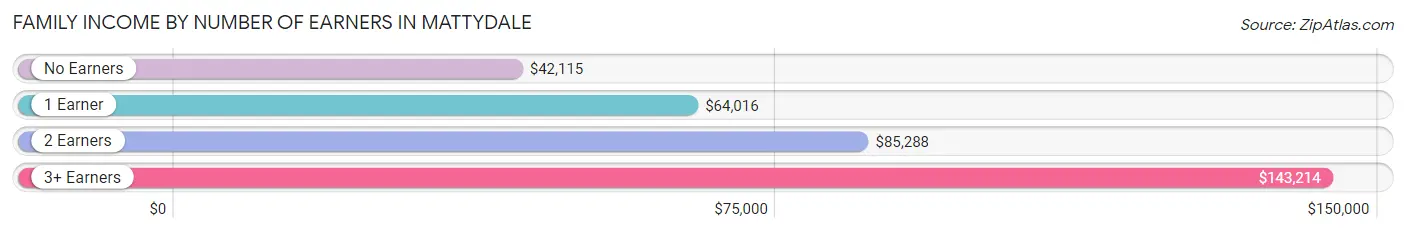
| Number of Earners | # Families | Median Income |
| No Earners | 142 (10.3%) | $42,115 |
| 1 Earner | 311 (22.6%) | $64,016 |
| 2 Earners | 740 (53.7%) | $85,288 |
| 3+ Earners | 186 (13.5%) | $143,214 |
| Total | 1,379 (100.0%) | $73,895 |
Household Income in Mattydale
Household Income Brackets in Mattydale
With 557 households falling in the category, the $50,000 to $74,999 income range is the most frequent in Mattydale, accounting for 23.7% of all households. In contrast, only 9 households (0.4%) fall into the $10,000 to $14,999 income bracket, making it the least populous group.
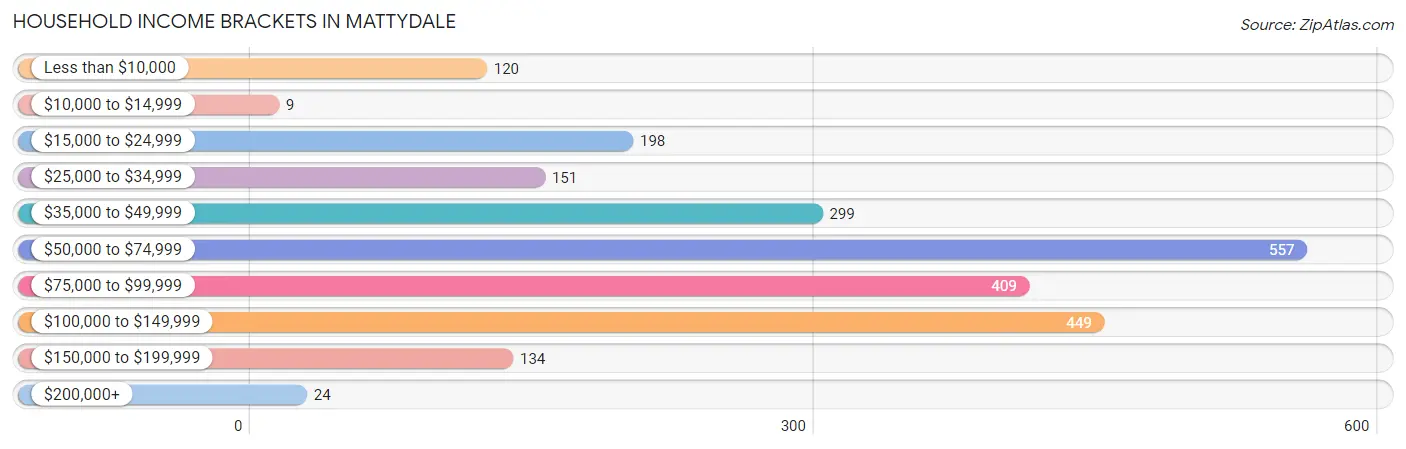
| Income Bracket | # Households | % Households |
| Less than $10,000 | 120 | 5.1% |
| $10,000 to $14,999 | 9 | 0.4% |
| $15,000 to $24,999 | 198 | 8.4% |
| $25,000 to $34,999 | 151 | 6.4% |
| $35,000 to $49,999 | 299 | 12.7% |
| $50,000 to $74,999 | 557 | 23.7% |
| $75,000 to $99,999 | 409 | 17.4% |
| $100,000 to $149,999 | 449 | 19.1% |
| $150,000 to $199,999 | 134 | 5.7% |
| $200,000+ | 24 | 1.0% |
Household Income by Householder Age in Mattydale
The median household income in Mattydale is $69,824, with the highest median household income of $79,459 found in the 25 to 44 years age bracket for the primary householder. A total of 832 households (35.4%) fall into this category. Meanwhile, the 65+ years age bracket for the primary householder has the lowest median household income of $40,647, with 573 households (24.4%) in this group.
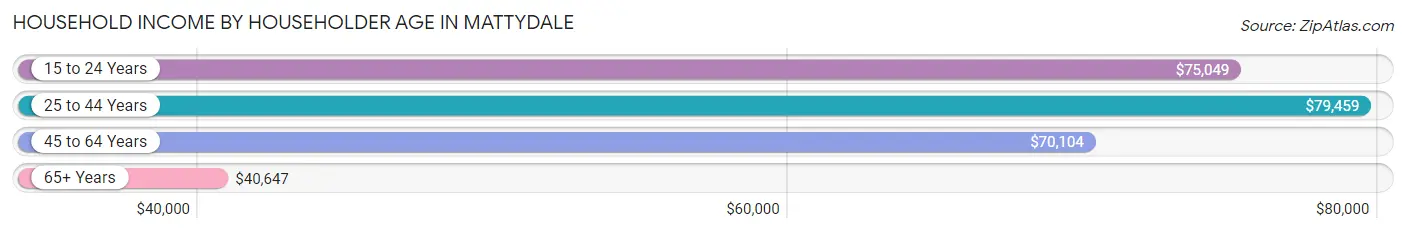
| Income Bracket | # Households | Median Income |
| 15 to 24 Years | 100 (4.3%) | $75,049 |
| 25 to 44 Years | 832 (35.4%) | $79,459 |
| 45 to 64 Years | 847 (36.0%) | $70,104 |
| 65+ Years | 573 (24.4%) | $40,647 |
| Total | 2,352 (100.0%) | $69,824 |
Poverty in Mattydale
Income Below Poverty by Sex and Age in Mattydale
With 11.3% poverty level for males and 7.6% for females among the residents of Mattydale, 18 to 24 year old males and 12 to 14 year old females are the most vulnerable to poverty, with 50 males (24.5%) and 41 females (38.7%) in their respective age groups living below the poverty level.
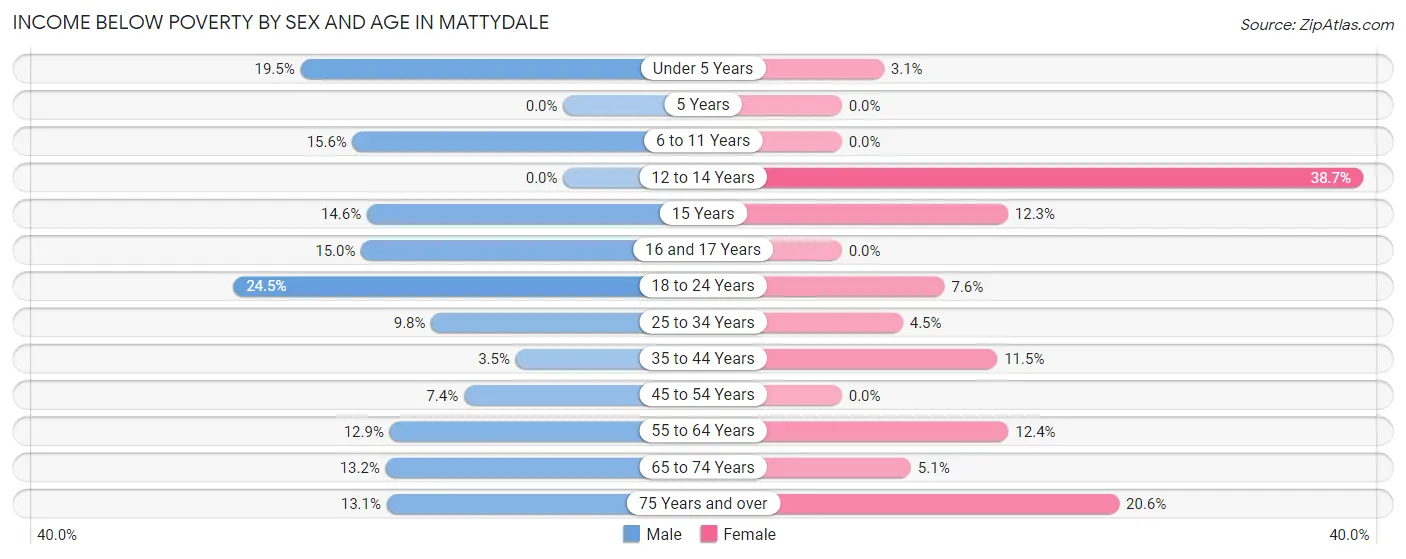
| Age Bracket | Male | Female |
| Under 5 Years | 16 (19.5%) | 7 (3.1%) |
| 5 Years | 0 (0.0%) | 0 (0.0%) |
| 6 to 11 Years | 38 (15.6%) | 0 (0.0%) |
| 12 to 14 Years | 0 (0.0%) | 41 (38.7%) |
| 15 Years | 7 (14.6%) | 9 (12.3%) |
| 16 and 17 Years | 6 (15.0%) | 0 (0.0%) |
| 18 to 24 Years | 50 (24.5%) | 37 (7.6%) |
| 25 to 34 Years | 44 (9.8%) | 17 (4.5%) |
| 35 to 44 Years | 16 (3.5%) | 30 (11.5%) |
| 45 to 54 Years | 16 (7.4%) | 0 (0.0%) |
| 55 to 64 Years | 50 (12.9%) | 46 (12.4%) |
| 65 to 74 Years | 31 (13.2%) | 16 (5.1%) |
| 75 Years and over | 16 (13.1%) | 42 (20.6%) |
| Total | 290 (11.3%) | 245 (7.6%) |
Income Above Poverty by Sex and Age in Mattydale
According to the poverty statistics in Mattydale, males aged 5 years and females aged 5 years are the age groups that are most secure financially, with 100.0% of males and 100.0% of females in these age groups living above the poverty line.
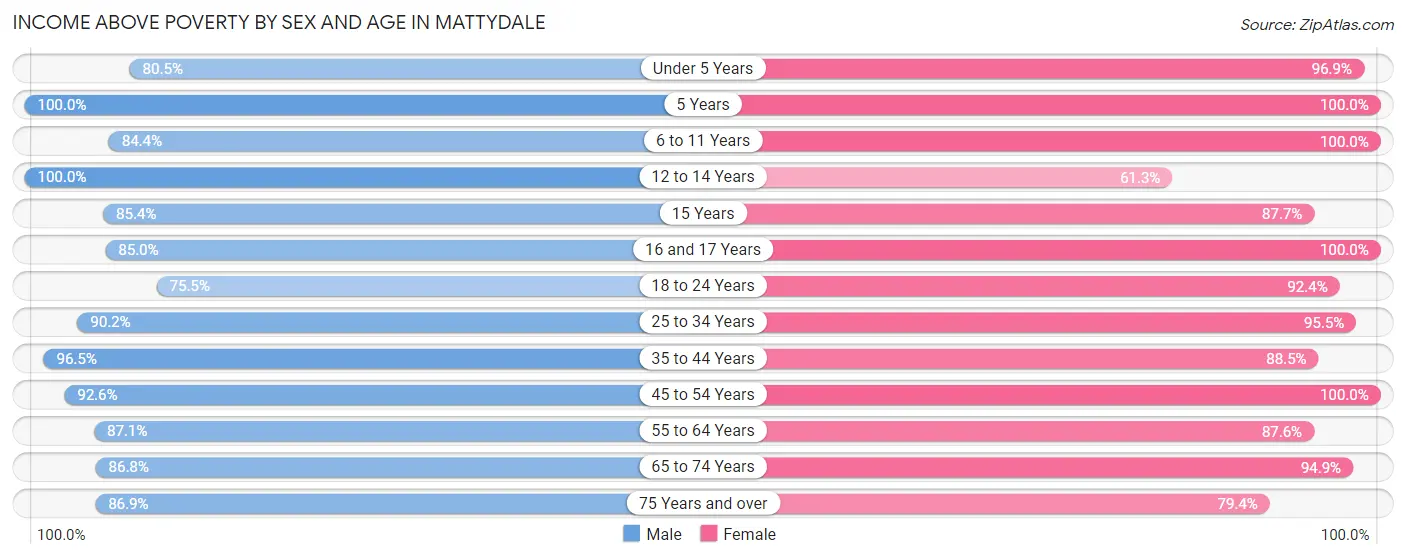
| Age Bracket | Male | Female |
| Under 5 Years | 66 (80.5%) | 217 (96.9%) |
| 5 Years | 45 (100.0%) | 16 (100.0%) |
| 6 to 11 Years | 205 (84.4%) | 295 (100.0%) |
| 12 to 14 Years | 49 (100.0%) | 65 (61.3%) |
| 15 Years | 41 (85.4%) | 64 (87.7%) |
| 16 and 17 Years | 34 (85.0%) | 20 (100.0%) |
| 18 to 24 Years | 154 (75.5%) | 448 (92.4%) |
| 25 to 34 Years | 405 (90.2%) | 358 (95.5%) |
| 35 to 44 Years | 437 (96.5%) | 230 (88.5%) |
| 45 to 54 Years | 201 (92.6%) | 495 (100.0%) |
| 55 to 64 Years | 338 (87.1%) | 326 (87.6%) |
| 65 to 74 Years | 204 (86.8%) | 296 (94.9%) |
| 75 Years and over | 106 (86.9%) | 162 (79.4%) |
| Total | 2,285 (88.7%) | 2,992 (92.4%) |
Income Below Poverty Among Married-Couple Families in Mattydale
The poverty statistics for married-couple families in Mattydale show that 1.7% or 16 of the total 935 families live below the poverty line. Families with 1 or 2 children have the highest poverty rate of 2.4%, comprising of 7 families. On the other hand, families with 3 or 4 children have the lowest poverty rate of 0.0%, which includes 0 families.
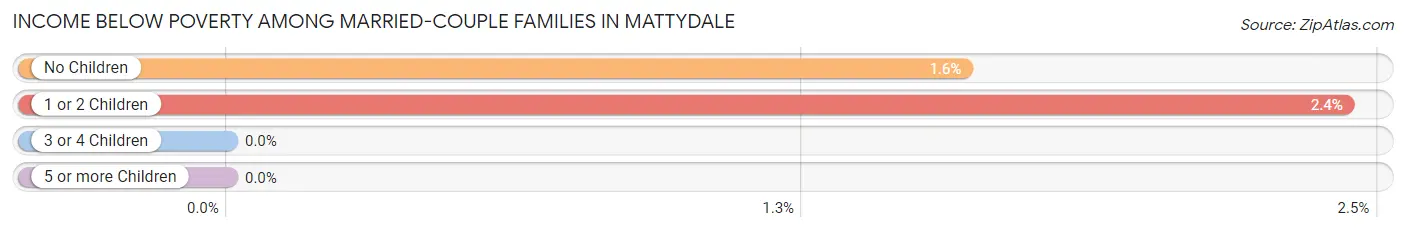
| Children | Above Poverty | Below Poverty |
| No Children | 553 (98.4%) | 9 (1.6%) |
| 1 or 2 Children | 281 (97.6%) | 7 (2.4%) |
| 3 or 4 Children | 70 (100.0%) | 0 (0.0%) |
| 5 or more Children | 15 (100.0%) | 0 (0.0%) |
| Total | 919 (98.3%) | 16 (1.7%) |
Income Below Poverty Among Single-Parent Households in Mattydale
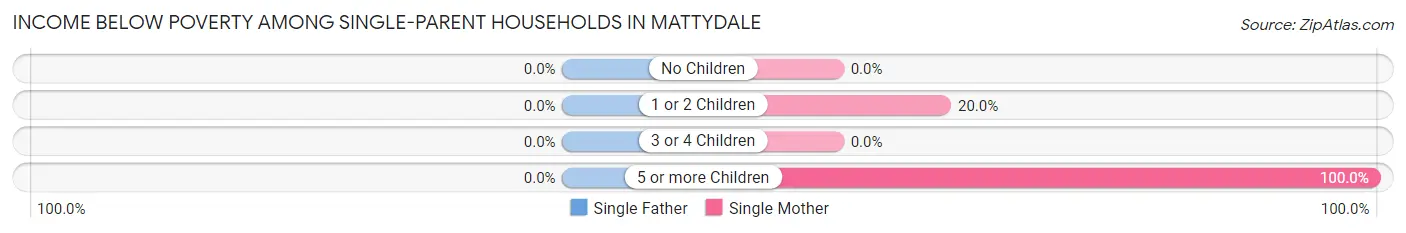
| Children | Single Father | Single Mother |
| No Children | 0 (0.0%) | 0 (0.0%) |
| 1 or 2 Children | 0 (0.0%) | 34 (20.0%) |
| 3 or 4 Children | 0 (0.0%) | 0 (0.0%) |
| 5 or more Children | 0 (0.0%) | 7 (100.0%) |
| Total | 0 (0.0%) | 41 (13.1%) |
Income Below Poverty Among Married-Couple vs Single-Parent Households in Mattydale
The poverty data for Mattydale shows that 16 of the married-couple family households (1.7%) and 41 of the single-parent households (9.2%) are living below the poverty level. Within the married-couple family households, those with 1 or 2 children have the highest poverty rate, with 7 households (2.4%) falling below the poverty line. Among the single-parent households, those with 5 or more children have the highest poverty rate, with 7 household (100.0%) living below poverty.
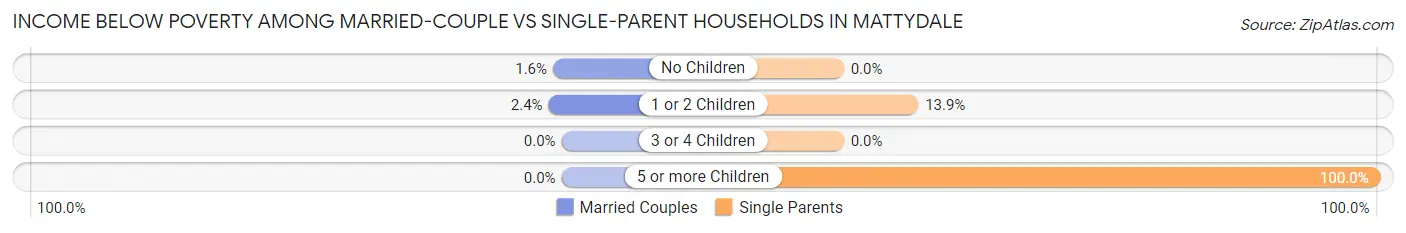
| Children | Married-Couple Families | Single-Parent Households |
| No Children | 9 (1.6%) | 0 (0.0%) |
| 1 or 2 Children | 7 (2.4%) | 34 (13.9%) |
| 3 or 4 Children | 0 (0.0%) | 0 (0.0%) |
| 5 or more Children | 0 (0.0%) | 7 (100.0%) |
| Total | 16 (1.7%) | 41 (9.2%) |
Race in Mattydale
The most populous races in Mattydale are White / Caucasian (4,605 | 79.1%), Two or more Races (457 | 7.9%), and Asian (403 | 6.9%).
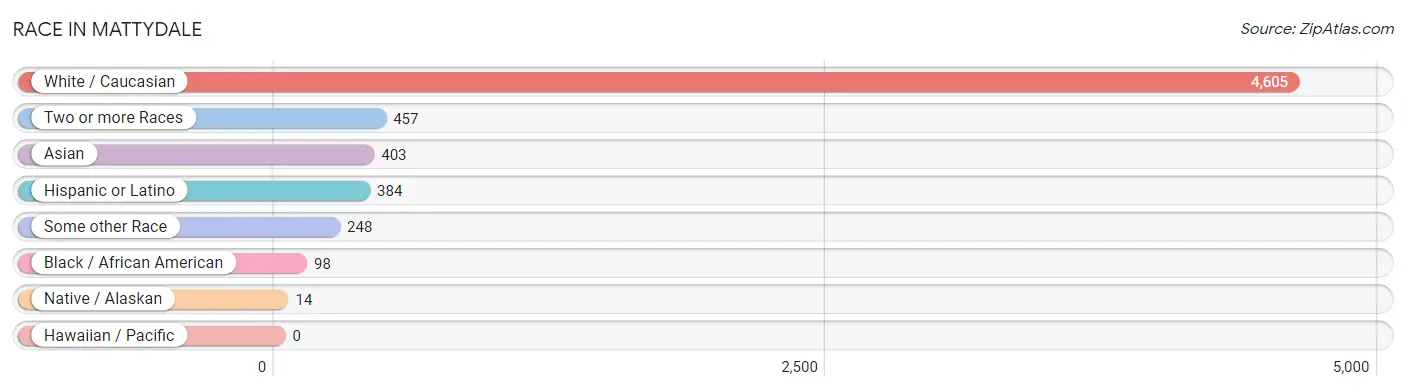
| Race | # Population | % Population |
| Asian | 403 | 6.9% |
| Black / African American | 98 | 1.7% |
| Hawaiian / Pacific | 0 | 0.0% |
| Hispanic or Latino | 384 | 6.6% |
| Native / Alaskan | 14 | 0.2% |
| White / Caucasian | 4,605 | 79.1% |
| Two or more Races | 457 | 7.9% |
| Some other Race | 248 | 4.3% |
| Total | 5,825 | 100.0% |
Ancestry in Mattydale
The most populous ancestries reported in Mattydale are Italian (1,087 | 18.7%), Irish (1,075 | 18.4%), German (1,043 | 17.9%), English (521 | 8.9%), and Polish (423 | 7.3%), together accounting for 71.2% of all Mattydale residents.
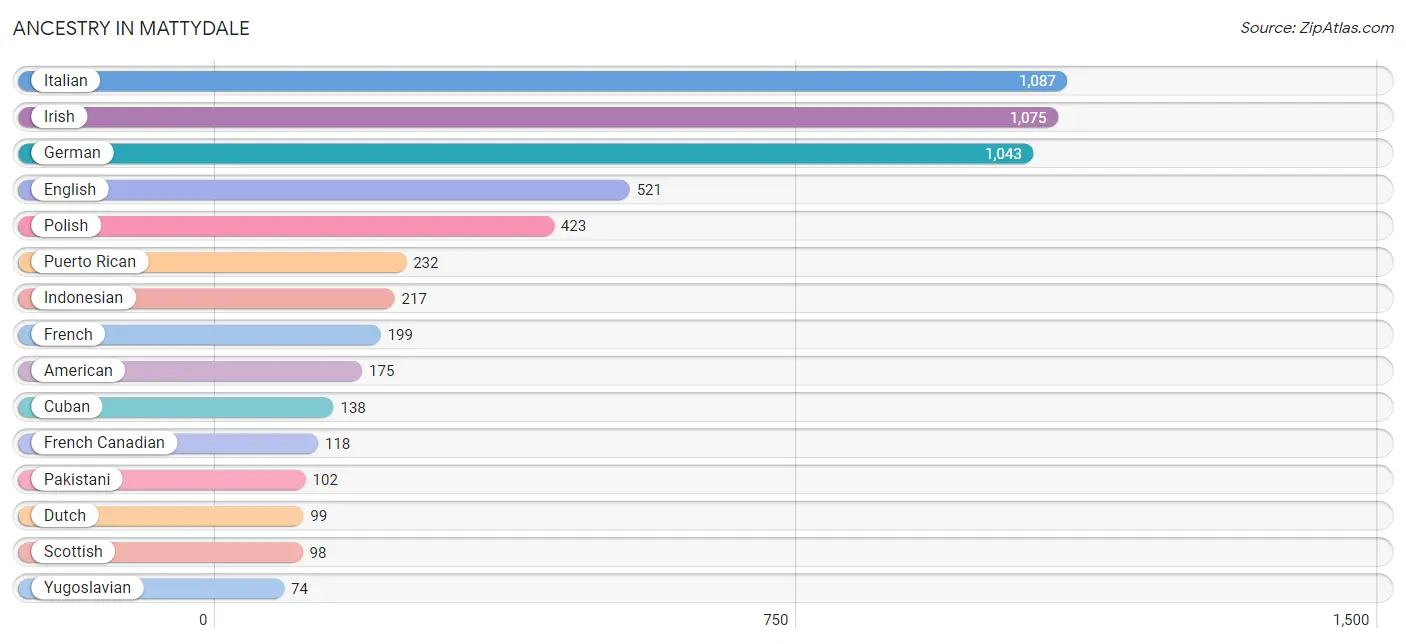
| Ancestry | # Population | % Population |
| American | 175 | 3.0% |
| Apache | 15 | 0.3% |
| Austrian | 68 | 1.2% |
| Blackfeet | 12 | 0.2% |
| British | 23 | 0.4% |
| Central American Indian | 9 | 0.2% |
| Cherokee | 12 | 0.2% |
| Cuban | 138 | 2.4% |
| Dutch | 99 | 1.7% |
| English | 521 | 8.9% |
| European | 7 | 0.1% |
| French | 199 | 3.4% |
| French American Indian | 14 | 0.2% |
| French Canadian | 118 | 2.0% |
| German | 1,043 | 17.9% |
| Hungarian | 53 | 0.9% |
| Indonesian | 217 | 3.7% |
| Irish | 1,075 | 18.4% |
| Italian | 1,087 | 18.7% |
| Jamaican | 35 | 0.6% |
| Lithuanian | 11 | 0.2% |
| Mexican | 1 | 0.0% |
| Native Hawaiian | 9 | 0.2% |
| Norwegian | 4 | 0.1% |
| Pakistani | 102 | 1.8% |
| Polish | 423 | 7.3% |
| Puerto Rican | 232 | 4.0% |
| Russian | 30 | 0.5% |
| Samoan | 30 | 0.5% |
| Scottish | 98 | 1.7% |
| Slovak | 11 | 0.2% |
| Spanish | 13 | 0.2% |
| Sri Lankan | 41 | 0.7% |
| Swedish | 34 | 0.6% |
| Thai | 60 | 1.0% |
| Ukrainian | 19 | 0.3% |
| Welsh | 38 | 0.6% |
| Yugoslavian | 74 | 1.3% | View All 38 Rows |
Immigrants in Mattydale
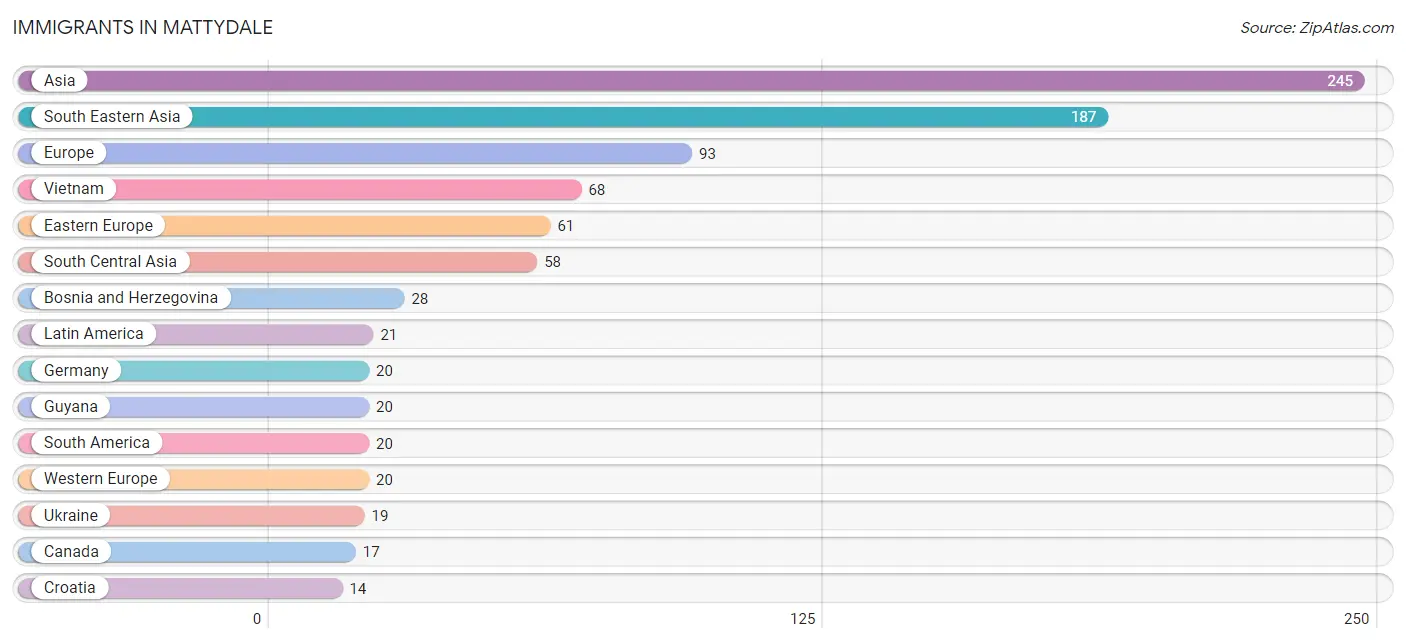
The most numerous immigrant groups reported in Mattydale came from Asia (245 | 4.2%), South Eastern Asia (187 | 3.2%), Europe (93 | 1.6%), Vietnam (68 | 1.2%), and Eastern Europe (61 | 1.1%), together accounting for 11.2% of all Mattydale residents.
| Immigration Origin | # Population | % Population |
| Asia | 245 | 4.2% |
| Bosnia and Herzegovina | 28 | 0.5% |
| Canada | 17 | 0.3% |
| Central America | 1 | 0.0% |
| Croatia | 14 | 0.2% |
| Eastern Europe | 61 | 1.1% |
| Europe | 93 | 1.6% |
| Germany | 20 | 0.3% |
| Guyana | 20 | 0.3% |
| Italy | 12 | 0.2% |
| Latin America | 21 | 0.4% |
| Mexico | 1 | 0.0% |
| South America | 20 | 0.3% |
| South Central Asia | 58 | 1.0% |
| South Eastern Asia | 187 | 3.2% |
| Southern Europe | 12 | 0.2% |
| Ukraine | 19 | 0.3% |
| Vietnam | 68 | 1.2% |
| Western Europe | 20 | 0.3% | View All 19 Rows |
Sex and Age in Mattydale
Sex and Age in Mattydale
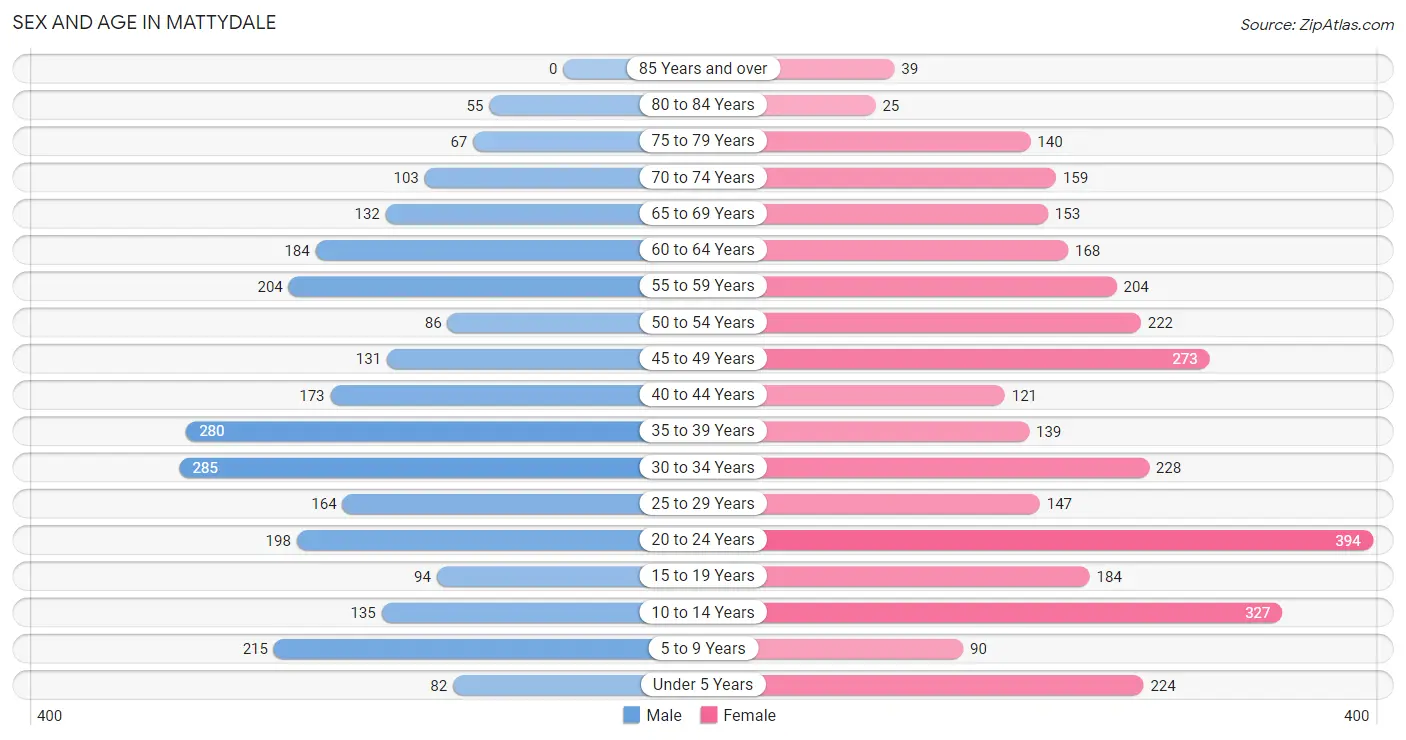
The most populous age groups in Mattydale are 30 to 34 Years (285 | 11.0%) for men and 20 to 24 Years (394 | 12.2%) for women.
| Age Bracket | Male | Female |
| Under 5 Years | 82 (3.2%) | 224 (6.9%) |
| 5 to 9 Years | 215 (8.3%) | 90 (2.8%) |
| 10 to 14 Years | 135 (5.2%) | 327 (10.1%) |
| 15 to 19 Years | 94 (3.6%) | 184 (5.7%) |
| 20 to 24 Years | 198 (7.6%) | 394 (12.2%) |
| 25 to 29 Years | 164 (6.3%) | 147 (4.5%) |
| 30 to 34 Years | 285 (11.0%) | 228 (7.0%) |
| 35 to 39 Years | 280 (10.8%) | 139 (4.3%) |
| 40 to 44 Years | 173 (6.7%) | 121 (3.7%) |
| 45 to 49 Years | 131 (5.1%) | 273 (8.4%) |
| 50 to 54 Years | 86 (3.3%) | 222 (6.9%) |
| 55 to 59 Years | 204 (7.9%) | 204 (6.3%) |
| 60 to 64 Years | 184 (7.1%) | 168 (5.2%) |
| 65 to 69 Years | 132 (5.1%) | 153 (4.7%) |
| 70 to 74 Years | 103 (4.0%) | 159 (4.9%) |
| 75 to 79 Years | 67 (2.6%) | 140 (4.3%) |
| 80 to 84 Years | 55 (2.1%) | 25 (0.8%) |
| 85 Years and over | 0 (0.0%) | 39 (1.2%) |
| Total | 2,588 (100.0%) | 3,237 (100.0%) |
Families and Households in Mattydale
Median Family Size in Mattydale
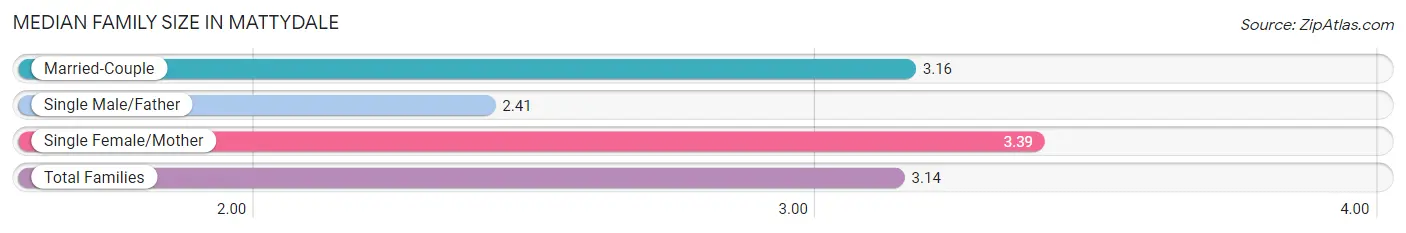
The median family size in Mattydale is 3.14 persons per family, with single female/mother families (313 | 22.7%) accounting for the largest median family size of 3.39 persons per family. On the other hand, single male/father families (131 | 9.5%) represent the smallest median family size with 2.41 persons per family.
| Family Type | # Families | Family Size |
| Married-Couple | 935 (67.8%) | 3.16 |
| Single Male/Father | 131 (9.5%) | 2.41 |
| Single Female/Mother | 313 (22.7%) | 3.39 |
| Total Families | 1,379 (100.0%) | 3.14 |
Median Household Size in Mattydale
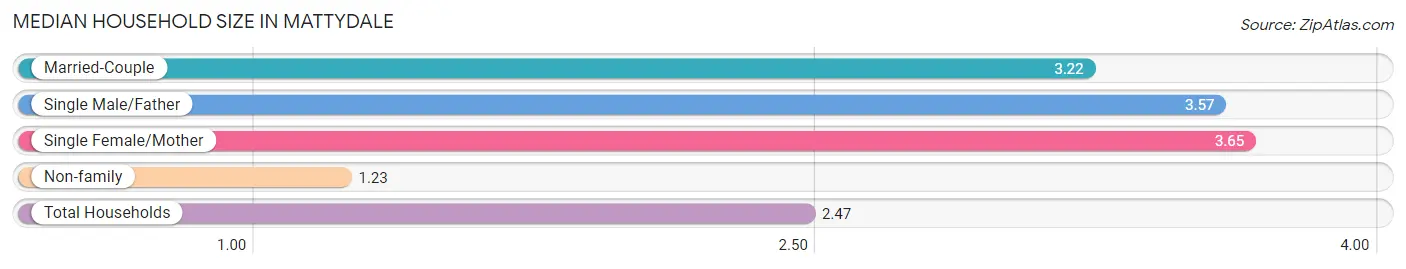
The median household size in Mattydale is 2.47 persons per household, with single female/mother households (313 | 13.3%) accounting for the largest median household size of 3.65 persons per household. non-family households (973 | 41.4%) represent the smallest median household size with 1.23 persons per household.
| Household Type | # Households | Household Size |
| Married-Couple | 935 (39.8%) | 3.22 |
| Single Male/Father | 131 (5.6%) | 3.57 |
| Single Female/Mother | 313 (13.3%) | 3.65 |
| Non-family | 973 (41.4%) | 1.23 |
| Total Households | 2,352 (100.0%) | 2.47 |
Household Size by Marriage Status in Mattydale
Out of a total of 2,352 households in Mattydale, 1,379 (58.6%) are family households, while 973 (41.4%) are nonfamily households. The most numerous type of family households are 2-person households, comprising 525, and the most common type of nonfamily households are 1-person households, comprising 781.
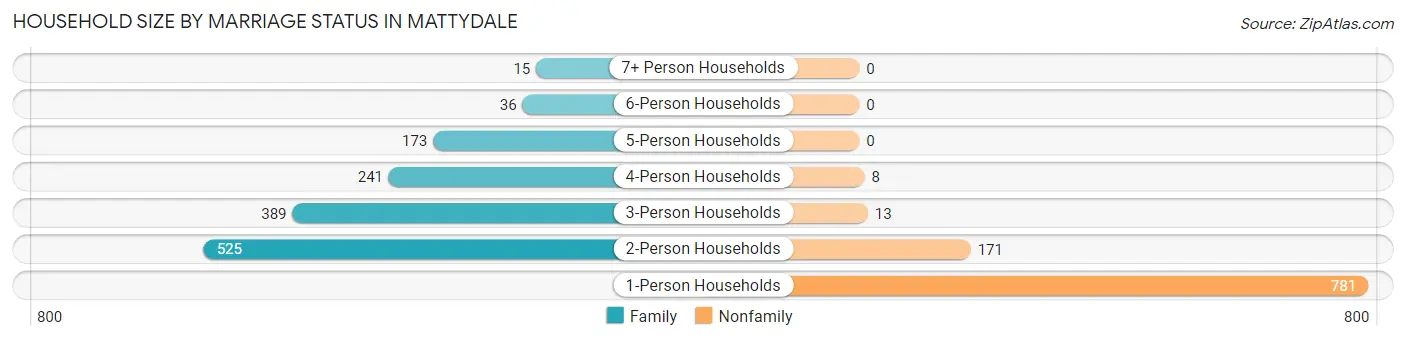
| Household Size | Family Households | Nonfamily Households |
| 1-Person Households | - | 781 (33.2%) |
| 2-Person Households | 525 (22.3%) | 171 (7.3%) |
| 3-Person Households | 389 (16.5%) | 13 (0.5%) |
| 4-Person Households | 241 (10.2%) | 8 (0.3%) |
| 5-Person Households | 173 (7.4%) | 0 (0.0%) |
| 6-Person Households | 36 (1.5%) | 0 (0.0%) |
| 7+ Person Households | 15 (0.6%) | 0 (0.0%) |
| Total | 1,379 (58.6%) | 973 (41.4%) |
Female Fertility in Mattydale
Fertility by Age in Mattydale
Average fertility rate in Mattydale is 38.0 births per 1,000 women. Women in the age bracket of 35 to 50 years have the highest fertility rate with 86.0 births per 1,000 women. Women in the age bracket of 35 to 50 years acount for 82.8% of all women with births.
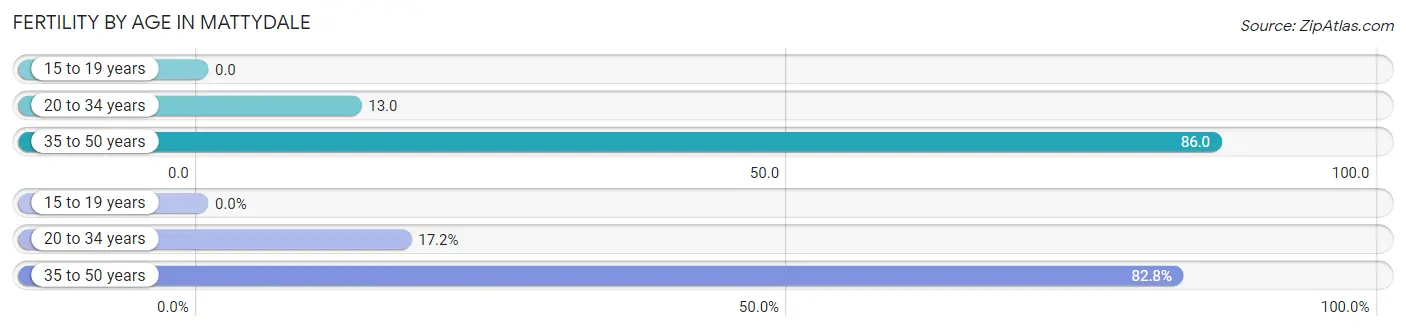
| Age Bracket | Women with Births | Births / 1,000 Women |
| 15 to 19 years | 0 (0.0%) | 0.0 |
| 20 to 34 years | 10 (17.2%) | 13.0 |
| 35 to 50 years | 48 (82.8%) | 86.0 |
| Total | 58 (100.0%) | 38.0 |
Fertility by Age by Marriage Status in Mattydale
29.3% of women with births (58) in Mattydale are married. The highest percentage of unmarried women with births falls into 35 to 50 years age bracket with 85.4% of them unmarried at the time of birth, while the lowest percentage of unmarried women with births belong to 20 to 34 years age bracket with 0.0% of them unmarried.
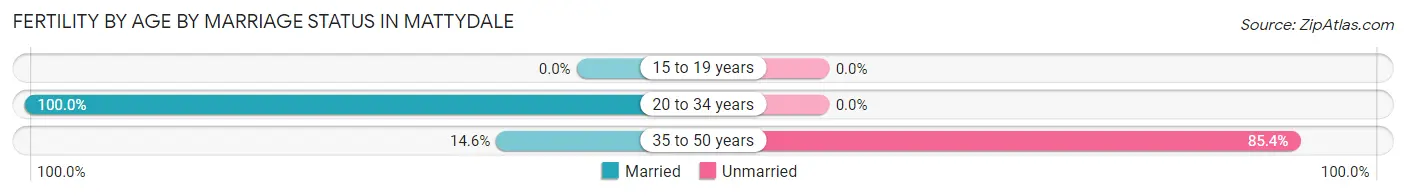
| Age Bracket | Married | Unmarried |
| 15 to 19 years | 0 (0.0%) | 0 (0.0%) |
| 20 to 34 years | 10 (100.0%) | 0 (0.0%) |
| 35 to 50 years | 7 (14.6%) | 41 (85.4%) |
| Total | 17 (29.3%) | 41 (70.7%) |
Fertility by Education in Mattydale
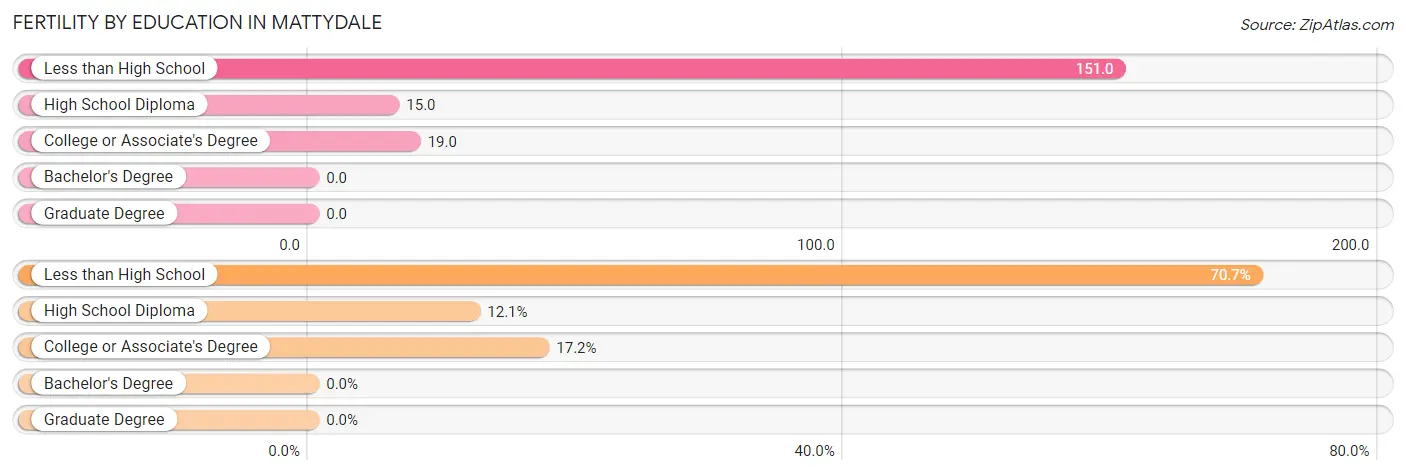
| Educational Attainment | Women with Births | Births / 1,000 Women |
| Less than High School | 41 (70.7%) | 151.0 |
| High School Diploma | 7 (12.1%) | 15.0 |
| College or Associate's Degree | 10 (17.2%) | 19.0 |
| Bachelor's Degree | 0 (0.0%) | 0.0 |
| Graduate Degree | 0 (0.0%) | 0.0 |
| Total | 58 (100.0%) | 38.0 |
Fertility by Education by Marriage Status in Mattydale
70.7% of women with births in Mattydale are unmarried. Women with the educational attainment of high school diploma are most likely to be married with 100.0% of them married at childbirth, while women with the educational attainment of less than high school are least likely to be married with 100.0% of them unmarried at childbirth.
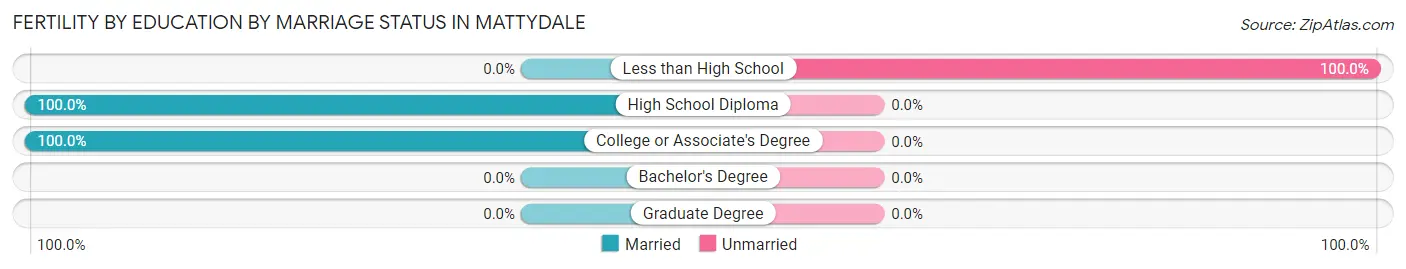
| Educational Attainment | Married | Unmarried |
| Less than High School | 0 (0.0%) | 41 (100.0%) |
| High School Diploma | 7 (100.0%) | 0 (0.0%) |
| College or Associate's Degree | 10 (100.0%) | 0 (0.0%) |
| Bachelor's Degree | 0 (0.0%) | 0 (0.0%) |
| Graduate Degree | 0 (0.0%) | 0 (0.0%) |
| Total | 17 (29.3%) | 41 (70.7%) |
Employment Characteristics in Mattydale
Employment by Class of Employer in Mattydale
Among the 3,145 employed individuals in Mattydale, private company employees (2,396 | 76.2%), not-for-profit organizations (309 | 9.8%), and federal government employees (184 | 5.9%) make up the most common classes of employment.
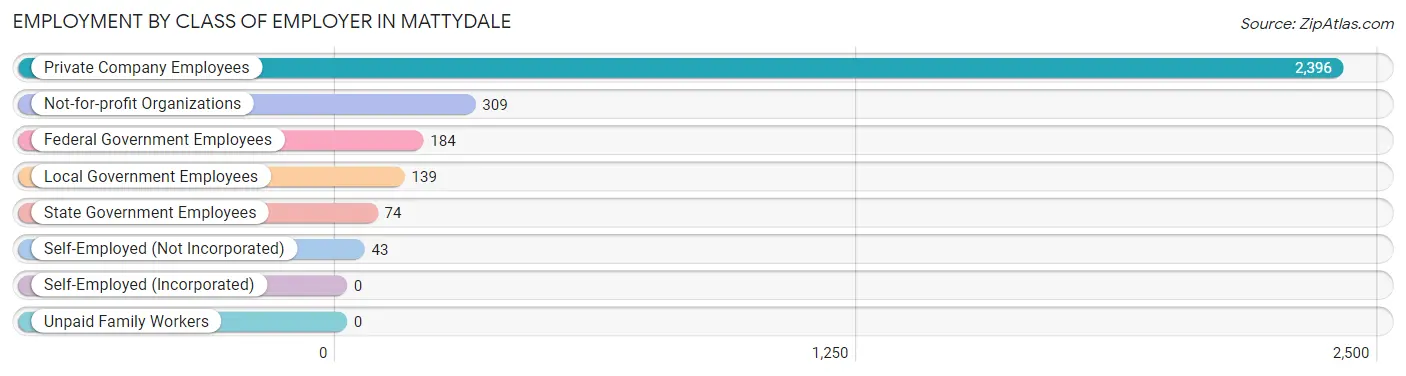
| Employer Class | # Employees | % Employees |
| Private Company Employees | 2,396 | 76.2% |
| Self-Employed (Incorporated) | 0 | 0.0% |
| Self-Employed (Not Incorporated) | 43 | 1.4% |
| Not-for-profit Organizations | 309 | 9.8% |
| Local Government Employees | 139 | 4.4% |
| State Government Employees | 74 | 2.4% |
| Federal Government Employees | 184 | 5.9% |
| Unpaid Family Workers | 0 | 0.0% |
| Total | 3,145 | 100.0% |
Employment Status by Age in Mattydale
According to the labor force statistics for Mattydale, out of the total population over 16 years of age (4,631), 72.3% or 3,348 individuals are in the labor force, with 5.8% or 194 of them unemployed. The age group with the highest labor force participation rate is 30 to 34 years, with 98.2% or 504 individuals in the labor force. Within the labor force, the 25 to 29 years age range has the highest percentage of unemployed individuals, with 23.6% or 68 of them being unemployed.
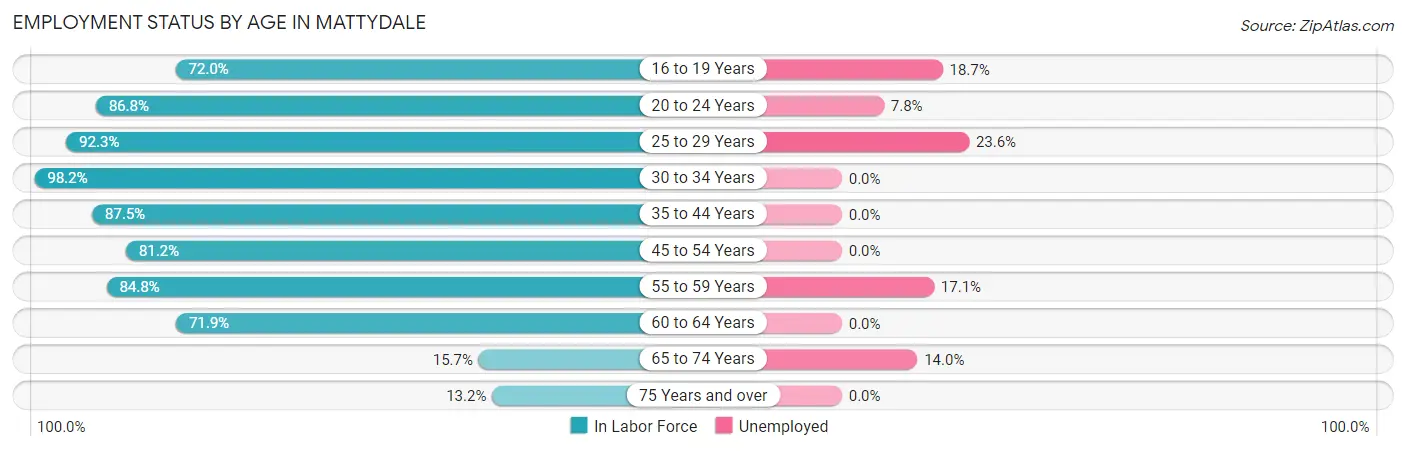
| Age Bracket | In Labor Force | Unemployed |
| 16 to 19 Years | 113 (72.0%) | 21 (18.7%) |
| 20 to 24 Years | 514 (86.8%) | 40 (7.8%) |
| 25 to 29 Years | 287 (92.3%) | 68 (23.6%) |
| 30 to 34 Years | 504 (98.2%) | 0 (0.0%) |
| 35 to 44 Years | 624 (87.5%) | 0 (0.0%) |
| 45 to 54 Years | 578 (81.2%) | 0 (0.0%) |
| 55 to 59 Years | 346 (84.8%) | 59 (17.1%) |
| 60 to 64 Years | 253 (71.9%) | 0 (0.0%) |
| 65 to 74 Years | 86 (15.7%) | 12 (14.0%) |
| 75 Years and over | 43 (13.2%) | 0 (0.0%) |
| Total | 3,348 (72.3%) | 194 (5.8%) |
Employment Status by Educational Attainment in Mattydale
According to labor force statistics for Mattydale, 86.1% of individuals (2,591) out of the total population between 25 and 64 years of age (3,009) are in the labor force, with 4.7% or 122 of them being unemployed. The group with the highest labor force participation rate are those with the educational attainment of bachelor's degree or higher, with 90.8% or 476 individuals in the labor force. Within the labor force, individuals with college / associate degree education have the highest percentage of unemployment, with 6.2% or 53 of them being unemployed.
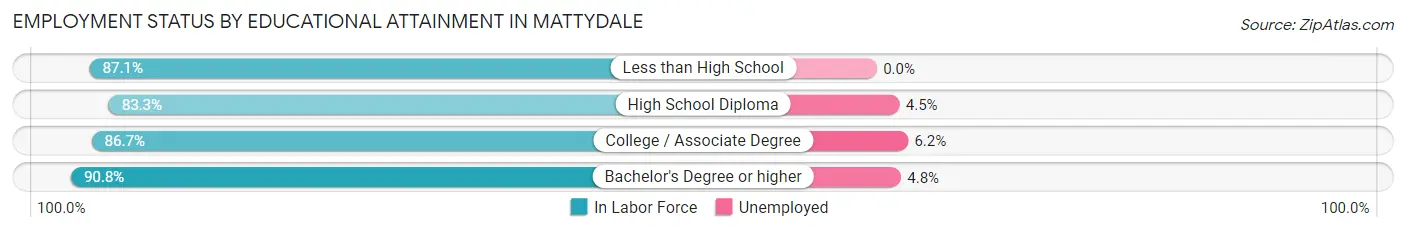
| Educational Attainment | In Labor Force | Unemployed |
| Less than High School | 263 (87.1%) | 0 (0.0%) |
| High School Diploma | 995 (83.3%) | 54 (4.5%) |
| College / Associate Degree | 857 (86.7%) | 61 (6.2%) |
| Bachelor's Degree or higher | 476 (90.8%) | 25 (4.8%) |
| Total | 2,591 (86.1%) | 141 (4.7%) |
Employment Occupations by Sex in Mattydale
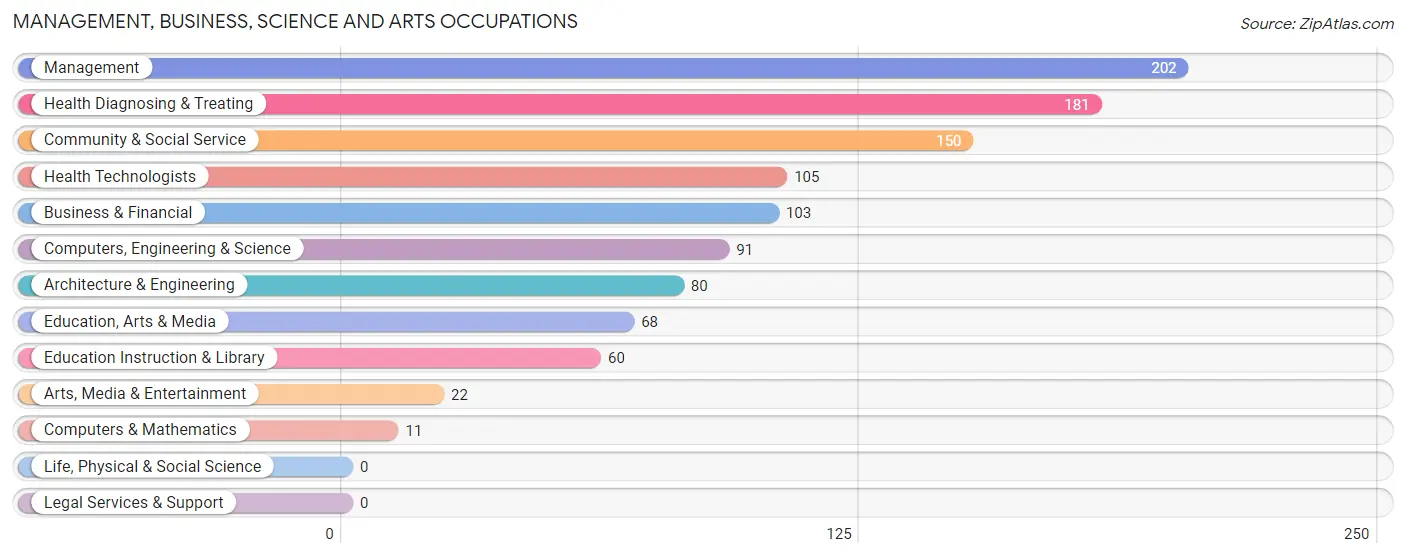
Management, Business, Science and Arts Occupations
The most common Management, Business, Science and Arts occupations in Mattydale are Management (202 | 6.5%), Health Diagnosing & Treating (181 | 5.8%), Community & Social Service (150 | 4.8%), Health Technologists (105 | 3.4%), and Business & Financial (103 | 3.3%).
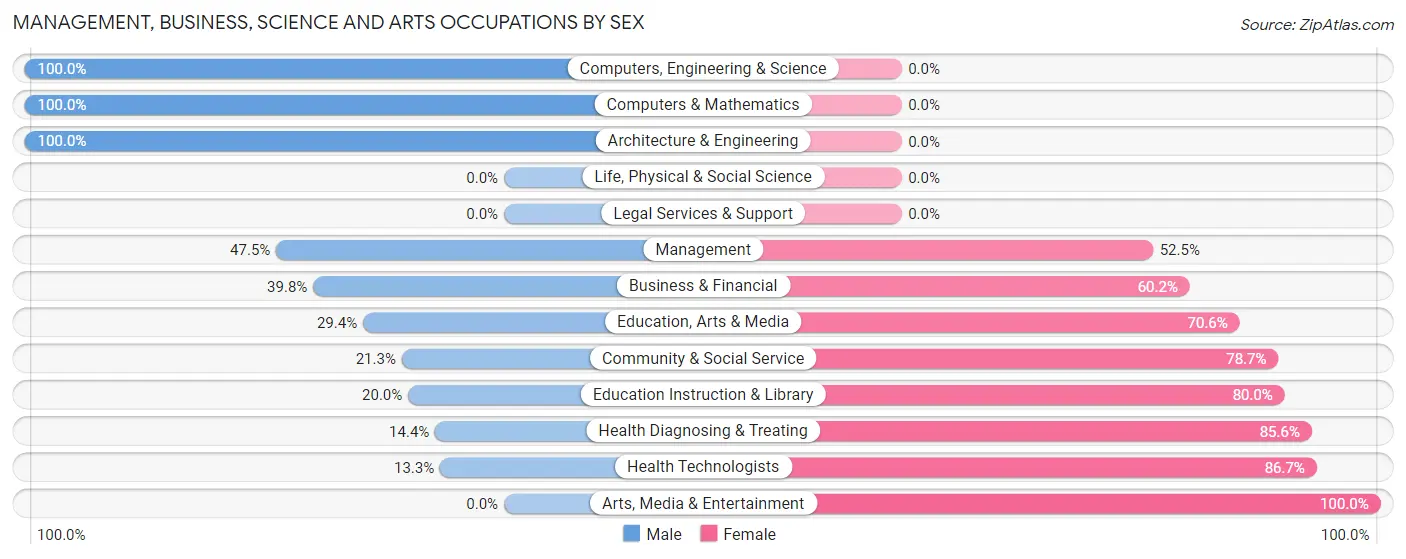
Management, Business, Science and Arts Occupations by Sex
Within the Management, Business, Science and Arts occupations in Mattydale, the most male-oriented occupations are Computers, Engineering & Science (100.0%), Computers & Mathematics (100.0%), and Architecture & Engineering (100.0%), while the most female-oriented occupations are Arts, Media & Entertainment (100.0%), Health Technologists (86.7%), and Health Diagnosing & Treating (85.6%).
| Occupation | Male | Female |
| Management | 96 (47.5%) | 106 (52.5%) |
| Business & Financial | 41 (39.8%) | 62 (60.2%) |
| Computers, Engineering & Science | 91 (100.0%) | 0 (0.0%) |
| Computers & Mathematics | 11 (100.0%) | 0 (0.0%) |
| Architecture & Engineering | 80 (100.0%) | 0 (0.0%) |
| Life, Physical & Social Science | 0 (0.0%) | 0 (0.0%) |
| Community & Social Service | 32 (21.3%) | 118 (78.7%) |
| Education, Arts & Media | 20 (29.4%) | 48 (70.6%) |
| Legal Services & Support | 0 (0.0%) | 0 (0.0%) |
| Education Instruction & Library | 12 (20.0%) | 48 (80.0%) |
| Arts, Media & Entertainment | 0 (0.0%) | 22 (100.0%) |
| Health Diagnosing & Treating | 26 (14.4%) | 155 (85.6%) |
| Health Technologists | 14 (13.3%) | 91 (86.7%) |
| Total (Category) | 286 (39.3%) | 441 (60.7%) |
| Total (Overall) | 1,487 (47.7%) | 1,631 (52.3%) |
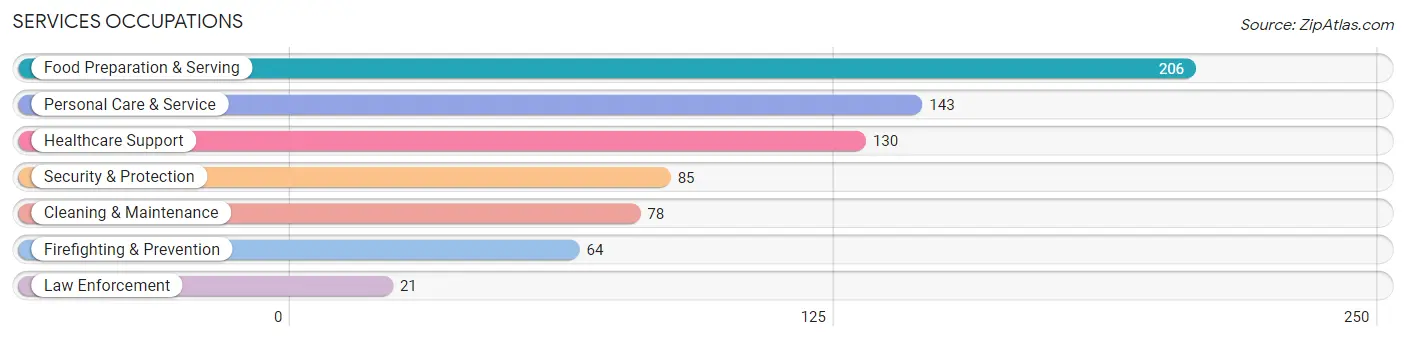
Services Occupations
The most common Services occupations in Mattydale are Food Preparation & Serving (206 | 6.6%), Personal Care & Service (143 | 4.6%), Healthcare Support (130 | 4.2%), Security & Protection (85 | 2.7%), and Cleaning & Maintenance (78 | 2.5%).
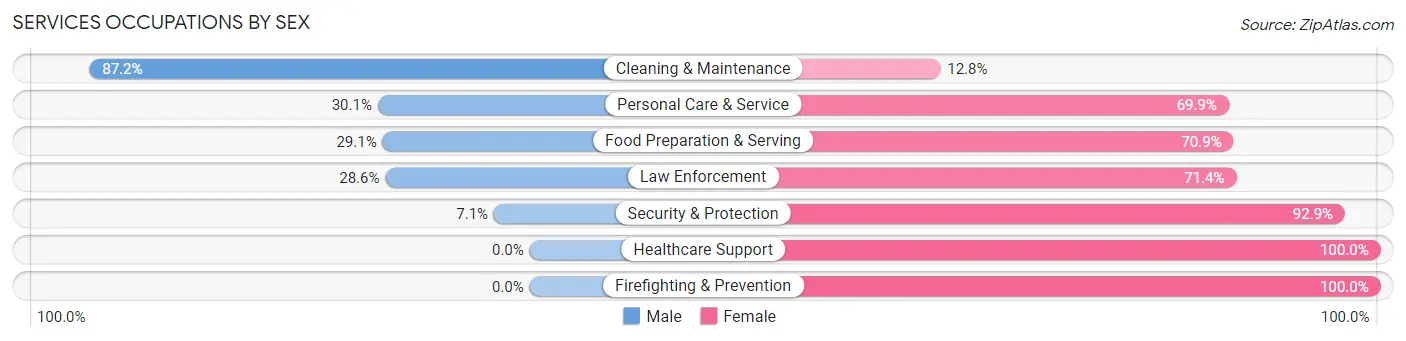
Services Occupations by Sex
Within the Services occupations in Mattydale, the most male-oriented occupations are Cleaning & Maintenance (87.2%), Personal Care & Service (30.1%), and Food Preparation & Serving (29.1%), while the most female-oriented occupations are Healthcare Support (100.0%), Firefighting & Prevention (100.0%), and Security & Protection (92.9%).
| Occupation | Male | Female |
| Healthcare Support | 0 (0.0%) | 130 (100.0%) |
| Security & Protection | 6 (7.1%) | 79 (92.9%) |
| Firefighting & Prevention | 0 (0.0%) | 64 (100.0%) |
| Law Enforcement | 6 (28.6%) | 15 (71.4%) |
| Food Preparation & Serving | 60 (29.1%) | 146 (70.9%) |
| Cleaning & Maintenance | 68 (87.2%) | 10 (12.8%) |
| Personal Care & Service | 43 (30.1%) | 100 (69.9%) |
| Total (Category) | 177 (27.6%) | 465 (72.4%) |
| Total (Overall) | 1,487 (47.7%) | 1,631 (52.3%) |
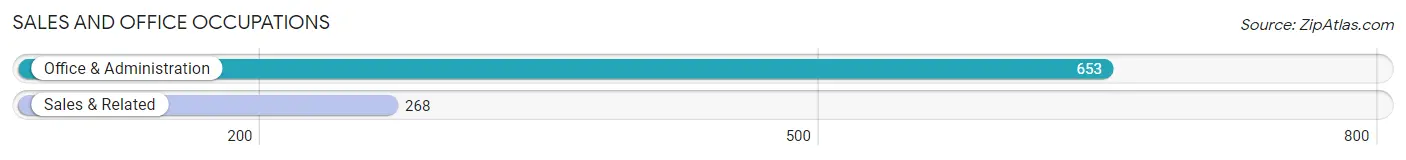
Sales and Office Occupations
The most common Sales and Office occupations in Mattydale are Office & Administration (653 | 20.9%), and Sales & Related (268 | 8.6%).
Sales and Office Occupations by Sex
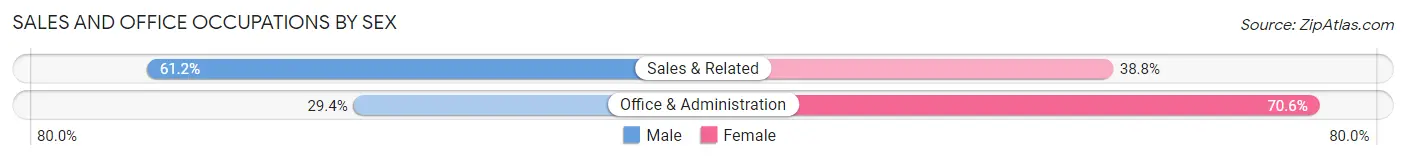
| Occupation | Male | Female |
| Sales & Related | 164 (61.2%) | 104 (38.8%) |
| Office & Administration | 192 (29.4%) | 461 (70.6%) |
| Total (Category) | 356 (38.7%) | 565 (61.4%) |
| Total (Overall) | 1,487 (47.7%) | 1,631 (52.3%) |
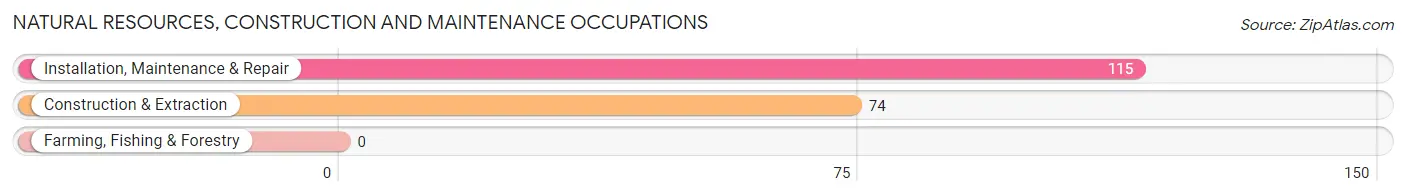
Natural Resources, Construction and Maintenance Occupations
The most common Natural Resources, Construction and Maintenance occupations in Mattydale are Installation, Maintenance & Repair (115 | 3.7%), and Construction & Extraction (74 | 2.4%).
Natural Resources, Construction and Maintenance Occupations by Sex
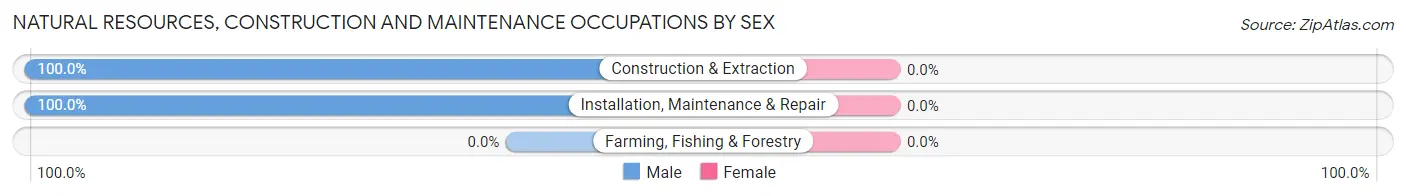
| Occupation | Male | Female |
| Farming, Fishing & Forestry | 0 (0.0%) | 0 (0.0%) |
| Construction & Extraction | 74 (100.0%) | 0 (0.0%) |
| Installation, Maintenance & Repair | 115 (100.0%) | 0 (0.0%) |
| Total (Category) | 189 (100.0%) | 0 (0.0%) |
| Total (Overall) | 1,487 (47.7%) | 1,631 (52.3%) |
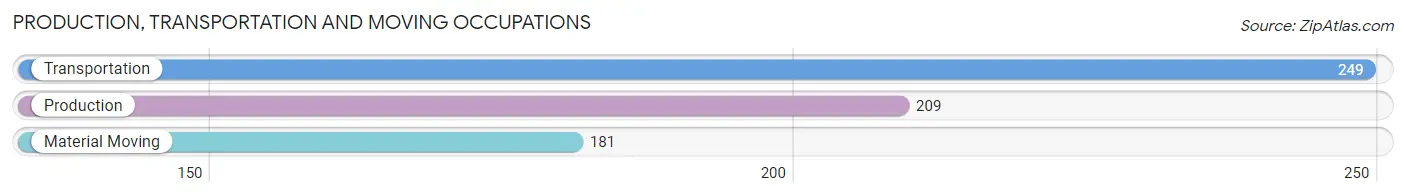
Production, Transportation and Moving Occupations
The most common Production, Transportation and Moving occupations in Mattydale are Transportation (249 | 8.0%), Production (209 | 6.7%), and Material Moving (181 | 5.8%).
Production, Transportation and Moving Occupations by Sex
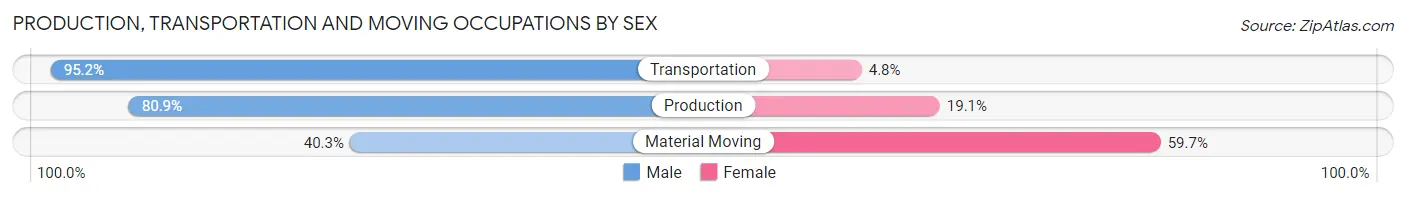
| Occupation | Male | Female |
| Production | 169 (80.9%) | 40 (19.1%) |
| Transportation | 237 (95.2%) | 12 (4.8%) |
| Material Moving | 73 (40.3%) | 108 (59.7%) |
| Total (Category) | 479 (75.0%) | 160 (25.0%) |
| Total (Overall) | 1,487 (47.7%) | 1,631 (52.3%) |
Employment Industries by Sex in Mattydale
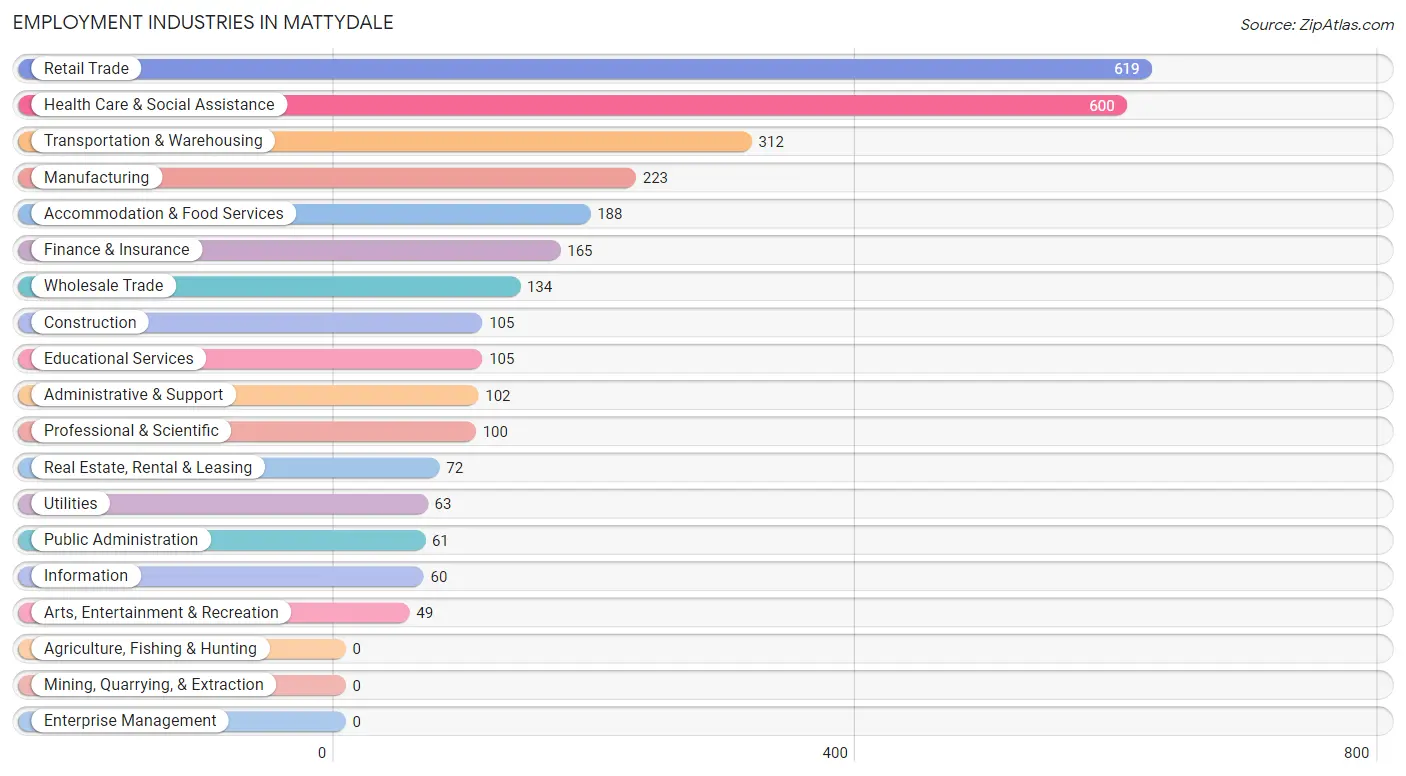
Employment Industries in Mattydale
The major employment industries in Mattydale include Retail Trade (619 | 19.9%), Health Care & Social Assistance (600 | 19.2%), Transportation & Warehousing (312 | 10.0%), Manufacturing (223 | 7.1%), and Accommodation & Food Services (188 | 6.0%).
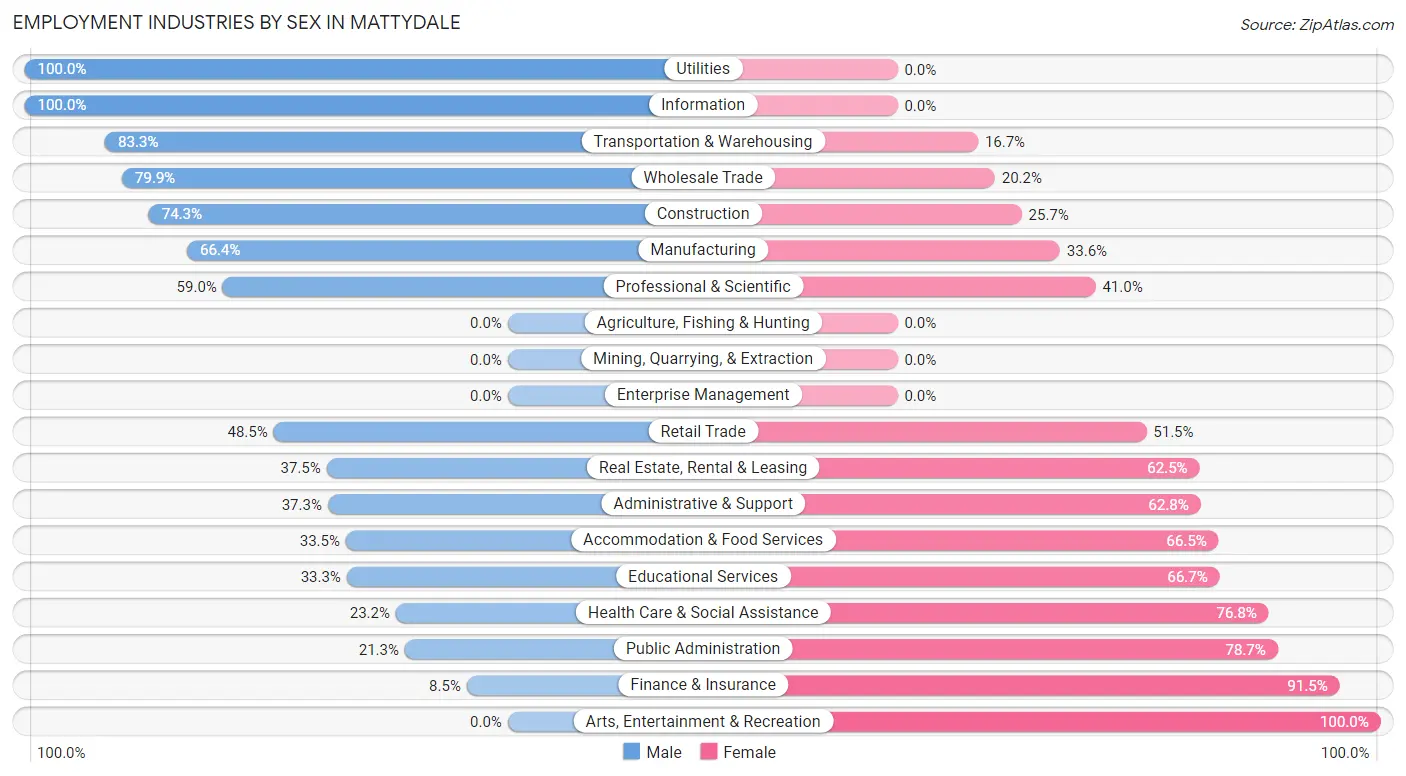
Employment Industries by Sex in Mattydale
The Mattydale industries that see more men than women are Utilities (100.0%), Information (100.0%), and Transportation & Warehousing (83.3%), whereas the industries that tend to have a higher number of women are Arts, Entertainment & Recreation (100.0%), Finance & Insurance (91.5%), and Public Administration (78.7%).
| Industry | Male | Female |
| Agriculture, Fishing & Hunting | 0 (0.0%) | 0 (0.0%) |
| Mining, Quarrying, & Extraction | 0 (0.0%) | 0 (0.0%) |
| Construction | 78 (74.3%) | 27 (25.7%) |
| Manufacturing | 148 (66.4%) | 75 (33.6%) |
| Wholesale Trade | 107 (79.8%) | 27 (20.2%) |
| Retail Trade | 300 (48.5%) | 319 (51.5%) |
| Transportation & Warehousing | 260 (83.3%) | 52 (16.7%) |
| Utilities | 63 (100.0%) | 0 (0.0%) |
| Information | 60 (100.0%) | 0 (0.0%) |
| Finance & Insurance | 14 (8.5%) | 151 (91.5%) |
| Real Estate, Rental & Leasing | 27 (37.5%) | 45 (62.5%) |
| Professional & Scientific | 59 (59.0%) | 41 (41.0%) |
| Enterprise Management | 0 (0.0%) | 0 (0.0%) |
| Administrative & Support | 38 (37.2%) | 64 (62.7%) |
| Educational Services | 35 (33.3%) | 70 (66.7%) |
| Health Care & Social Assistance | 139 (23.2%) | 461 (76.8%) |
| Arts, Entertainment & Recreation | 0 (0.0%) | 49 (100.0%) |
| Accommodation & Food Services | 63 (33.5%) | 125 (66.5%) |
| Public Administration | 13 (21.3%) | 48 (78.7%) |
| Total | 1,487 (47.7%) | 1,631 (52.3%) |
Education in Mattydale
School Enrollment in Mattydale
The most common levels of schooling among the 1,162 students in Mattydale are elementary school (309 | 26.6%), middle school (291 | 25.0%), and high school (244 | 21.0%).
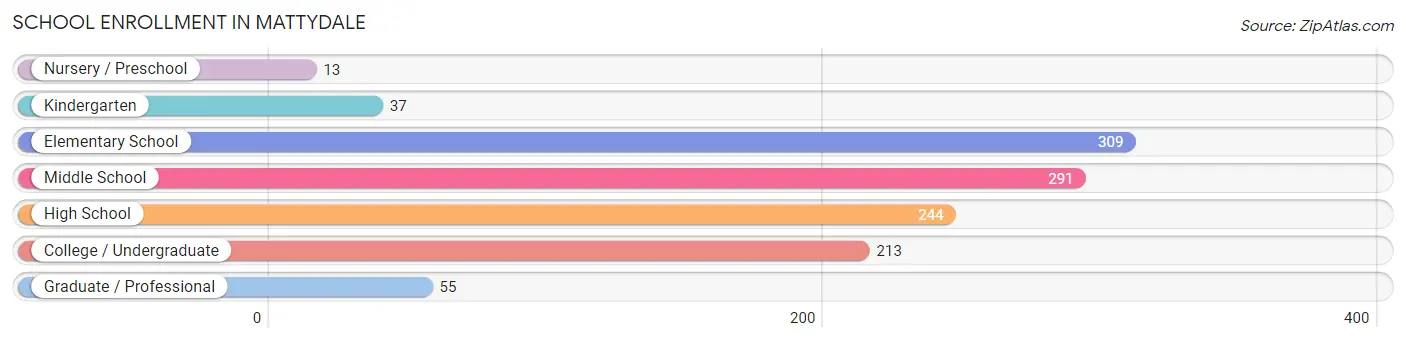
| School Level | # Students | % Students |
| Nursery / Preschool | 13 | 1.1% |
| Kindergarten | 37 | 3.2% |
| Elementary School | 309 | 26.6% |
| Middle School | 291 | 25.0% |
| High School | 244 | 21.0% |
| College / Undergraduate | 213 | 18.3% |
| Graduate / Professional | 55 | 4.7% |
| Total | 1,162 | 100.0% |
School Enrollment by Age by Funding Source in Mattydale
Out of a total of 1,162 students who are enrolled in schools in Mattydale, 55 (4.7%) attend a private institution, while the remaining 1,107 (95.3%) are enrolled in public schools. The age group of 35 years and over has the highest likelihood of being enrolled in private schools, with 15 (31.2% in the age bracket) enrolled. Conversely, the age group of 5 to 9 year old has the lowest likelihood of being enrolled in a private school, with 272 (100.0% in the age bracket) attending a public institution.
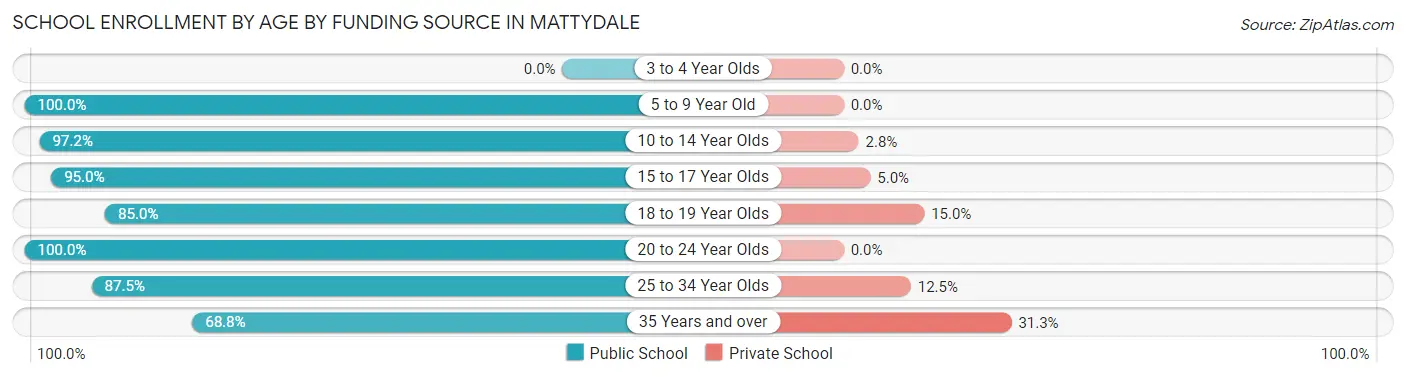
| Age Bracket | Public School | Private School |
| 3 to 4 Year Olds | 0 (0.0%) | 0 (0.0%) |
| 5 to 9 Year Old | 272 (100.0%) | 0 (0.0%) |
| 10 to 14 Year Olds | 385 (97.2%) | 11 (2.8%) |
| 15 to 17 Year Olds | 172 (95.0%) | 9 (5.0%) |
| 18 to 19 Year Olds | 34 (85.0%) | 6 (15.0%) |
| 20 to 24 Year Olds | 113 (100.0%) | 0 (0.0%) |
| 25 to 34 Year Olds | 98 (87.5%) | 14 (12.5%) |
| 35 Years and over | 33 (68.8%) | 15 (31.2%) |
| Total | 1,107 (95.3%) | 55 (4.7%) |
Educational Attainment by Field of Study in Mattydale
Education (168 | 25.5%), science & technology (147 | 22.3%), business (90 | 13.6%), psychology (45 | 6.8%), and communications (44 | 6.7%) are the most common fields of study among 660 individuals in Mattydale who have obtained a bachelor's degree or higher.
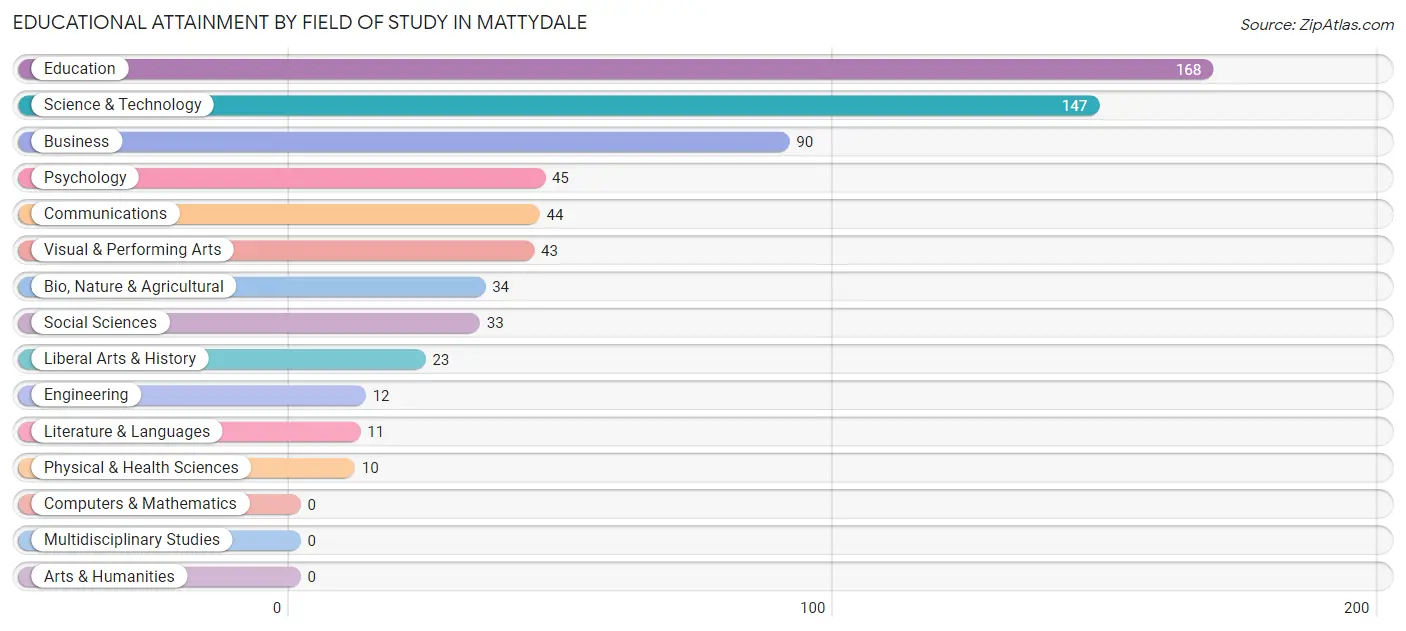
| Field of Study | # Graduates | % Graduates |
| Computers & Mathematics | 0 | 0.0% |
| Bio, Nature & Agricultural | 34 | 5.1% |
| Physical & Health Sciences | 10 | 1.5% |
| Psychology | 45 | 6.8% |
| Social Sciences | 33 | 5.0% |
| Engineering | 12 | 1.8% |
| Multidisciplinary Studies | 0 | 0.0% |
| Science & Technology | 147 | 22.3% |
| Business | 90 | 13.6% |
| Education | 168 | 25.5% |
| Literature & Languages | 11 | 1.7% |
| Liberal Arts & History | 23 | 3.5% |
| Visual & Performing Arts | 43 | 6.5% |
| Communications | 44 | 6.7% |
| Arts & Humanities | 0 | 0.0% |
| Total | 660 | 100.0% |
Transportation & Commute in Mattydale
Vehicle Availability by Sex in Mattydale
The most prevalent vehicle ownership categories in Mattydale are males with 2 vehicles (668, accounting for 43.8%) and females with 2 vehicles (848, making up 41.3%).
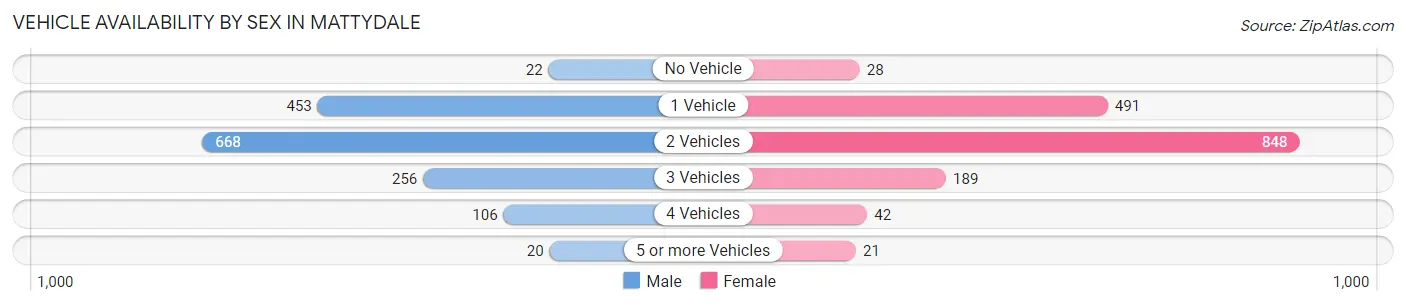
| Vehicles Available | Male | Female |
| No Vehicle | 22 (1.4%) | 28 (1.7%) |
| 1 Vehicle | 453 (29.7%) | 491 (30.3%) |
| 2 Vehicles | 668 (43.8%) | 848 (52.4%) |
| 3 Vehicles | 256 (16.8%) | 189 (11.7%) |
| 4 Vehicles | 106 (7.0%) | 42 (2.6%) |
| 5 or more Vehicles | 20 (1.3%) | 21 (1.3%) |
| Total | 1,525 (100.0%) | 1,619 (100.0%) |
Commute Time in Mattydale
The most frequently occuring commute durations in Mattydale are 15 to 19 minutes (902 commuters, 31.1%), 10 to 14 minutes (524 commuters, 18.1%), and 20 to 24 minutes (361 commuters, 12.4%).
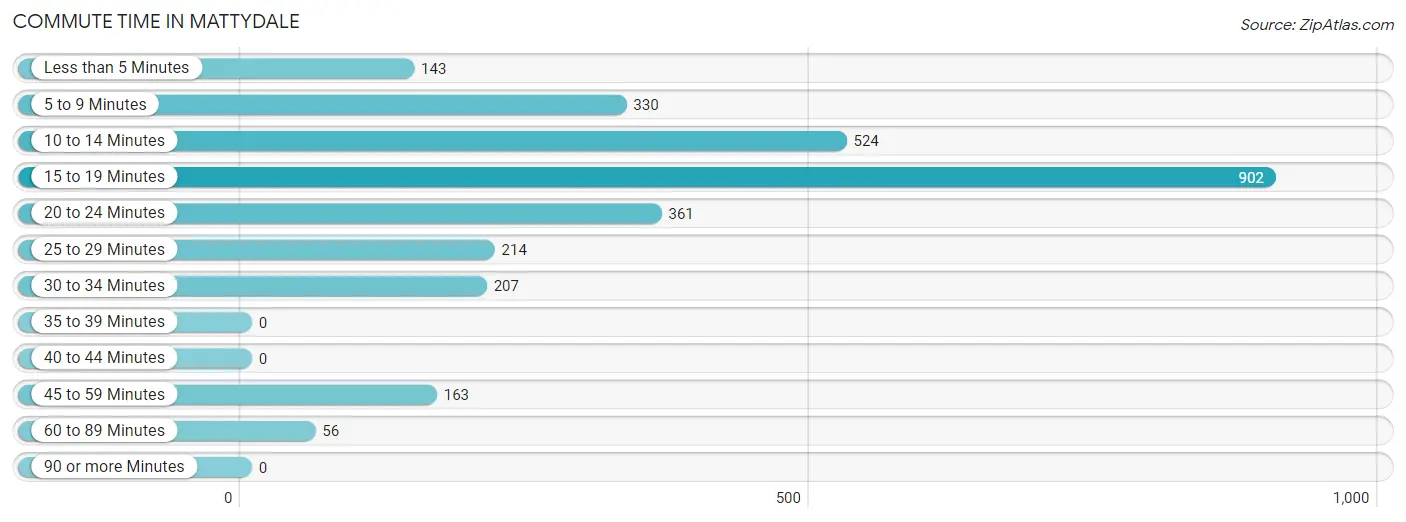
| Commute Time | # Commuters | % Commuters |
| Less than 5 Minutes | 143 | 4.9% |
| 5 to 9 Minutes | 330 | 11.4% |
| 10 to 14 Minutes | 524 | 18.1% |
| 15 to 19 Minutes | 902 | 31.1% |
| 20 to 24 Minutes | 361 | 12.4% |
| 25 to 29 Minutes | 214 | 7.4% |
| 30 to 34 Minutes | 207 | 7.1% |
| 35 to 39 Minutes | 0 | 0.0% |
| 40 to 44 Minutes | 0 | 0.0% |
| 45 to 59 Minutes | 163 | 5.6% |
| 60 to 89 Minutes | 56 | 1.9% |
| 90 or more Minutes | 0 | 0.0% |
Commute Time by Sex in Mattydale
The most common commute times in Mattydale are 10 to 14 minutes (377 commuters, 26.7%) for males and 15 to 19 minutes (595 commuters, 40.0%) for females.
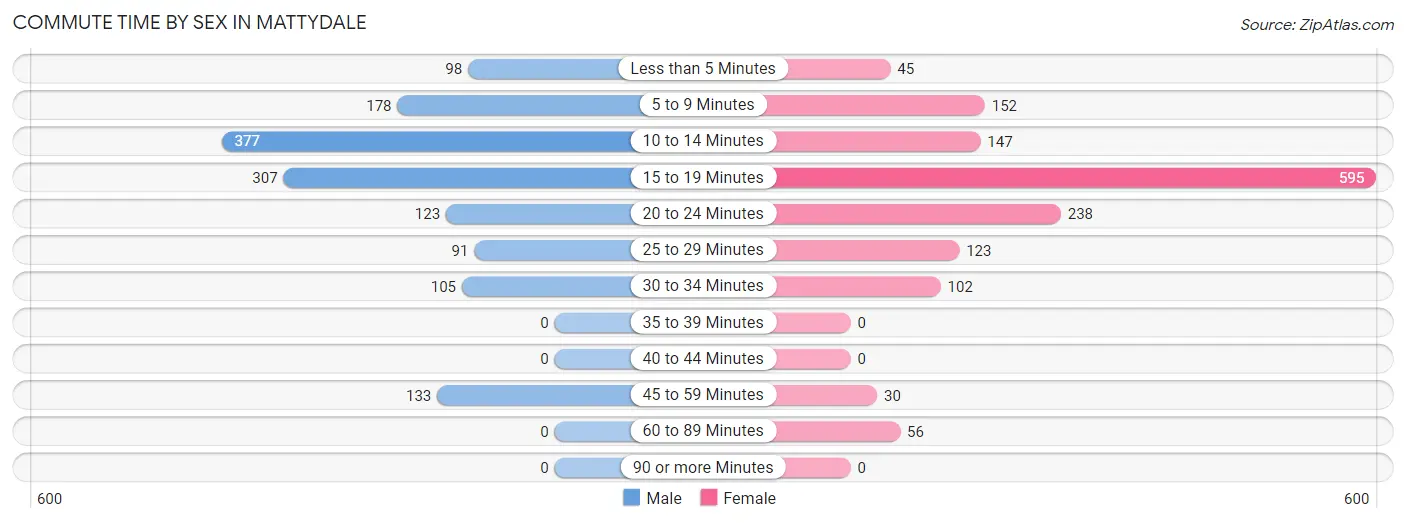
| Commute Time | Male | Female |
| Less than 5 Minutes | 98 (6.9%) | 45 (3.0%) |
| 5 to 9 Minutes | 178 (12.6%) | 152 (10.2%) |
| 10 to 14 Minutes | 377 (26.7%) | 147 (9.9%) |
| 15 to 19 Minutes | 307 (21.7%) | 595 (40.0%) |
| 20 to 24 Minutes | 123 (8.7%) | 238 (16.0%) |
| 25 to 29 Minutes | 91 (6.4%) | 123 (8.3%) |
| 30 to 34 Minutes | 105 (7.4%) | 102 (6.9%) |
| 35 to 39 Minutes | 0 (0.0%) | 0 (0.0%) |
| 40 to 44 Minutes | 0 (0.0%) | 0 (0.0%) |
| 45 to 59 Minutes | 133 (9.4%) | 30 (2.0%) |
| 60 to 89 Minutes | 0 (0.0%) | 56 (3.8%) |
| 90 or more Minutes | 0 (0.0%) | 0 (0.0%) |
Time of Departure to Work by Sex in Mattydale
The most frequent times of departure to work in Mattydale are 6:30 AM to 6:59 AM (230, 16.3%) for males and 7:00 AM to 7:29 AM (256, 17.2%) for females.
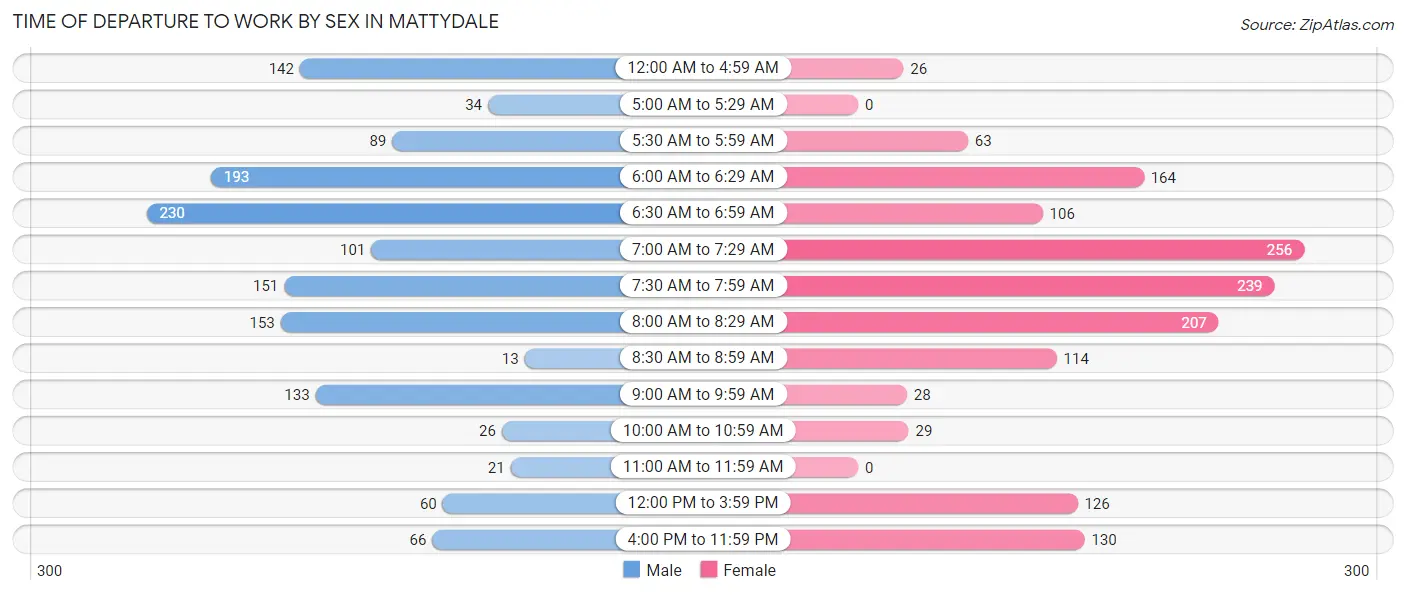
| Time of Departure | Male | Female |
| 12:00 AM to 4:59 AM | 142 (10.1%) | 26 (1.8%) |
| 5:00 AM to 5:29 AM | 34 (2.4%) | 0 (0.0%) |
| 5:30 AM to 5:59 AM | 89 (6.3%) | 63 (4.2%) |
| 6:00 AM to 6:29 AM | 193 (13.7%) | 164 (11.0%) |
| 6:30 AM to 6:59 AM | 230 (16.3%) | 106 (7.1%) |
| 7:00 AM to 7:29 AM | 101 (7.1%) | 256 (17.2%) |
| 7:30 AM to 7:59 AM | 151 (10.7%) | 239 (16.1%) |
| 8:00 AM to 8:29 AM | 153 (10.8%) | 207 (13.9%) |
| 8:30 AM to 8:59 AM | 13 (0.9%) | 114 (7.7%) |
| 9:00 AM to 9:59 AM | 133 (9.4%) | 28 (1.9%) |
| 10:00 AM to 10:59 AM | 26 (1.8%) | 29 (1.9%) |
| 11:00 AM to 11:59 AM | 21 (1.5%) | 0 (0.0%) |
| 12:00 PM to 3:59 PM | 60 (4.3%) | 126 (8.5%) |
| 4:00 PM to 11:59 PM | 66 (4.7%) | 130 (8.7%) |
| Total | 1,412 (100.0%) | 1,488 (100.0%) |
Housing Occupancy in Mattydale
Occupancy by Ownership in Mattydale
Of the total 2,352 dwellings in Mattydale, owner-occupied units account for 1,750 (74.4%), while renter-occupied units make up 602 (25.6%).
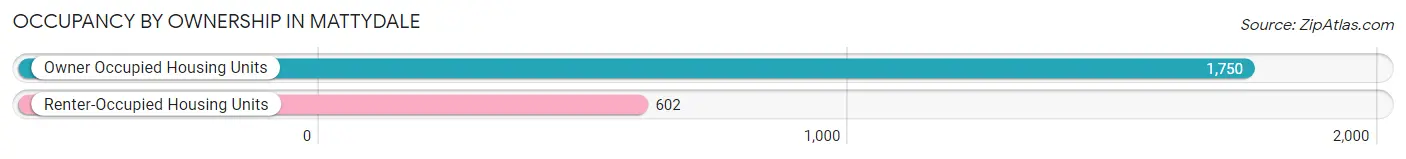
| Occupancy | # Housing Units | % Housing Units |
| Owner Occupied Housing Units | 1,750 | 74.4% |
| Renter-Occupied Housing Units | 602 | 25.6% |
| Total Occupied Housing Units | 2,352 | 100.0% |
Occupancy by Household Size in Mattydale
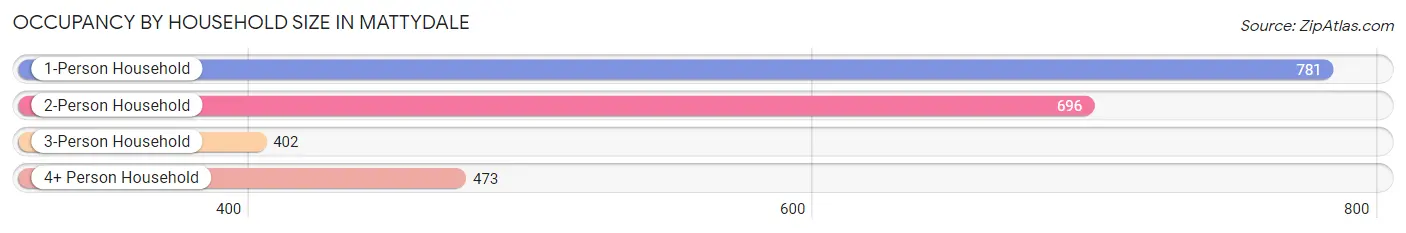
| Household Size | # Housing Units | % Housing Units |
| 1-Person Household | 781 | 33.2% |
| 2-Person Household | 696 | 29.6% |
| 3-Person Household | 402 | 17.1% |
| 4+ Person Household | 473 | 20.1% |
| Total Housing Units | 2,352 | 100.0% |
Occupancy by Ownership by Household Size in Mattydale
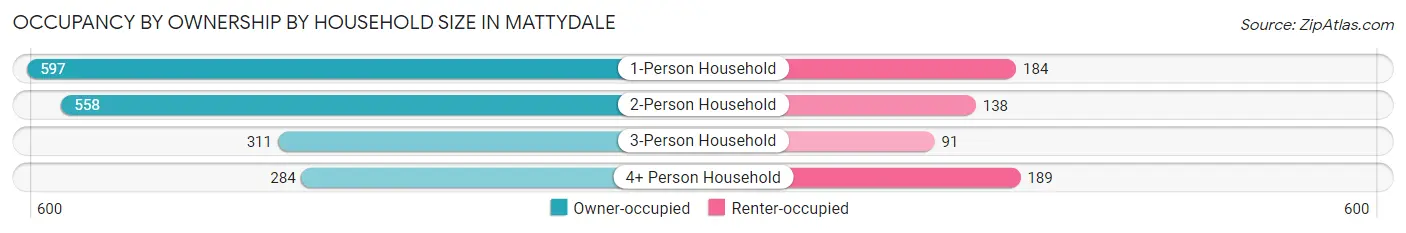
| Household Size | Owner-occupied | Renter-occupied |
| 1-Person Household | 597 (76.4%) | 184 (23.6%) |
| 2-Person Household | 558 (80.2%) | 138 (19.8%) |
| 3-Person Household | 311 (77.4%) | 91 (22.6%) |
| 4+ Person Household | 284 (60.0%) | 189 (40.0%) |
| Total Housing Units | 1,750 (74.4%) | 602 (25.6%) |
Occupancy by Educational Attainment in Mattydale
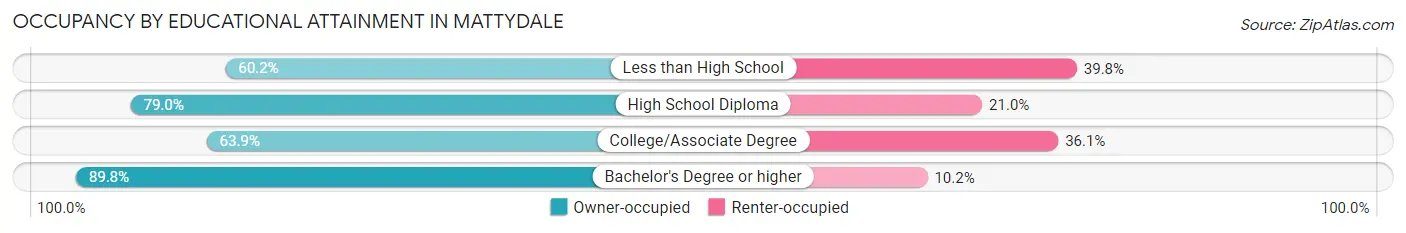
| Household Size | Owner-occupied | Renter-occupied |
| Less than High School | 115 (60.2%) | 76 (39.8%) |
| High School Diploma | 703 (79.0%) | 187 (21.0%) |
| College/Associate Degree | 517 (63.9%) | 292 (36.1%) |
| Bachelor's Degree or higher | 415 (89.8%) | 47 (10.2%) |
Occupancy by Age of Householder in Mattydale
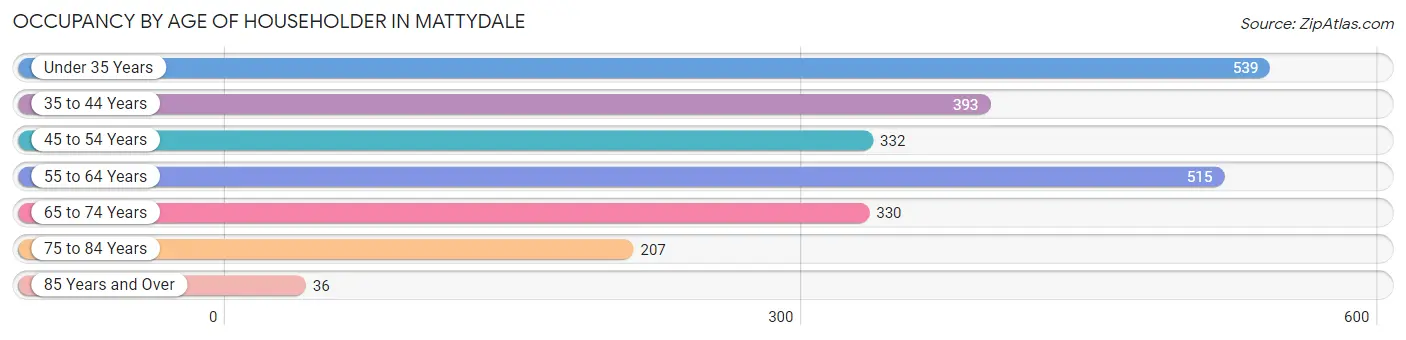
| Age Bracket | # Households | % Households |
| Under 35 Years | 539 | 22.9% |
| 35 to 44 Years | 393 | 16.7% |
| 45 to 54 Years | 332 | 14.1% |
| 55 to 64 Years | 515 | 21.9% |
| 65 to 74 Years | 330 | 14.0% |
| 75 to 84 Years | 207 | 8.8% |
| 85 Years and Over | 36 | 1.5% |
| Total | 2,352 | 100.0% |
Housing Finances in Mattydale
Median Income by Occupancy in Mattydale
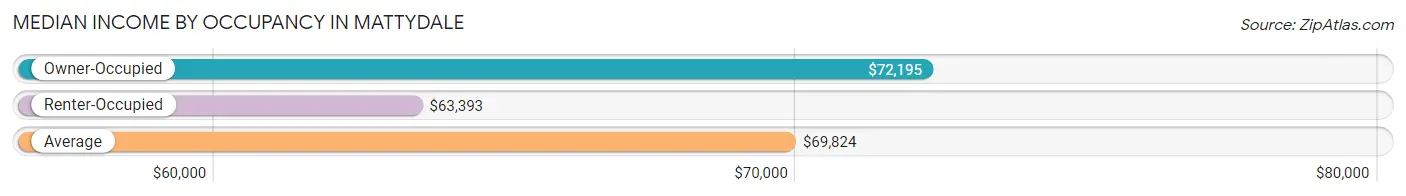
| Occupancy Type | # Households | Median Income |
| Owner-Occupied | 1,750 (74.4%) | $72,195 |
| Renter-Occupied | 602 (25.6%) | $63,393 |
| Average | 2,352 (100.0%) | $69,824 |
Occupancy by Householder Income Bracket in Mattydale
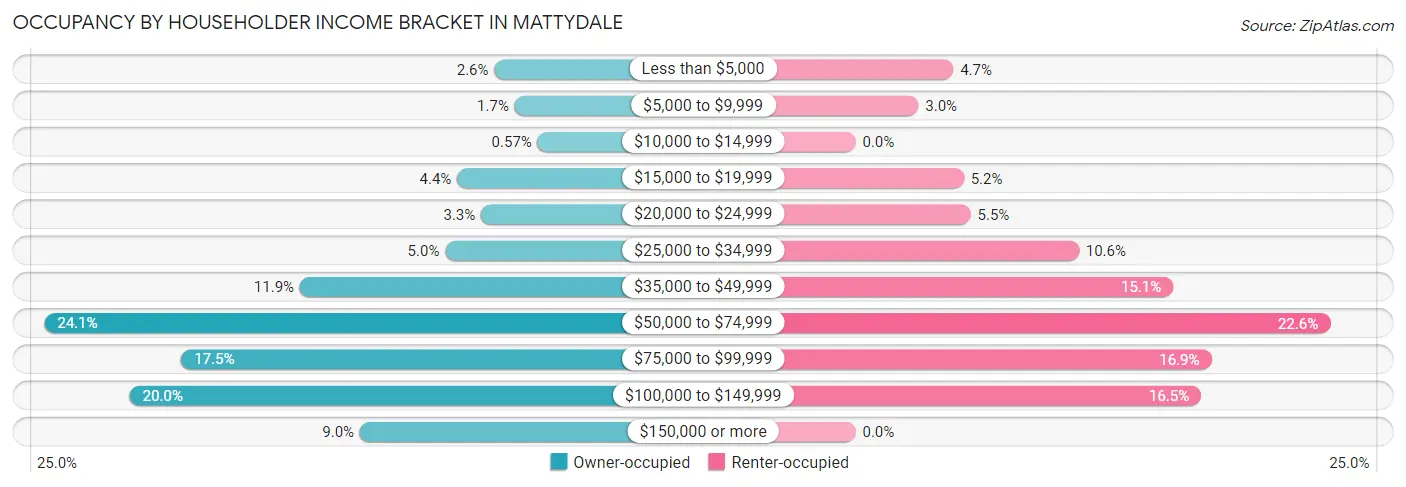
| Income Bracket | Owner-occupied | Renter-occupied |
| Less than $5,000 | 46 (2.6%) | 28 (4.6%) |
| $5,000 to $9,999 | 29 (1.7%) | 18 (3.0%) |
| $10,000 to $14,999 | 10 (0.6%) | 0 (0.0%) |
| $15,000 to $19,999 | 77 (4.4%) | 31 (5.1%) |
| $20,000 to $24,999 | 57 (3.3%) | 33 (5.5%) |
| $25,000 to $34,999 | 87 (5.0%) | 64 (10.6%) |
| $35,000 to $49,999 | 208 (11.9%) | 91 (15.1%) |
| $50,000 to $74,999 | 421 (24.1%) | 136 (22.6%) |
| $75,000 to $99,999 | 307 (17.5%) | 102 (16.9%) |
| $100,000 to $149,999 | 350 (20.0%) | 99 (16.5%) |
| $150,000 or more | 158 (9.0%) | 0 (0.0%) |
| Total | 1,750 (100.0%) | 602 (100.0%) |
Monthly Housing Cost Tiers in Mattydale
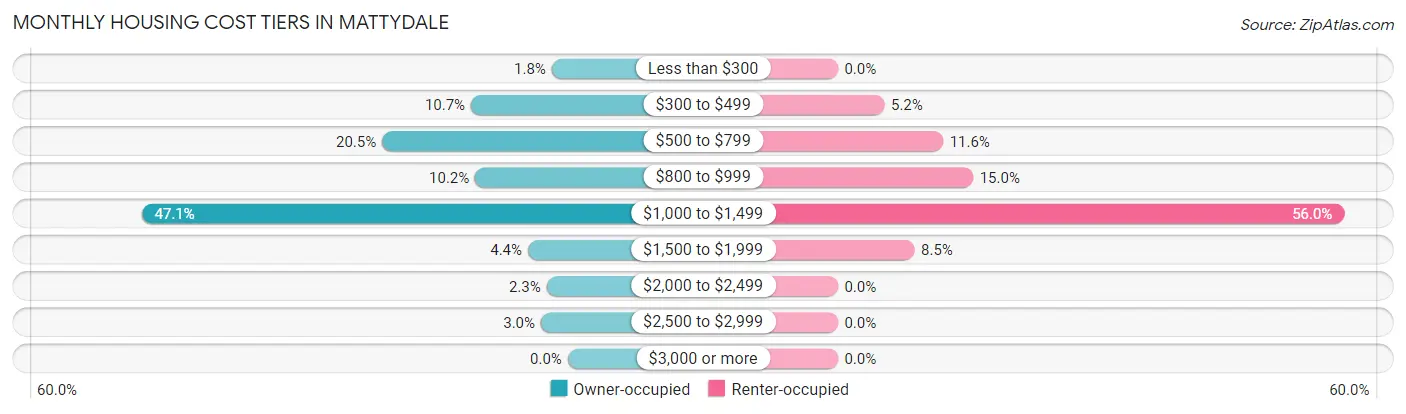
| Monthly Cost | Owner-occupied | Renter-occupied |
| Less than $300 | 31 (1.8%) | 0 (0.0%) |
| $300 to $499 | 187 (10.7%) | 31 (5.1%) |
| $500 to $799 | 359 (20.5%) | 70 (11.6%) |
| $800 to $999 | 179 (10.2%) | 90 (14.9%) |
| $1,000 to $1,499 | 824 (47.1%) | 337 (56.0%) |
| $1,500 to $1,999 | 77 (4.4%) | 51 (8.5%) |
| $2,000 to $2,499 | 41 (2.3%) | 0 (0.0%) |
| $2,500 to $2,999 | 52 (3.0%) | 0 (0.0%) |
| $3,000 or more | 0 (0.0%) | 0 (0.0%) |
| Total | 1,750 (100.0%) | 602 (100.0%) |
Physical Housing Characteristics in Mattydale
Housing Structures in Mattydale
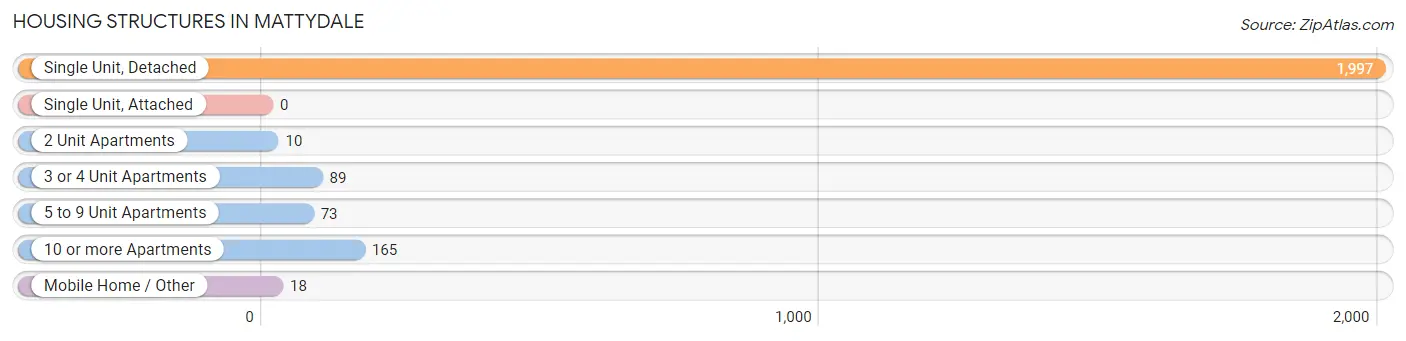
| Structure Type | # Housing Units | % Housing Units |
| Single Unit, Detached | 1,997 | 84.9% |
| Single Unit, Attached | 0 | 0.0% |
| 2 Unit Apartments | 10 | 0.4% |
| 3 or 4 Unit Apartments | 89 | 3.8% |
| 5 to 9 Unit Apartments | 73 | 3.1% |
| 10 or more Apartments | 165 | 7.0% |
| Mobile Home / Other | 18 | 0.8% |
| Total | 2,352 | 100.0% |
Housing Structures by Occupancy in Mattydale
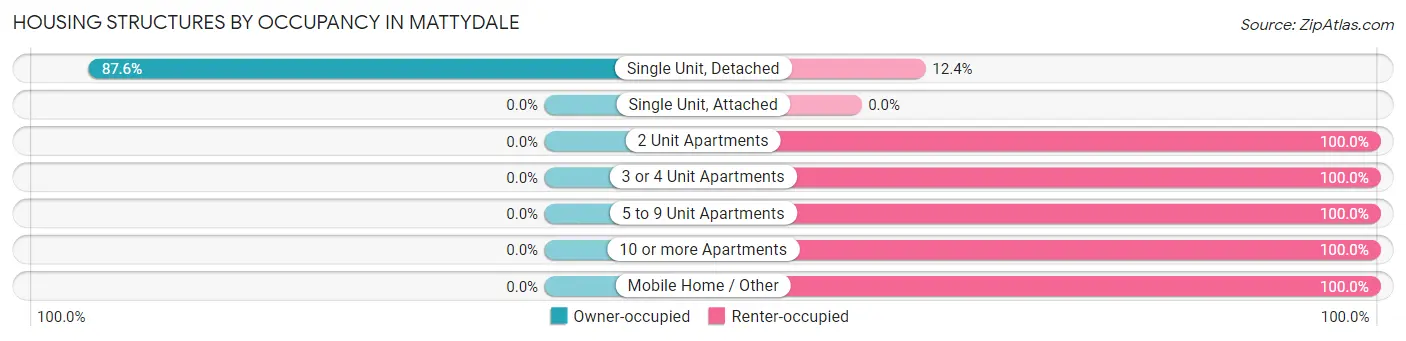
| Structure Type | Owner-occupied | Renter-occupied |
| Single Unit, Detached | 1,750 (87.6%) | 247 (12.4%) |
| Single Unit, Attached | 0 (0.0%) | 0 (0.0%) |
| 2 Unit Apartments | 0 (0.0%) | 10 (100.0%) |
| 3 or 4 Unit Apartments | 0 (0.0%) | 89 (100.0%) |
| 5 to 9 Unit Apartments | 0 (0.0%) | 73 (100.0%) |
| 10 or more Apartments | 0 (0.0%) | 165 (100.0%) |
| Mobile Home / Other | 0 (0.0%) | 18 (100.0%) |
| Total | 1,750 (74.4%) | 602 (25.6%) |
Housing Structures by Number of Rooms in Mattydale
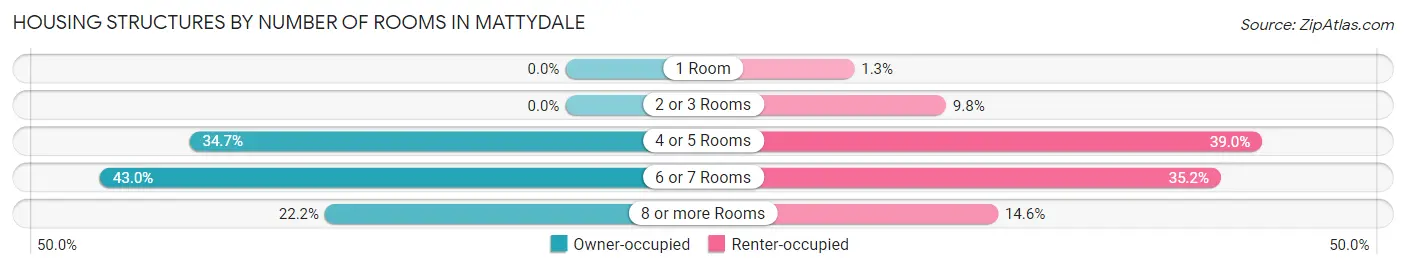
| Number of Rooms | Owner-occupied | Renter-occupied |
| 1 Room | 0 (0.0%) | 8 (1.3%) |
| 2 or 3 Rooms | 0 (0.0%) | 59 (9.8%) |
| 4 or 5 Rooms | 608 (34.7%) | 235 (39.0%) |
| 6 or 7 Rooms | 753 (43.0%) | 212 (35.2%) |
| 8 or more Rooms | 389 (22.2%) | 88 (14.6%) |
| Total | 1,750 (100.0%) | 602 (100.0%) |
Housing Structure by Heating Type in Mattydale
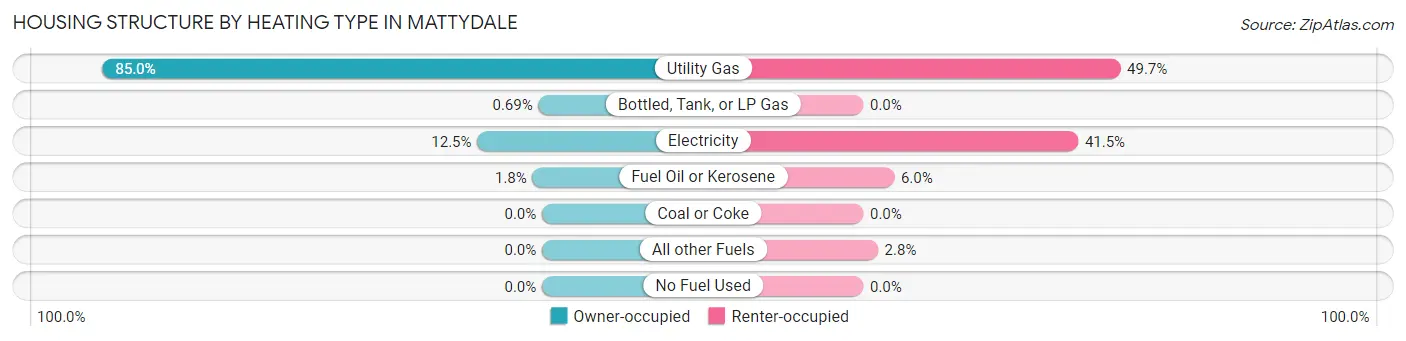
| Heating Type | Owner-occupied | Renter-occupied |
| Utility Gas | 1,487 (85.0%) | 299 (49.7%) |
| Bottled, Tank, or LP Gas | 12 (0.7%) | 0 (0.0%) |
| Electricity | 219 (12.5%) | 250 (41.5%) |
| Fuel Oil or Kerosene | 32 (1.8%) | 36 (6.0%) |
| Coal or Coke | 0 (0.0%) | 0 (0.0%) |
| All other Fuels | 0 (0.0%) | 17 (2.8%) |
| No Fuel Used | 0 (0.0%) | 0 (0.0%) |
| Total | 1,750 (100.0%) | 602 (100.0%) |
Household Vehicle Usage in Mattydale
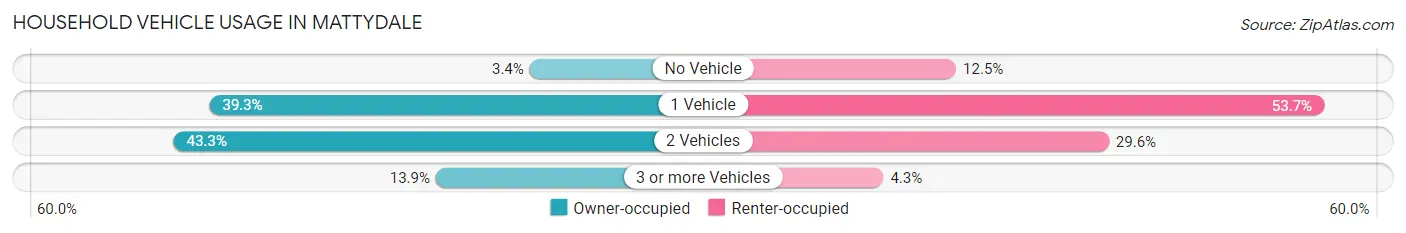
| Vehicles per Household | Owner-occupied | Renter-occupied |
| No Vehicle | 60 (3.4%) | 75 (12.5%) |
| 1 Vehicle | 688 (39.3%) | 323 (53.6%) |
| 2 Vehicles | 758 (43.3%) | 178 (29.6%) |
| 3 or more Vehicles | 244 (13.9%) | 26 (4.3%) |
| Total | 1,750 (100.0%) | 602 (100.0%) |
Real Estate & Mortgages in Mattydale
Real Estate and Mortgage Overview in Mattydale
| Characteristic | Without Mortgage | With Mortgage |
| Housing Units | 475 | 1,275 |
| Median Property Value | $100,900 | $108,700 |
| Median Household Income | $54,135 | $136 |
| Monthly Housing Costs | $518 | $0 |
| Real Estate Taxes | $2,797 | $25 |
Property Value by Mortgage Status in Mattydale
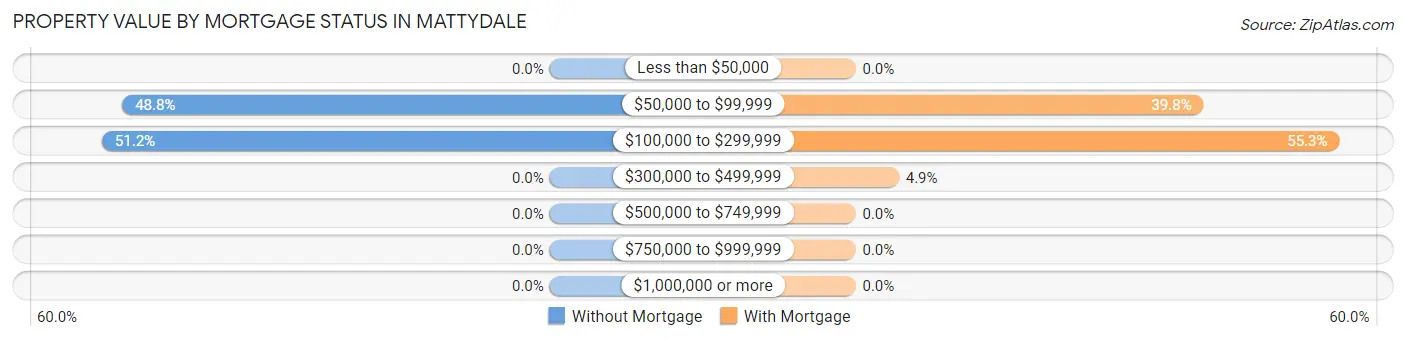
| Property Value | Without Mortgage | With Mortgage |
| Less than $50,000 | 0 (0.0%) | 0 (0.0%) |
| $50,000 to $99,999 | 232 (48.8%) | 507 (39.8%) |
| $100,000 to $299,999 | 243 (51.2%) | 705 (55.3%) |
| $300,000 to $499,999 | 0 (0.0%) | 63 (4.9%) |
| $500,000 to $749,999 | 0 (0.0%) | 0 (0.0%) |
| $750,000 to $999,999 | 0 (0.0%) | 0 (0.0%) |
| $1,000,000 or more | 0 (0.0%) | 0 (0.0%) |
| Total | 475 (100.0%) | 1,275 (100.0%) |
Household Income by Mortgage Status in Mattydale
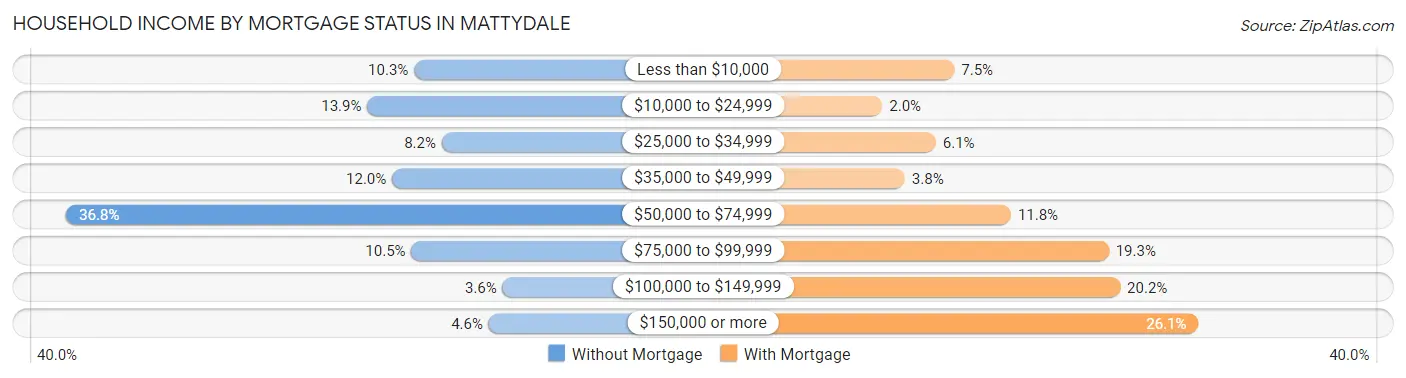
| Household Income | Without Mortgage | With Mortgage |
| Less than $10,000 | 49 (10.3%) | 96 (7.5%) |
| $10,000 to $24,999 | 66 (13.9%) | 26 (2.0%) |
| $25,000 to $34,999 | 39 (8.2%) | 78 (6.1%) |
| $35,000 to $49,999 | 57 (12.0%) | 48 (3.8%) |
| $50,000 to $74,999 | 175 (36.8%) | 151 (11.8%) |
| $75,000 to $99,999 | 50 (10.5%) | 246 (19.3%) |
| $100,000 to $149,999 | 17 (3.6%) | 257 (20.2%) |
| $150,000 or more | 22 (4.6%) | 333 (26.1%) |
| Total | 475 (100.0%) | 1,275 (100.0%) |
Property Value to Household Income Ratio in Mattydale
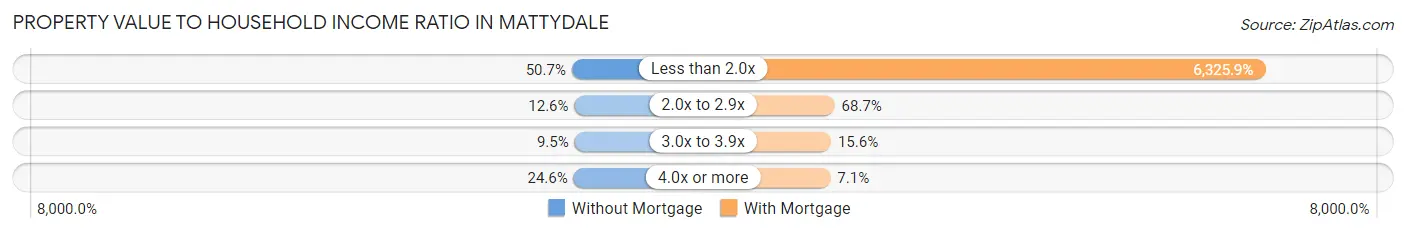
| Value-to-Income Ratio | Without Mortgage | With Mortgage |
| Less than 2.0x | 241 (50.7%) | 80,655 (6,325.9%) |
| 2.0x to 2.9x | 60 (12.6%) | 876 (68.7%) |
| 3.0x to 3.9x | 45 (9.5%) | 199 (15.6%) |
| 4.0x or more | 117 (24.6%) | 90 (7.1%) |
| Total | 475 (100.0%) | 1,275 (100.0%) |
Real Estate Taxes by Mortgage Status in Mattydale
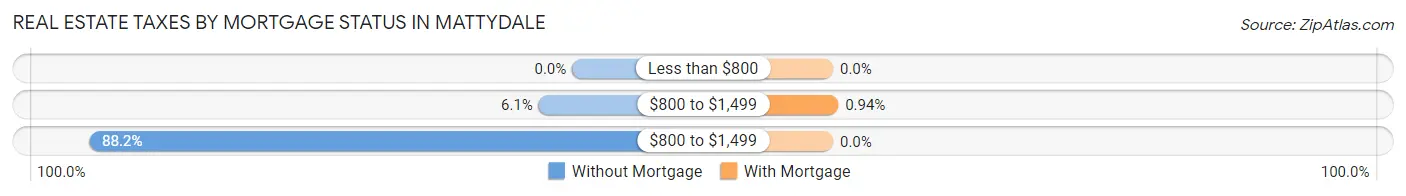
| Property Taxes | Without Mortgage | With Mortgage |
| Less than $800 | 0 (0.0%) | 0 (0.0%) |
| $800 to $1,499 | 29 (6.1%) | 12 (0.9%) |
| $800 to $1,499 | 419 (88.2%) | 0 (0.0%) |
| Total | 475 (100.0%) | 1,275 (100.0%) |
Health & Disability in Mattydale
Health Insurance Coverage by Age in Mattydale
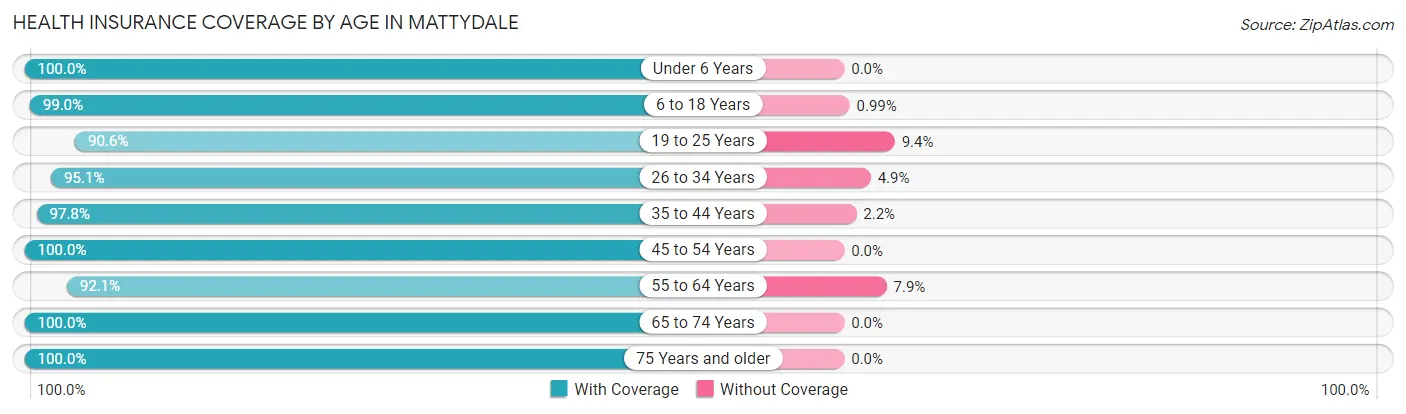
| Age Bracket | With Coverage | Without Coverage |
| Under 6 Years | 367 (100.0%) | 0 (0.0%) |
| 6 to 18 Years | 898 (99.0%) | 9 (1.0%) |
| 19 to 25 Years | 693 (90.6%) | 72 (9.4%) |
| 26 to 34 Years | 655 (95.1%) | 34 (4.9%) |
| 35 to 44 Years | 697 (97.8%) | 16 (2.2%) |
| 45 to 54 Years | 712 (100.0%) | 0 (0.0%) |
| 55 to 64 Years | 700 (92.1%) | 60 (7.9%) |
| 65 to 74 Years | 547 (100.0%) | 0 (0.0%) |
| 75 Years and older | 326 (100.0%) | 0 (0.0%) |
| Total | 5,595 (96.7%) | 191 (3.3%) |
Health Insurance Coverage by Citizenship Status in Mattydale
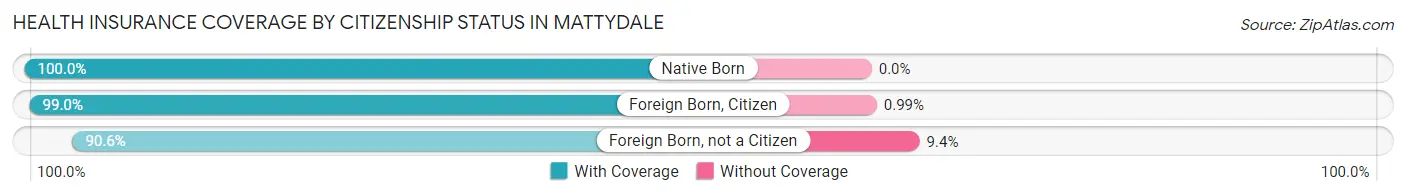
| Citizenship Status | With Coverage | Without Coverage |
| Native Born | 367 (100.0%) | 0 (0.0%) |
| Foreign Born, Citizen | 898 (99.0%) | 9 (1.0%) |
| Foreign Born, not a Citizen | 693 (90.6%) | 72 (9.4%) |
Health Insurance Coverage by Household Income in Mattydale
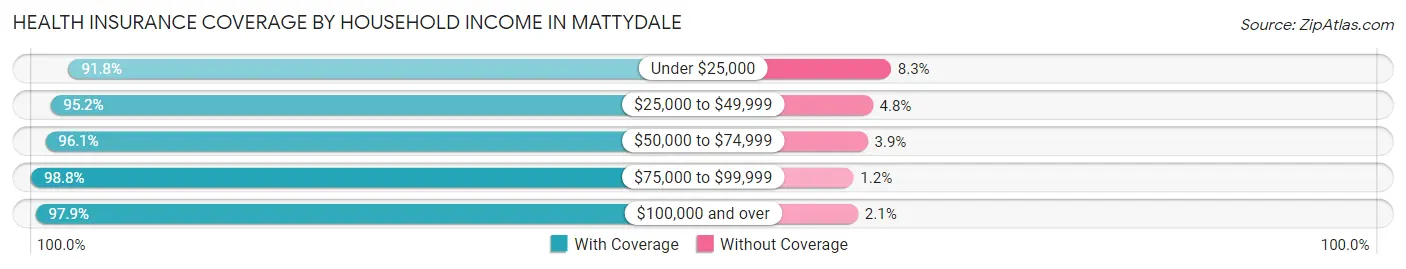
| Household Income | With Coverage | Without Coverage |
| Under $25,000 | 445 (91.7%) | 40 (8.3%) |
| $25,000 to $49,999 | 749 (95.2%) | 38 (4.8%) |
| $50,000 to $74,999 | 1,403 (96.1%) | 57 (3.9%) |
| $75,000 to $99,999 | 874 (98.8%) | 11 (1.2%) |
| $100,000 and over | 2,115 (97.9%) | 45 (2.1%) |
Public vs Private Health Insurance Coverage by Age in Mattydale
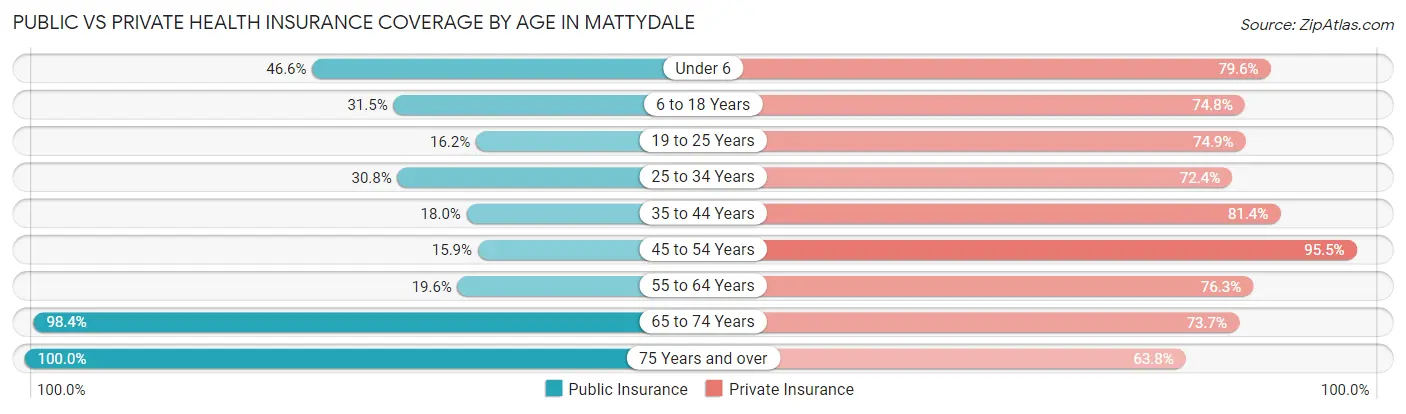
| Age Bracket | Public Insurance | Private Insurance |
| Under 6 | 171 (46.6%) | 292 (79.6%) |
| 6 to 18 Years | 286 (31.5%) | 678 (74.8%) |
| 19 to 25 Years | 124 (16.2%) | 573 (74.9%) |
| 25 to 34 Years | 212 (30.8%) | 499 (72.4%) |
| 35 to 44 Years | 128 (17.9%) | 580 (81.4%) |
| 45 to 54 Years | 113 (15.9%) | 680 (95.5%) |
| 55 to 64 Years | 149 (19.6%) | 580 (76.3%) |
| 65 to 74 Years | 538 (98.4%) | 403 (73.7%) |
| 75 Years and over | 326 (100.0%) | 208 (63.8%) |
| Total | 2,047 (35.4%) | 4,493 (77.6%) |
Disability Status by Sex by Age in Mattydale
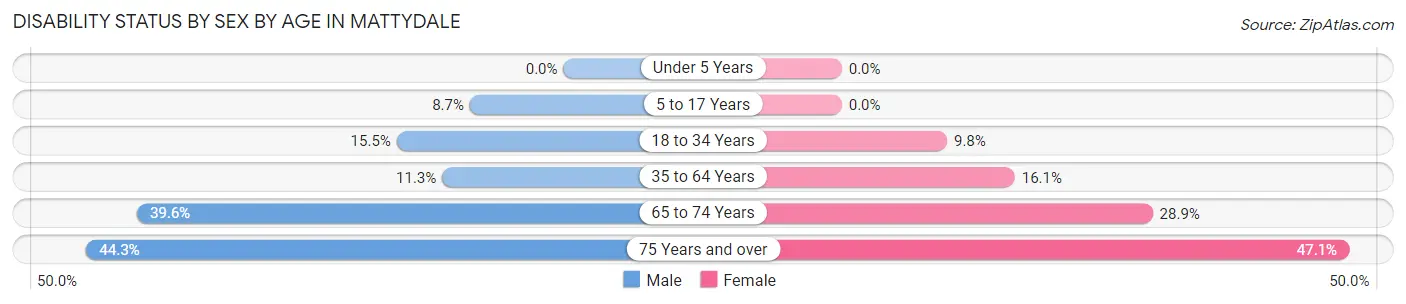
| Age Bracket | Male | Female |
| Under 5 Years | 0 (0.0%) | 0 (0.0%) |
| 5 to 17 Years | 38 (8.7%) | 0 (0.0%) |
| 18 to 34 Years | 95 (15.5%) | 84 (9.8%) |
| 35 to 64 Years | 119 (11.3%) | 181 (16.1%) |
| 65 to 74 Years | 93 (39.6%) | 90 (28.8%) |
| 75 Years and over | 54 (44.3%) | 96 (47.1%) |
Disability Class by Sex by Age in Mattydale
Disability Class: Hearing Difficulty
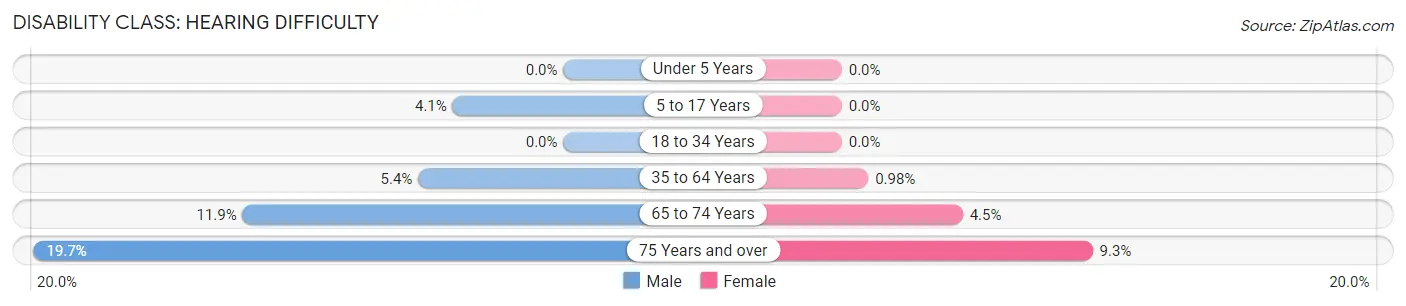
| Age Bracket | Male | Female |
| Under 5 Years | 0 (0.0%) | 0 (0.0%) |
| 5 to 17 Years | 18 (4.1%) | 0 (0.0%) |
| 18 to 34 Years | 0 (0.0%) | 0 (0.0%) |
| 35 to 64 Years | 57 (5.4%) | 11 (1.0%) |
| 65 to 74 Years | 28 (11.9%) | 14 (4.5%) |
| 75 Years and over | 24 (19.7%) | 19 (9.3%) |
Disability Class: Vision Difficulty
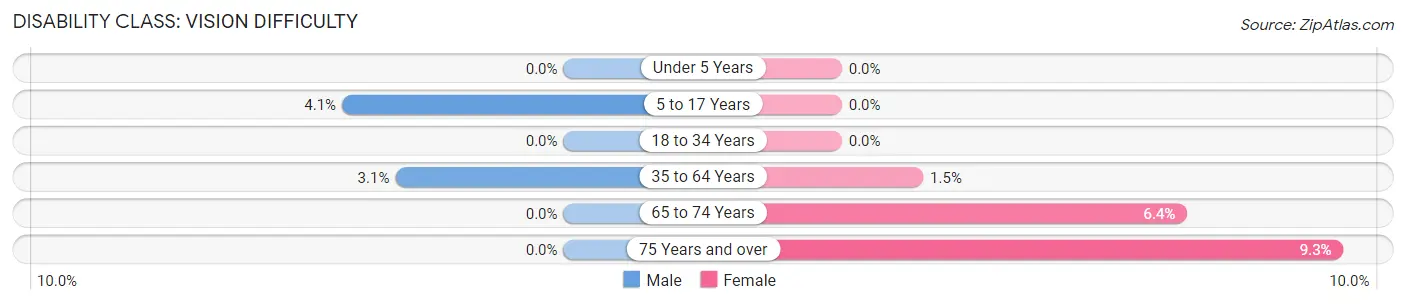
| Age Bracket | Male | Female |
| Under 5 Years | 0 (0.0%) | 0 (0.0%) |
| 5 to 17 Years | 18 (4.1%) | 0 (0.0%) |
| 18 to 34 Years | 0 (0.0%) | 0 (0.0%) |
| 35 to 64 Years | 33 (3.1%) | 17 (1.5%) |
| 65 to 74 Years | 0 (0.0%) | 20 (6.4%) |
| 75 Years and over | 0 (0.0%) | 19 (9.3%) |
Disability Class: Cognitive Difficulty
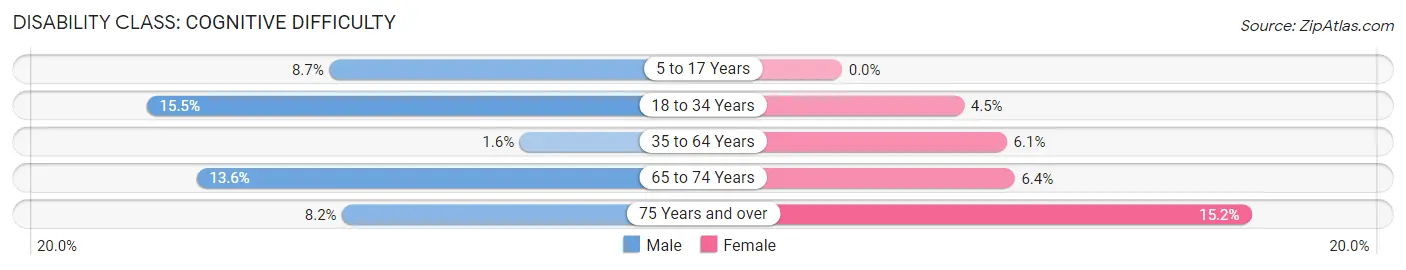
| Age Bracket | Male | Female |
| 5 to 17 Years | 38 (8.7%) | 0 (0.0%) |
| 18 to 34 Years | 95 (15.5%) | 39 (4.5%) |
| 35 to 64 Years | 17 (1.6%) | 69 (6.1%) |
| 65 to 74 Years | 32 (13.6%) | 20 (6.4%) |
| 75 Years and over | 10 (8.2%) | 31 (15.2%) |
Disability Class: Ambulatory Difficulty
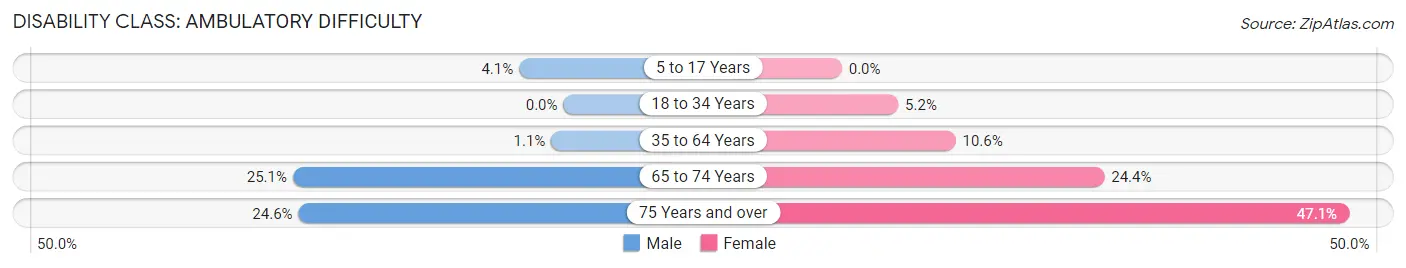
| Age Bracket | Male | Female |
| 5 to 17 Years | 18 (4.1%) | 0 (0.0%) |
| 18 to 34 Years | 0 (0.0%) | 45 (5.2%) |
| 35 to 64 Years | 12 (1.1%) | 119 (10.6%) |
| 65 to 74 Years | 59 (25.1%) | 76 (24.4%) |
| 75 Years and over | 30 (24.6%) | 96 (47.1%) |
Disability Class: Self-Care Difficulty
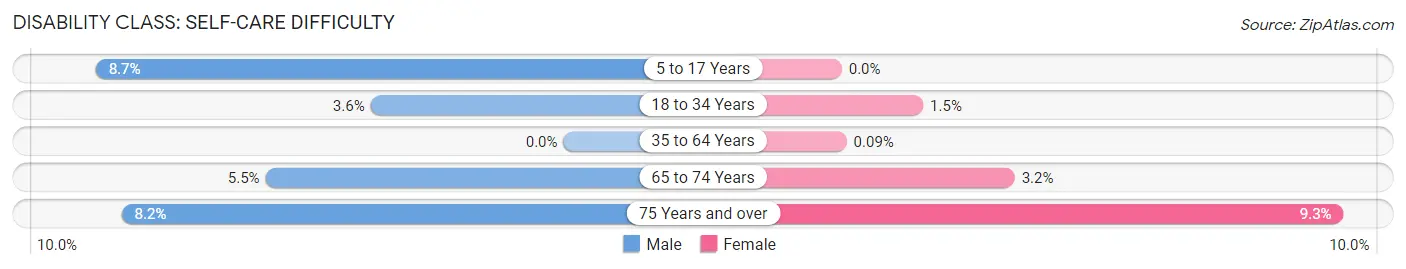
| Age Bracket | Male | Female |
| 5 to 17 Years | 38 (8.7%) | 0 (0.0%) |
| 18 to 34 Years | 22 (3.6%) | 13 (1.5%) |
| 35 to 64 Years | 0 (0.0%) | 1 (0.1%) |
| 65 to 74 Years | 13 (5.5%) | 10 (3.2%) |
| 75 Years and over | 10 (8.2%) | 19 (9.3%) |
Technology Access in Mattydale
Computing Device Access in Mattydale
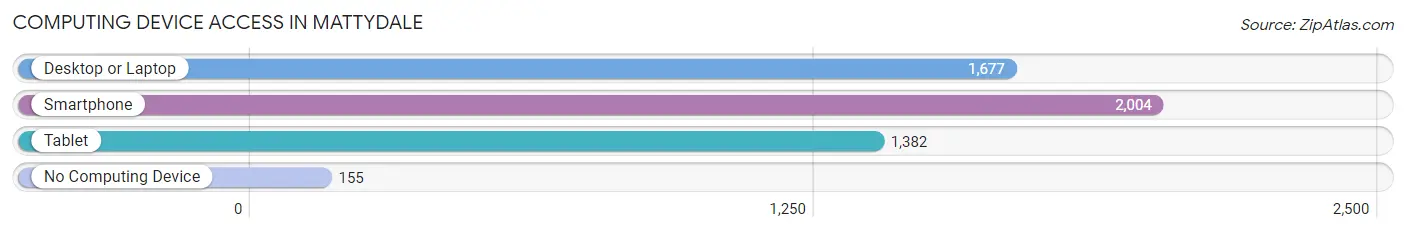
| Device Type | # Households | % Households |
| Desktop or Laptop | 1,677 | 71.3% |
| Smartphone | 2,004 | 85.2% |
| Tablet | 1,382 | 58.8% |
| No Computing Device | 155 | 6.6% |
| Total | 2,352 | 100.0% |
Internet Access in Mattydale
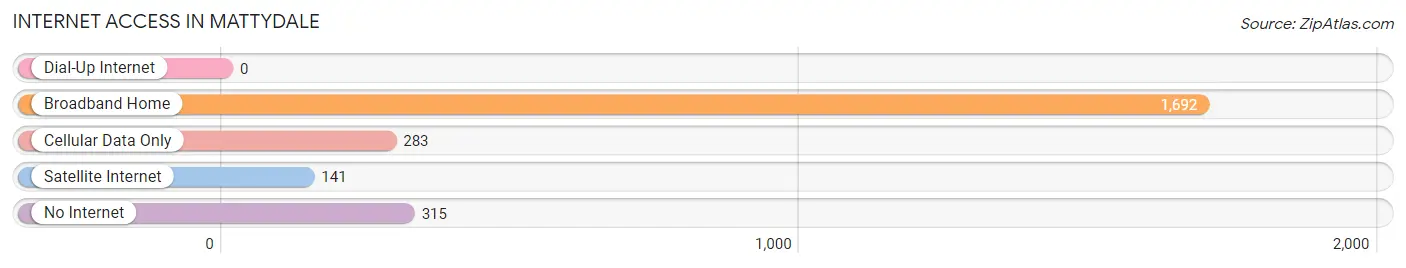
| Internet Type | # Households | % Households |
| Dial-Up Internet | 0 | 0.0% |
| Broadband Home | 1,692 | 71.9% |
| Cellular Data Only | 283 | 12.0% |
| Satellite Internet | 141 | 6.0% |
| No Internet | 315 | 13.4% |
| Total | 2,352 | 100.0% |
Mattydale Summary
Mattydale is a hamlet located in Onondaga County, New York, United States. It is a suburb of Syracuse, located in the town of Salina. The population was 8,717 at the 2010 census.
History
Mattydale was originally part of the Onondaga Nation, a member of the Iroquois Confederacy. The area was settled by Europeans in the late 18th century. The hamlet was named after Matty, a local Native American who lived in the area.
In the early 19th century, Mattydale was a small farming community. The hamlet was incorporated in 1848 and was home to a variety of businesses, including a grist mill, a saw mill, a blacksmith shop, and a general store.
In the late 19th century, Mattydale began to grow rapidly. The hamlet was connected to Syracuse by the Syracuse and Chenango Valley Railroad in 1872. This allowed for the development of a variety of industries, including a brickyard, a tannery, and a paper mill.
In the early 20th century, Mattydale continued to grow. The hamlet was annexed by the city of Syracuse in 1925. The population of Mattydale peaked in the 1950s, when it had a population of over 10,000.
Geography
Mattydale is located at 43°7′17″N 76°10′17″W (43.1214, -76.1714). The hamlet is located in the town of Salina, in Onondaga County. It is bordered by the city of Syracuse to the south and east, and by the towns of Clay and Cicero to the north and west.
The hamlet is located on the northern shore of Onondaga Lake. The lake is a popular recreational area, with a variety of activities available, including fishing, boating, and swimming.
Economy
Mattydale is primarily a residential community. The hamlet is home to a variety of businesses, including retail stores, restaurants, and professional services.
Mattydale is also home to a variety of industrial businesses. The hamlet is home to a variety of manufacturing companies, including a paper mill, a printing company, and a metal fabrication plant.
Demographics
As of the 2010 census, there were 8,717 people, 3,541 households, and 2,323 families living in Mattydale. The population density was 2,845.3 people per square mile (1,098.7/km2). The racial makeup of the hamlet was 92.2% White, 3.2% African American, 0.3% Native American, 1.2% Asian, 0.1% Pacific Islander, 1.2% from other races, and 2.0% from two or more races. Hispanic or Latino of any race were 4.2% of the population.
The median income for a household in Mattydale was $45,938, and the median income for a family was $54,917. Males had a median income of $41,917 versus $30,938 for females. The per capita income for the hamlet was $21,917. About 5.2% of families and 7.2% of the population were below the poverty line, including 9.2% of those under age 18 and 5.2% of those age 65 or over.
Common Questions
What is Per Capita Income in Mattydale?
Per Capita income in Mattydale is $31,391.
What is the Median Family Income in Mattydale?
Median Family Income in Mattydale is $73,895.
What is the Median Household income in Mattydale?
Median Household Income in Mattydale is $69,824.
What is Income or Wage Gap in Mattydale?
Income or Wage Gap in Mattydale is 16.4%.
Women in Mattydale earn 83.6 cents for every dollar earned by a man.
What is Inequality or Gini Index in Mattydale?
Inequality or Gini Index in Mattydale is 0.35.
What is the Total Population of Mattydale?
Total Population of Mattydale is 5,825.
What is the Total Male Population of Mattydale?
Total Male Population of Mattydale is 2,588.
What is the Total Female Population of Mattydale?
Total Female Population of Mattydale is 3,237.
What is the Ratio of Males per 100 Females in Mattydale?
There are 79.95 Males per 100 Females in Mattydale.
What is the Ratio of Females per 100 Males in Mattydale?
There are 125.08 Females per 100 Males in Mattydale.
What is the Median Population Age in Mattydale?
Median Population Age in Mattydale is 36.4 Years.
What is the Average Family Size in Mattydale
Average Family Size in Mattydale is 3.1 People.
What is the Average Household Size in Mattydale
Average Household Size in Mattydale is 2.5 People.
How Large is the Labor Force in Mattydale?
There are 3,348 People in the Labor Forcein in Mattydale.
What is the Percentage of People in the Labor Force in Mattydale?
72.3% of People are in the Labor Force in Mattydale.
What is the Unemployment Rate in Mattydale?
Unemployment Rate in Mattydale is 5.8%.